Article

Mapping of Communication in Space Crews

by
Radvan Bahbouh
1,2,
Eva Hoschlova
1,2,*,
Michal Huzva
1,2 and
Katerina Bernardova Sykorova
3
1
QED GROUP a.s., Stepanska 20, 110 00 Prague, Czech Republic
2
Department of Psychology, Faculty of Arts, Charles University, Celetna 20, 110 00 Prague, Czech Republic
3
Department of Social Work, Faculty of Social and Economic Studies, Jan Evangelista Purkyne University in Usti nad Labem, Pasteurova 3544/1, 400 96 Usti nad Labem, Czech Republic
*
Author to whom correspondence should be addressed.
Aerospace 2024, 11(1), 45; https://doi.org/10.3390/aerospace11010045
Submission received: 10 November 2023 / Revised: 20 December 2023 / Accepted: 24 December 2023 / Published: 31 December 2023
(This article belongs to the Special Issue Human Behaviors in Space Exploration Mission)

Abstract

:
(1) Background: Starting in 1993, the sociomapping method was used in the Czech Army to map communication. After initial pilot tests in military aviation, where we verified the reliability and validity of the basic subjective scales (for example, by correlations with physiological data), this method was utilized for communication mapping in the HUBES (Human Behavior in Extended Spaceflight) experiment conducted between 1994 and 1995, and since then has been repeatedly used in experiments simulating long-term space flights. (2) Methods: In this article, we summarize the key findings obtained through sociomapping in eight space experiments with crews including women, conducted between 2015 and 2023, including five experiments at the Mars Desert Research Station (MDRS) and in three stages of the SIRIUS project (Scientific International Research in Unique Terrestrial Station). (3) Results: The median test-retest correlation for both the frequency and quality of communication was 0.64, ranging widely from −0.74 to 1. The quantity and quality of communication showed a moderately strong correlation (0.40). Control charts demonstrated diverse developmental trends in crew communication across the experiments. Sociomapping allowed for more detailed visualization of the structure and dynamics of communication throughout the missions, as well as the detection of subgrouping and isolation of individuals in the crews. (4) Conclusions: The experiments showed that scaled assessments of mutual communication in terms of both quantity (frequency) and quality are a reliable and valid tool that enables the capture of significant one-time fluctuations and/or long-term trends. The experiments highlighted the possibility of increased risk of significant fluctuations and gradual deterioration of communication in the second half of the mission, which, however, does not have to be the rule, especially in shorter isolations. Continuous monitoring of communication through simple rating scales allows for timely intervention and stabilization of communication.

1. Introduction

Psychosocial aspects of space travel have been studied since the 1950s [1,2,3,4]. While early space flight programs were more focused on resolving physical and physiological stressors, the advent of long-duration missions emphasized the importance of psychological and social stressors [5]. Vinograd [6], in a comprehensive study of isolation experiments aimed at gathering relevant recommendations for long-duration space flights, highlights not only the importance of interpersonal relationships but also the lack of methods for quantitatively capturing their changes. Ziller [7] cites group dynamics as one of the fundamental differences that distinguish long-term work teams from short-term ones. Connors, Harrison, and Akins [8] recommend reducing the psychological and interpersonal vulnerability of the team not only through appropriate individual selection but also through group dynamics training and the provision of psychological assistance. They also advocate for the need for future research focused on better understanding team dynamics. Nicholas [9] noted that despite the crucial impact of team interaction on team performance, this area has been largely ignored in the context of space research. Foushee and Helmreich [10] even mention a paradox in that relatively little attention is paid to research and training for group performance in aviation, despite the fact that crew performance is inherently a type of group performance. Later, Galarza and Holland [11] highlight that the ability to work in a team is a critical competency for long-duration flights, which should also be reflected in the development of tools and procedures not only for selection but also for training and support. In 2004, Manzey [12] summarized the then-current knowledge about behavior during long-duration flights, emphasizing that attention should be paid to the mutual interactions among crew members and their measurement. More specifically, he claims that the biggest psychological challenges astronauts have to cope with are related to psychological and interpersonal stressors they are exposed to, especially a lack of privacy and enforced social contact with other crew members. Kanas and his colleagues [13] formulated recommendations that internationally approved procedures should be established for monitoring interactions among crew members, emphasizing self-monitoring methods. The assertion that teamwork needs attention in both research and training and that tools and procedures enabling this should be developed can also be captured in recent systematic studies [14,15,16].
One of the important themes of team dynamics is the formation of subgroups and cliques, leading to a decrease in group cohesion and, in some cases, even resulting in the isolation of certain crew members [17,18]. In this context, Kanas [19] emphasizes the importance of having open communication channels among crew members. In addition to the theme of team dynamics, the gender composition of teams also appears to be an important topic. In summary comments on space exploration, the assumption was initially formulated that this was not work suitable for women [20,21]. However, this topic has become more discussed with the gradually growing assumption that crews in space research will be mixed [17,18,22,23], up to the radical suggestion that crews should be all-female [24]. Landis [24] argues that women have a lower mass, take less volume than males, and use proportionately fewer consumables. In addition, a female crew may be likely to choose non-confrontational approaches to solve interpersonal problems. Another important aspect influencing the communication and collaboration of crews is linguistic and cultural differences [13,17,18], which can result in group division [25]. The fact that cultural and gender differences can lead to significant conflict was demonstrated, among other instances, in the SFINCSS experiment [26].
Apart from one-time conflicts, various studies have shown a gradual increase in tension during long-term missions accompanied by a decrease in communication. Sometimes, this is referred to as the phenomenon of the second half or the third quarter of the mission [16,27,28]. These findings, evident in some specific case studies [26,29,30], however, cannot be generalized [16,28].
In the former Czechoslovakia, the study of space crews was initiated by the sociologist and pilot Jaroslav Sýkora. One of his initial studies was the Stola 1988 experiment, which simulated a 21-day space flight and examined differences between two crews. In this experiment, Sýkora brought together doctors, psychologists, and sociologists to study stress aspects related to crew isolation from an interdisciplinary perspective. Differences in the communication of both crews were later correlated with leadership style and crew composition, which differed in the presence or absence of women [31,32,33].
In 1993, the method of sociomapping [34,35,36] was introduced in the Army of the Czech Republic, enabling the monitoring of communication development within and between teams. Mutual interactions were transformed into a fuzzy model of the mutual communication proximity of individual crew members or teams. This fuzzy model allowed for the aggregation of various measurement methods and different time intervals. Repeated representations captured changes in the overall volume of communication, as well as in mutual proximity or distance. This method was designed for monitoring communication in the Human Behavior in Extended Spaceflight (HUBES) experiment. During repeated scaled assessments of mutual cooperation, a persistent decline in mutual communication was visible. In the dynamic mapping of mutual communication distance, gradual isolation of one of the crew members was evident [35]. This decline in perceived communication corresponded with a decrease in recorded communication and an increase in stress [31], which were findings also noted by other research teams [30].
Sociomapping was also utilized in the EKOPSY 95 experiment, conducted between 1995 and 1996, in which a three-member crew was temporarily expanded by an additional three-member crew, which was later separated again [37]. In the EKOPSY experiment, crew members evaluated their communication with each other on an ordinal scale. This made it possible to assess, based on the average, how other crew members perceived an individual’s communication activity, as well as how the individual perceived communication activity with each team member. Mutual evaluations enabled the depiction of the crew’s communication structure and dynamics through sociomaps, which derived the mutual arrangement from the mutual communication proximity. On the sociomaps depicting the development of mutual communication proximity, it was evident that both crews managed to connect mainly through the communication of both leaders. After the crew was reduced to three members again, communication did not return to the original level, and one of the crew members remained partially isolated [37,38].
In the Mars-105 experiment conducted in 2009, a total of 7 data collections were carried out with an average 16-day interval between administrations [38]. Each crew member ranked the other crew members from whom they communicated with the most to the least. The average test-retest correlation of this ranking was 0.80. The quality of communication with individual team members was assessed on a percentage scale. The lowest average communication quality scores (69%) were achieved during the sixth administration (two-thirds of the total experiment time). At the same administration, the lowest scores were also recorded for the overall assessment of team atmosphere and team performance. Additionally, a higher number of mutual misunderstandings were reported at that time [38].
In the Mars-500 experiment, conducted between 2010 and 2011, a total of 36 data collections were conducted at fourteen-day intervals. Apart from the order in which individual members communicate with each other and how they should communicate, a five-point scale assessing the level of communication with individual persons was also utilized for both the current and optimal communication levels. Throughout the experiment, crew members used all values on the scale, with the average test-retest correlation of communication frequency being 0.79 and the average test-retest correlation of optimal communication frequency being 0.84 [39]. One significant decrease in the communication frequency parameter occurred during the seventeenth administration, which was due to the simulated landing on Mars and, thus, the division of the entire group into two subgroups. After the Mars-500 experiment, questions arose about the format of the five-point scale used for frequency and quality of communication, which is also employed in the research of regular work teams [38]. Such scales were used in the series of MDRS and SIRIUS experiments.
In this study, we focused on mapping the mutual communication of eight crews involved in simulated space flights with varying isolation durations. We were particularly interested in the following four areas of research questions:
  • What is the general level of frequency and quality of mutual communication among the observed crews? What is the typical distribution of the use of individual degrees on the measurement scales? Which values, in terms of the rarity of their occurrence, can be considered warning signals?
  • What is the stability of communication frequency and quality among the crews in the simulated flights? What is the typical test-retest correlation between the various measurements of mutual crew communication?
  • What trends and changes can we observe in the development of frequency and communication over time? Are there any typically occurring phenomena in the frequency and quality of crew communication? Is it possible to observe significant fluctuations in certain time intervals of the experiments?
  • What significant changes in the structure of communication occur during the various experiments? Is the team structure stable or rather a temporary phenomenon within the changing dynamics of cooperation during the experiments?

2. Materials and Methods

2.1. Description of Experiments

This study is based on the analysis of data from eight experiments simulating space missions, specifically five MDRS (Mars Desert Research Station) experiments, namely MDRS 162, 147, 148, 275, and 280, and three SIRIUS (Scientific International Research in Unique Terrestrial Station) experiments, namely SIRIUS-17, SIRIUS-19, and SIRIUS-21. The experiments took place between 2015 and 2023, with isolation periods ranging from 12 to 240 days. The crews consisted of 3 to 7 members, with one experiment seeing a reduction in crew members from 6 to 5 during the simulation. Seven crews were gender mixed; one crew was all female. Three of the eight crews had a female commander. Six crews included members of different nationalities; two crews were composed of members of the same nationality. Further characteristics of the experiments and their crews are detailed in Table 1.
All MDRS experiments were held in the Mars Desert Research Station in Utah, USA. The Mars Desert Research Station (MDRS), owned and operated by the Mars Society, is a space analog facility in Utah that supports Earth-based research in pursuit of the technology, operations, and science required for human space exploration. The facility hosts an eight-month field season for professional scientists and engineers, as well as college students of all levels, in training for human operations, specifically on Mars [40].
All stages of the SIRIUS project were held in the ground-based experimental facility (NEK) in Russia. SIRIUS is an international project that is being conducted in Moscow at the Institute of Biomedical Problems (IBMP) of the Russian Academy of Sciences (RAS) in collaboration with NASA’s Human Research Program (HRP) [41,42,43]. Thus far, three stages of the project have been conducted (SIRIUS-17, SIRIUS-19, and SIRIUS-21). In each of these so-called ICC (Isolated, Confined, and Controlled) analog missions, a mixed crew (3 men and 3 women) was isolated. Crew communication was monitored as part of a broader questionnaire focused on psychosocial aspects [44].
For more information about all eight experiments included in this study, please see Appendix A.

2.2. Data Collection

Data on the mutual communication of crew members, specifically regarding frequency and quality, was collected throughout the isolation periods in all the mentioned experiments. This collection was conducted through questionnaires based on mutual assessments. Crews evaluated the frequency and quality of their mutual communication at various intervals, which were always adjusted to the overall duration of the isolation. The total number of data collections varied depending on the duration of each experiment. A detailed overview is provided in Table 2.

2.3. Communication Scales

The foundation of our team and crew research is based on relational questions focusing on the frequency and quality of mutual communication among individual crew members. Each member individually evaluated their colleagues during the relevant time period in terms of how often they communicated with them and the quality of the mutual communication. The length of the evaluated period was derived from the overall duration of the isolation and ranged from daily intervals to bi-weekly intervals. The five-point Likert scales were verbally anchored. The description of the scales is provided in Table 3:
For both communication scales, we can measure test-retest correlation, the median estimate of which (at intervals shorter than six months) is 0.63 for the communication frequency scale and 0.59 for the communication quality scale [45]. In earlier studies, a high correlation has been demonstrated, which for example, for the communication frequency scale was 0.65 on average at intervals shorter than six months [38]. Although this high correlation is satisfactory evidence of test-retest reliability, the ability of this question to capture continuous changes has also been documented in various case studies and experiments [38,39,46]. Moreover, the correlation between ratings on the communication frequency and quality scales was found to be moderate (specifically 0.44) based on the data from hundreds of regular work teams [38].
Previous studies have also confirmed the associations between the evaluation using rating communication scales and mutual trust, team satisfaction, or team performance. For instance, a positive correlation between the quality of mutual communication and overall satisfaction with team communication was found, with a value of r = 0.49 [47]. A correlation between the current frequency of communication and sympathy was also identified, with a value of r = 0.46, and trust, with a value of r = 0.42 [48]. The quality of communication also positively correlates with an average team member’s annual revenue in business teams, with a value of r = 0.20 [49].
Data collected using scales measuring the mutual frequency and quality of communication within individual crews were analyzed and visualized using the sociomapping method, which allows for the capture of communication structures and the display of the temporal evolution of relationships [39,46]. Control charts [39,46,50] were additionally used to statistically evaluate the significance of fluctuations over time. These methods will be briefly introduced in the following sections.

2.4. Control Charts

Data on mutual evaluations (of which there are a total of 30 in a six-member team, for example) can be summarized into an average as a simple parameter indicating the quantity (frequency) and quality of communication. These values allow for a comparison with values from work teams of the same size, representing an external benchmark. An internal benchmark involves comparing the specific data collection with the long-term average over an extended period, which is done within the control chart.
If we have these parameters at regular intervals, we can evaluate sudden fluctuations and changes using control charts [38,46,50]. Tests described for this method enable the determination of whether a deviation from a stabilized state is excessive or whether a specific phenomenon is emerging, whether it is a long-term trend of decreasing or increasing mean level or an increase in volatility [51]. The graphical representation of the tracked changes and fluctuations is presented in Figure 1.
The basic parameters of control charts are the central line (CL) and two boundary lines indicating statistically significant deviations—the upper control limit (UCL) and the lower control limit (LCL). The UCL and LCL were determined using the control limits factor (A3) multiplied by the sample’s standard deviation and added to the mean or subtracted from the mean. The A3 is a standardized coefficient that considers all values for each measurement [52].
Apart from monitoring whether individual measurements fall outside the common range defined by the UCL and LCL lines, it is also possible to observe whether there is a long-term decrease or increase in the observed variable (successive measurements have a downward or upward trend) or whether values remain above or below the normal level for an extended period (multiple measurements in a row are above or below the average).

2.5. Sociomapping

The sociomapping method allows for the analysis and visualization of changes in mutual communication. Its underlying mathematical basis is a fuzzy model, within which the proximity of each crew member to other crew members is indicated. These fuzzy models allow for the aggregation of various data collection methods, as well as temporal aggregation [34,35]. A fuzzy model, generally, is an asymmetric matrix in which the degree of membership (from 0 to 1) of person j to the fuzzy set of close individuals to person i is indicated in the i-th row and j-th column. The degree of membership can range from zero, corresponding to the minimum possible level of communication, to 1, corresponding to the maximum possible level of communication in terms of the given communication parameter. An example of a fuzzy matrix is shown in Table 4. Communication data can come from various sources. The degrees of membership can be converted based on content analysis of the volume of mutual communication (within the total volume of communication of a given person), variables obtained through observation, and mutual subjective evaluations using ordinal scales. In our case, the model was created based on the above-mentioned subjective communication scales.
The fuzzy model is transformed into a sociomap, which is a graphical representation of mutual relationships [38,53,54,55]. An example of a graphical representation of a fuzzy model using a sociomap is shown in Figure 2. The accuracy of the sociomap with respect to the given model is measured using the Spearman rank correlation based on the distance on the map (from the nearest to the furthest) and the values of the degree of membership in the fuzzy model (from the highest to the lowest). This Spearman correlation is calculated for each team member and then averaged for the entire team and the corresponding sociomap. The algorithm that assigns a corresponding sociomap to each fuzzy model is based on maximizing the average Spearman coefficient.
In general, the sociomap demonstrates that the closer a person is to the sociomap, the higher their degree of belonging to the fuzzy set of communication proximity. The heights of individual crew members correspond to the average value of how they are perceived by the other team members. In the previous example of a military team, we present a fuzzy model (Table 4) and its corresponding sociomap (Figure 2). The average Spearman correlation between the degrees of belonging and the proximities on the sociomap is 0.72 in this case [38].
The sociomap allows us not only to capture the extent of communication involvement of individual team members but also to see who speaks more and who speaks less. Consequently, we can observe the division of the team into subgroups or the partial isolation of some team members on the sociomap. In the case of repeated data collection, we can observe the development of mutual communication.

3. Results

The aforementioned eight experiments conducted between 2015 and 2022 involved 48 subjects who provided 4851 mutual evaluations of quantity (frequency) and quality of communication out of 5062 possible evaluations, representing a 96% return rate of the rating scales. The total sum of days in isolated conditions amounted to 464.

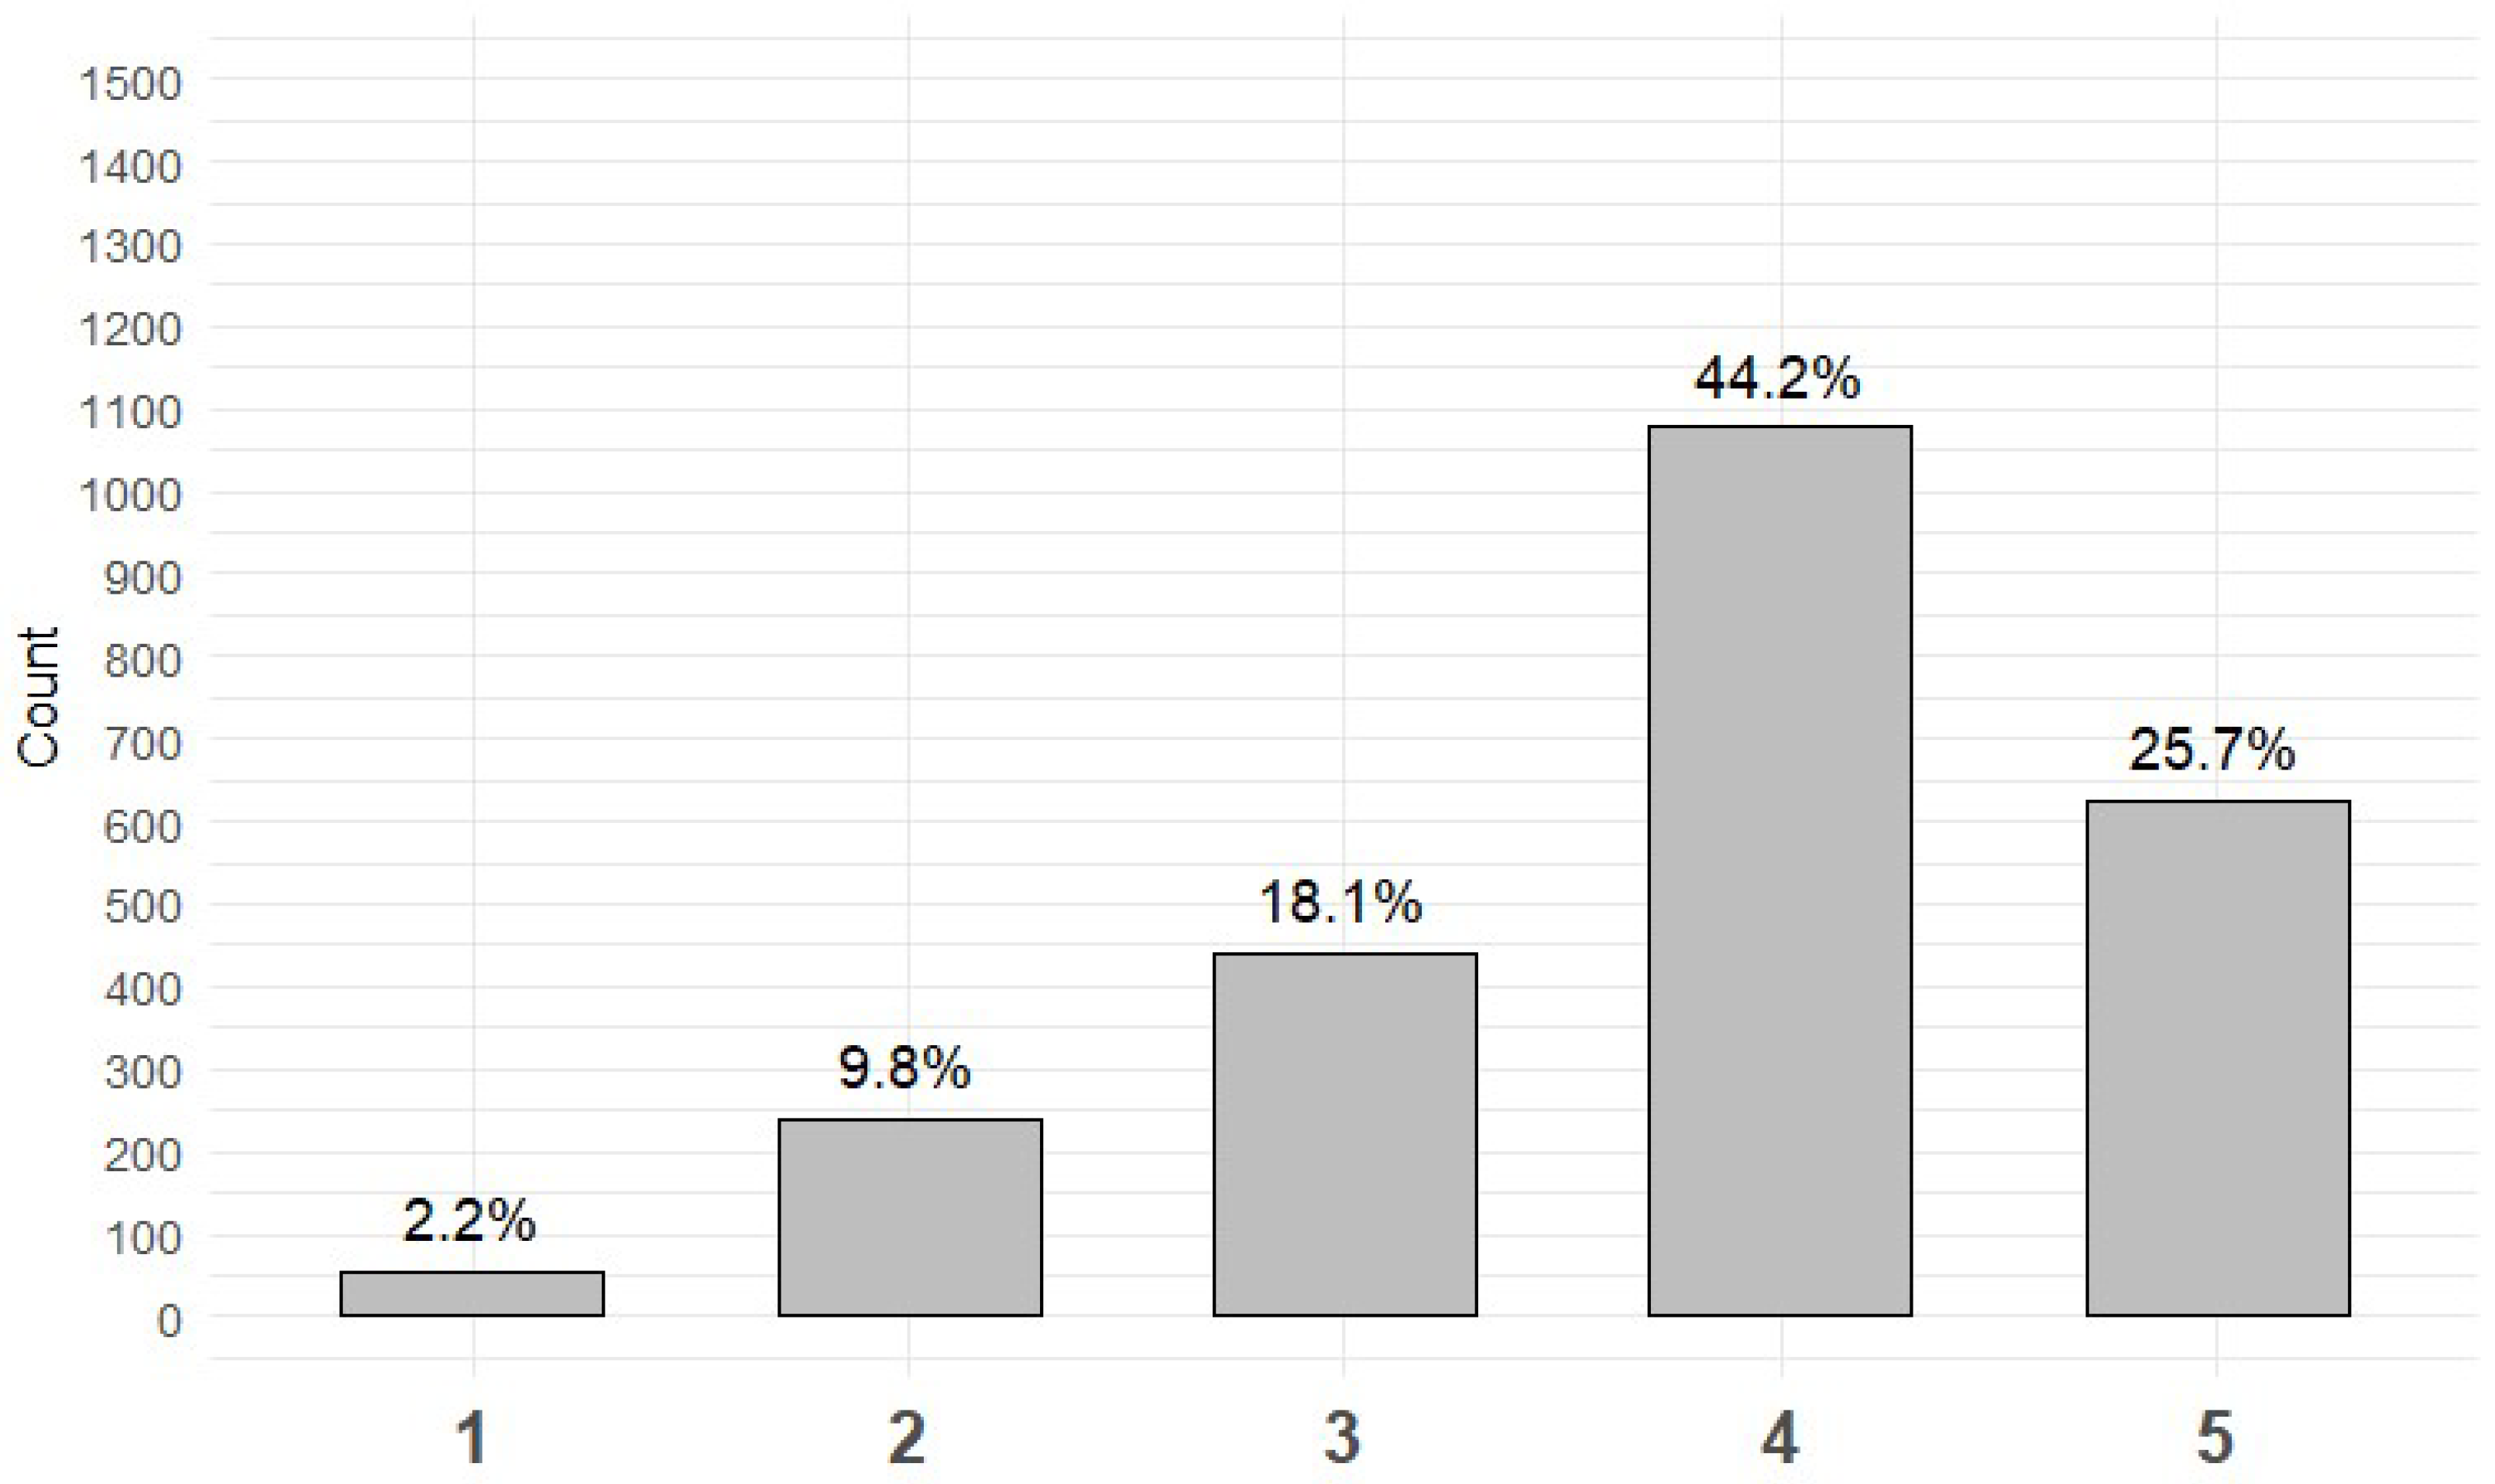
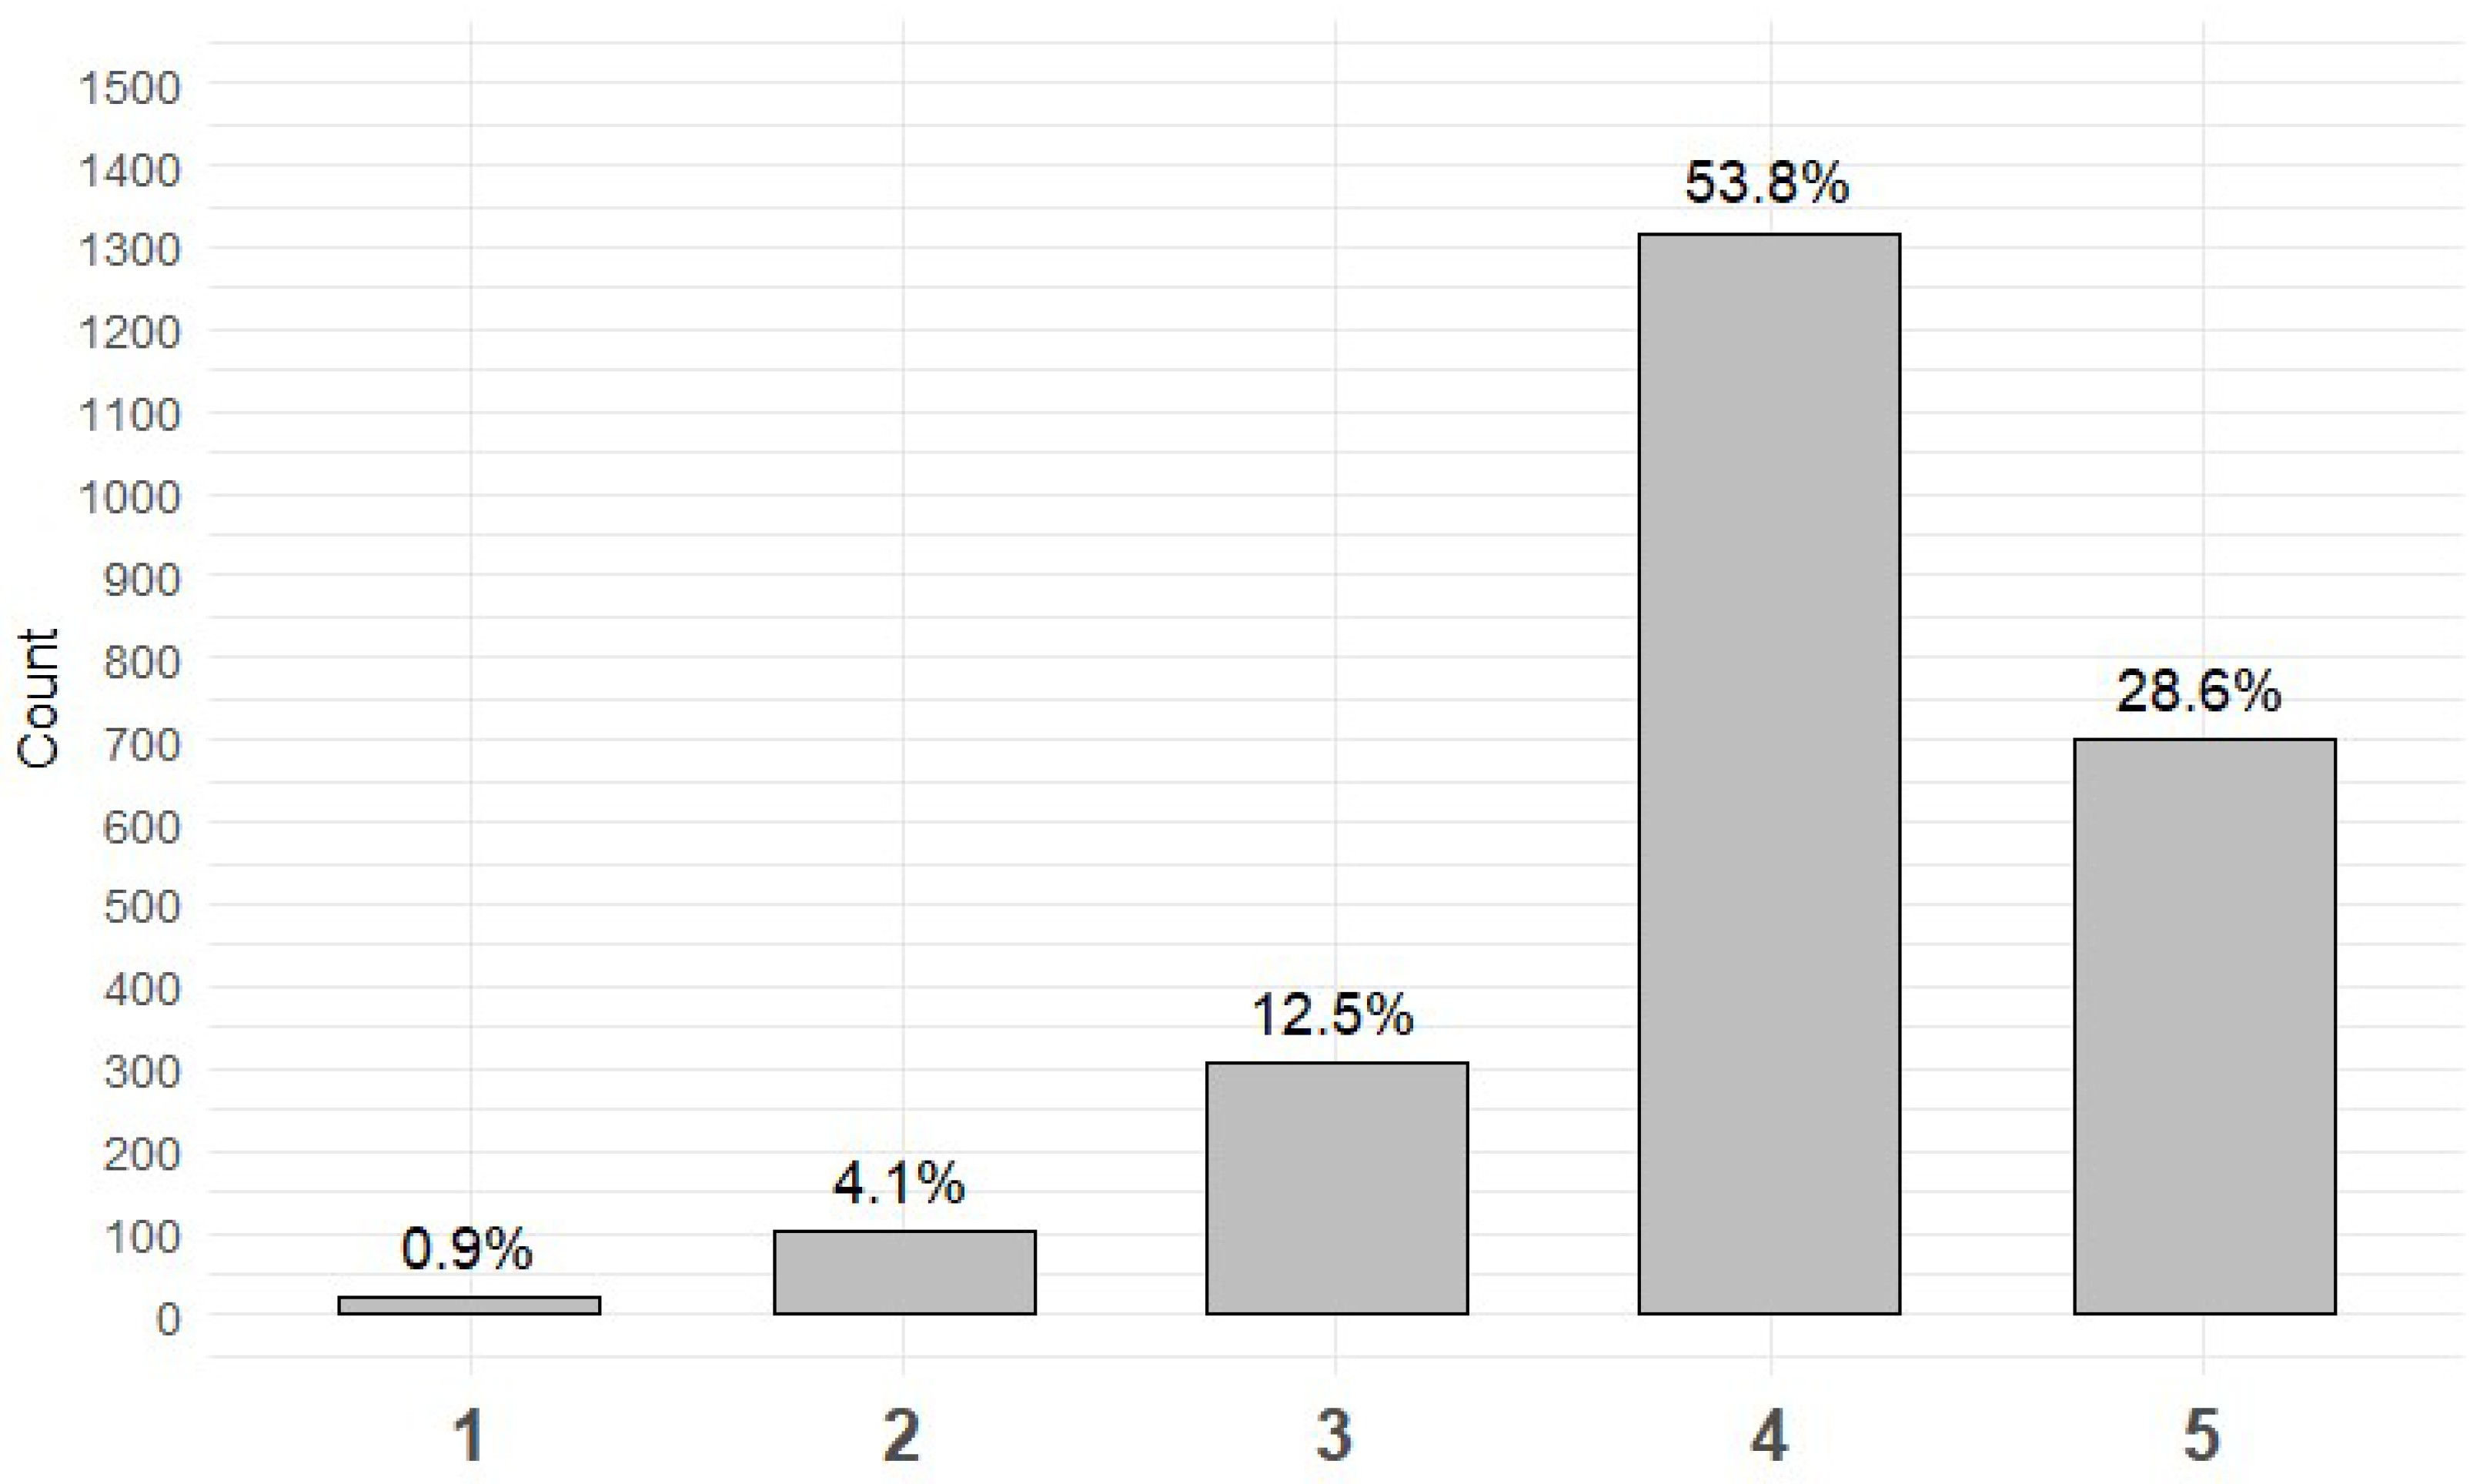
3.1. Description of Frequency and Quality of Communication in the Experiment Crews

Although the question setups differed in individual experiments, they were always based on the two aforementioned five-point scales. The distribution of the individual degrees of both scales is visualized in Figure 3 and Figure 4.
As can be seen, respondents utilized the entire range of the scale for both questions. The mode and median of the responses are 4, which represents a narrower statistical norm. Responses 4 and 5 account for 70% in the case of evaluating the frequency of communication and over 80% in the case of evaluating the quality of communication. Responses 1 and 2 are rare occurrences (values 1 and 2 occur in 12% of cases for the frequency of communication and only 5% of cases for the quality of communication). They should thus serve as an indicator of a less functional communication channel. Descriptive statistics for these scales in individual experiments and across the samples are provided in Table 5.
The above-mentioned averages are computed across all data collections from individual team members; the overall score is computed using the data on the team level. The distribution of data collection results is further expressed in the following histograms (see Figure 5 and Figure 6).
During the individual data collection across all experiments, the average team communication frequency never fell below the value of 2 and was only below 3 in 3.5% of cases. In 5.8% of cases, the average communication frequency exceeded 4.5. The average mutual ratings for communication quality never fell below 3. In 4.7% of cases, the teams were able to achieve an average communication quality rating higher than 4.5.

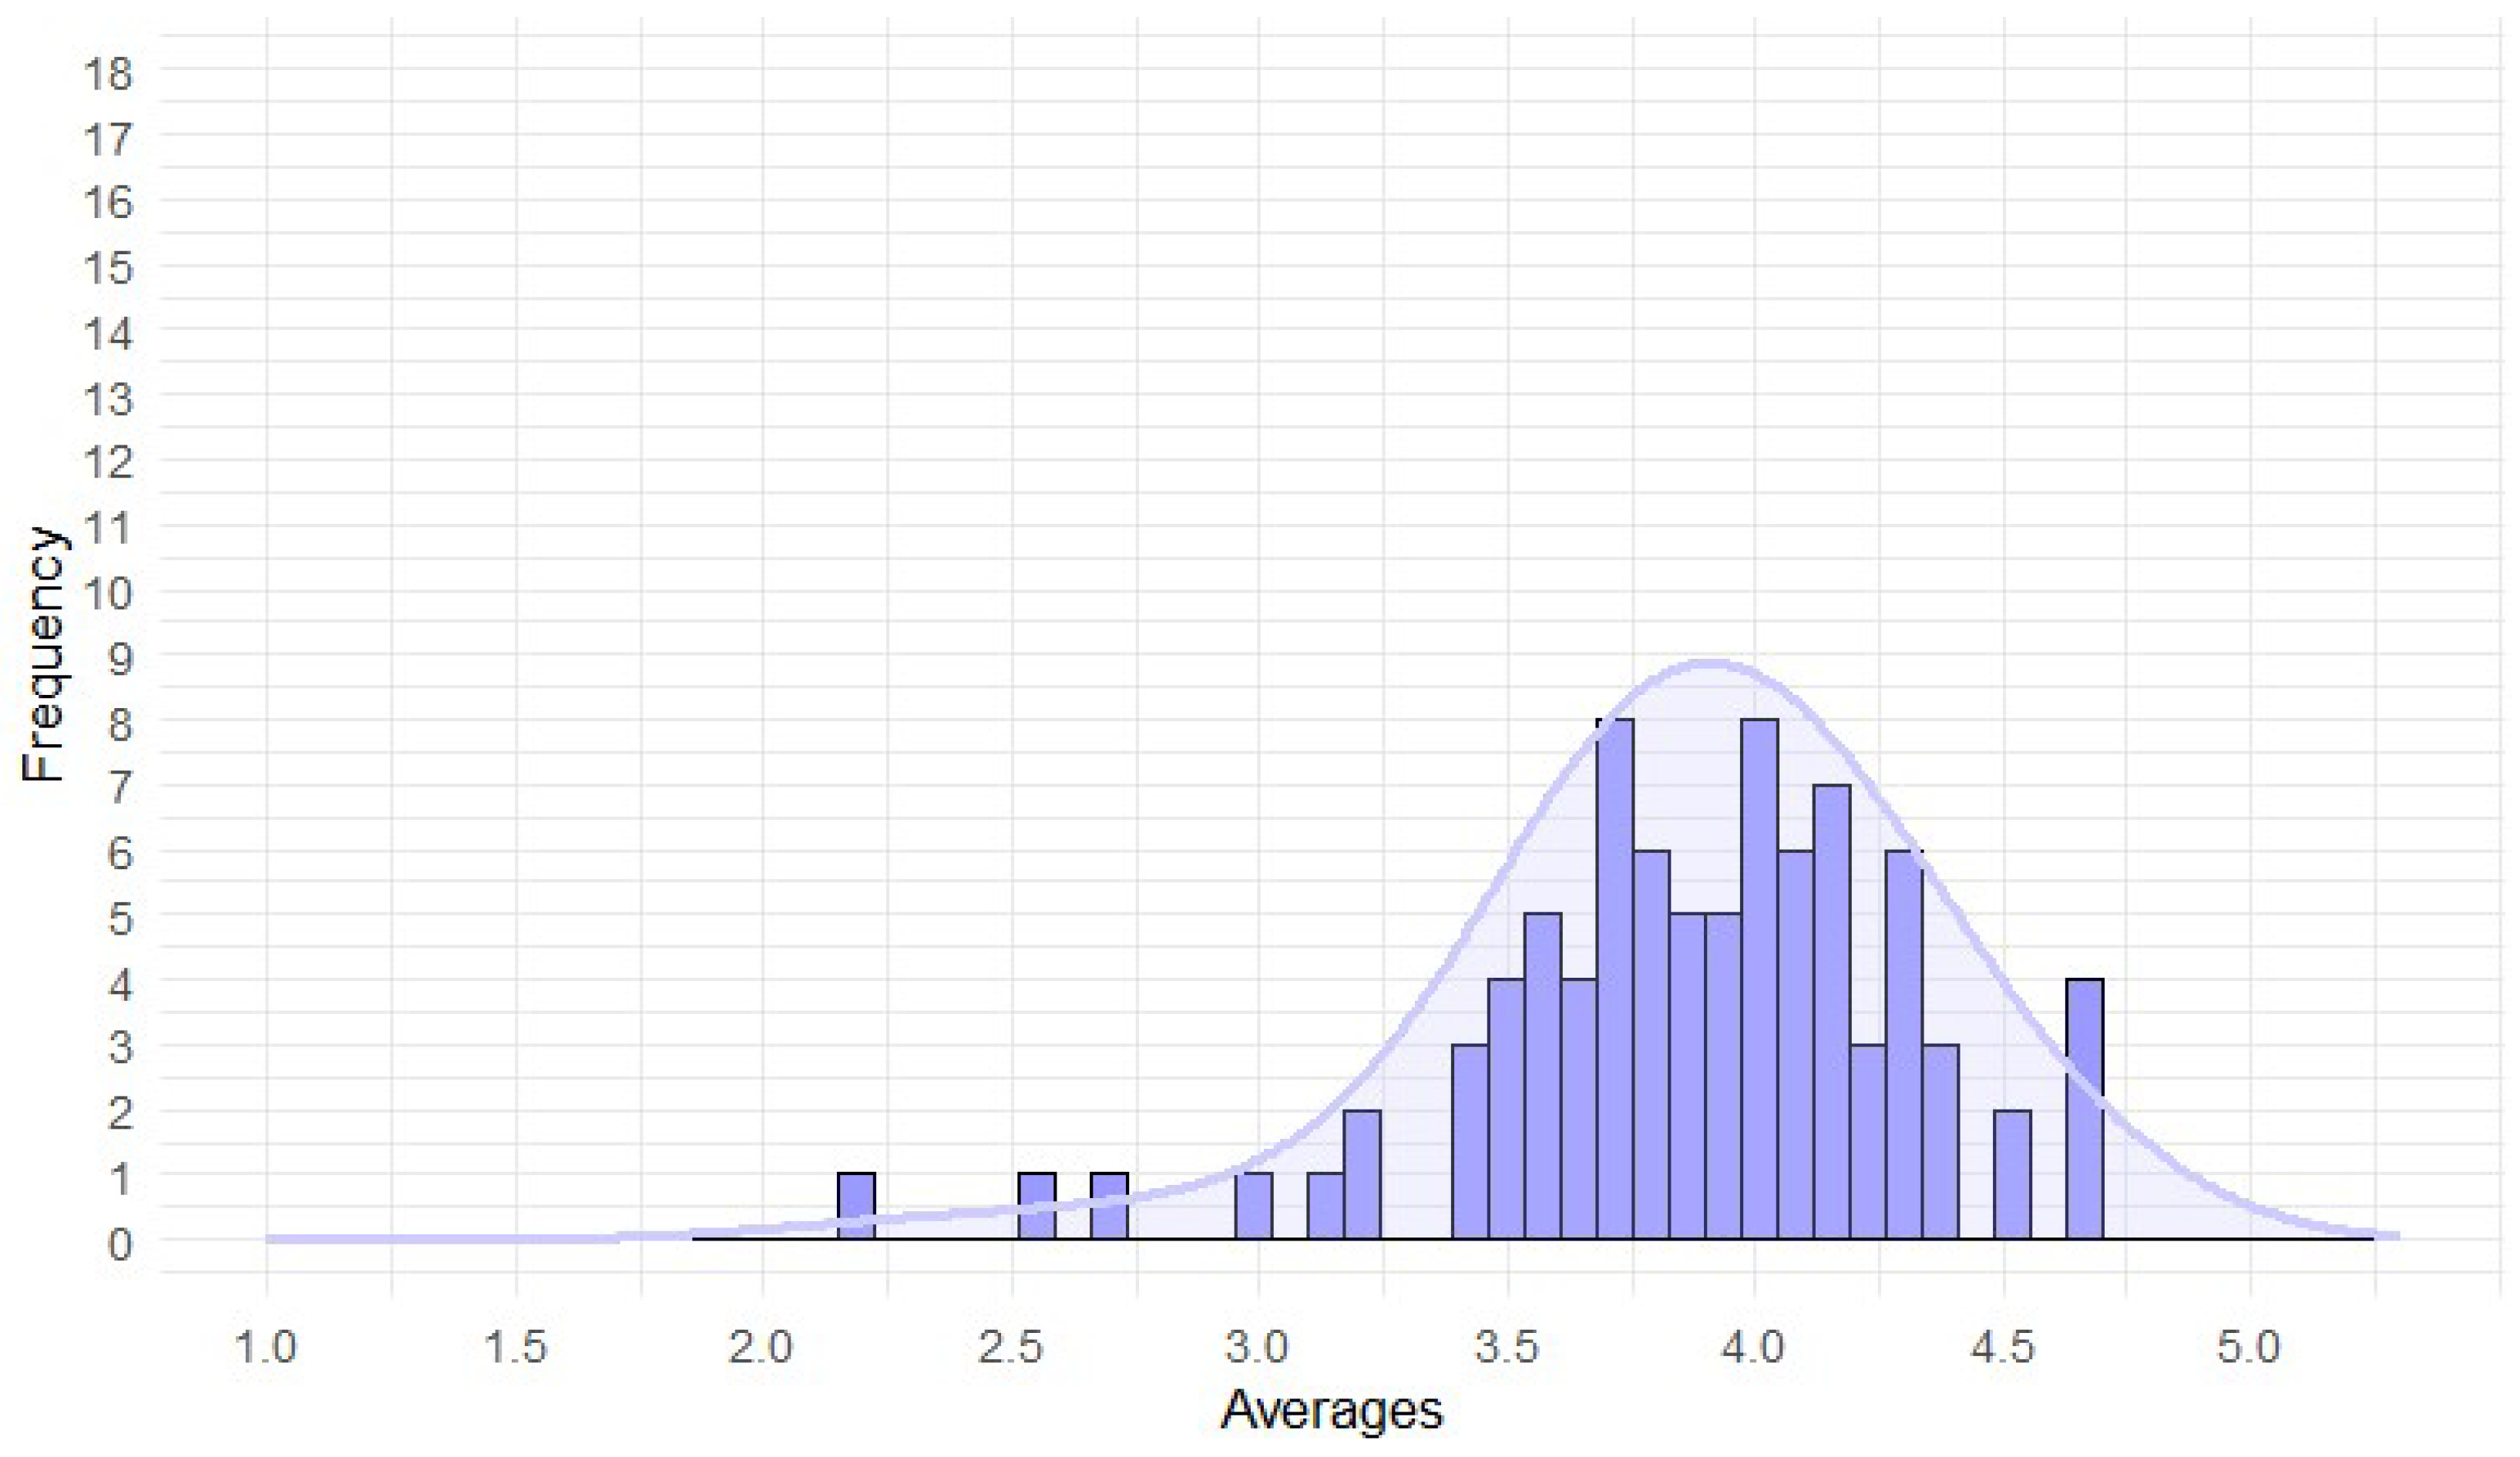
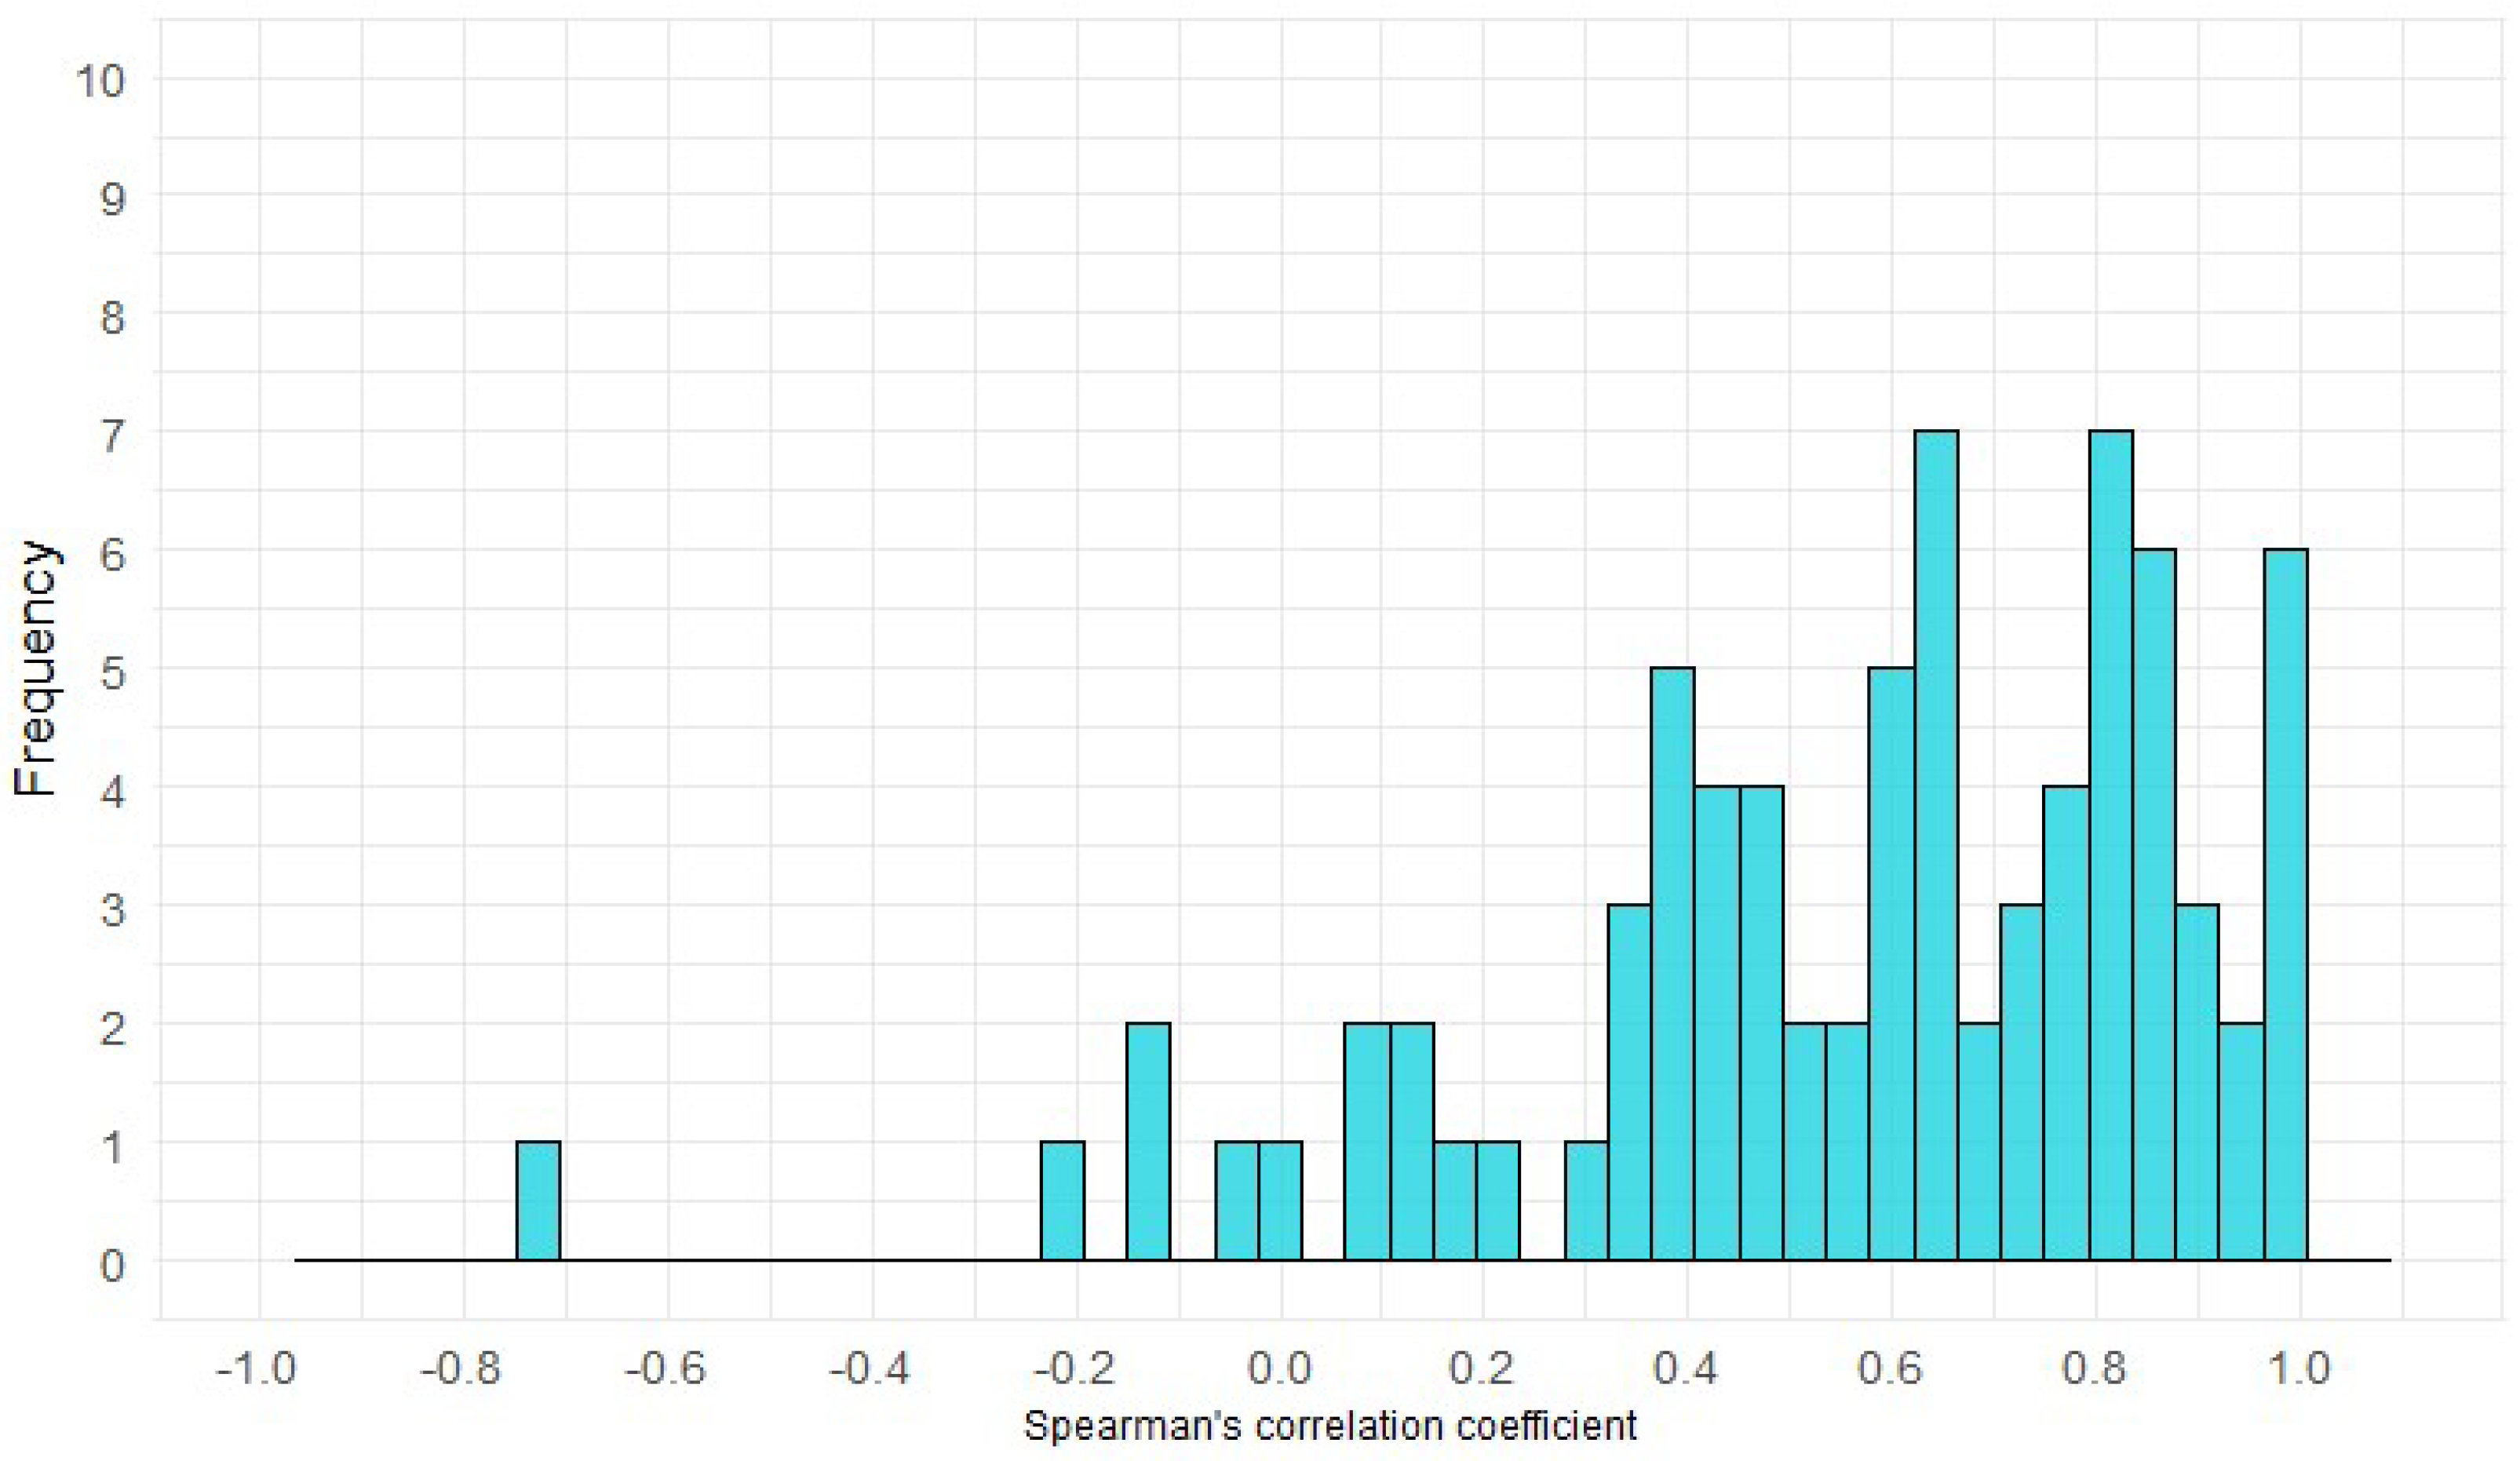
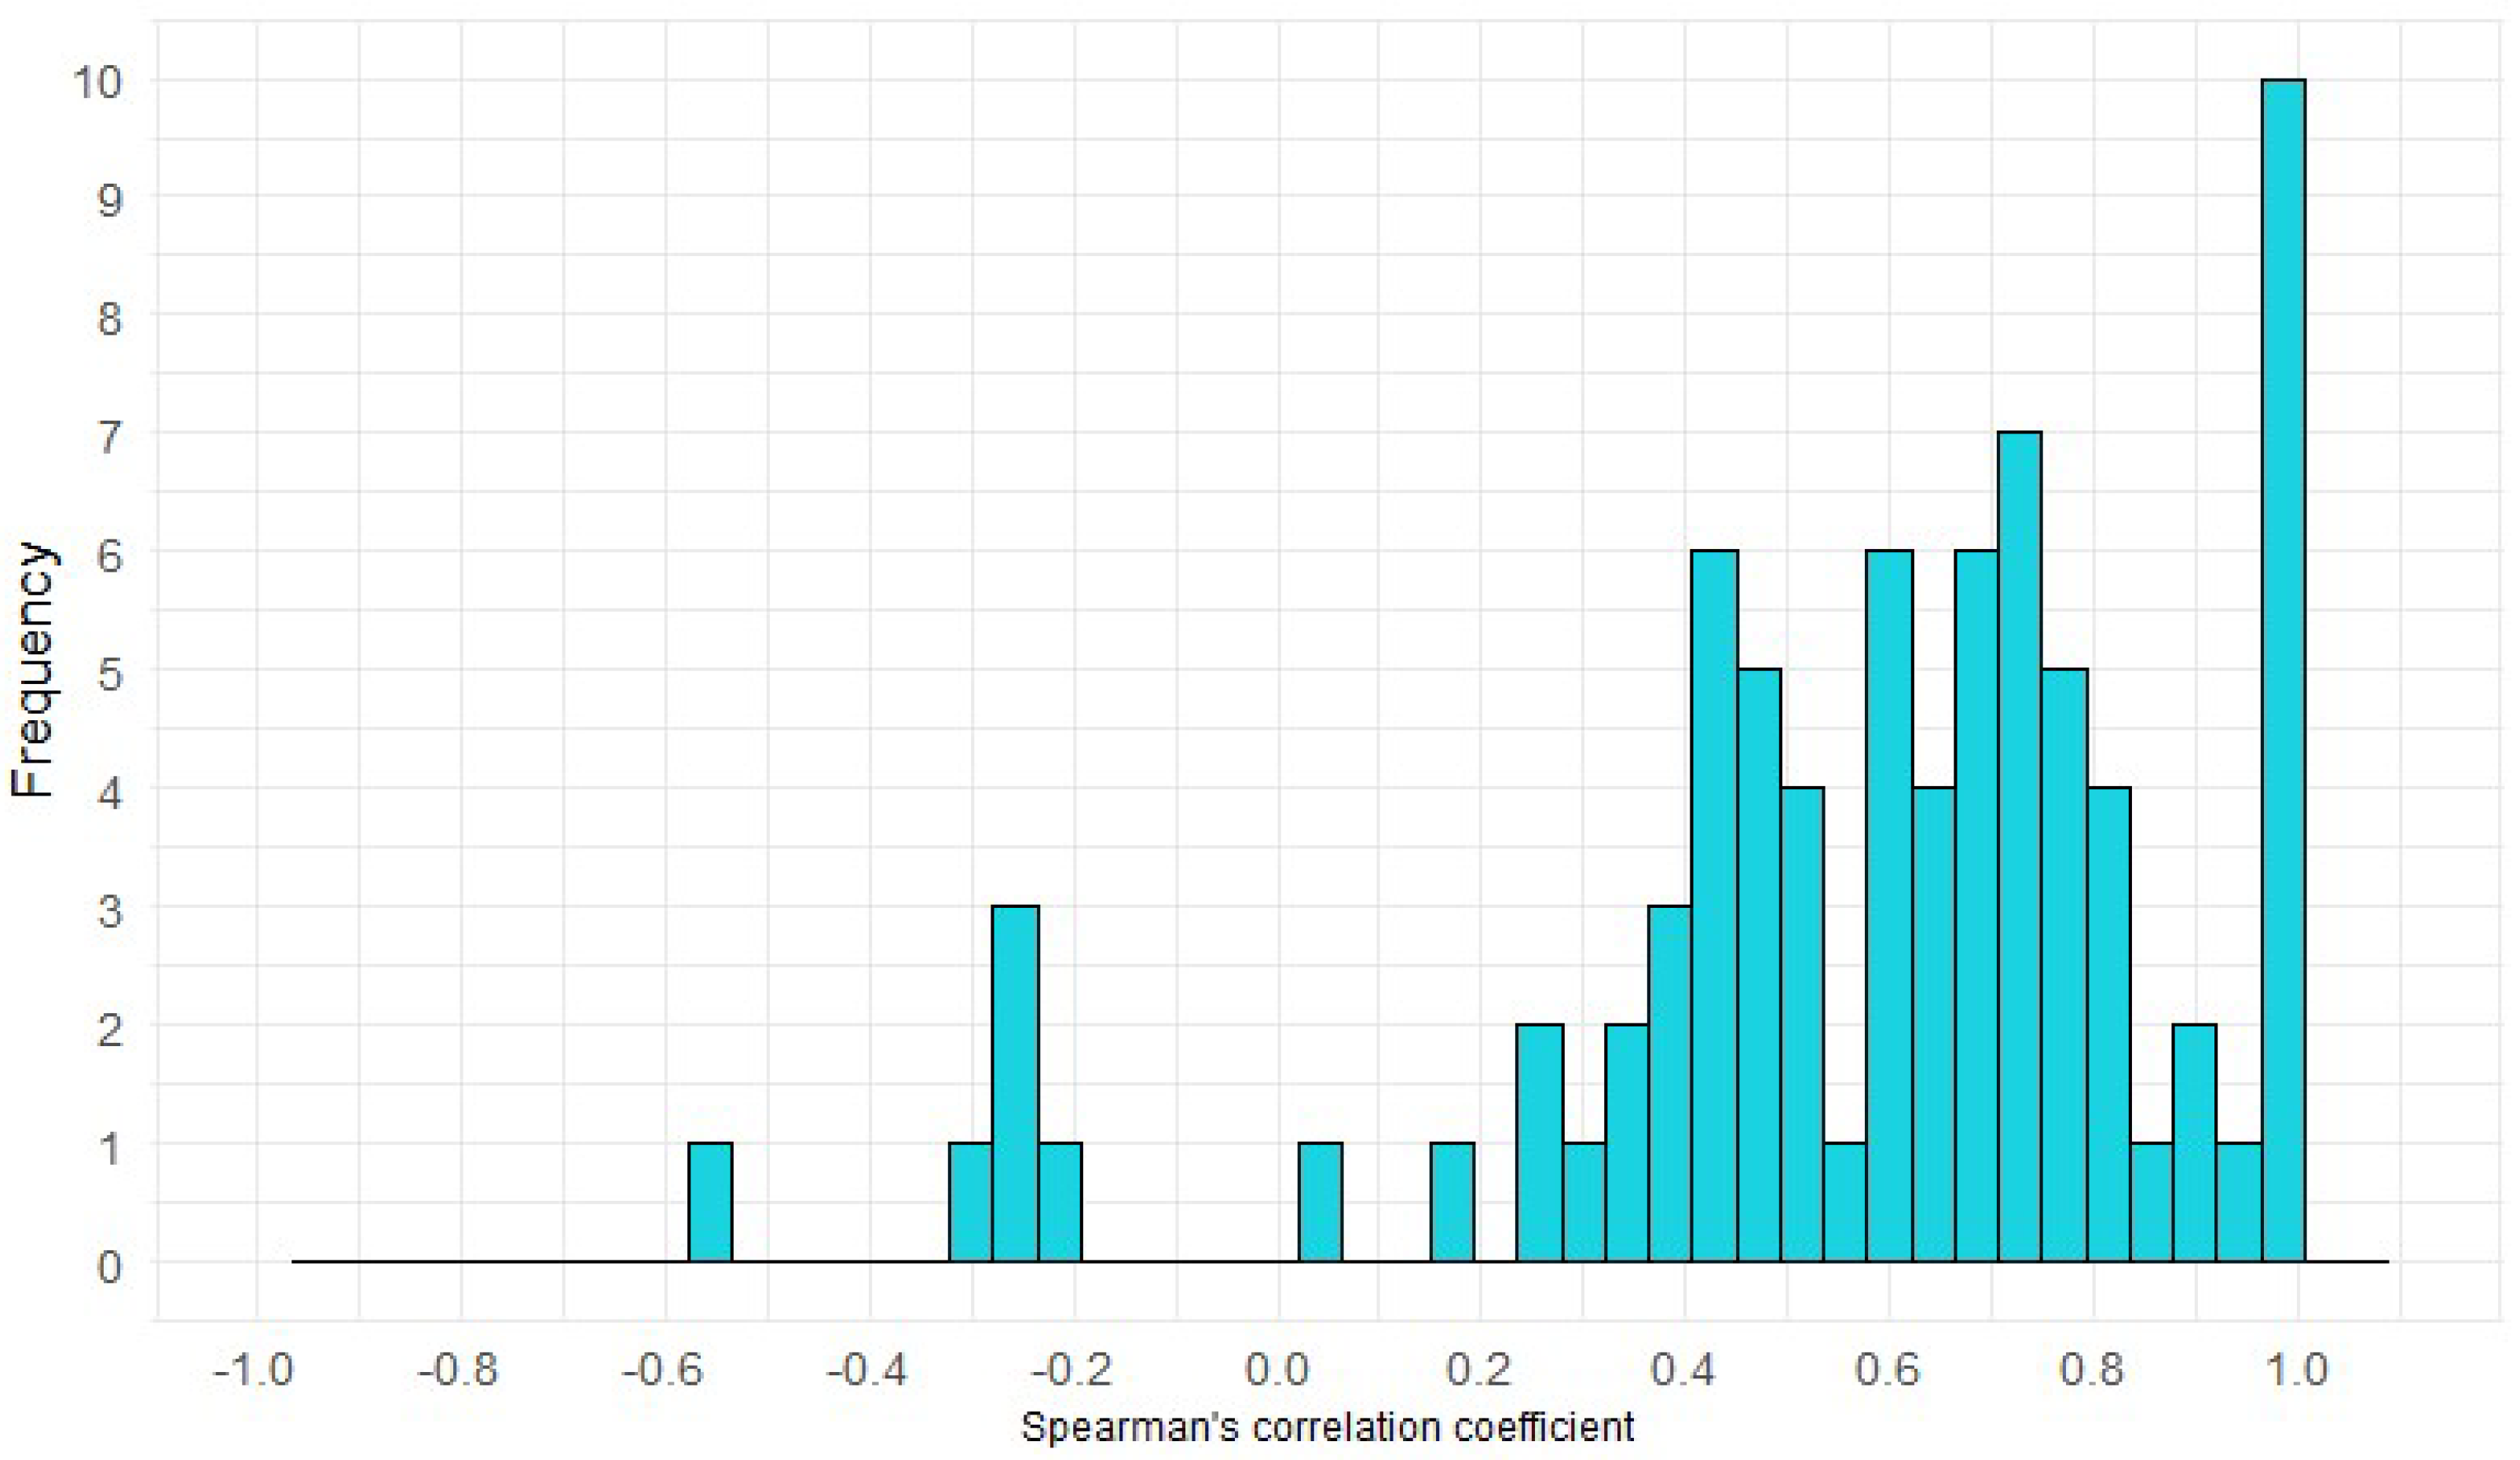
3.2. Stability of Communication Frequency and Quality among the Experiment Crews

The stability of communication can also be assessed by the correlation between two consecutive data collections. Table 6 provides descriptive statistics for the calculated Spearman correlations for each experiment separately, as well as the overall value for all measurements included in this study across the experiments.
The overall median test-retest correlation across all experiments was 0.64 for both frequency and quality of communication. Rounding to two decimal places makes the results look identical. The correlation range was from −0.74 to 1 for frequency and from −0.57 to 1 for quality. All those results indicate high stability of communication but also occasional significant changes. The results can be further described by the distribution of the test-retest correlations (see Figure 7 and Figure 8).
The correlation between the scales of quantity and quality of communication across all experiments was 0.40. This correlation coefficient is based on individual-level data and was computed across all experiments included in this study.

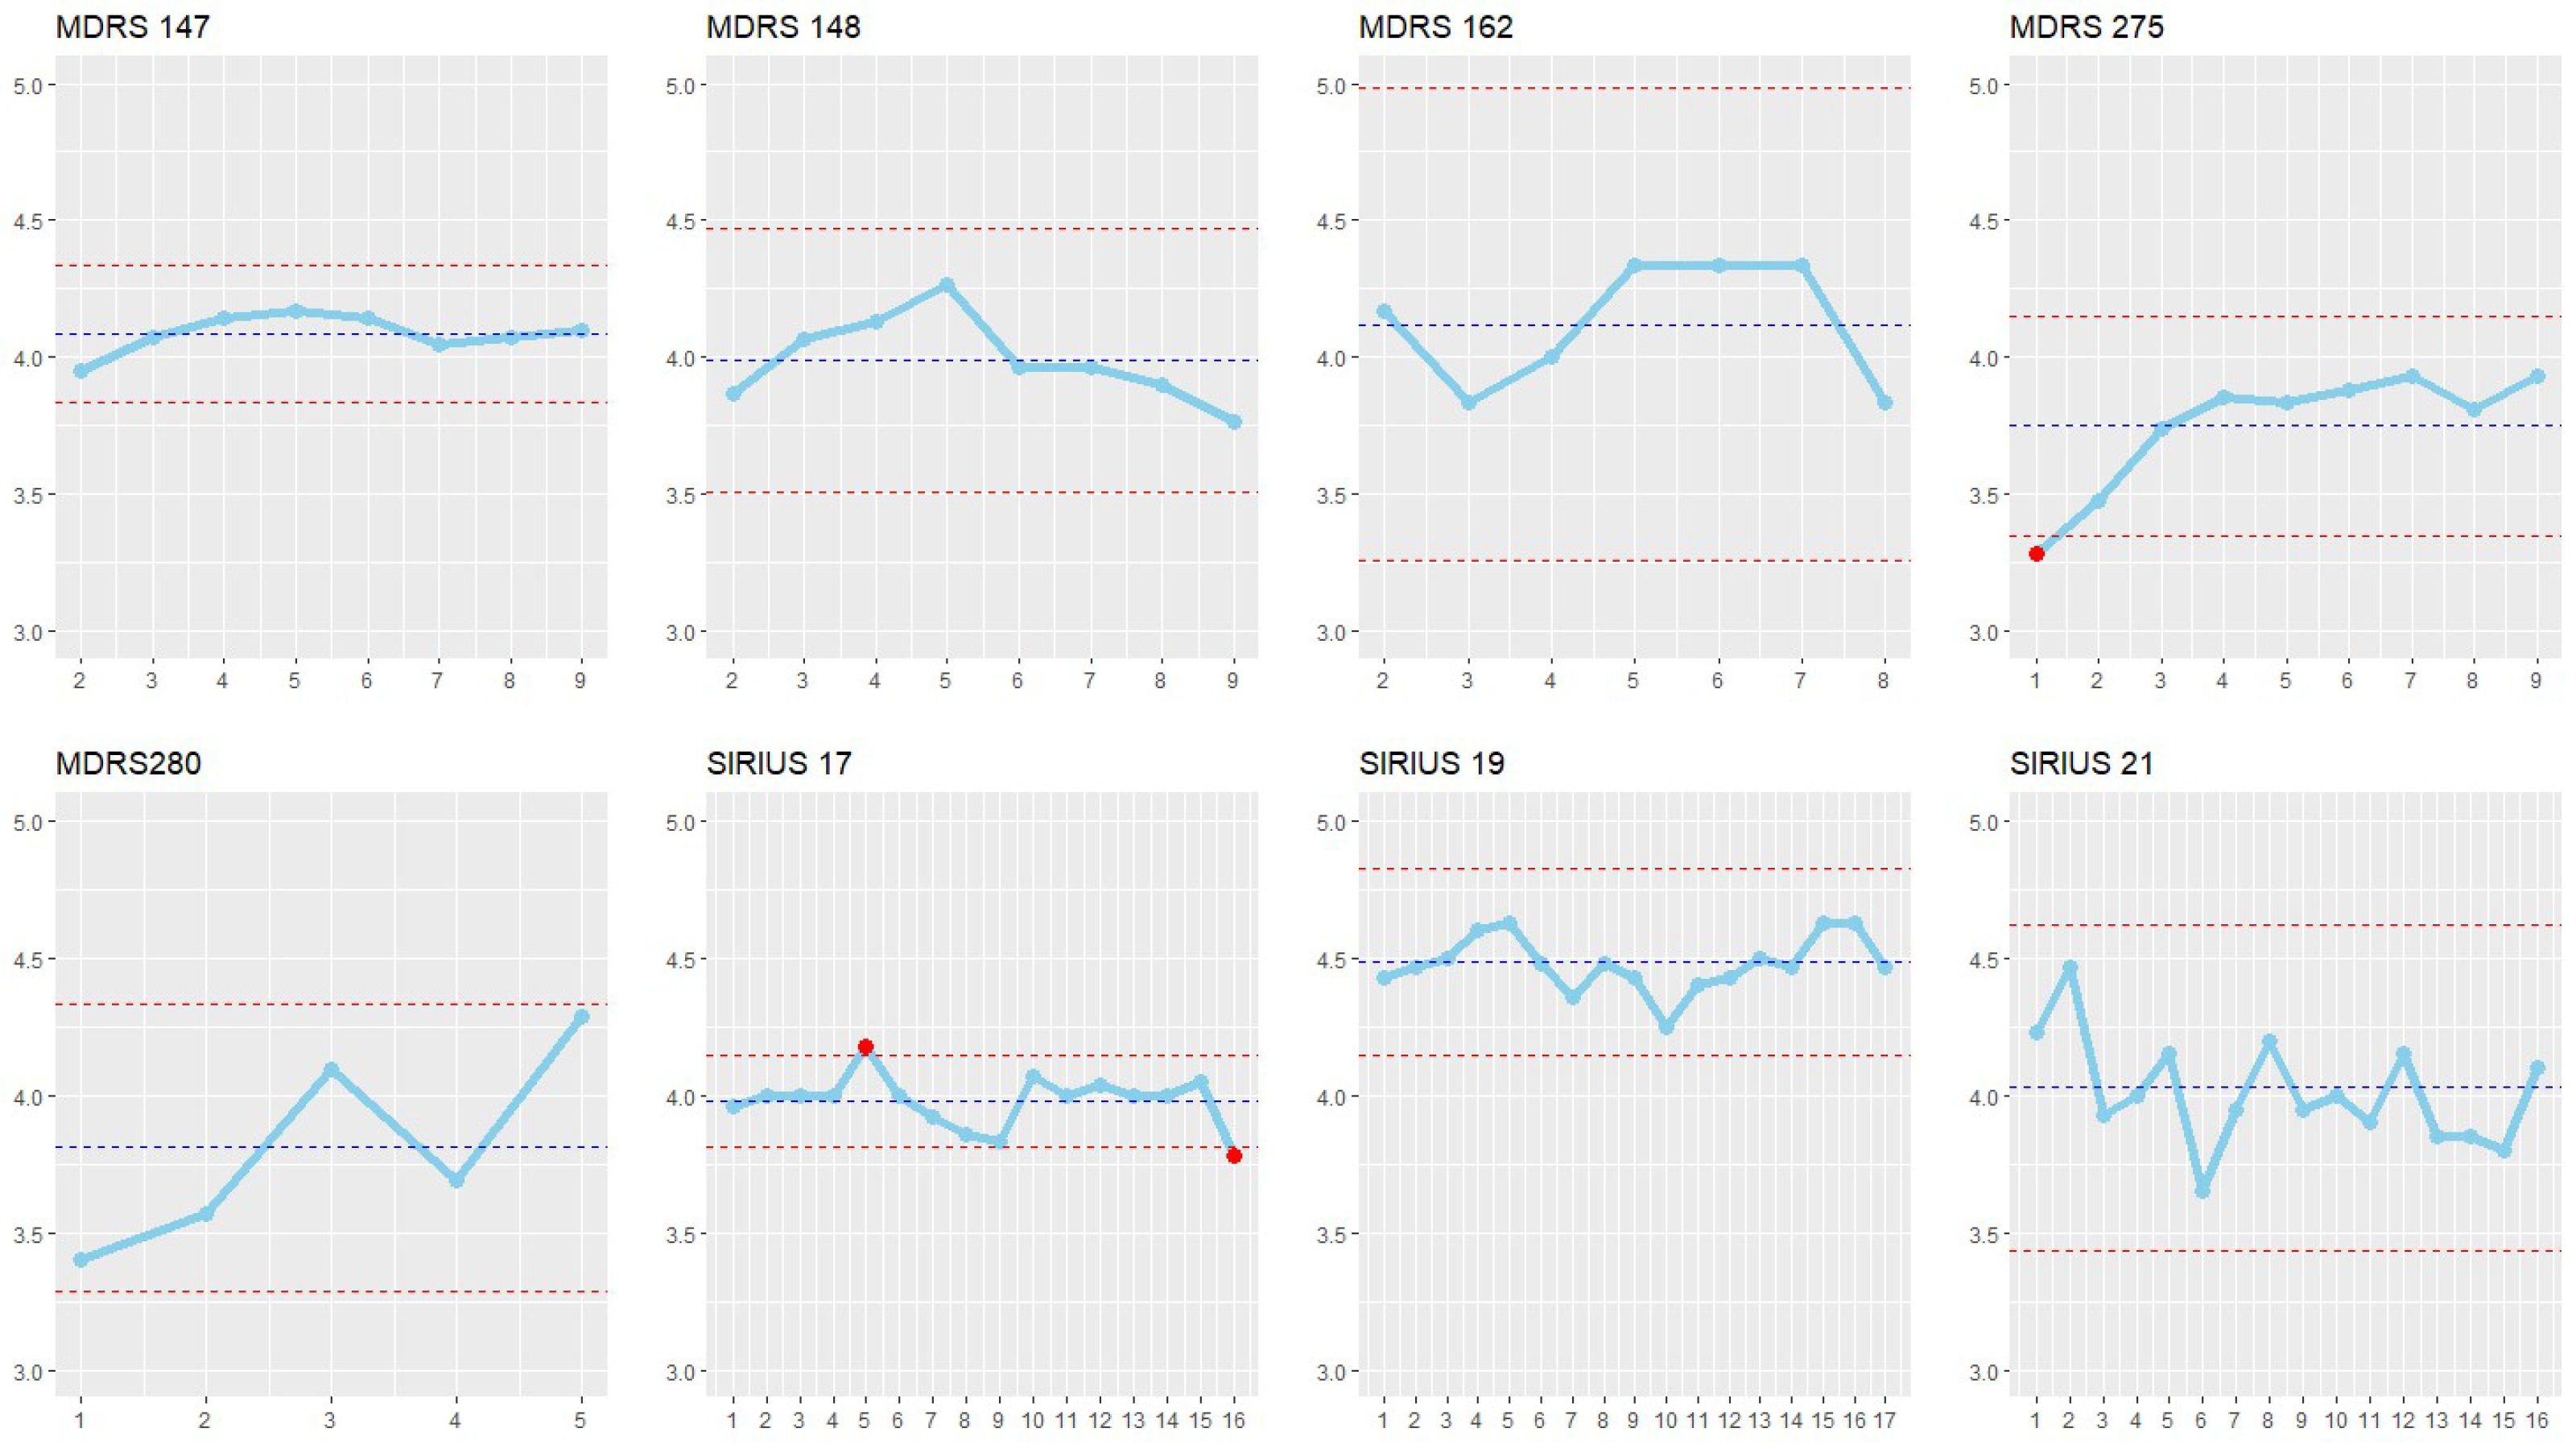
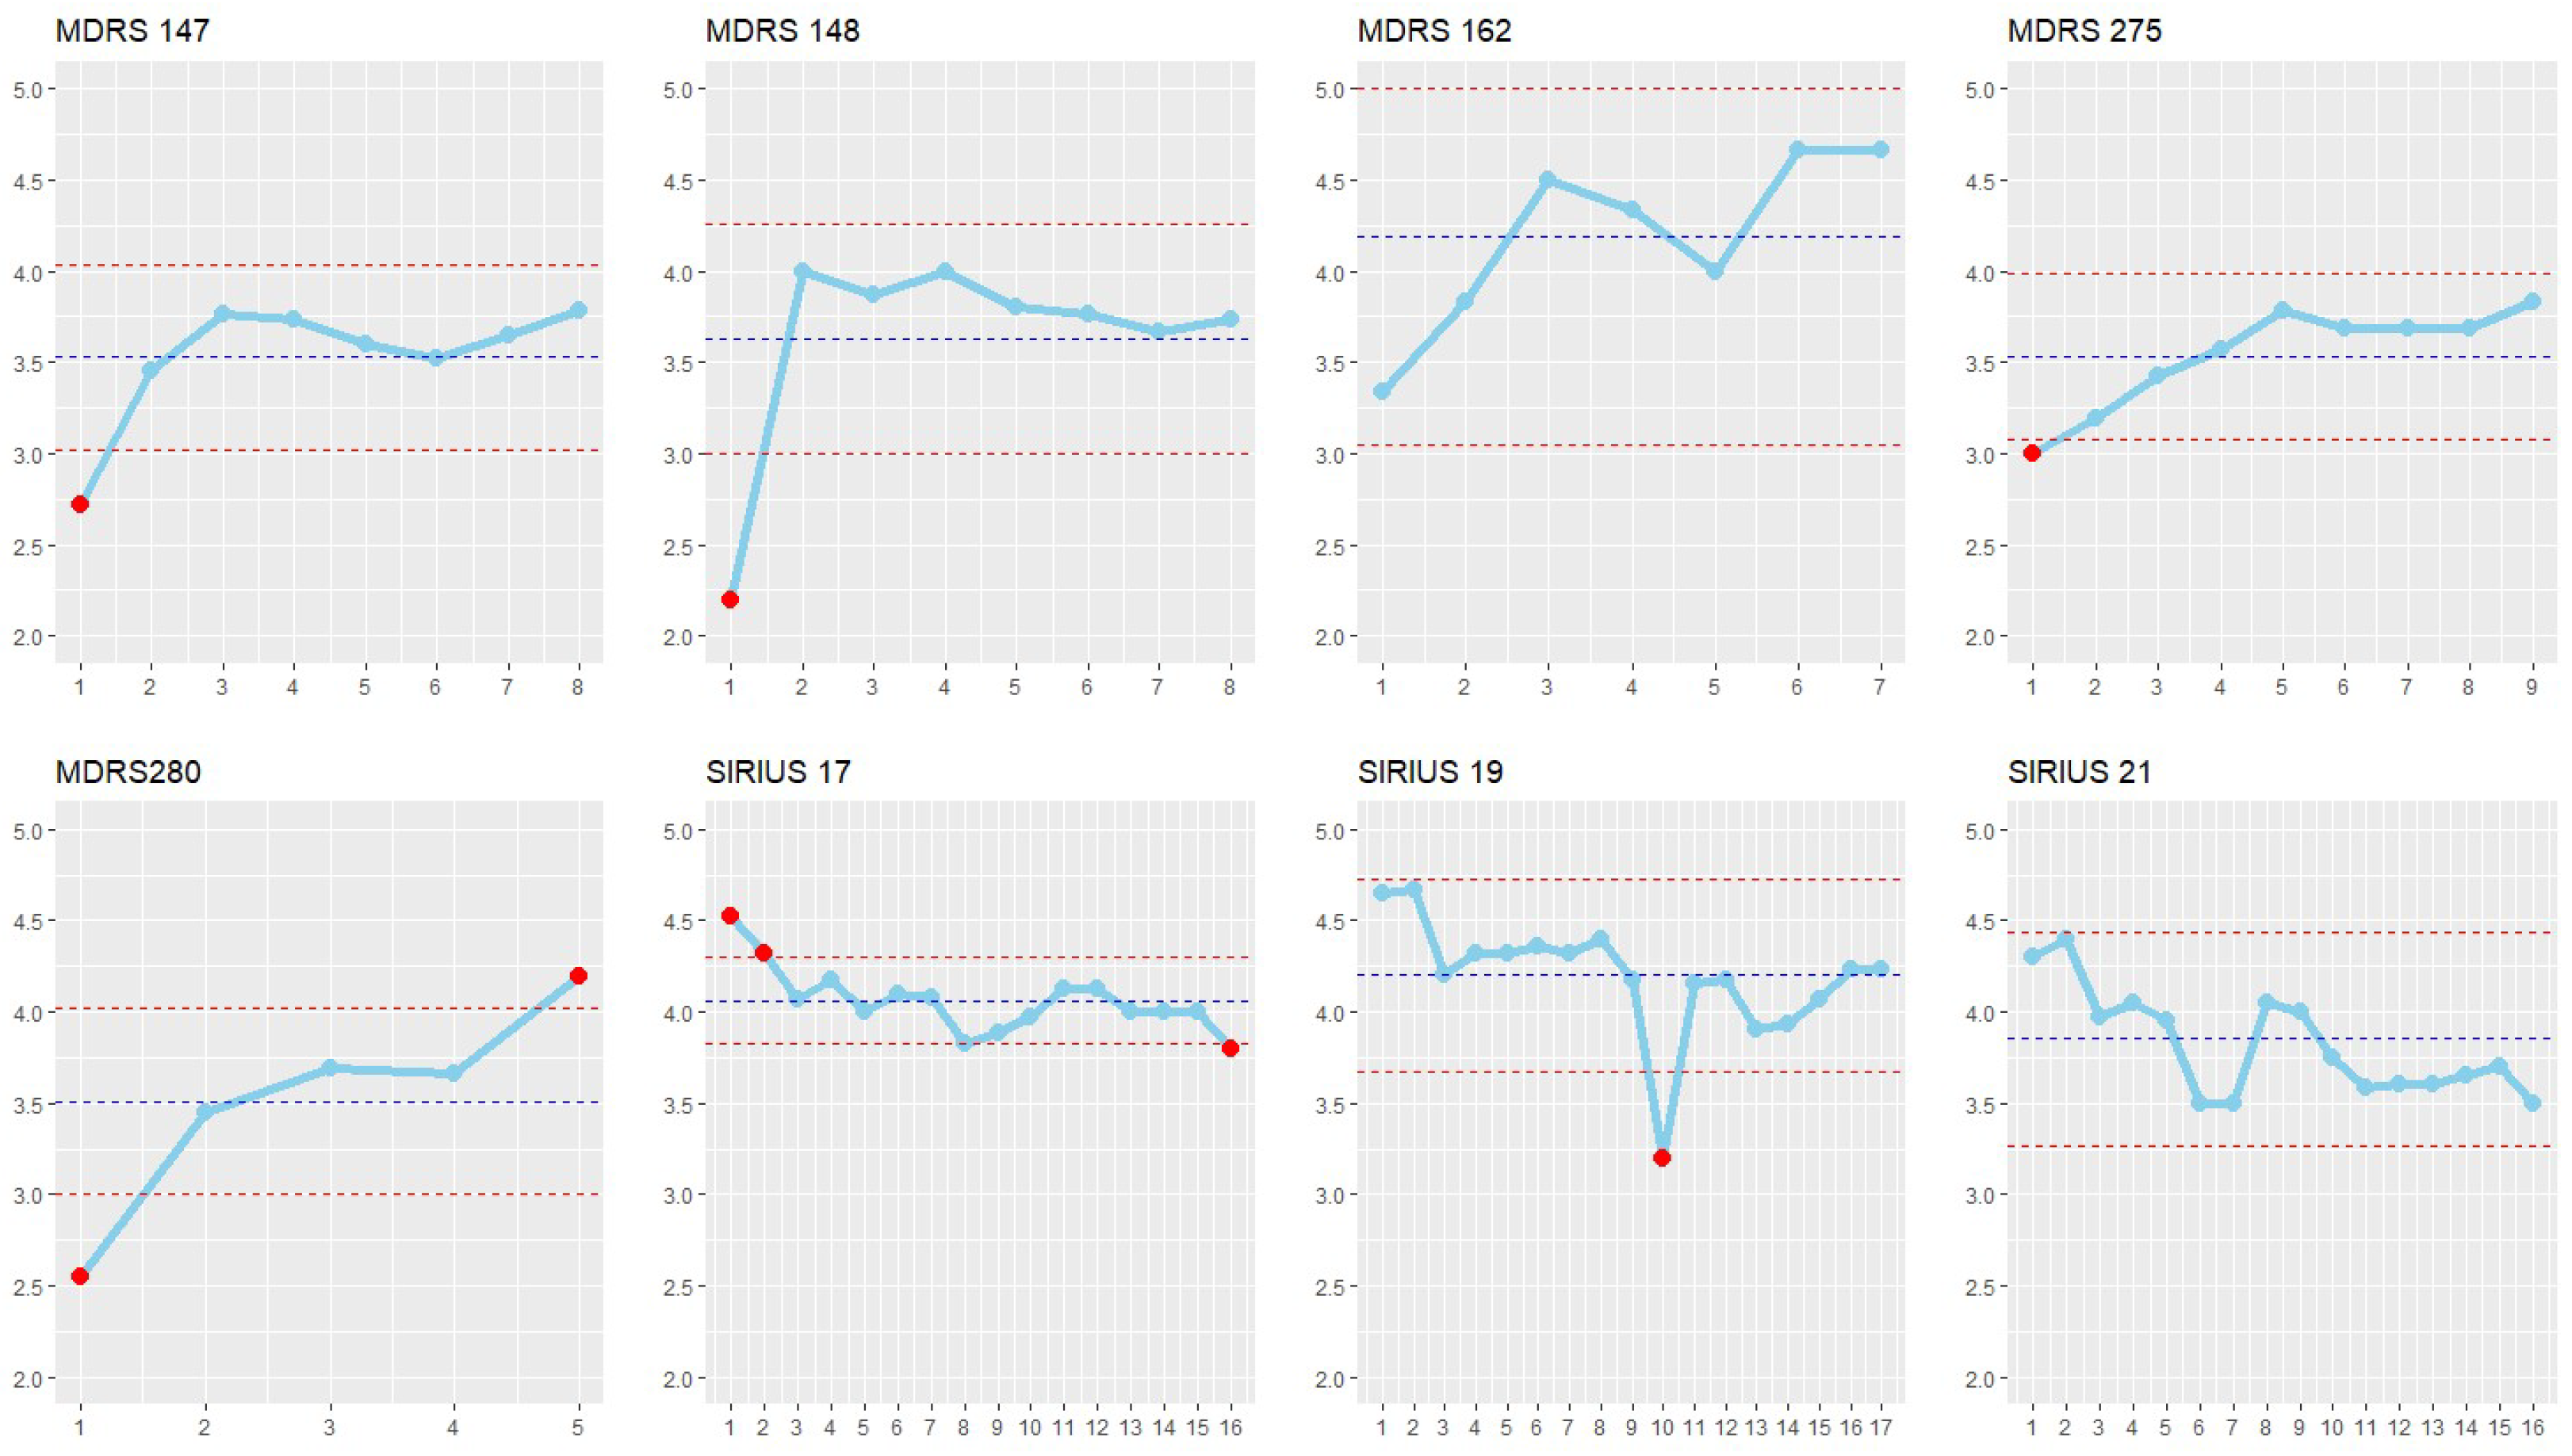
3.3. Significant Fluctuations and Trends in the Communication of the Experimental Crews

The development of both the quantity and quality of communication can be expressed using a control chart, which includes a time series of individual data collections, as well as the long-term average and any warning lines that express a significant deviation from the average. In Figure 9 and Figure 10, we illustrate the fluctuation of both parameters, with the central lines and warning limits UCL and LCL marked.
These graphs allow us to capture not only singular fluctuations but also longer-term trends. A downward trend can be observed, for instance, in the SIRIUS-17 experiment, where there was a decline in both frequency and quality. A significant one-time fluctuation in frequency (and partially in quality) of communication can be seen in the SIRIUS-19 experiment. In the SIRIUS-21 experiment, a decrease in the frequency of communication is indicated (seven final observations fall below the centerline). An example of stabilized communication can be found in the MDRS 147 experiment. Improving trends in both frequency and quality of communication can be observed, on the other hand, in the MDRS 275 and MDRS 280 experiments. The MDRS 148 and MDRS 162 experiments are relatively stabilized, although it is evident that the lowest values of communication quality are achieved at the end.

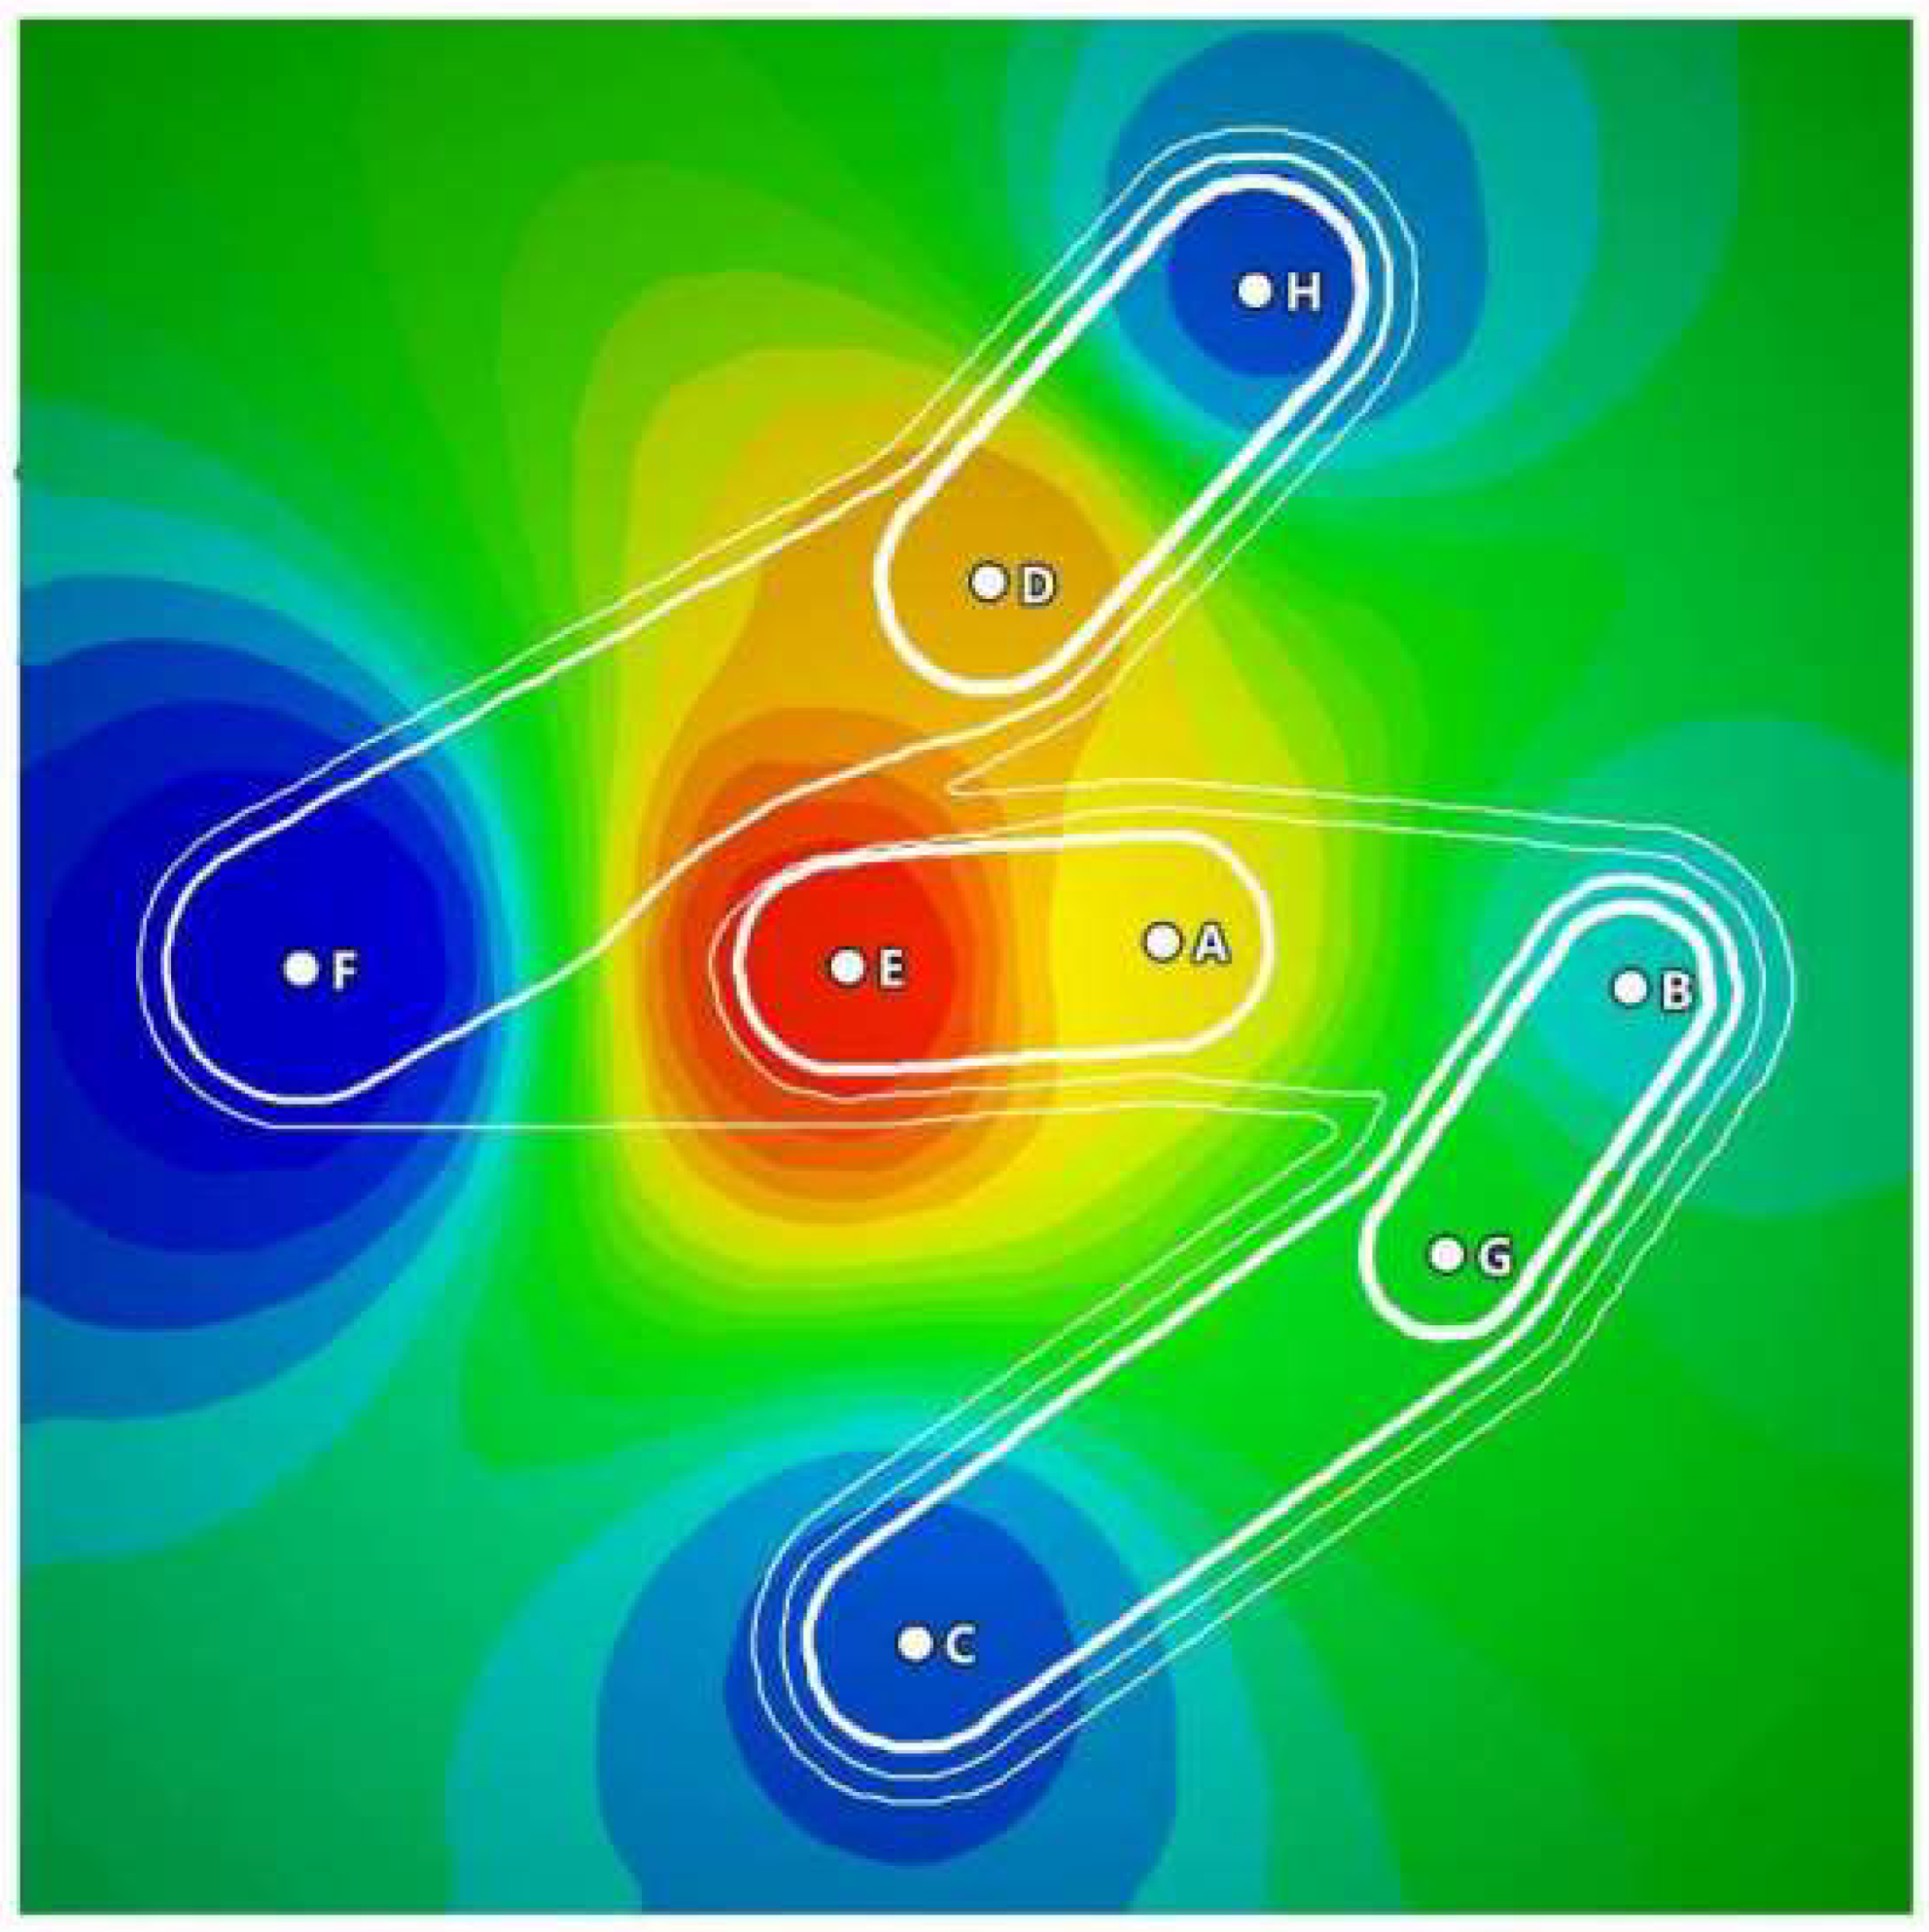
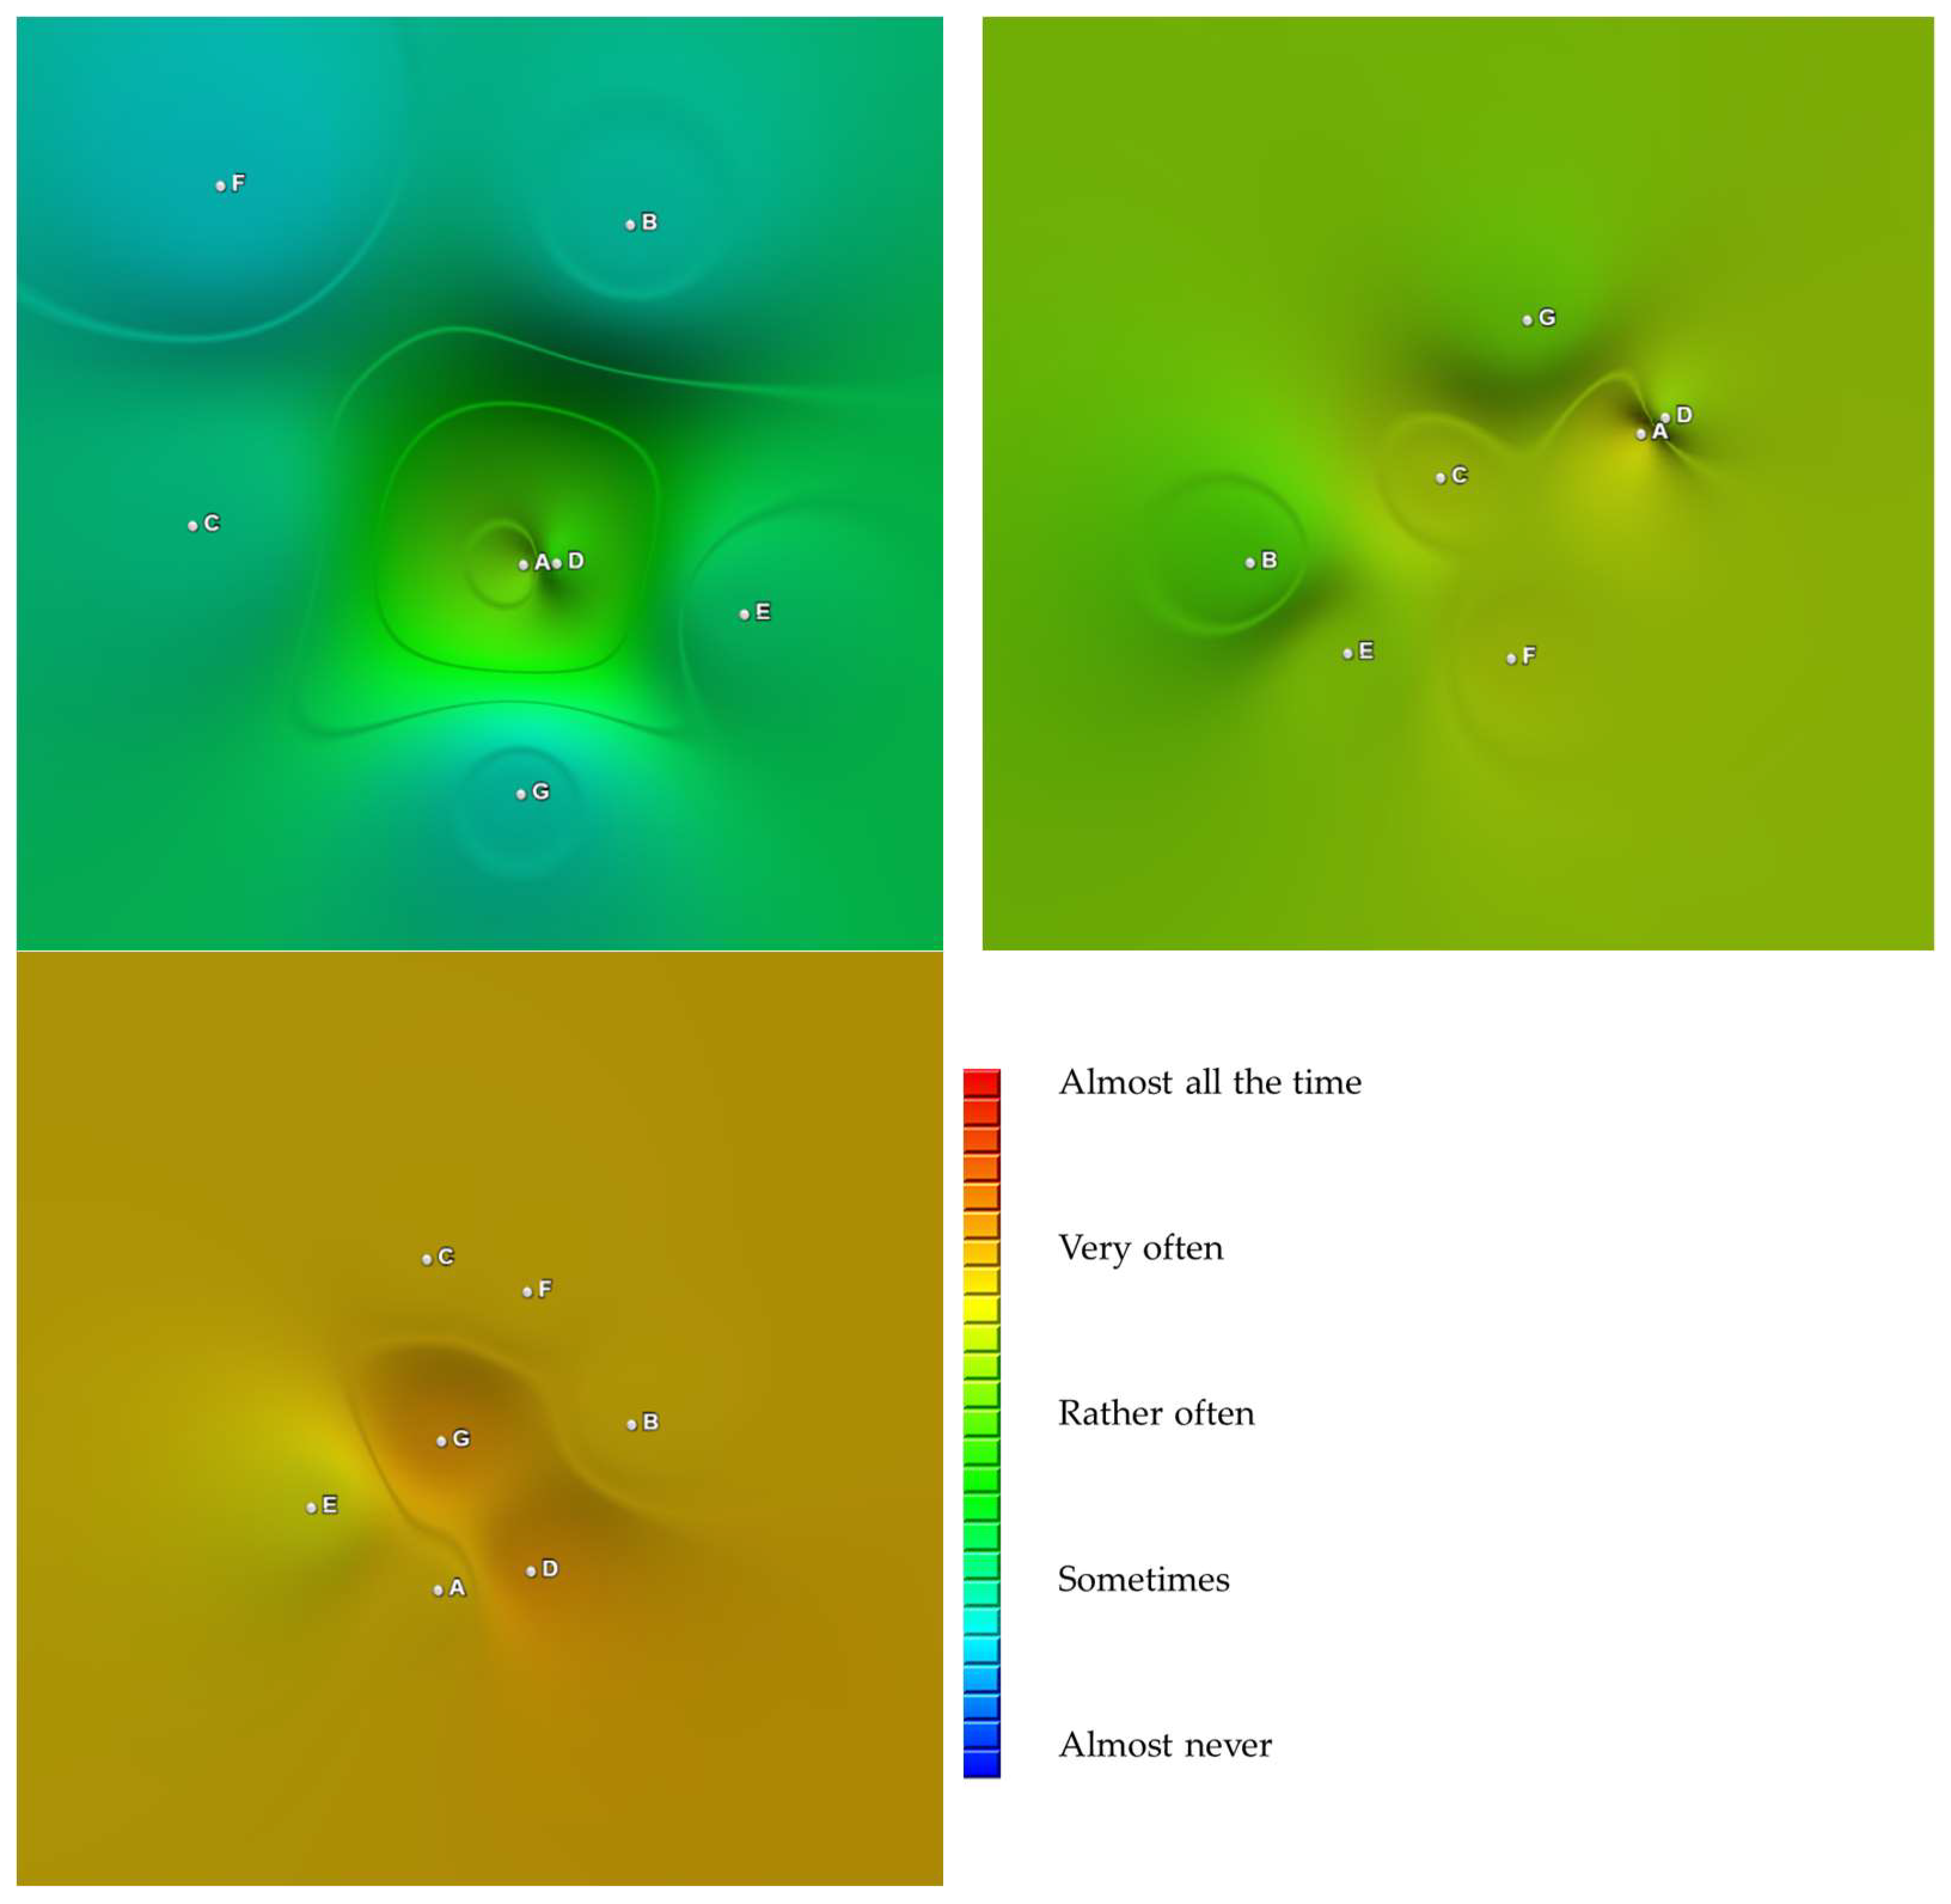
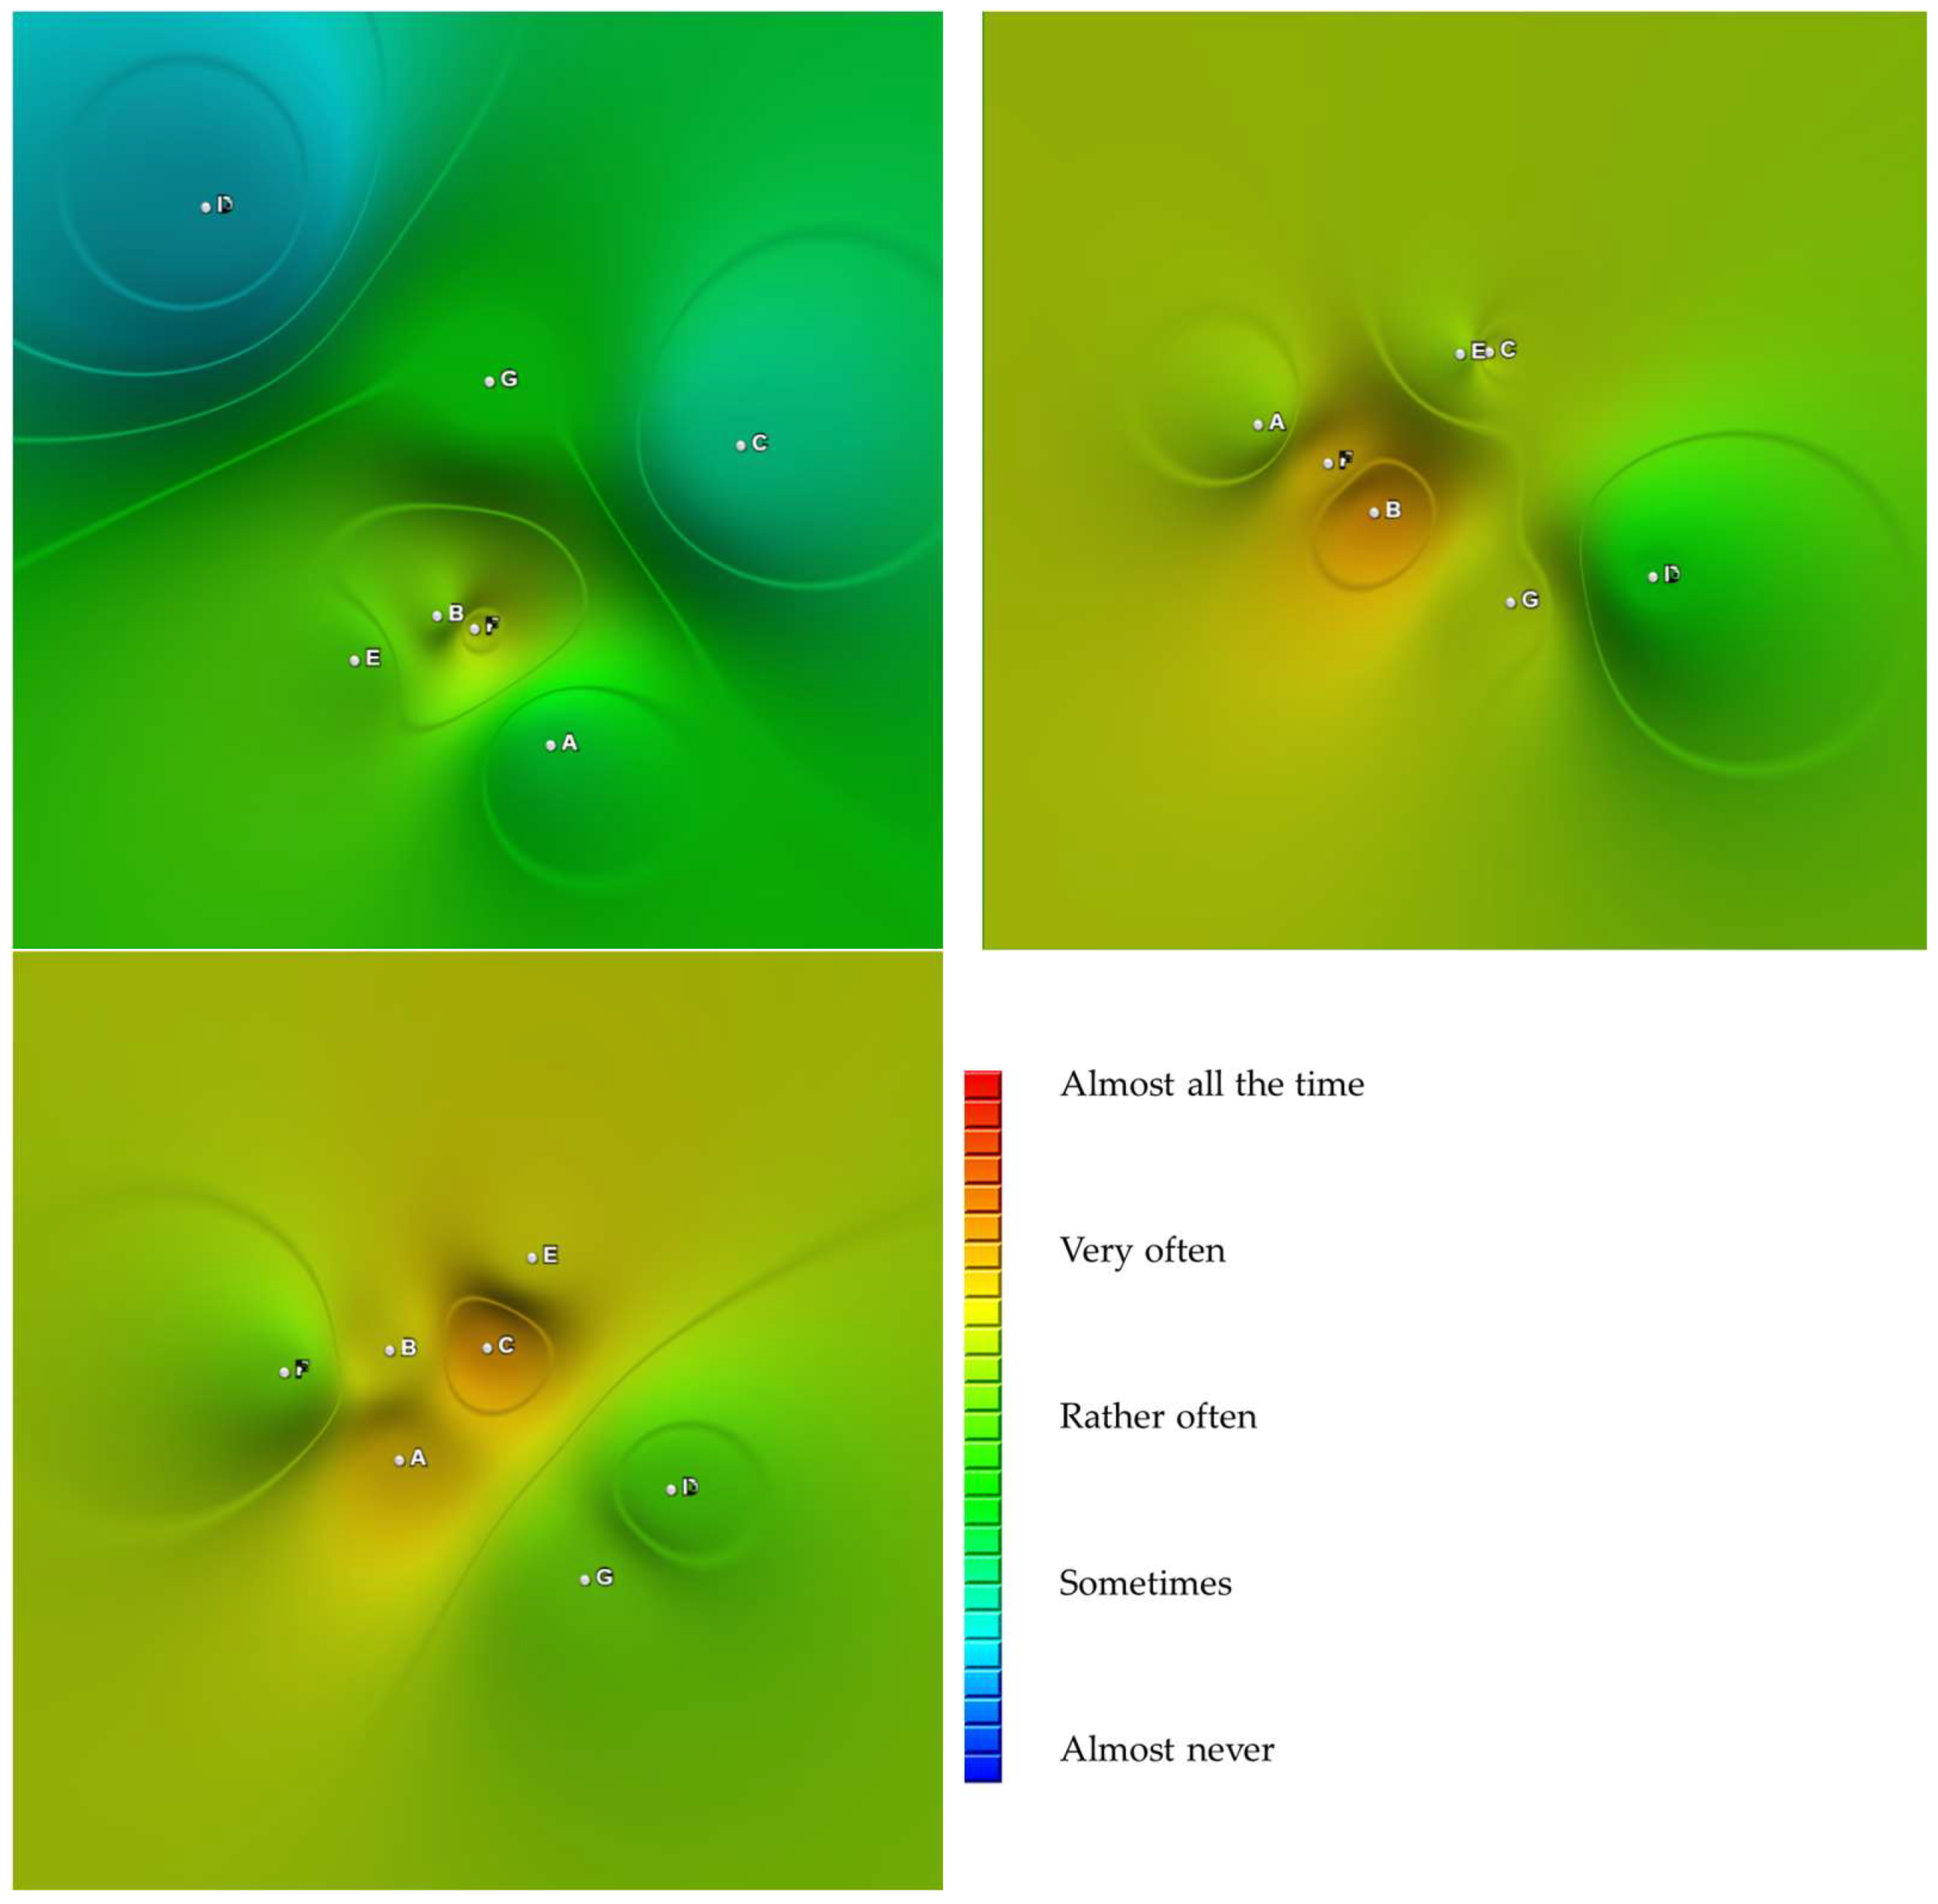
3.4. Visualization of the Structure and Dynamics of Team Communication

Sociomaps offer a deeper understanding of team structure (and dynamics). Figure 11 shows the development of communication frequency during the MDRS 280 experiment. In the beginning, not only a lower intensity of communication is noticeable (blue/green color), but also a structure indicating five team members that are rather separated, with two members in the middle of the sociomap connecting the rest of the team. They act as a connector between the other members. In the second sociomap, we already see a clearer formation of the team, with a structure of two smaller subgroups, mostly connected by one person in the middle of the map. The last sociomap, depicting the end of the experiment, clearly shows highly intensive communication connections between all team members. The team has become highly interconnected, and in terms of communication, it has become significantly more cohesive. The division into distinct sub-teams has disappeared, and none of the team members are significantly separated from the rest of the team.
Figure 12 shows the evolution of communication frequency in another 7-member team, specifically the MDRS 275 experiment. Before the start of the mission, we can see a team with relatively lower communication frequency on the first sociomap, with one team member more distanced from the others, but even the others do not show full mutual communication connections yet. The sociomap from approximately the middle of the mission indicates an overall increase in communication frequency, with more distant team members successfully involved in communication exchanges. However, we still see mostly pairs connecting to the team leader. At the end of the experiment, the formation of a communicationally interconnected five-member crew is evident, with two team members remaining slightly separated from the rest of the team, but this dyad is still connected to each other (proximity on the map).

4. Discussion

Among the various approaches that analyze crew interactions, content analysis of communication [56] or the use of semantic differentials [57] are some examples that enable the capture of the gradual convergence of mutual perceptions. Vinokhodova et al. [58] and Gushin et al. [59] emphasize the importance of measuring changes in communication and psychological closeness not only within the crew but also with the mission command center (MCC). They reported an increase in a “psychological distance” between the crew and the MCC personnel versus increased crew cohesion. A detailed analysis of various levels of communication is quite demanding and expensive and requires special software [60]. In our experiments, changes were repeatedly captured only through subjective scales. This approach is highly time-efficient.
Although the questionnaires varied in different experiments, the assessment of communication in terms of real frequency and quality was always the basis. The reason for choosing communication to assess team processes is that communication can be considered a fundamental condition for all team processes [61]. A meta-analytic study on the relationship between team communication and team performance [62] found a relationship strength of 0.36 for communication quality and 0.19 for quantity. Moreover, these numbers remained relatively stable despite changing team characteristics or management methods. When operationalizing quantity and quality through subjective rating scales, we arrived at similar results on a representative sample from the Czech Republic [63]. For the communication frequency scale, the correlation with perceived performance was 0.19, and for the communication quality satisfaction scale, the correlation with perceived team performance was 0.39. The use of rating scales thus appears to be effective and beneficial for a quick insight into the state of team communication, which can also predict their performance.
Frequency analysis of mutual evaluations of communication quantity and quality among crew members shows that one of the significant warning signs is the scaled rating at levels 1 and 2, which is rarely found on both communication frequency and quality scales. It should be perceived as an unusual phenomenon that indicates a lack of communication connection, which could be a source of potential communication barriers.
Average values of mutual communication frequency, either in quantity or quality, do not normally fall below 3 on the five-point scale. Therefore, any lower average value for both parameters should also be considered highly atypical. Values of average communication frequency and quality below 3.5 are still below the average range compared to the norm for simulated flight crews, while values above 4.5 can be considered significantly above average. Overall, the average of both scales compared to the norms for regular work teams is very high. The obtained average scores can be compared with the norms of regular work teams. These norms were collected from 2014 to 2020 for a total of 1049 teams. The norms take into account the team’s size. Compared to these norms, the space crews are exceptional in terms of above-average frequency (96.5th percentile) and communication quality (98th percentile).
The results of the test-retest correlation of both scales are consistent with previously published findings on time dependability [45]. Although the median estimate of the mean can be understood as evidence of the scale’s reliability and the time stability of communication, the wide range of correlations indicates greater variability in specific cases. This variability may have been caused in some cases by the experimental program, such as the Mars landing simulation in the Mars-500 experiment, but it may also be due to conflicts, as previously found in the HUBES and Mars-105 experiments [38].
It turns out that changes in the quantity and quality of communication are correlated, which can be considered evidence of convergent validity, even though they do not measure the same concepts. The correlation between communication frequency and quality is 0.40, which is very close to the previously published correlation of 0.44 found in regular work teams [38].
On the control charts of overall communication parameters, we can capture occasional fluctuations as well as systematic trends. One possible trend is the deterioration of communication (in terms of both quantity and quality) in the second half of the experiment. The experiments where deterioration occurred include SIRIUS-17 and SIRIUS-21. It cannot be said, therefore, that the general deterioration of communication (which was previously found, for example, in the HUBES, EKOPSY, or Mars 105 experiments [38]) had to be the rule, but it is one of the possible developments that need to be considered since we can include cases such as the SFINCSS and EXEMSI experiments [30]. Given the high number of case studies showing deteriorating communication, it is necessary to consider this risk in training and subsequent team support.
When values for a specific group (or individual) are compared with values for the remaining team members, it is possible to capture the splitting of the team into sub-teams. In the example provided, we illustrated that it is possible to capture the splitting of a group or the partial isolation of some team members on the sociomap.
Regarding gender differences, there is currently a lack of sufficient data. From a communication perspective, mixed crews can be evaluated (compared to team norms) as highly effective, although for a long time in space research, there was a trend to nominate all-male crews. In this context, we can mention a study on work teams, where we did not find significant gender differences in the frequency of mutual communication [64]. Differences in the quantity and quality of communication will continue to be one of the questions in our future research.
Regular measurement of communication sensitizes crew members to how they communicate with each other and provides an early signal in case some communication indicators are not developing as desired by the crew members or the command center [46]. Sociomaps can be a suitable basis for debriefing focused on mutual cooperation [65]. Salas and his colleagues [66] proved that team training has an effect on team performance. If a team learns to conduct regular debriefs, a significant increase in team performance is evident [67,68]. This approach has long been used in aviation [69]. Therefore, it is recommended that team training and team debriefing be used within space crews [70]. The entire process could be adopted by the crew even before the mission itself, which in some cases was done by administering scales at least once before the start of the mission. This finding is supported by a meta-analysis of the impacts of team collaboration training on behavior and team performance [71]. This meta-analysis has demonstrated that training that includes content review supplemented by simulations and a final debrief achieves a high effect on team performance.
Debriefing takes the form of a structured team discussion of the results of the sociomapping followed by facilitated feedback, which is then followed by the creation of action plans to improve communication. The whole process typically includes these specific phases:
  • Data collection and evaluation.
  • Presentation of sociomaps to the team.
  • A general discussion about the results (of what team members found interesting, surprising, affirming, or contradictory about their perceptions of the team).
  • Preparation of feedback to individual team members. Everyone notes on paper the pluses (something they would like to appreciate their colleague for) and deltas (what they could improve in their communication to work better together).
  • Individual team members have a minute to communicate feedback to each other team member.
  • Team members transform the feedback they have heard into an action plan of what they will specifically do to maintain highly effective team communication.
One potential limitation of this study is based on the measurement of communication on subjective assessment scales. In the HUBES and EKOPSY studies, communication scales were compared with objective criteria: physiological and behavioral indicators; for example, it was confirmed that subjective ratings of peer relationships were related to measured physiological indicators of stress. We also validated the relationship between subjectively rated communication frequency and actual communication volume measured in minutes, with an average correlation of 0.69 between objective and subjective communication frequency [38]. In future years, we plan to focus on re-integrating our subjective scale data more closely with objective data measured during isolation to re-validate communication scales in the space research setting.
Let us add that besides space research, communication mapping has been used in the analysis of various other work teams. Over time, it has been proven to be a reliable and valid method [38,72], allowing for the comparison of communication among different work teams. Sociomapping has a demonstrated impact on team performance assessed internally [65] as well as externally [73]. The use of sociomapping is suitable in more demanding situations [74]. Sociomapping can be followed by intervention methods [48,75,76]. Sociomapping has also started to be used in the Army of the Czech Republic for interventions that support team cohesion [77]. Among other things, it has been shown that team interventions based on sociomapping can contribute to the support of mental health [78]. From the perspective of the team itself and the command center, sociomapping can be seen as a regular form of monitoring the quality and quantity of communication within quality management.
In the future, we would recommend that the crew adopt this process along with debriefing and be informed about the various phases that a team can go through and how to deal with misunderstandings or conflicts more constructively. Sociomapping is not only a diagnostic tool but can also be used as a method that is applicable for team training as a tool for better awareness of team processes.

5. Conclusions

Regular evaluation of communication frequency and quality using five-point scales allows for capturing one-time fluctuations in communication as well as long-term trends. If any change is captured by the analysis of averages through regulatory analysis, a sociomap can be used to visualize the relationships among individual crew members. The data collected can serve as a basis for communication debriefing aimed at stabilizing or improving communication. Simultaneously, these procedures can be used for team collaboration training before the actual space mission.

Author Contributions

Conceptualization, R.B. and K.B.S.; methodology, R.B.; software, R.B., E.H. and M.H.; validation, R.B., K.B.S. and E.H.; formal analysis, R.B., M.H. and E.H.; investigation, R.B.; resources, R.B.; data curation, K.B.S.; writing—original draft preparation, R.B. and E.H.; writing—review and editing, R.B., E.H. and K.B.S.; visualization, R.B. and M.H.; supervision, R.B.; project administration, K.B.S.; funding acquisition, K.B.S. and R.B. All authors have read and agreed to the published version of the manuscript.

Funding

This research was funded by the Technology Agency of the Czech Republic, grant number TL03000257.

Data Availability Statement

The data presented in this study are available on request from the corresponding author.

Acknowledgments

In memoriam, we would like to express our gratitude for our long-lasting collaboration with Jaroslav Sýkora and to acknowledge his exceptional contributions to space research, particularly in the field of psychosocial studies. We also extend our gratitude to the Czech team KOSMOW for organizing and executing the Czech collaboration on the SIRIUS research project. Furthermore, we would like to thank Cyril Höschl for programming the software for sociomap visualization and for other technical support.

Conflicts of Interest

The authors declare no conflict of interest.

Appendix A. Resources for More Information about Experiments

ExperimentWebsite with More Information about the Simulation/Project
MDRS 147https://sites.google.com/a/marssociety.org/mdrs2013/home/crew-147/final-mission-report?authuser=0 (accessed on 10 November 2023)
MDRS 148https://sites.google.com/a/marssociety.org/mdrs2013/home/crew-148/mission-summary?authuser=0 (accessed on 10 November 2023)
MDRS 162https://sites.google.com/a/marssociety.org/mdrs2013/home/crew-162/endmissionsummary?authuser=0 (accessed on 10 November 2023)
MDRS 275https://mars.bde-supaero.fr/en/crew-275-crew-members/, more will be published on the MDRS website later (accessed on 10 November 2023)
MDRS 280https://hypatiamars.com/newsletter/ (accessed on 10 November 2023), more will be published on the MDRS website later
MDRShttps://mdrs.marssociety.org/ (accessed on 10 November 2023)
SIRIUS-17https://www.nasa.gov/wp-content/uploads/2018/10/sirius-17.pdf (accessed on 10 November 2023)
SIRIUS-19https://www.nasa.gov/wp-content/uploads/2018/09/sirius_19_booklet.pdf (accessed on 10 November 2023)
SIRIUS-21http://sirius.imbp.ru/sirius21/eng.html (accessed on 10 November 2023)
SIRIUS PROJECThttp://sirius.imbp.ru/eng.html (accessed on 10 November 2023)

References

  1. Hauty, G.T. Human performance in space. In Man in Space: The United States Air Force Program for Developing the Spacecraft Crew; Gantz, K.F., Ed.; Duell, Sloan and Pearce: New York, NY, USA, 1959; pp. 84–108. [Google Scholar]
  2. Christensen, J.M. Psychological Aspects of Extended Manned Space Flight. 1963. Available online: https://apps.dtic.mil/sti/tr/pdf/AD0423442.pdf (accessed on 1 November 2023).
  3. Hartman, B.C.; Flinn, D.E. Crew structure in future space missions. In Lectures in Aerospace Medicine; USAF School of Airspace Medicine and Brooks Airforce Base: San Antonio, TX, USA, 1964; pp. 50–72. [Google Scholar]
  4. Swenson, L.; Grimwood, J.; Alexander, C. This New Ocean: A History of Project Mercury; NASA Special Publication-4201 in the NASA History Series [Internet]. 1989. Available online: https://history.nasa.gov/SP-4201/toc.htm (accessed on 1 November 2023).
  5. Kanas, N.A.; Fedderson, W.E. Behavioral, Psychiatric, and Sociological Problems of Long-Duration Space Missions; NASA TM X-580. 1971. Available online: https://ntrs.nasa.gov/api/citations/19720008366/downloads/19720008366.pdf (accessed on 1 November 2023).
  6. Vinograd, S.P. Studies of Social Group Dynamics under Isolated Conditions; Objective Summary of the Literature as It Relates to Potential Problems of Long Duration Space Flight. 1974. Available online: https://ntrs.nasa.gov/search.jsp?R=19750007236 (accessed on 1 November 2023).
  7. Ziller, R. Group dialectics: The dynamics of groups over time. Hum. Dev. 1977, 20, 293–308. [Google Scholar] [CrossRef]
  8. Connors, M.M.; Harrison, A.A.; Akins, F.R. Living Aloft: Human Requirements for Extended Spaceflight; NASA SP Vol. 483. 1985. Available online: https://ntrs.nasa.gov/api/citations/19850024459/downloads/19850024459.pdf (accessed on 1 November 2023).
  9. Nicholas, J.M. Small groups in orbit: Group interaction and crew performance on Space Station. Aviat. Space Environ. Med. 1987, 58, 1009–1013. [Google Scholar] [PubMed]
  10. Foushee, H.C.; Helmreich, R.L. Group interaction and flight crew performance. In Human Factors in Aviation; Wiener, E.L., Nagel, D.C., Eds.; Academic Press: San Diego, CA, USA, 1988; pp. 189–227. [Google Scholar]
  11. Galarza, L.; Holland, A.W. Critical Astronaut Proficiencies Required for Long-Duration Space Flight; SAE Technical Paper 1999-01-2096; NASA: Houston, TX, USA, 1999. [Google Scholar] [CrossRef]
  12. Manzey, D. Human missions to Mars: New psychological challenges and research issues. Acta Astronaut. 2004, 55, 781–790. [Google Scholar] [CrossRef] [PubMed]
  13. Kanas, N.; Sandal, G.M.; Boyd, J.E.; Gushin, V.I.; Manzey, D.; North, R.; Leon, G.R.; Suedfeld, P.; Bishop, S.L.; Fiedler, E.R.; et al. Psychology and culture during long-duration space missions. In On orbit and Beyond: Psychological Perspectives on Human Spaceflight; Vakoch, D.A., Ed.; Springer Publishing: Berlin/Heidelberg, Germany, 2013; pp. 153–184. [Google Scholar] [CrossRef]
  14. Landon, L.B.; Slack, K.J.; Barrett, J.D. Teamwork and collaboration in long-duration space missions: Going to extremes. Am. Psychol. 2018, 73, 563–575. [Google Scholar] [CrossRef] [PubMed]
  15. Golden, S.J.; Chang, C.H.; Kozlowski, S.W. Teams in isolated, confined, and extreme (ICE) environments: Review and integration. J. Organ. Behav. 2018, 39, 701–715. [Google Scholar] [CrossRef]
  16. Bell, S.T.; Brown, S.G.; Mitchell, T.D. What we know about team dynamics for long-distance space missions: A systematic review of analog research. Front. Psychol. 2019, 10, 811. [Google Scholar] [CrossRef]
  17. Kanas, N. Psychosocial issues affecting crews during long-duration international space missions. Acta Astronaut. 1998, 42, 339–361. [Google Scholar] [CrossRef]
  18. Palinkas, L.A. Psychosocial issues in long-term space flight: Overview. Gravitational Space Biol. Bull. 2001, 14, 25–33. [Google Scholar]
  19. Kanas, N. Crewmember interactions in space. In Handbook of Bioastronautics; Young, L.R., Sutton, J.P., Eds.; Springer: Cham, Switzerland, 2021; pp. 407–423. [Google Scholar] [CrossRef]
  20. Oberg, J.E. Red Star in Orbit, 1st ed.; Random House: New York, NY, USA, 1981. [Google Scholar]
  21. Cunningham, W. All American Boys, an Insider’s Look at the US Space Program (New Ed.); iBooks; Seattle Goodwill: Seattle, WA, USA, 2010. [Google Scholar]
  22. Kring, J.P.; Kaminski, M.A. Gender composition and crew cohesion during long-duration space missions. In On Orbit and Beyond: Psychological Perspectives on Human Spaceflight; Vakoch, D.A., Ed.; Springer: New York, NY, USA, 2012; Volume 29, pp. 123–134. [Google Scholar]
  23. Mark, S.; Scott, G.B.; Donoviel, D.B.; Leveton, L.B.; Mahoney, E.; Charles, J.B.; Siegel, B. The impact of sex and gender on adaptation to space: Executive summary. J. Women’s Health 2014, 23, 941–947. [Google Scholar] [CrossRef]
  24. Landis, G.A. An all-woman crew to Mars: A radical proposal. Space Policy 2000, 16, 167–169. [Google Scholar] [CrossRef]
  25. Tafforin, C. Time effects, cultural influences, and individual differences in crew behavior during the Mars-500 experiment. Aviat. Space Environ. Med. 2013, 84, 1082–1086. [Google Scholar] [CrossRef] [PubMed]
  26. Sandal, G.M. Culture and tension during an International Space Station simulation: Results from SFINCSS’99. Aviat. Space Environ. Med. 2004, 75, C44–C51. [Google Scholar] [PubMed]
  27. Bechtel, R.B.; Berning, A. The third-quarter phenomenon: Do people experience discomfort after stress has passed. In From Antarctica to Outer Space: Life in Isolation and Confinement; Harrison, A.A., Clearwater, Y.A., McKay, C.P., Eds.; Springer: New York, NY, USA, 1991; pp. 261–265. [Google Scholar]
  28. Kanas, N.A.; Ritsher, J.B.; Saylor, S.A. Do Psychosocial Decrements Occur During the 2nd Half of Space Missions? In Proceedings of the AIAA 57th International Astronautical Congress, IAC 2006, Valenica, Spain, 2–6 October 2006. [Google Scholar]
  29. Sandal, G.M.; Værnes, R.; Ursin, H. Crew compatibility and interaction. Adv. Space Biol. Med. 1996, 5, 213–231. [Google Scholar] [CrossRef] [PubMed]
  30. Sandal, G.M. Crew tension during a space station simulation. Environ. Behav. 2001, 33, 134–150. [Google Scholar] [CrossRef] [PubMed]
  31. Sýkora, J.; Šolcová, I.; Bahbouh, R. Group Dynamics and Tension Analysis in Simulated Extended Spaceflight Settings. In Advances in Space Biology and Medicine: HUBES–135 Days of MIR Simulation Study; ESA: Paris, France, 1996. [Google Scholar]
  32. Šolcová, I. Poznatky o psychické odolnosti malých skupin izolovaných v náročných podmínkách. Ceskoslov. Psychol. 2008, 52, 253–264. [Google Scholar]
  33. Šolcová, I. Poznatky o odolnosti malých skupin izolovaných v náročných podmínkách. In Mars-500 Fakta a Postřehy ze Simulovaného Letu na Rudou Planetu; Šolcová, I., Stuchlíková, I., Guščin, V.I., Eds.; Academia Praha: Praha, Czech Rebublic, 2014; pp. 14–29. [Google Scholar]
  34. Bahbouh, R. Sociomapování (Sociomapping); Gema Art: Prague, Czech Republic, 1994. [Google Scholar]
  35. Bahbouh, R. Využití Sociomapování u Malých Sociálních Skupin (Use of Sociomapping in Small Social Groups). Master’s Thesis, Charles University in Prague, Prague, Czech Republic, 1996. [Google Scholar]
  36. Kazda, L.; Tomeček, A. Implications of dynamic sociometry in optimalization of management structures of the Czech Air Force. Selection and Training Advances in Aviation. In Proceedings of the Aerospace Medical Symposium, Prague, Czech Republic, May 1996. [Google Scholar]
  37. Sýkora, J.; Nechaev, A.P.; Šolcová, I.; Bahbouh, R.; Konopásek, P. Izučenije gruppovoj dinamiki v uslovijach 90-sutočnoj izoljaci. (evaluation of the dynamics of in-group strain during long isolation). Aviakosmičeskaja I Ekol. Med. 1997, 34, 11–15. [Google Scholar]
  38. Bahbouh, R. Sociomapping of Teams; Dar Ibn Rushd: Praha, Czech Republic, 2012. [Google Scholar]
  39. Bahbouh, R.; Sněhotová, J.; Děchtěrenko, F.; Sýkora, J. Sociomapování komunikace posádky v experimentu Mars 500. In Mars-500 Fakta a Postřehy ze Simulovaného Letu na Rudou Planetu; Šolcová, I., Stuchlíková, I., Guščin, V.I., Eds.; Academia Praha: Czech Rebublic, 2014; pp. 147–163. [Google Scholar]
  40. Mars Desert Research Station. Available online: https://mdrs.marssociety.org/ (accessed on 2 November 2023).
  41. SIRIUS International Project. Available online: http://sirius.imbp.ru/sirius21/eng.html (accessed on 2 November 2023).
  42. International Science Program SIRIUS. Stage One: SIRIUS-17. Available online: https://www.nasa.gov/wp-content/uploads/2018/10/sirius-17.pdf (accessed on 2 November 2023).
  43. International Science Program SIRIUS. Stage Two: SIRIUS-19. Available online: https://www.nasa.gov/wp-content/uploads/2018/09/sirius_19_booklet.pdf (accessed on 2 November 2023).
  44. Bernardová Sýkorová, K. Application of a psychosocial approach to the identification and strengthening of adaptation mechanisms of humans and a small social group during the isolation experiment “SIRIUS 2017–2023”. Aerospace 2023, 10, 771. [Google Scholar] [CrossRef]
  45. Bahbouh, R.; Rozehnalová, E.; Děchtěrenko, F. Dependability of group communication sociomapping. In Sociodiagnostics and Sociomapping II; Lasker, G., Bahbouh, R., Eds.; The International Institute for Advanced Studies in Systems Research and Cybernetics: Tecumseh, ON, Canada, 2013; pp. 4–10. [Google Scholar]
  46. Bahbouh, R. Psychosocial Aspects of a Flight to Mars; IntechOpen: London, UK, 2020. [Google Scholar] [CrossRef]
  47. Kubík, R.; Bahbouh, R. The Relationship between Satisfaction with Team Communication and Evaluation of Communication with Individual Team Members. In Sociodiagnostics and Sociomapping III; Lasker, G., Bahbouh, R., Eds.; The International Institute for Advanced Studies in Systems Research and Cybernetics: Tecumseh, ON, Canada, 2014; pp. 46–50. [Google Scholar]
  48. Vraný, M.; Bahbouh, R. Sociomapping of the mutual familiarity of team members and its increase. In Sociodiagnostics and Sociomapping IV; Lasker, G., Bahbouh, R., Eds.; The International Institute for Advanced Studies in Systems Research and Cybernetics: Tecumseh, ON, Canada, 2015; pp. 45–51. [Google Scholar]
  49. Franc, M.; Bahbouh, R.; Kubík, R. The effect of manager’s frequency and quality of communication on team’s performance. In Work and Organizational Psychology 2019: Proceedings of the 18th International Conference; Procházka, J., Kratochvíl, T., Vaculík, M., Eds.; MUNI Press: Brno, Czech Republic, 2019; pp. 44–52. [Google Scholar] [CrossRef]
  50. Shewhart, W.A. Statistical Method from the Viewpoint of Quality Control; Dover Publications: New York, NY, USA, 1986. [Google Scholar]
  51. Nelson, L.S. The Shewhart Control Chart—Tests for Special Causes. J. Qual. Technol. 1984, 16, 238–239. [Google Scholar] [CrossRef]
  52. Bi, H.H. A Note on the Factor Values of Three Common Shewhart Variables Control Charts. Commun. Stat.—Theory Methods 2015, 44, 2655–2673. [Google Scholar] [CrossRef]
  53. Bahbouh, R. Sociomapování (Sociomapping). Doctoral Dissertation, Charles University in Prague, Prague, Czech Republic, 2004. [Google Scholar]
  54. Hoschl, C. Visualization and Testing of Team Profiles. Master’s Thesis, Charles University in Prague, Prague, Czech Republic, 2010. [Google Scholar]
  55. Hoschl, C. Accuracy of Sociomapping Visualization: Comparative Study with MDS and PCA. In Sociomapping and Sociodiagnostics: Volume II; Bahbouh, R., Lasker, G., Eds.; The International Institute for Advanced Studies in Systems Research and Cybernetics: Tecumseh, ON, Canada, 2013; pp. 1–3. [Google Scholar]
  56. Gushin, V.I.; Zaprisa, N.S.; Kolinitchenko, T.B.; Efimov, V.A.; Smirnova, T.M.; Vinokhodova, A.G.; Kanas, N. Content analysis of the crew communication with external communicants under prolonged isolation. Aviat. Space Environ. Med. 1997, 68, 1093–1098. [Google Scholar]
  57. Gushin, V.I.; Efimov, V.A.; Smirnova, T.M.; Vinokhodova, A.G.; Kanas, N. Subject’s perceptions of the crew interaction dynamics under prolonged isolation. Aviat. Space Environ. Med. 1998, 69, 556–561. [Google Scholar] [PubMed]
  58. Vinokhodova, A.; Gushin, V.; Kuznetsova, P.; Yusupova, A. Crew Interaction in Extended Space Missions. Aerospace 2023, 10, 719. [Google Scholar] [CrossRef]
  59. Gushin, V.I.; Yusupova, A.K.; Shved, D.M.; Shueva, L.V.; Vinokhodova, A.G.; Bubeev, Y.A. The evolution of methodological approaches to the psychological analysis of the crew communications with Mission Control Center. REACH 2016, 1, 74–83. [Google Scholar] [CrossRef]
  60. Hutchins, E.; Weibel, N.; Emmenegger, C.; Fouse, A.; Holder, B. An integrative approach to understanding flight crew activity. J. Cogn. Eng. Decis. Mak. 2013, 7, 353–376. [Google Scholar] [CrossRef]
  61. Dickinson, T.L.; McIntyre, R.M.A. conceptual framework for teamwork measurement. In Team Performance Assessment and Measurement: Theory, Methods, and Applications; Brannick, M.T., Salas, E., Prince, C.W., Eds.; Lawrence Erlbaum: Mahwah, NJ, USA, 1997; pp. 19–43. [Google Scholar]
  62. Marlow, S.L.; Lacerenza, C.N.; Paoletti, J.; Burke, C.S.; Salas, E. Does team communication represent a one-size-fits-all approach?: A meta-analysis of team communication and performance. Organ. Behav. Hum. Decis. Process. 2018, 144, 145–170. [Google Scholar] [CrossRef]
  63. Bahbouh, R.; Hoschlová, E. Relationship between perceived team communication and team performance. In Work and Organizational Psychology 2021: Proceedings of the 20th International Conference; Seitl, M., Viktorová, L., Hypšová, P., Eds.; Palacký University, Faculty of Arts: Olomouc, Czech Republic, 2021; pp. 23–33. [Google Scholar]
  64. Fabianová, I.; Bahbouh, R. Do we talk more often with men or women? The communication frequency comparison between men and women in the team. In Social Processes and Personality 2017: LOOKING BACK, LOOKING FOR...; Blatný, M., Jelínek, M., Květoň, P., Vobořil, D., Eds.; Psychologický ústav AV ČR: Brno, Czech Republic, 2018; pp. 49–54. [Google Scholar]
  65. Fabianová, I. Efekt Týmového Koučování Využívajícího Sociomapování (The Effect of Sociomapping Based Team Coaching). Doctoral Dissertation, Charles University in Prague, Prague, Czech Republic, 2020. [Google Scholar]
  66. Salas, E.; DiazGranados, D.; Klein, C.; Burke, C.S.; Stagl, K.C.; Goodwin, G.F.; Halpin, S.M. Does team training improve team performance? A meta-analysis. Hum. Factors 2008, 50, 903–933. [Google Scholar] [CrossRef] [PubMed]
  67. Tannenbaum, S.I.; Cerasoli, C.P. Do team and individual debriefs enhance performance? A meta-analysis. Hum. Factors 2013, 55, 231–245. [Google Scholar] [CrossRef]
  68. Keiser, N.L.; Arthur, W., Jr. A meta-analysis of the effectiveness of the after-action review (or debrief) and factors that influence its effectiveness. J. Appl. Psychol. 2021, 106, 1007. [Google Scholar] [CrossRef]
  69. Kikkawa, Y.; Mavin, T.J. A review of debriefing practices: Towards a framework for airline pilot debriefing. Aviat. Psychol. Appl. Hum. Factors 2017, 7, 42–54. [Google Scholar] [CrossRef]
  70. Salas, E.; Tannenbaum, S.I.; Kozlowski, S.W.; Miller, C.A.; Mathieu, J.E.; Vessey, W.B. Teams in space exploration: A new frontier for the science of team effectiveness. Curr. Dir. Psychol. Sci. 2015, 24, 200–207. Available online: http://www.jstor.org/stable/44319016 (accessed on 10 November 2023). [CrossRef]
  71. McEwan, D.; Ruissen, G.R.; Eys, M.A.; Zumbo, B.D.; Beauchamp, M.R. The effectiveness of teamwork training on teamwork behaviors and team performance: A systematic review and meta-analysis of controlled interventions. PLoS ONE 2017, 12, e0169604. [Google Scholar] [CrossRef] [PubMed]
  72. Rozehnalová, E. Reliabilita a Validita Sociomapování Komunikace: Se Zaměřením na Vzájemné Hodnocení Uvnitř Malých Pracovních Skupin (Reliability and Validity of Sociomapping: Focused on Peer-to-Peer Ratings in Small Work Groups). Doctoral Dissertation, Charles University in Prague, Prague, Czech Republic, 2013. [Google Scholar]
  73. Tetour, V. Efektivita Intervence Sociomapování u Vybraných Charakteristik Pracovních Týmů (The Effectivity of Sociomapping Intervention for Selected Charateristics of Work Teams). Master’s Thesis, Charles University in Prague, Prague, Czech Republic, 2019. [Google Scholar]
  74. Bahbouh, R.; Willis, P. Navigating crisis with integrative systemic team coaching (ISTC). In The Team Coaching Casebook; Clutterbuck, D., Turner, T., Murphy, C., Eds.; Open University Press: Berkshire, UK, 2021; pp. 69–78. [Google Scholar]
  75. Rozehnalová, E.; Bahbouh, R. Effectiveness of Sociomapping Intervention I: Theoretical Background. In Sociodiagnostics and Sociomapping II; Lasker, G., Bahbouh, R., Eds.; The International Institute for Advanced Studies in Systems Research and Cybernetics: Tecumseh, ON, Canada, 2013; Volume II, pp. 11–16. [Google Scholar]
  76. Kovaříková, J.; Rozehnalová, E.; Bahbouh, R. Effectiveness of Sociomapping Intervention II: Case Studies. In Sociodiagnostics and Sociomapping II; Lasker, G., Bahbouh, R., Eds.; The International Institute for Advanced Studies in Systems Research and Cybernetics: Tecumseh, ON, Canada, 2013; Volume II, pp. 17–22. [Google Scholar]
  77. Bernardova, K. Using sociomapping with the Czech Army. In New Perspectives of Psychodiagnostics; Bahbouh, R., Rozehnalová, E., Sailerová, V., Eds.; QED GROUP: Prague, Czech Republic, 2012; pp. 71–82. [Google Scholar]
  78. Giusino, D.; De Angelis, M.; Kubík, R.; Axtell, C.; Pietrantoni, L. Digital team coaching for workplace communication: Longitudinal evaluation of recipients’ perceptions. Team Perform. Manag. 2023, 29, 257–277. [Google Scholar] [CrossRef]
Figure 1. Example of a control chart. Note: the blue line represents the average value (CL), and the red dashed lines indicate the UCL (upper control limit) and LCL (lower control limit) values. The example also includes visualization of some observed phenomena in the development of the monitored variable.
Aerospace 11 00045 g001
Figure 2. A sociomap corresponding to the fuzzy model from Table 4 (retrieved from Bahbouh [38], p. 101). Note: The letters (A–H) represents the individual members of the team. The mutual distances indicate the intensity of the relationship (e.g., communication frequency). The closer the labeled subjects are on the map, the more intensively they communicate with each other. The color intensity represents the overall intensity of communication, with red indicating the highest average intensity and blue the lowest.
Aerospace 11 00045 g002
Figure 3. Distribution of the five-point evaluation of the communication frequency across all experiments. Note: 1 = should often be better; 2 = should sometimes be better; 3 = sufficient; 4 = sometimes above average; 5 = often above average.
Aerospace 11 00045 g003
Figure 4. Distribution of the five-point evaluation of the communication quality across all experiments. Note: 1 = should often be better; 2 = should sometimes be better; 3 = sufficient; 4 = sometimes above average; 5 = often above average.
Aerospace 11 00045 g004
Figure 5. Distribution of average scores—communication frequency scale.
Aerospace 11 00045 g005
Figure 6. Distribution of average scores—communication quality scale.
Aerospace 11 00045 g006
Figure 7. Distribution of test-retest correlation coefficients—communication frequency.
Aerospace 11 00045 g007
Figure 8. Distribution of test-retest correlation coefficients—communication quality.
Aerospace 11 00045 g008
Figure 9. Control charts of communication frequency in individual experiments. Note: the blue dashed line represents the average value (CL), and the red dashed lines indicate the UCL (upper control limit) and LCL (lower control limit) values.
Aerospace 11 00045 g009
Figure 10. Control charts of communication quality in individual experiments. Note: the blue dashed line represents the average value (CL), and the red dashed lines indicate the UCL (upper control limit) and LCL (lower control limit) values.
Aerospace 11 00045 g010
Figure 11. Sociomaps of the communication frequency at the beginning of the MDRS 280 experiment, in the middle of it, and at its end. Note: The letters (A–G) represents the individual members of the team. The closer the team members are to each other on the sociomap, the more frequently they communicate with each other. The color intensity represents the overall intensity of communication, with red indicating the highest average intensity and blue the lowest.
Aerospace 11 00045 g011
Figure 12. Sociomaps of the communication frequency at the beginning of the MDRS 275 experiment, in the middle of it, and at its end. Note: The letters (A–G) represents the individual members of the team. The closer the team members are to each other on the sociomap, the more frequently they communicate with each other. The color intensity represents the overall intensity of communication, with red indicating the highest average intensity and blue the lowest.
Aerospace 11 00045 g012
Table 1. Overview of experiments in which sociomapping was used to monitor the crew’s mutual communication.
Year Duration in DaysNumber of Crew MembersNationality of Crew MemberWomen in Crew (Total Number/
Commander)
Facility,
Location
MDRS 14720151373 USA
1 Germany
1 France
1 UK
3/noMDRS, UT, USA
MDRS 14820151262 France
2 Portugal
1 USA
1 Sweden
4/yes
MDRS, UT, USA
MDRS 16220161832 USA
1 Mexico
2/yesMDRS, UT, USA
MDRS 27520233077 France2/noMDRS, UT, USA
MDRS 28020231477 Spain7/yesMDRS, UT, USA
SIRIUS-1720171765 Russia
1 Germany
3/noNEK, IMBP, Moscow, Russia
SIRIUS-19201912064 Russia
2 USA
3/noNEK, IMBP, Moscow
SIRIUS-212021–20222406
(5 after 33 MD)
3 Russia
2 USA
1 UAE
3/noNEK, IMBP, Moscow
Note: MD = mission days; MDRS = Mars Desert Research Station; NEK = Nadzemnyj experimentalnyj komplex = Ground-based experimental facility.
Table 2. Description of the frequency and interval of measurements in the analyzed experiments.
Number of MeasuresPre-Isolation
Measure
Interval between Measures
SIRIUS-17 16No1 day
SIRIUS-19 17No7 days
SIRIUS-21 16No14 days
MDRS 147 9Yes2 days
MDRS 148 9Yes2 days
MDRS 162 8Yes2–4 days
MDRS 275 9Yes3 to 5 days
(Mondays and Fridays)
MDRS 280 5Yes3 to 5 days
(Mondays and Fridays)
Table 3. Questions and scales measuring the frequency and quality of communication.
ScaleQuestionScale Verbalizations—Examples
Frequency of communicationHow often did you communicate with your colleagues from the crew?[1]
Almost never
[2]
Sometimes
[3]
Rather often
[4]
Very often
[5]
Almost all the time
Communication qualityEvaluate the quality of communication with your colleagues from the crew?[1]
Should often be better
[2]
Should sometimes be better
[3]
Sufficient
[4]
Sometimes above average
[5]
Often above average
Table 4. An example of the fuzzy model for 8 subjects (retrieved from Bahbouh [38], p. 99).
ABCDEFGH
A 0.480.150.540.570.210.750.78
B0.81 0.750.750.810.810.840.84
C0.930.75 0.570.720.510.570.24
D0.690.610.45 0.750.270.420.78
E0.540.450.330.63 0.480.450.15
F0.780.120.630.810.75 0.240.45
G0.570.810.730.690.690.54 0.48
H0.330.660.660.780.840.660.84
Table 5. Descriptive statistics of the communication scales.
Frequency of CommunicationCommunication Quality
MedianAvgMinMaxSDMedianAvgMinMaxSD
SIRIUS-1744.06250.4343.98250.30
SIRIUS-1944.19150.9654.49250.62
SIRIUS-2143.82151.0644.01151.07
MDRS 14743.53151.0844.09150.54
MDRS 14843.63151,1443.99150.87
MDRS 16244.17250.9944.12350.67
MDRS 27543.54150.9843.75150.86
MDRS 28043.51151.0943.81151.12
Overall *3.923.882.204.670.854.024.073.294.630.69
Note: Avg = average, Min = minimum, Max = maximum, SD = standard deviation. * Overall values are computed as weighted median/average, respectively, considering the total amount of measures during the experiments.
Table 6. Descriptive statistics of the test-retest correlations for communication frequency and quality.
Frequency of CommunicationCommunication Quality
MedianAvgMinMaxMedianAvgMinMax
SIRIUS-170.590.610.3310.85 0.80 0.33 0.95
SIRIUS-190.810.66−0.1410.69 0.63 −0.27 1
SIRIUS-210.780.720.4210.89 0.75 −0.28 1
MDRS 1470.640.600.470.710.52 0.44 −0.57 1
MDRS 1480.160.2000.400.77 0.71 0.58 0.79
MDRS 1620.790.4−0.7410.66 0.61 0.36 0.82
MDRS 2750.540.540.120.840.28 0.16 −0.24 0.47
MDRS 2800.370.34- 0.030.630.45 0.49 0.26 0.72
Overall *0.640.57−0.7410.640.57−0.571
Note: Avg = average, Min = minimum, Max = maximum. * Overall values are computed as weighted median/average, respectively, considering the total amount of measures during the experiments.
Disclaimer/Publisher’s Note: The statements, opinions and data contained in all publications are solely those of the individual author(s) and contributor(s) and not of MDPI and/or the editor(s). MDPI and/or the editor(s) disclaim responsibility for any injury to people or property resulting from any ideas, methods, instructions or products referred to in the content.

