Article

Investigation of the Influence of Wake Field Characteristic Structures on Downstream Targets Using the POD Method

1
Shenyang Aircraft Design & Research Institute, Shenyang 110000, China
2
China Special Vehicle Research Institute, Jingmen 448000, China
3
High Speed Aerodynamic Institute, China Aerodynamics Research and Development Center, Mianyang 621000, China
4
Key Laboratory of Unsteady Aerodynamics and Flow Control, Ministry of Industry and Information Technology, Nanjing University of Aeronautics and Astronautics, Nanjing 210016, China
*
Author to whom correspondence should be addressed.
Aerospace 2023, 10(9), 824; https://doi.org/10.3390/aerospace10090824
Submission received: 10 August 2023 / Revised: 14 September 2023 / Accepted: 18 September 2023 / Published: 21 September 2023

Abstract

:
This research investigated the impact of complex low-speed wake flow structures on the aerodynamic characteristics of objects downstream. It employed the proper orthogonal decomposition (POD) method and the domain precursor simulation method to compare traditional methods and validate this approach. The study generated several flow structures of parallel dual-cylinder wakes with different scales and spacing. The variations in the aerodynamic coefficient of three downstream objects at various times passing through wakes of varying scales were appropriately compared and analyzed. The study established that the wake with a cylinder spacing of G = 1.5 has a more compact and concentrated modal structure than that with a cylinder spacing of G = 0.35. Smaller objects were more responsive to the wake flow structure with a spacing of G = 1.5, whereas larger objects responded more to the flow structure with a spacing of G = 0.35. The achieved results also revealed that the aerodynamic force coefficients of objects passing through the wakefield at different times were closely related to the temporal characteristics of the wake flow structure with different scales.

1. Introduction

Wake generally refers to turbulent vortices behind or downstream of a moving object, also known as the trail. For moving non-streaming objects, such as wind turbines and aircraft carriers, the flow separates from the trailing surface and creates vortices that continue to develop downstream and form a wake region. The aircraft carrier will generate a large-scale vortex behind the ship island during navigation. The aircraft will pass through the vortex generated by the ship island during the landing process, and the aircraft will be affected by the large-scale vortex. It is necessary to study the downstream target moving through the wake. In the wake region, the flow velocity lessens and the turbulence intensity increases, which has a substantial effect on the aerodynamic performance of downstream objects, such as reducing the efficiency of wind turbines in the wake region and making it problematic to predict the aerodynamic characteristics of an aircraft carrier on the carrier.
Numerical simulations are common approaches to examining the aerodynamic characteristics of downstream objects that are affected by the complex low-velocity peak [1]. Such methods often exploit a coupled solution calculation of the wake field and the downstream object. However, due to the high dimensions, instability, and nonlinearity of the foundation, the computational time of conventional methods is expensive and the reproducibility of the results is generally poor. To address the abovementioned issues, according to the characteristic flow structure of the foundation, this paper separated the calculations from the foundation and the flow around the downstream object. In particular, an efficient wake reduction methodology was employed to identify the characteristic flow structure of the wake, and different scale flow structures were generated through the domain precursor simulation method, based on which the wake effect on the aerodynamic characteristics of the downstream objects was calculated.
Regarding the identification of the characteristic flow structures of wake, proper orthogonal decomposition (POD) is regarded as an efficient and extensively utilized flow reduction scheme. This approach was proposed by Hotelling [2], and the main idea is to seek the optimal standard orthogonal basis or several bases that best represent the known data in a least-squares sense and employ them to approximate high-dimensional data with low-dimensional models [3], therefore achieving the goal of simplifying the physical model [4]. Lumley [5] proposed the application of this method to identify characteristic structures in complex turbulent flows and analyzed high-dimensional unsteady flows via the POD, which elucidated characteristic flow structures and examined complex turbulent flow phenomena. Nevertheless, with the rapid and continuous development of numerical and experimental techniques, flow data have become progressively massive, becoming problematic for the original POD approach to work with high-dimensional matrices. Subsequently, Sirovich [6] improved the original POD algorithm using singular-value decomposition (SVD) and proposed the snapshot POD algorithm, which is capable of solving problems of large matrix dimensions and making it easier to handle complex high-dimensional flow fields. Currently, this improved POD approach has been broadly employed in complex flow structure analysis [7,8,9].
The domain precursor simulation method is often adopted to generate turbulent inflow boundary conditions, as illustrated in Figure 1. First, an unsteady numerical simulation is performed in domain A, and when the flow field is stabilized, the values of flow variables such as velocity and pressure at each time step are stored on the plane P, perpendicular to the flow direction, for a certain period, which is utilized to generate the input database. Then, by simulating the flow in the main downstream domain, the flow variables at each time step in the inflow database are loaded into inlet surface J of the main domain by interpolating between various grids. This approach has gained remarkable results in atmospheric boundary layer flow simulation and LES analysis of complex turbulent flows. For instance, Fureby et al. [10] and Lamballais et al. [11] applied the domain precursor simulation method to numerically simulate the pipe flow using periodic boundary conditions by reimposing the downstream flow variable at the upstream inlet, creating a more realistic turbulent flow and enabling a faster and more efficient analysis of the coherent structure of the turbulent flow. Wang et al. [12] implemented a domain precursor simulation approach to store the input flow data of 10,000 time steps in examining the rotating turbulent flows by large-eddy simulation. By reducing the turbulence energy via a scaling method for the momentum of turbulent oscillations, the unphysical flow fields could be transformed into more realistic turbulent fields in a short time.
Flow across cylinders is widely present in nature and engineering as a typical blunt body flow, and it is a classic and complex question in fluid mechanics research. Two cylinders in crossflow were studied by Zhou et al. [13], and the physical aspects of each regime were discussed in detail, covering the flow structures, Strouhal numbers, fluid forces, heat and momentum transport characteristics, and Reynolds number effect. Chen et al. [14] proposed the POD Surrogate method, which establishes a reduced order model by obtaining the projection coefficients of the basis function with a one-to-one correspondence with the system sample points. This method is applied to the reduction of hypersonic aerodynamic heat, greatly reducing the complexity of the original system and improving computational efficiency. Chang et al. [15] analyzed the interactive vortex shedding in the multiply connected domain formed by a pair of circular cylinders.
Based on the snapshots of the POD-based method and the domain precursor simulation method, this paper aimed to appropriately mix the efficient flow reduced-order method with the domain decomposition simulation approach to arrive at various scale inflow structures. Then, the changes in the aerodynamic characteristics of the downstream objects were examined.

2. Numerical Solution Approach for Low-Speed Flow

The Navier–Stokes governing equations of an incompressible flow read as
u = 0
d u d t = 1 ρ p + ν 2 u
where u denotes the velocity vector, ρ is the density, p represents the pressure field, and ν stands for the kinematic viscosity.
The finite volume approach is implemented for the spatial approximation of the governing equations. To this end, the diffusion term was appropriately discretized via a central scheme, whereas the convection term was discretized based on a second-order upwind scheme. The value of a scalar variable ϕ on the face of a cell can be evaluated as follows:
ϕ face   = ϕ center   + ϕ r
and the gradient of the aforementioned scalar field ( ϕ ) is calculated in the following way:
ϕ = Ω N f a c e ϕ face   × n   S f a c e   Ω
The temporal term in the governing equations can be discretized using the following second-order implicit scheme:
3 ϕ n + 1 4 ϕ n + ϕ n 1 2 Δ t = R ( ϕ n + 1 )
where n represents the current time step, and R denotes the residual term.
In this work, the SST (i.e., Shear–Stress Transport) k-ω [16] model was utilized for turbulence closure. Furthermore, due to the decoupling of velocity and pressure, the SIMPLEC (SIMPLE Consistent) algorithm was adopted to evaluate the pressure.

3. POD Method and Its Application

3.1. POD Method

Let V be an arbitrary flow variable, such as velocity, pressure, or vorticity. The sample matrix A V of dimension M × L could be configured by a set of snapshots { V l } l = 1 L = { V i l } l = 1 L   ( 1 i M ) ( l L ) obtained within a specified time interval in the following form:
A V = ( V 1 1 V 1 2 V 1 L V 2 1 V 2 2 V 2 L V M 1 V M 2 V M L )
where M denotes the number of grid nodes and L represents the number of snapshots.
The time average of snapshots set { V ¯ i } i = 1 M is stated by
V ¯ i = 1 L l = 1 L V i l ,   1 i M
Let us denote the snapshot fluctuation matrix by A = { V ^ l } l = 1 L , where
V ^ i l = V i l V ¯ i , 1 i M , 1 l L
The key of the POD method is to seek a set or several sets of optimal orthogonal basis functions { ϕ i }   ( i = 1 , , L ) to maximize the following expression:
1 L i = 1 L | < V ^ i   , ϕ i > L 2 | 2
that is to say, to solve the following eigenvalue problem:
C x = λ x
where
C = { c i , j } i , j = 1 M = { Ω   ( V ^ i   ) T V ^ j   d Ω } i , j = 1 M = A A T
By transforming the spatial dimensions of the matrix C into the time dimension, the modal representation can be stated as a linear combination of the eigenvalues of the temporal matrix [17,18]:
  ϕ i = k = 1 N U i k V ^ i  
Let R = A T A , that is, to solve R U = λ U , where U i denotes the i-th eigenvector associated with the eigenvalue λ i . Since the dimension of the matrix to be solved is only L , the computational complexity is substantially reduced compared to the original POD algorithm.

3.2. Validation of the Snapshot POD Algorithm

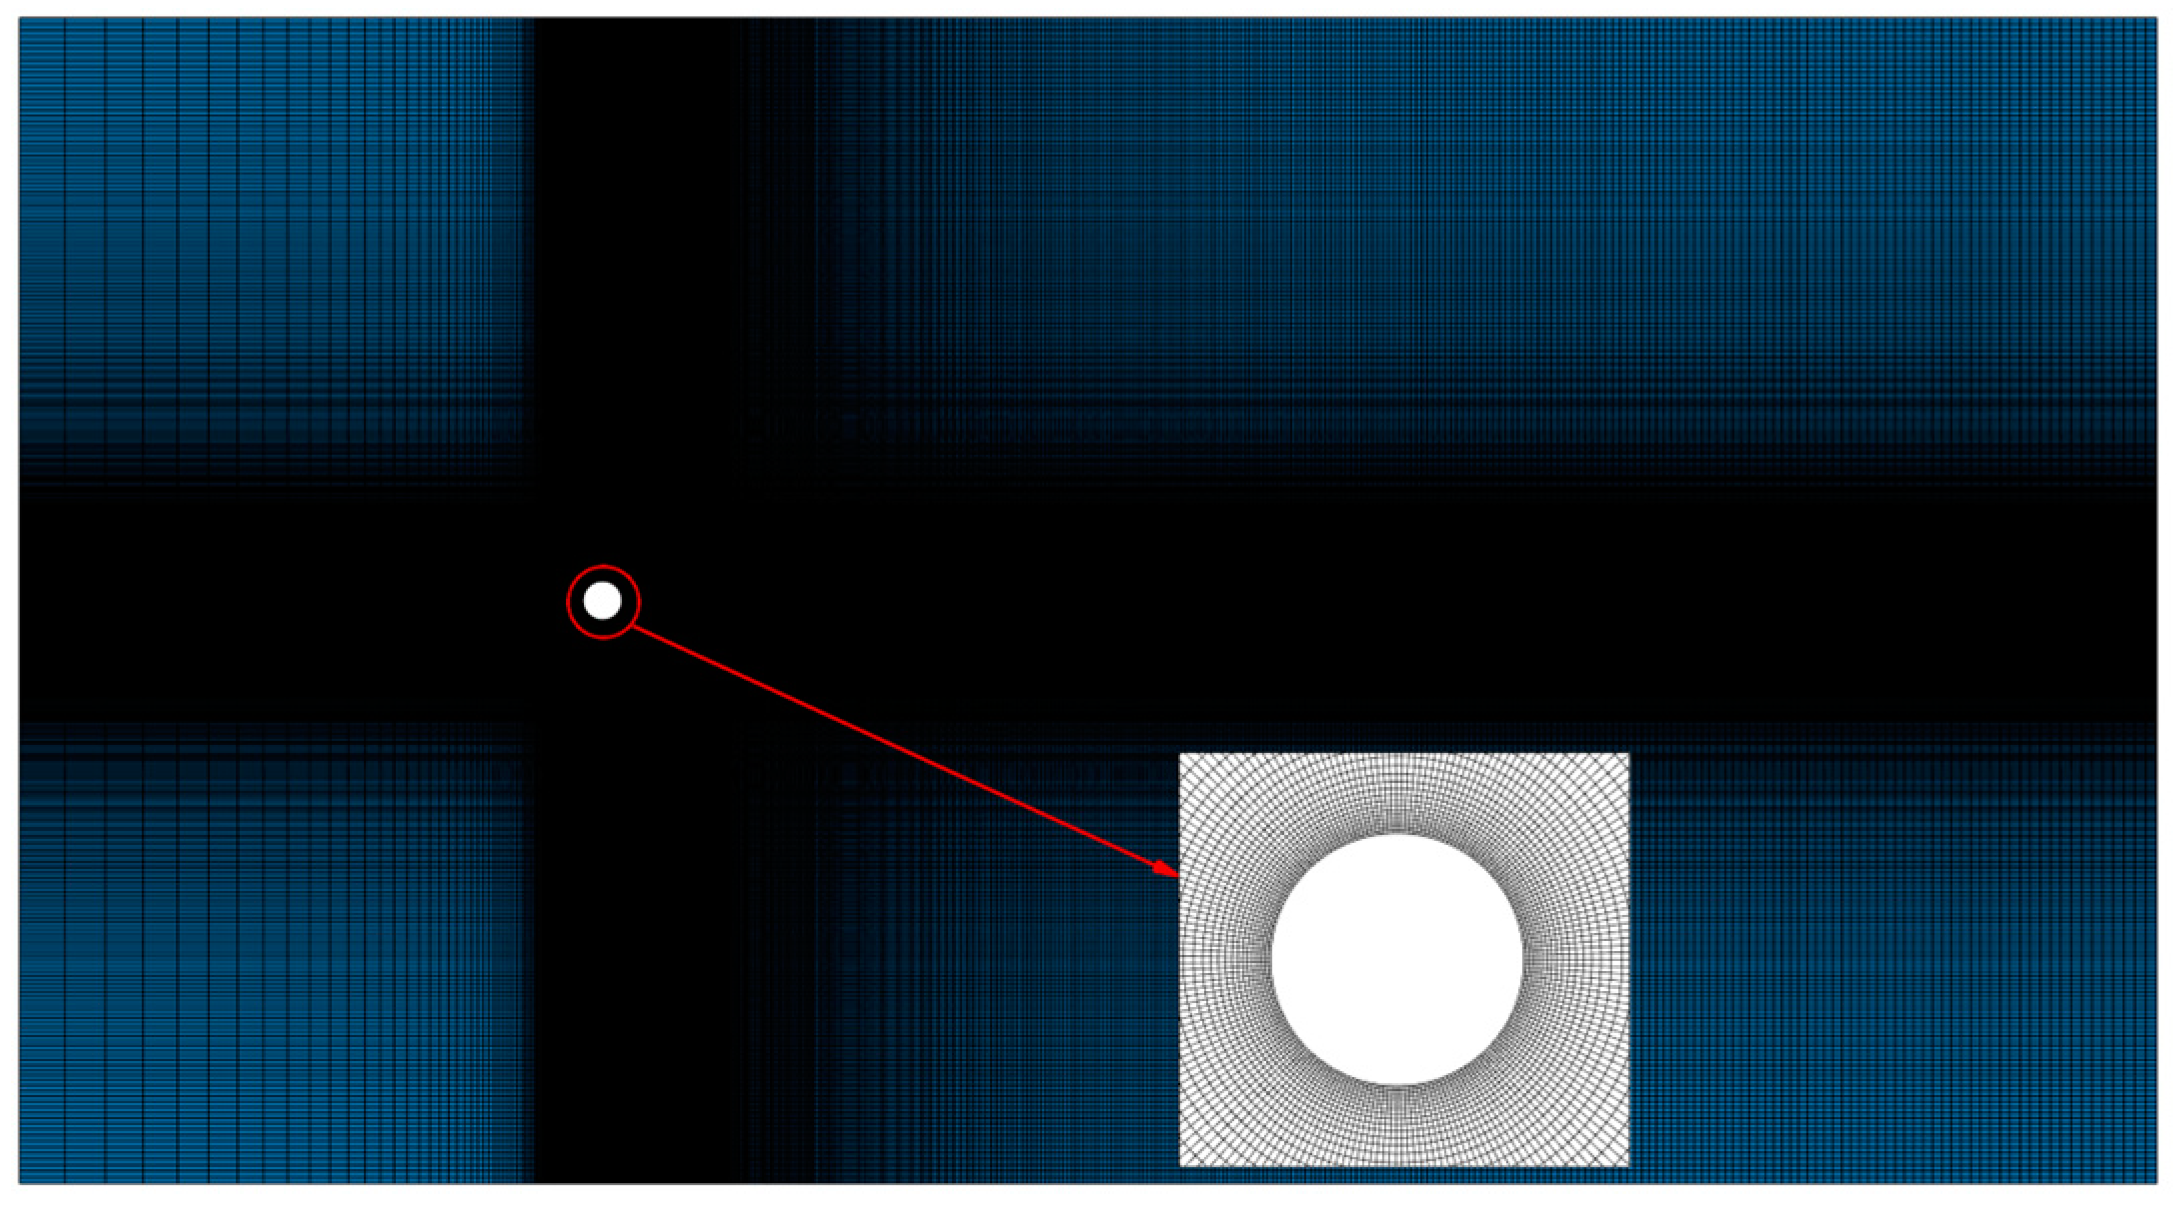
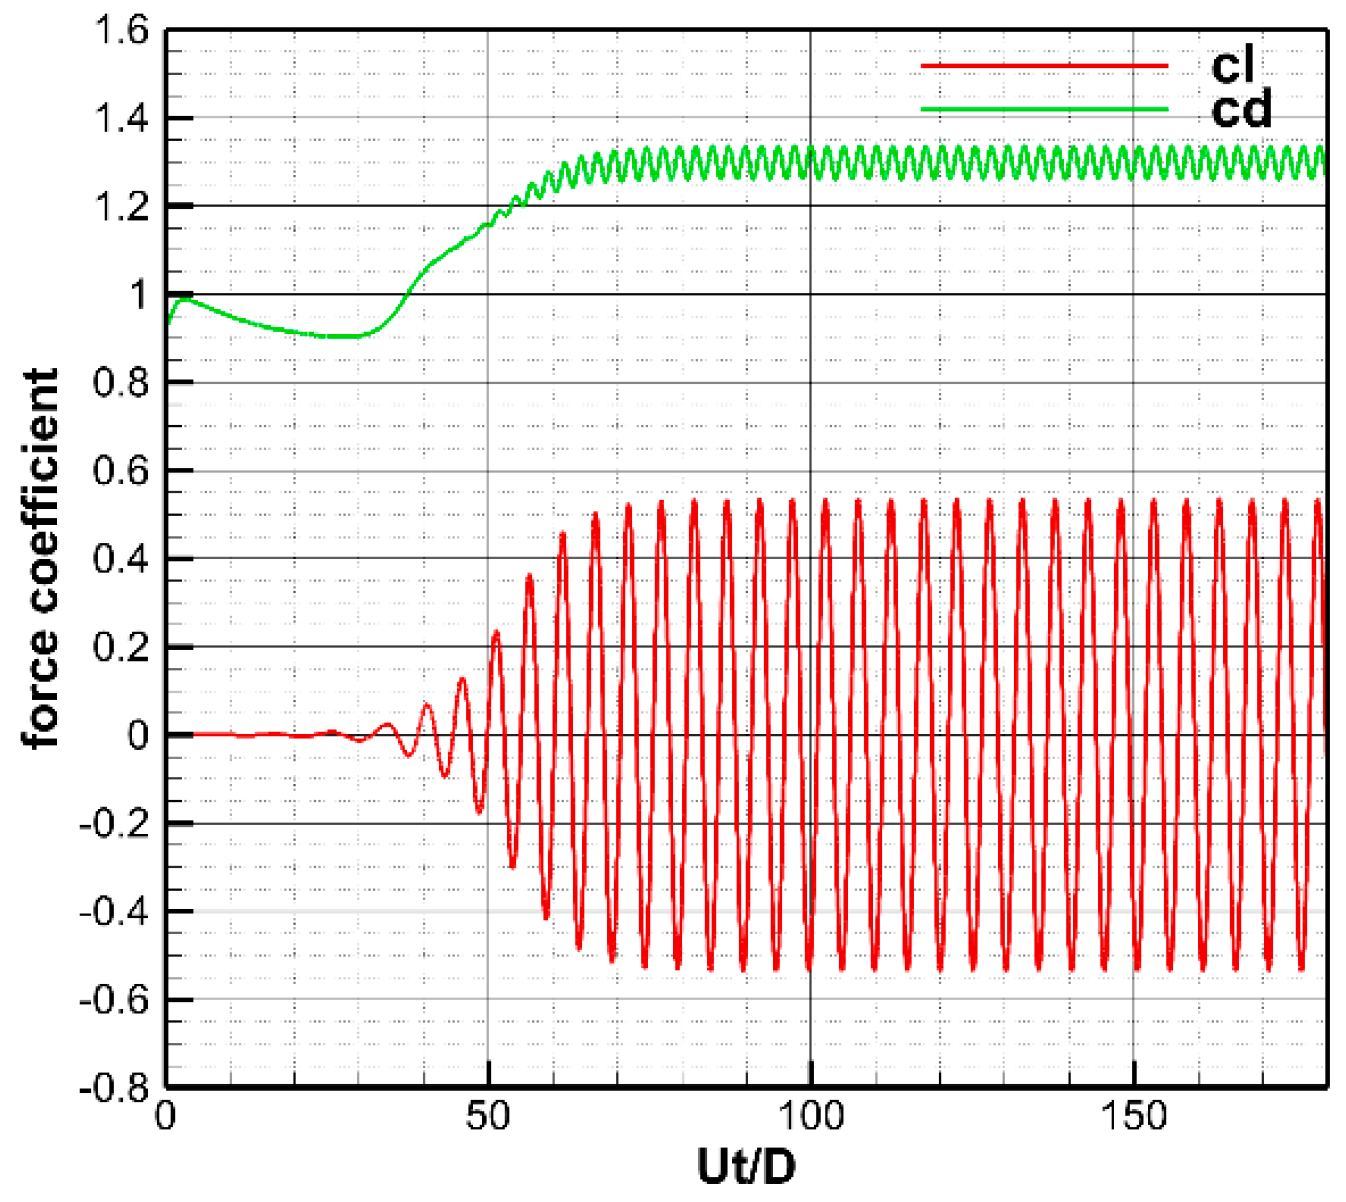
In order to validate the snapshot POD algorithm, the classical wake flow behind a single circular cylinder was chosen, and the Reynolds number was set to 200 based on the diameter. The size of the computational domain was taken according to Refs. [19,20], as illustrated in Figure 2. The diameter of the cylinder was set as 0.01 m and the inlet flow velocity was considered to be 0.3 m/s. The computational grid is a structured grid, as demonstrated in Figure 3. The height of the first grid layer is 10−5 and the total number of grid cells is 340,862. The grid is refined around the cylinder where the flow was sharply altered, and in the region where the wake vortex falls and gradually dissipated from the cylinder. The time step was set equal to 0.001 s and the calculation was performed for 6 s. The time histories of the lift and drag coefficients of the cylinder, denoted by Cl and Cd, are illustrated in Figure 4, where Ut/D represents the non-dimensional time. It can be seen that after the non-dimensional time of 70, the Kármán vortex street behind the cylinder exhibited stable periodic shedding and the shedding frequency was 6 Hz. Additionally, the Strouhal number was calculated as St = fD/U. In Table 1, the values of Cl, Cd, and St are compared with those given by Refs. [21,22,23,24,25,26]. This brief comparison study reveals that the present numerical method is reliable. After that, 2000 sets of flow field vorticity samples during the time period from 4 s to 6 s were selected for POD dimensionality reduction analysis.
Figure 5 illustrates the energy distribution of different POD modes. It can be seen that the modal eigenvalues quickly lessened in the first eight modes, with mode 1 and mode 2 having the highest energy ratios of 67.40% and 25.94%, respectively, contributing to the flow field. The energy of modes 3 and 4 decayed to 1.57% and 1.07%, respectively, whereas the energy of modes 5–8 dropped below 1.00%, respectively. The higher-order modes contain less energy and their contribution to the flow field can be reasonably neglected. Therefore, the numerical analysis was performed on the structures based on the first eight modes.
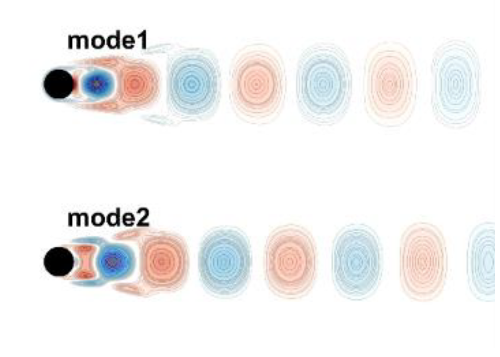
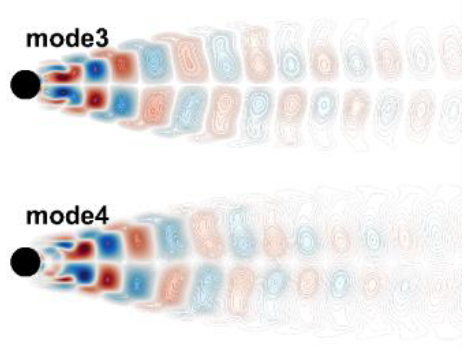
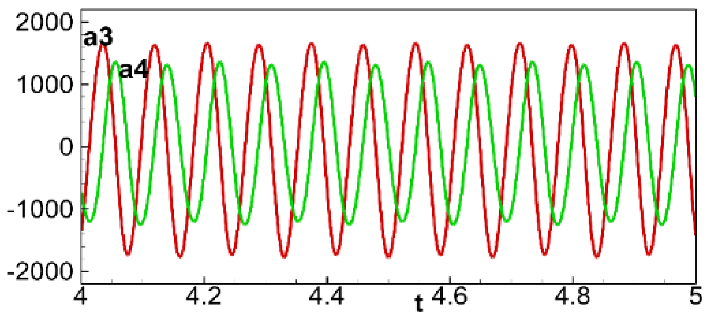
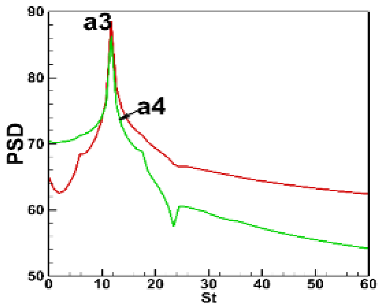
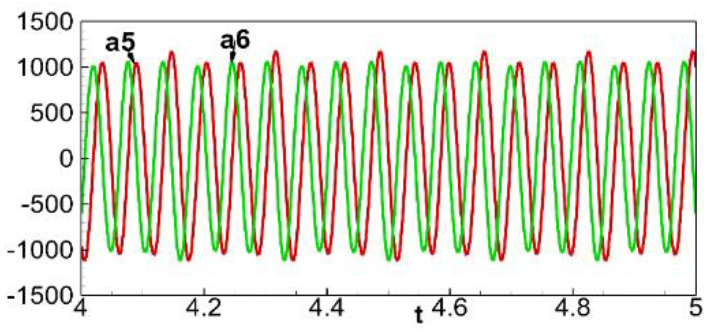
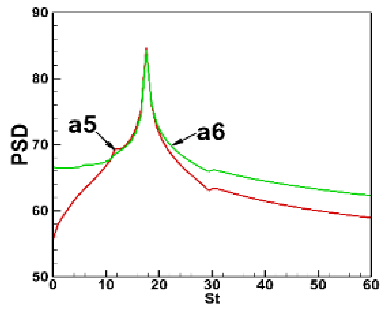
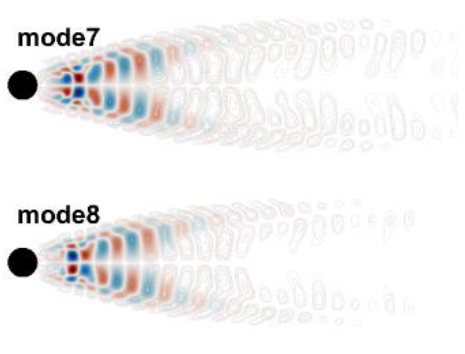
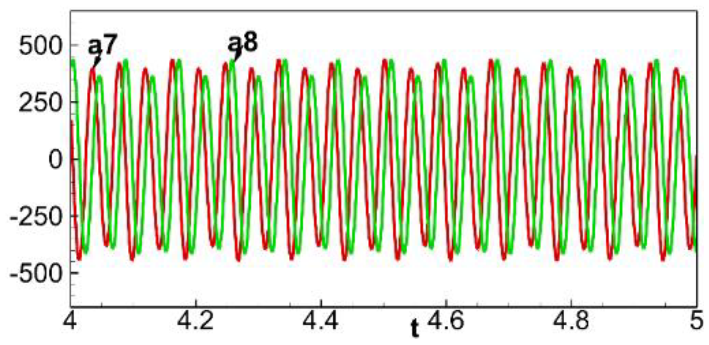
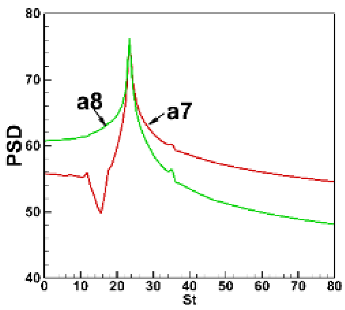
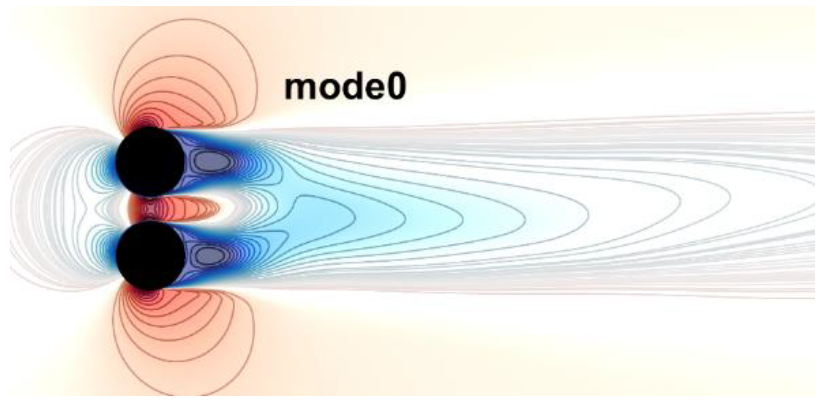
Figure 6a,b illustrate the instantaneous and mean vorticity fields, respectively. Table 2 presents contour maps, time evolution of mode coefficients, and spectral analysis plots for each POD mode. It can be seen that modes 1 and 2, modes 3 and 4, modes 5 and 6, and modes 7 and 8 exhibited almost identical structures, and the phase differences of their mode coefficients were around π/2. Their main peak values were also close to each other; therefore, modes 1 and 2, modes 3 and 4, modes 5 and 6, and modes 7 and 8 can be rationally taken into account as paired modes. The spatial structures of modes 1, 3, 5, and 7 were analyzed in detail. Mode 1 (or 2) mainly characterizes the structure of large-scale vortices, which exhibits an up–down symmetrical structure along the flow direction and dominates the periodic shedding of the Kármán vortex street. Mode 3 (or 4) also has a clear vortex structure, but it is more diffuse and smaller compared to mode 1 (or 2) and exhibits an antisymmetric up-down structure along the flow direction. Mode 5 (or 6) and mode 7 (or 8) have similar scattered and chaotic small-scale structures that contribute less to the development of the overall flow. However, mode 7 (or 8) displays a smaller scale structure compared to mode 5 (or 6), and mode 5 (or 6) has an up-down symmetric structure along the flow direction, whereas mode 7 (or 8) exhibits an up-down anti-symmetrical structure. The present POD mode structures are rationally consistent with those in the literature [27], which demonstrates the reliability of the snapshot POD algorithm implemented in this study.

3.3. Methods for Generating Various Scales Inflow for Flow Simulation

Figure 7 illustrates a schematic representation for generating inflows of different scales. Plane J represents the inlet downstream of the low-velocity wake field. The general idea of this loading method is similar to the domain precursor simulation method presented in Figure 1. The difference is that the inflow data in the J-plane come from different scale structures obtained via the POD dimension reduction method; however, this also poses a problem. In the domain precursor simulation method, the inlet database is commonly obtained by numerical simulation of real turbulent flows, which possesses characteristics of both temporal and spatial developments of the flow field and is compatible with the N-S equations. When loading such an inlet database with real flow characteristics in the main simulation region, the flow field can quickly transform into a form more consistent with the original flow field. However, for the characteristic structures obtained through POD analysis, during the entrance generating process, the discrepancies between the characteristic structures and the original flow field require more time to develop a real turbulent flow field. Therefore, when we loaded the flow field with characteristic POD structures as boundary conditions at the inlet, we reconstructed the velocity field with various scale modes and compensated for the pressure field to ensure that the reconstructed flow field was closer to the real one to rapidly produce an ideal flow field. This approach is verified in the following sections.

4. Results and Discussions

4.1. Numerical Simulation of the Wake Field of Low-Speed Parallel Double Cylinders in the Pre-Domain

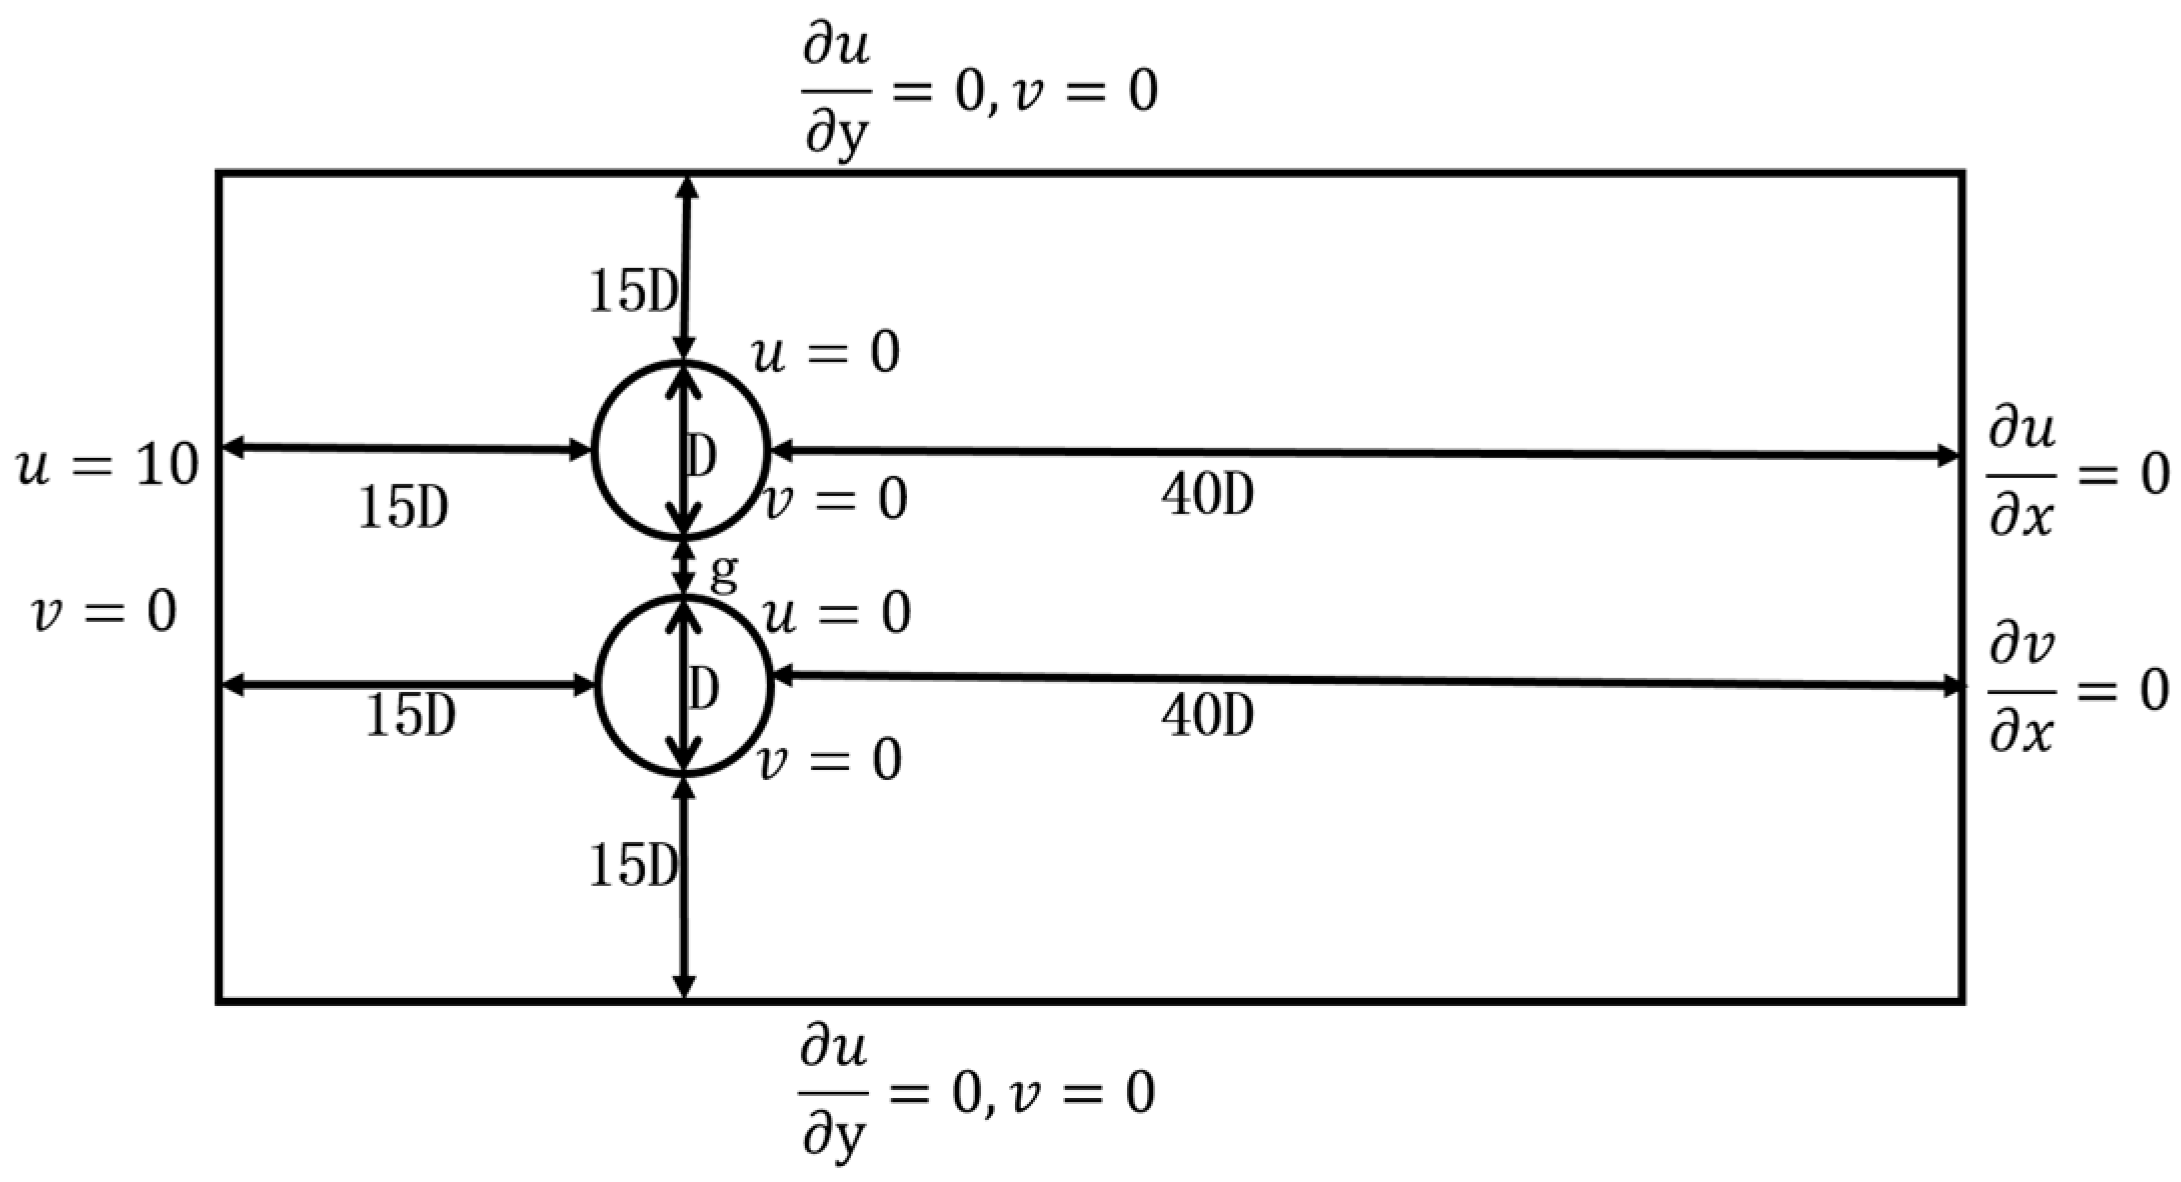
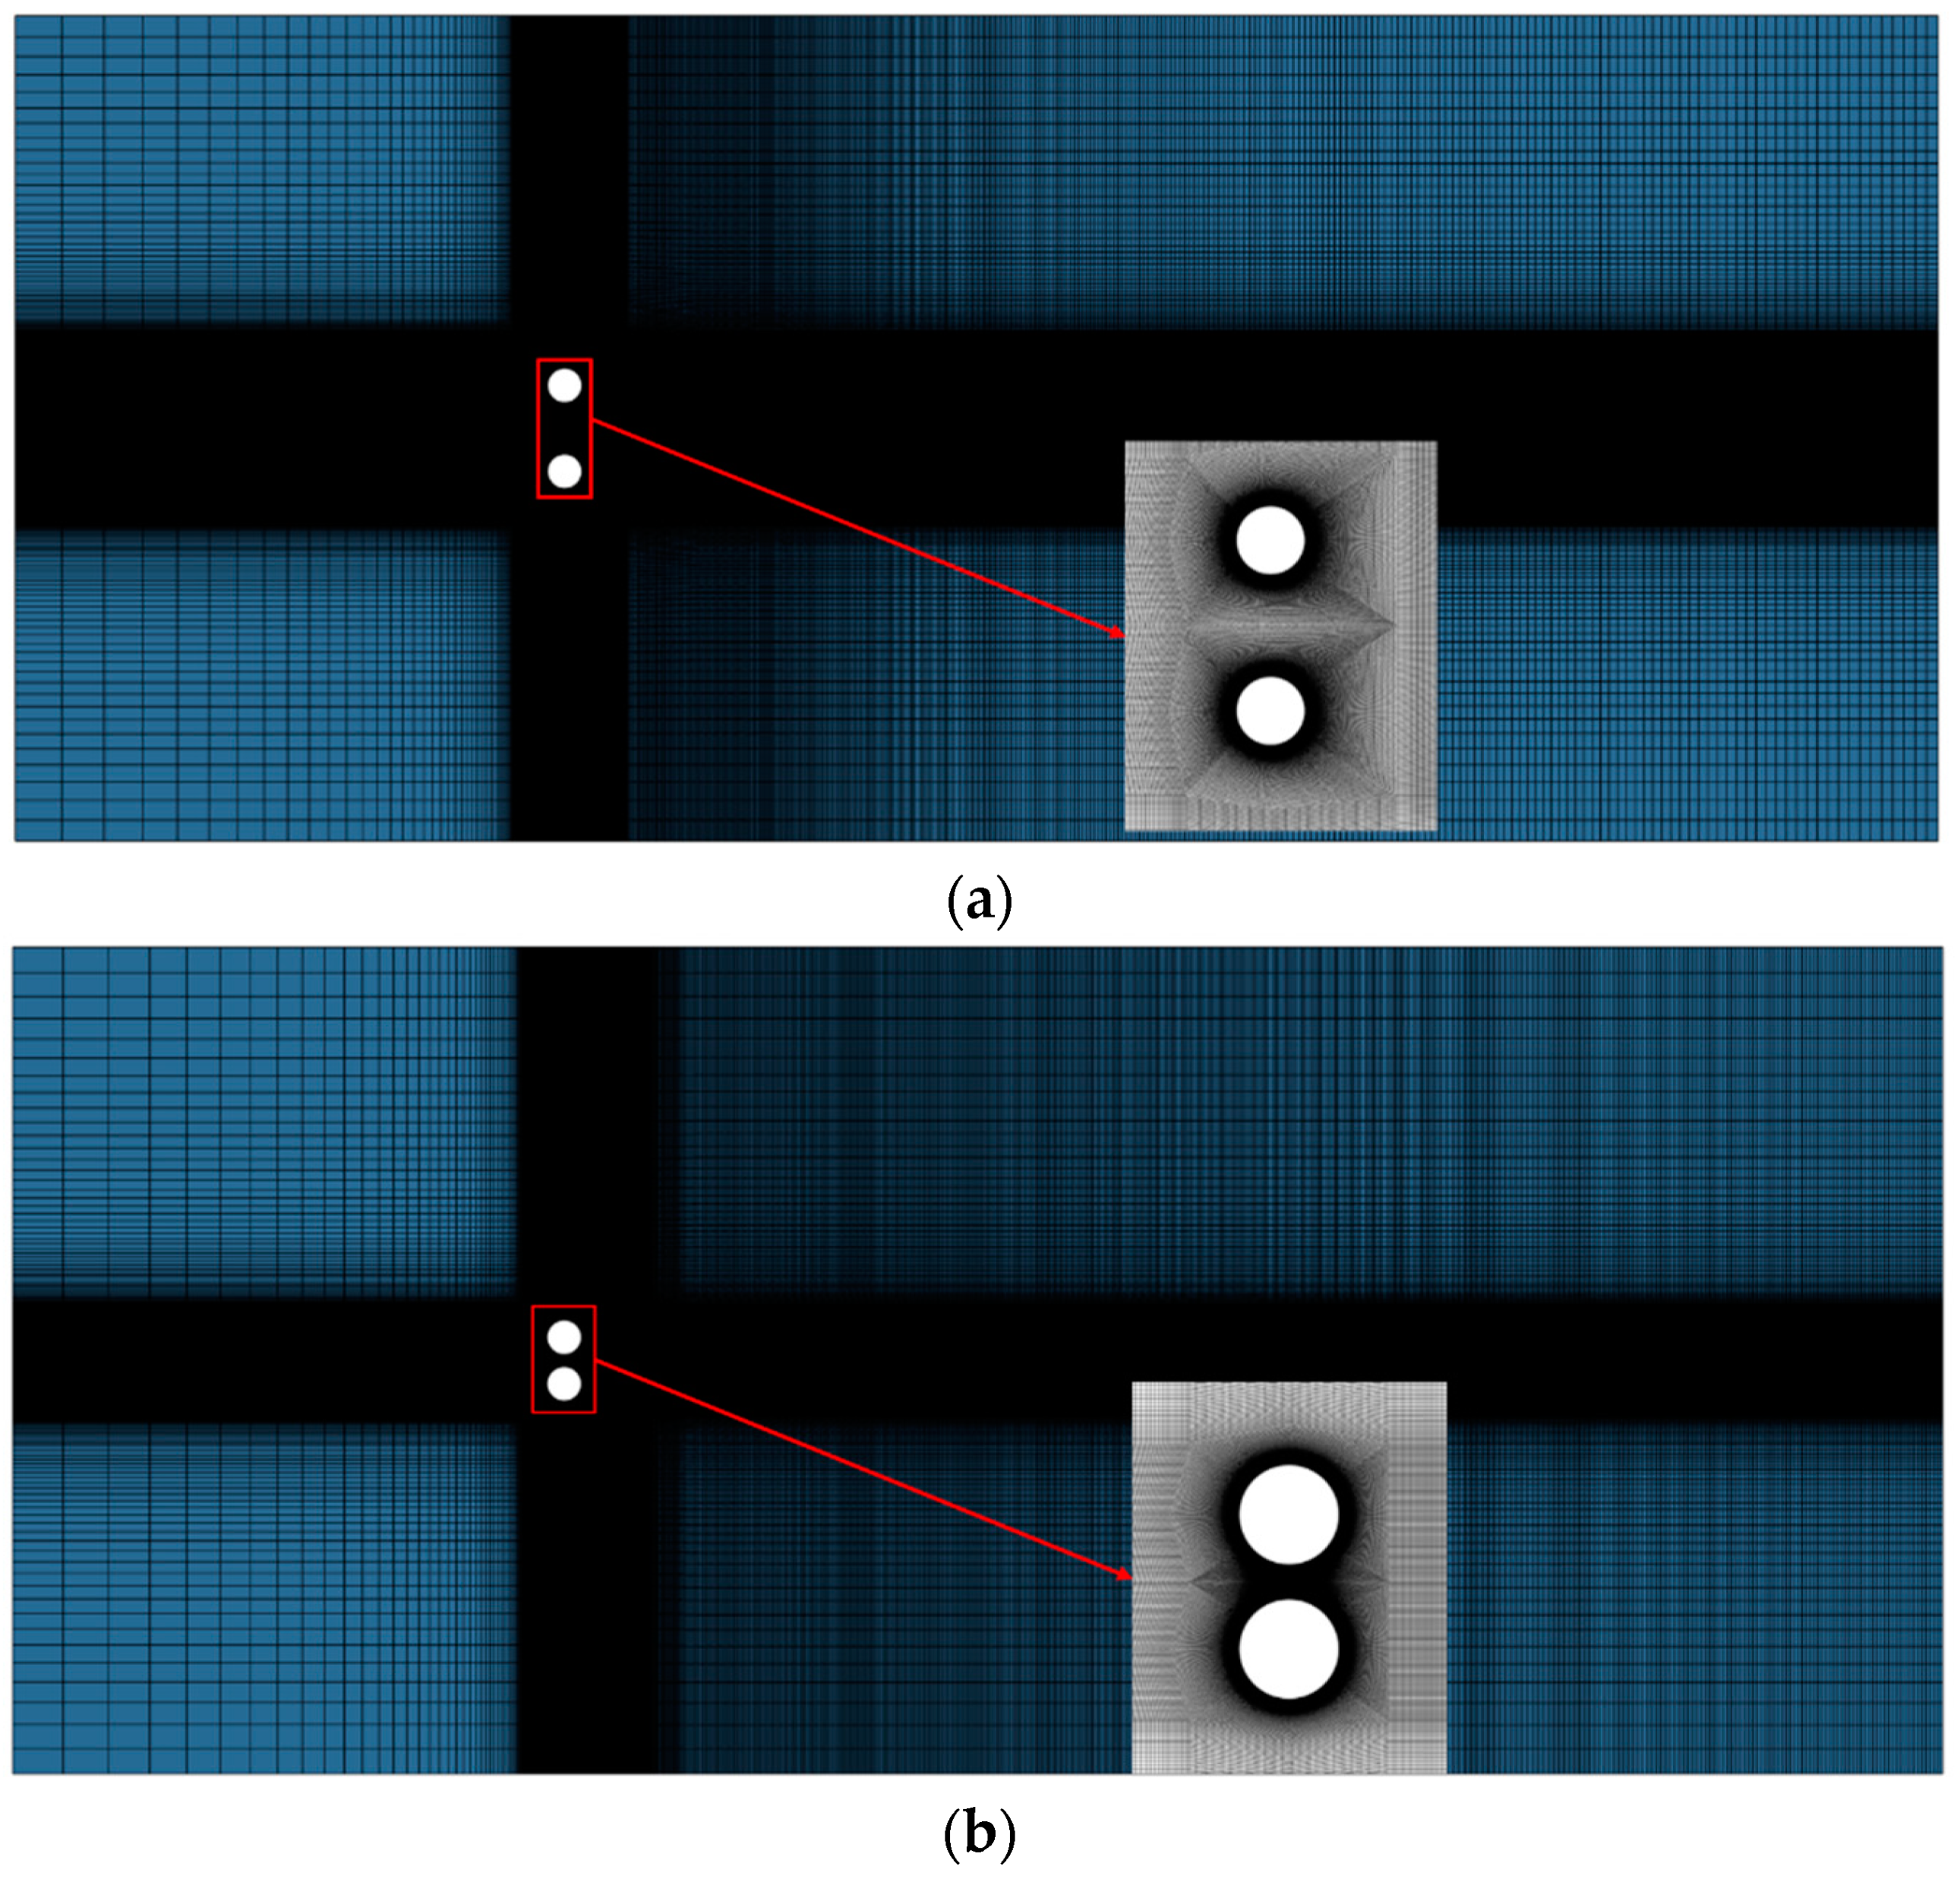
The computational domain and the meshes, used in the numerical simulation of the wake flow field of two parallel circular cylinders with dimensionless inter-distances G = 1.5 and 0.35 (G = g/D), are illustrated in Figure 8 and Figure 9. Both upper and lower cylinders were 1 m in diameter. The height of the first layer of the grid was 10−4 m. The total numbers of grid cells considered for inter-distances G = 1.5 and 0.35 were 294,742 and 373,742, respectively. The inlet flow speed was 10 m/s, the Reynolds number was Re  = 6.46 × 10 5 , and the time step was set as equal to 0.005 s.
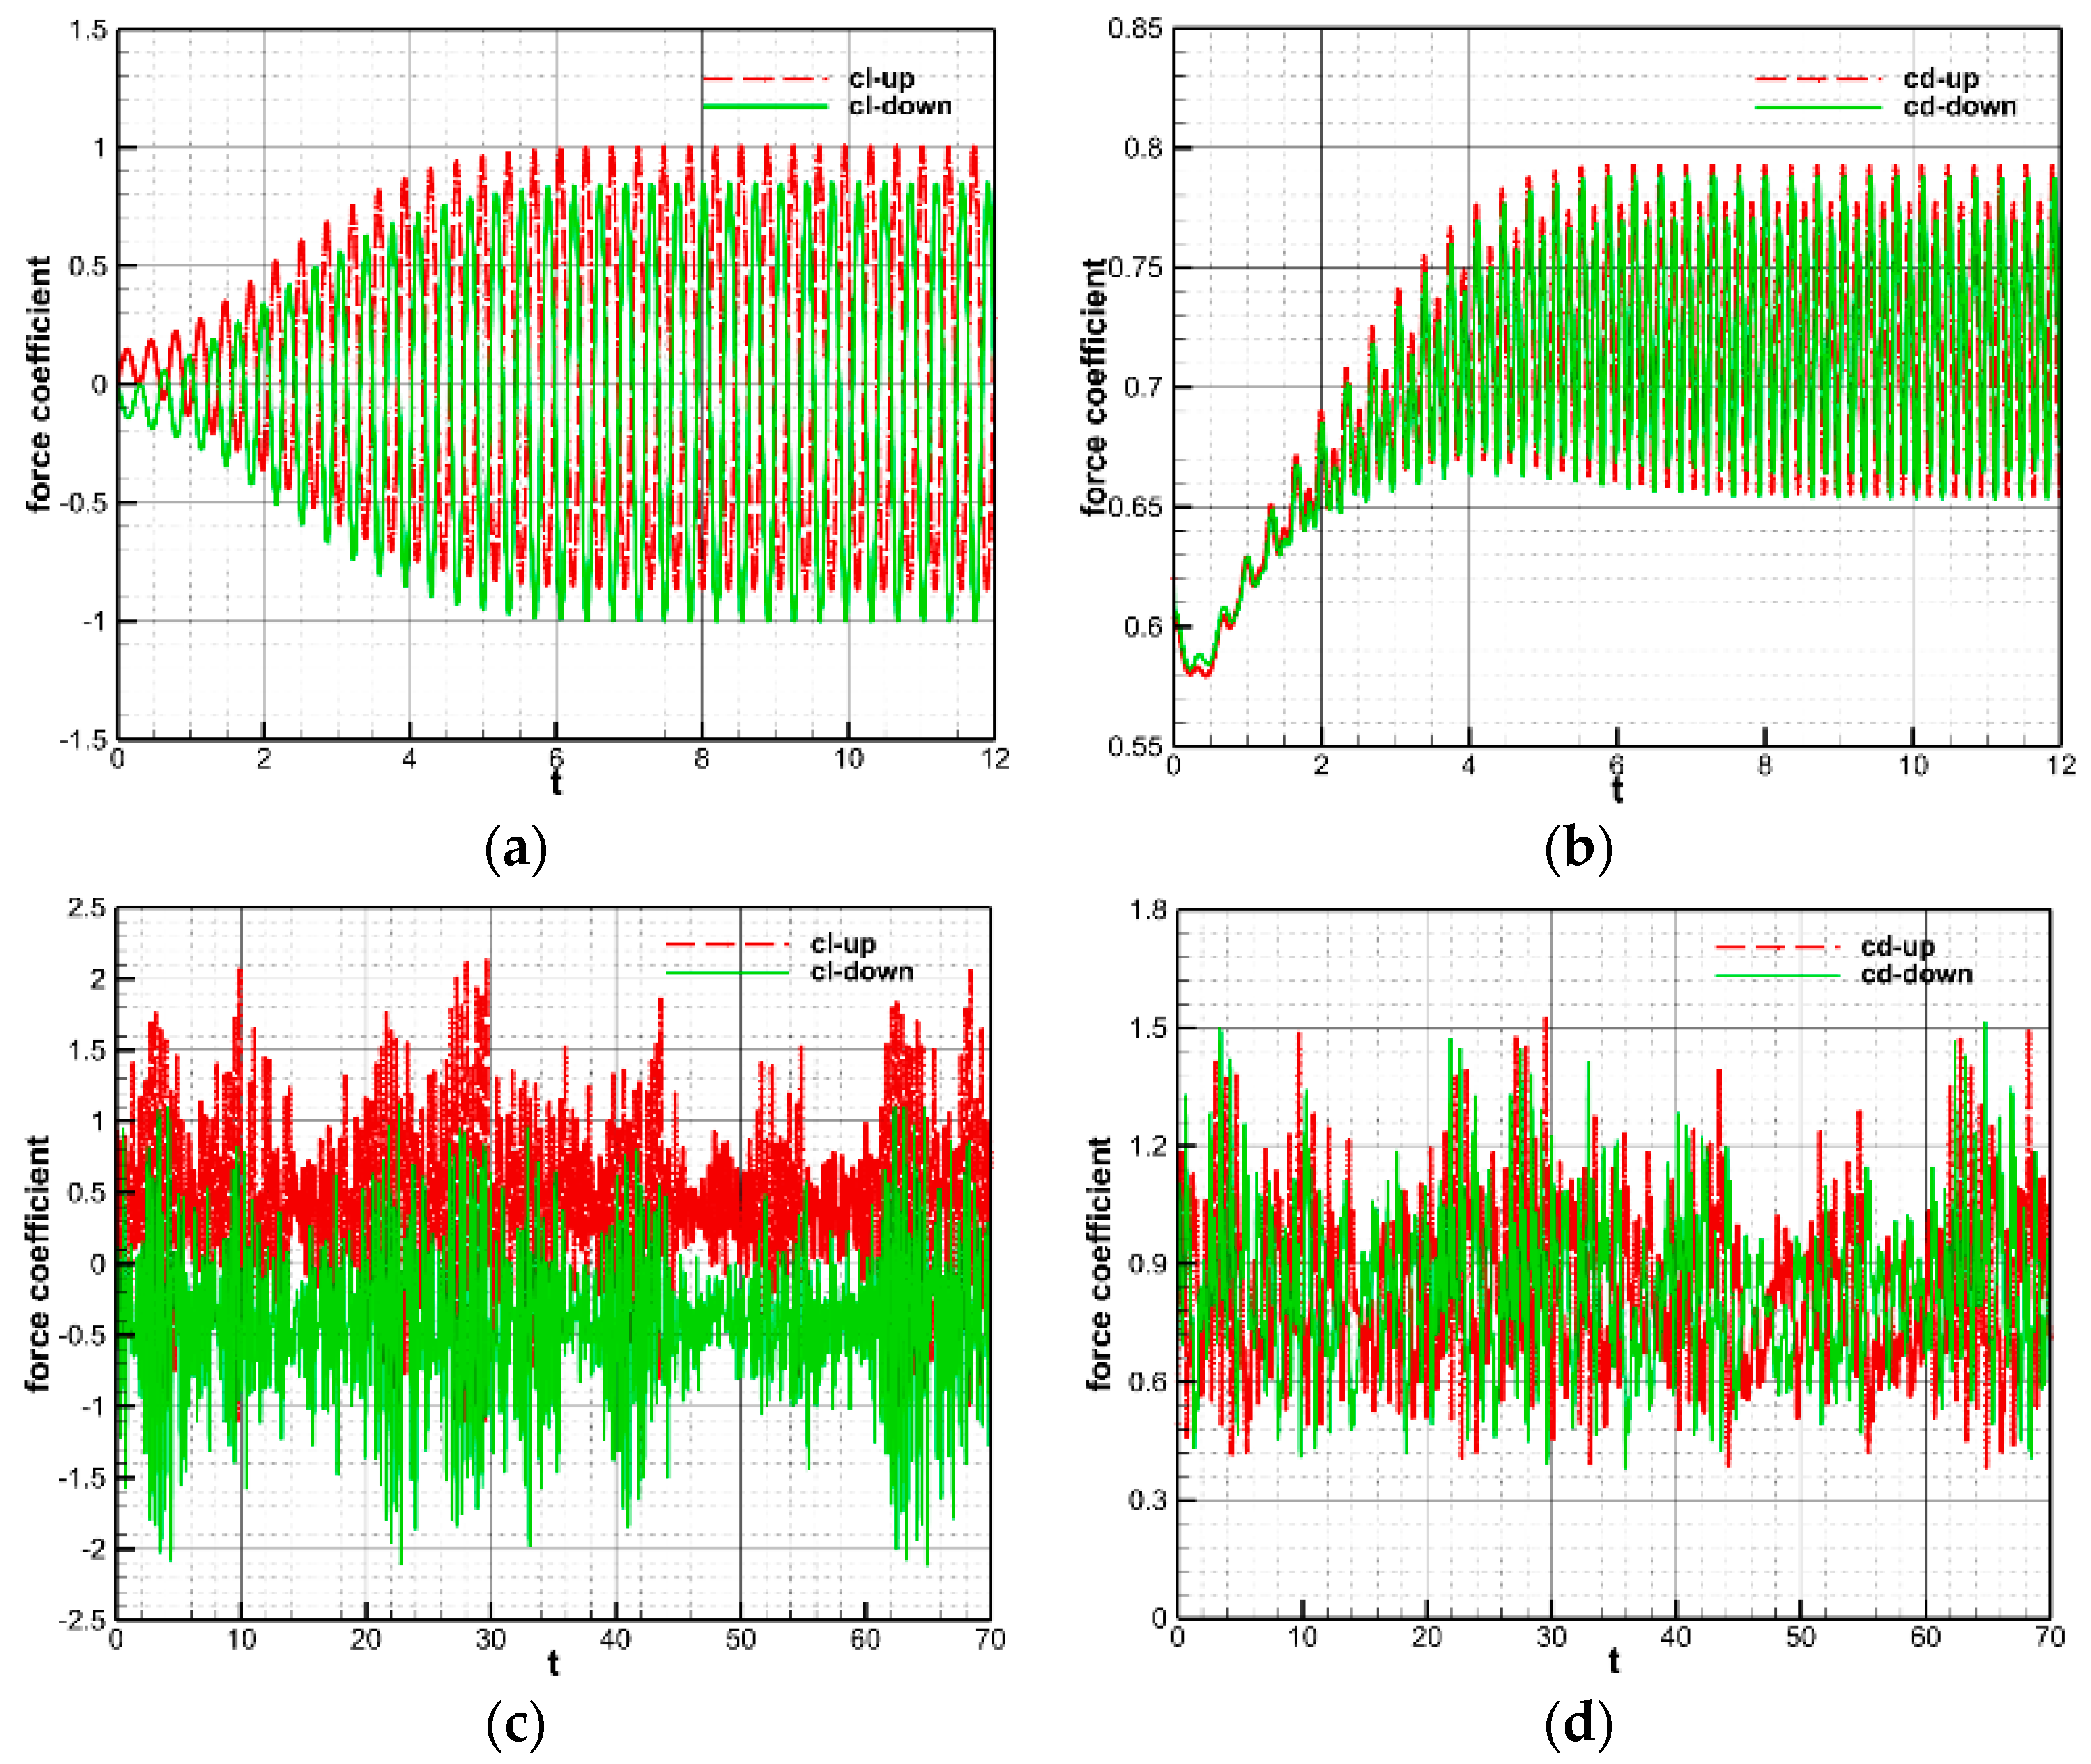
Figure 10 and Figure 11 illustrate the time histories of aerodynamic force coefficients and vortex lines at four characteristic moments in one period for two parallel circular cylinders with inter-distances of G = 1.5 and 0.35. For the double circular cylinders with dimensionless inter-spacing G = 1.5, the plots of lift and drag coefficients of the two cylinders both exhibited stable periodicity after 6 s. Meanwhile, from the characteristics of the vortex structure changes in the vorticity contours, it can be seen that the shedding of the wake vortices was clearly periodic for this cylindrical inter-distance. The vortices were shed from the surfaces of the two cylinders in a coordinated and opposite direction, and the vortex structure downstream of the two cylinders remained unchanged. For two cylinders with an inter-distance of G = 0.35, there was no significant variation in the lift and drag coefficients of each cylinder. The vorticity contours revealed that there was strong interference between the two peaks in this distance of the cylinder. The wake tended to favor one cylinder over a certain period of time and then gradually shift to another over time. In addition, the drag coefficient of the cylinder favored by the wake was substantially higher than the other one. The shedding pattern of the wake was an alternating flipping shedding pattern, which tended to favor one cylinder during a certain period.

4.2. POD Analysis of the Wake Flow Field in the Pre-Domain

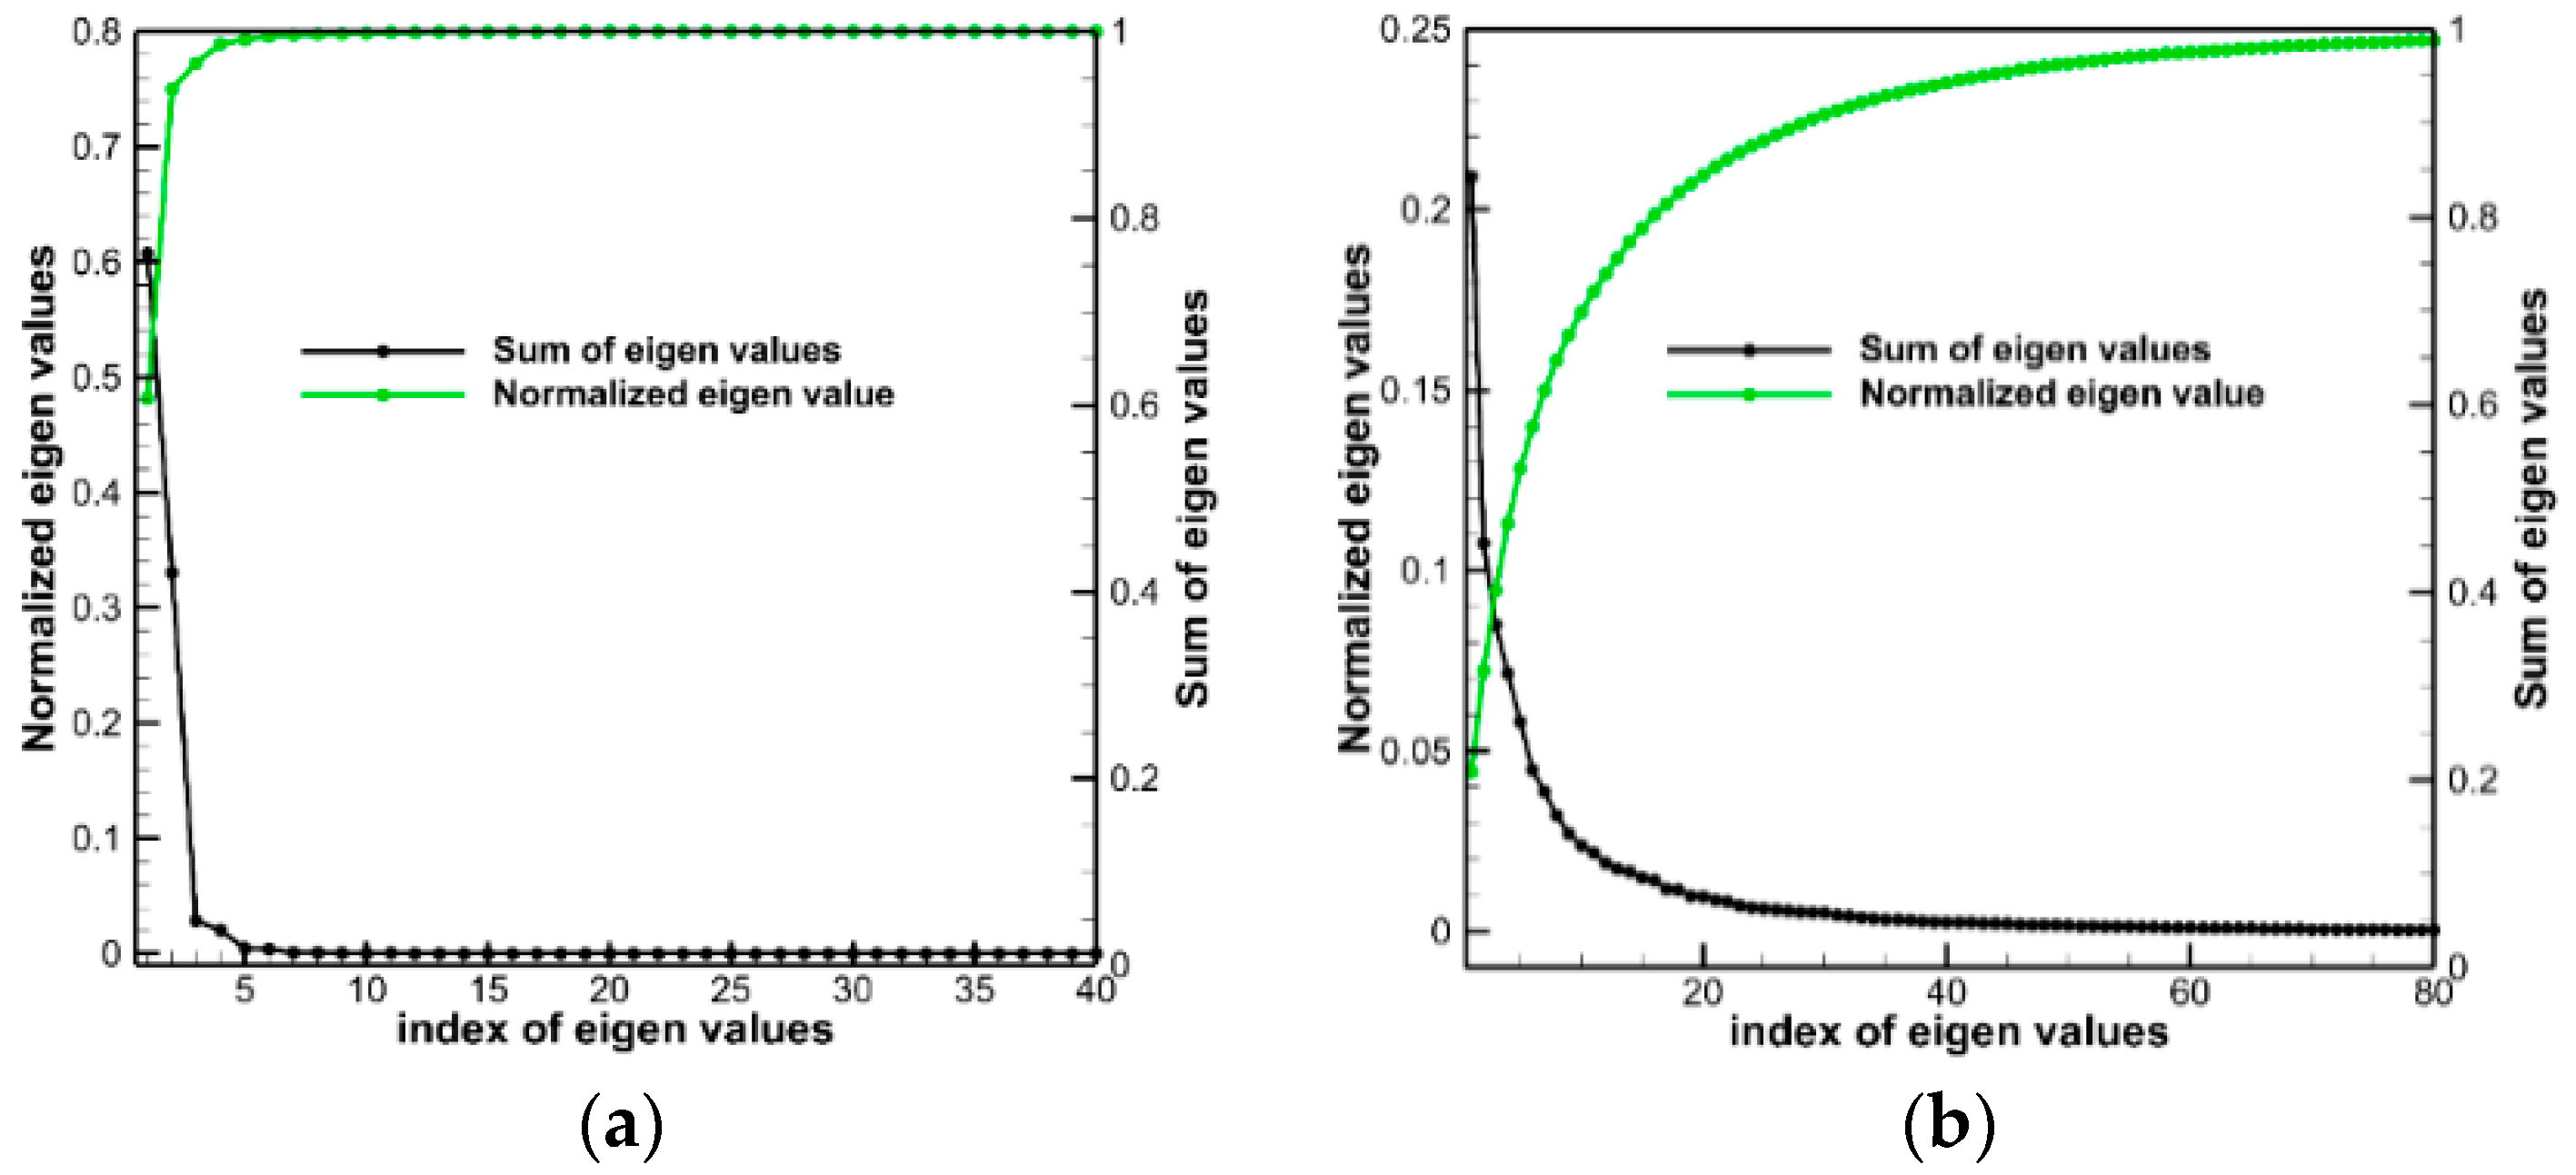
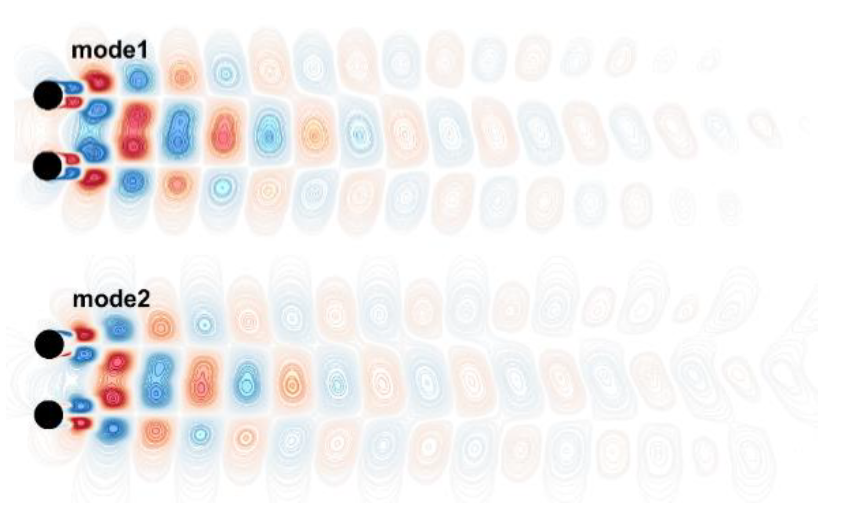
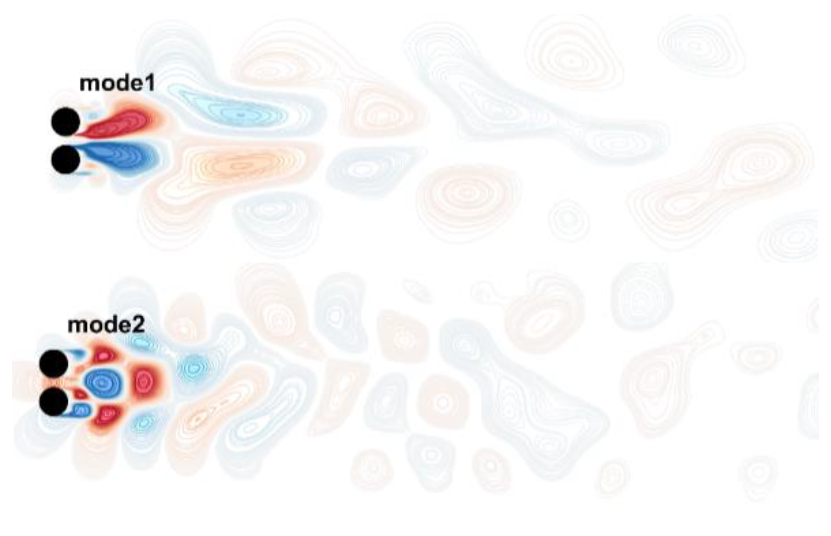
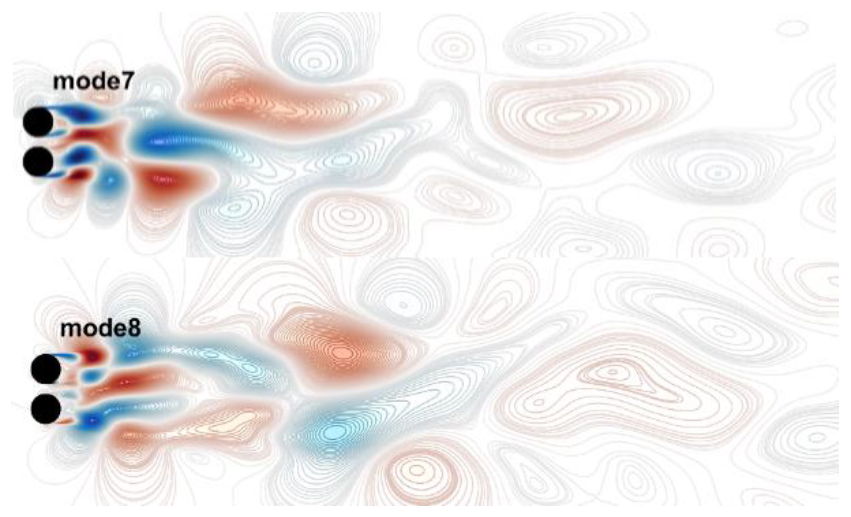
We performed a POD analysis of 3000 velocity samples of the wake flow field for the doubly parallel cylinders with inter-spacings G = 1.5 and 0.35 for the time interval of [10 s, 25 s]. Figure 12 demonstrates the POD modal energy distribution, which was sharply reduced when increasing the modal order for both cases. In the case of G = 1.5, the first four modes accounted for 98.66% of the total energy. The energy content then rapidly reduced to a very small amount with increasing the modal order. In contrast, the energy distribution of the case of G = 0.35 was more scattered such that the first four modes contained only 47.33% of the total energy. It took up to 30 modes to contain 90.92% of the total energy, indicating that more modes are required to capture most features of the flow field. We analyzed the first eight POD modes of the wake flow field for the cases of G = 1.5 and 0.35.
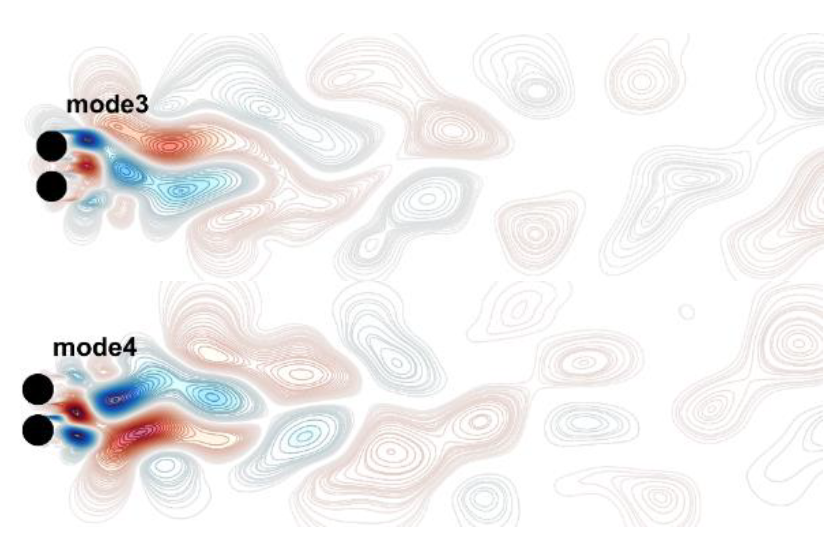
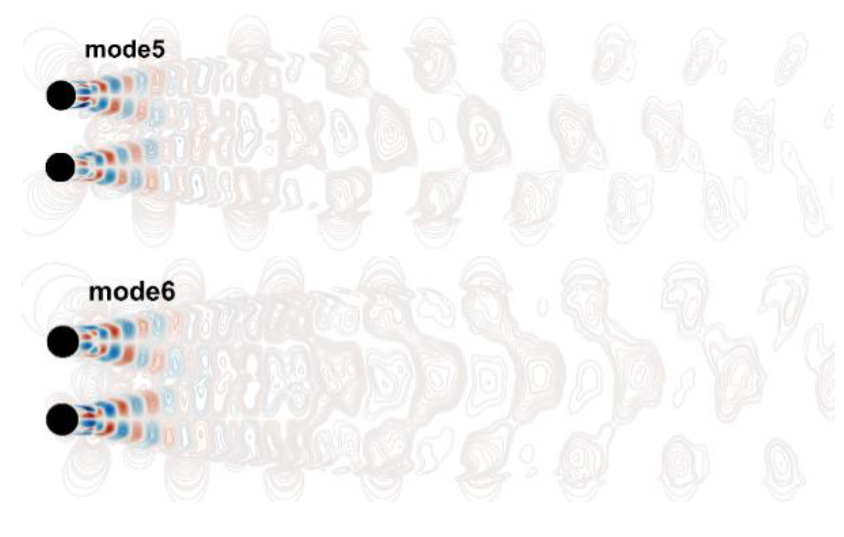
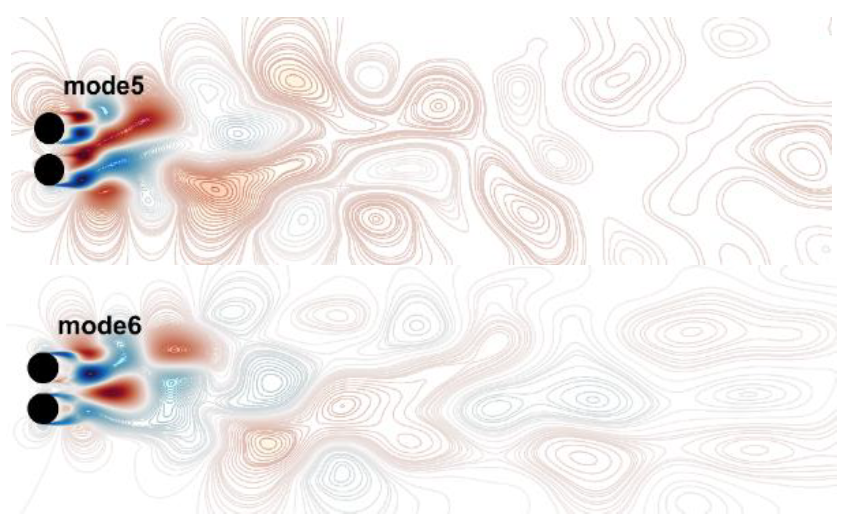
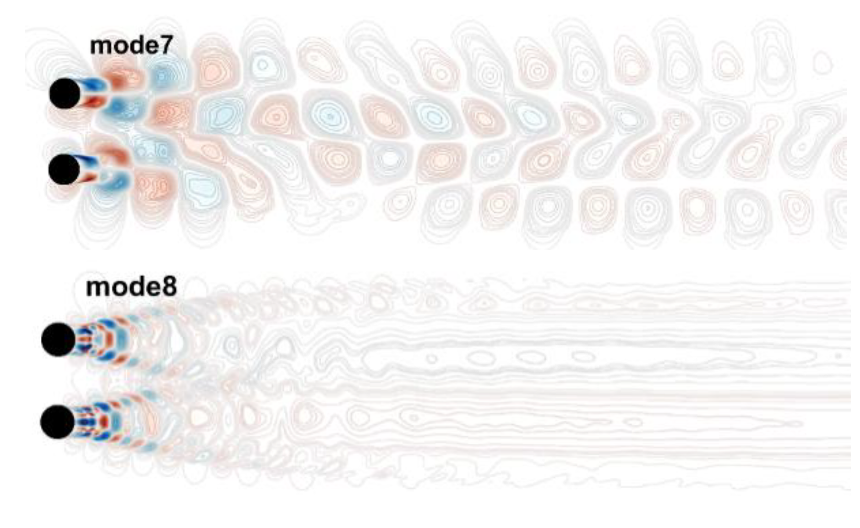
Table 3 presents the first eight POD modes of the flow field with cylinder inter-spacings of G = 1.5 and 0.35. Mode 0 represents the mean flow field, which characterizes the larger-scale static structure. For wake flow POD modes in the case of G = 1.5, modes 1 and 2, modes 3 and 4, modes 5 and 6, and modes 7 and 8 can be reasonably regarded as pairs of modes because the structures and scales are very similar. Therefore, the present analysis mainly focuses on modes 1, 3, 5, and 7. Mode 1 (or 2) represents the main coherent structure of the large-scale flow field, which exhibited an up–down symmetric structure about the flow direction that dominates the synchronous reverse shedding of the wake vortices. Modes 3, 5, and 7 retained the same overall structural form, but the mode structures became denser, and smaller-scale flow structures appeared in the flow direction. This is because as the mode order increases further, the energy contained in each mode lessens and the small-scale structures represented by the mode become more abundant. For POD modes with a cylinder inter-spacing of G = 0.35, the percentages of energy available in modes 1–8 in order were 20.91%, 10.75%, 8.51%, 7.16%, 5.81%, 4.48%, 3.86%, and 3.21%. The energy of each mode was almost the same, and the flow structures represented by each mode are also on the same scale. Mode 1 exhibited a slightly asymmetric structure about the centerline, and the symmetry of the structure decreased with the development of the downstream, with the mode structure tending to be biased toward the upper cylinder. The structure of mode 2 tended towards the lower cylinder and was more scattered and smaller than that of mode 1. The structure of mode 3 then shifted back towards the upper cylinder side. This change was repeated for alternating modes. In general, with the increase in order, the evolution of mode structures was consistent with the shedding mode of the wake and the scale of mode structures became more scattered and smaller to a certain extent.

4.3. Verification Analysis of the Full-Order Wake Field Generating Method in Pre-Domain

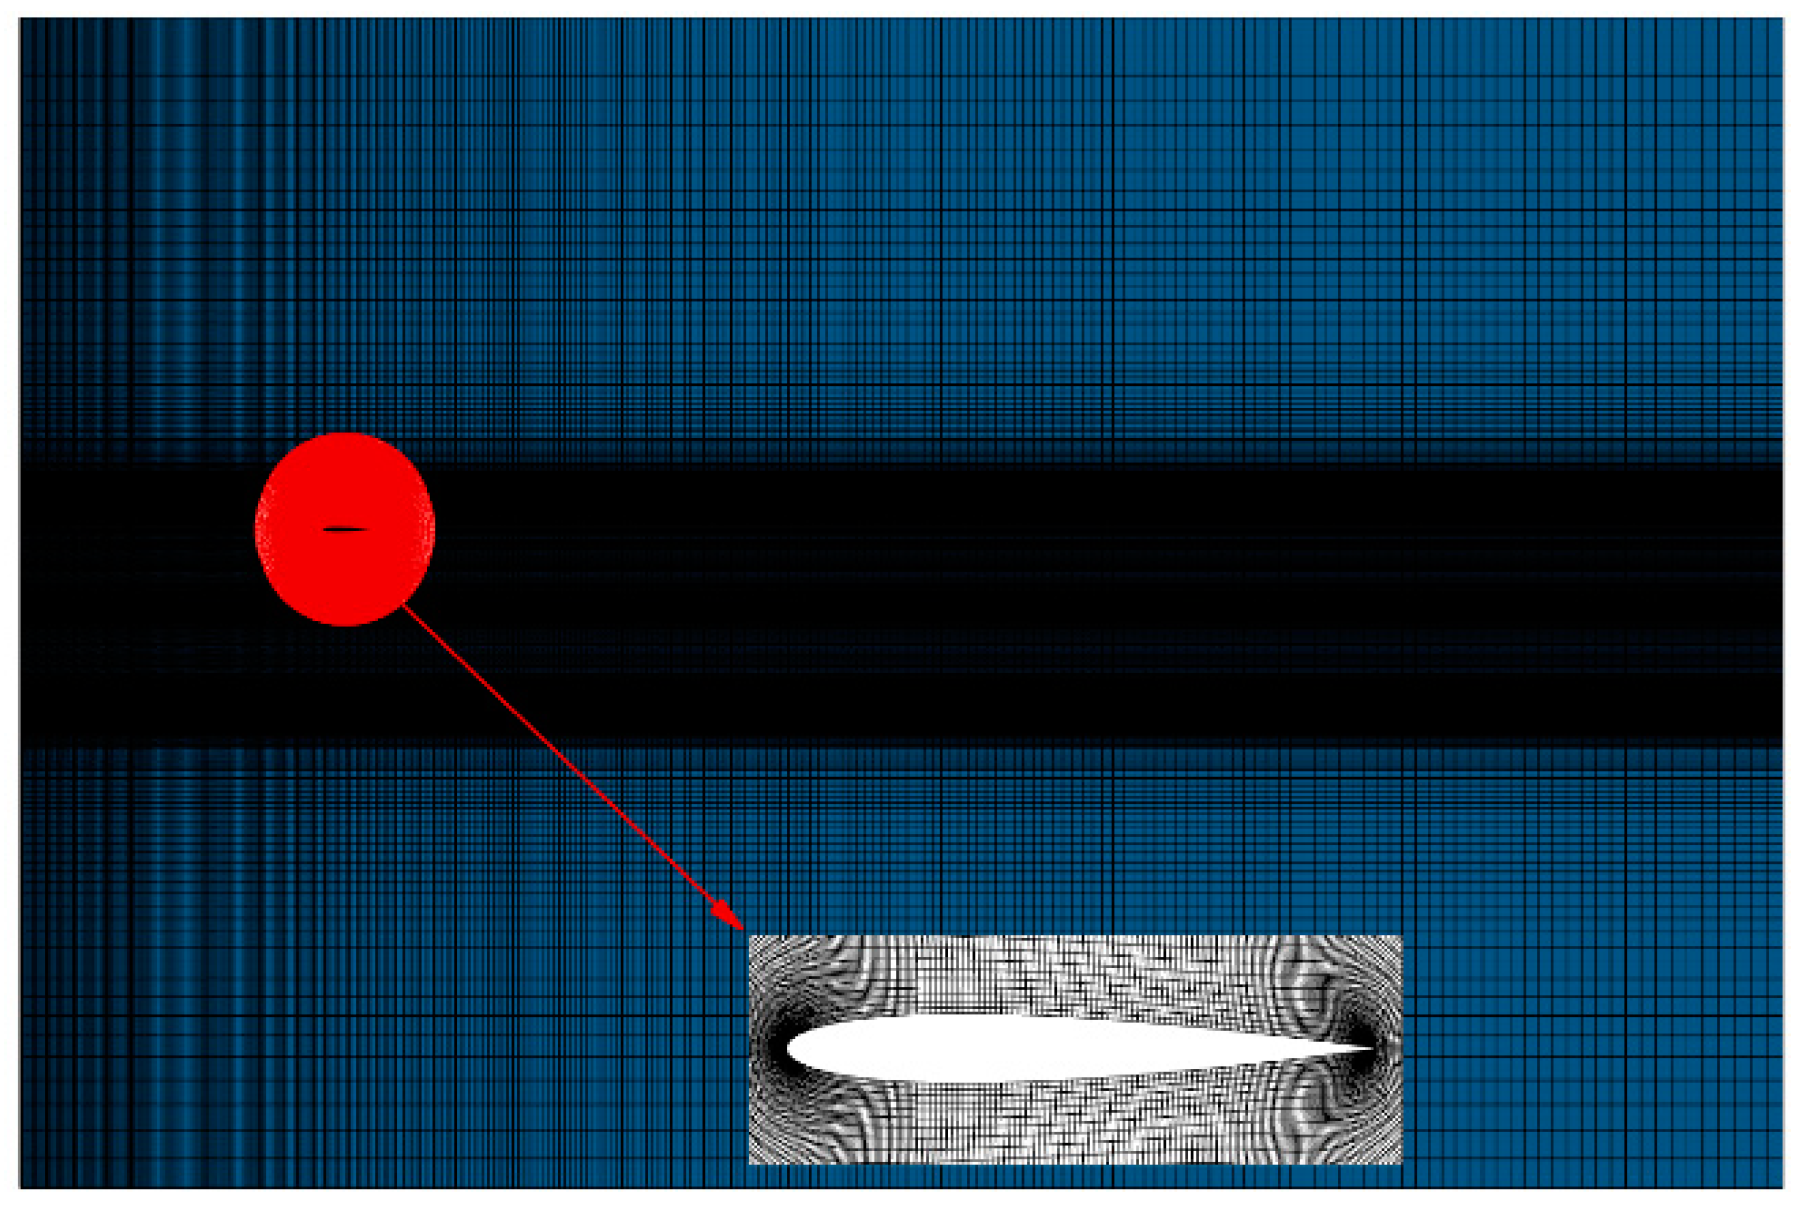
Before generating flow structures at various scales in the post domain, the reliability of the full-scale wake-generating method should be appropriately verified. Figure 13 demonstrates the computational model employed in the study, where the red lines in Figure 13a,b present the position of pre-domain simulation variables and the inlet position of the post-domain simulation, respectively, and Figure 13c presents the results of a comparison between the aerodynamic coefficient obtained based on the full-wake field loading method and those of the coupled calculation of double circular cylinders and an airfoil. To facilitate the comparison study, the computational mesh was kept unchanged in the calculations, and overlapping meshes were used, as demonstrated in Figure 14. The red mesh represents the foreground mesh around the NACA0012 airfoil, and the entire mesh around the double circular cylinders was utilized as the background mesh of the computational model in Figure 13c.
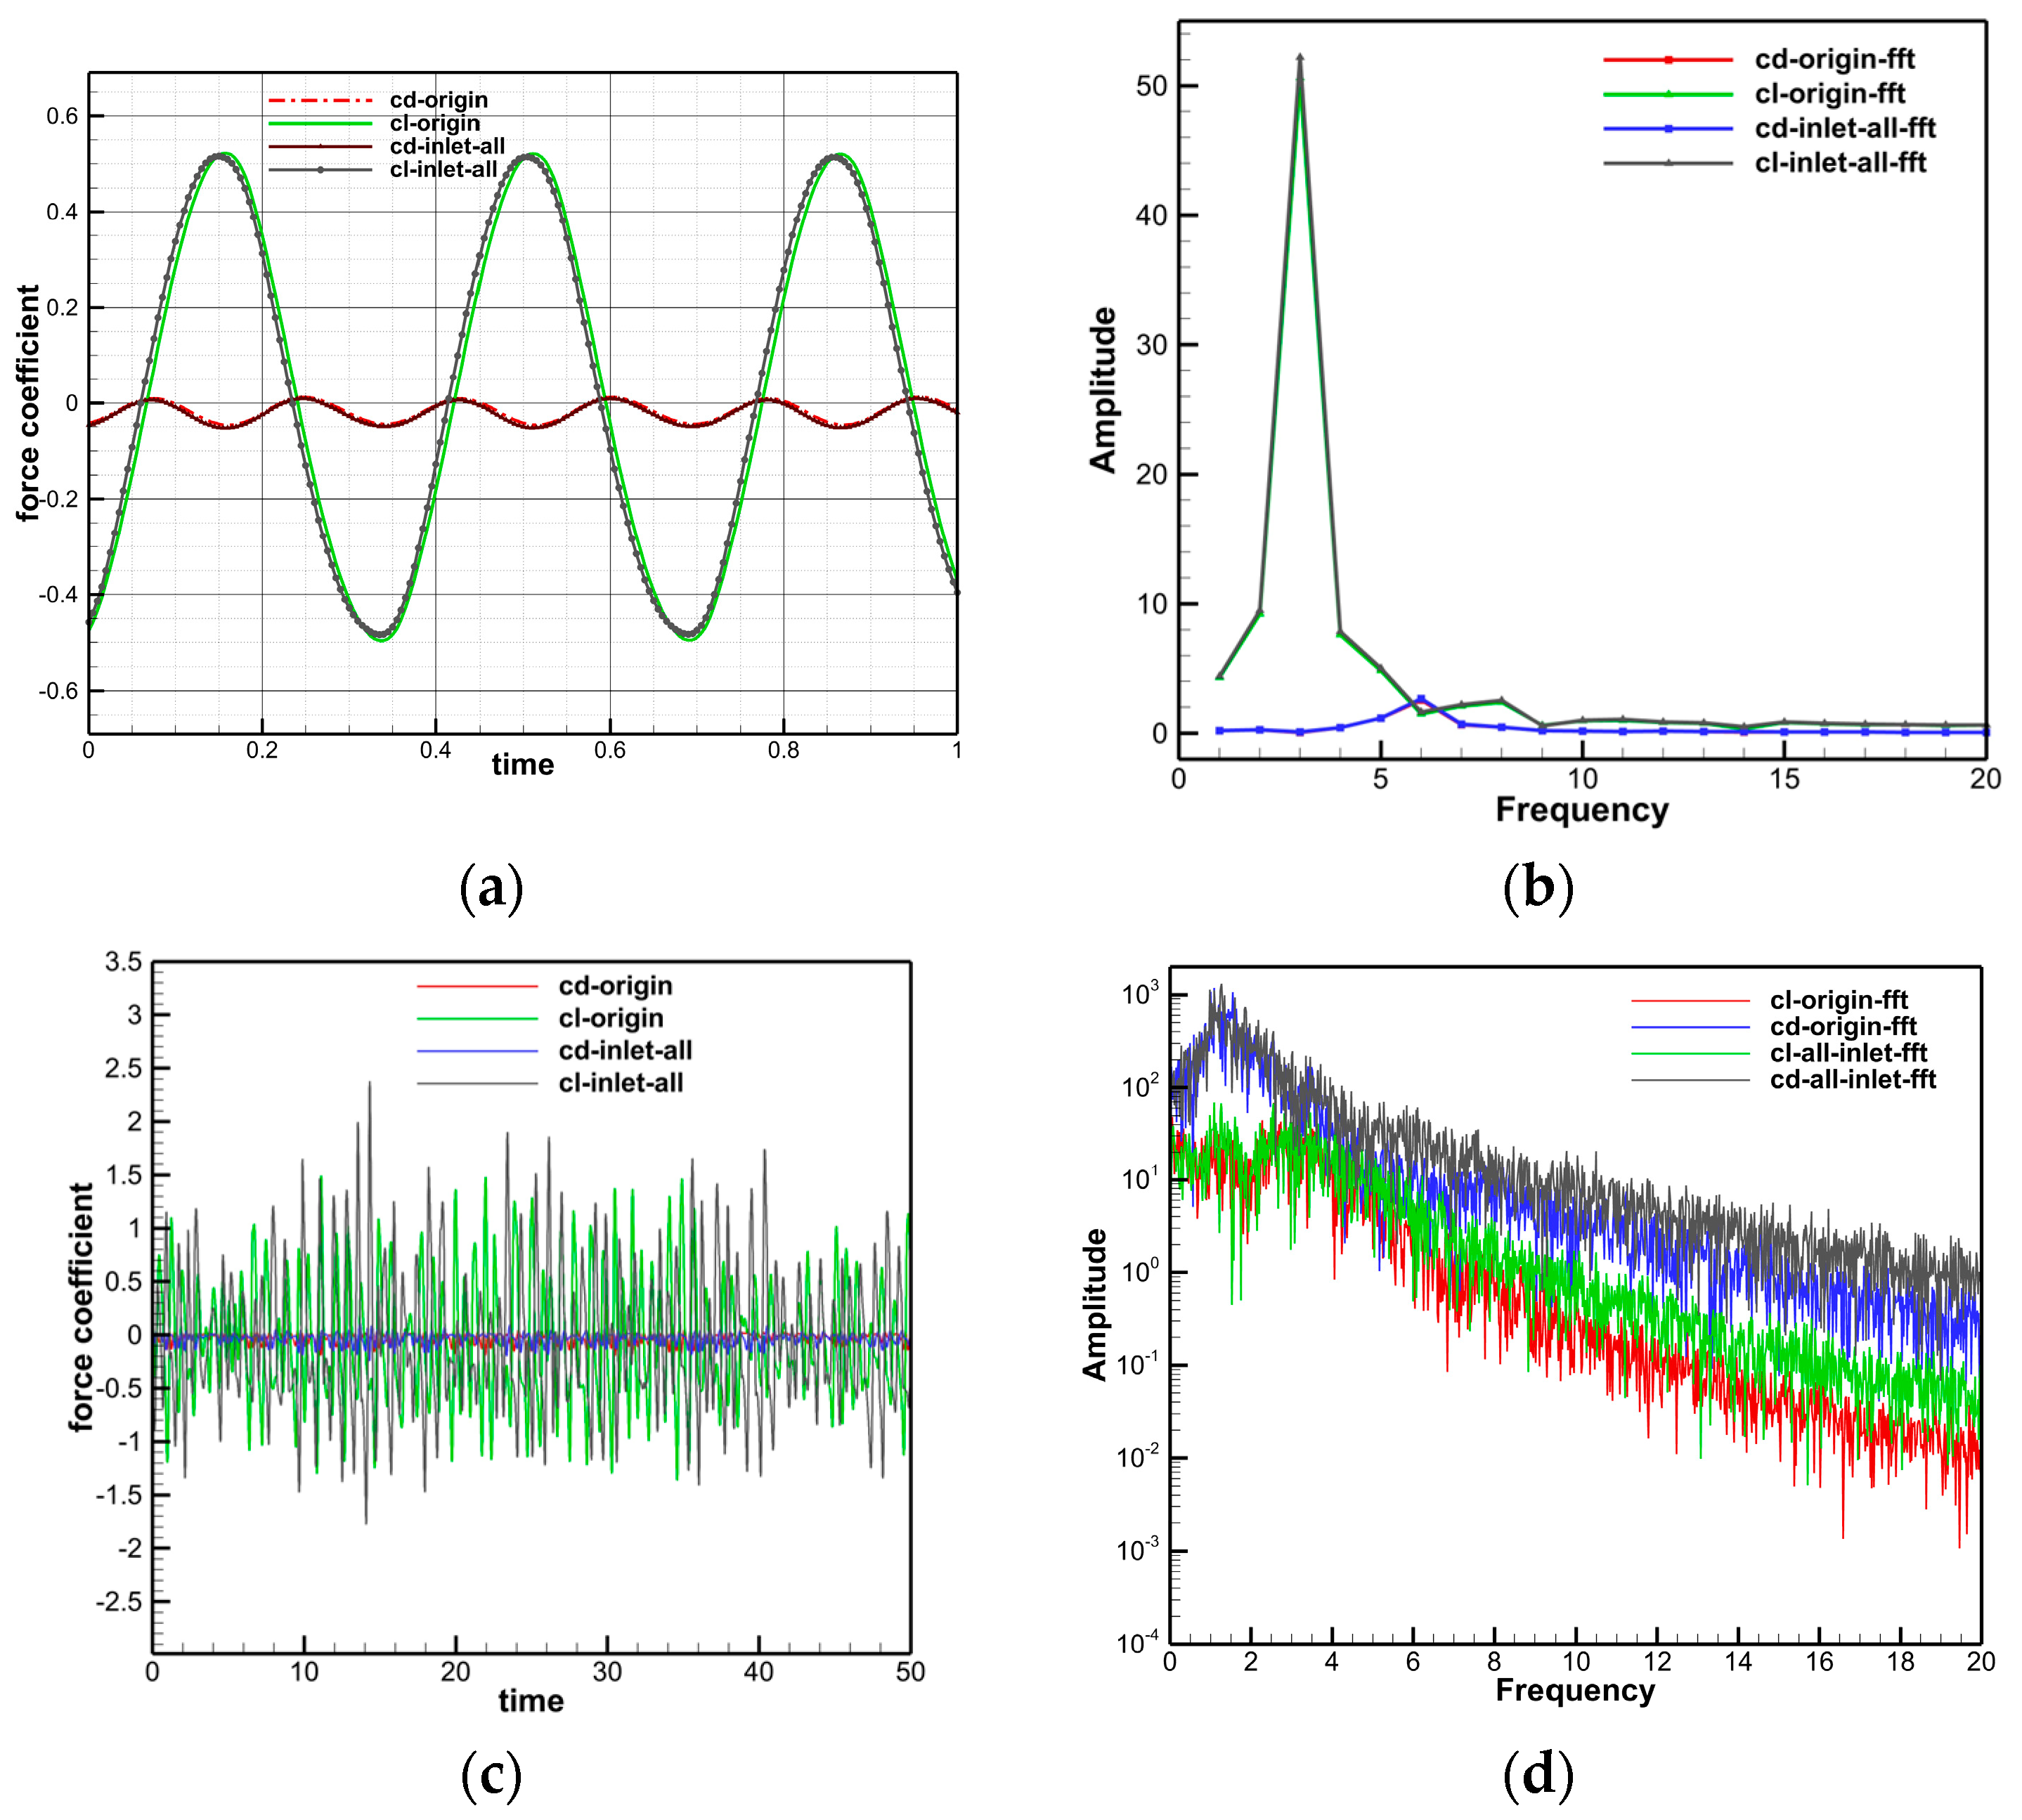
Figure 15 illustrates the instantaneous vorticity contours in the wake field with dimensionless cylinder inter-spacings of G = 1.5 and 0.35. It can be seen that the post-domain flow fields in Figure 15a,b were fully developed and exhibited a high degree of similarity with the actual physical flow. Due to the periodic shedding of the wake vortices behind two side-by-side circular cylinders with a gap of 1.5 m, the lift and drag coefficients of the downstream airfoil demonstrated periodic variations. Comparison figures and frequency analysis figures of the lift and drag coefficients in one second are shown in Figure 16. As shown in Figure 16a, cd-origin and cl-origin represent the airfoil lift and drag coefficients obtained from the coupled calculation of the two circular cylinders and the airfoil, respectively, and cd-inlet-all and cl-inlet-all represent those obtained via the full-order wake field loading method, respectively. As shown in Figure 16b, cd-origin-fft and cl-origin-fft represent the frequency domain of the airfoil obtained from the coupled calculation of the two circular cylinders and the airfoil, respectively and cd-inlet-all-fft and cl-inlet-all-fft represent those obtained via the full-order wake field loading method. The plotted results reveal that the temporal variations of the two results had almost a constant frequency; further, the discrepancy in the amplitudes of the lift coefficient was less than 1% and the difference in the amplitudes of the drag coefficient was less than 3%. Therefore, the reliability of the full-order wake-field loading method for flow around two parallel cylinders with a gap of G = 1.5 was firmly confirmed. Figure 16c shows the airfoil lift and drag coefficients obtained from the coupled calculation of the two circular cylinders and the airfoil, and Figure 16d shows the frequency domain of the airfoil obtained from the coupled calculation of the two circular cylinders and the airfoil. The shedding of the vortices in the case of G = 0.35 did not show an obvious periodicity, so it was not possible to directly compare the airfoil lift and drag coefficients. It can be seen that the amplitude frequencies of airfoil lift and drag coefficients obtained by the two calculation approaches were very close, which also confirms the reliability of the full-order wakefield generation approach when applied to the complex wake field with an cylinder inter-distance of G = 0.35.

4.4. Effects of Various Scale Flow Structures of the Wake on the Target Object for Different Modes in Post-Domain

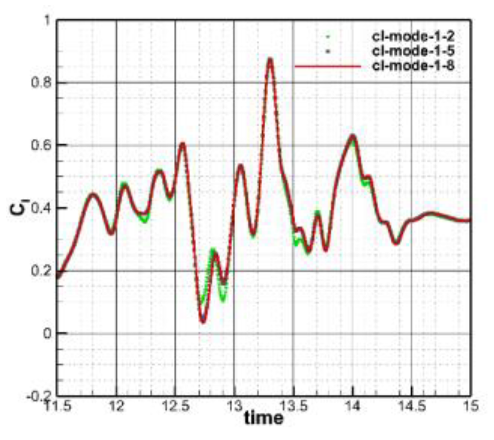
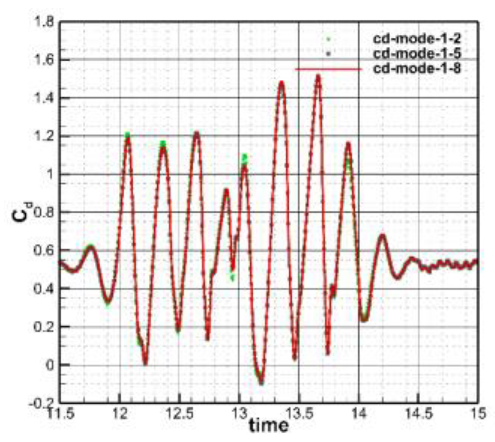
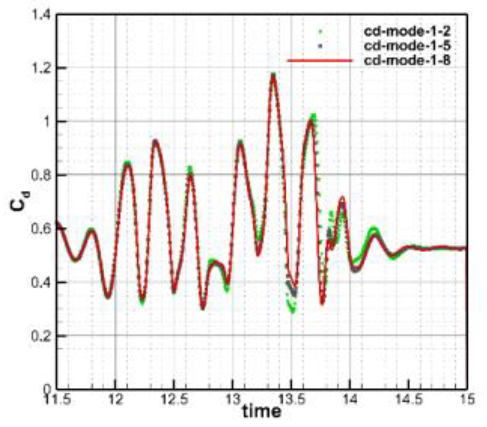
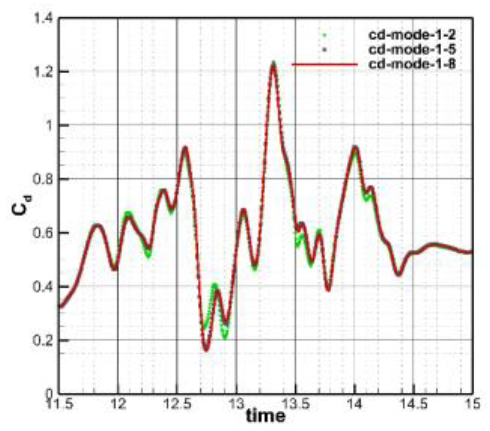
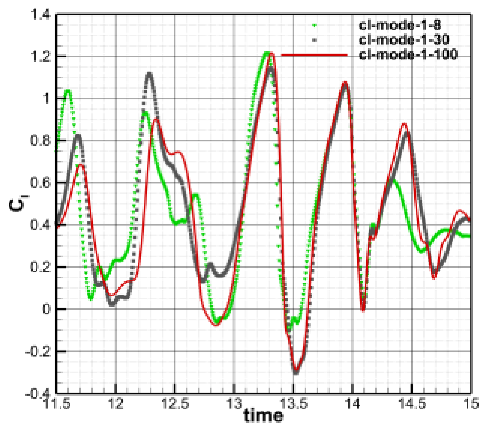
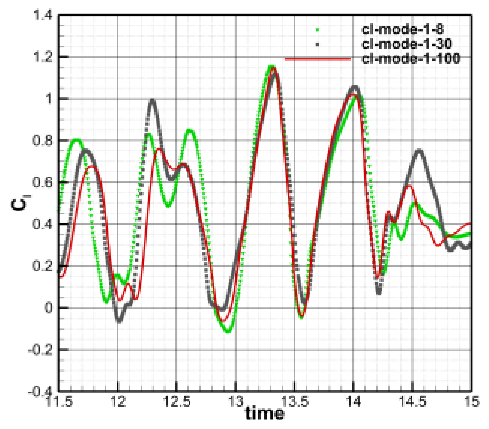
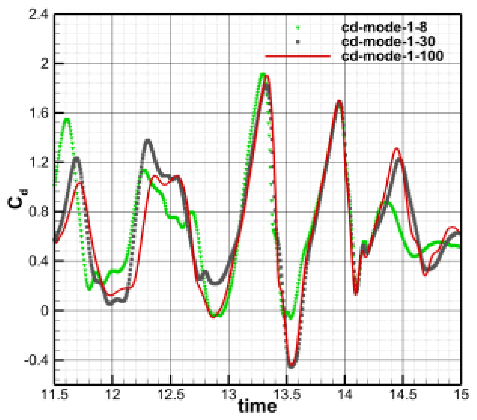
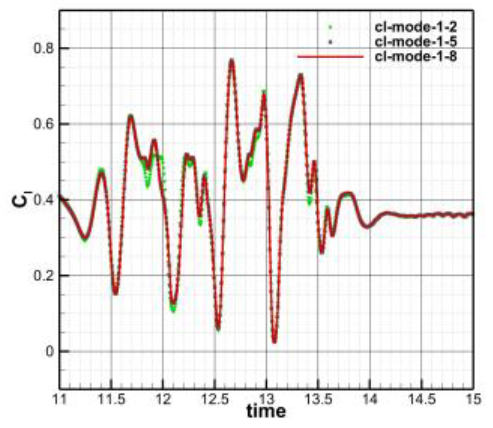
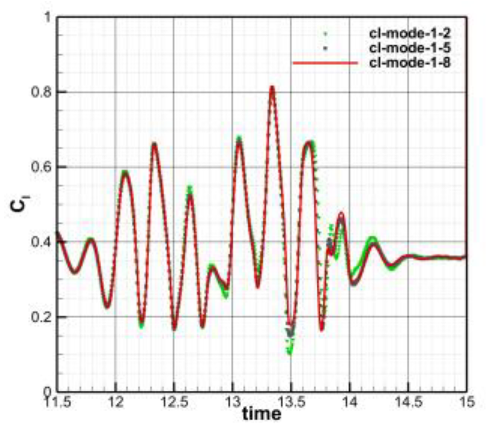
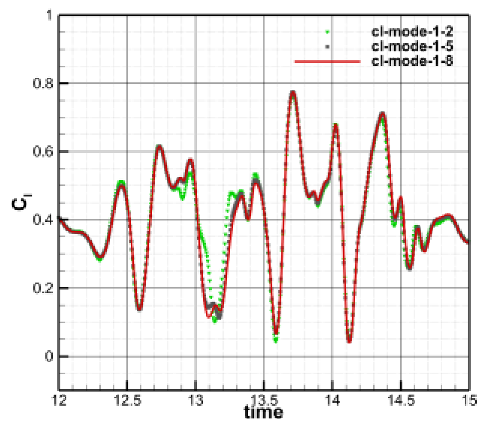
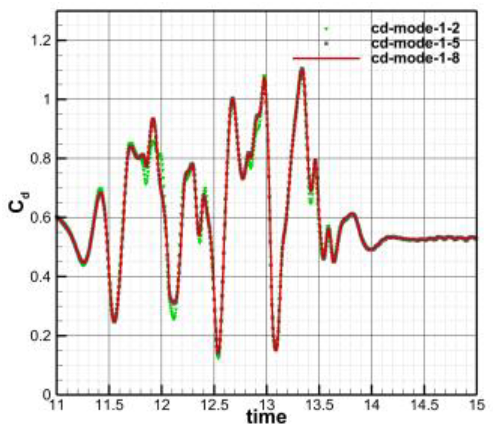
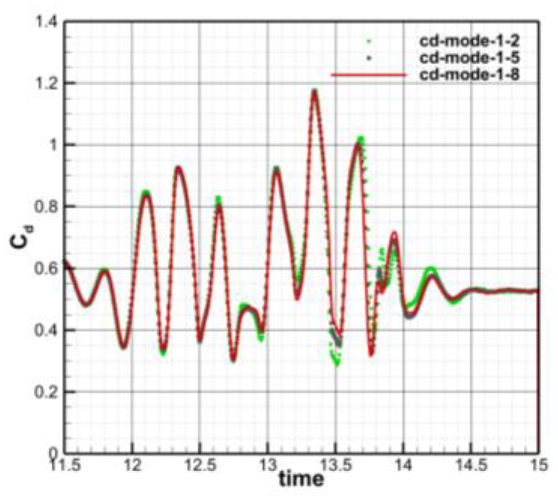
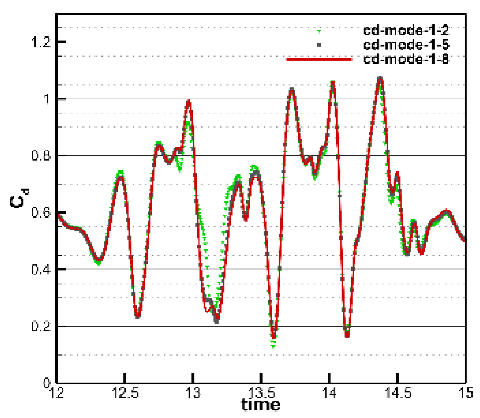
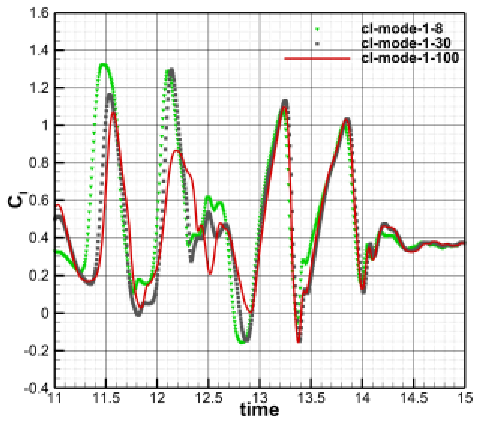
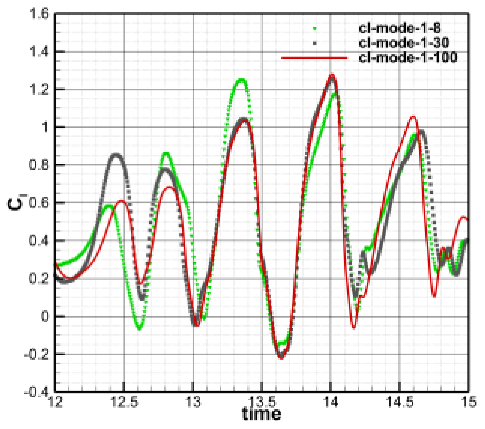
Figure 17 demonstrates a comparison investigation of the effects of different modal production on the aerodynamic characteristics of static airfoils for inter-spacings of G = 1.5 and 0.35. In the figure, the symbols “cl” and “cd” are associated with the lift and drag coefficients of the airfoil, “cl-mode-1–2” represents the lift coefficient obtained from the production of the first two modes, and so on. It can be seen that for the wake with G = 1.5, the first two generated modes could capture the large-scale flow structures in the flow field, and the resulting aerodynamic characteristics of the airfoil were close to those obtained by the full-order flow field, but detail treatment was a bit rough. The difference in the lift coefficient obtained from the first five generated modes was about 2%, which can meet the practical engineering requirements. The first eight modes generated were capable of capturing small-scale features in the flow field. For the wake flow with G = 0.35, the lift and drag coefficients obtained from the first thirty modes followed the trends of the full-order wake generation, but with large differences in their magnitudes. This is because the flow structures in lower modes are relatively uneven due to the complexity of the wake flow. The difference in the results obtained from the generation of the first mode was much less, which shows that the existing flow structures in one hundred first modes can meet the practical engineering requirements for this case.
This work investigated the aerodynamic characteristics of target objects in the wake of two parallel cylinders with different scales of flow structures. The effects of cylinder inter-spacing, object size, and object motion mode were also discussed. Equations (13) and (14) are time-dependent functions that prescribe the velocity components of the target objects. In these relations, l is a parameter related to the airfoil motion mode, which was taken as −0.5, 0, or 0.5 in this study. In Figure 18a, model 2 denotes the NACA0012 airfoil, object 1 is a model with half the center of gravity of object 2, and object 3 represents a model with an enlargement of 1.5 times the center of gravity of object 2. Figure 18b presents the trajectory of the target object, and Figure 18c illustrates the velocity components of the target object expressed by Equations (13) and (14) with l = 0. The target object remained stationary for the first 10 s, then underwent the motion described by Equations (13) and (14) from 10 to 11 s, followed by constant velocity motion until it completely passed through the wake region. For the case of l equal to −0.5 and 0.5, the airfoil started to accelerate at 9.5 s and 10.5 s, respectively, and maintained a constant speed until it completely passed through the wake region.
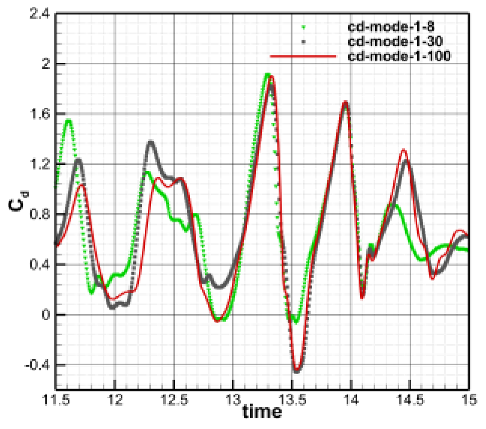
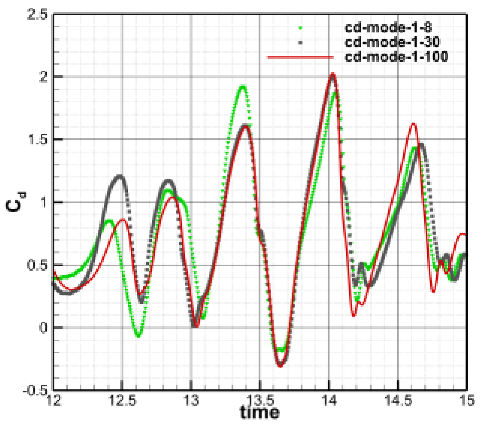
Table 4 presents a comparison of the aerodynamic force coefficients of three different target objects for l = 0 subjected to a load of wake flow structures with cylinder inter-spacings of G = 1.5 and 0.35. The obtained results indicated that for the flow structure with G = 1.5, the first five modes could capture the flow characteristics of all three objects suitably, and the aerodynamic characteristics of the obtained objects were compatible with the first eight modes, which is consistent with the results obtained for the load of the static flow structure of the airfoil. However, a comparison of the aerodynamic force coefficients for three understudy objects indicated that as the model size decreased, the lift and drag coefficients became more periodic with time, and for smaller objects, the aerodynamic force coefficients obtained by loading the first two modes were in good agreement with those obtained by loading the first eight and five modes, revealing that smaller models respond less to higher flow structures at smaller scales. For the flow structure with a cylinder inter-spacing of G = 0.35, only the first 30 modes for all three target objects approximately captured the flow profile, and the aerodynamic characteristics of the downstream targets obtained by the first 100 modes were consistent, which is because of the complex and dispersed flow structures below this smaller distance. In addition, by comparing the aerodynamic force coefficients for three target objects with different sizes, it can be concluded that for this distance, with the increase in the size of the object, the lift and drag coefficients become periodic, and for the largest object, the aerodynamic force. The coefficients obtained by loading the first 30 modes were better than the coefficients of the other two smaller bodies, indicating that the larger body responds more to the flow characteristics for this cylinder inter-distances and the characteristic size of the flow structure corresponding to the first 30 modes was slightly larger than object 3.
Table 5 shows the comparison of the aerodynamic coefficients of object 2 for the cases of G = 1.5 and 0.35. The results indicate object 2 accelerated in 9.5 s, 10.0 s, and 10.5 s. It can be seen that for the wake structure with dimensionless inter-distance of G = 1.5, the variations in trends of the aerodynamic coefficients during a period, when the target object completes acceleration until it completely passes through the wake region, were constant at 9.5 s and 10.5 s. This issue also indicates that 1 s represents only one evolutionary cycle of this wake structure. In addition, we compared the aerodynamic coefficients of the object obtained from the loading of the first five structures and the first eight structure modes at various moments of acceleration. The plotted results indicated that the loading of the first five modal structures was appropriate for three different acceleration moments, which shows that the responses of different scales of characteristic wake structures to different acceleration moments for this cylinder distance are weak. For the wake structure with distance G = 0.35, the variation’s trends of aerodynamic coefficients wewre roughly the same for three different moments of acceleration, which indicated that the wake structure reacts slowly at this distance. In addition, by comparing the aerodynamic coefficients of the downstream target object obtained by loading the first thirty structures and one hundred first modal structures at different moments of acceleration, it can be found that the loading of the first thirty modal structures was almost reasonable for three different moments of acceleration instants, indicating that the response of different scales of characteristic wake structures to different acceleration moments for this cylinder inter-distance is weak:
V x = 1 sin { π ( time l ) π 2 } 1
  V y = 1.5 sin { ( π ( time l ) π 2 ) } 1.5

5. Conclusions

Based on the reduced-order modeling methodology and the post-domain simulation approach, this paper aimed to investigate the effect of the complex low-speed wake on the aerodynamic characteristics of downstream target objects. The main results can be summarized as follows:
  • The flow around the doubly parallel cylinders demonstrated a synchronized and reverse vortex shedding pattern, and the vortex structure along the flow direction remained unchanged in a relatively long region behind the two cylinders until the dimensionless inter-distance was G = 1.5. The vortex shedding pattern of the double-cylinder wake exhibited an alternating and flipping vortex shedding pattern that tilted toward one of the cylinders during a certain period of time for the dimensionless inter-distance of G = 0.35;
  • The wake modal structure for G = 1.5 was more compact than that in the case of G = 0.35, and the wake mode for G = 1.5 was generally smoother and more regular. The modal structure evolution with increasing modal order and the shedding were compatible with each other, and the higher-order modal structure was relatively more scattered and smaller in scale;
  • The wake field for the case of G = 1.5 only required the first five modes to capture the overall flow structure, and the lift and drag coefficients obtained from the fixed downstream object matched those obtained with the full wake field. In contrast, the wake field in the case of G = 0.35 required about the first thirty modes to roughly capture the trend of the flow development process;
  • For the case of moving downstream target object, for the wake with G = 1.5, the aerodynamic properties of smaller downstream objects had less influence on the response of higher-order modes with smaller scales. For the wake with a dimensionless inter-distance G = 0.35, due to the scattered modal structures, the aerodynamic characteristics of the three target objects with different sizes had less influence on the response of the first three large-scale modes, which is directly related to the relative scale of the target object flow structure. Meanwhile, the aerodynamic characteristics of the flow structures of the wake at inter-distances of G = 1.5 and 0.35 exhibited consistent responses to the target object at different times, which indicated that the flow structures of the wake exhibited consistent aerodynamic characteristics on the target object at different times.

Author Contributions

Conceptualization, J.F. and J.W. (Junhui Wang); methodology, J.F., J.W. (Junhui Wang) and S.T.; software, J.W. (Junhui Wang) and S.T.; validation J.W. (Jifei Wu); formal analysis, K.X.; investigation, J.W. (Jifei Wu); resources, S.T.; data curation, K.X.; writing—Original Draft Preparation, J.W. (Junhui Wang); writing—review and editing, S.T. and K.X. All authors have read and agreed to the published version of the manuscript.

Funding

This research was funded by National Numerical Wind tunnel Project, grant number: NNW2019ZT7- B31.

Data Availability Statement

Not applicable.

Acknowledgments

The work was financially supported by National Numerical Wind tunnel Project (Grant No. NNW2019ZT7-B31). This research was also supported in part by the Priority Academic Program Development of Jiangsu Higher Education Institutions.

Conflicts of Interest

The authors declare no conflict of interest.

References

  1. Qu, F.; Lu, C.; Jiang, Z.F.; Wang, T. CFD numerical simulation of ship air-wake. Chin. J. Ship Res. 2009, 4, 23–27. [Google Scholar]
  2. Hotelling, H. Analysis of a complex of statistical variables in principal components. J. Educ. Psychol. 1933, 24, 498–520. [Google Scholar] [CrossRef]
  3. Krath, E.H.; Carpenter, F.L.; Cizmas, P.G.A.; Johnston, D.A. An efficient proper orthogonal decomposition based reduced-order model for compressible flows. J. Comput. Phys. 2021, 426, 109959. [Google Scholar] [CrossRef]
  4. Holmes, P.; Lumley, J.L.; Berkooz, G. Turbulence, Coherent Structures, Dynamical Systems and Symmetry; Cambridge University Press: Cambridge, UK, 1996. [Google Scholar]
  5. Lumley, J.L. The structure of inhomogeneous turbulent flows. In Atmospheric Turbulence and Radio Wave Propagation; Nauka, Moscow, 1967; pp. 166–178. Available online: http://a.xueshu.baidu.com/usercenter/paper/show?paperid=dd09155296faa5589ab06b9d4f86b27b (accessed on 8 August 2023).
  6. Sirovich, L. Turbulence and the dynamics of coherent structures. I. Coherent structures. Q. Appl. Math. 1987, 45, 561–571. [Google Scholar] [CrossRef]
  7. Premaratne, P.; Tian, W.; Hu, H. A proper-orthogonal-decomposition (POD) study of the wake characteristics behind a wind turbine model. Energies 2022, 15, 3596. [Google Scholar] [CrossRef]
  8. Kumar, M.; Vanka, S.P.; Banerjee, R.; Mangadoddy, N. Dominant modes in a gas cyclone flow field using proper orthogonal decomposition. Ind. Eng. Chem. Res. 2022, 61, 2562–2579. [Google Scholar] [CrossRef]
  9. Sinha, A.; Ivln, P. Investigating wake structures in flow past oscillating cylinder using proper orthogonal decomposition. arXiv 2022, arXiv:2201.09839. [Google Scholar]
  10. Fureby, C.; Tabor, G.; Weller, H.G.; Gosman, A.D. A comparative study of subgrid scale models in homogenous isotropic turbulence. Phys. Fluids 1997, 9, 1416–1429. [Google Scholar] [CrossRef]
  11. Lamballais, E.; Lesieur, M.; Metais, O. Probability distribution functions and coherent structures in a turbulent channel. Phys. Rev. E 1997, 56, 6761–6766. [Google Scholar] [CrossRef]
  12. Wang, P.; Bai, X.S. Large eddy simulations of turbulent swirling flows in a dump combustor: A sensitivity study. Int. J. Numer. Methods Fluids 2005, 47, 99–120. [Google Scholar] [CrossRef]
  13. Zhou, Y.; Mahbub, A.M. Wake of two interacting circular cylinders: A review. Int. J. Heat Fluid Flow 2016, 62, 510–537. [Google Scholar] [CrossRef]
  14. Chen, X.; Liu, L.; Yue, Z.J. Reduced order aerothermodynamic modeling research for hypersonic vehicles based on proper orthogonal decomposition and surrogate method. Acta Aeronaut. Et Astronaut. Sin. 2015, 2, 462–472. [Google Scholar]
  15. Chang, K.S.; Song, C.J. Interactive vortex shedding from a pair of circular cylinders in a transverse arrangement. Int. J. Numer. Methods Fluids 1990, 11, 317–329. [Google Scholar] [CrossRef]
  16. Menter, F.R. Two-equation eddy-viscosity turbulence models for engineering applications. AIAA J. 1994, 32, 1598–1605. [Google Scholar] [CrossRef]
  17. Zhao, N.; Jiang, Y.; Peng, L.L.; Chen, X.W. Fast simulation of nonstationary wind velocity fields by proper orthogonal decomposition interpolation. J. Wind Eng. Ind. Aerodyn. 2021, 219, 104798. [Google Scholar] [CrossRef]
  18. Abbaszadeh, M.; Dehghan, M.; Khodadadian, A.; Noii, N.; Heitzinger, C.; Wick, T. A reduced-order variational multiscale interpolating element free Galerkin technique based on proper orthogonal decomposition for solving Navier-Stokes equations coupled with a heat transfer equation: Nonstationary incompressible Boussinesq equations. J. Comput. Phys. 2021, 426, 109875. [Google Scholar] [CrossRef]
  19. Yang, S.; Wu, B.S. The numerical simulation of two dimensional circular flow. Shipbuild. China 2007, 48, 533–540. [Google Scholar]
  20. Fang, Y.Y. Flow field selection and mesh generation of 3D numerical simulation of flow around a circular cylinder. J. Waterw. Harb. 2009, 30, 70–76. [Google Scholar]
  21. Meneghini, J.R.; Saltara, F.; Siqueira, C.L.R.; Ferrarijr, J.A. Numerical simulation of flow interference between two circular cylinders in tandem and side-by-side arrangements. J. Fluids Struct. 2001, 15, 327–350. [Google Scholar] [CrossRef]
  22. Wu, G.X.; Hu, Z.Z. Numerical simulation of viscous flow around unrestrained cylinders. J. Fluids Struct. 2006, 22, 371–390. [Google Scholar] [CrossRef]
  23. Ding, D.W. Two-Dimensional Numerical Simulation of Flow around a Cylinder and Vortex-Induced Vibration; Doctor-Tianjin University: Tianjin, China, 2010; Available online: https://kns.cnki.net/kcms2/article/abstract?v=3uoqIhG8C475KOm_zrgu4lQARvep2SAkWGEmc0QetxDh64Dt3veMp0sEcugM_LeKLl76NlUs3SfgyRdXir0528PSfo5sbyET&uniplatform=NZKPT (accessed on 8 August 2023).
  24. Chen, Y.H.; Yang, S.C.; Yang, J.Y. Implicit weighted essentially non-oscillatory schemes for the incompressible Navier-Stokes equations. Int. J. Numer. Methods Fluids 1999, 31, 747–765. [Google Scholar] [CrossRef]
  25. Martinez, V.; Azzopardi, J.G. Invasive lobular carcinoma of the breast: Incidence and variants. Histopathology 1979, 3, 467–488. [Google Scholar] [CrossRef] [PubMed]
  26. Liu, S.; Fu, S. Numerical simulation of flow past two cylinders in tandem arrangement. Chin. J. Comput. Mech. 2000, 17, 260–266. [Google Scholar]
  27. Zhang, Q.S. PIV Measurements of Unsteady Characteristics of Separated and Reattaching Flow on Finite Blunt Plate—Vortex Dynamics Analysis Using Proper Orthogonal Decomposition and Dynamic Mode Decomposition; Doctor-Shanghai Jiao Tong University: Shanghai, China, 2015; Available online: https://kns.cnki.net/kcms2/article/abstract?v=3uoqIhG8C447WN1SO36whLpCgh0R0Z-ifBI1L3ks338rpyhinzvy7GQKVVP3Xa6CRdgoOvFrvg8DF2ichygiv_BcOr2Czj2h&uniplatform=NZKPT (accessed on 8 August 2023).
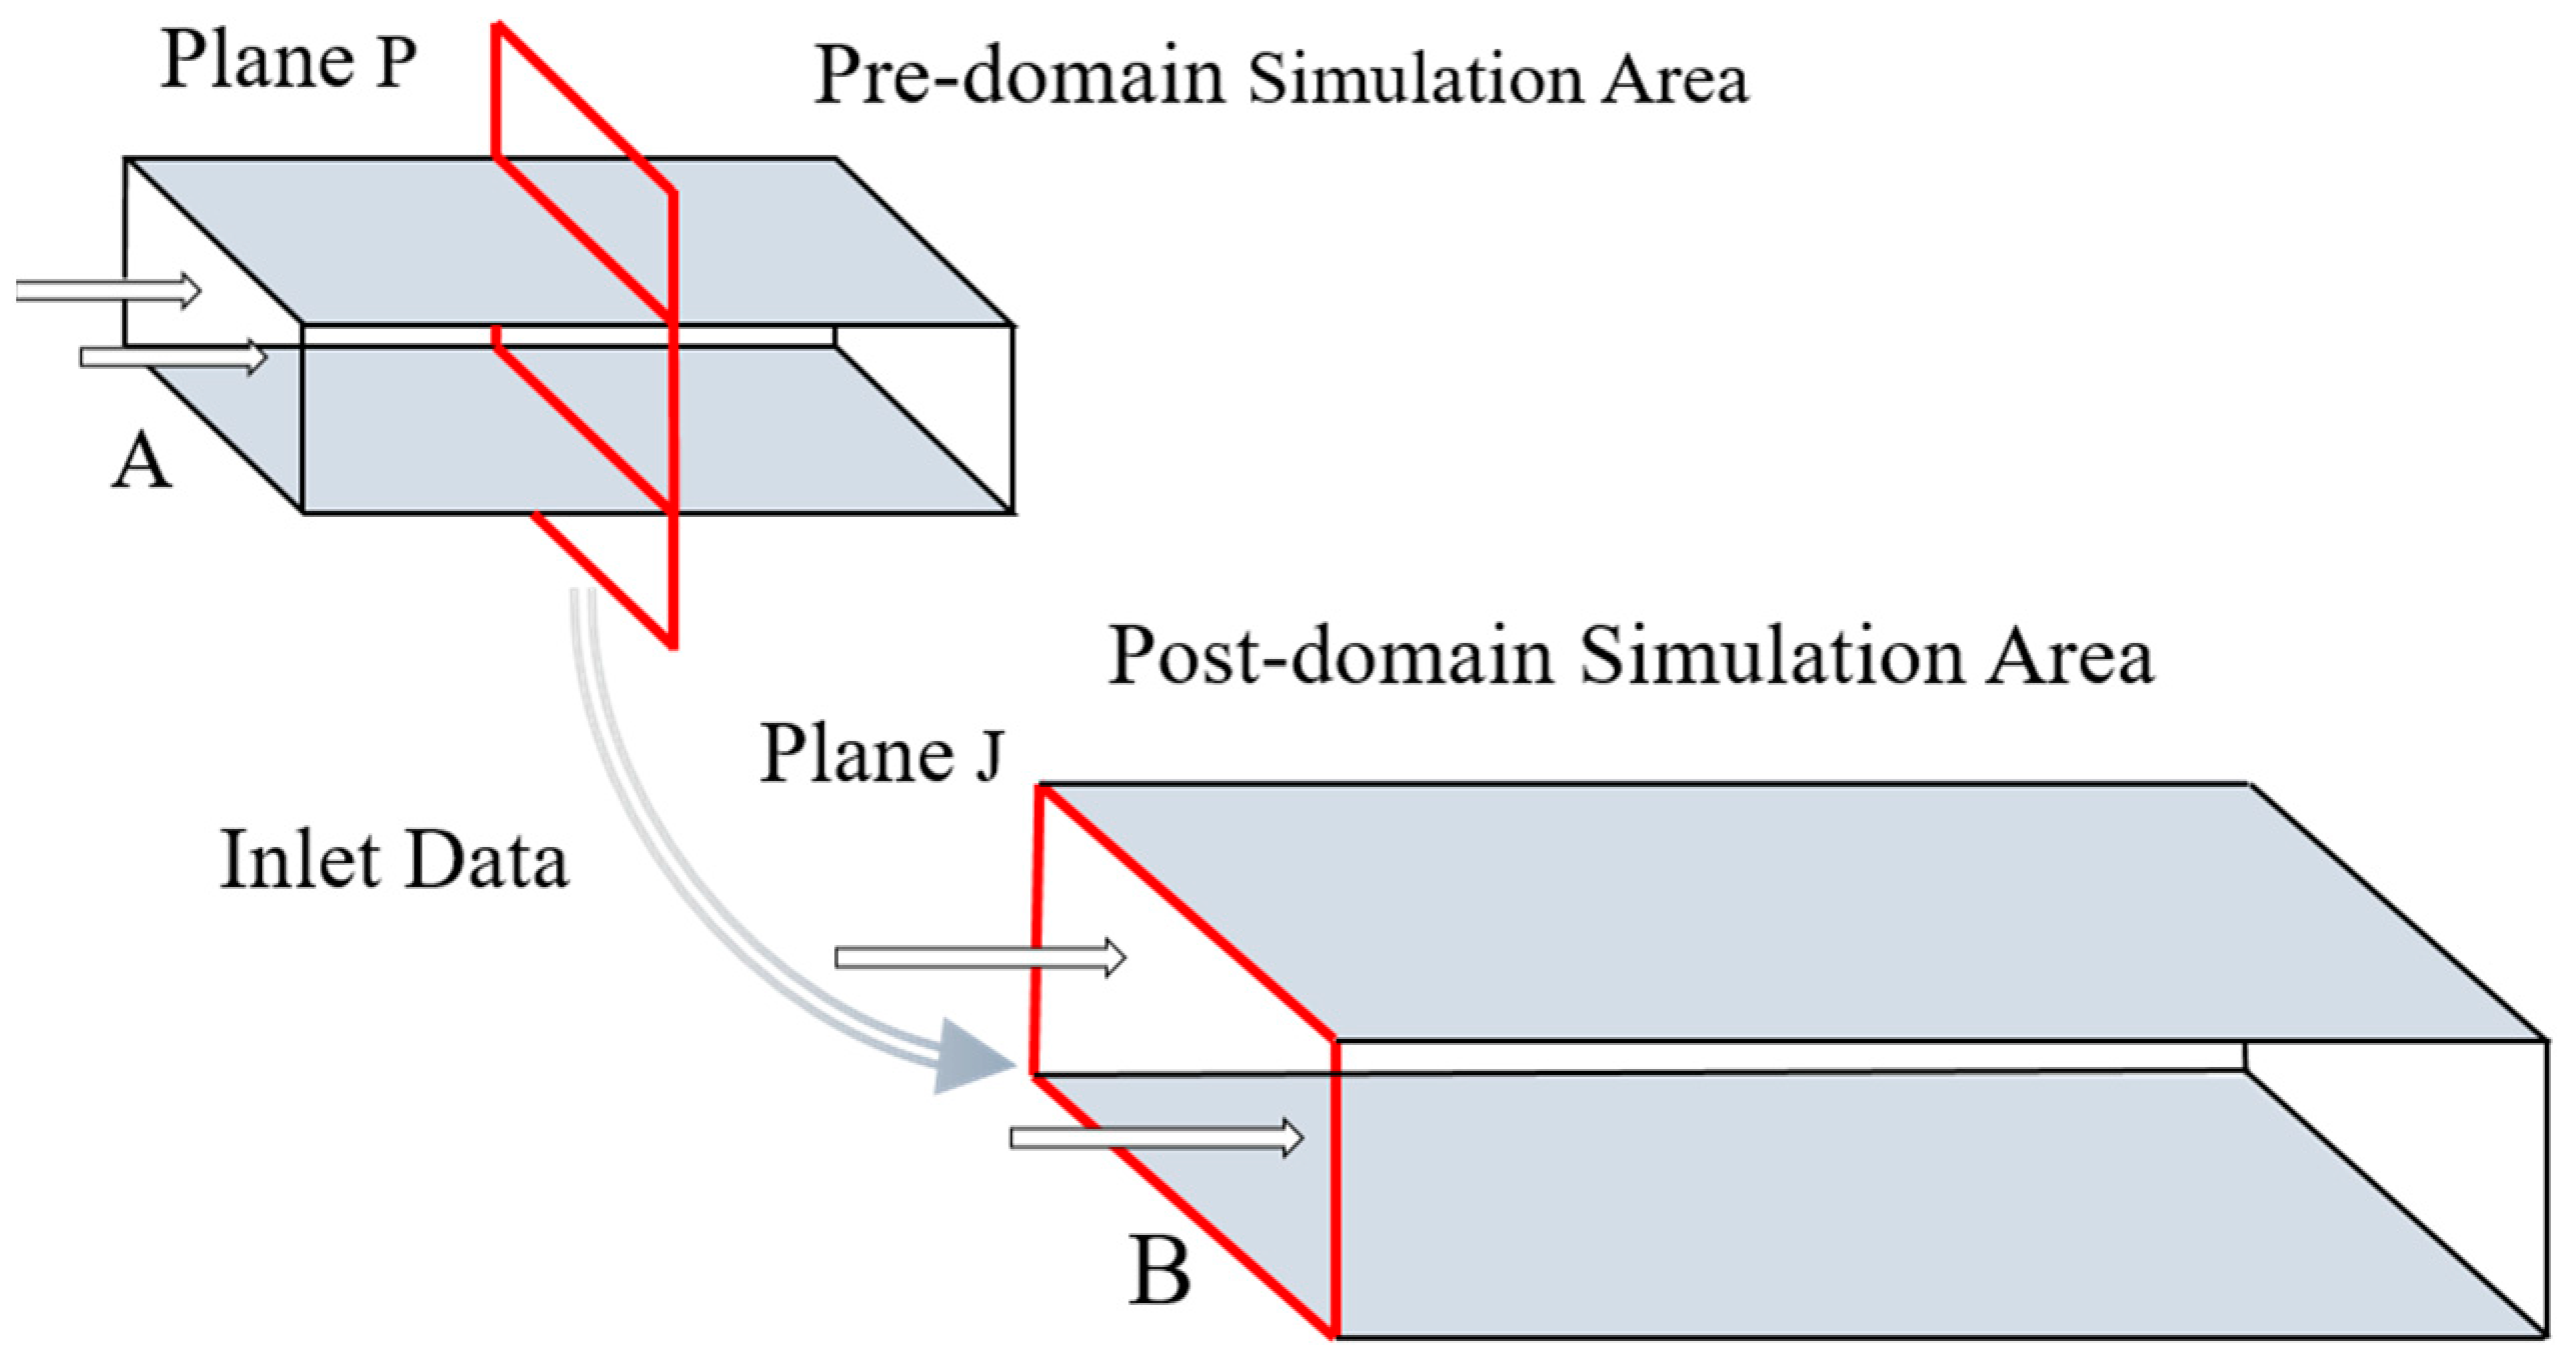
Figure 1. Schematic representation of the domain precursor simulation approach.
Aerospace 10 00824 g001
Figure 2. Schematic representation of the computational domain and boundary conditions.
Aerospace 10 00824 g002
Figure 3. The considered mesh around a single circular cylinder.
Aerospace 10 00824 g003
Figure 4. Time history plots of the lift and drag coefficients of a circular cylinder.
Aerospace 10 00824 g004
Figure 5. Energy distribution of different POD modes for the flow over a single cylinder.
Aerospace 10 00824 g005
Figure 6. Instantaneous and mean vorticity fields. (a) Vorticity contours at 6 s; (b) mode0 (mean vorticity contours).
Aerospace 10 00824 g006
Figure 7. Schematic representation of generating different scales of flow structures.
Aerospace 10 00824 g007
Figure 8. The computational domain of the flow field around the doubly parallel cylinders.
Aerospace 10 00824 g008
Figure 9. The mesh representation around the doubly parallel cylinders. (a) G = 1.5. (b) G = 0.35.
Aerospace 10 00824 g009
Figure 10. The lift and drag coefficients of doubly parallel cylinders with inter-distances of G = 1.5 and 0.35. (a) Lift coefficient (G = 1.5). (b) Drag coefficient (G = 1.5). (c) Lift coefficient (G = 0.35). (d) Drag coefficient (G = 0.35).
Aerospace 10 00824 g010
Figure 11. The vortex contour at different instants for doubly parallel cylinders with inter-distances of G = 1.5 and 0.35. (a) G = 1.5. (b) G = 0.35.
Aerospace 10 00824 g011
Figure 12. POD modal energy distribution of the flow around doubly parallel cylinders with inter-spacing G = 1.5 and 0.35. (a) G = 1.5. (b) G = 0.35.
Aerospace 10 00824 g012
Figure 13. Computational domain associated with doubly parallel cylinders and downstream NACA0012 airfoil. (a) Pre-domain. (b) Post-domain. (c) Coupled domain of two cylinders and an airfoil.
Aerospace 10 00824 g013
Figure 14. The dense mesh diagram of the NACA0012 airfoil in the post-domain.
Aerospace 10 00824 g014
Figure 15. Instantaneous vorticity contours in the post-domain obtained by the full-order wake field generating method. (a) G = 1.5. (b) G = 0.35.
Aerospace 10 00824 g015
Figure 16. Comparison plots of the lift and drag coefficients of the airfoil. (a) Time domain for G = 1.5. (b) Frequency domain for G = 1.5. (c) Time domain for G = 0.35. (d) Frequency domain for G = 0.35.
Aerospace 10 00824 g016
Figure 17. Influence of different mode generating of the POD on the lift and drag coefficients of the airfoil subjected to static conditions for inter-spacing of G = 1.5 and 0.35. (a) Comparison plots of the lift coefficient, G = 1.5. (b) Comparison plots of the drag coefficient, G = 1.5. (c) Comparison plots of the lift coefficient, G = 0.35. (d) Comparison plots of the drag coefficient, G = 0.35.
Aerospace 10 00824 g017
Figure 18. Shape, trajectory, and velocity of the downstream target object. (a) Target object. (b) Trajectory of the object. (c) Velocity components of the object.
Aerospace 10 00824 g018
Table 1. The lift and drag coefficients and Strouhal number.
Parameter C l C d St
Reference MaxMinMaxMin
Present study0.54−0.541.341.2610.2
Wu and Hu (2006) [22]0.586−0.5821.3841.3220.19
DW (2010) [23]0.594−0.5931.561.490.2
Chen et al. (1999) [24]0.63−0.631.531.430.18
Martinez (1979) [25]0.701.300.19
Table 2. The contour maps, temporal evolution of coefficients, and spectral analysis graphs for each POD mode.
(a) Contour Plot of Each Mode(b) Temporal Evolution of Mode Coefficients(c) Spectral Analysis of Mode Coefficients
Aerospace 10 00824 i001Aerospace 10 00824 i002Aerospace 10 00824 i003
Aerospace 10 00824 i004Aerospace 10 00824 i005Aerospace 10 00824 i006
Aerospace 10 00824 i007Aerospace 10 00824 i008Aerospace 10 00824 i009
Aerospace 10 00824 i010Aerospace 10 00824 i011Aerospace 10 00824 i012
Table 3. POD modal contour of the flow around doubly parallel cylinders with G = 1.5 and 0.35.
(a) G = 1.5 (b) G = 0.35
Aerospace 10 00824 i013Aerospace 10 00824 i014
Aerospace 10 00824 i015Aerospace 10 00824 i016
Aerospace 10 00824 i017Aerospace 10 00824 i018
Aerospace 10 00824 i019Aerospace 10 00824 i020
Aerospace 10 00824 i021Aerospace 10 00824 i022
Table 4. Comparison of the aerodynamic coefficients of different objects during the process of passing through the wake zone (note: l = 0).
Object 1Object 2Object 3
G = 1.5Aerospace 10 00824 i023Aerospace 10 00824 i024Aerospace 10 00824 i025
Aerospace 10 00824 i026Aerospace 10 00824 i027Aerospace 10 00824 i028
G = 0.35Aerospace 10 00824 i029Aerospace 10 00824 i030Aerospace 10 00824 i031
Aerospace 10 00824 i032Aerospace 10 00824 i033Aerospace 10 00824 i034
Table 5. Comparison of the aerodynamic coefficients of object 2 during the process of passing through the wake zone.
l = −0.5l = 0l = 0.5
G = 1.5Aerospace 10 00824 i035Aerospace 10 00824 i036Aerospace 10 00824 i037
Aerospace 10 00824 i038Aerospace 10 00824 i039Aerospace 10 00824 i040
G = 0.35Aerospace 10 00824 i041Aerospace 10 00824 i042Aerospace 10 00824 i043
Aerospace 10 00824 i044Aerospace 10 00824 i045Aerospace 10 00824 i046
Disclaimer/Publisher’s Note: The statements, opinions and data contained in all publications are solely those of the individual author(s) and contributor(s) and not of MDPI and/or the editor(s). MDPI and/or the editor(s) disclaim responsibility for any injury to people or property resulting from any ideas, methods, instructions or products referred to in the content.