Article

Suggestions for Criteria to Evaluate Lateral-Directional Nonlinear Pilot-Induced Oscillations Due to Fly-by-Wire Civil Aircraft Landing Configuration Switch

1
School of Aeronautic Science and Engineering, Beihang University, Beijing 100191, China
2
China Special Aircraft Research Institute, Jinmen 448035, China
*
Author to whom correspondence should be addressed.
Aerospace 2023, 10(9), 799; https://doi.org/10.3390/aerospace10090799
Submission received: 13 July 2023 / Revised: 8 September 2023 / Accepted: 12 September 2023 / Published: 13 September 2023
(This article belongs to the Section Aeronautics)

Abstract

:
Using a nonlinear pilot-induced oscillation prediction method based on digital virtual flight simulation calculations, digital experiments on predicting lateral-directional nonlinear pilot-induced oscillations due to landing configuration switching of fly-by-wire civil aircraft with different closed-loop dynamic characteristics are carried out. It is proposed that the lateral-directional pilot-induced oscillations due to the landing configuration switch can be evaluated using the changes in dynamic characteristic parameters before and after the configuration switch. The quantitative boundaries of the dynamic characteristic parameters of an example aircraft are determined, and a criterion suggestion is formed to predict the lateral-directional nonlinear pilot-induced oscillations due to landing configuration switching. This study provides a reference for the optimal design of the lateral-directional flight control law of fly-by-wire aircraft during the approach stage and provides suggestions for the formulation of evaluation criteria for other nonlinear pilot-induced oscillation phenomena.

1. Introduction

To cruise at higher speeds, the wings of modern large civil aircraft are generally swept back, which also enhances the aircraft lateral static stability. During approach, to increase lift and decelerate, an aircraft needs to extend flaps and switch from the cruise configuration to the landing configuration [1,2,3]. At this time, the wings can generate additional lift, and asymmetric lift generated by the wings on both sides will increase during sideslip, enhancing the lateral stability effect generated by the wing sweep [4,5]. The lateral control law designed for the aircraft cruise configuration may no longer be applicable to the landing configuration, and control law parameters for fly-by-wire (FBW) civil aircraft should be designed for both cruise and landing configurations. Therefore, the lateral-directional dynamic characteristics of closed-loop aircraft may change greatly before and after a configuration switch [6].
To align an aircraft flight path to a runway during approach, a pilot needs to precisely control the roll attitude of the aircraft [7]. If the pilot is accustomed to manipulating the dynamic characteristics of the aircraft in the cruise configuration and then the aircraft changes to the landing configuration, the lateral-directional dynamic characteristics of the closed-loop aircraft will change greatly, and it may be difficult for the pilot to adjust their manipulation behaviour in time to adapt to the dynamic characteristics of the landing configuration. Therefore, aircraft configuration changes are one of the main factors causing a nonlinear pilot-induced oscillation phenomenon (Category III PIOs) [8,9,10]. When designing the control law parameters for the cruise and landing configurations, it is necessary to consider the problem that a change in closed-loop aircraft dynamic characteristics before and after configuration switching may induce lateral-directional PIO [11].
However, the traditional flying qualities evaluation criteria [12,13,14,15] can only be used to evaluate the PIO characteristics of an aircraft in a certain configuration, namely Category I or Category II PIOs, and cannot predict the Category III PIO phenomena caused by the change in closed-loop aircraft dynamic characteristics [16]. Therefore, it is difficult to evaluate whether a designed flight control law is suitable for the process of switching to the landing configuration, and it cannot expose flight safety hazards that may exist in the approach and landing stage of FBW civil aircraft. To predict the lateral-directional Category III PIO phenomenon induced by configuration switching during landing, new characteristic parameters or combinations that can characterize the dynamic characteristics of closed-loop aircraft need to be proposed to evaluate the closed-loop lateral-directional flying qualities more accurately during the approach and landing stages and provide a reference for optimal flight control law design.
At present, there is a lack of evaluation criteria for predicting PIOs due to abrupt changes in closed-loop aircraft dynamics [9]. In Ref. [17], a nonlinear PIO prediction method based on digital virtual flight simulation calculation [18,19] was proposed. By using a pilot model that can adjust the control behaviour adaptively according to the dynamic characteristics of the aircraft, the pitch attitude tracking task used to evaluate the PIO characteristics is simulated. Then, the PIO identification algorithm based on fuzzy logic is used to quantitatively evaluate the PIO trend of aircraft during flight tasks. The prediction results based on the simulation calculation are consistent with the results of a human-in-the-loop flight test conducted using a ground simulator, which verifies the effectiveness of the prediction method.
In this study, the nonlinear PIO prediction method based on digital virtual flight established in Ref. [17] is first used to carry out digital experiments on lateral-directional PIO prediction due to configuration switching during landing for aircraft with different closed-loop dynamic characteristics. Second, according to the calculation results, characteristic parameters that characterize the effect of the configuration switching on the lateral-directional PIO characteristics during landing are proposed. Finally, evaluation criteria for lateral-directional nonlinear PIOs due to landing configuration switching are proposed.

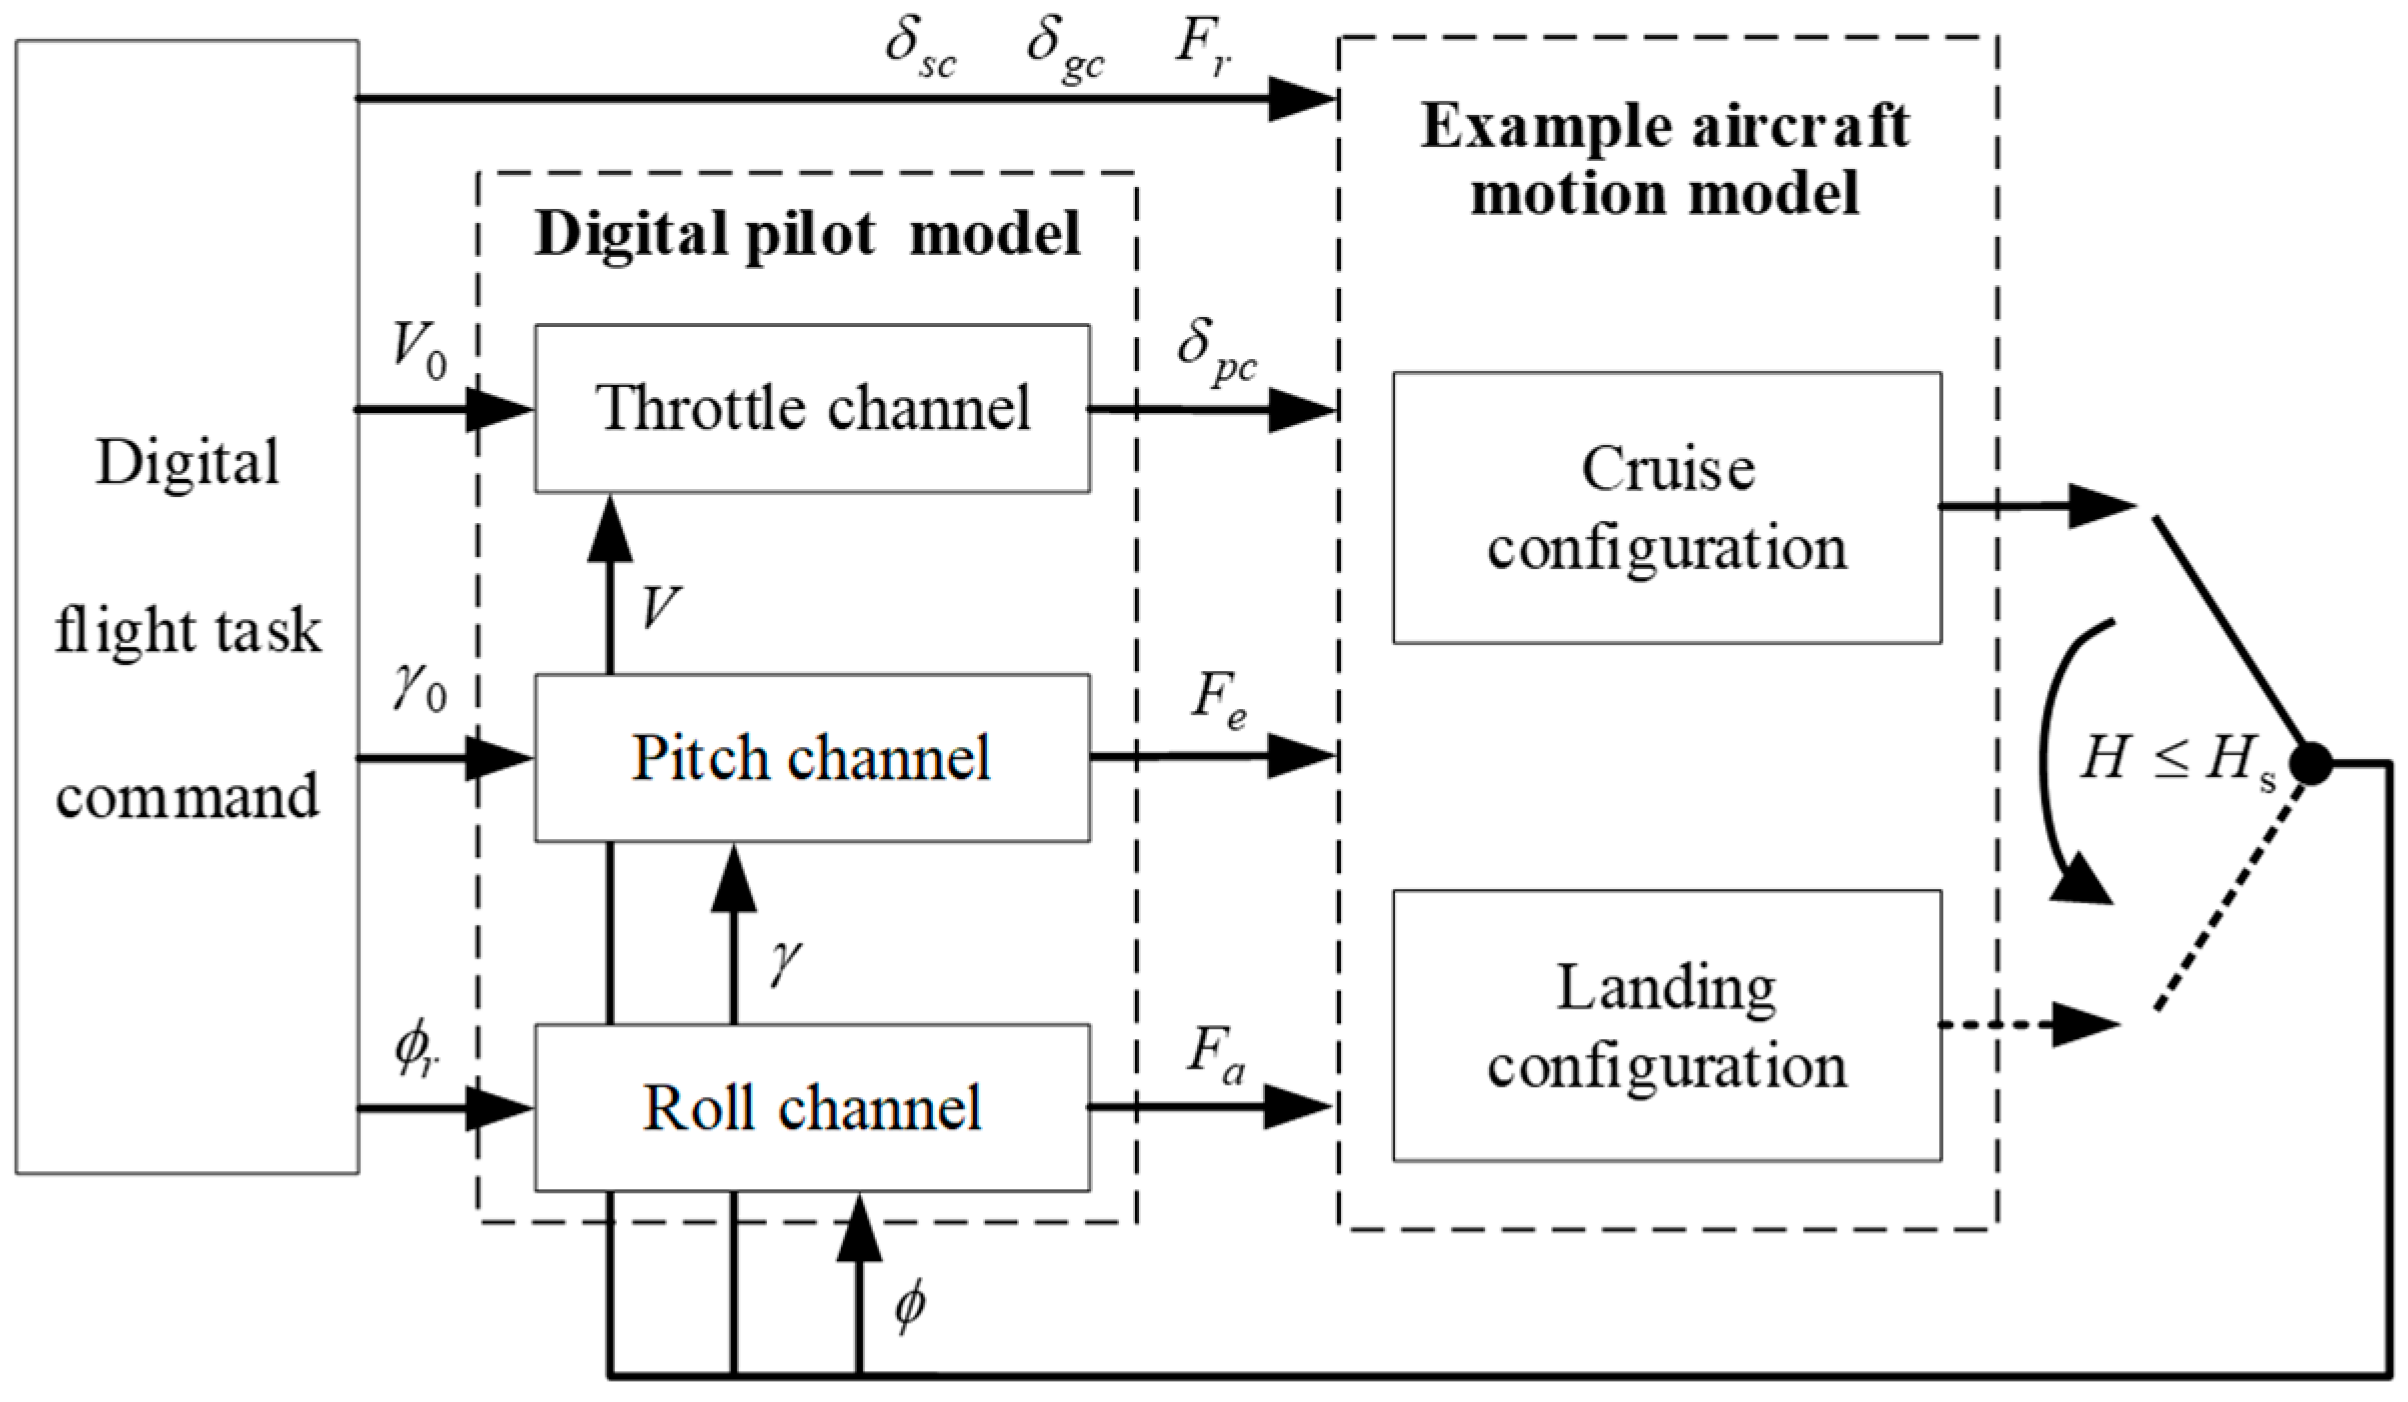
2. Digital Test of Lateral-Directional PIO Prediction Due to Landing Configuration Switching

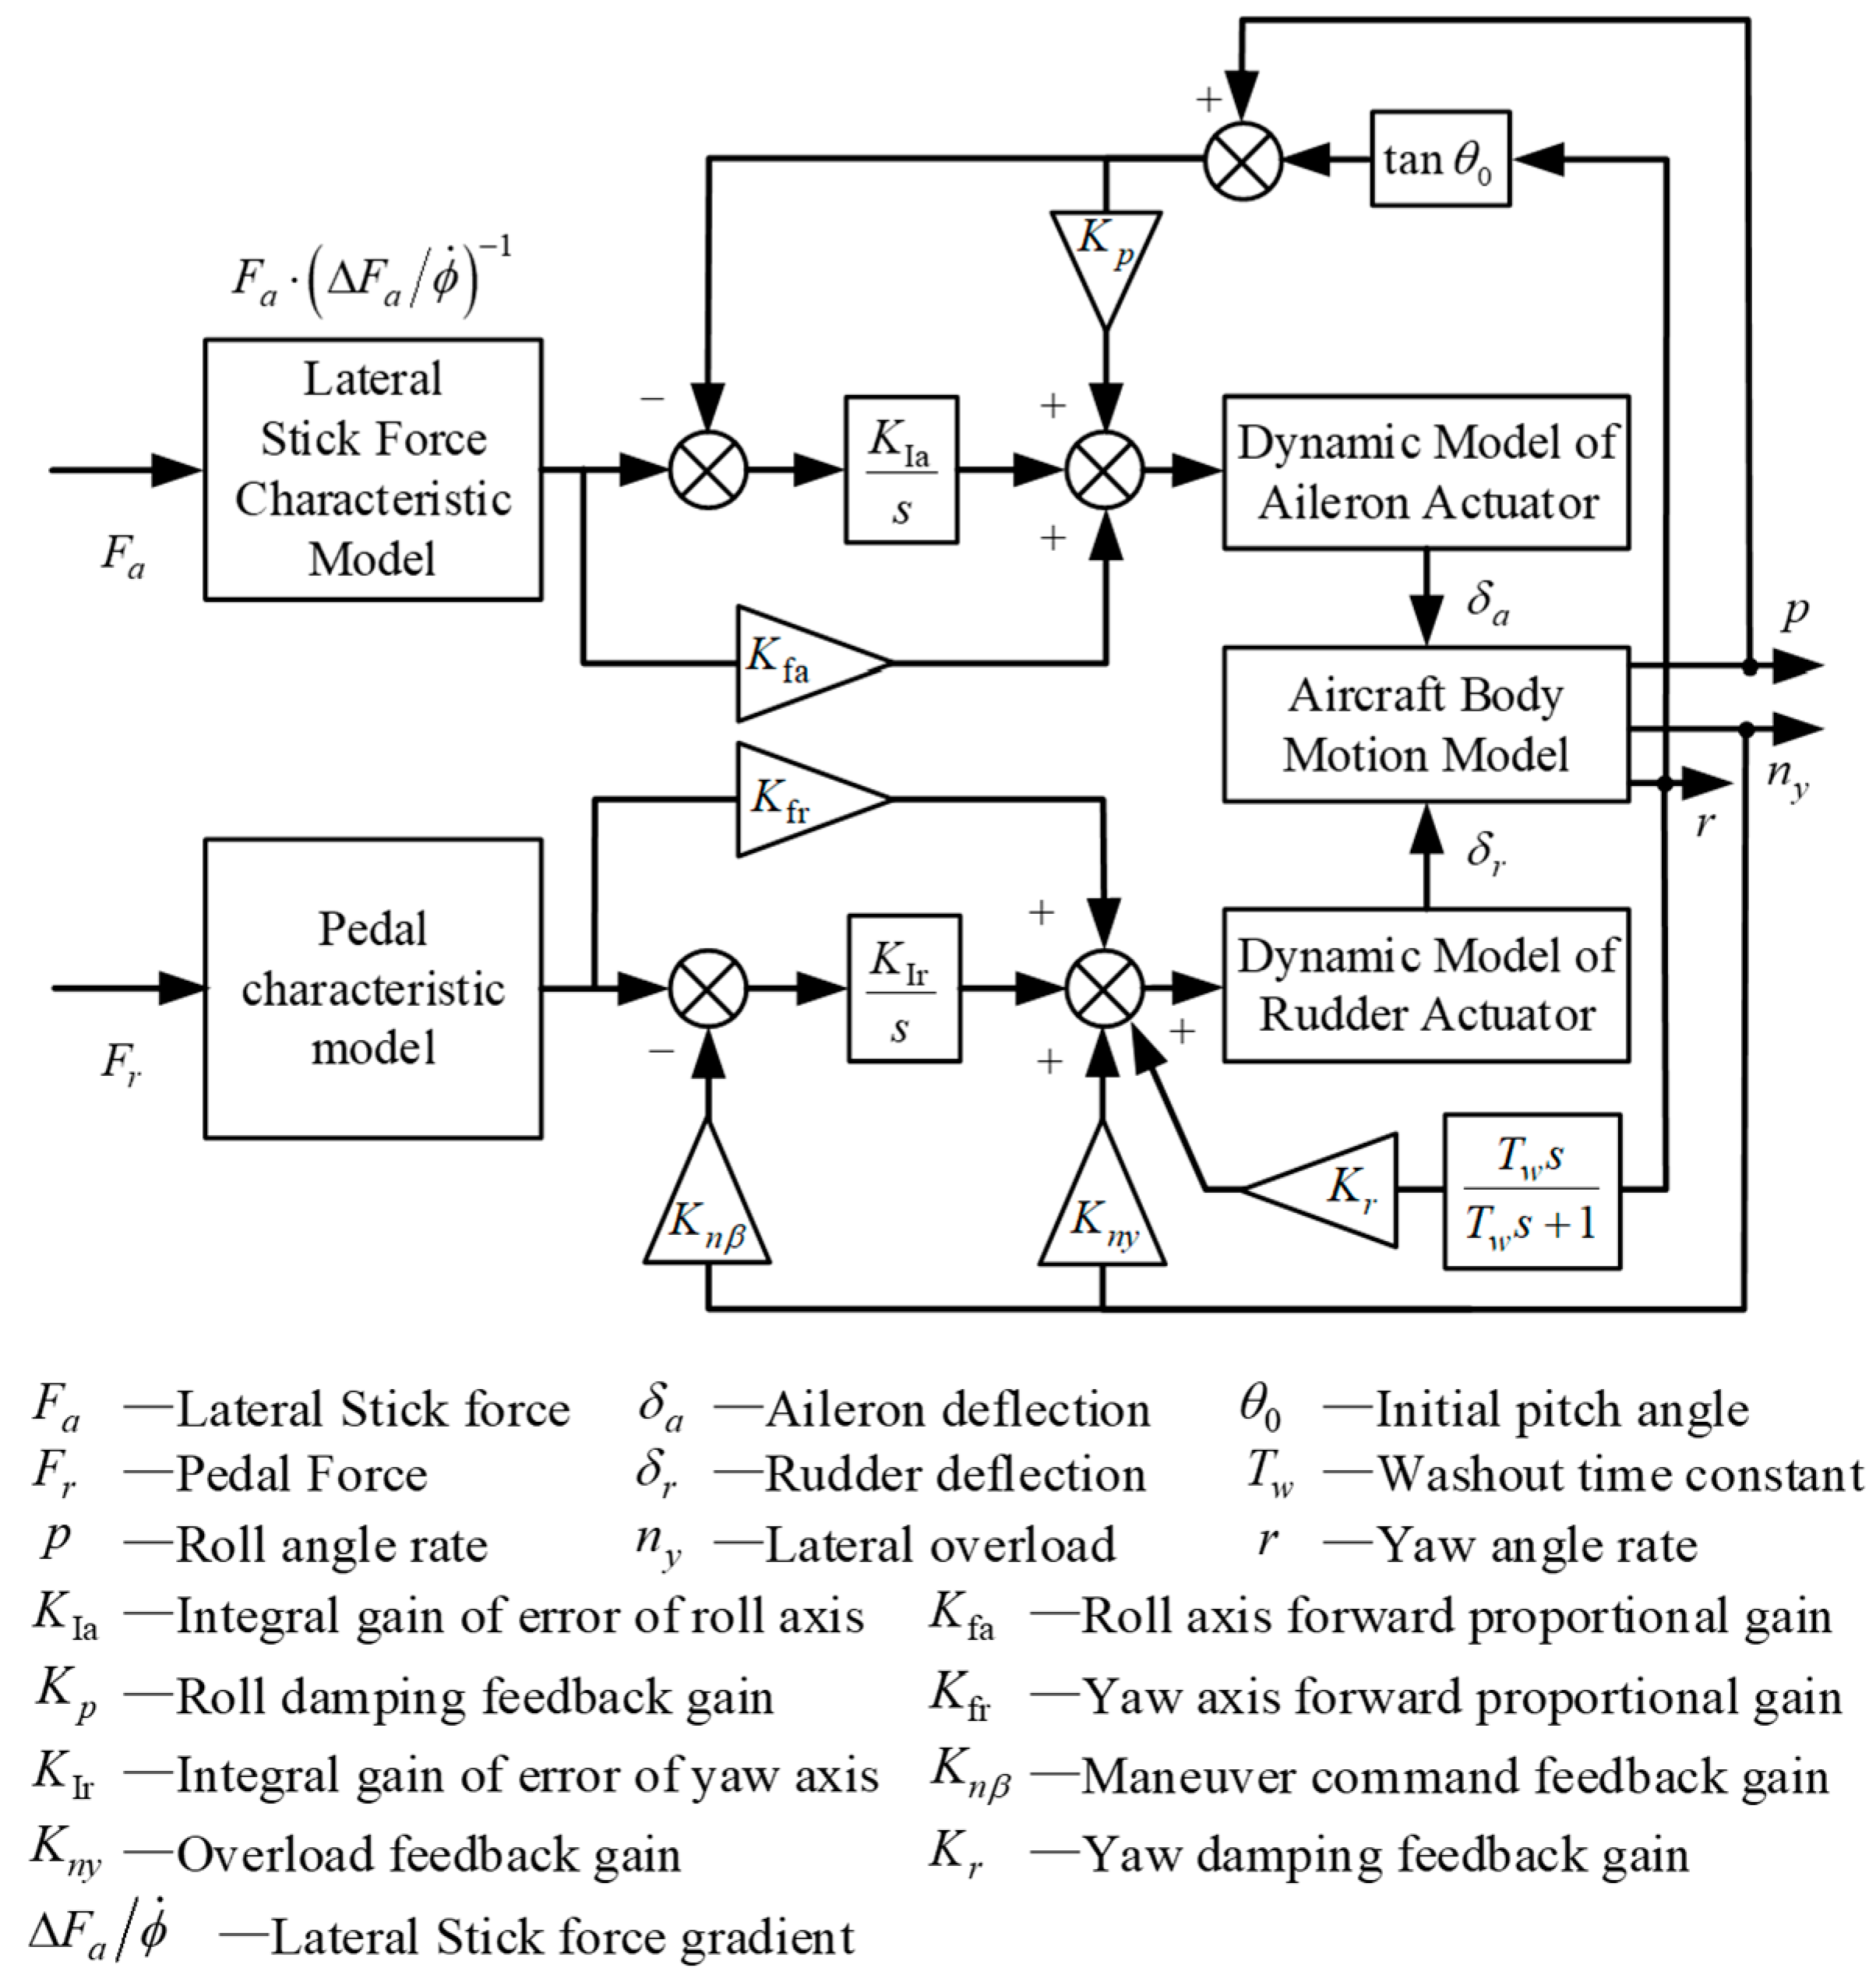
2.1. Effect of Configuration Switching on Aircraft Dynamic Characteristics

In this study, an FBW aircraft adopting a control and stability augmentation flight control law is taken as the research object. To be more consistent with the pilot’s control habits and similar to the principle of conventional aileron control to directly control the roll rate, the roll axis flight control law adopts the roll angle rate command configuration so that the pilot’s manoeuvring force directly corresponds to the roll angle rate [20]. For the yaw axis, the sideslip angle command configuration control law is adopted to obtain a lateral-directional flight control structure, as shown in Figure 1.
A first-order inertial element, 1/(τacts + 1), is used to describe the control surface actuator dynamic model shown in Figure 1. According to the flight control law design scheme of an Airbus A320, the longitudinal flight control law of the example aircraft was selected as a C* command configuration [21] so that the pilot can stably control the pitch attitude and the longitudinal flight trajectory of the aircraft during a low-speed approach.
The roll damping moment of large civil aircraft is mainly generated by the wing. If the aircraft rolls right (positive) at roll angle speed p, the local angle of attack of the right wing increases, and the lift increases, and vice versa for the left. Asymmetrical lift creates a rolling moment to the left, impeding the aircraft roll. After switching to the landing configuration, the flaps are deflected downwards, and the wing lift line slope increases. At this time, the lift generated by the local angle of attack increment increases, so the generated rolling torque to the left also increases; that is, the roll damping increases, the roll time constant TR decreases and the aircraft roll handling response convergence rate accelerates [5].
In addition, large civil aircraft lateral static stability is mainly produced by the sweepback angle, dihedral angle and vertical tail. According to Ref. [5], the absolute values of the lateral static stability derivatives generated by the sweepback angle (χ > 0°) and dihedral angle (ψ > 0°), |C,χ| and |C,ψ|, are both proportional to the lift line slope C. When the flaps are down, the air foil camber increases, the lift line slope C increases, the absolute values of derivatives C,χ and C,ψ increase and the lateral static stability increases. As the ratio of the lateral to directional stability derivatives |C/C| increases, the Dutch roll mode oscillation intensifies, the Dutch roll frequency of the aircraft increases and the damping ratio decreases [4,5].
In conclusion, the dynamic characteristics of an aircraft body change after the landing configuration switch, leading to the closed-loop dynamic characteristics deviating from the design point. In addition, the closed-loop dynamic characteristic requirements in the cruise and landing stages are not completely consistent. In the approach and landing stage, the aircraft attitude response must be faster, and the flight path must be tracked more accurately [20]. Therefore, it is necessary to reasonably adjust the landing configuration flight control law parameters so that the closed-loop aircraft after configuration switching can meet the flying qualities requirements during landing; that is, it has a faster attitude response rate and can better complete the approach and landing task.
To meet the flying qualities requirements in the landing phase, the equivalent roll time constant TR of closed-loop aircraft needs to decrease, the roll response rate increases after adjusting the landing configuration control law parameters and the amplitude of closed-loop aircraft response to high-frequency control input increases. If the pilot still adopts the cruise configuration aircraft manipulation behaviour, that is, adopts a large manipulation amplitude to track the high-frequency roll attitude command, then a large overshoot will occur. The nonlinear pilot-induced oscillation phenomenon (Category III PIO) may be induced due to the pilot’s difficulty in adapting to the closed-loop aircraft dynamic characteristics of the landing configuration in time.
In addition, if the equivalent Dutch roll damping ratio ξd of the closed-loop aircraft is greatly reduced after switching, the convergence rate of the Dutch roll mode motion will be slow, which may also have adverse effects on the completion of the roll tracking task.

2.2. Test Task and State Determination

To predict the lateral-directional PIO trend, the roll attitude tracking task is selected as the flight task in the PIO prediction digital test by referring to AC25-7B [9]. When the mathematical simulation begins, the digital pilot controls the aircraft tracking roll angle command ϕr by applying lateral stick force Fa. Meanwhile, the sideslip angle is eliminated automatically by the directional flight control law. According to the tracking command designed in Ref. [17], roll angle command ϕr is generated by adding 14 sinusoidal signals with different amplitudes and frequencies, denoted as ϕr = ∑iAisin(ωit). The values of each sinusoidal frequency ωi are shown in Table 1. Since the roll angle of civil aircraft in the approach stage should not exceed 5° [22], the amplitude Ai corresponding to frequency ωi in Ref. [17] is scaled down to make the maximum amplitude of the sinusoidal signal superimposed to 5°, and the amplitude Ai is shown in Table 1.
To simulate the approach process, the longitudinal flight task in the digital test is as follows: by manipulating the joystick and throttle lever, the pilot controls the aircraft to glide steadily at an initial speed of V0 = 90 m/s and initial flight path angle of γ0 = −3°. The initial altitude of the aircraft is set to 2050 m in the digital test. At the switching altitude Hs = 1800 m, the flaps are lowered to complete the switch to the landing configuration. To evaluate whether the PIO phenomenon occurs after a configuration change, the aircraft glides steadily for a period. When the altitude drops to 1500 m, the flight mission is terminated.
Combining the digital flight task command, aircraft motion model (including landing configuration switching) and digital pilot control model, a digital virtual flight simulation calculation model for landing configuration switching is developed, as shown in Figure 2.
In Figure 2, the roll channel adopts the time-varying adaptive digital pilot model proposed in Ref. [17] to simulate the adaptive tracking behaviour of real human pilots to roll angle commands. After aircraft configuration switching, the model can also automatically adjust the pilot model parameters according to the changes in the aircraft dynamic characteristics and simulate the pilot adaptive manipulation behaviour to ensure the correctness of the predicted results. To realize the stable glide of the aircraft, the throttle channel and pitch channel digital pilot manipulation model in Figure 2 adopts a time-invariant Zaal’s pilot model [23] and calculates the throttle command and longitudinal stick force according to the airspeed and flight path angle of the aircraft, respectively.
Then, according to the nonlinear PIO prediction method based on digital virtual flight simulation calculation proposed in Ref. [17], mathematical simulation calculation of flight tasks is completed using the digital virtual flight simulation model for landing configuration switching. To quantitatively evaluate the nonlinear PIO trend according to the model simulation results, the PIO evaluation index EPIO based on the fuzzy logic algorithm is calculated according to Ref. [17]. In this paper, the maximum value of EPIO during the whole flight task is defined as the PIO prediction result RPIO. If the value of RPIO exceeds 0.5, it is considered that PIO may occur after the aircraft landing configuration switch; otherwise, oscillation does not occur.
Finally, the roll mode time constant TR, Dutch roll natural frequency ωd and damping ratio ξd, roll phase equivalent time delay τp and rolling attitude bandwidth ωBW of the low-order equivalent model of the high-order closed-loop aircraft were selected to characterize the dynamic characteristics and handling response characteristics of the closed-loop aircraft. By adjusting the control law gains KIa, Kfa, Kp, KIr, Kfr, Kny and Kr of cruise and landing configurations respectively, changing the values of TR, ξd, ωd, ωBW and other parameters, the handling response characteristics of closed-loop aircraft before and after switching are different in the set test case. Therefore, it is convenient to carry out the study on the influence of closed-loop aircraft dynamic difference on PIO characteristics before and after switching. Considering that an aircraft needs to have faster attitude response characteristics in the landing stage to achieve accurate tracking of the flight trajectory, the rolling attitude bandwidth of the closed-loop aircraft landing configuration is set to be greater than the cruise configuration bandwidth in the same group of test cases.
In addition, the research results in Ref. [17] show that too large a difference in the stick force gradient before and after switching may also induce nonlinear PIO. In this study, the lateral stick force gradient ΔFa/ ϕ ˙ for cruise and landing configurations is adjusted, and the difference in the stick force gradient before and after switching is changed. In summary, a total of 50 test cases were established in this study to simulate the difference in closed-loop aircraft dynamic characteristics before and after switching, as shown in Table A1.
To ensure that the test case is not prone to the Category I PIO phenomenon and avoid interfering with the predicted Category III PIO results, the flying qualities of the aircraft roll axis in the landing configuration should meet the attitude bandwidth criteria of civil aircraft in the C flight stage [24]. In the 50 test cases, the bandwidth criteria evaluation results for the closed-loop aircraft in the landing configuration are shown in Figure 3. Notably, the bandwidth criteria evaluation results for some different test cases in Figure 3 are the same. For example, the roll attitude bandwidth ωBW and delay τp of landing configurations F21–F25 in the test cases are consistent.
In the bandwidth criteria evaluation, if the flying qualities were evaluated as Level 3, the risk of Category I PIO was considered [24]. The landing configurations of the 50 test cases in Figure 3 all meet the Level 1 or 2 quality requirements of the bandwidth criterion, indicating that the test case set is not prone to the occurrence of the Category I PIO phenomenon and meets the requirements of the predicted test.
For each test case, the Category III PIO characteristic prediction method based on the digital virtual flight simulation is adopted to obtain the PIO prediction result RPIO, which is shown in the last column of Table A1.

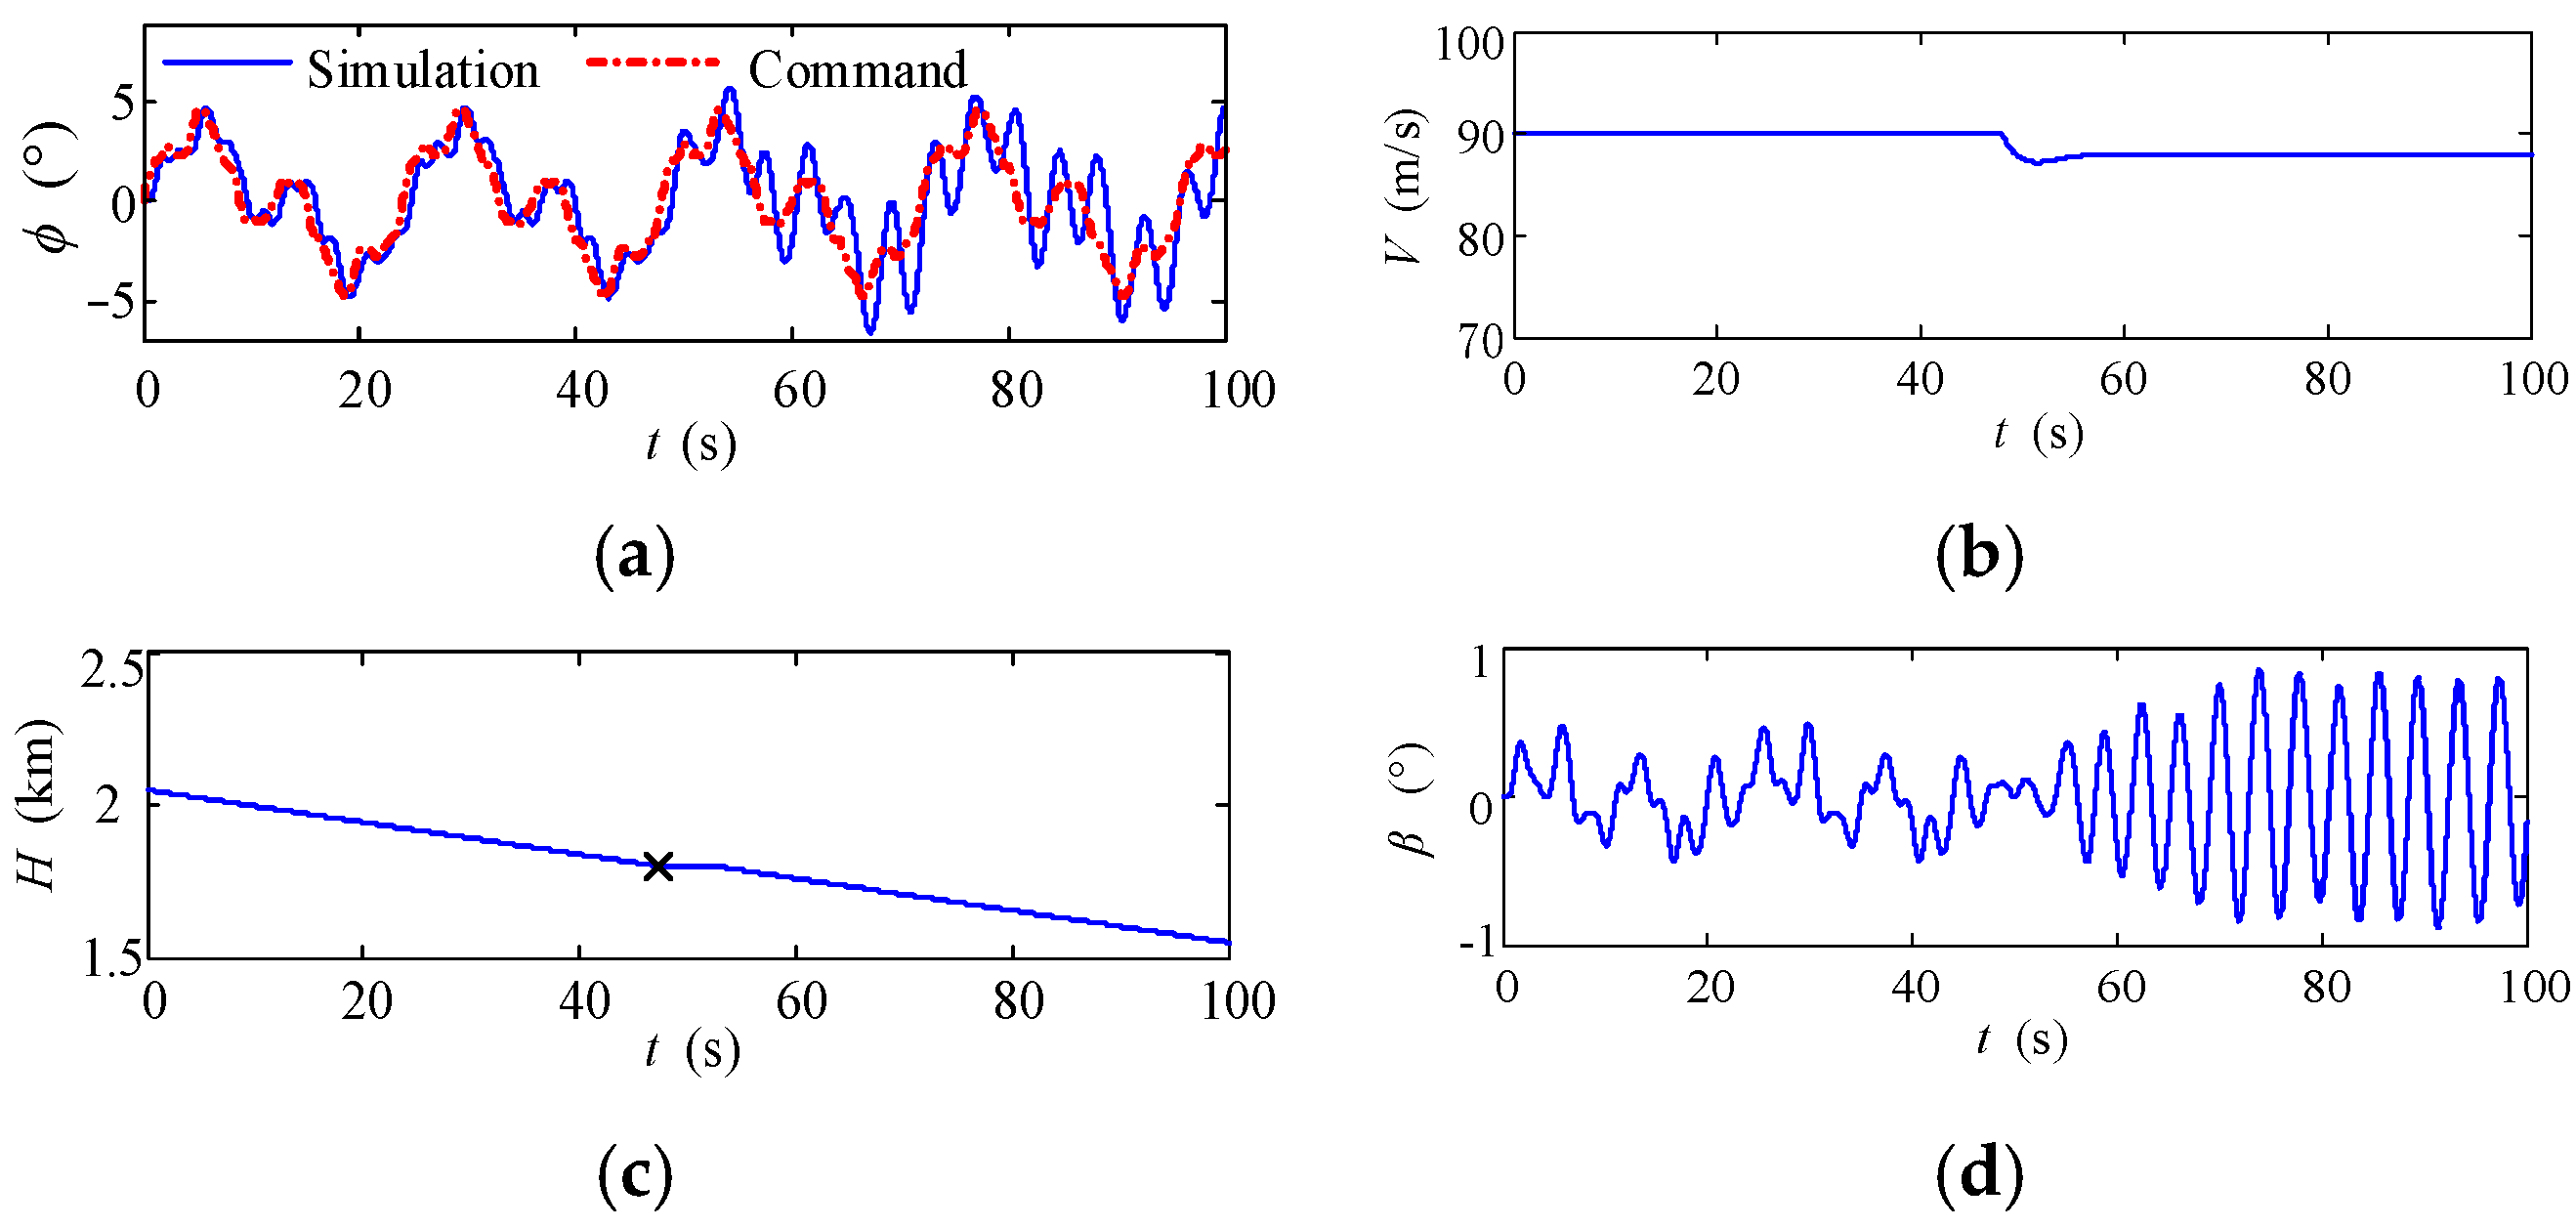
2.3. Digital Test Example

In this study, a certain type of FBW aircraft is taken as an example to establish an aircraft body motion mathematical model [4]. Due to technical confidentiality issues, the specific values of the data related to the example aircraft are not given.
Taking test case F17 as an example, the lateral-directional control law parameters and stick force gradient ΔFa/ ϕ ˙ for cruise and landing configurations are given in Table 2.
To study the effect of the closed-loop aircraft dynamic characteristics on the PIO characteristics, the low-order equivalent model parameters that can represent the high-order closed-loop aircraft dynamic characteristics are calculated through the low-order equivalent fitting of the aircraft’s lateral-directional. where the equivalent system model is [20]
ϕ ( s ) F a ( s ) = K ϕ ( s 2 + 2 ξ ϕ ω ϕ s + ω ϕ 2 ) ( s + 1 / T R ) ( s + 1 / T s ) ( s 2 + 2 ξ d ω d s + ω d 2 ) e τ e ϕ s β ( s ) F r ( s ) = K β ( 1 + 1 / T β 1 ) ( 1 + 1 / T β 2 ) ( 1 + 1 / T β 3 ) ( s + 1 / T R ) ( s + 1 / T s ) ( s 2 + 2 ξ d ω d s + ω d 2 ) e τ e β s ,
where K(·) is the equivalent transfer function gain; τ(·) is the equivalent delay time of the transfer function; ωd and ξd are the natural frequency and damping ratio of the Dutch roll, respectively; ωϕ and ξϕ are the equivalent molecular natural frequency and damping ratio of the roll axis, respectively; Tβ1, Tβ2 and Tβ3 are the equivalent molecular time constants of the yaw axis; TR is the roll time constant and Ts is the spiral mode time constant.
A Bode diagram of the instantaneous transfer function ϕ(s)/Fa(s) is drawn based on the lower-order equivalent system of the aircraft before and after the switch, as shown in Figure 4.
Taking the landing configuration in Figure 4 as an example, the frequency ω180 is 15.9 rad/s when the phase angle is −180°; ω180 corresponds to an amplitude of −72.8 dB, and, based on this, 6 dB is added, and the frequency ωBW,gain corresponding to an amplitude of −66.8 dB is 11.2 rad/s. Figure 4 shows that, when the phase angle is −135°, the corresponding frequency ωBW,phase is 2.45 rad/s. According to the bandwidth criterion [25], the roll attitude bandwidth ωBW is the smaller of ωBW,gain and ωBW,phase, so, in this example, ωBW is 2.45 rad/s. In addition, the frequency 2ω180 in Figure 4 has a phase of ϕ2ω180 = −193°, so τp = 0.008 s based on the formula for the phase equivalent time delay, τp = −(180 + ϕ2ω180)/(2ω180 × 57.3) [25]. In summary, the lateral-directional low-order equivalent model parameters and bandwidth criterion parameters of the closed-loop aircraft are shown in Table 3.
In Table 3, TR and ωBW can represent the phase lag and response delay of the closed-loop aircraft roll mode response. ωd and ξd represent the oscillation period and decay rate of the closed-loop aircraft Dutch roll mode. The natural frequency ratio ωϕ/ωd can characterize the Dutch roll motion effect on the aircraft roll manipulation response [26]. Considering that the response of the roll mode is fast and the oscillation period of the Dutch roll mode is short, these two modes are the main lateral-directional modes of civil aircraft, and the frequency is similar to that of the pilot’s tracking manoeuvring; the modal characteristics have a great influence on the pilot-aircraft coupling phenomenon. Thus, in this paper, only the low-order equivalent model parameters related to these two modes are selected to characterize the lateral-directional motion characteristics of closed-loop aircraft.
By comparing Table 2 and Table 3, it can be seen that, in test case F17, the roll time constant TR of the closed-loop landing configuration aircraft is reduced, and the roll attitude bandwidth ωBW is increased by increasing the roll damping feedback gain Kp after the configuration switching so that the phase lag and response delay of the aircraft roll handling response are reduced. By reducing the yaw damping feedback gain Kr and increasing the overload feedback gain Kny, the Dutch roll frequency ωd of closed-loop aircraft increases and the Dutch roll damping ξd decreases, which increases the influence of aircraft roll manoeuvrability on the Dutch roll motion response. By reducing the lateral stick force gradient ΔFa/ ϕ ˙ , the stick force gradient of the closed-loop aircraft after configuration switching is reduced, and the manipulation sensitivity is increased, which can simulate the possible dynamic characteristics of the closed-loop aircraft before and after the landing configuration change.
The aircraft roll angle command and response, airspeed, altitude above ground level (AGL), sideslip angle, roll angular velocity, lateral stick force, aileron deflection and PIO evaluation index EPIO simulation results during the whole task are shown in Figure 5a–h.
In the simulation process between 0 and 48 s, the aircraft glided steadily and could complete the roll attitude tracking task well, as shown in Figure 5a. The PIO evaluation index in Figure 5h is less than 0.5, indicating that no lateral-directional PIO phenomenon occurs before the configuration switch.
As shown in Figure 5c, at 48 s, the aircraft descended to 1800 m AGL altitude and switched from the cruise configuration to the landing configuration. Due to lowering the flaps, the lift and drag of the whole aircraft increased instantaneously, the flight path inclination increased and the speed decreased slightly. By manipulating the joystick and throttle lever, the digital pilot gradually restored the longitudinal motion state of the aircraft to stability, as shown in Figure 5b,c. After configuration switching, the roll angle and sideslip angle of the aircraft shown in Figure 5a,d–f oscillate greatly, the amplitude of the roll angular velocity is more than 12 °/s and the amplitude of the lateral stick force is more than 25 N. In Figure 5h, the PIO evaluation index exceeds 0.5 at 50 s, and the lateral-directional PIO phenomenon is induced by the landing configuration switch. At 58 s, the PIO evaluation index EPIO reaches the maximum value of 0.8, so the PIO predicted result is RPIO = 0.8.

3. Characteristic Parameters of Lateral-Directional PIO Due to Landing Configuration Switch

3.1. Instantaneous Amplitude–Frequency Response Peak of Pilot–Vehicle Closed-Loop at Switching

Closed-loop pilot manipulation is a necessary PIO condition [20]. At this time, the pilot and aircraft form a closed-loop pilot–vehicle system (CL-PVS), as shown in Figure 6a. The pilot controls the aircraft by feeling the aircraft’s motion response and makes the motion response meet the command requirements. By disconnecting the CL-PVS feedback loop, the open-loop pilot–vehicle system (OL-PVS) shown in Figure 6b can be obtained.
According to the principle of automatic control, the amplitude–frequency response peak of the CL-PVS can represent its damping characteristics [27]. The larger the peak is, the smaller the damping. Based on this, the Neal–Smith criterion is proposed in Ref. [20]. A CL-PVS model is established by introducing a pilot control model, and the amplitude–frequency response peak of the CL-PVS is taken as the criterion parameter for evaluating the PIO characteristics. Under the premise that the CL-PVS meets the stability, if the peak value is too large, the CL-PVS will react strongly to a certain frequency command and have a tendency to resonate, resulting in large aircraft motion response overshoot during tracking, making it prone to the PIO phenomenon.
However, the Neal–Smith criterion can only predict Category I PIO when the dynamic characteristics of the aircraft are constant, and the criterion does not apply to Category III PIO when the dynamic characteristics of an aircraft change. Therefore, a pilot control model Yp suitable for cruise configuration aircraft is first established in this study. Considering that, when closed-loop aircraft motion response characteristics change, it is difficult for pilots to quickly adjust their manipulating behaviours, and the original manipulating behaviours remain unchanged at the switching instant [17], this study combined the pilot control model Yp during cruise and the aircraft motion model in the landing configuration to establish a CL-PVS of aircraft configuration switching instant. The coupling characteristics of pilot control and aircraft motion during switching are described. Finally, the maximum peak Mp is calculated according to the amplitude–frequency response curve of the CL-PVS at the switching instant. If Mp is large, the control behaviour taken by the pilot during cruise does not match the motion response characteristics of the aircraft in the landing configuration, resulting in small CL-PVS damping at the switching instant, large aircraft motion response overshoot when the closed-loop tracking task is completed and a PIO is prone to occur.
The following takes test case F17 as an example to illustrate the amplitude–frequency response peak Mp calculation of the CL-PVS at the switching instant:
  • According to Ref. [17], Zaal’s pilot model is selected to establish the CL-PVS, whose transfer function is as follows [23]:
    Y p s = K p · T l s + 1 · G n · e s τ v ,
    where e s τ v and Gn both represent the limiting characteristics of the pilot’s manipulation ability. e s τ v represents the pilot response delay, and the delay time τv is generally 0.3 s. Gn is a simplified expression of a pilot’s neuromotor limb dynamics model, mathematically described as a second-order oscillation element with natural frequency ωn equal to 10 rad/s and damping ratio ξn equal to 0.707:
    G n = 10 2 s 2 + 2 × 0.707 × 10 s + 10 2 ,
  • Considering only roll damping, the aircraft’s roll motion response in Equation (1) is simplified to the first-order inertial element Kϕ/(s + 1/TR). To compensate for the response lag generated by the first-order inertial element, the lead time parameter Tl in the pilot control model in Equation (3) can be taken as the roll time constant TR1 of the cruise configuration aircraft, namely:
    Tl = TR1 = 0.67 s,
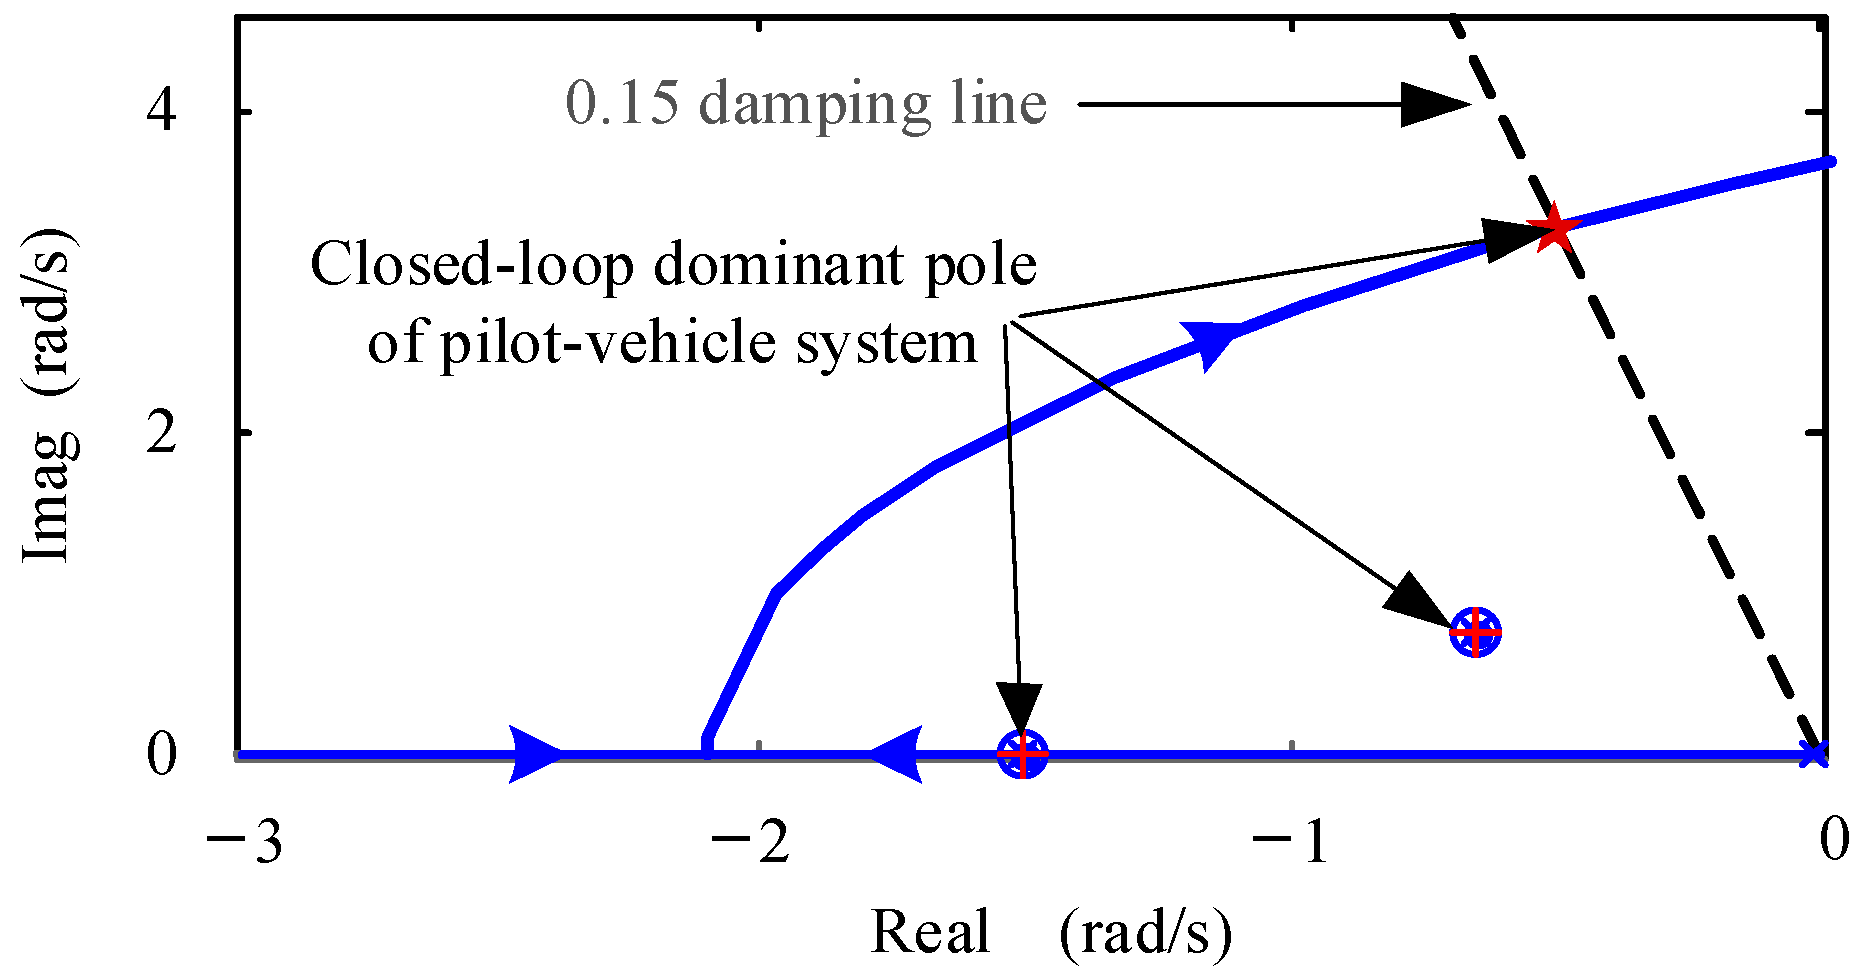
  • The root locus plot of the CL-PVS during cruising is shown in Figure 7. According to Ref. [28], to limit the overshoot in the tracking task, the damping ratio of the leading pole of the CL-PVS should be 0.15. To this end, the pilot’s control gain is adjusted to Kp = 3.39 N/rad to meet the requirement of a 0.15 damping ratio of the CL-PVS.
  • According to the principle of automatic control [27], the OL-PVS shown in Figure 6b can be used to evaluate the stability of the CL-PVS. The frequency of the OL-PVS with an amplitude of 0 dB is called the crossing frequency ωc. If the corresponding phase lag at ωc is close to or greater than 180°, the CL-PVS is unstable and prone to the PIO phenomenon. Therefore, to ensure that the CL-PVS has sufficient stability and is not prone to Category I or II PIOs, it is necessary to check the phase margin of the OL-PVS during cruise. If the phase margin is not less than 45°, the pilot’s control gain Kp in Equation (3) remains unchanged; otherwise, gradually reduce Kp until the OL-PVS has a phase margin of 45°. In test case F17, when Kp = 3.39 N/rad, the pilot–vehicle system phase margin is 22.6°, which does not meet the requirements. When Kp decreases to 2.22 N/rad, the pilot–vehicle system phase margin is exactly 45°; thus, Kp = 2.22 N/rad.
    By adjusting the pilot’s control gain Kp, the following requirements have been met during cruise flight:
    • The damping ratio of the dominant pole of the CL-PVS is no less than 0.15, and the tracking overshoot is small, meeting the requirements for the pilot’s control stability [28].
    • The OL-PVS has a 45° phase margin to ensure the stability of the CL-PVS [28].
    • The crossing frequency should be as large as possible to improve the tracking accuracy.
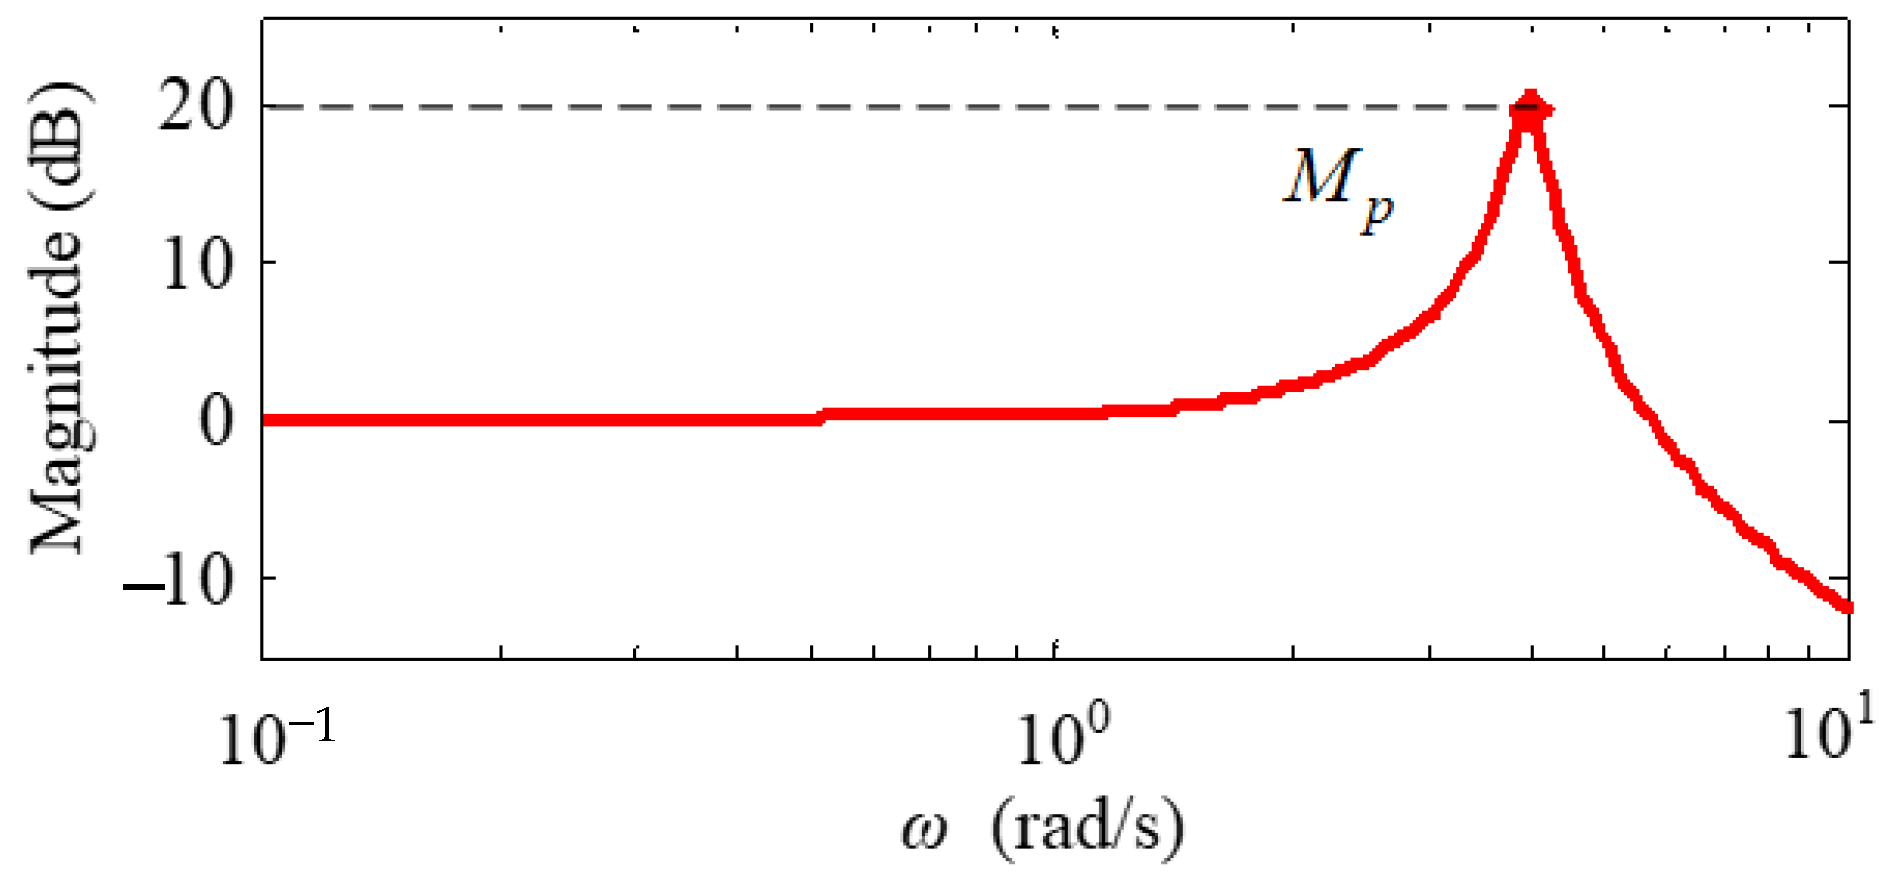
  • Finally, a CL-PVS was formed by combining the pilot control model for the cruise phase and the equivalent motion model of the aircraft roll axis in the landing configuration in Equation (3). The amplitude–frequency response curve of the CL-PVS at the landing configuration switching instant is obtained, as shown in Figure 8. The maximum peak value is Mp = 19.6 dB.

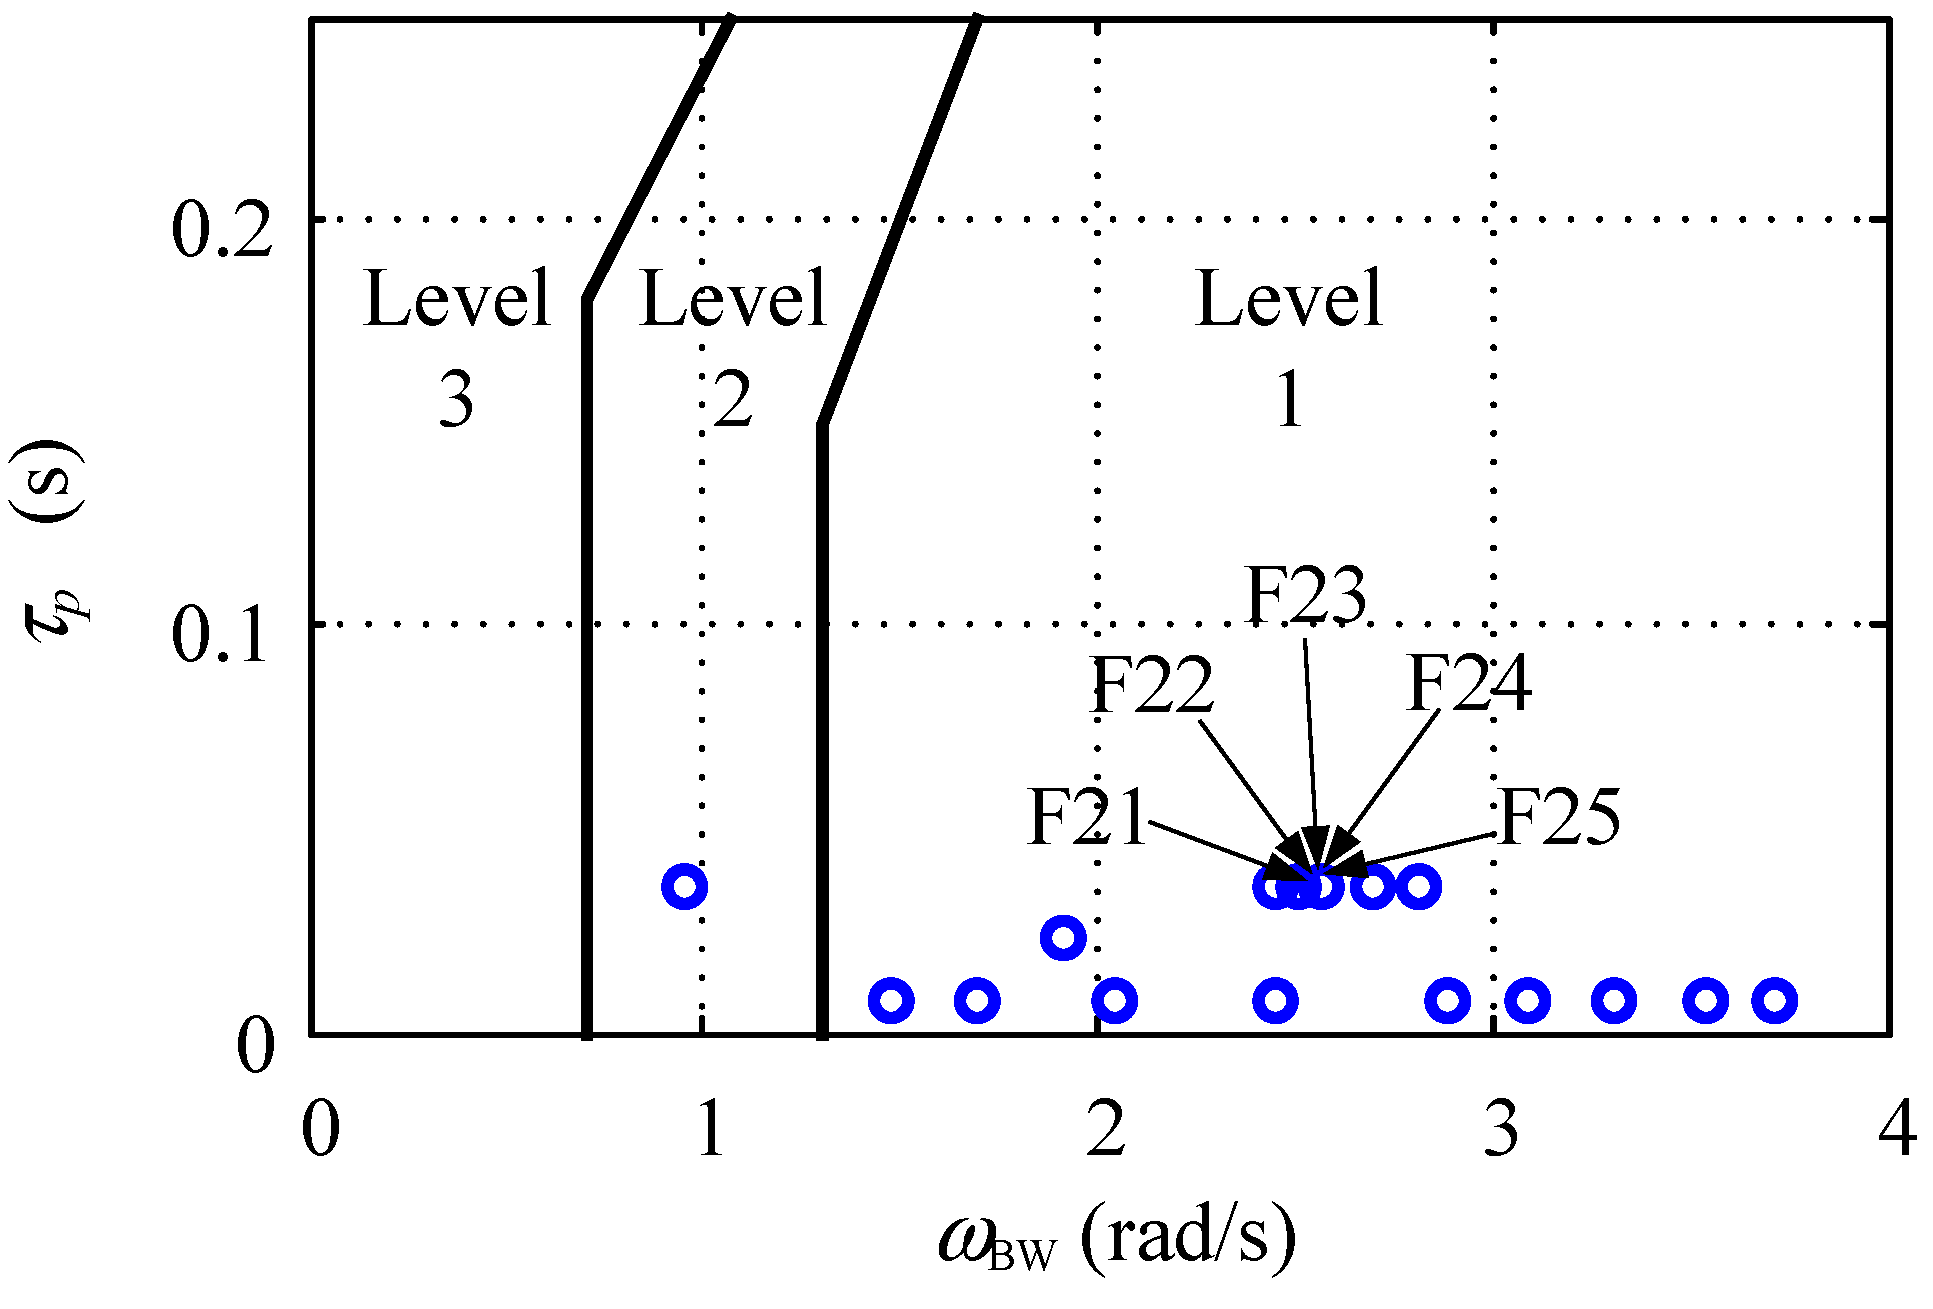
3.2. Closed-Loop Aircraft Handling Response Parameters before and after Switch

According to research on the stick force gradient in Ref. [17], manipulation sensitivity is one of the important factors inducing the nonlinear PIO phenomenon. After configuration switching, if the manipulation sensitivity of an aircraft is greatly improved, the pilot needs to quickly reduce the stick force. Otherwise, the roll attitude of the aircraft will be greatly changed, and the pilot needs to take large high-frequency manipulations to stabilize it. If the aircraft roll angle response delay corresponding to a large manipulation frequency is large, it will reduce the stability of the CL-PVS and is prone to the PIO phenomenon. Therefore, the change in roll manipulation sensitivity before and after configuration switching is selected as one of the characteristic parameters to characterize whether a nonlinear PIO is prone to occur.
Ref. [20] defines the roll manipulation sensitivity as the ratio of the roll angular velocity p to the lateral stick force Fa when the aircraft’s lateral step handling response reaches a steady state, which can be expressed by the frequency domain response amplitude of the roll angular velocity at low frequency. In this study, the low-frequency value is set to ω0 = 10−1 rad/s. In addition, since the frequency domain response of roll angle and roll angular velocity differs approximately by a linear integral element, the roll manipulation sensitivity variation can be expressed by the frequency domain response amplitude variation of the roll angle. Therefore, the difference between the amplitude–frequency response of the roll angle between the landing and cruise configurations, ΔM, at a low frequency of 10−1 rad/s is selected in this study to describe the change in the manipulation sensitivity of the roll axis after configuration switching, as shown in Figure 9. Subscript 1 on each parameter in Figure 9 represents the cruise configuration; subscript 2 represents the landing configuration.
In addition, compared with the landing configuration, the handling response rate of the aircraft in the cruise configuration is slower, and the pilot needs to carry out some advance control when tracking the high-frequency command to achieve accurate tracking of the roll attitude. After switching, if the aircraft roll response speed increases significantly, it may be difficult for the pilot to quickly change the original manipulation behaviour, and the pilot still uses a large control amplitude to track high-frequency commands, resulting in an increase in the roll response amplitude and a large overshoot, thus inducing the PIO phenomenon. Large manoeuvring may also trigger the deflection angle or speed limit of the aircraft control surface actuator, resulting in an increased closed-loop aircraft response delay and CL-PVS instability and then leading to the PIO phenomenon. As shown in test cases F14, F19, F28 and F38, the roll attitude bandwidth ωBW before and after the switch is set to increase by 1.0 rad/s, 1.4 rad/s, 1.8 rad/s and 2.2 rad/s, respectively, and the difference gradually increases. The simulation results of the roll angle response and PIO prediction index in the prediction test are shown in Figure 10.
As shown in Figure 10, no PIO phenomenon occurred in test cases F14 and F19. With the increase in the roll attitude bandwidth before and after configuration switching, the roll angle of the aircraft in test cases F28 and F38 oscillates greatly, and the maximum values of the PIO prediction index reach 0.73 and 0.98, respectively, showing the PIO phenomenon. Therefore, the reduction in roll attitude bandwidth before and after switching is also one of the sensitive parameters of lateral-directional nonlinear PIO characteristics. In this study, the ratio of the roll attitude bandwidth of the landing and cruise configurations, ωBW2/ωBW1, is used to describe the variation in the bandwidth.
Taking test case F17 as an example, the known roll attitude bandwidths of the cruise and landing configurations are ωBW1 = 1.48 rad/s and ωBW2 = 2.45 rad/s, respectively, and, thus, the ratio of the roll attitude bandwidths ωBW2/ωBW1 is 1.66. In Figure 4, on the amplitude–frequency response curves of the roll attitude for both configurations, the amplitude at the frequency ω0 = 10−1 rad/s is found to be Mϕ1 = −17.1 dB and Mϕ2 = −12.7 dB, respectively; then, the amplitude increment before and after switching can be expressed as ΔM = Mϕ2Mϕ1 = 4.4 dB.
In summary, ΔM and ωBW2/ωBW1 are selected to represent the differences in the roll axis manipulation sensitivity and rapidity of response before and after the landing configuration switch, jointly determining the changes in the closed-loop system stability. The characteristic parameters Mp, ωBW2/ωBW1 and ΔM are calculated for the 50 test cases listed in Table A1, and the calculation results are shown in Table A1.

4. Suggestions for Criteria to Evaluate Lateral-Directional PIOs Due to Landing Configuration Switch

The amplitude–frequency response peak Mp of the CL-PVS, the roll attitude bandwidth ratio ωBW2/ωBW1, the change in roll manipulation sensitivity ΔM and the corresponding PIO prediction index RPIO in Table A1 are plotted, as shown in Figure 11.
By fitting the parameters near the ‘No PIO’ region, quantitative requirements for characteristic parameters without PIO occurrence can be obtained, as shown in the dotted boundary in Figure 11, including requirements for the values of Mp, ωBW2/ωBW1, ΔM and their combinations.

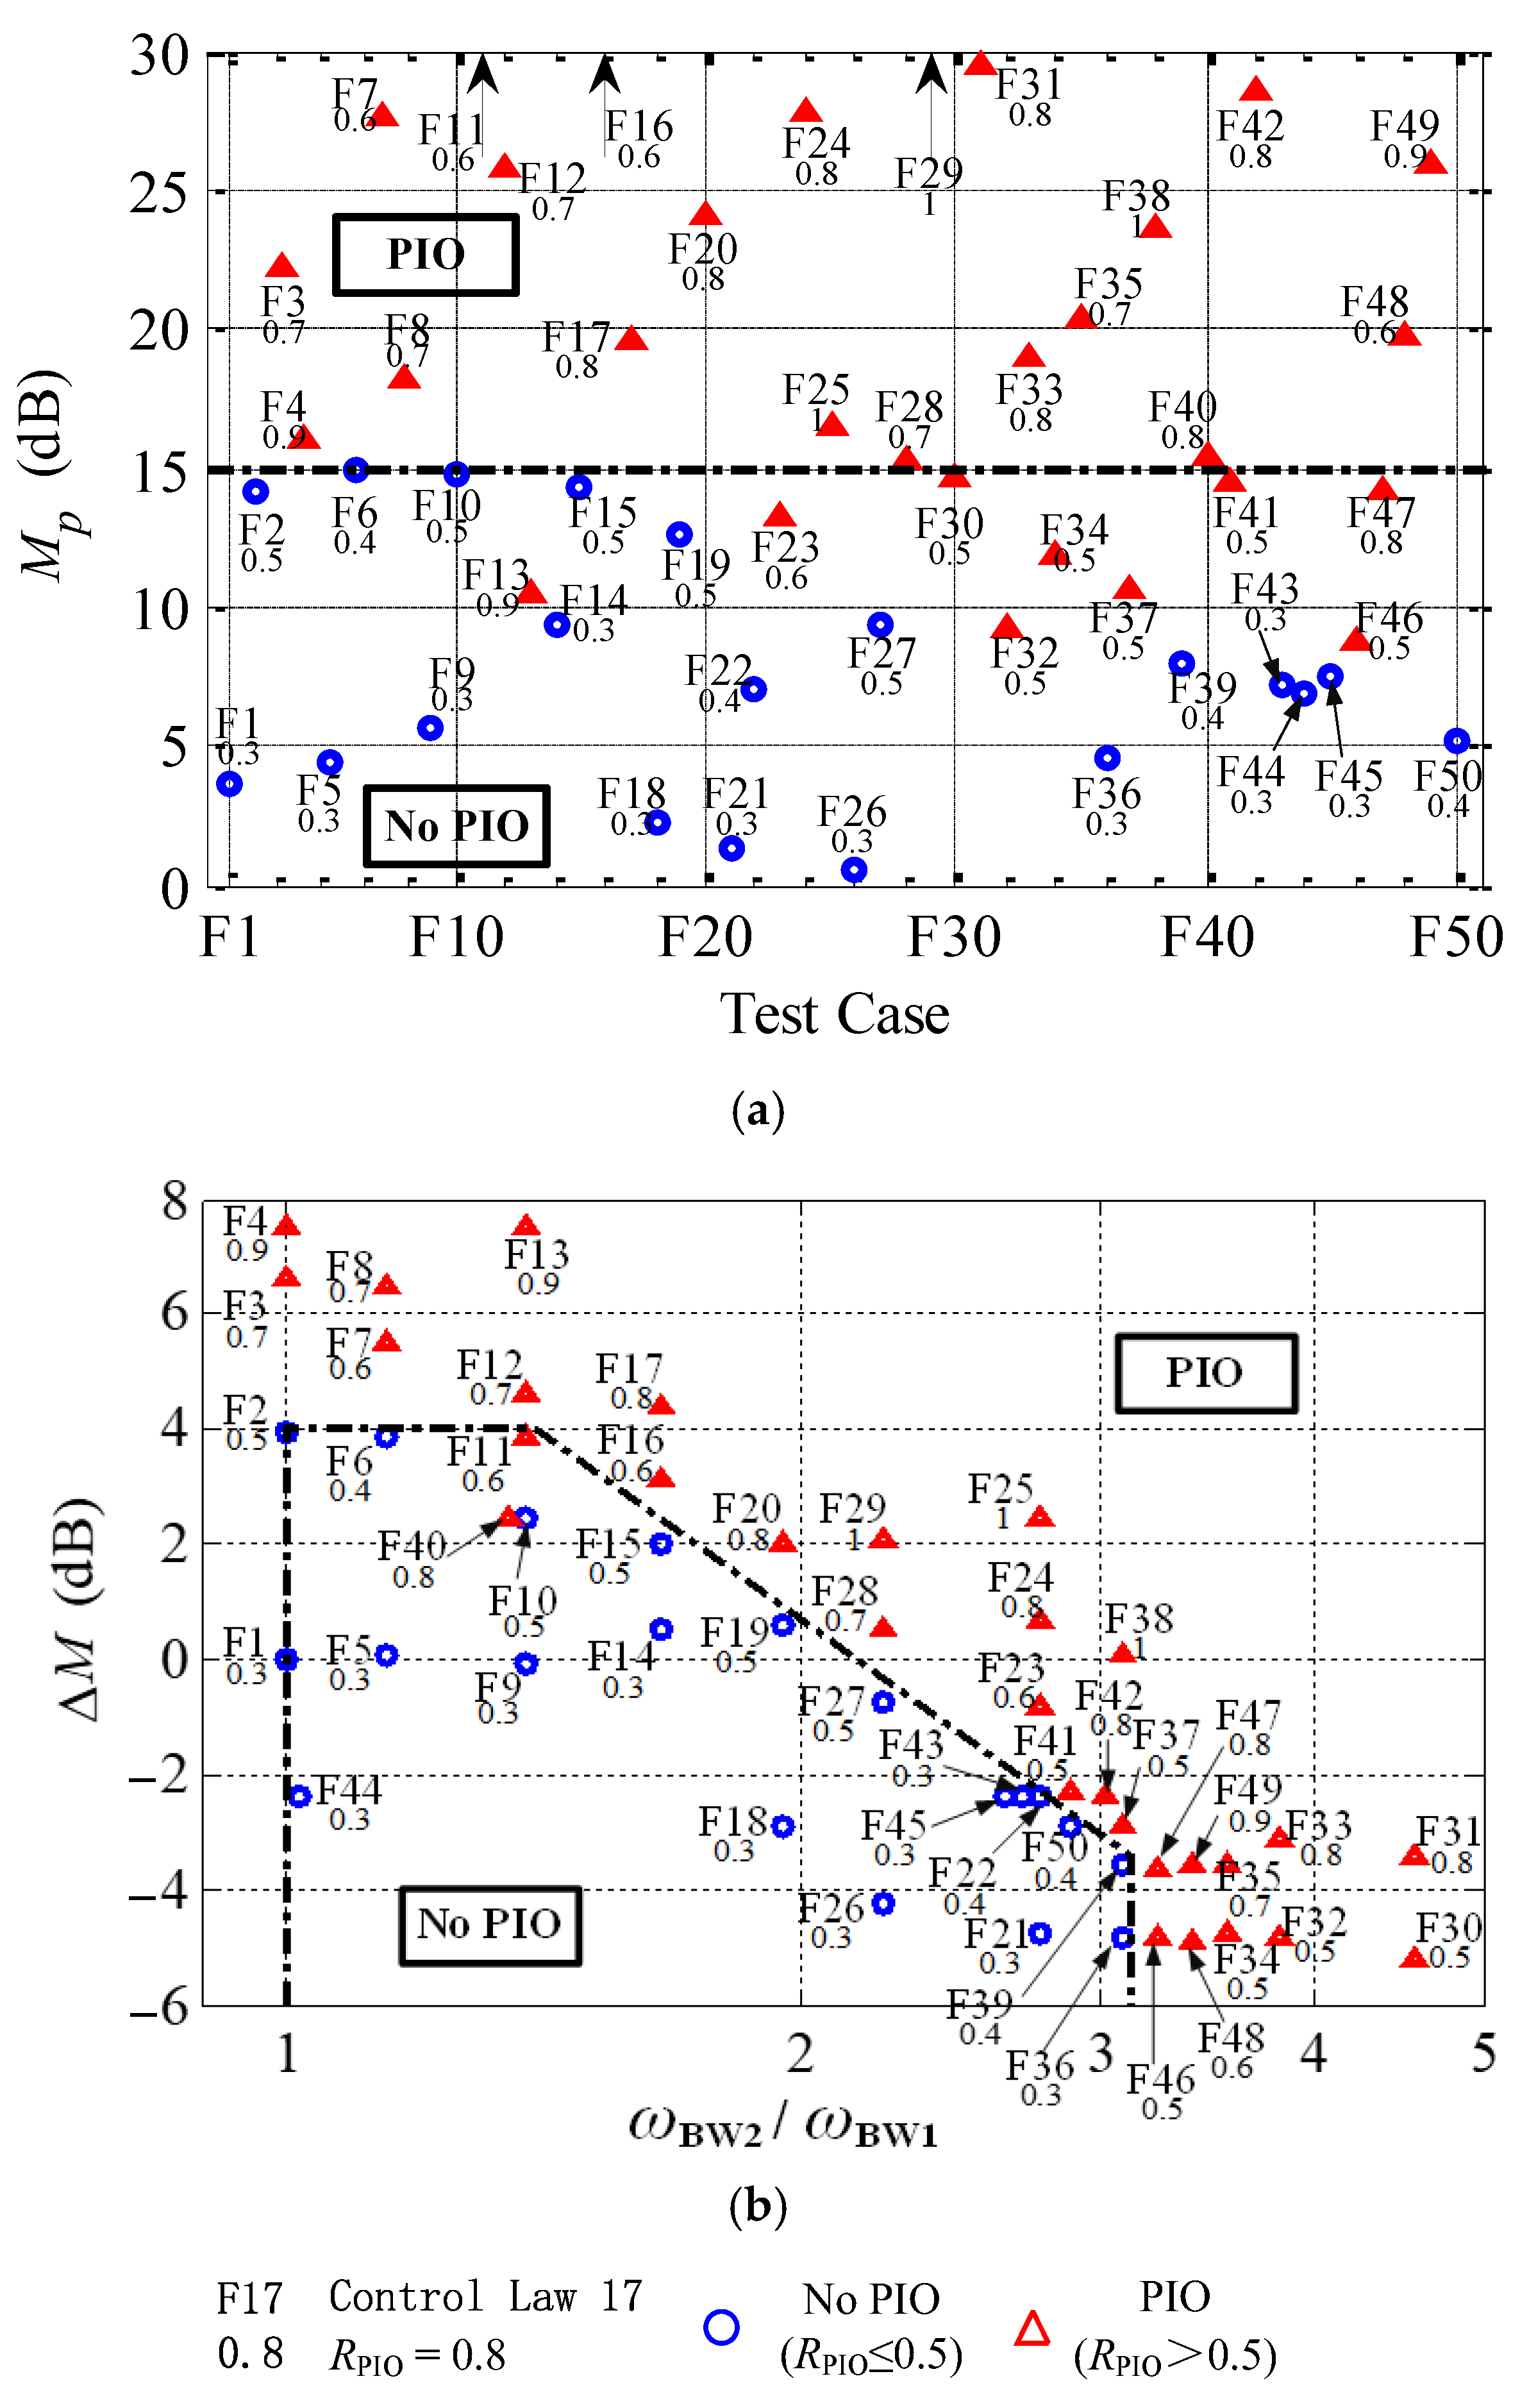
4.1. Requirements for Mp
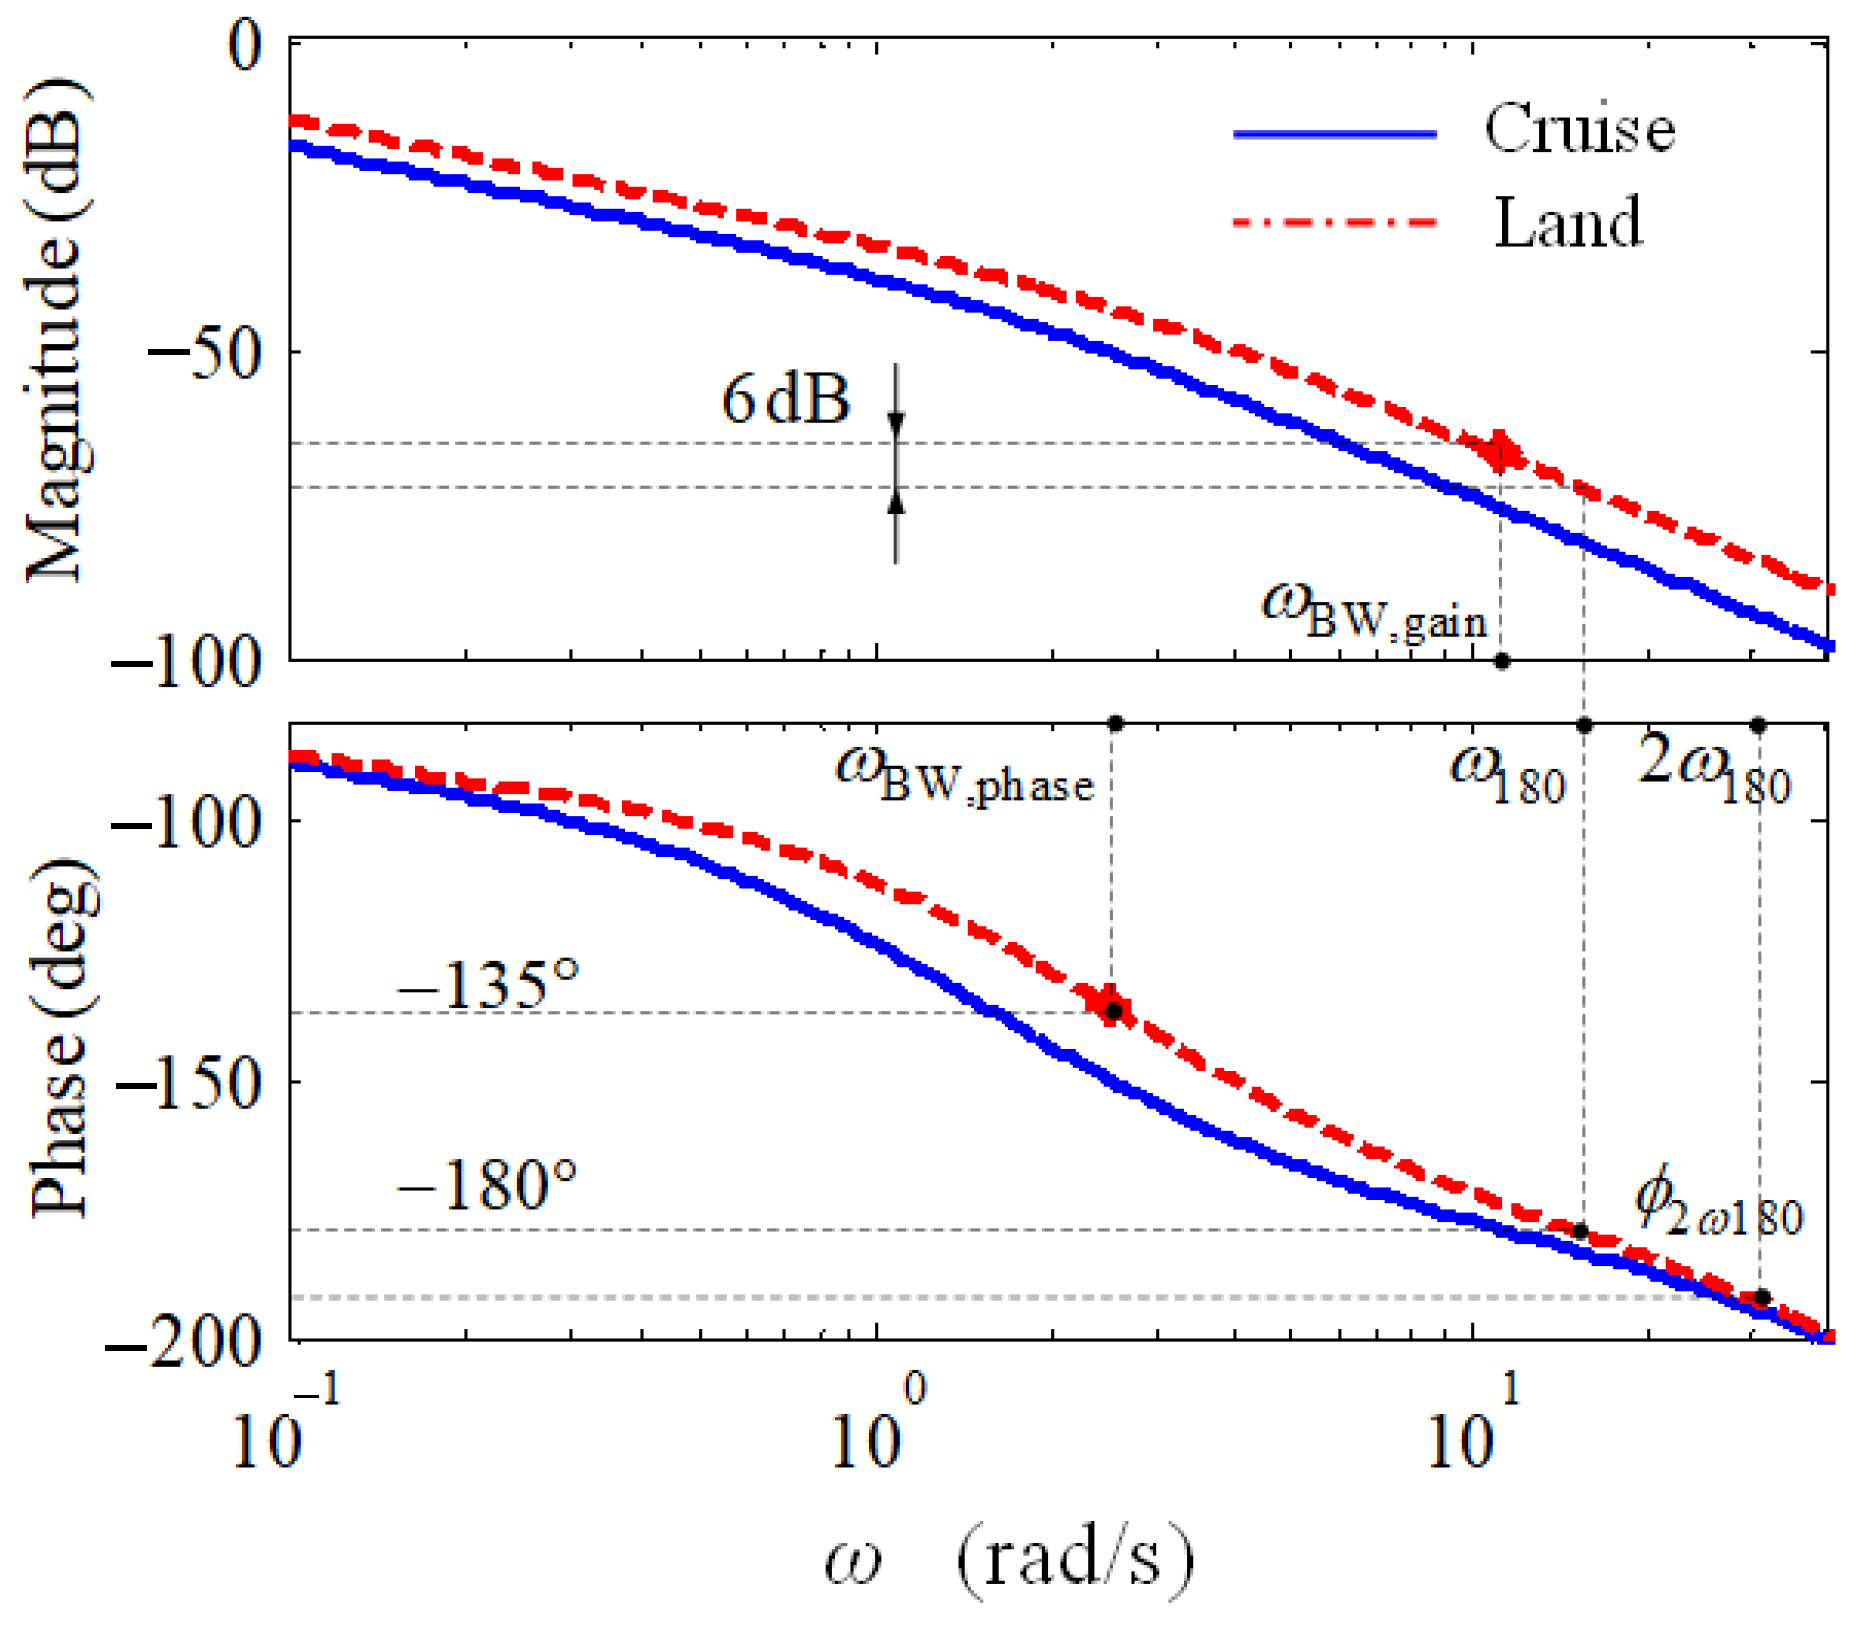
The instantaneous amplitude–frequency response peak Mp of the CL-PVS at switching describes the degree of matching between the pilot’s manoeuvring behaviour during cruise and the dynamic characteristics of the aircraft in the landing configuration. If the Mp is too large, the match between the two is poor. After configuration switching, it is difficult for pilots to quickly adapt to the dynamic characteristics of the aircraft in the landing configuration, and the overshoot of the roll angle response may be large in the tracking process, resulting in poor stationarity of the CL-PVS and poor tracking effect and being more prone to the PIO phenomenon. Therefore, it is necessary to propose requirements on the upper limit of Mp, as shown in Figure 11a. The upper limit is 15 dB.
If the Mp exceeds 15 dB, such as in test cases F11 and F40, the manipulation sensitivity increases significantly after the configuration switch, and then the pilot needs to significantly change the control behaviour to adapt to the dynamic characteristics of the aircraft in the landing configuration, resulting in a significant decline in the stability of the CL-PVS after the switch, and then the PIO phenomenon.
The existing Neal–Smith criterion requires that the amplitude–frequency response peak of the CL-PVS should not exceed 11 dB, thus limiting the overshoot of the tracking task and making the PIO phenomenon less likely to occur in the task [20]. However, the Neal–Smith criterion is primarily used to evaluate linear and time-invariant PIO phenomena, where the dynamic characteristics of the aircraft and the pilot’s handling behaviour can be considered approximately constant. In this study, the time-varying digital pilot model established in Ref. [17] is adopted, which has the ability to adjust the manoeuvring behaviour and adapt to the dynamic characteristics of the aircraft in landing configuration to a certain extent to reduce the overshoot in the tracking task and to avoid the large and continuous oscillation in aircraft motion parameters after switching. Therefore, compared with the Neal–Smith criterion, the value of the upper limit of the amplitude–frequency response peak in this study is slightly larger; that is, a slightly larger overshot is allowed during configuration switching.

4.2. Requirements for ωBW2BW1 and ΔM

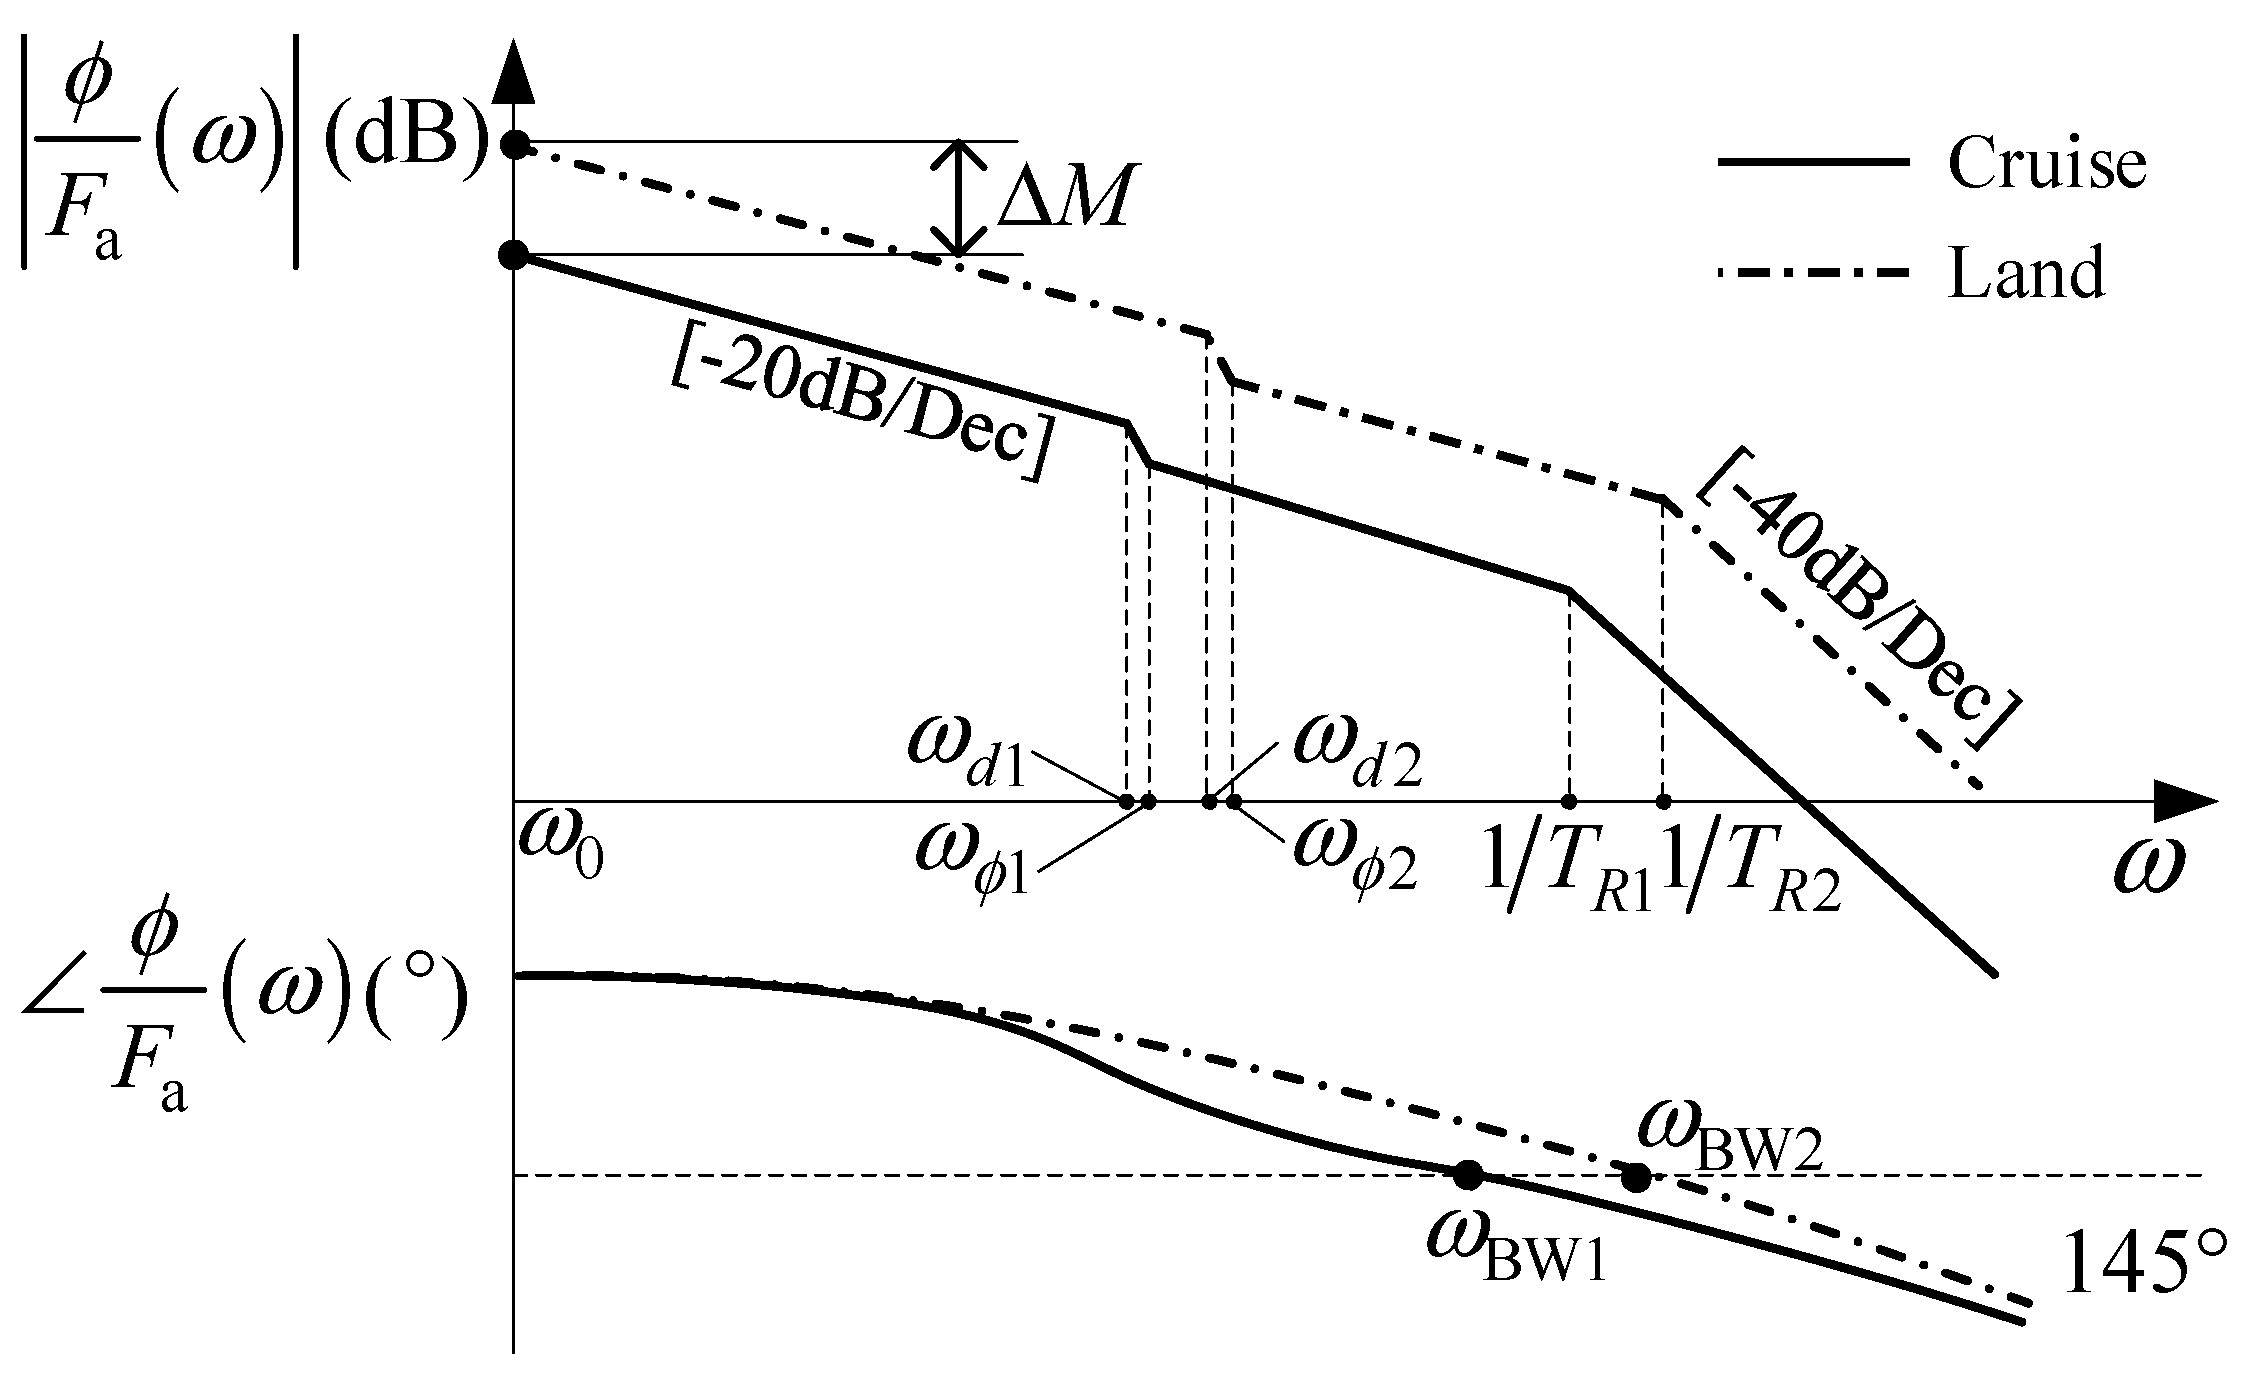
  • ωBW2/ωBW1 characterizes the differences in the roll axis manipulation sensitivity before and after the landing configuration switch. ωBW2/ωBW1 > 1, indicating that, after the configuration switch, the manipulation response of the aircraft roll axis is accelerated; otherwise, it slows. As shown in Figure 11b, before and after the configuration switch, the aircraft’s roll attitude bandwidth ωBW should not be increased too much, and a right boundary for the bandwidth ratio is needed, that is, ωBW2/ωBW1 ≤ 3.1. If the bandwidth increases significantly after switching, that is, ωBW2/ωBW1 is greater than 3.1, such as test cases F30 and F31, the aircraft roll handling response is accelerated. If the pilot cannot change the leading manipulation behaviour quickly, a large manipulation amplitude when tracking high-frequency commands after configuration switching may be adopted, resulting in a large tracking overshoot, and then the PIO phenomenon is induced.
  • ΔM represents the differences in the rapidity of the roll axis handling response before and after the landing configuration switch. ΔM > 0 dB indicates that the manipulation sensitivity of the aircraft roll axis increases after configuration switching and conversely decreases. As shown in Figure 11b, when ωBW increases relatively little, i.e., 1 ≤ ωBW2/ωBW1 ≤ 1.3, it is also necessary to limit the increase in manipulation sensitivity, and the increase in manipulation sensitivity ΔM after switching should not exceed 4 dB. If ΔM increases substantially, such as in test cases F3, F7 and F12, the response amplitude of the aircraft roll attitude increases significantly under the same manoeuvring quantity, and then a large overshoot may be generated during closed-loop tracking, which makes accurate tracking difficult and leads to the PIO phenomenon.
  • In addition, with the increase in bandwidth change amplitude after switching, the limit on the increase in manipulation sensitivity is increasingly strict. As shown in Figure 11b, by fitting the characteristic parameters of test cases F19, F22 and F50, the expression of the upper right boundary can be obtained:
    20 lg ω B W 2 / ω B W 1 + Δ M 6.5 d B ,
    Equation (5) is the combined boundary formed by ΔM and ωBW2/ωBW1, which reflects the requirement of coordination between the change in response rapidity and manipulation sensitivity. If the upper right boundary is exceeded, the control bandwidth and manipulation sensitivity increase simultaneously after configuration switching. According to the analysis results in 1. and 2. above, an increase in control response rapidity and response amplitude will lead to an increase in overshoot in closed-loop tracking. The superposition effect caused by the simultaneous increase in the two factors may lead to a large increase in overshoot during closed-loop tracking and is thus prone to the PIO phenomenon.
In conclusion, when Mp, ωBW2/ωBW1 and ΔM are in the ‘No PIO’ region of Figure 11a,b, it can be ensured that the example aircraft will not have the lateral-directional Category III PIO due to the landing configuration switch.

5. Conclusions

  • By analysing the digital test results of the lateral-directional PIO due to landing configuration switching and the formation mechanism of nonlinear PIOs, three characteristic parameters, namely the peak of the amplitude–frequency response of the CL-PVS at the switching instant, Mp, the ratio of the roll attitude bandwidth of the landing and cruise configurations, ωBW2/ωBW1, and the difference between the steady-state response of the roll attitude of the landing and cruise configurations, ΔM, are proposed to represent the difference in the lateral-directional dynamic characteristics of the aircraft before and after the landing configuration switch. They are also used to predict the characteristics of a lateral-directional PIO due to configuration switching.
  • For the example aircraft, to avoid the lateral-directional PIO phenomenon after the landing configuration switch, Mp cannot exceed 15 dB, which reflects the tracking overshoot limit requirement at the switching instant. ωBW2/ωBW1 should be less than 3.1; that is, the increase in the roll attitude bandwidth should not be more than 3 times, which reflects the requirements for the response speed of the aircraft’s roll handling response. ΔM should not exceed 4 dB, indicating that the increase in the roll manipulation sensitivity should not exceed approximately 1.6 times. Further, |20lg(ωBW2/ωBW1)| + ΔM is no more than 6.5 dB, reflecting the requirements for coordination between changes in roll response rapidity and manipulation sensitivity.
  • The research results have certain theoretical reference value for the analysis of the lateral-directional nonlinear PIO characteristics, flight quality assessment and flight control law optimization design of fly-by-wire civil aircraft during the approach phase. In the future, research on the criteria for Category III PIO phenomena induced by other factors can be carried out.

Author Contributions

Conceptualization, L.W. and C.L.; methodology, C.L.; validation, T.J.; investigation, H.L.; writing—original draft preparation, C.L.; writing—review and editing, L.W.; visualization, T.Y. All authors have read and agreed to the published version of the manuscript.

Funding

This research received no external funding.

Data Availability Statement

Data sharing is not applicable.

Conflicts of Interest

The authors declare no conflict of interest.

Appendix A

Table A1. The low-order equivalent model parameters, bandwidth criteria parameters, PIO characteristic parameters and prediction indexes of different test cases.
No.ΔFa/ ϕ ˙
(N·s/°)
ξϕ
(-)
ωϕ
(rad/s)
ξd
(-)
ωd
(rad/s)
TR
(s)
ωBW
(rad/s)
τp
(s)
Mp
(dB)
ω B W 2 ω B W 1
(-)
ΔM
(dB)
RPIO
(-)
F12.20.451.00.451.00.671.480.0083.61.00.00.3
2.20.451.00.451.00.671.480.008
F22.20.451.00.451.00.671.480.00814.21.03.90.5
1.40.451.00.451.00.671.480.008
F32.20.451.00.451.00.671.480.00822.31.06.60.7
1.00.451.00.451.00.671.480.008
F42.20.451.00.451.00.671.480.00816.11.07.50.9
0.90.451.00.451.00.671.480.008
F52.20.451.00.451.00.671.480.0084.51.10.10.3
1.90.451.00.451.00.591.700.008
F62.20.451.00.451.00.671.480.00815.01.13.80.4
1.20.451.00.451.00.591.700.008
F72.20.451.00.451.00.671.480.00827.51.15.50.6
1.00.451.00.451.00.591.700.008
F82.20.451.00.451.00.671.480.00818.21.16.50.7
0.90.451.00.451.00.591.700.008
F92.20.451.00.451.00.671.480.0085.71.4−0.10.3
1.60.451.00.451.00.482.040.008
F102.20.451.00.451.00.671.480.00814.71.42.50.5
1.20.451.00.451.00.482.040.008
F112.20.451.00.451.00.671.480.00831.91.43.90.6
1.00.451.00.451.00.482.040.008
F122.20.451.00.451.00.671.480.00825.71.44.60.7
0.90.451.00.451.00.482.040.008
F132.20.451.00.451.00.671.480.00810.41.47.50.9
0.70.451.00.451.00.482.040.008
F142.20.651.00.651.00.671.480.0089.31.70.50.3
1.20.401.10.401.10.402.450.008
F152.20.651.00.651.00.671.480.00814.31.72.00.5
1.10.401.10.401.10.402.450.008
F162.20.651.00.651.00.671.480.00830.31.73.10.6
0.90.401.10.401.10.402.450.008
F172.20.651.00.651.00.671.480.00819.61.74.40.8
0.80.401.10.401.10.402.450.008
F182.20.451.00.451.00.671.480.0082.31.9−2.90.3
1.50.451.00.451.00.332.880.008
F192.20.451.00.451.00.671.480.00812.61.90.60.5
1.00.451.00.451.00.332.880.008
F202.20.451.00.451.00.671.480.00824.01.92.00.8
0.90.451.00.451.00.332.880.008
F212.20.250.50.250.51.000.930.0381.32.8−4.70.3
1.30.251.10.251.00.292.570.036
F222.20.250.50.250.51.000.930.0387.02.8−2.40.4
1.00.251.10.251.00.292.570.036
F232.20.250.50.250.51.000.930.03813.22.8−0.80.6
0.80.251.10.251.00.292.570.036
F242.20.250.50.250.51.000.930.03827.82.80.60.8
0.70.251.10.251.00.292.570.036
F252.20.250.50.250.51.000.930.03816.42.82.41.0
0.60.251.10.251.00.292.570.036
F262.20.651.00.651.00.671.480.0080.62.2−4.20.3
1.50.401.00.401.00.293.310.008
F272.20.651.00.651.00.671.480.0089.32.2−0.70.5
1.00.401.00.401.00.293.310.008
F282.20.651.00.651.00.671.480.00815.22.20.50.7
0.90.401.00.401.00.293.310.008
F292.20.651.00.651.00.671.480.00835.12.22.11.0
0.70.401.00.401.00.293.310.008
F302.20.450.50.450.51.430.720.00814.64.6−5.20.5
0.80.451.00.451.00.293.310.008
F312.20.450.50.450.51.430.720.00829.54.6−3.40.8
0.70.451.00.451.00.293.310.008
F322.20.450.50.450.51.180.870.0089.23.8−4.90.5
0.90.451.00.451.00.293.310.008
F332.20.450.50.450.51.180.870.00818.93.8−3.10.8
0.80.451.00.451.00.293.310.008
F342.20.450.50.450.51.001.000.00811.93.5−4.80.5
0.90.450.90.451.00.293.550.008
F352.20.450.50.450.51.001.000.00820.33.5−3.60.7
0.80.450.90.451.00.293.550.008
F362.20.450.50.450.50.951.070.0084.63.1−4.80.3
1.20.451.00.451.00.293.310.008
F372.20.450.50.450.50.951.070.00810.63.1−2.90.5
0.90.451.00.451.00.293.310.008
F382.20.450.50.450.50.951.070.00823.53.10.01.0
0.70.451.00.451.00.293.310.008
F392.20.450.50.450.50.951.070.0088.03.1−3.60.4
1.00.451.00.451.00.293.310.008
F402.20.451.00.451.00.671.410.02315.31.32.50.8
1.20.451.00.451.00.481.910.023
F412.20.250.50.250.51.000.930.03814.42.9−2.30.5
0.80.251.00.251.00.292.690.036
F422.20.250.50.250.51.000.930.03828.53.0−2.40.8
0.70.250.90.251.00.292.820.036
F432.20.450.50.450.51.000.930.0387.32.7−2.40.3
1.00.451.10.451.00.292.510.036
F442.20.250.50.250.51.000.930.0386.91.0−2.40.3
1.00.101.10.101.00.290.950.036
F452.20.650.50.650.51.000.930.0387.52.6−2.40.3
1.00.651.10.651.00.292.450.036
F462.20.450.50.450.50.911.100.0088.83.2−4.90.5
1.00.450.90.451.00.293.550.008
F472.20.450.50.450.50.911.100.00814.13.2−3.70.8
0.90.450.90.451.00.293.550.008
F482.20.450.50.450.50.911.100.00819.73.4−5.00.6
0.80.450.80.451.00.293.720.008
F492.20.450.50.450.50.911.100.00825.93.4−3.60.9
0.70.450.80.451.00.293.720.008
F502.20.450.50.450.50.951.070.0085.12.9−2.90.4
1.10.451.10.451.00.293.090.008

References

  1. Endres, G.G.; Gething, M.J. Jane’s Aircraft Recognition Guide, 5th ed.; Harper Collins: New York, NY, USA, 2007; pp. 1–250. [Google Scholar]
  2. Holzaepfel, F.; Strauss, L.; Schwarz, C. Assessment of Dynamic Pairwise Wake Vortex Separations for Approach and Landing at Vienna Airport. Aerosp. Sci. Technol. 2021, 112, 106618. [Google Scholar] [CrossRef]
  3. Hameeda, A.S.; Bindu, G.R. Single Segment Approach and Landing Guidance and Control for an Unpowered Reusable Launch Vehicle. Aerosp. Sci. Technol 2021, 115, 106777. [Google Scholar] [CrossRef]
  4. Etkin, B.; Reid, L.D. Dynamics of Flight Stability and Control, 3rd ed.; John Wiley & Sons, Inc.: New York, NY, USA, 1996; pp. 93–160. [Google Scholar]
  5. Fang, Z.; Chen, W.; Zhang, S. Aircraft Flight Dynamics, 1st ed.; Beihang University Press: Beijing, China, 2005; pp. 254–263. (In Chinese) [Google Scholar]
  6. Iloputaife, O. Minimizing Pilot-induced-oscillation Susceptibility during C-17 Development. In Proceedings of the 22nd Atmospheric Flight Mechanics Conference, New Orleans, LA, USA, 11–13 August 1997. [Google Scholar] [CrossRef]
  7. Hyokawa, S.; Ueba, M. Design and Verification of Short-Distance Landing Control System for a One-Third-Scale Unmanned Supersonic Experimental Airplane. Aerospace 2023, 10, 334. [Google Scholar] [CrossRef]
  8. Xu, S.; Tan, W.; Qu, X.; Zhang, C. Prediction of Nonlinear Pilot-induced Oscillation Using an Intelligent Human Pilot Model. Chin. J. Aeronaut. 2019, 32, 2592–2611. [Google Scholar] [CrossRef]
  9. Pavel, M.D.; Jump, M.; Dang-Vu, B.; Masarati, P.; Gennaretti, M.; Ionita, A.; Zaichik, L.; Smaili, H.; Quaranta, G.; Yilmaz, D.; et al. Adverse Rotorcraft Pilot Couplings: Past, Present and Future Challenges. Prog. Aerosp. Sci. 2013, 62, 1–51. [Google Scholar] [CrossRef]
  10. Hassan, A.M.; Taha, H.E. Airplane Loss of Control Problem: Linear Controllability Analysis. Prog. Aerosp. Sci. 2016, 55, 264–271. [Google Scholar] [CrossRef]
  11. Mandal, T.K.; Gu, Y. Analysis of Pilot-Induced-Oscillation and Pilot Vehicle System Stability Using UAS Flight Experiments. Aerospace 2016, 3, 42. [Google Scholar] [CrossRef]
  12. Drewiacki, D.; Silvestre, F.J.; Neto, A.G. Influence of Airframe Flexibility on Pilot-induced Oscillations. J. Guid. Control Dyn. 2019, 42, 7. [Google Scholar] [CrossRef]
  13. Shweyk, K.; Weltz, G. Design and Validation of Flight Control Law Changes Intended to Minimize Pilot-induced Oscillations in a Large Transport Aircraft. In Proceedings of the AIAA Atmospheric Flight Mechanics Conference and Exhibit, San Francisco, CA, USA, 15–18 August 2005. [Google Scholar] [CrossRef]
  14. Bailey, R.E.; Bidlack, T.J. A Quantitative Criterion for Pilot-induced Oscillations: Time Domain Neal-smith Criterion. In Proceedings of the 21st Atmospheric Flight Mechanics Conference, San Diego, CA, USA, 29–31 July 1996. [Google Scholar] [CrossRef]
  15. Innocenti, M.; Thukral, A. Roll-performance Criteria for High Augmented Aircraft. J. Guid. Control Dyn. 1991, 14, 1277–1286. [Google Scholar] [CrossRef]
  16. Jones, M.; Alexander, M.; Höfinger, M.; Barnett, M.; Comeau, P.; Gubbels, A. In-Flight Test Campaign to Validate PIO Detection and Assessment Tools. Aerospace 2020, 7, 136. [Google Scholar] [CrossRef]
  17. Wang, L.; Lu, C.; Liu, H.; Yue, T. Method of Predicting Nonlinear Pilot-induced Oscillations Due to Flight Control Degradation Based on Digital Virtual Flight. Aerosp. Sci. Technol. 2021, 116, 106871. [Google Scholar] [CrossRef]
  18. Liu, F.; Wang, L.; Tan, X. Digital Virtual Flight Testing and Evaluation Method for Flight Characteristics Airworthiness Compliance of Civil Aircraft Based on HQRM. Chin. J. Aeronaut. 2015, 28, 112–120. [Google Scholar] [CrossRef]
  19. Wang, L.; Yin, H.; Yang, K.; Liu, H.; Zhu, J. Water Takeoff Performance Calculation Method for Amphibious Aircraft Based on Digital Virtual Flight. Chin. J. Aeronaut. 2020, 33, 3082–3091. [Google Scholar] [CrossRef]
  20. Gao, J.; Li, L.; Feng, Y. Aircraft Handling Qualities, 1st ed.; National Defense Industry Press: Beijing, China, 2003; pp. 146–153. (In Chinese) [Google Scholar]
  21. Favre, C. Fly-by-wire for Commercial Aircraft: The Airbus Experience. Int. J. Control 1994, 59, 139–157. [Google Scholar] [CrossRef]
  22. Federal Aviation Administration. FAR Part 25: Air-Worthiness Standards: Transport Category Airplanes; Federal Aviation Administration: Washington, DC, USA, 1964; pp. 26–28.
  23. Zaal, P.; Sweet, B. Estimation of Time Varying Pilot Model Parameters. In Proceedings of the AIAA Modeling and Simulation Technologies Conference, Portland, OR, USA, 8–11 August 2011. [Google Scholar] [CrossRef]
  24. Mitchell, D.G.; Hoh, R.H.; Aponso, B.L. Proposed Incorporation of Mission-oriented Flying Qualities into MIL-STD-1797A; Wright Laboratory, Hoh Aeronautics, Inc.: Lomita, CA, USA, 1994. [Google Scholar]
  25. MIL-HDBK-1797A; Flying Qualities of Piloted Aircraft. Military Standard. Department of Defense: Arlington, VA, USA, 2004.
  26. Innocenti, M.; Bava, R. Lateral-direction Tracking Requirements from Simulation Data. J. Guid. Control Dyn. 1991, 14, 701–703. [Google Scholar] [CrossRef]
  27. Meng, Q. Automatic Control Theory, 2nd ed.; Higher Education Press: Beijing, China, 2008; pp. 11–30. (In Chinese) [Google Scholar]
  28. Martz, J.; Biezad, D.J.; DiDominico, E.D. Loop Separation Parameter-A New Metric for Landing Flying Qualities. J. Guid. Control Dyn. 1988, 11, 535–541. [Google Scholar] [CrossRef]
Figure 1. Example aircraft lateral-directional control law.
Aerospace 10 00799 g001
Figure 2. Landing configuration switching digital virtual flight simulation model.
Aerospace 10 00799 g002
Figure 3. Test case results evaluated using the bandwidth criteria.
Aerospace 10 00799 g003
Figure 4. Bode diagram of the transfer function ϕ(s)/Fa(s).
Aerospace 10 00799 g004
Figure 5. Results of typical motion parameters of the rolling attitude tracking task. (a) Roll angle; (b) airspeed; (c) AGL altitude; (d) sideslip angle; (e) roll angular velocity; (f) lateral stick force; (g) aileron deflection; (h) PIO evaluation index.
Aerospace 10 00799 g005aAerospace 10 00799 g005b
Figure 6. Structure of the pilot–vehicle system (PVS). (a) CL-PVS; (b) OL-PVS.
Aerospace 10 00799 g006
Figure 7. Root locus plot of the CL-PVS in test case F17.
Aerospace 10 00799 g007
Figure 8. Amplitude–frequency response of the CL-PVS.
Aerospace 10 00799 g008
Figure 9. Roll angle frequency domain response characteristics before and after landing configuration switching.
Aerospace 10 00799 g009
Figure 10. Comparison of the PIO prediction results of test cases F14, F19, F28 and F38. (a) Roll angle; (b) PIO prediction index.
Aerospace 10 00799 g010
Figure 11. Relationship between the nonlinear PIO prediction results and the characteristic parameters. (a) Mp in different test cases; (b) ωBW2/ωBW1 and ΔM in different test cases.
Aerospace 10 00799 g011
Table 1. Amplitude and frequency of the sinusoidal signal.
No.ωi (rad/s)Ai (rad)No.ωi (rad/s)Ai (rad)
10.2622.97082.6180.155
20.5241.47493.1420.120
30.785−0.890103.9270.098
41.0470.575115.236−0.055
51.3090.393127.8540.035
61.5710.3481310.4700.028
72.094−0.2351415.710−0.010
Table 2. Lateral-directional flight control law parameters in test case F17.
No.ParameterConfiguration
CruiseLanding
1ΔFa/ ϕ ˙ (N·s/°)2.200.80
2Tw (s)33
3τact (s)0.30.3
4KIa0.390.39
5Kfa0.100.10
6KIr0.020.02
7Kfr0.020.02
8Kny1.972.20
9Kr0.140.01
10Kp−0.26−0.19
Table 3. Lateral-directional low-order equivalent model parameters and bandwidth criterion parameters.
No.ParameterConfiguration
CruiseLanding
1ξϕ0.650.40
2ωϕ (rad/s)1.01.1
3TR (s)0.670.40
4ξd0.650.40
5ωd (rad/s)1.01.1
6ωBW (rad/s)1.482.45
7τp (s)0.0080.008
Disclaimer/Publisher’s Note: The statements, opinions and data contained in all publications are solely those of the individual author(s) and contributor(s) and not of MDPI and/or the editor(s). MDPI and/or the editor(s) disclaim responsibility for any injury to people or property resulting from any ideas, methods, instructions or products referred to in the content.

