Article

Investigation of Vaned-Recessed Casing Treatment in a Low-Speed Axial-Flow Compressor, Part II: Unsteady Results

School of Mechanical Engineering, Iran University of Science and Technology, Tehran 16846-13114, Iran
*
Author to whom correspondence should be addressed.
Aerospace 2023, 10(9), 763; https://doi.org/10.3390/aerospace10090763
Submission received: 17 June 2023 / Revised: 7 August 2023 / Accepted: 16 August 2023 / Published: 28 August 2023

Abstract

:
In this paper, unsteady characteristics of a modified vaned-recessed casing treatment with 23.2% rotor blade tip axial chord exposure were studied numerically. The modifications to the traditional vaned-recessed casing treatments were composed of geometrical amendments to the casing treatment’s guide vanes and the top of the treated casing. The solid casing and the casing treatment configurations were simulated using the Unsteady Reynolds-Averaged Navier–Stokes equations (URANS), and the results were validated by experimental results. Firstly, standard deviation and frequency analysis were performed to find the sources of unsteadiness. Secondly, velocity components analysis, including velocity triangles, was presented instantaneously to clarify their effects on rotor tip flow fields as well as stall margin improvement. Thirdly, unsteady interactions between the rotor and casing treatment flow fields, including flow structure and pressure distributions, were discussed. In the end, flow streamline patterns, in addition to the physical mechanism of the vaned-recessed casing treatment, were also discussed. The results indicated that unsteadiness plays an important role in the flow mechanism and cannot be ignored. The unsteadiness increases as the mass flow is reduced toward the stall/surge condition. Moreover, the analysis of velocity components demonstrated that the casing treatment has distinct behavior at the last operating points before the onset of the stall for solid casing and casing treatment configurations in terms of axial velocity change.

1. Introduction

Casing treatments are effective methods to postpone the onset of aerodynamic instabilities, such as rotating stalls and surges, and extend the stable operating range of a compressor. Various types of casing treatments, such as circumferential grooves, axial slots, and bend skewed, have been developed over the past years to extend the stability limits of a compressor. These casing treatments have been studied extensively, and their mechanism has been explained adequately [1,2,3,4,5,6,7,8,9,10,11,12,13,14,15,16,17]. Considerably different from the mentioned types of casing treatments, a vaned-recessed casing treatment, which is a large-scale casing one, was developed by Ivanov [18], and further investigation was conducted by Bard [19]. Air-separators and anti-stall rings are also large-scale casing treatments in which a number of fins are utilized and have similarities to vaned-recessed casing treatments. Vaned-recessed casing treatments and air separators have been investigated experimentally and numerically over the past years. Miyake [20] reported that the unstable operating range of an axial-flow fan was stabilized by air-separator equipment. The main function of a vaned-recessed casing treatment was found to absorb reversed flow and reduce tangential velocity [21]. The flow pattern analysis inside the casing treatment showed that the flow within the casing treatment is highly unsteady, while the flow in the casing region is less unsteady [22]. The main function of the vaned-recessed casing treatment was found to modify the tip-leakage flow and replace it with a radial flow by Kang [23]. The effects of vaned-recessed casing treatment axial rotor chord exposures from 23.2% to 83.8% on the performance of a multistage compressor were tested experimentally by Akhlaghi [24]. In a first numerical investigation of a vaned-recessed casing treatment by Ghila [25], the flow pattern analysis indicated that a large area of reversed flow is accumulated in the tip region at lower mass flow rates. The computations were performed in steady-state mode. The influence of radial-vaned air separators on the axial-flow fan was investigated by Yamguchi [26,27]. In another similar steady-state study, the influence of blade chord exposure, as well as recess height, were investigated by Yelmar [28]. A frozen rotor approach was utilized in a numerical investigation to study an anti-stall ring. This study does not include unsteady interactions [29]. In a similar numerical investigation, a frozen rotor approach coupled to actuator disk theory was utilized. This approach neglects unsteady interactions [30]. The influence of cavity outlet distance and blade chord exposure of a vaned-recessed casing treatment was numerically investigated by Chen [31]. In another study by Chen [32], the influence of the casing treatment vanes’ inlet angle was numerically investigated, and the flow patterns inside the casing treatment were analyzed. Based on the above literature, it is not difficult to conclude that the effects of vaned-recessed casing treatments and air separators have been investigated mainly from a steady-state operation point of view. However, the limitation of investigations based on the steady-state approach is that the results based on this approach fail to account for the fundamental mechanism of operation under real conditions. In particular, the assumption that the steady-state method can capture flow behavior accurately is not correct, especially when unsteadiness increases at lower-mass flow rates by approaching stability limits. Apart from the above investigations, there is a single unsteady investigation by Ghila [33], which studied a vaned-recessed casing treatment under a time-accurate unsteady computation. Nevertheless, their conclusion is that flow behavior inside the casing treatment is mostly dominated by the steady-state flow process, and steady-state simulations are adequate to capture the main effects of the casing treatment.
Different from vaned-recessed casing treatments and anti-stall rings, self-recirculating casing treatments have attracted a lot of interest recently. A discrete type of passive self-recirculating casing treatment was experimentally tested by Kumar [34]. The stall margin improvement for the various configurations was found to be due to the impact of high-pressure fluid that manipulates tip-leakage flow and its associated losses. Two cross-stage self-recirculating casing treatments were investigated in a counter-rotating axial compressor by Guo [35]. The favorable effect of the self-recirculating casing treatment was attributed to the suppression of the detrimental effect of tip-leakage flow. In addition, it was found that the intensity of unsteady pressure fluctuations was inhibited by the self-recirculating casing treatment. A self-recirculating casing treatment with different circumferential coverage ratios was tested by Zhang [36]. The stall margin improvement was found to be due to the suction of low-speed flow that contributed to the development of the tip-leakage vortices. A novel casing treatment that combines flow recirculation with a circumferential casing groove was investigated by Vuong [37] in a transonic axial compressor. The maximum improvement in stall margin was found to be 42.5%, with a minor reduction in efficiency. The stalling mechanism was attributed to vortex breakdown, which results in the formation of passage blockage. A self-recirculating casing treatment was tested in a two-stage counter-rotating axial-flow compressor by Guo [38]. The self-recirculating casing treatment was found to alter stall occurrence by suppressing the strength of tip-leakage flow which inhibits tip-leakage flow spillage. A low-reaction transonic compressor, in addition to a self-recirculating compressor, was tested by Ding [39]. The favorable effect of the self-recirculating casing treatment was found to be due to the weakening of the tip-leakage vortex/shock interaction and the formation of the tip-secondary vortex, which results in less blockage in the passage. A recirculating type casing treatment was tested in a highly loaded compressor by Kawase [40]. The stall margin improvement was found to be due to altering the interaction between the tip-leakage vortex and shock wave. An interesting finding in this study is that the casing treatment experiences no penalty in the isentropic efficiency. The impact of various angles of a self-recirculating casing treatment in a transonic compressor was investigated by Zhang [41]. The mechanism of stall margin improvement was attributed to the decrease in blockage regions by the increase in radial inclined angle.
It is an indispensable trend that a better understanding of the mechanism of vaned-recessed casing treatments requires unsteady investigation without any further assumption that limits its operation under real conditions. As a result of the lack of a comprehensive unsteady investigation, the present investigation studies the influence of a modified vaned-recessed casing treatment by considering the unsteady effects numerically. The modifications to the traditional vaned-recessed casing treatments are composed of the following: First, the geometry of guide vanes inside the casing treatment has changed. In this study, the guide vanes consist of curved sections, while the guide vanes in the traditional vaned-recessed investigations are composed of straight and curved sections. Second, the geometry of the upper shroud surface has changed from a straight section into a curved section. The goal of these modifications is to overcome the accumulation of low-speed fluid in the corners of the casing treatment and promote flow recirculation. These modifications were designed and tested experimentally by the first author of this paper previously [24]. It should be noted that an unsteady investigation including these modifications is discussed numerically for the first time. In the first part of this paper, frequency analysis and source of unsteadiness are discussed. Afterward, the analysis of velocity components as well as velocity triangles, are presented for a deep understanding of the physical mechanism of the vaned-recessed casing treatment. In the end, the casing treatment/rotor flow interactions are discussed, and their relation to stall margin improvement is explained.

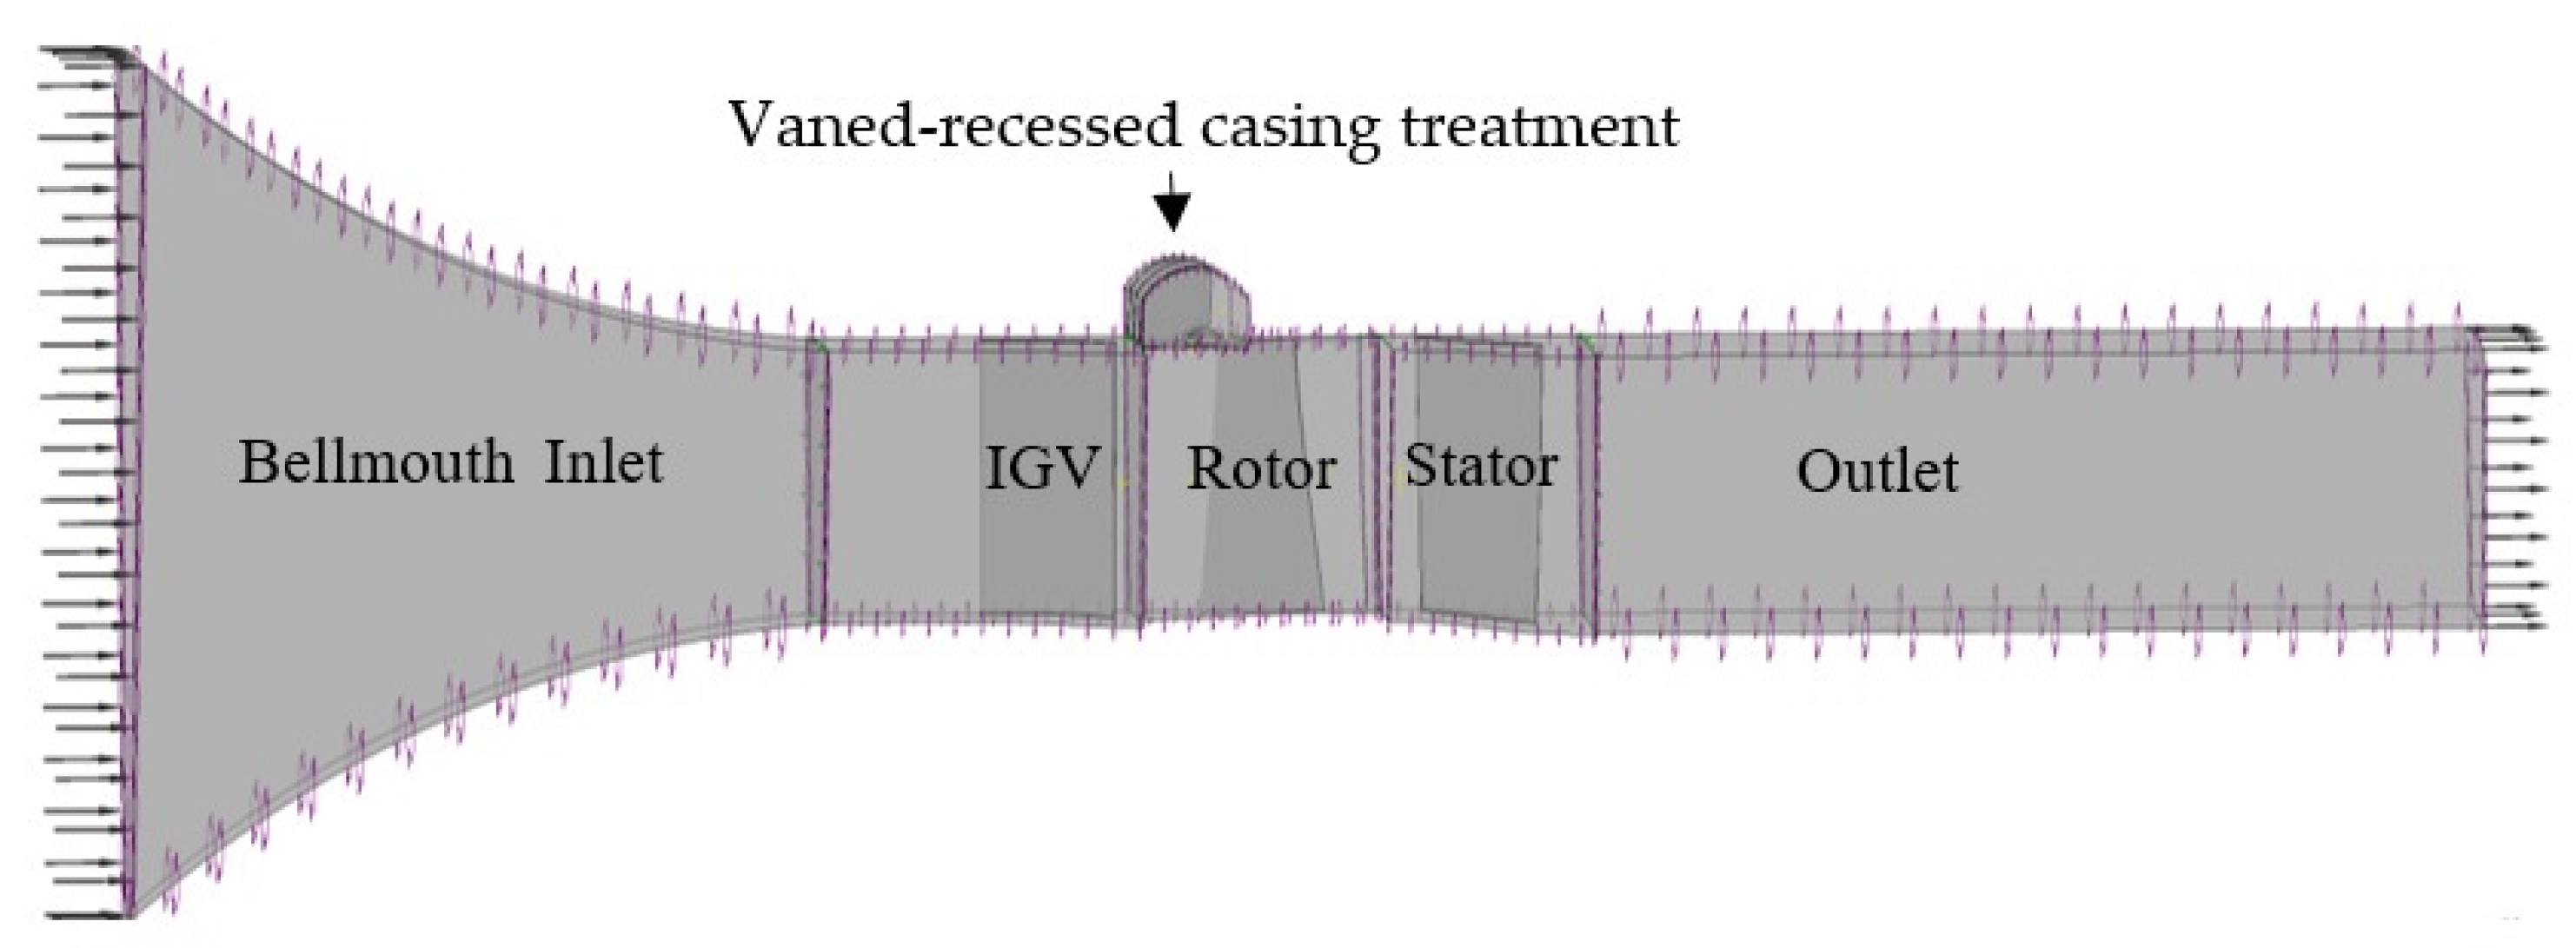
2. Investigated Compressor and Casing Treatment Configuration

A low-speed axial-flow compressor has been selected for numerical investigation in this study. The test rig was named Peregrine and was tested by Akhlaghi [24,42] at Cranfield University. The test rig is composed of an electric motor with a bellmouth inlet, a row of igv, three repeating stages, two honeycomb straighteners, a venturi flow meter, an electrically operated orifice, and an outlet ducting. The rotor shaft was driven by an electric motor at the design speed of 3000 rpm. The vaned-recessed casing treatment selected for this study is composed of 120 curved guide vanes. The casing treatment was designed based on a conceptual approach by the first author of this paper and was tested experimentally [24,42]. The configuration under investigation in this study has rotor blade tip axial chord exposure of 23.2% (about 4.7 mm) to the casing treatment. The main design characteristics of the low-speed compressor are summarized in Table 1, and a sketch of the vaned-recessed casing treatment configuration is shown in Figure 1.

3. Numerical Details
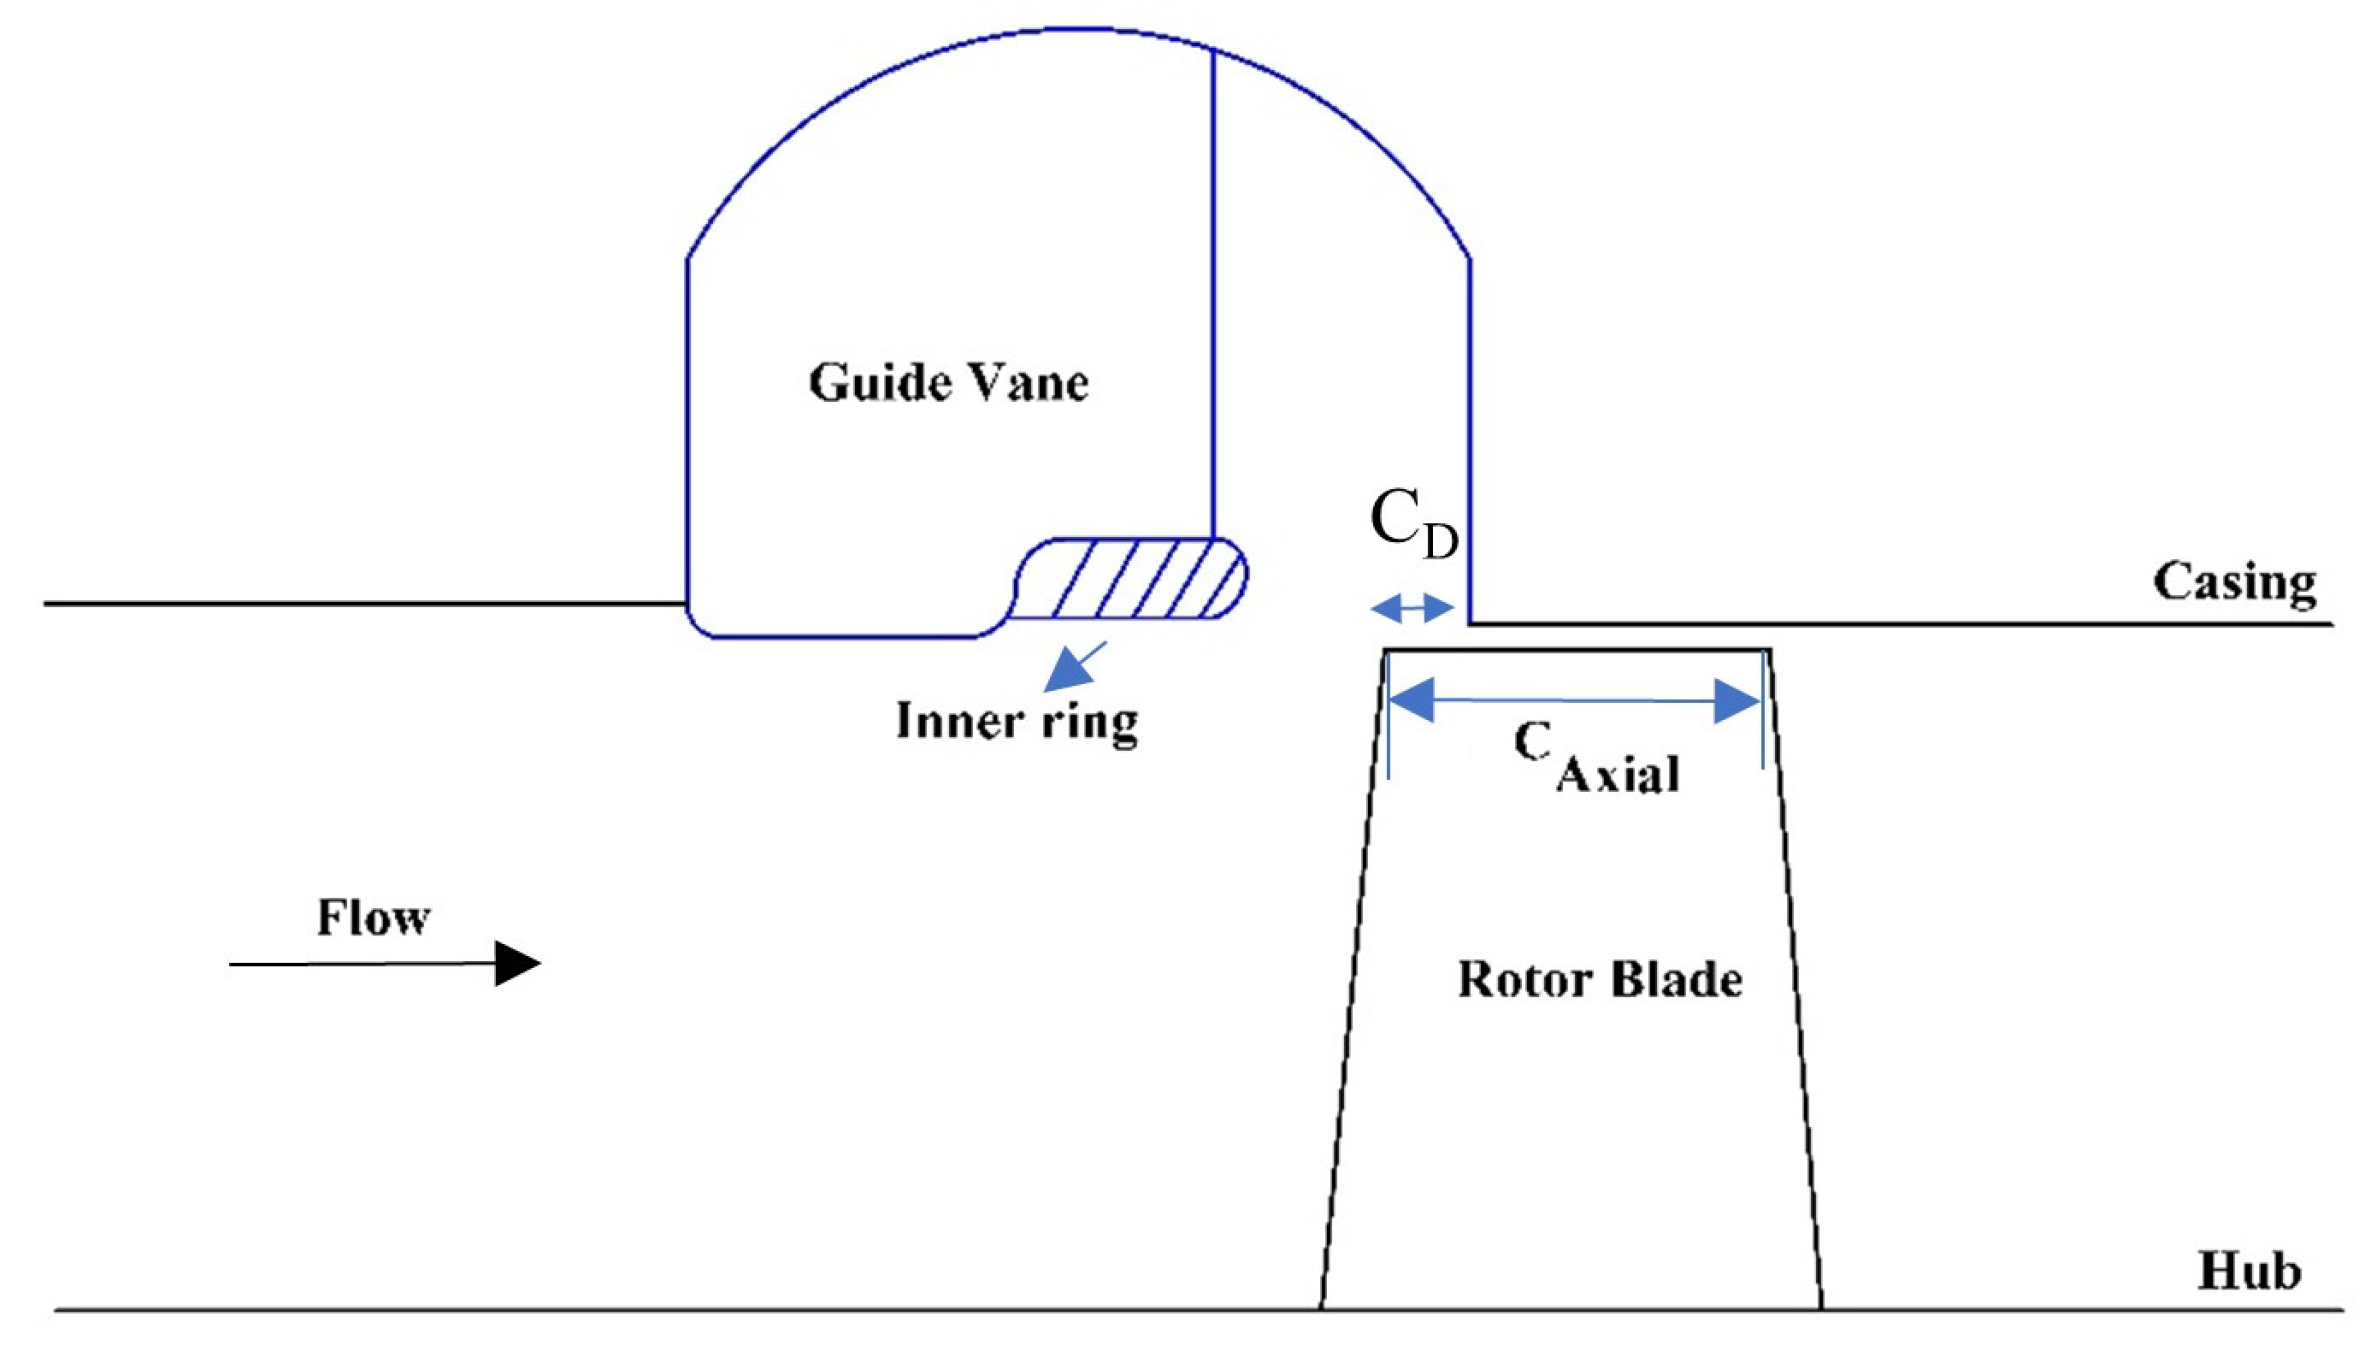
Rotating stall and surge are very complex and unsteady phenomena that require time-accurate unsteady simulations. Consequently, all the computations in this numerical study, from maximum mass flow to near-stall operating points, were 3D and unsteady. A three-dimensional CFD code was utilized to solve the Unsteady Reynolds-Averaged Navier–Stokes (URANS) equations. The solver utilizes a fully coupled approach in which momentum and pressure equations are solved together. It uses a fully implicit numerical method. Forty-time steps per passing period corresponding to 1520-time steps in a full rotation of the rotor were selected for the simulations. This corresponds to a time step of 1.31579 × 10 5   s . The transient profile transformation (PT) method was applied for IGV-rotor, rotor-casing treatment, and rotor–stator interfaces. The pitch change ratios across these interfaces are 1.11, 1.05, and 1.02 for modeling one IGV blade, one rotor blade, three guide vanes inside the casing treatment, and one stator blade, respectively. The transient interface used for the numerical simulation utilizes the profile transformation (PT) method, in which the flow profiles across the interfaces are circumferentially stretched or compressed. According to Zori [43] and Cornelius [44], the main limitation of this method is that there is a frequency error proportional to the pitch ratio. In the current investigation, since the pitch ratios are close to unity, there is a frequency error of 0.3%; therefore, the numerical method was considered to be acceptable. The error due to the use of the PT method is discussed in Section 3.7.

3.1. Geometry

The computational flow domain is composed of a bellmouth inlet, IGV, rotor, stator, casing treatment, and outlet. Due to the high computational requirements of the full-annulus unsteady simulations, only one passage per blade has been modeled. In order to maintain the pitch ratios requirement across the interfaces, the numbers of IGV, rotor, stator, and vanes in this investigation are 1, 1, 1, and 3, respectively. A schematic view of the flow domain is presented in Figure 2.

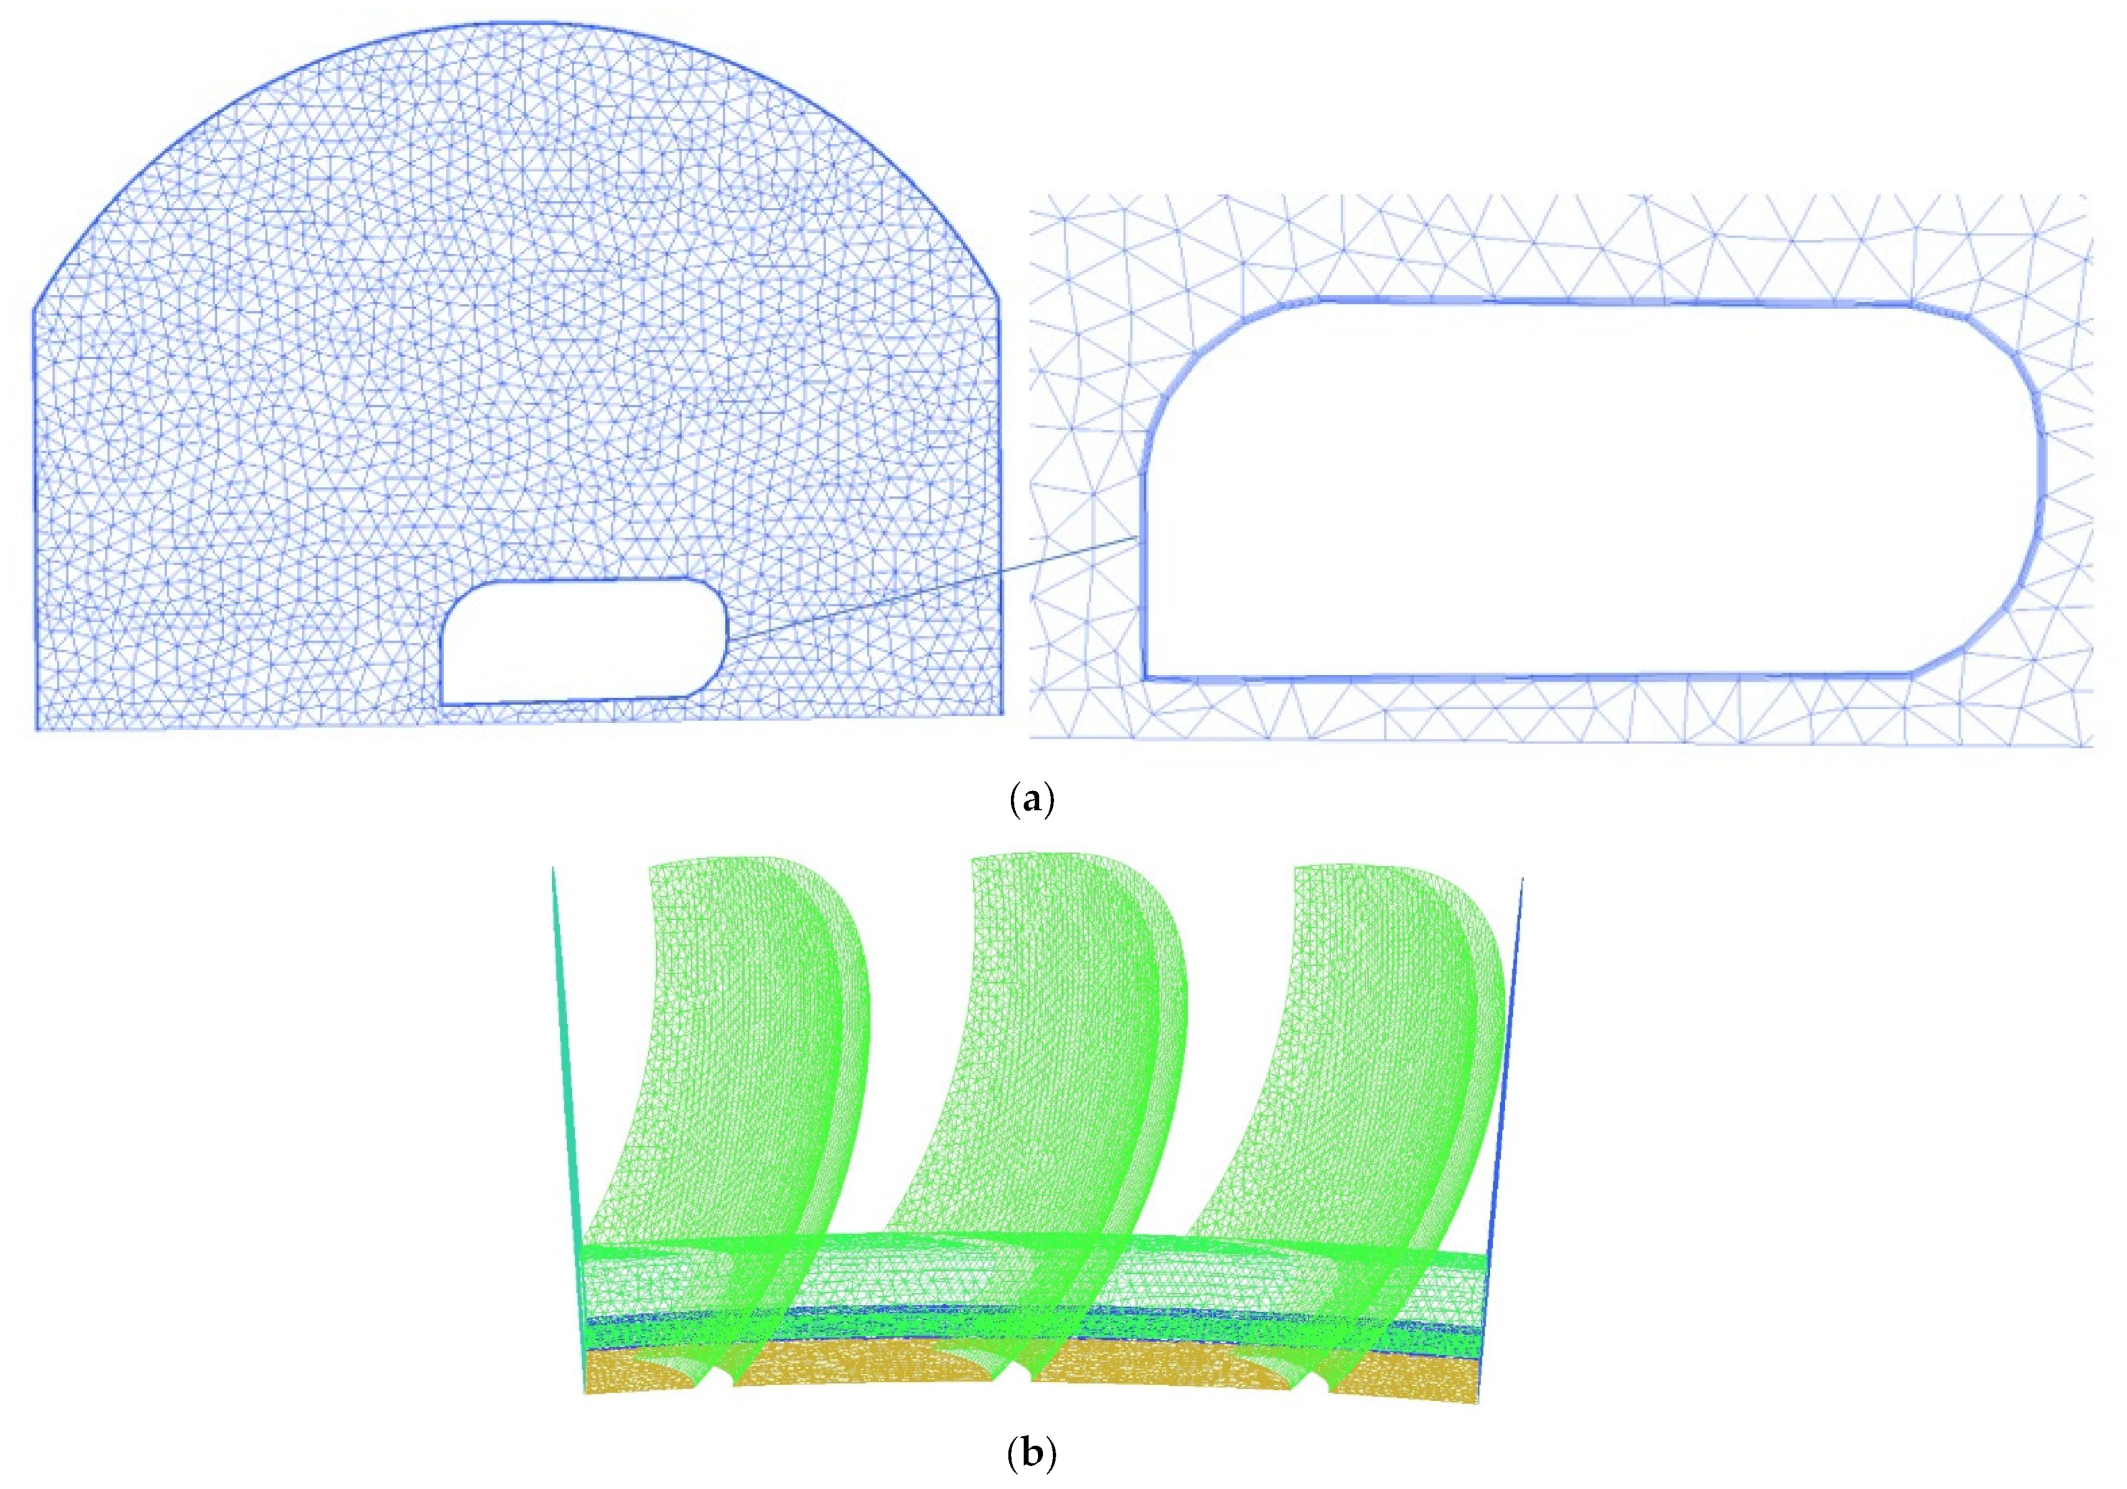
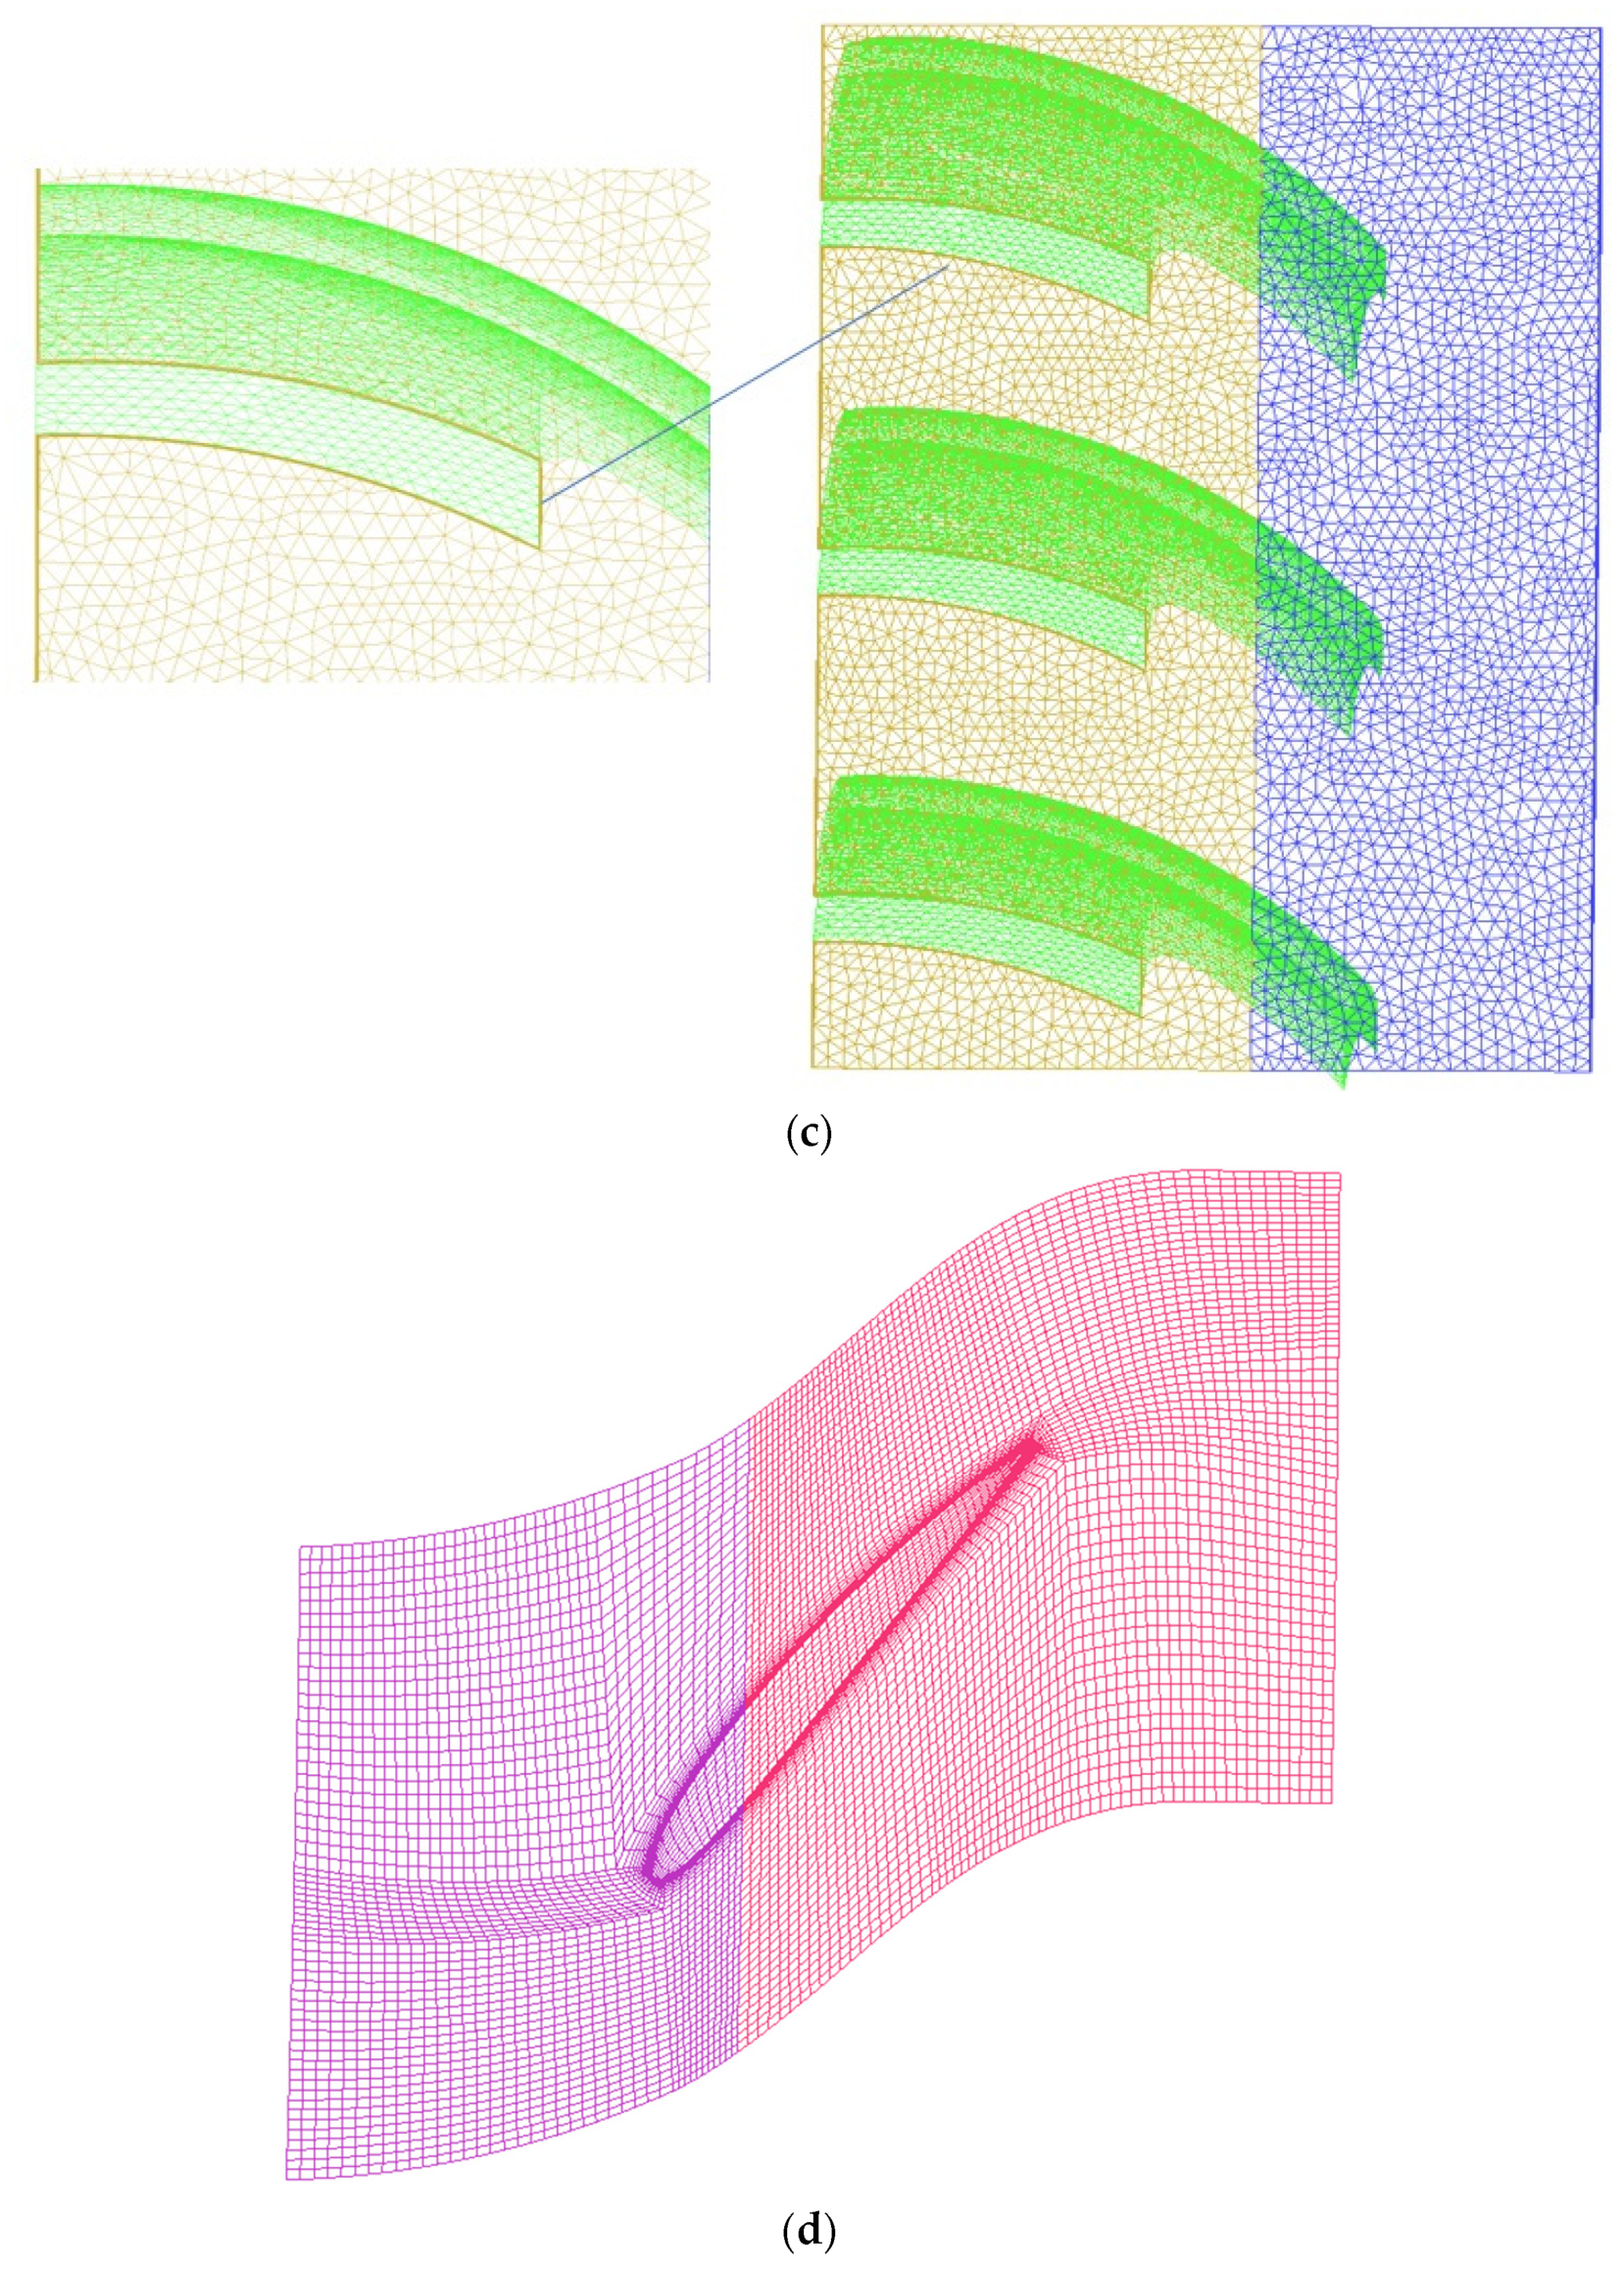
3.2. Meshing Details

IGV, rotor, and stator were discretized with block-structured grids. Each blade passage utilizes an O-grid structure near the blade surface, while the other parts employ an H-grid structure. A mixture of structured and unstructured grids was utilized for the casing treatment. The grid density near the wall surfaces was increased to conform with the y + requirement. Front, side, and down views of the grids within the casing treatment and the rotor are presented in Figure 3.

3.3. Boundary Conditions

Total temperature and total pressure were imposed at the inlet, while mass flow boundary condition was set at the outlet. For the maximum mass flow operating point, static pressure was imposed at the outlet. It is assumed that the properties have uniform distributions at the inlet. Periodic boundary conditions were imposed in the circumferential direction. The solid boundaries were chosen to be nonslip, adiabatic, and smooth.

3.4. Governing and Turbulence Equations

The governing equations to be solved are composed of continuity, momentum, and turbulence transport equations. The turbulence was modeled by the shear stress transport k ω turbulence model [45]. The continuity and momentum equations are as follows:
U i x i = 0  
ρ U i t + ρ U j U i x j = P x i + x j 2 μ S j i ρ u j ´ u i ´ ¯  
where S j i is the strain-rate tensor and is equal to S i j for simple viscous fluids.
The transport equations for the turbulence kinetic energy and specific dissipation rate are as follows:
k t + u j ¯ k x j = x j ν + σ k υ t k x j + P k β k ω  
ω t + u j ¯ ω x j = γ P k ρ υ t β ω 2 + x j ν + σ ω υ t ω x j + 2 1 F 1 σ ω 2 1 ω k x j ω x j
where eddy viscosity is expressed as:
υ t = a 1 k m a x a 1 ω , S F 2

3.5. Grid Independence Study

A summary of the grid independence analysis is presented in Table 2. The grid independence analysis was implemented on several sets of grid numbers ranging from 791,713 to 10,565,038 nodes. The data from three monitor points have been selected for the demonstration of grid independence. The three numerical probes are placed near the tip of the IGV, rotor, and stator, respectively. As can be seen, the time-averaged static pressure values change marginally by refining the mesh. Furthermore, the time-averaged pressure ratio values almost remain constant by refining the mesh. Based on the analysis in this section, it can be concluded that grid independence is achieved. In order to save on transient simulations, the grid type with 2,224,443 nodes has been used throughout the simulations.

3.6. Convergence Assessment

The convergence of unsteady computations was analyzed by monitoring the static pressure signals from the three numerical probes in the previous section. The minimum numbers from 1 to 2 rotations were required to obtain periodic signals away from stall operating conditions. At the near stall points, the periodicity of signals in time broke down, and no periodic signals were observed. The analysis of the pressure signals shows that the convergence requirement has been achieved.

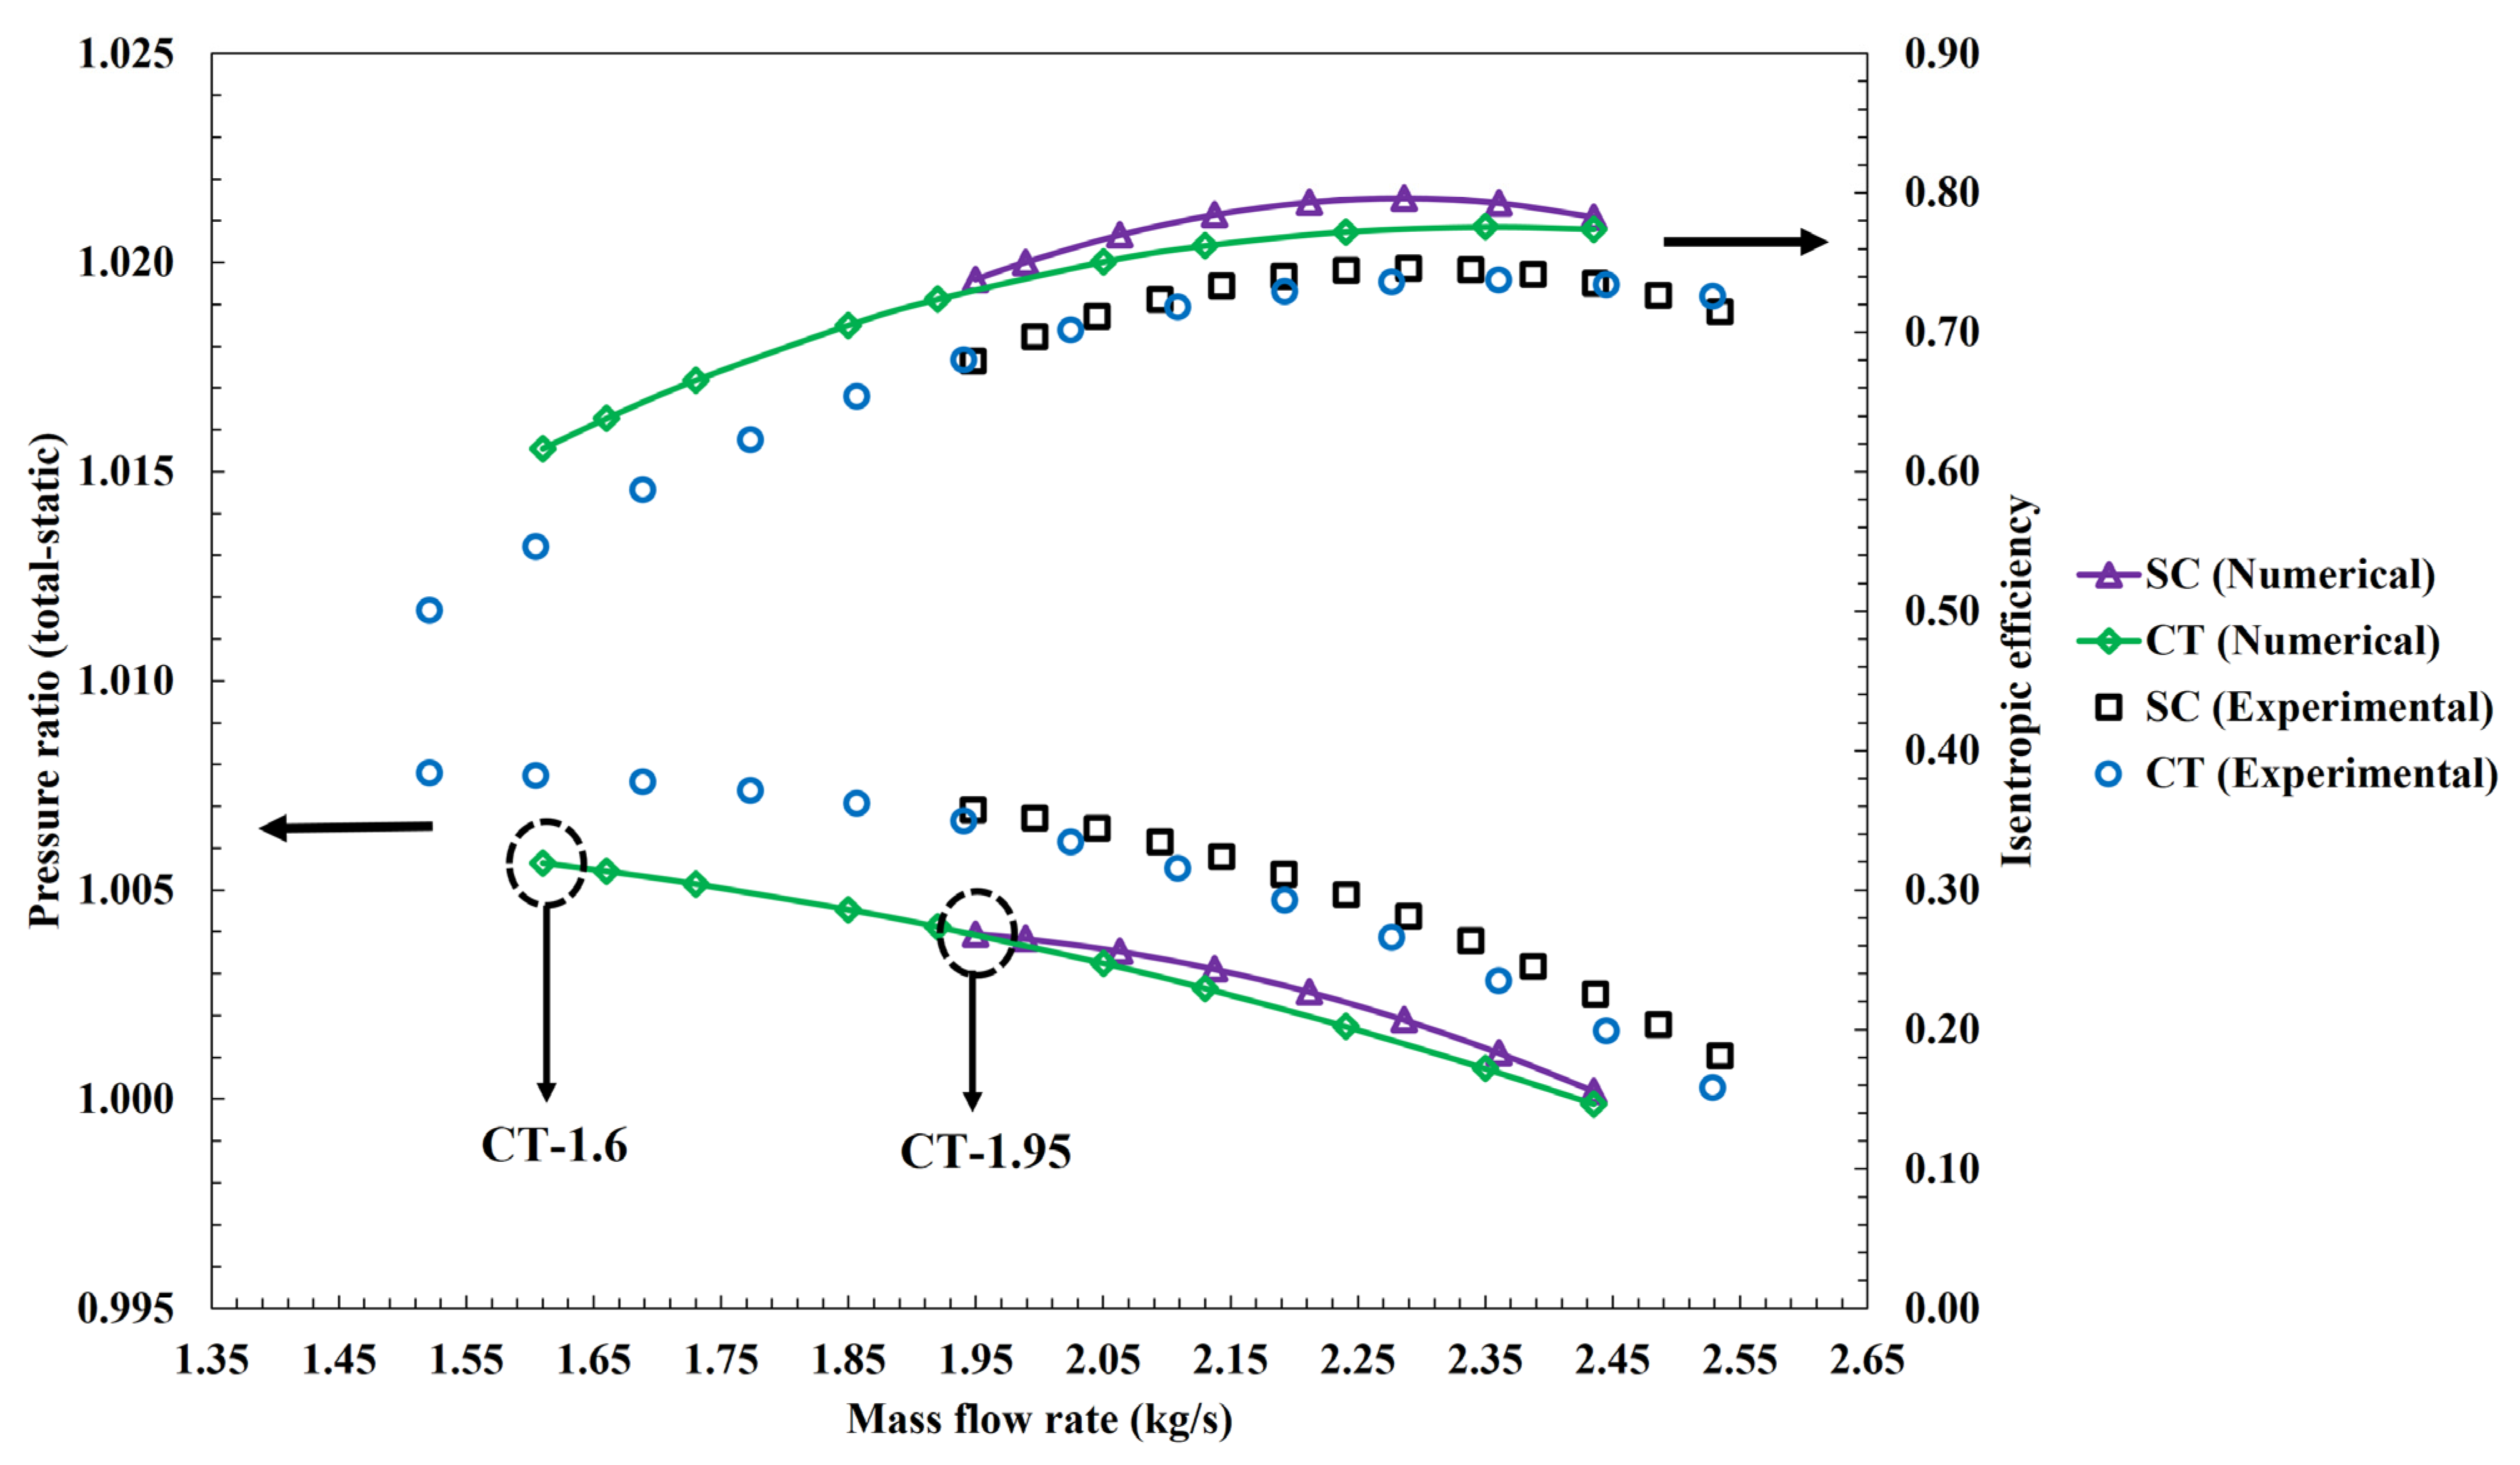
3.7. Validation of Results

As explained in references [43,44], the main limitations of the profile transformation (PT) method exist in predicting aerodynamic performances, frequencies, and flow features. In this section, the error due to the use of the PT method in predicting the pressure ratio is calculated in Table 3 and Table 4 for SC and CT configurations:
The maximum error in predicting the pressure ratio is less than 0.5%, which shows that the numerical results based on the PT method have reasonable error. The error in predicting the efficiency and the onset of stall is discussed in Section 4.1.

4. Results

4.1. Compressor Characteristics

The time-averaged compressor characteristics at 100% design speed (3000 rpm) for SC (solid casing) and CT (casing treatment) configurations have been compared to the experimental results by Akhlaghi [24,42] in Figure 4. Maximum mass flow to near stall operating points was obtained by reducing mass flow at the outlet gradually. The simulations were conducted fully unsteadily using one-passage simulations. The onset of stall is estimated to initiate at 1.95 kg/s and 1.6 kg/s for SC and CT configurations, respectively. The procedures to detect stall inception in the numerical simulation have been discussed in Ref. [46].
Stall margin improvement (SMI) based on mass flow rates and pressure ratios is calculated using the following equation:
S t a l l   m a r g i n   i m p r o v e m e n t = m ˙   S t a l l S C × P R s t a l l S C m ˙ S t a l l C T × P R S t a l l C T m ˙   S t a l l S C × P R s t a l l S C  
where m ˙   S t a l l S C and m ˙ S t a l l C T are the mass flow rates, and P R s t a l l S C and P R S t a l l C T are the pressure ratios, both at the near stall points for SC and CT configurations, respectively.
According to the above equation, the stall margin improvement for CT configuration is 17.7%.
As seen in Figure 4, a reasonable agreement exists between the numerical and experimental results. CT configuration improves stall margin, but it causes a small efficiency penalty over the entire operating range of the compressor. The pressure ratios have been slightly underestimated by the simulations, while efficiencies have been overestimated by the simulations. The maximum error in predicting the pressure ratios is less than 0.5%. Furthermore, the numerical computations have, at the most, a 5% error in predicting the onset of stall/surge.
The reason for the discrepancy in efficiency is that the experimental efficiency has been calculated as the ratio of actual pressure rise to the ideal work input to the compressor, where the ideal work input to the compressor has been taken as the applied torque to the compressor times angular velocity of the rotor blade in Reference [42]. However, as the applied torque in the numerical simulations does not consider any mechanical losses between the rotor and the shaft, the denominator becomes smaller; hence, numerical efficiencies are slightly overestimated with respect to the experimental results. Nevertheless, the trend of the efficiency curves is correctly estimated by the simulations. The two operating points at 1.95 and 1.6 kg/s are the near stall points for SC and CT configurations, which have been marked by dashed circles in Figure 4. These operating points are shown as CT-1.95 and CT-1.6, and for their significance, analysis is made at these operating points in the next sections.

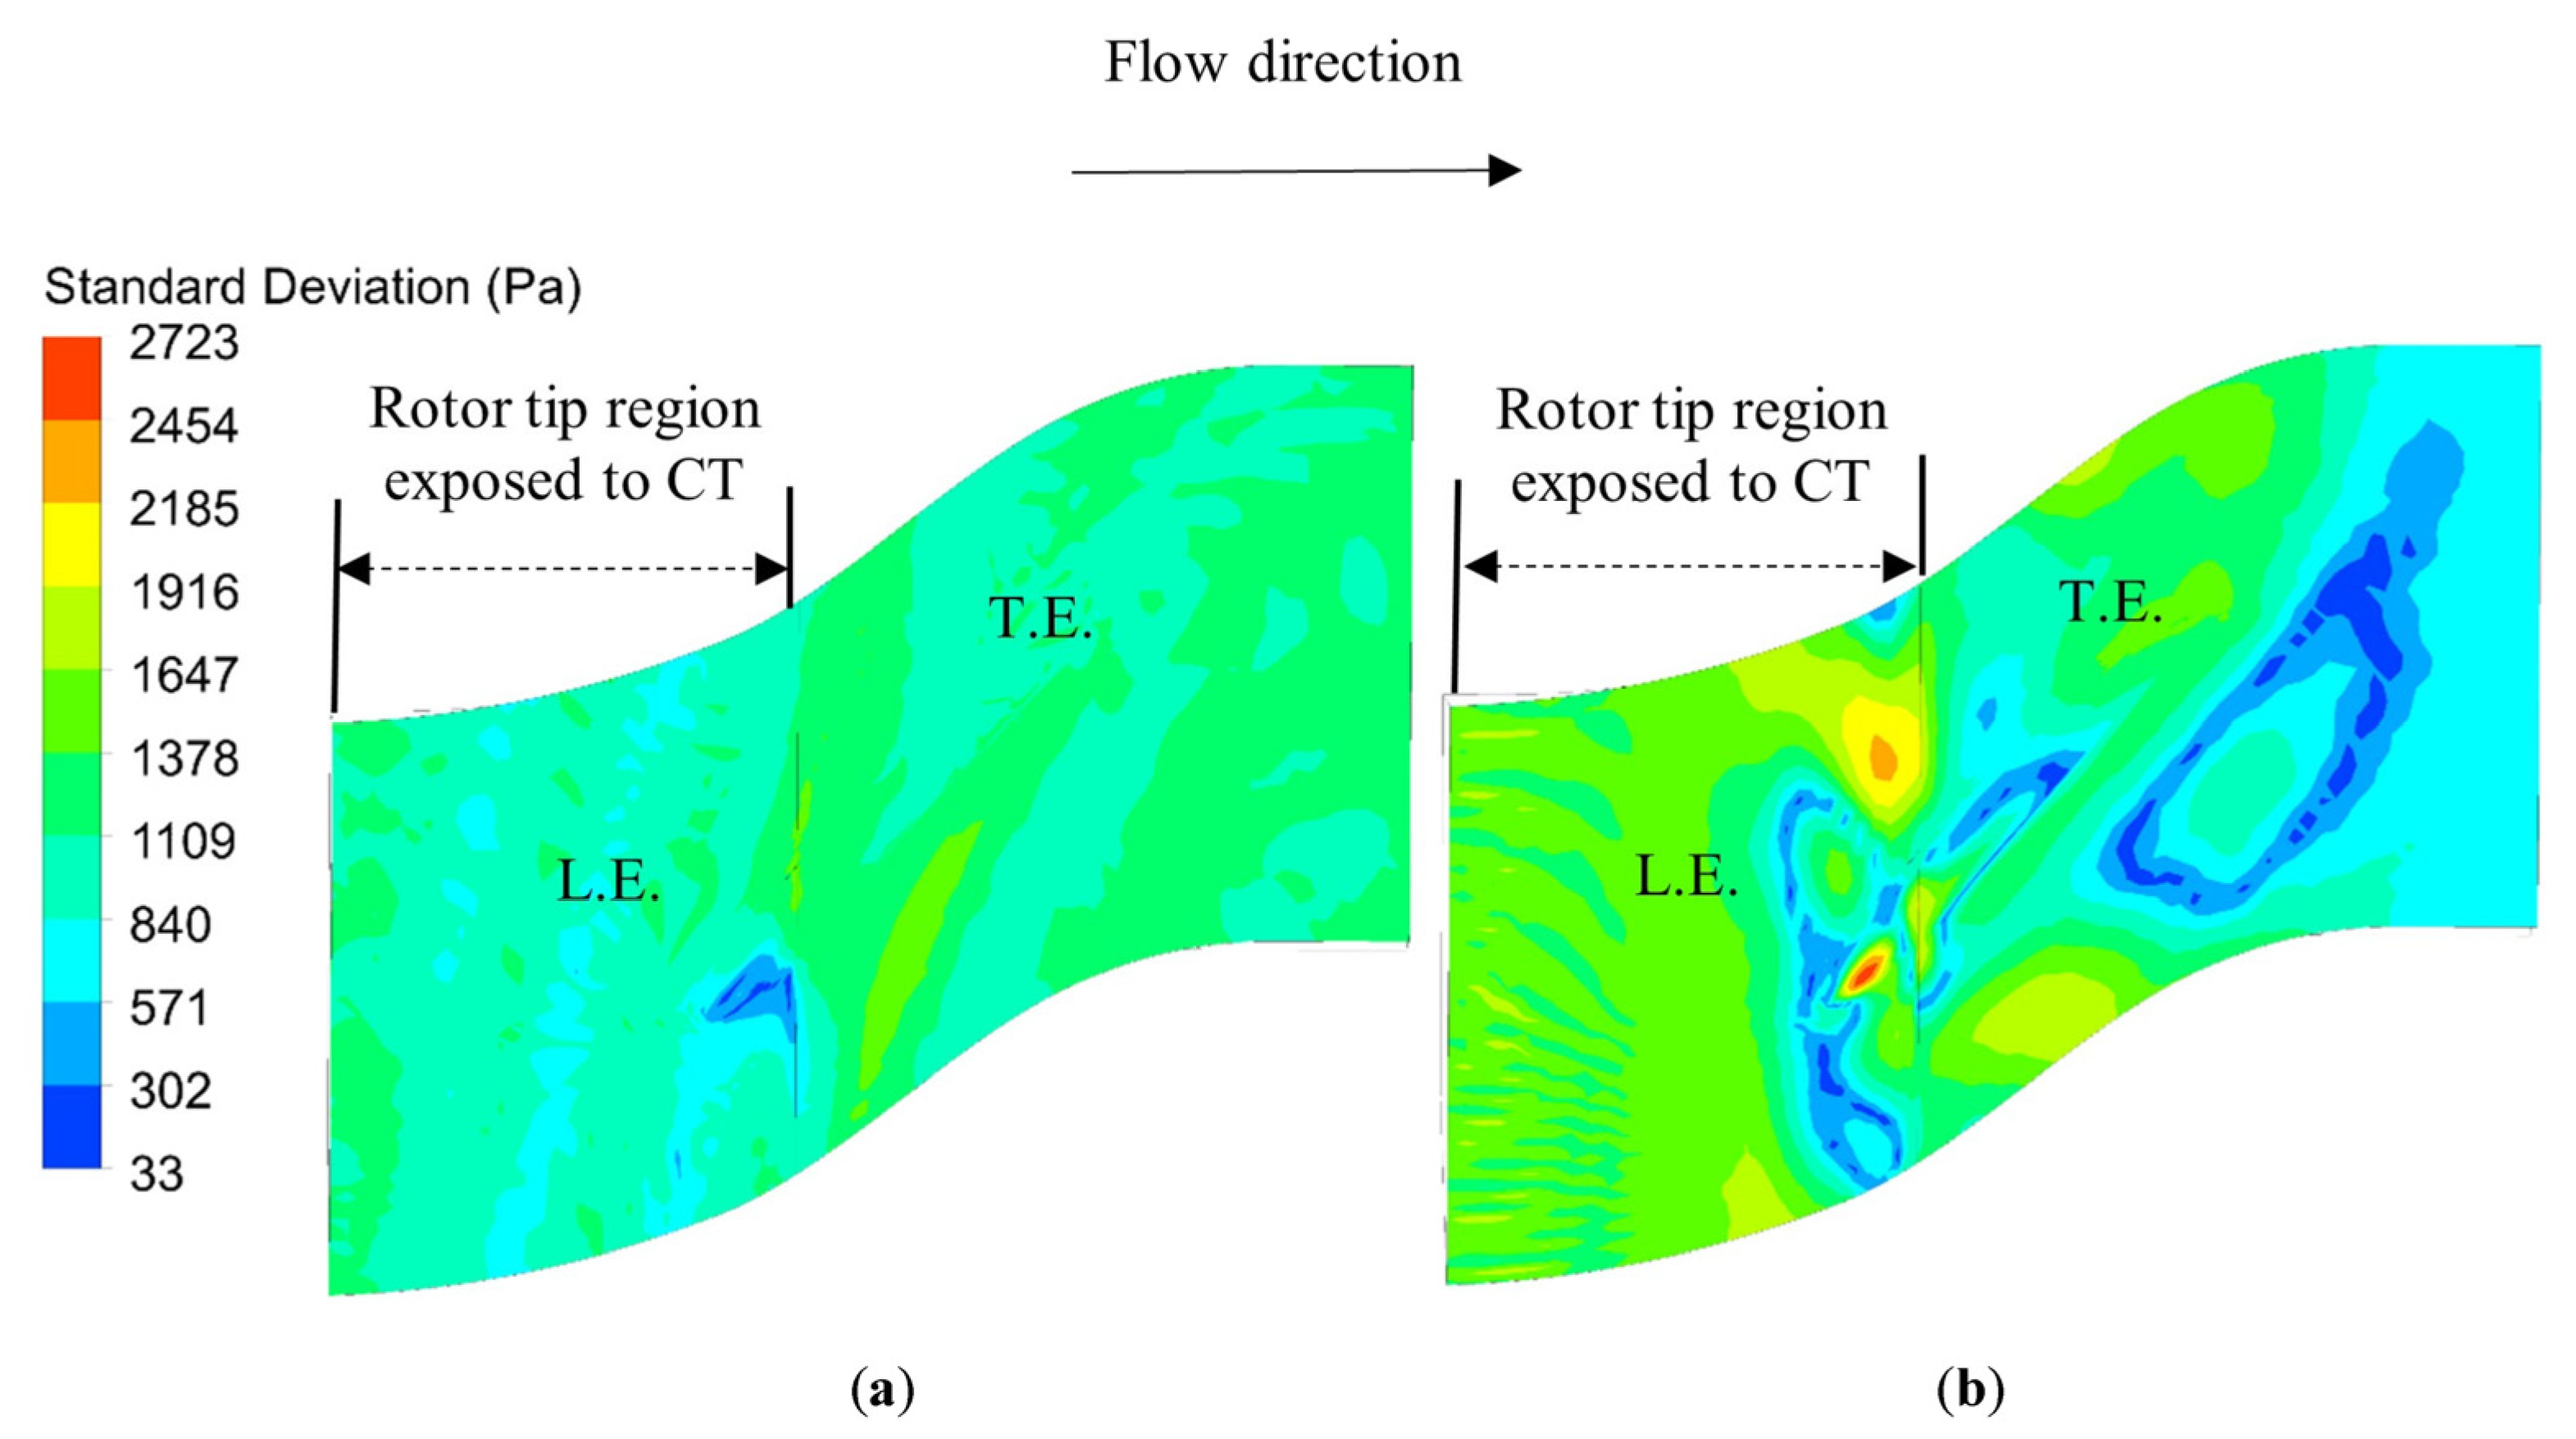
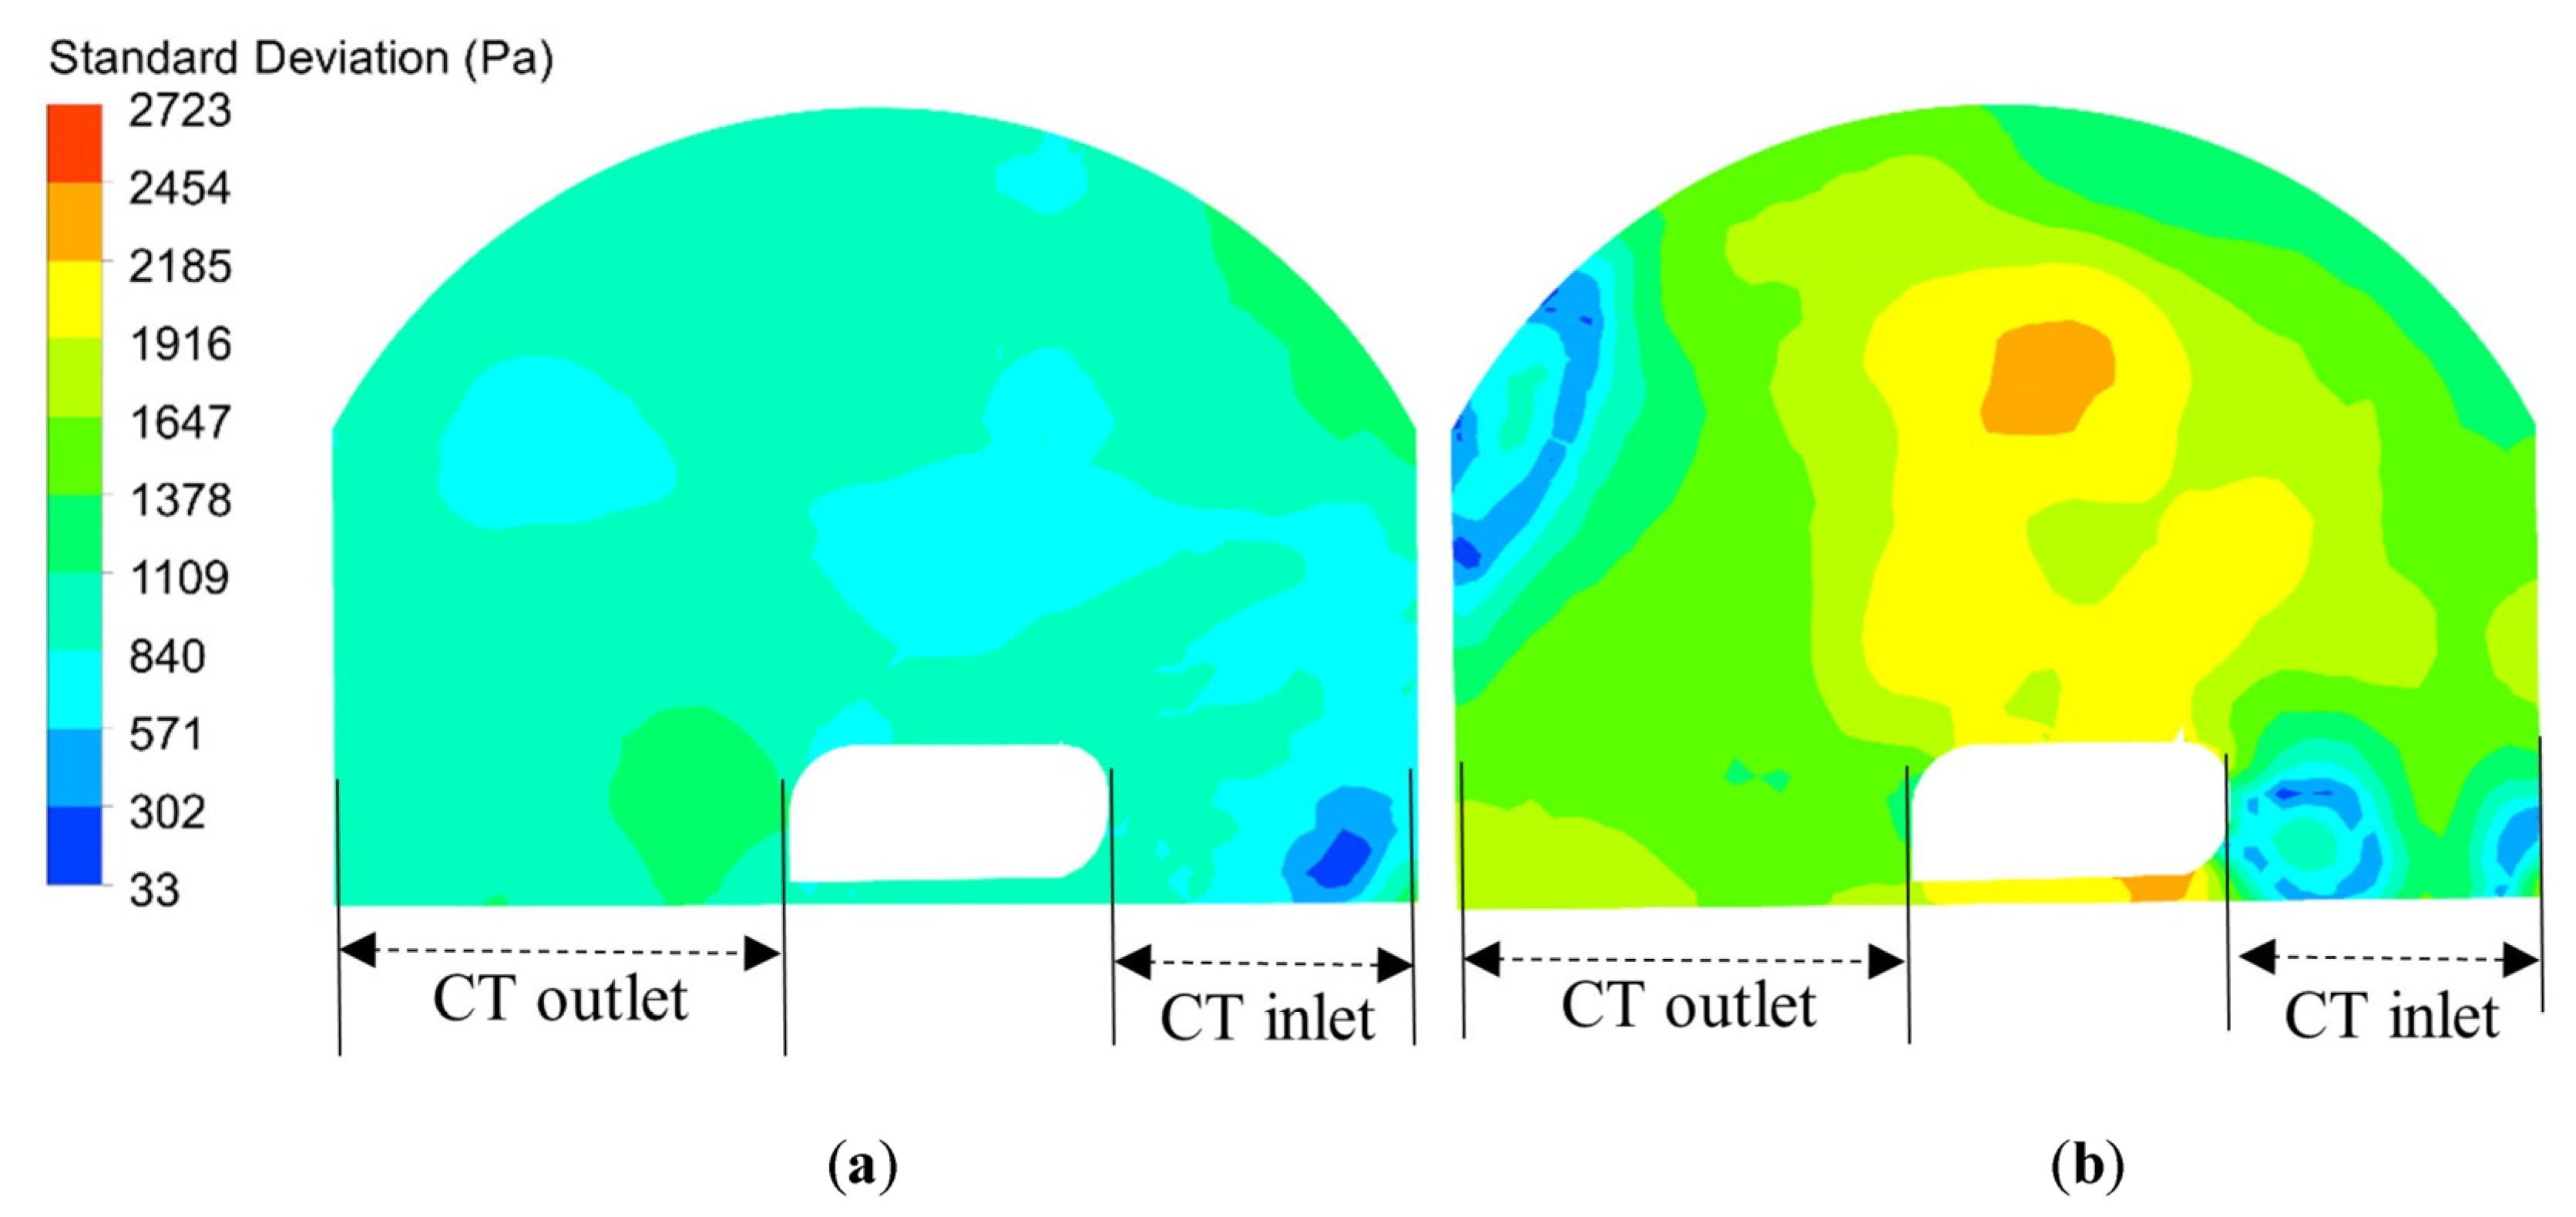
4.2. Unsteadiness of Rotor Blade Tip and Casing Treatment

Unsteadiness is a general issue in turbomachinery. In this section, the unsteadiness of rotor and casing treatment is discussed at the two operating at 1.95 and 1.6 kg/s. To quantify and demonstrate the unsteadiness, the standard deviation of static pressure has been utilized. The standard deviation of static pressure is defined as:
σ = 1 N 1 i = 1 N P i P ¯ 2
where N ,   P i , and P ¯ are the number of samples and instantaneous and time-averaged static pressure values, respectively. In this equation, N 1 , instead of N, has been used to express sample standard deviation. Sample standard deviation has been taken at the mid-space of tip clearance and the vane passages inside the casing treatment.
Figure 5 and Figure 6 demonstrate that at CT-1.95, the lowest unsteadiness is located at the leading-edge area, where the standard deviation drops to the lowest level. On the other hand, higher unsteadiness can be observed at the region downstream of rotor exposure to the casing treatment. The distribution of standard deviation for the region exposed to the casing treatment is nearly uniform to some extent. The most distinct area inside the casing treatment is located at the inlet to the casing treatment, where the unsteadiness has reduced to the lowest values. Nevertheless, the distribution of standard deviation inside the casing treatment does not change significantly. With the reduction in mass flow to 1.6 kg/s, it can be observed that a dramatic increase in unsteadiness occurs, especially at the leading edge as well as the region exposed to the casing treatment. Furthermore, the comparison between the two operating points indicates that the unsteadiness increases in most areas. This indicates that the unsteadiness intensifies when the compressor operating condition moves toward stall/surge condition. Downstream the casing treatment direct influence, the unsteadiness drops at the regions adjacent to the trailing edge. As for the distribution inside the casing treatment, the unsteadiness increases inside the casing treatment, and a region with higher unsteadiness is concentrated in the middle of the casing treatment, where a vortex flow is located. The analysis in this section reveals that the unsteadiness of static pressure with different intensities occurs, particularly for CT-1.6 at the rotor tip as well as inside the casing treatment, and the assumption of a steady state flow process is not reasonable.

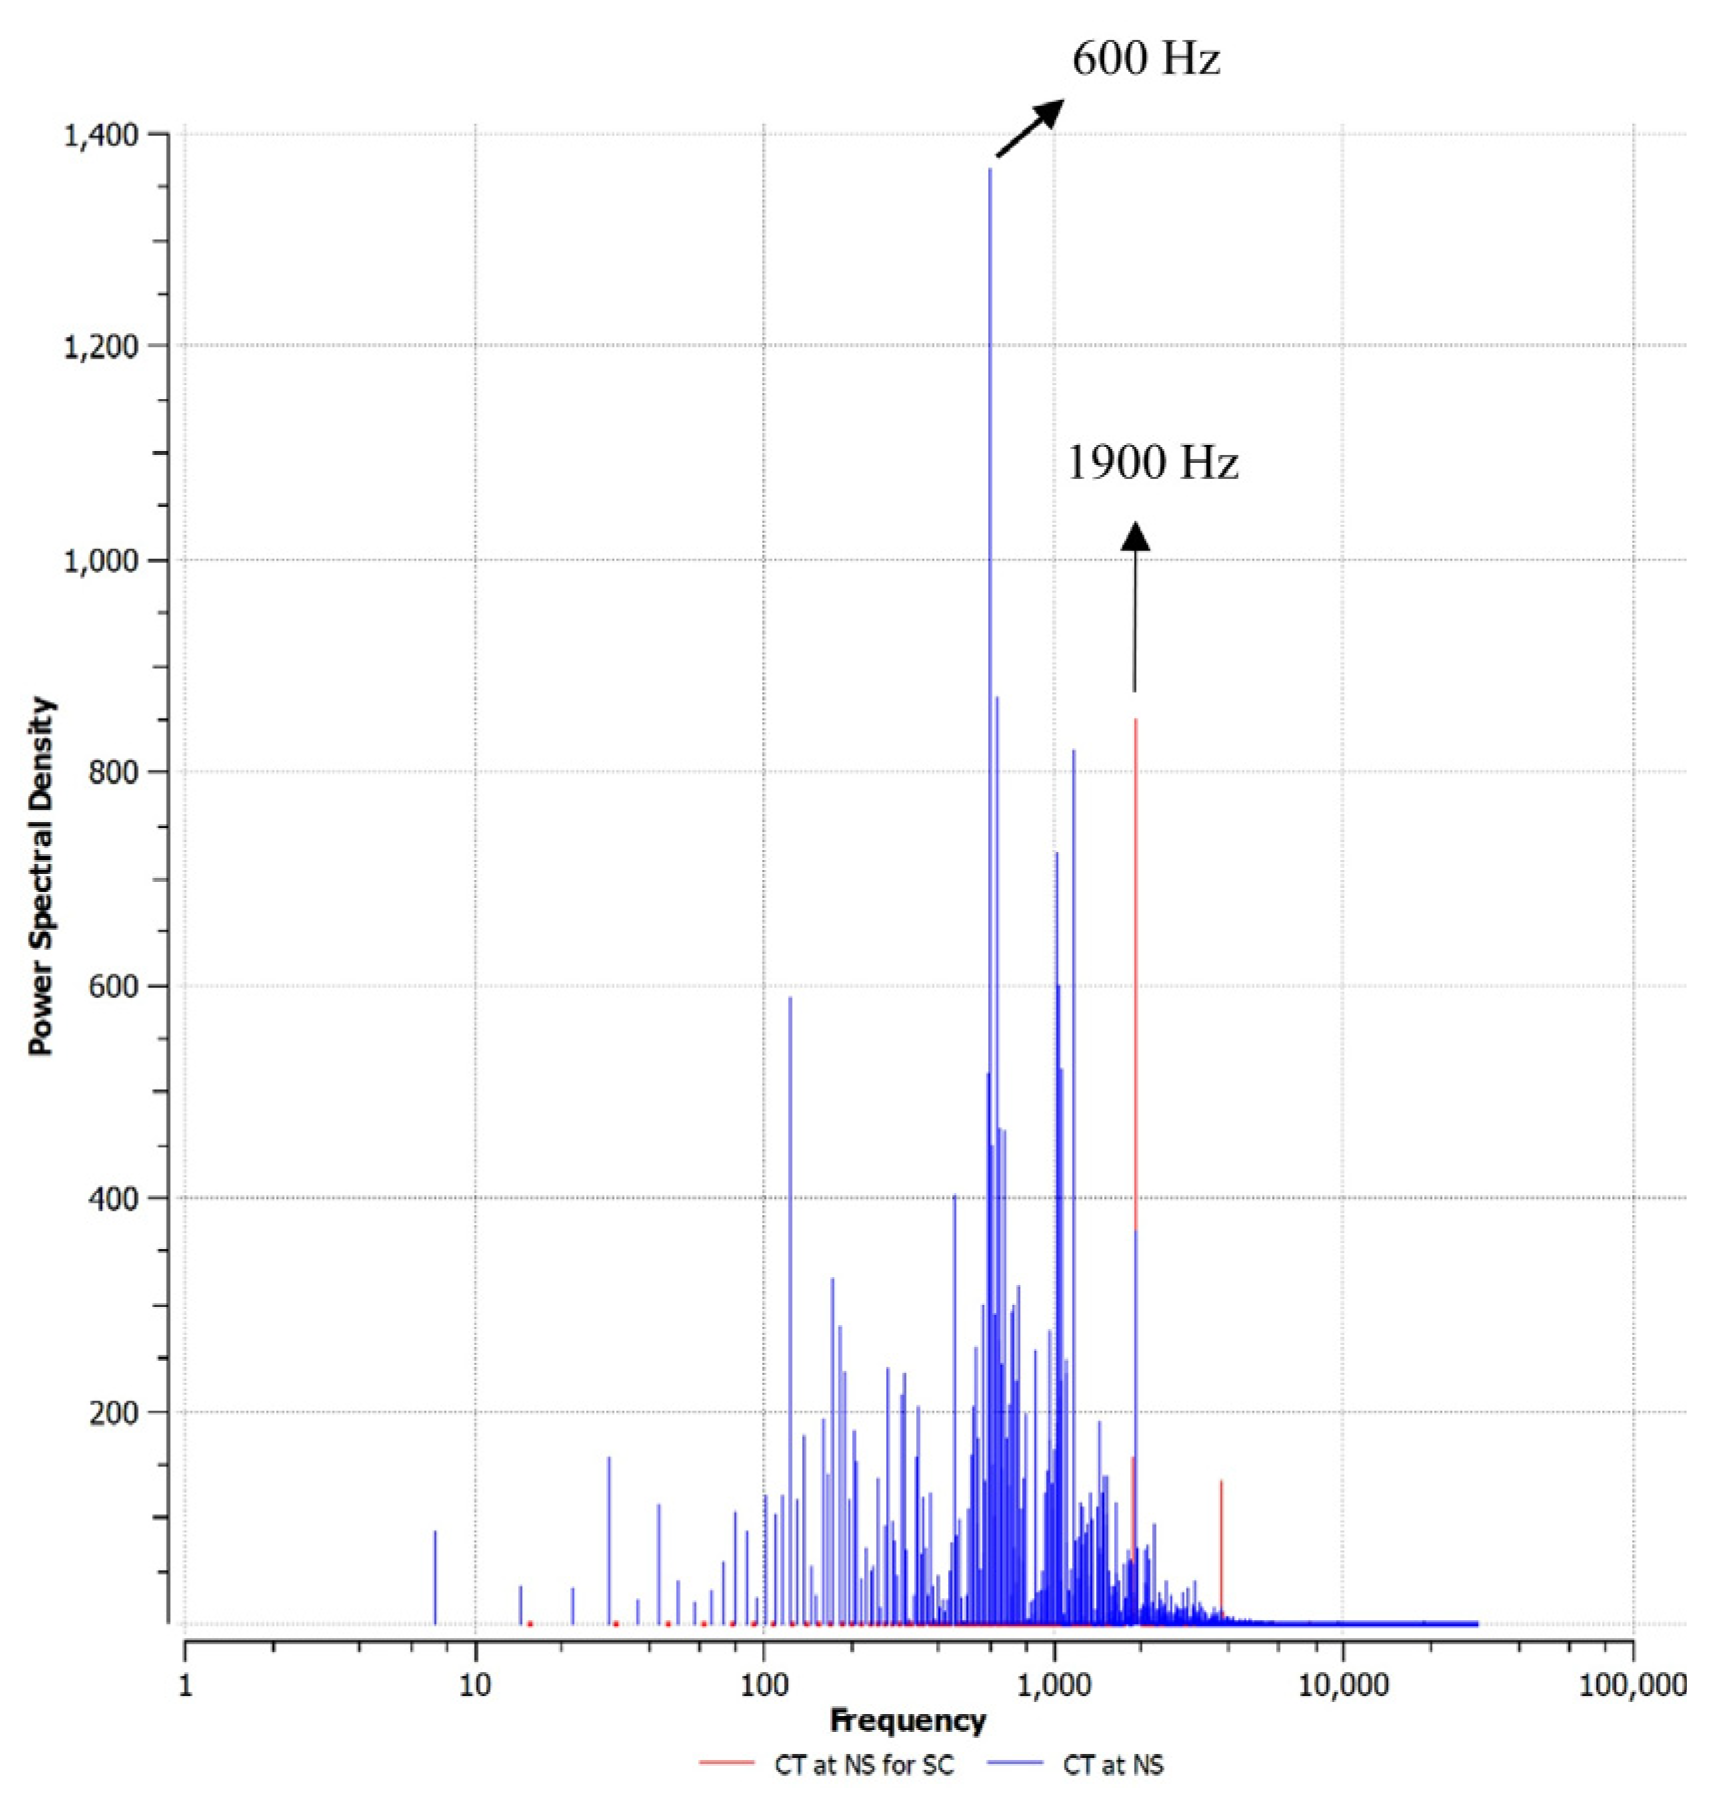
4.3. Frequency Analysis

In this section, the FFT analysis of the static pressure signal was performed to identify the unsteady characteristics in the rotor tip and the casing treatment. Figure 7 shows the FFT analysis for the pressure signal at 1.95 and 1.6 kg/s. The signal was recorded by a numerical probe, which is located near the tip of the rotor-leading edge. The numerical probe was placed in the absolute frame of reference. As the compressor is operating at the near stall point for SC configuration at 1.95 kg/s, it can be observed that a peak frequency occurs at 1900 Hz. This frequency corresponds to the rotor blade passing frequency (BPF). In this operating point, the contents of the frequency spectrum are composed of BPF and its harmonics. As the mass flow is reduced to 1.6 kg/s and the near stall point is approached for CT configuration, new frequencies related to stall cells emerge, and the frequency band is extended. The increase in frequency band can be explained by the formation of secondary flow patterns at lower mass flow rates, which induce many peaks. It can be observed that a dominating frequency related to instabilities at 600 Hz (0.315 BPF) appears. In the meantime, the frequency at 1900 Hz still exists, but the power reduces significantly.

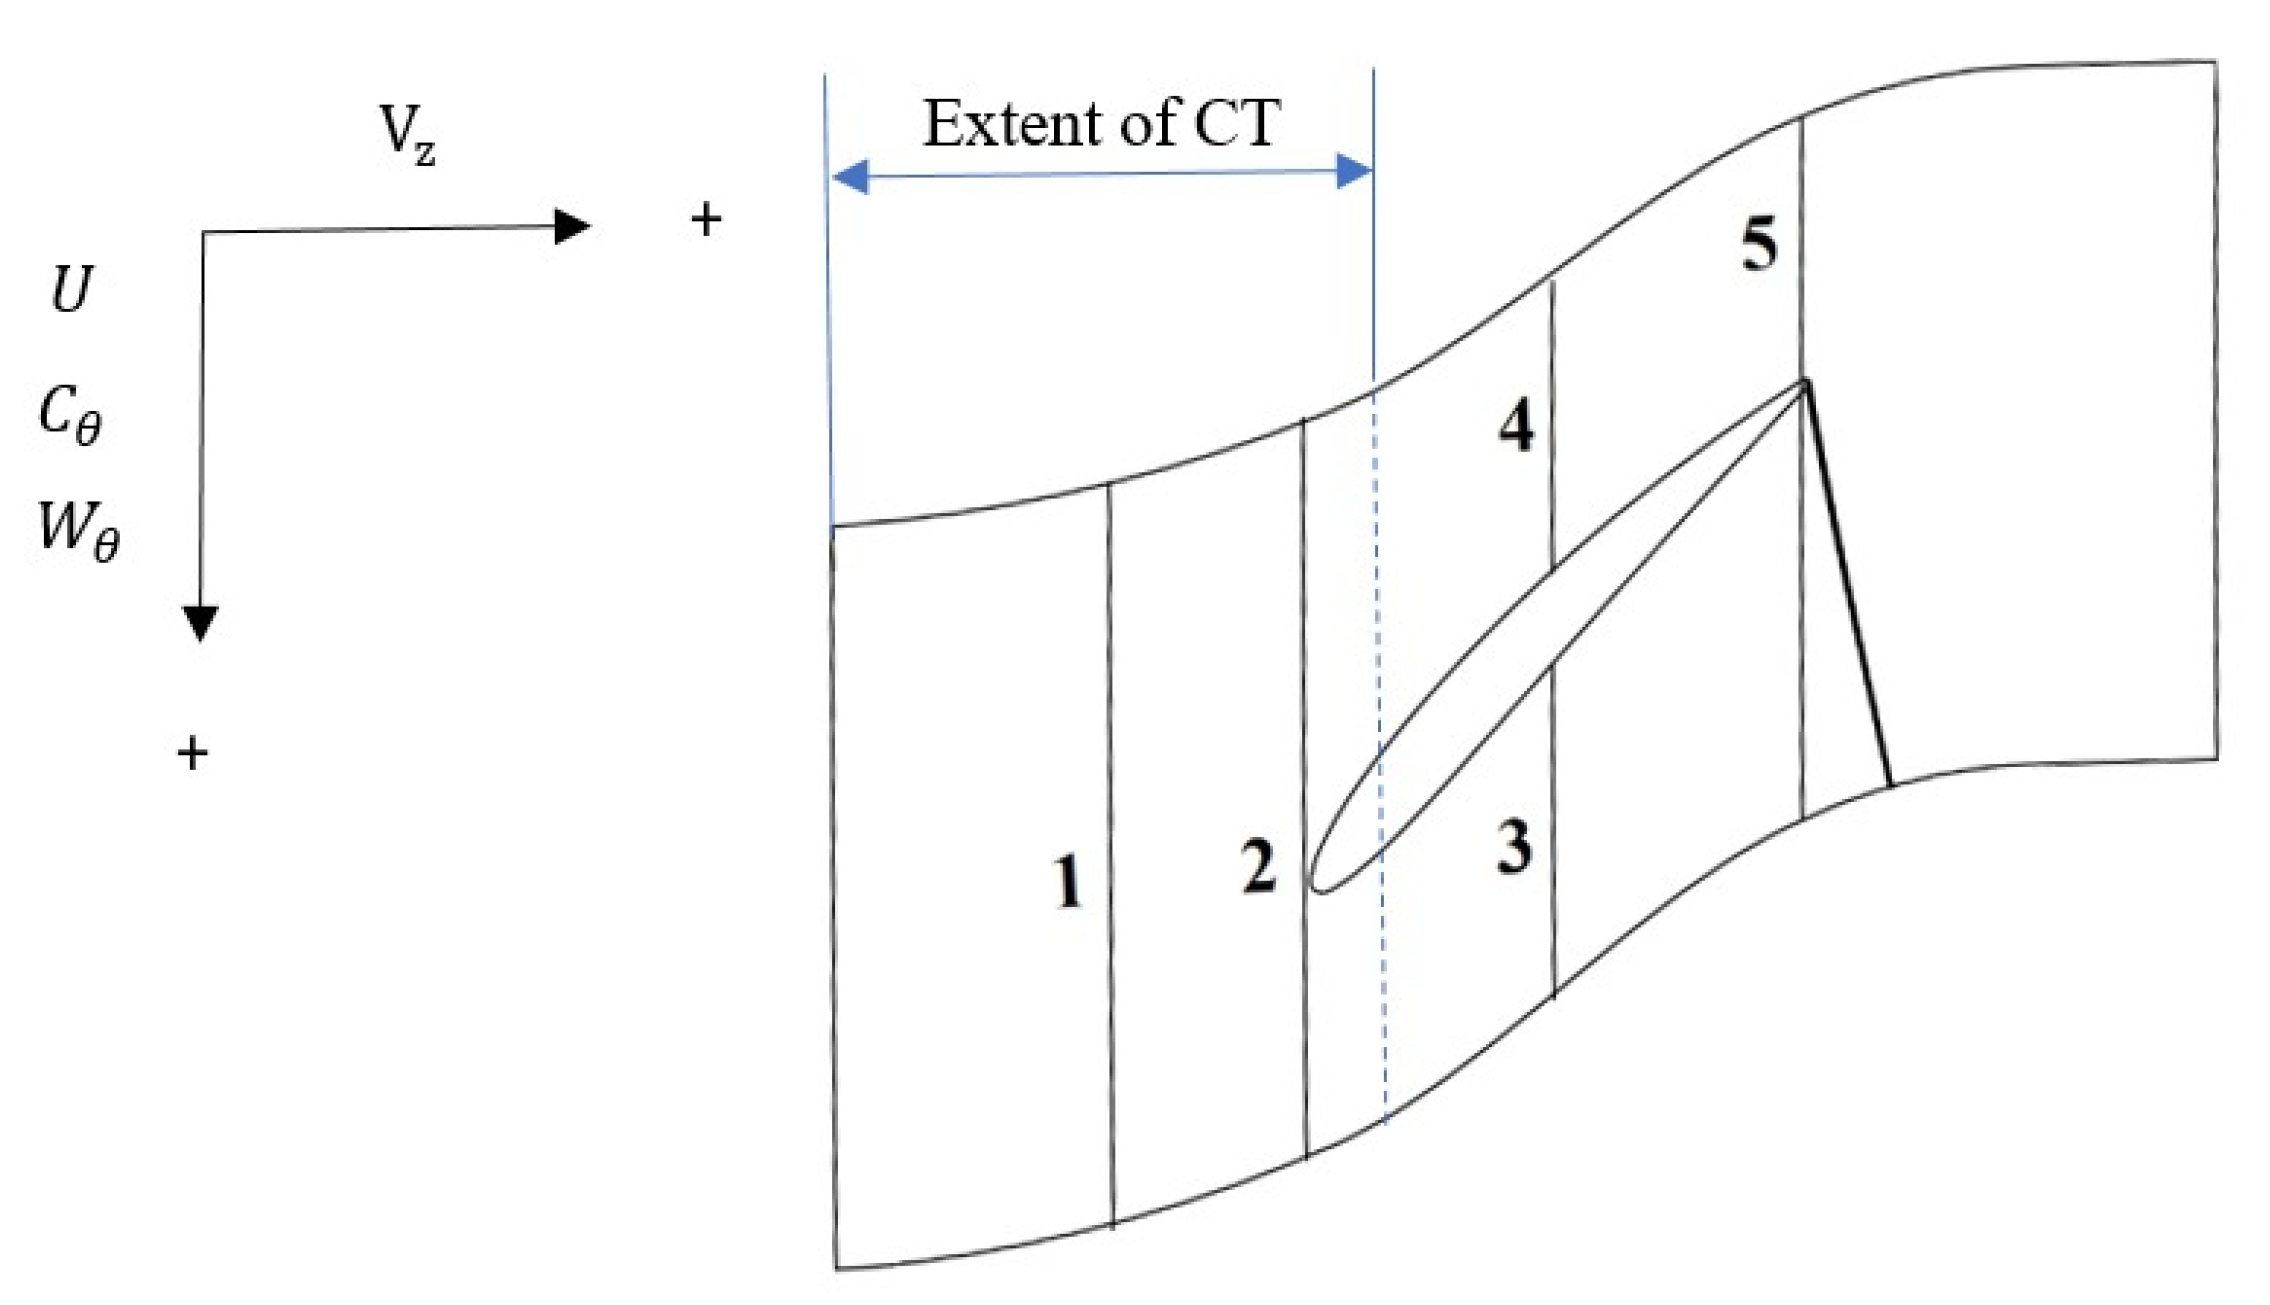
4.4. Velocity Components Analysis

To further explain the influence of the casing treatment on the tip flow field, Table 5 presents the instantaneous and the circumferential-averaged velocity components at 99% span during a rotor passing period t 1 ,   t 2 ,   t 3 . In Table 6 and Table 7, sections 1–5 correspond to the upstream of the leading edge, the leading-edge plane, the middle of the leading edge and the trailing edge pressure side, the middle of the leading edge and the trailing edge suction side, and the trailing edge plane, respectively, as shown in Figure 8. The adopted sign convention is also shown in this figure. According to this convention, the radial velocity component is considered positive when it is directed upward. Moreover, the swirl velocity component is considered positive when it is in the direction of the rotor rotation. It should be noted that the reported swirl velocity components in Table 5 and Table 7 are relative, while the swirl velocity components in Table 6 and Table 8 are absolute. Figure 9 shows the relative W θ and absolute swirl velocity C θ in a velocity triangle, respectively. The relationship between velocity components is as follows:
C = W + U
sin β = W θ W
U = W θ + C θ  
As the compressor is operating at the near stall condition at 1.95 kg/s, the rotor passage accumulates with low axial momentum fluid, which induces a flow blockage area. After the introduction of the casing treatment at CT-1.95, the low-speed regions shrink and move toward the trailing edge. The distributions of radial, swirl, and axial velocity components in Table 5 show that the velocity components experience small changes during a passing period, which confirms that the flow behaves unsteadily. It can be observed that the absolute value of the relative swirl velocity component is reduced from section 1 to section 5, except between sections 3 and 4. This reduction can be explained due to two reasons: First, as the low-speed fluid regions which cause flow blockage decrease and move toward the trailing edge, the relative velocity increases toward the leading edge and decreases toward the trailing edge. The relative velocity vector is shown by red arrows in Figure 10. Second, the relative flow angle with respect to the axial direction, which is directed to the right, is increased for most sections from section 1 to section 5. The comparison between the radial velocity components at CT-1.95 indicates that a higher radial velocity occurs at section 3 during t 1 ,   t 2 ,   t 3 . The development of this flow can be explained due to the difference in pressure between the rotor with higher-pressure fluid and the casing treatment.
Table 6 summarizes the inflow/outflow velocity components to/from the casing treatment. It demonstrates that all three velocity components are reduced by the casing treatment at 1.95 kg/s. Importantly, the reductions of the absolute velocity components, which is a key function of the vaned-recessed casing treatment, occur. Table 6 additionally shows that the velocity components experience small changes during the time t 1 ,   t 2 ,   t 3 , which is in accord with the results in Figure 5 and Figure 6.
As the mass flow is reduced to 1.6 kg/s, the three velocity components experience noticeable changes during t 1 ,   t 2 ,   t 3 in Table 7. Table 7 shows that the radial velocity components increase toward the upstream and leading edge when compared to 1.95 kg/s. The increase in radial velocity can be explained by the increase in the casing treatment’s suction and injection effects. However, since the axial rotor tip exposure is limited to 23.2%, the increase in radial velocity does not occur toward the trailing edge, and even a reduction in radial velocity occurs in some cases. As the mass flow decreases to 1.6 kg/s, the low axial momentum regions grow once again and move toward the upstream and accumulate the rotor passage. As a result, the axial velocity decreases in most sections. This can be observed by comparing the axial velocity columns in Table 5 and Table 7.
Table 8 demonstrates a key difference in the influence of the casing treatment at 1.95 kg/s. While the three velocity components reduce by the casing treatment at 1.95 kg/s, the axial velocity components increase at 1.6 kg/s during a rotor passing period. The reason for the difference in the reduction and increase in axial velocity components at 1.95 and 1.6 kg/s is discussed in Section 4.6.2.

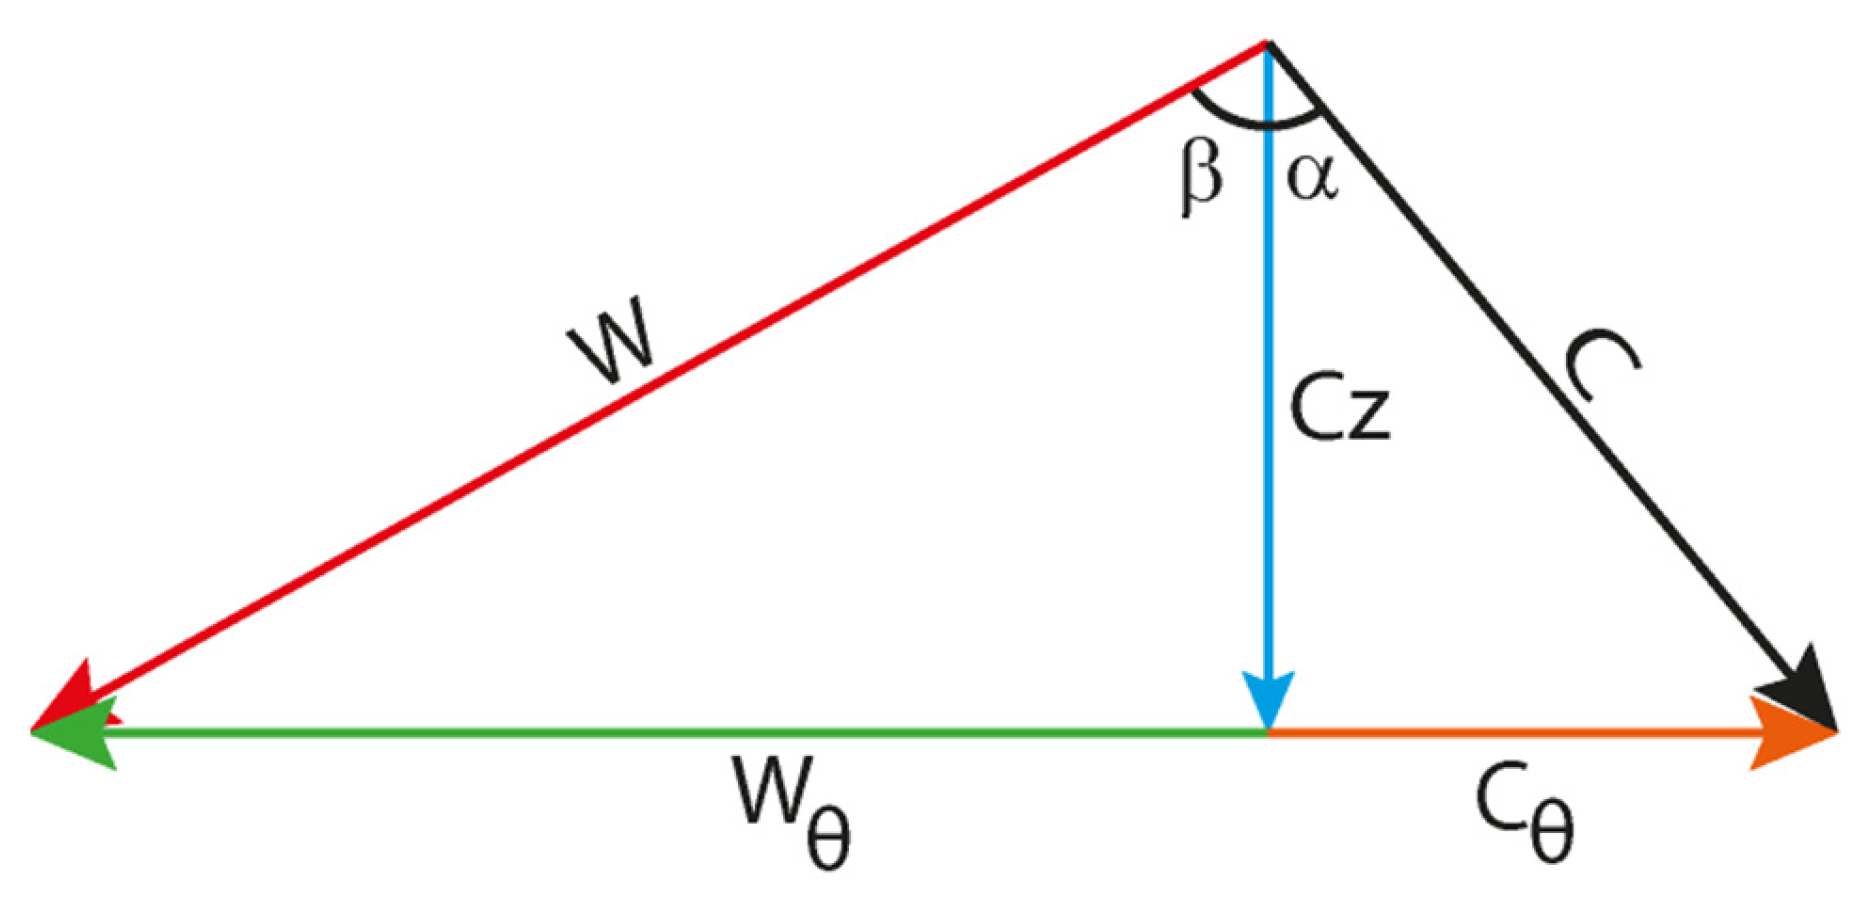
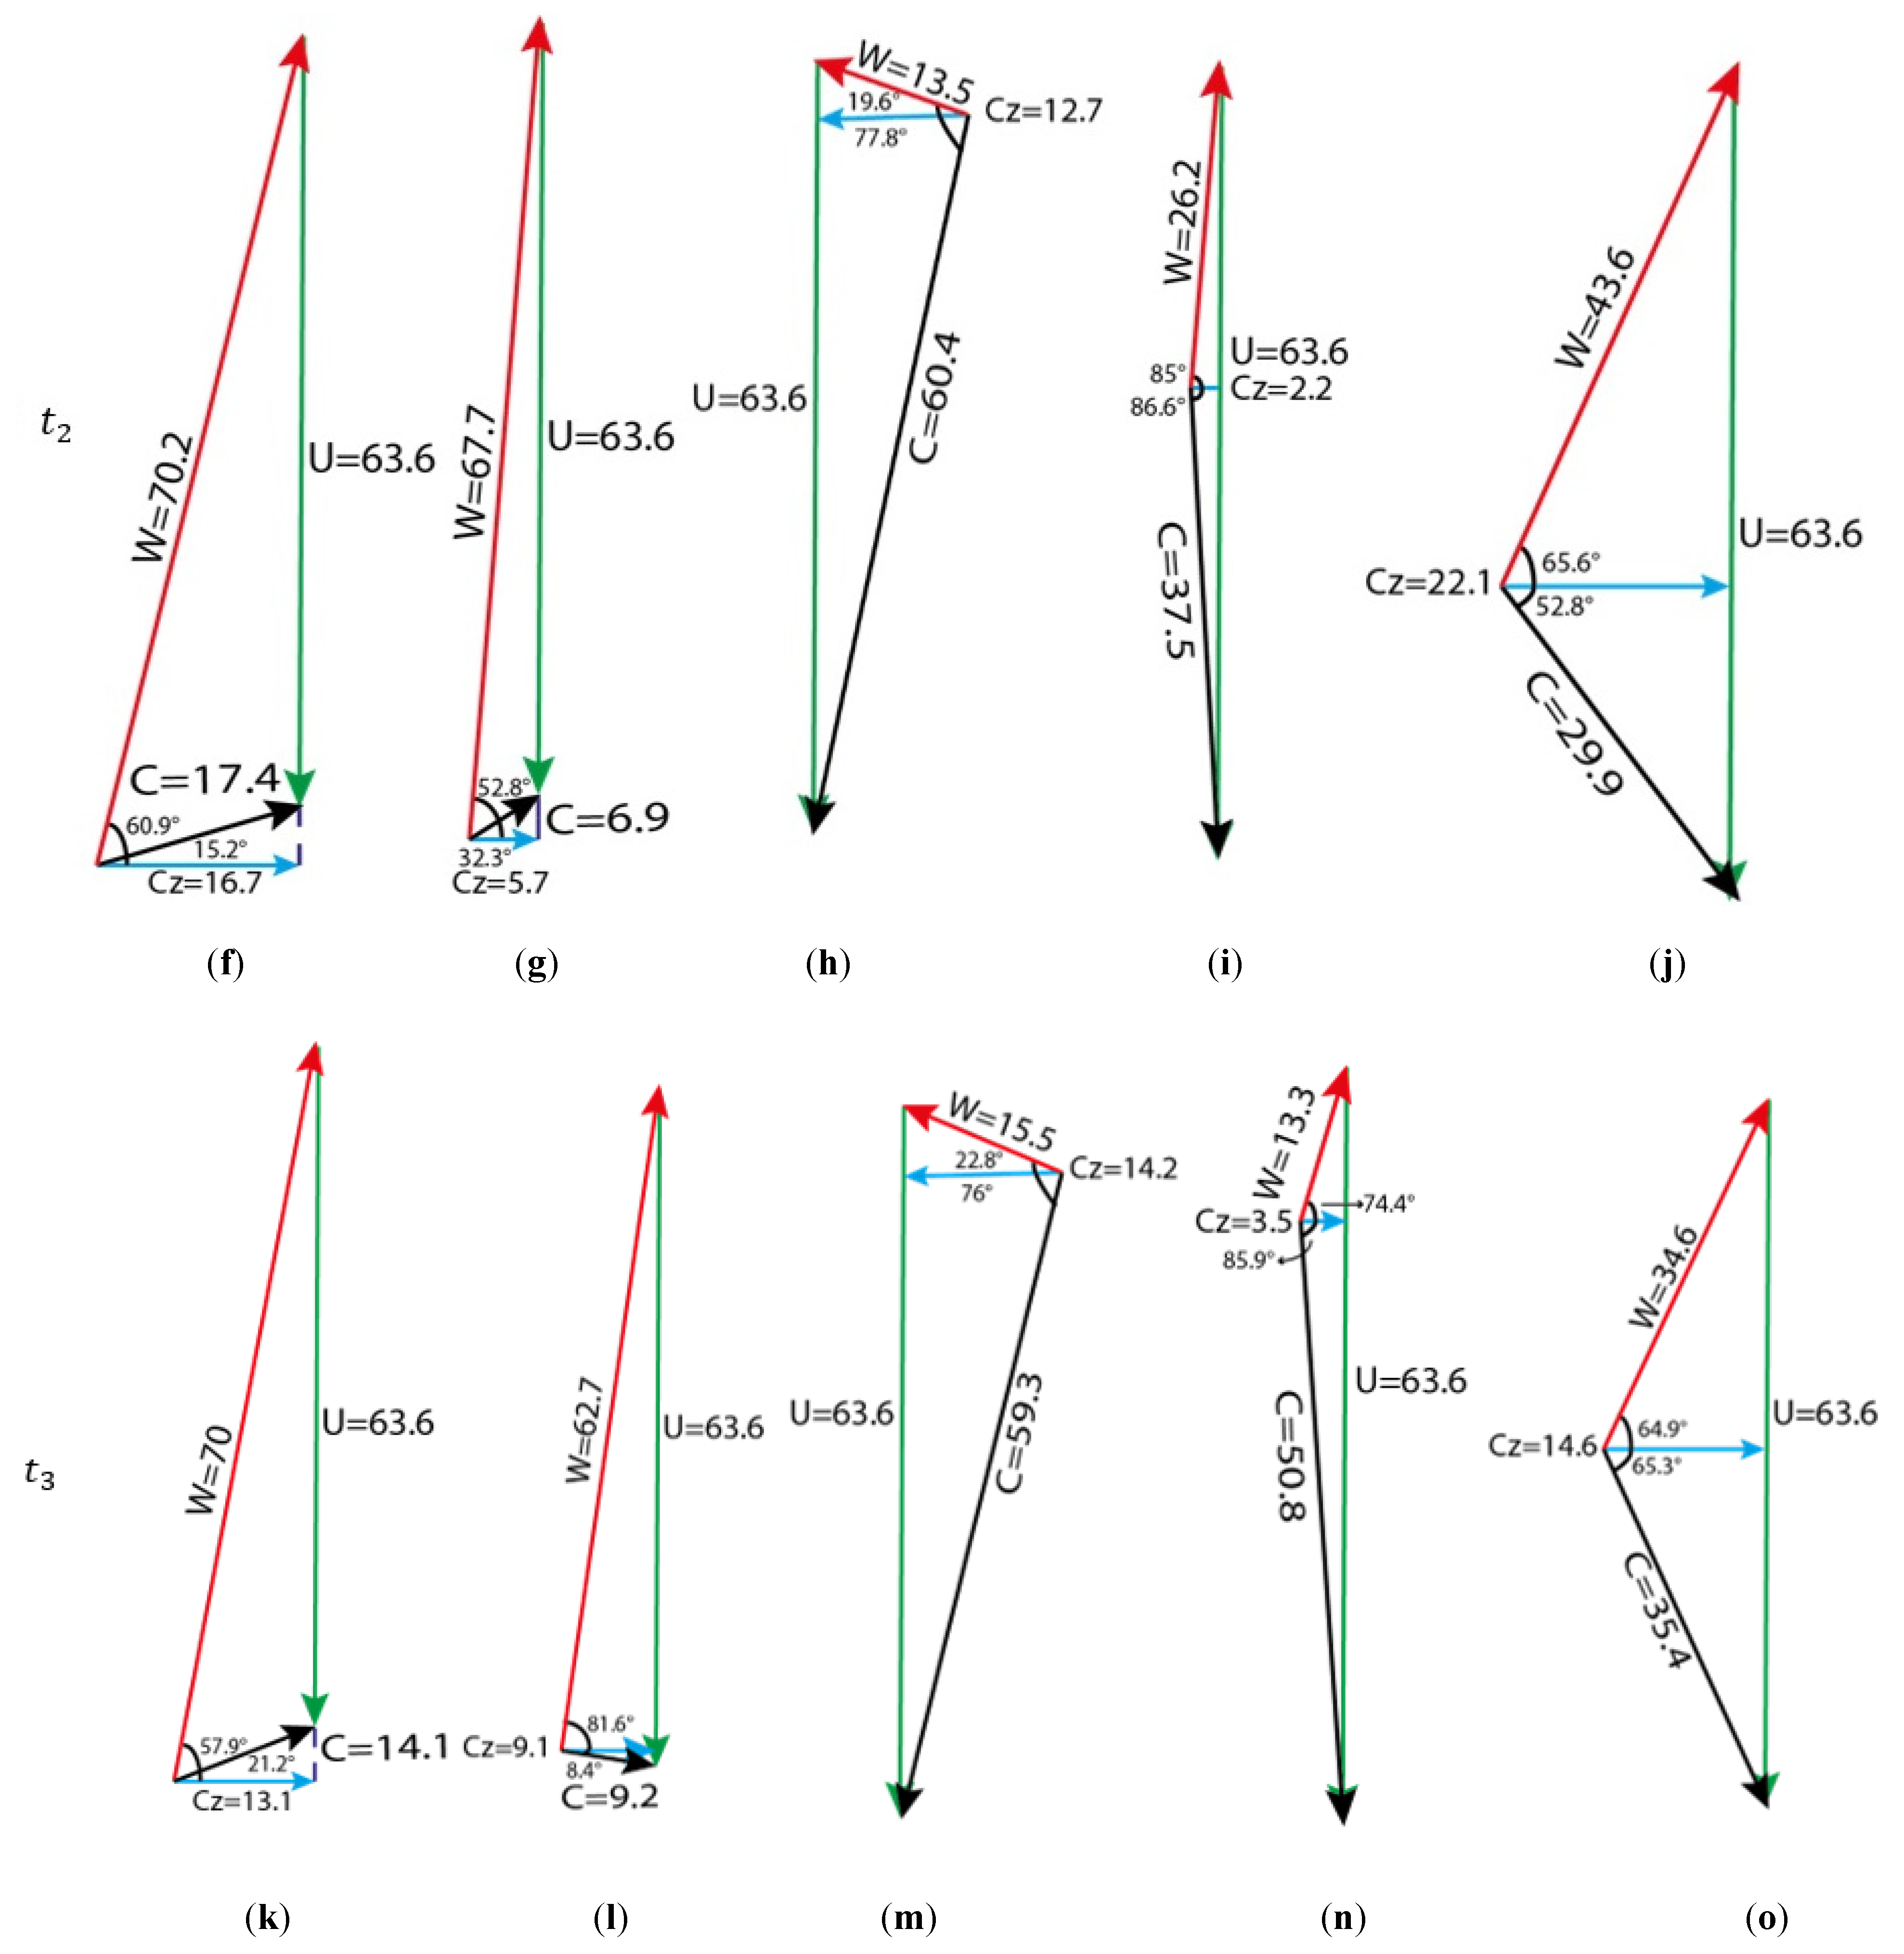
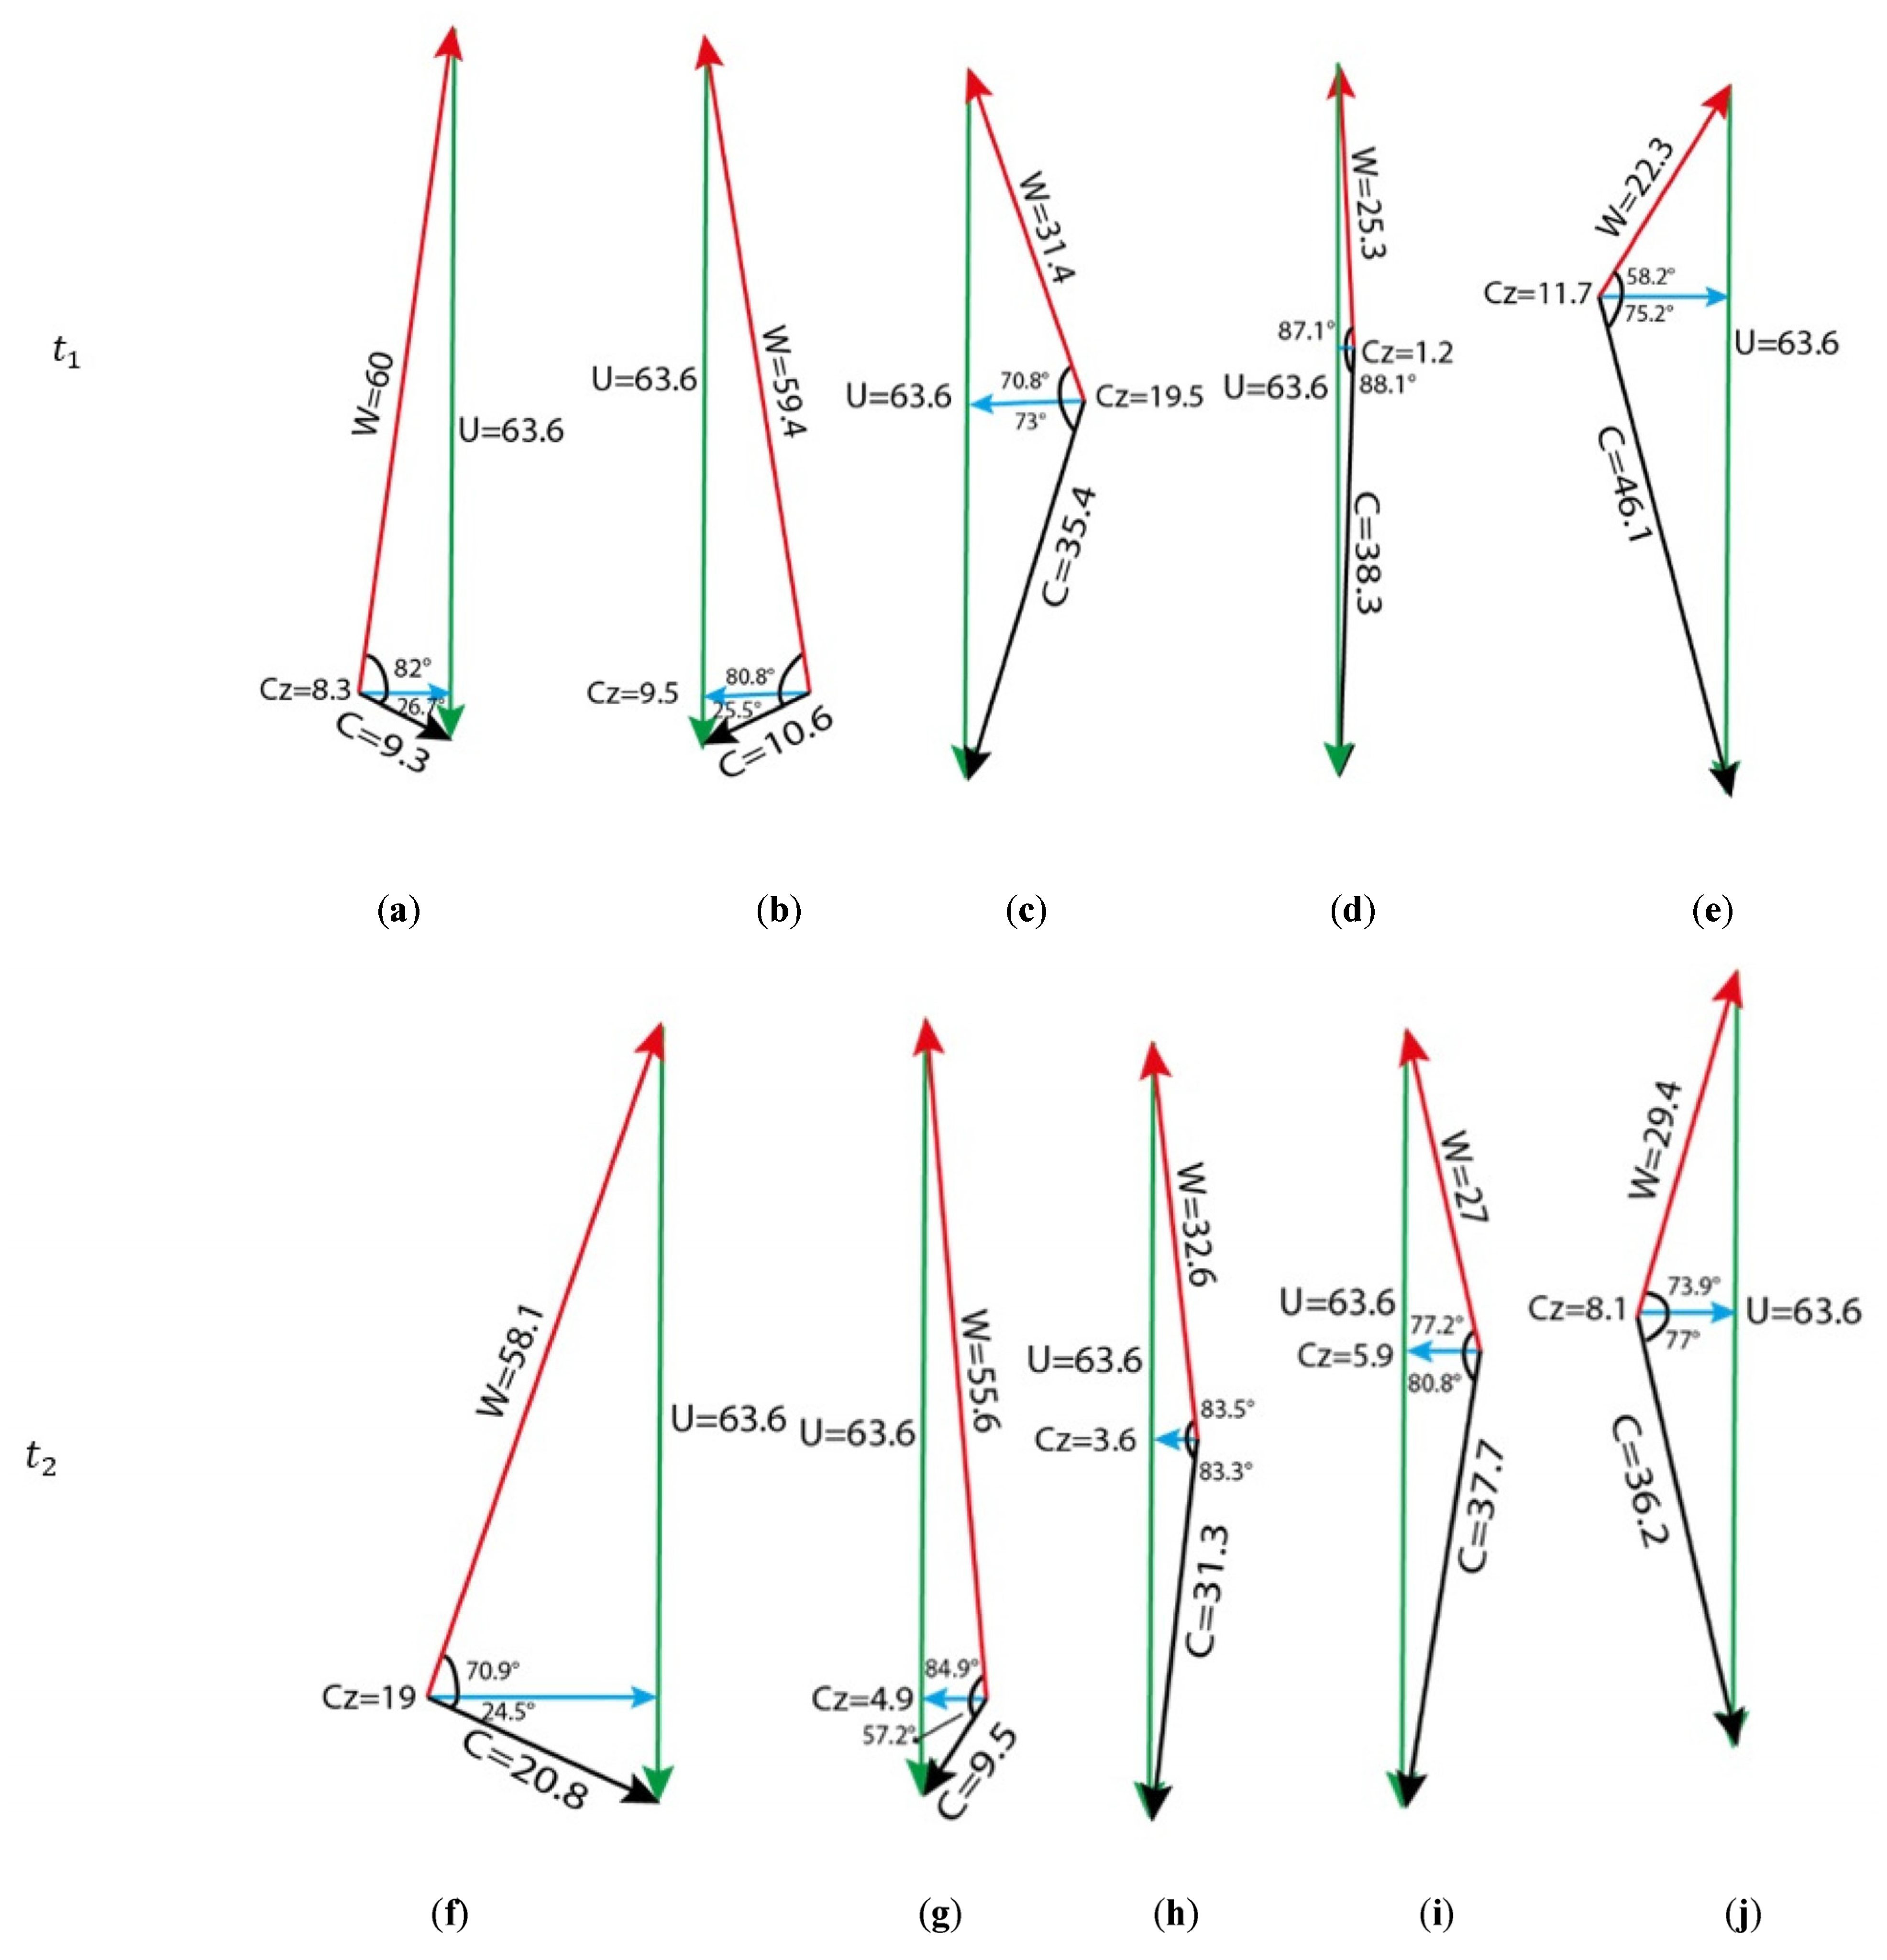
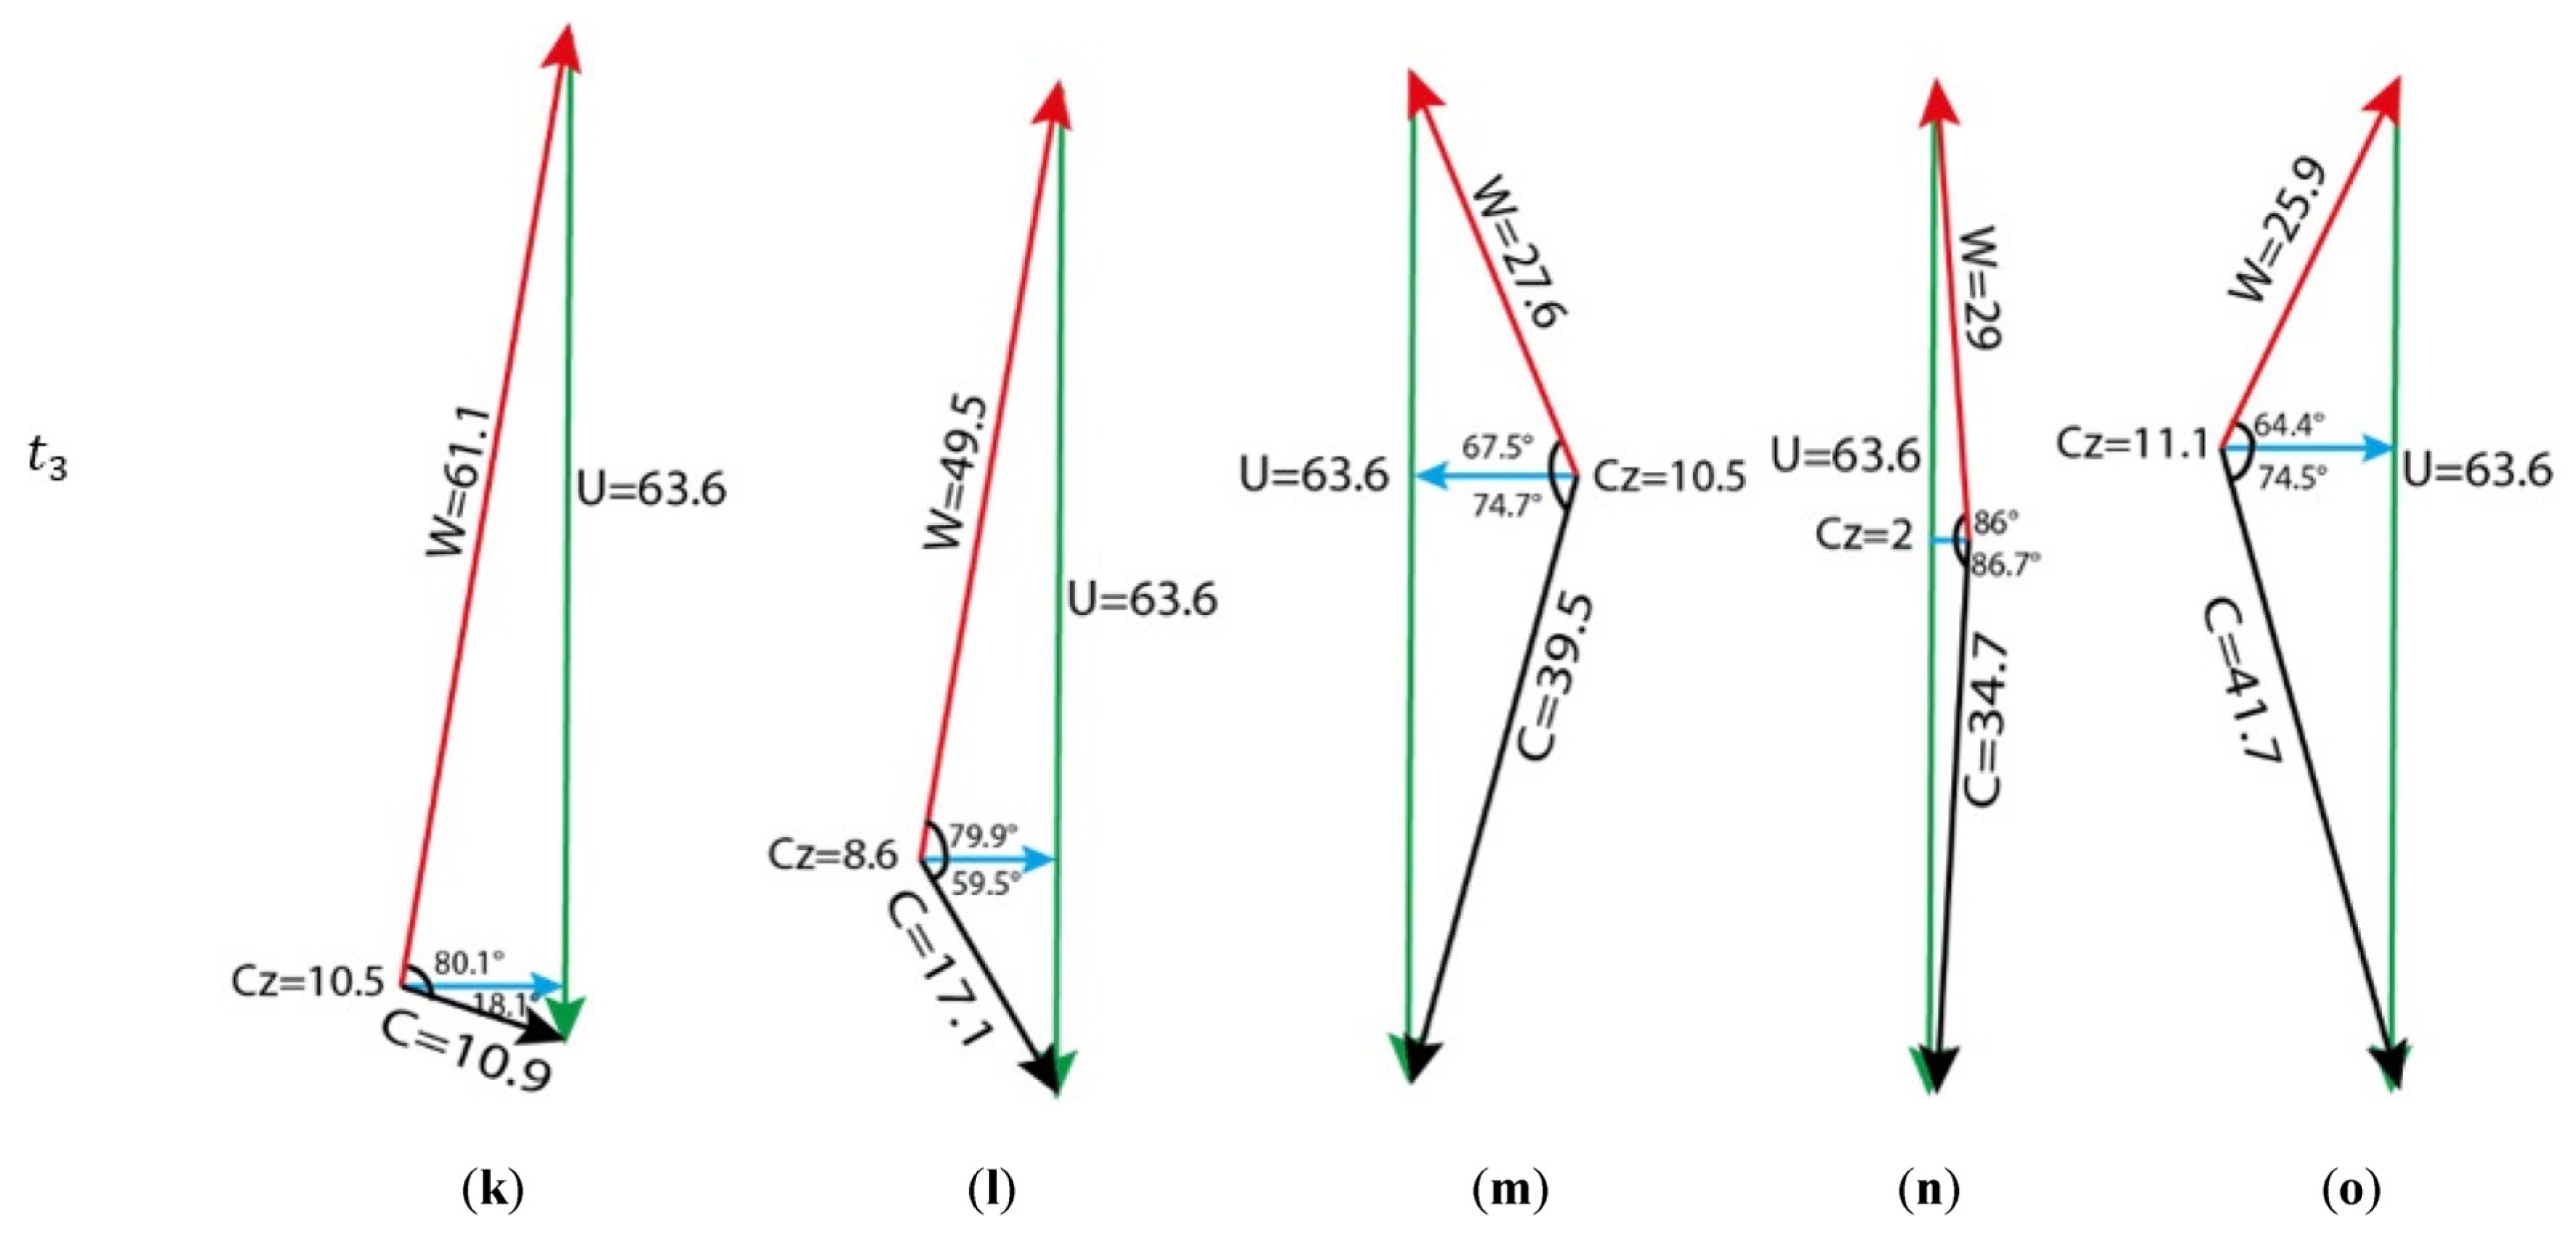
4.5. Velocity Triangles

This section demonstrates a comparison of velocity triangles at the five sections in Figure 8 at 1.95 and 1.6 kg/s. In order to analyze the change in velocity components and velocity directions, the velocity triangles have been shown at the same time steps as t 1 ,   t 2 , and t 3 . It should be noted that the velocity triangles are instantaneous, and they show the velocity triangles at a point roughly at the midpoints of the five lines in Figure 8. The leftmost velocity triangles in Figure 10 and Figure 11 correspond to the midpoint of the first line in Figure 8, and the second velocity triangle corresponds to the midpoint of the second line in Figure 8, etc.
Based on the changes in velocity components and directions, it can be observed that the relative and absolute velocity, the relative and absolute flow angles, and the axial velocity values undergo noticeable changes during the time t 1 ,   t 2 , and t 3 . Moreover, the velocity triangles demonstrate that the trend of change is not regular from one point to another. Note that the average relative flow angle at the upstream of the rotor (section 1) increases from 77.6 ° to 79 ° as the mass flow decreases from 1.95 kg/s to 1.6 kg/s. The comparison between the velocity triangles at 1.95 and 1.6 kg/s indicates that the velocity components are not constant at a specific point, and rather, they change in general. The velocity triangles in this section confirm that the rotor tip flow at the two operating points has unsteady behavior.

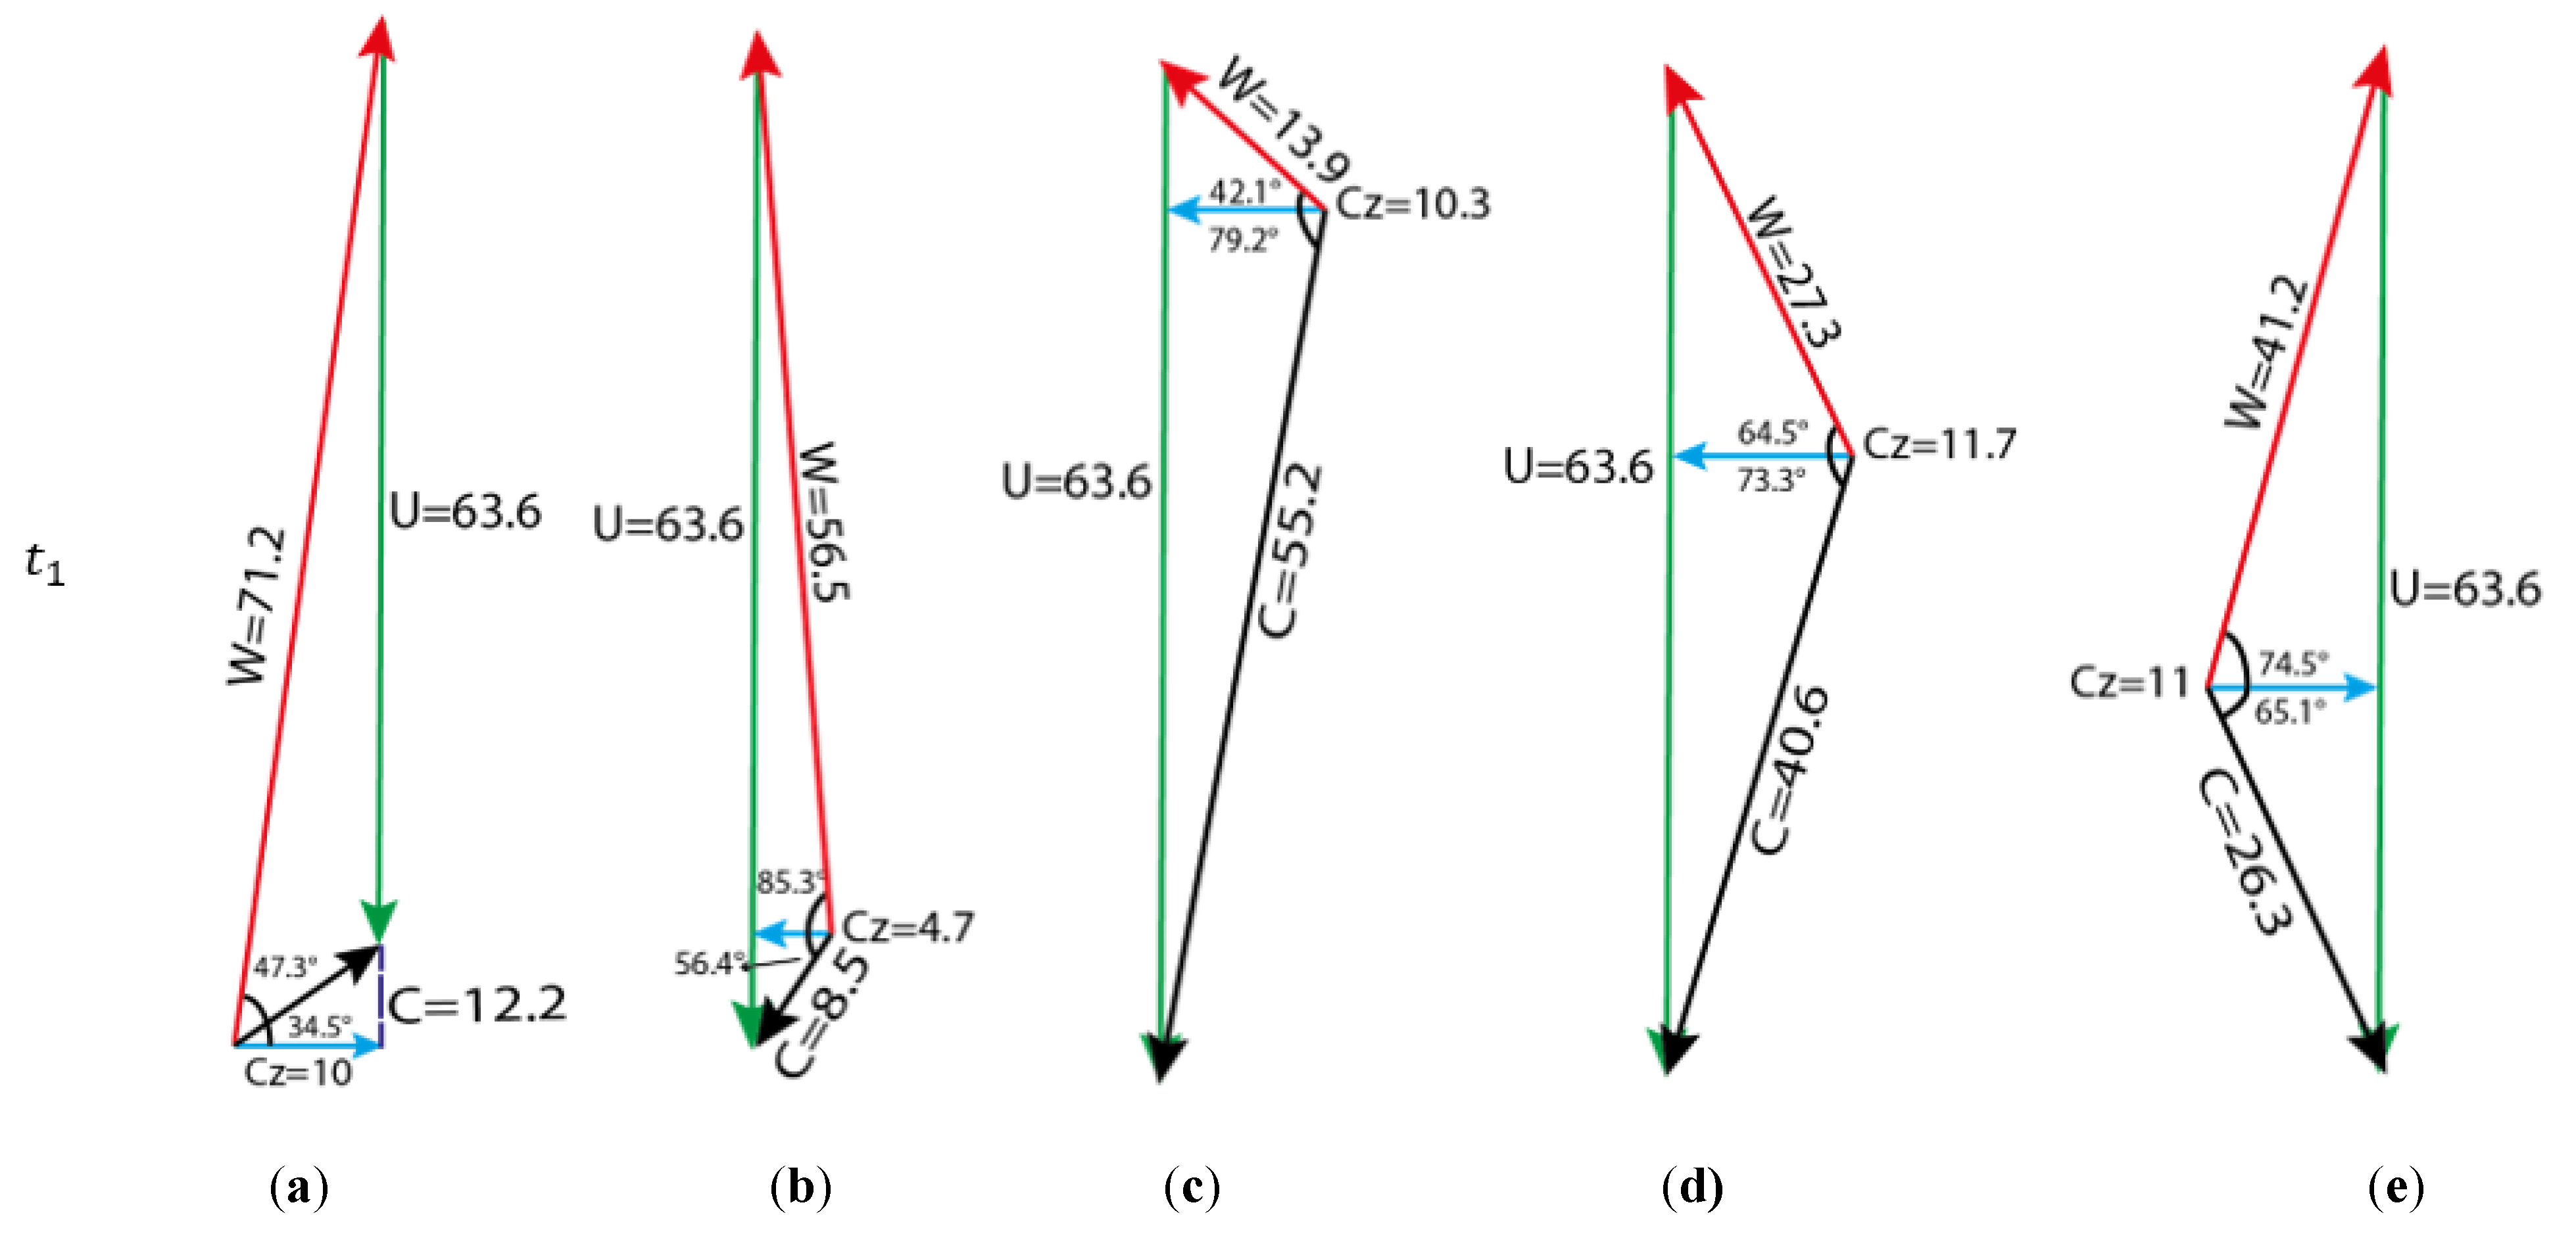
4.6. Rotor Casing Treatment Flow-Fields

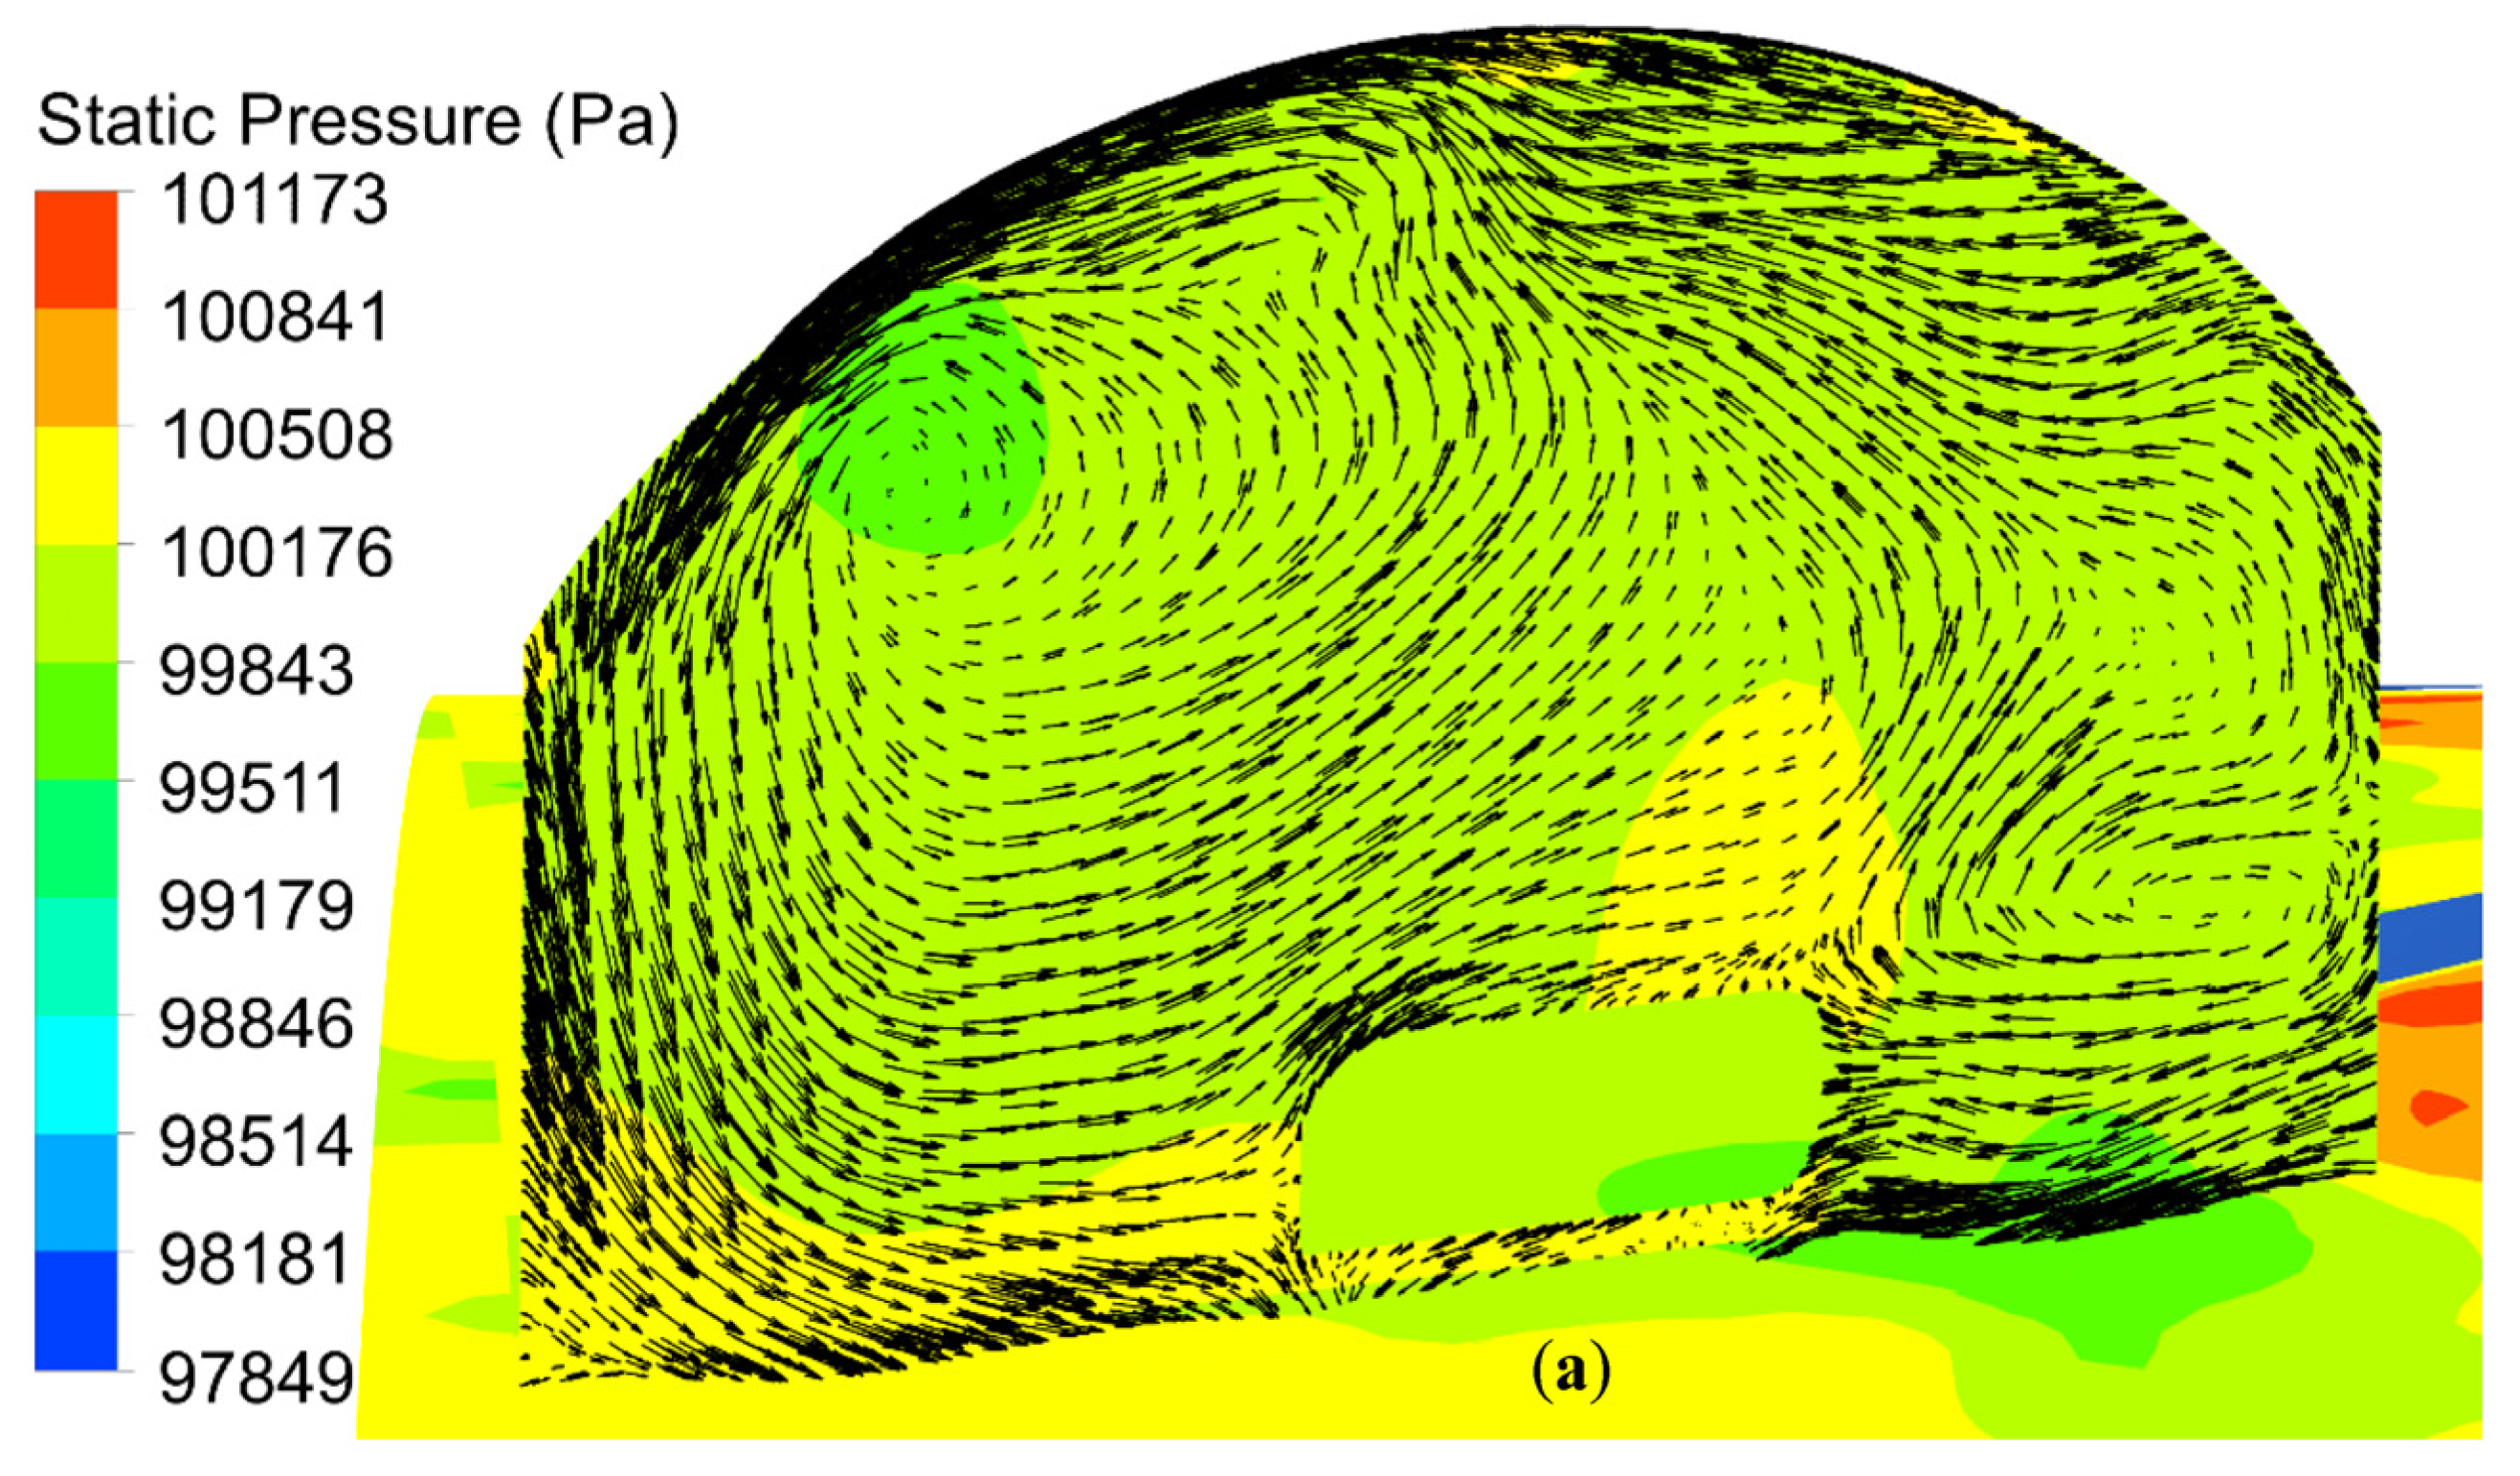
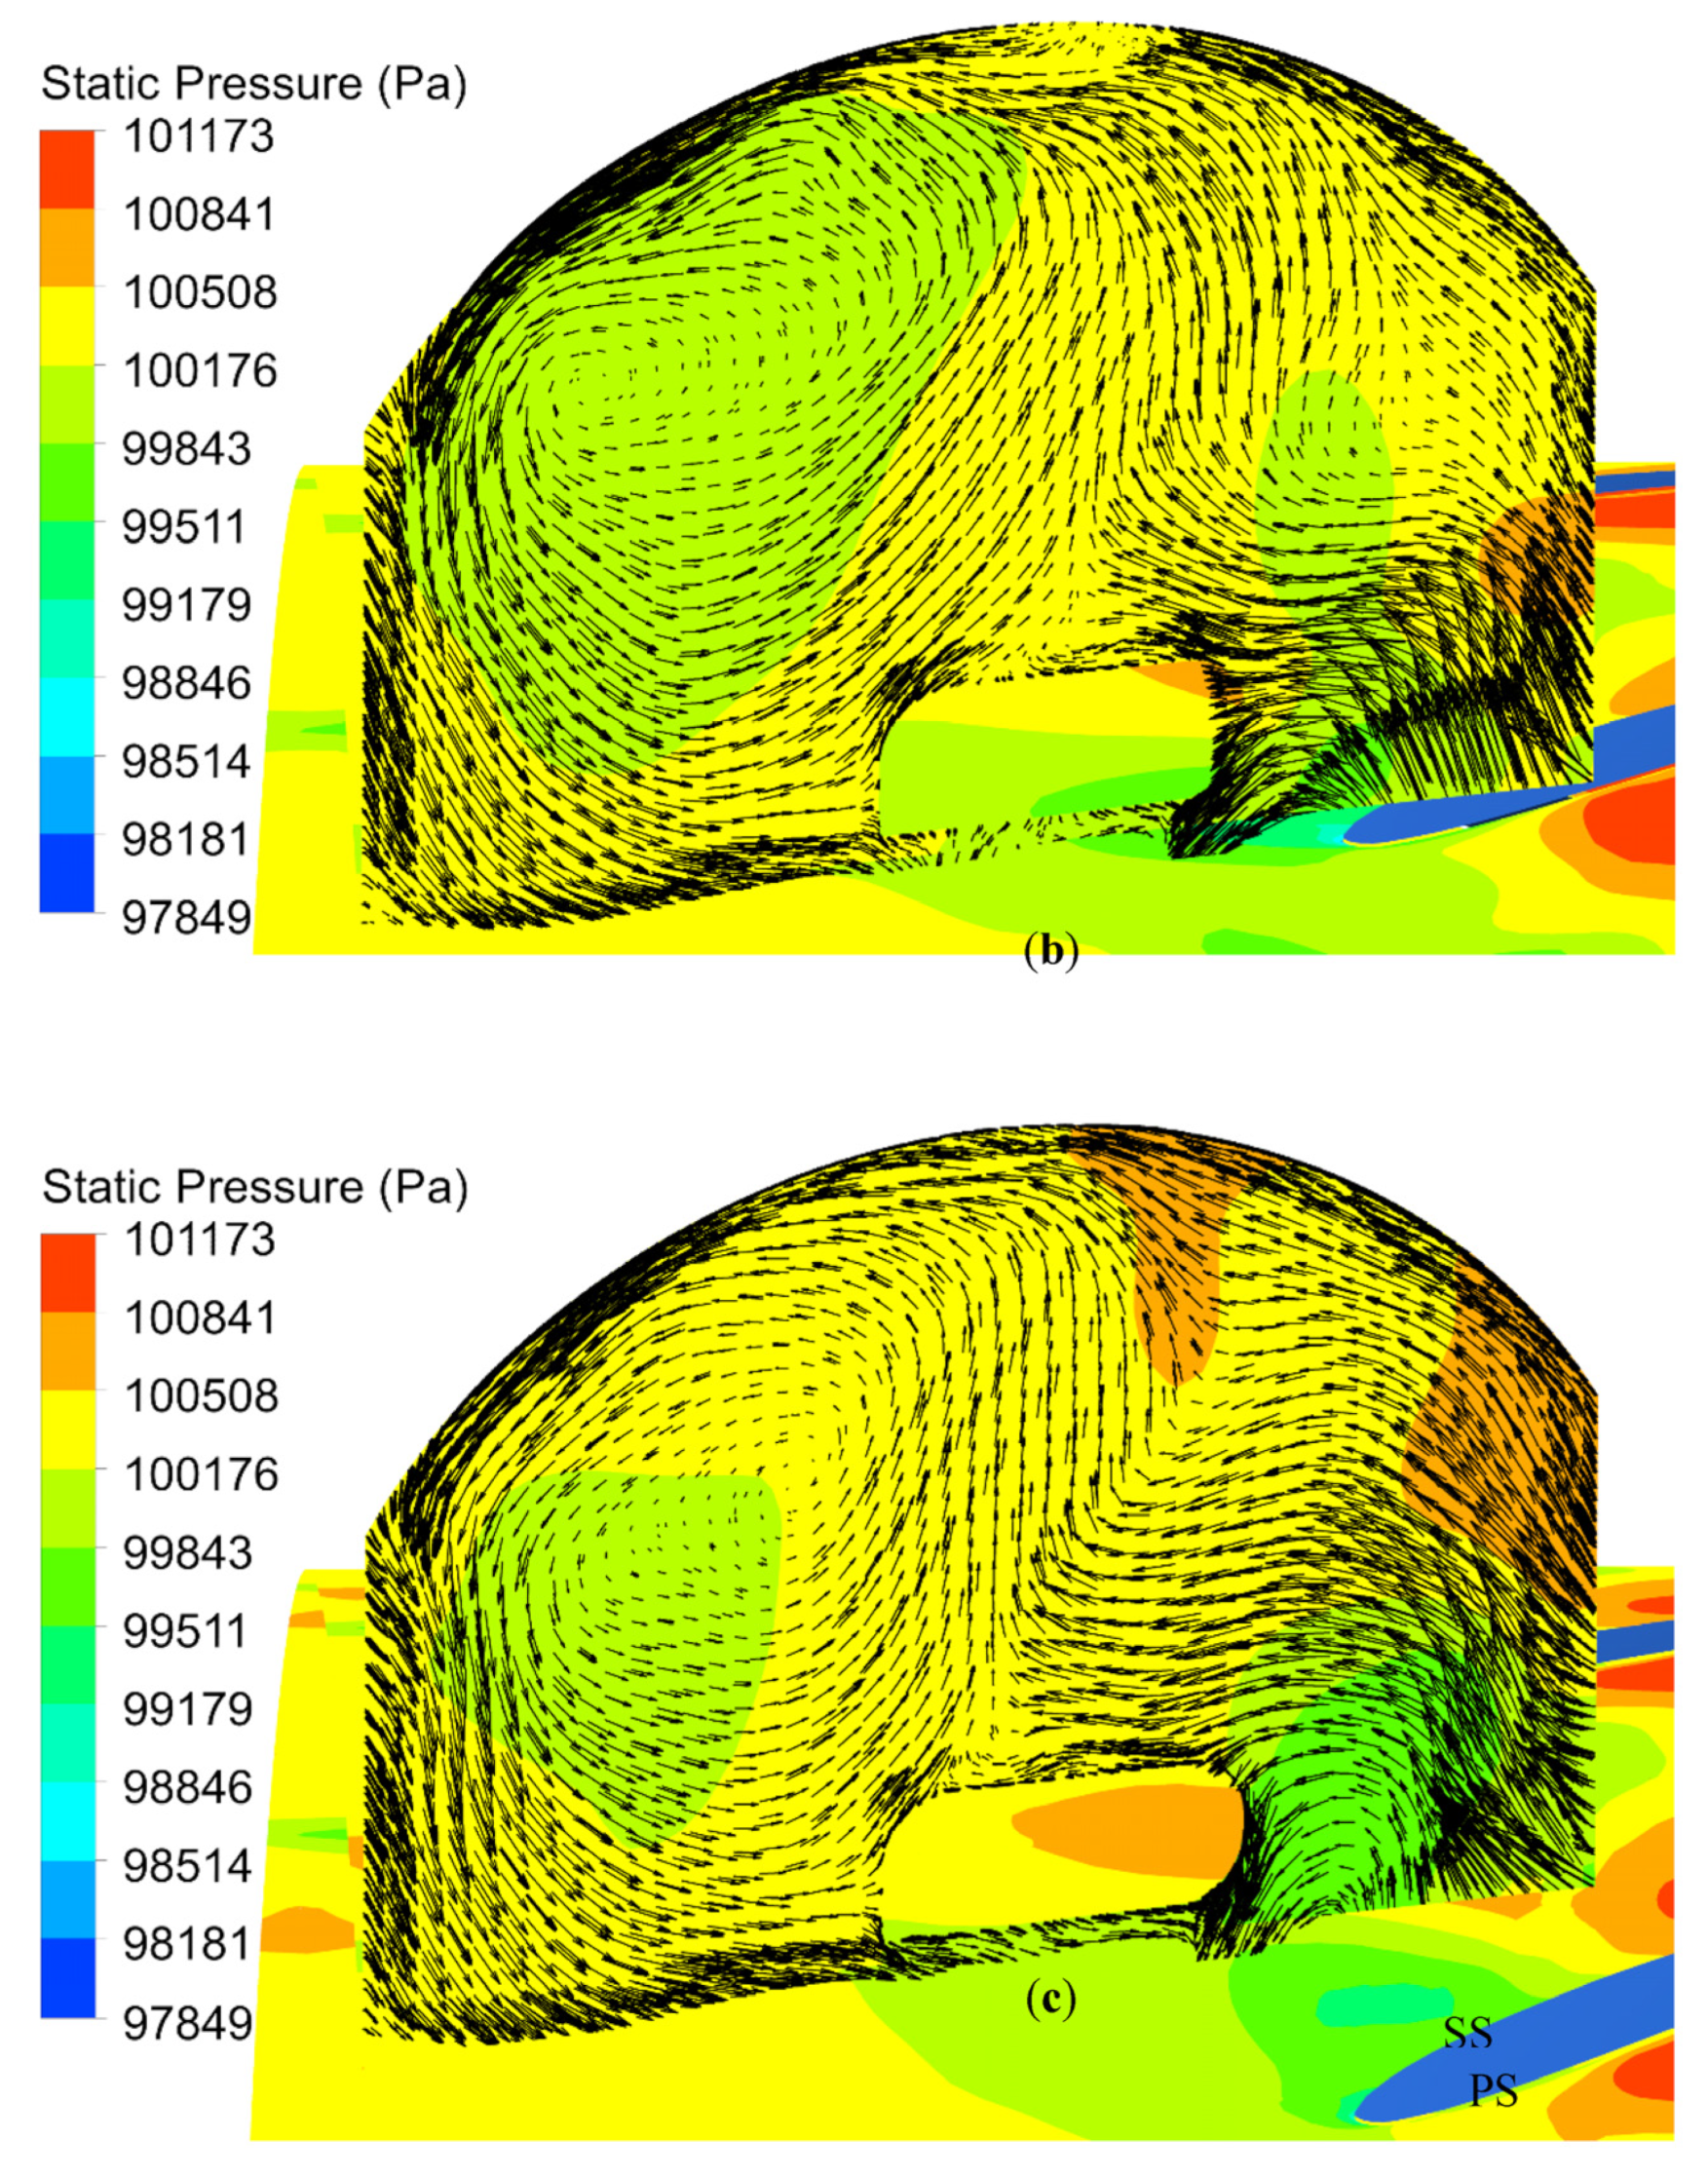
4.6.1. Flow Structure and Pressure Contours

The previous sections showed that unsteadiness with different intensities occurs at the tip as well as inside the casing treatment. In this section, the unsteady interactions between the rotor tip and casing treatment flows are discussed. Comparisons have been made for the two operating points at CT-1.95 and CT-1.6, likewise. The distributions of instantaneous static pressure and velocity vectors at the rotor tip, in addition to a plane within the casing treatment, are shown in Figure 12. The contours have been separated into three instances during a rotor passing period T. Based on the flow structures inside the casing treatment, three major streamline patterns can be identified inside the casing treatment:
First, a global flow recirculation forms between the rotor and casing treatment. The formation of global flow recirculation is complicated due to the pressure gradient between the inlet and outlet of the casing treatment and the relative positions between the rotor and casing treatment. Generally, a strong flow recirculation is induced when the pressure difference between the inlet and outlet is large, while a small pressure difference results in a weak flow recirculation. In Figure 12a, as the compressor is operating at CT-1.95, the inlet of the casing treatment is located approximately above a high-pressure fluid at the rotor tip and slightly away from the blade PS. Note that SC and PS have been marked in Figure 12c. As time goes on, the inlet of the casing treatment is positioned right above the blade’s leading edge. In this case, the fluid is injected toward the casing treatment with higher intensity in Figure 12b. As time passes, the inlet of the casing treatment lies slightly away from the blade SS in Figure 12c.
Second, the streamline pattern is formed due to the fluid that is not returned to the main flow immediately and instead is stored inside the casing treatment. The flow patterns within the casing treatment show that a local counterclockwise vortex flow forms at the upper left of the casing treatment. The vortex flow opposes the incoming flow to a large extent in a way that the passage of the fluid from the inlet to the outlet is mostly disrupted. As a result of this event, a stagnant area is formed at the upper left of the casing treatment, which can be observed during a passing period t 1 ,   t 2 ,   t 3 in Figure 12a–c. As time goes on, the vortex flow is still located at the same location as at the previous times.
Third, in addition to the two flow patterns, a part of the fluid that is not returned to the main flow and is not stored inside the casing treatment unexpectedly leaves the casing treatment from the inlet. This can be observed in Figure 12a,c, in which the inlet of the casing treatment remains away from the close proximity of the rotor leading edge. This condition will continue unless the inlet of the casing treatment is positioned right above the rotor blade’s leading edge again. The bleeding/injecting mass flow rates normalized by the compressor mass flow at the interface between the casing treatment/rotor are presented in Table 9. The normalized bleeding/injecting mass flow decreases and then increases as time goes on for CT-1.95.
As the mass flow rate decreases to CT-1.6, the three major streamline patterns evolve and amplify. As shown in Figure 13a, the inlet of the casing treatment is positioned at the upper of a small low-pressure region and slightly away from the blade PS. In this case, as the rotor tip axial chord exposure is limited to 23.2%, the higher-pressure fluid does not reach the inlet of the casing treatment, and, as a result, the pressure difference is not enough to develop a flow recirculation between the inlet and outlet of the casing treatment. Nevertheless, the suction/injection mass flow rates increase noticeably when compared to 1.95 kg/s, as can be observed in Table 9. Unexpectedly, a new clockwise local vortex flow forms at the proximity of the inlet of the casing treatment in addition to the identified flow structures. The extent of its impact is such that it disturbs the passage of fluid to the inlet. The counterclockwise vortex flow is still located in the casing treatment at the upper left. The counterclockwise vortex flow affects the passage of fluid within the casing treatment, and the passage of fluid is still disturbed. As time goes on, the inlet of the casing treatment reaches above the blade’s leading edge in Figure 13b. Consequently, the fluid with a high radial velocity is bled to the casing treatment, and the clockwise vortex flow is eliminated. Moreover, the bleeding/injecting mass flow at the interface increases slightly to 7.92%. As time passes in Figure 13c, the inlet of the casing treatment moves slightly away from the blade SS, and the inlet is positioned above a lower-pressure fluid region, likewise. It can be observed that a part of the fluid is returned to the main flow above the inlet, which limits the passage of inflow to the casing treatment. In the meantime, the counterclockwise vortex flow slightly moves toward the right and down directions in Figure 13c. The bleeding/injecting mass flow at the interface increases once more and reaches its maximum magnitude at 8.23%. The comparison of the distributions of static pressure at 1.95 and 1.6 kg/s indicates that the pressure values within the casing treatment vary slightly. Moreover, the results in this section confirm that unsteadiness occurs in the two operating points.

4.6.2. Discussion of Axial Velocity Change at 1.95 and 1.6 kg/s

Section 4.4 demonstrated that the axial velocity of the flow leaving the casing treatment is reduced and increased at 1.95 and 1.6 kg/s, respectively. The reason for the distinct difference is discussed in this section. Figure 14 compares the time-averaged velocity vectors at 1.95 and 1.6 kg/s. As the compressor is operating at 1.95 kg/s, the pressure difference between the inlet and outlet of the casing treatment is weak and is not enough to develop a strong flow recirculation. As a result, a weak flow recirculation is formed, and the suction/injection mass flow is between 1.6–2.2%. In this case, the flow, which is supposed to recirculate within the casing treatment, does not recirculate properly. Consequently, a large dead zone is formed within the casing treatment. The inflow to the casing treatment in this operating point has negative radial velocity and a very small positive axial velocity, while the outflow has negative radial and positive axial velocity components.
In contrast to 1.95 kg/s, the pressure difference increases as a result of throttling the compressor toward the lower mass flow rate at 1.6 kg/s. In this case, the suction/injection mass flow increases to 7.1–8.2%, and a strong recirculation flow is formed. Consequently, the dead zone inside the casing treatment vanishes. As can be seen from the velocity vectors, the inflow to the casing treatment has higher positive radial velocity and very small axial velocity, while the outflow has significant axial and radial velocity components.

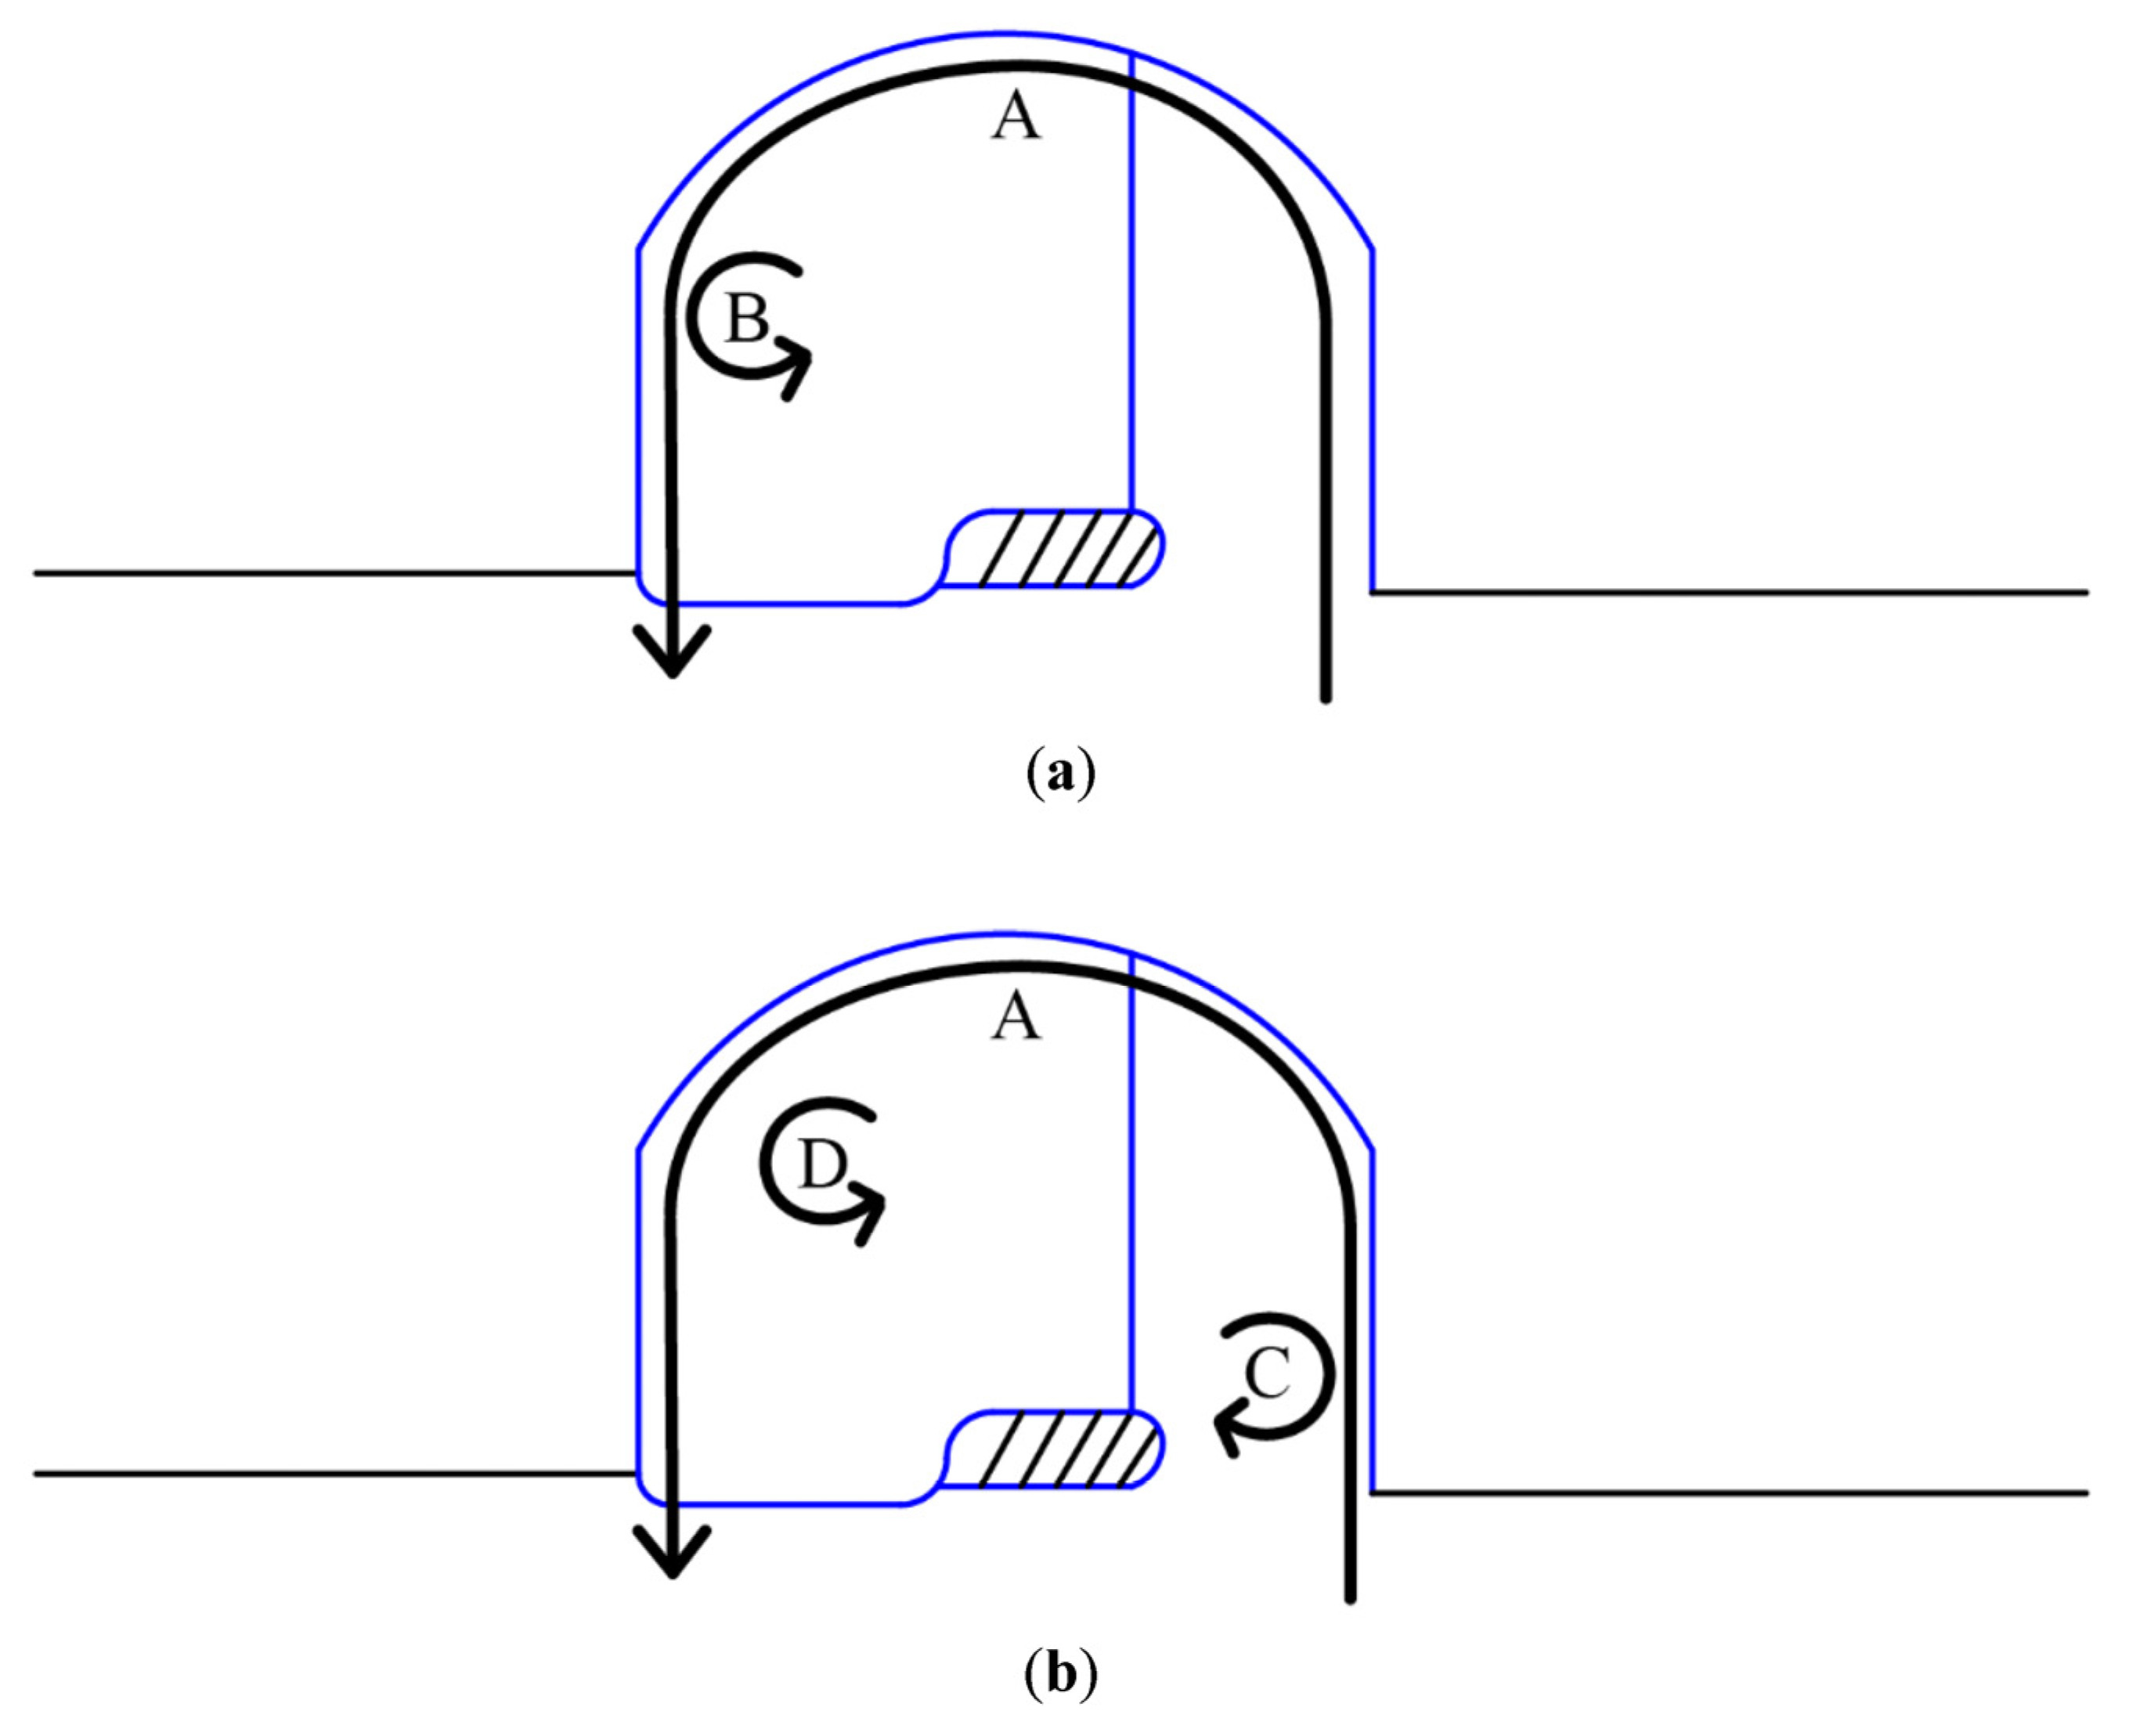
4.6.3. Summary of Flow Streamline Patterns, Fluid Trajectories, and Operating Mechanism

Based on the flow analysis in the previous sections, four major streamline patterns can be identified in total in the casing treatment at 1.95 and 1.6 kg/s, as shown schematically in Figure 15:
Fluid trajectory A: As the mass flow decreases to 1.95 kg/s, the flow exchange is established between the rotor and the casing treatment due to the pressure gradient between them. This forms the global flow recirculation between the rotor and casing treatment and has an important influence on the stall margin improvement since it affects the flow blockage inside the rotor passage. The flow that is injected into the casing treatment is returned to the mainstream upstream of the rotor. This fluid trajectory occurs in both CT-1.95 and CT-1.6, while the strength of suction/injection increases with the reduction in the mass flow.
Fluid trajectory B: This flow streamline pattern corresponds to the fluid flow that is not returned to the mainstream by following fluid trajectory A but is stored inside the casing treatment temporarily. This flow forms a local counterclockwise vortex flow that interacts with the injected flow to the casing treatment. As a result, most part of the incoming flow is disturbed, and a stagnant area forms.
Fluid trajectory C: As the mass flow decreases to 1.6 kg/s, a new clockwise local vortex flow forms at the vicinity of the inlet to the casing treatment. This flow opposes and disturbs the incoming flow to the casing treatment, but the region of its influence is limited. Nevertheless, this flow does not occur during the whole time of a rotor passing period, and due to an increase in suction/injection mass, flow is eliminated in the rest of the time steps.
Fluid trajectory D: This flow corresponds to the counterclockwise local vortex flow that existed at 1.95 kg/s, likewise. However, the location of this flow undergoes a small change, and it moves to the up and right directions slightly. This flow still opposes the injected flow to the casing treatment, but due to the amplification of flow exchange between the rotor and casing treatment, its influence is limited, and it is less than 1.95 kg/s.
The flow-field analysis in this and previous sections showed that the close proximity of the casing treatment inlet to the blade leading edge and the bleeding/injecting mass flow are prime factors in the formation of global flow recirculation between the casing treatment and rotor. The pressure gradient between the inlet and outlet of the casing treatment and the formation of the counterclockwise vortex flow in the casing treatment also affect the degree of flow recirculation within the casing treatment.
Based on the results in this and previous sections, the operating mechanism of the casing treatment can be briefly summarized as follows:
First, regardless of the relative position between CT and rotor, low axial momentum fluid, which induces flow blockage in the tip region, is bled to CT with various magnitudes, and a flow recirculation is formed. The factors that influence the intensity of recirculation are composed of casing treatment and rotor tip pressure distributions, the location of the counterclockwise vortex within CT and its opposing effect on incoming flow, as well as the proximity of the CT inlet to the rotor leading edge.
Second, the curved guide vanes in the casing treatment, as was reported by previous studies, have the function of reducing or eliminating the tangential velocity component [21,23,25]. The low-speed flow strikes the guide vanes after bleeding into CT, and subsequently, the flow with reduced tangential velocity is injected into the upstream of the rotor. The amount of stall margin improvement is directly proportional to the ability of CT to accommodate the low-speed flow. As the mass flow is reduced further to 1.6 kg/s, although the bleeding/injecting mass flow is increased significantly, CT reaches its maximum capacity to accommodate the low-speed flow. As a result, the compressor’s operating condition moves toward the stall/surge conditions.

5. Conclusions

In this paper, the effects of the two new modifications to the traditional vane-recessed casing treatments, namely, fully curved guide vanes and semi-circular curves at the top of the treated casing, were investigated numerically. Two configurations of SC and CT were studied fully unsteadily. The findings of this study are as follows:
(1) The intensity of flow recirculation in the casing treatment varies between 1.95 and 1.6 kg/s. At 1.95 kg/s, the pressure difference between the inlet and outlet of the casing treatment is not enough to form a strong flow recirculation; as a result, a very weak flow recirculation forms, and even the axial velocity of flow leaving the casing treatment is reduced. Consequently, a large dead zone forms in the casing treatment, which disturbs the inflow to the casing treatment. At 1.6 kg/s, as the pressure difference is high, a strong flow recirculation forms, and the dead zone vanishes, hence the axial velocity of the flow leaving the casing treatment increases;
(2) The degree of unsteadiness increases as the mass flow is reduced from 1.95 to 1.6 kg/s. While the distribution of standard deviation is uniform to some extent at 1.95 kg/s, the region of high unsteadiness is found at the rotor tip, especially at the region in contact with the casing treatment and leading edge, as well as the center of the casing treatment. As a result, the assumption of a steady-state flow process is not valid, especially at the lower mass flow rate of 1.6 kg/s;
(3) The major streamline patterns in the casing treatment are composed of global flow recirculation in addition to three local vortex flow patterns. The impact of the streamline patterns on the stall margin was explained. The global streamline pattern has a more profound effect on stall margin improvement;
(4) The analysis of velocity components, including velocity triangles, gives an insight into the change in velocity components in the rotor tip as well as the inflow and outflow of the casing treatment. This analysis confirmed that unsteadiness plays an important role and cannot be ignored;
(5) The frequency analysis showed that the frequency contents differed between 1.95 and 1.6 kg/s. At 1.95 kg/s, the frequency content is simple, mainly because the casing treatment configuration unstalls the compressor at this operating point and is composed of the blade passing frequency at 1900 Hz as well as its harmonics. At the lower mass flow rate of 1.6 kg/s, the instabilities related to stall condition grow, and consequently, new frequencies emerge in the frequency spectrum;
(6) The operating mechanism of the casing treatment slightly changes at 1.95 and 1.6 kg/s due to a change in flow recirculation intensity. At 1.95 kg/s, the suction/injection mass flow to the casing treatment is 1.6 to 2.2% of the compressor total mass flow, while the suction/injection mass flow increases from 7.1 to 8.2% of the compressor total mass flow at 1.6 kg/s. However, the main function of the casing treatment can be explained by inhaling the low axial-momentum fluid into the casing treatment and subsequently injecting the flow with reduced circumferential velocity to the blade’s rotor tip. Their difference, however, is due to the degree of reduction in circumferential velocity. The reduction in circumferential velocity occurs through the guide vanes and reaches the maximum effect at 1.6 kg/s;
(7) The analysis of velocity components, including velocity triangles, showed that the velocity vectors are three-dimensional in general, so they can change from one point to another point. In general, radial, swirl, and circumferential velocity components change from one location to another at both 1.95 and 1.6 kg/s, so the randomness of the velocity triangle location definitely changes the velocity components as well as the absolute/relative velocity vectors.

Author Contributions

Conceptualization, M.A. and Y.A.; Formal analysis, Y.A.; Investigation, Y.A.; Methodology, M.A. and Y.A.; Resources, Y.A.; Software, Y.A.; Supervision, M.A. and Y.A.; Validation, M.A. and Y.A.; Writing—original draft, Y.A.; Writing—review & editing, Y. All authors have read and agreed to the published version of the manuscript.

Funding

This research received no external funding.

Data Availability Statement

Not applicable.

Conflicts of Interest

The authors declare no conflict of interest.

Nomenclature

BPFBlade passing frequency (Hz)
CAxialRotor blade tip axial chord
CDRotor blade tip axial chord exposure to the casing treatment
CTCasing treatment (vaned-recessed design used in this study with 23.2% exposure)
CT at NSCasing treatment at near stall condition at mass flow 1.6 kg/s
CT at NS for SCCasing treatment at near stall condition for solid casing at mass flow 1.95 kg/s
C, W, UAbsolute, relative, blade velocity components (m/s)
C θ Absolute swirl (circumferential) velocity component (m/s)
CzAxial velocity component (m/s)
m ˙ Mass flow rate (kg/s)
NSNear stall
P i Sample static pressure (Pa)
P ¯ Time-averaged static pressure (Pa)
PEPeak efficiency
PSPressure surface
PRPressure ratio
PTProfile transformation
SCSolid casing (no casing treatment)
SSSuction surface
TRotor passing period (s)
t1, t2, t3Time (s)
t-stotal condition-static condition
URotor tip tangential speed (m/s)
V r Radial velocity component (m/s)
V z Axial velocity component (m/s)
W θ Relative swirl (circumferential) velocity component (m/s)
σ Standard deviation (Pa)
NNumber of samples
β Relative flow angle

References

  1. Rabe, D.C.; Hah, C. Application of Casing Circumferential Grooves for Improved Stall Margin in a Transonic Axial Compressor; ASME Paper No. 2002-GT-30641; ASME: New York, NY, USA, 2002. [Google Scholar]
  2. Wilke, I.; Kau, H.-P. A Numerical Investigation of the Flow Mechanisms in a HPC Front Stage with Axial Slots. ASME J. Turbomach. 2004, 126, 339–349. [Google Scholar] [CrossRef]
  3. Shabbir, A.; Adamczyk, J.D. Flow Mechanism for Stall Margin Improvement Due to Circumferential Casing Grooves on Axial Compressors. ASME J. Turbomach. 2005, 127, 708–717. [Google Scholar] [CrossRef]
  4. Zhu, J.; Chu, W. The Effects of Bend Skewed Groove Casing Treatment on Performance and Flow Field near Endwall of an Axial Compressor; AIAA 2005-809; AIAA: Reston, VA, USA, 2005. [Google Scholar]
  5. Lu, X.; Zhu, J.; Chu, W.; Wu, Y. Mechanism of the Interaction between Casing Treatment and Tip Leakage Flow in a Subsonic Compressor; ASME Paper No. GT2006-90077; ASME: New York, NY, USA, 2006. [Google Scholar]
  6. Lu, X.G.; Chu, W.L.; Zhang, Y.F.; Zhu, J. Experimental and numerical investigation of a subsonic compressor with bend-skewed slot casing treatment. Proc. IMechE Part C J. Mech. Eng. Sci. 2006, 220, 1785–1796. [Google Scholar] [CrossRef]
  7. Mueller, M.W.; Schiffer, H.P.; Hah, C. Effects of Circumferential Grooves on the Aerodynamic Performance of an Axial Single-Stage Transonic Compressor; ASME Paper No. GT-2007-27365; ASME: New York, NY, USA, 2007. [Google Scholar]
  8. Hathaway, M.D. Passive Endwall Treatments for Enhancing Stability; NASA TM-214409; NASA: Glenn Research Center, Cleveland, OH, USA, 2007. [Google Scholar]
  9. Lu, J.; Chu, W.; Wu, Y. Investigation of Skewed Slot Casing on Transonic Axial-Flow Fan Stage; ASME Paper No. GT2009-59417; ASME: New York, NY, USA, 2009. [Google Scholar]
  10. Houghton, T.; Day, I. Stability Enhancement by Casing Grooves: The Importance of Stall Inception Mechanism and Solidity. ASME J. Turbomach. 2010, 134, 021003. [Google Scholar] [CrossRef]
  11. Chen, H.; Huang, X.; Shi, K.; Fu, S.; Bennington, M.A.; Morris, S.C.; Ross, M.; McNulty, S.; Wadia, A. A CFD Study of Circumferential Groove Casing Treatments in a Transonic Axial Compressor; ASME Paper No. GT2010-23606; ASME: New York, NY, USA, 2010. [Google Scholar]
  12. Van de Wyer, N.; Desset, F.B.; Brouckaet, J.F.; Thomas, J.-F.; Hiernaux, S. Experimental Investigation of the Steady and Unsteady Flow Field in a Single Stage Low Pressure Axial Compressor with a Circumferential Groove Casing Treatment; ASME Paper No. GT2010-23474; ASME: New York, NY, USA, 2010. [Google Scholar]
  13. Zhao, S.; Lu, X. Investigation for the Effects of Circumferential Grooves on the Unsteadiness of Tip Clearance Flow to Enhance Compressor Flow Instability; ASME Paper No. GT2010-22652; ASME: New York, NY, USA, 2010. [Google Scholar]
  14. Houghton, T.O.; Day, I.J. Enhancing the Stability of Subsonic Compressors Using Casing Grooves. ASME J. Turbomach. 2011, 133, 021007. [Google Scholar] [CrossRef]
  15. Sakuma, Y.; Watanabe, T.; Himeno, T. Numerical Analysis of Flow in a Transonic Compressor with a Single Circumferential Casing Groove: Influence of Groove Location and Depth on Flow Instability; ASME Paper No. GT2013-94988; ASME: New York, NY, USA, 2013. [Google Scholar]
  16. Lu, X.; Chu, W.; Zhu, J.; Zhang, Y. Numerical Investigations of the Coupled Flow through a Subsonic Compressor Rotor and Axial Skewed Slot. J. Turbomach. 2009, 131, 011001. [Google Scholar] [CrossRef]
  17. Li, J.C.; Lin, F.; Wang, S.C.; Du, J.; Nie, C.Q.; Chen, J.Y. Extensive Experimental Study of Circumferential Single Groove in an Axial Flow Compressor; ASME Paper No. GT2014-26859; ASME: New York, NY, USA, 2014. [Google Scholar]
  18. Ivanov, S.K.; Dudkin, V.E.; Peredery, V.P.; Molchanov, V.N. Axial-Flow Ventilation Fan. No 08318063A, 26 March 1986. [Google Scholar]
  19. Bard, H. The Stabilisation of Axial Fan Performance. In Proceedings of the Institution of Mechanical Engineers (IMechE) Conference C120/84 on the Installation Effects in Ducted Fan Systems, London, UK, 1–2 May 1984; pp. 100–106. [Google Scholar]
  20. Miyake, Y.; Inaba, T.; Kato, T. Improvement of unstable characteristics of an axial flow fan by air-separator equipment. J. Fluids Eng. 1987, 109, 36–40. [Google Scholar] [CrossRef]
  21. Azimian, A.R.; Elder, R.L.; McKenzie, A.B. Application of recess vaned casing treatment to axial flow fans. ASME J. Turbomach. 1990, 112, 145–150. [Google Scholar] [CrossRef]
  22. Ziabasharhagh, M.; McKenzie, A.B.; Elder, R.L. Recess Vane Passive Stall Control. In Proceedings of the International Gas Turbine and Aeroangine Congress and Exposition, Cologne, Germany, 1–4 June 1992. ASME Paper 1992; 92-GT-36. [Google Scholar]
  23. Kang, C.S.; McKenzie, A.B.; Elder, R.L. Recessed Casing Treatment Effects on Fan Performance and Flow Field. In Proceedings of the ASME 1995 International Gas Turbine and Aeroengine Congress and Exposition, Houston, TX, USA, 5–8 June 1995. ASME Paper 1995; 95-GT-197. [Google Scholar]
  24. Akhlaghi, M.; Elder, R.L.; Ramsden, K.W. Effects of a Vane-Recessed Tubular-Passage Passive Stall Control Technique on a Multistage, Low-Speed, Axial-Flow Compressor: Results of Tests on the First Stage with the Rear Stages Removed. In Proceedings of the ASME Turbo Expo 2003, Collocated with the 2003 International Joint Power Generation Conference, Atlanta, GA, USA, 16–19 June 2003. ASME Paper 2003; GT2003-38301. [Google Scholar]
  25. Ghila, A.; Tourlidakis, A. Computational Analysis of Passive Stall Delay through Vaned Recess Treatment. In Proceedings of the ASME Turbo Expo 2001: Power for Land, Sea, and Air, New Orleans, LA, USA, 4–7 June 2001. ASME Paper 2001; GT-0342. [Google Scholar]
  26. Yamaguchi, N.; Ogata, M.; Kato, Y. Improvement of stalling characteristics of an axial-flow fan by radial-vaned air-separators. J. Turbomach. 2010, 132, 021015. [Google Scholar] [CrossRef]
  27. Yamaguchi, N.; Ogata, M.; Kato, Y. Effects of Compact Radial-Vaned Air Separators on Stalling Characteristics of an Axial-Flow Fan. J. Turbomach. 2010, 132, 021009. [Google Scholar] [CrossRef]
  28. Yelmar, K.; Viswanath, K. Computational Analysis of Recess Vane Geometry Modification in the Casing Treatment Approach to Enhance Stall Margin in Axial Flow Fans; ASME Paper No. IMECE2013-63096; ASME: New York, NY, USA, 2013. [Google Scholar]
  29. Corsini, A.; Delibra, G.; Rispoli, F.; Sheard, A.G.; Volponi, D. Investigation on Anti-Stall Ring Aerodynamic Performance in an Axial Flow Fan. In Proceedings of the ASME Turbo Expo 2014: Turbine Technical Conference and Exposition, Düsseldorf, Germany, 16–20 June 2014. ASME Paper 2014; GT2014-25794. [Google Scholar]
  30. Bonanni, T.; Corsini, A.; Delibra, G.; Volponi, D.; Sheard, A.G. Modelling of Axial Fan and Anti-Stall Ring on a Virtual Test Rig for Air Performance Evaluation. In Proceedings of the ASME Turbo Expo 2016: Turbomachinery Technical Conference and Exposition, Seoul, Republic of Korea, 13–17 June 2016. ASME Paper 2016; GT2016-56862. [Google Scholar]
  31. Chen, X.; Chu, W.; Zhang, H.; Li, J.; Lang, J. Numerical Investigation of Effect of Recess Vane Casing Treatments on an Axial Lift Fan Performance. In Proceedings of the ASME Turbo Expo 2017: Turbomachinery Technical Conference and Exposition, Charlotte, NC, USA, 26–30 June 2017. ASME Paper 2017; GT2017-63767. [Google Scholar]
  32. Chen, X.; Chu, W.; Zhang, H.; Li, X. Numerical study on inlet angle of guide vane in recess vaned casing treatment. Aerosp. Sci. Technol. 2019, 93, 105323. [Google Scholar] [CrossRef]
  33. Ghila, A.; Tourlidakis, A. Unsteady Simulations of Recess Casing Treatment in Axial flow Fans. In Proceedings of the ASME Turbo Expo 2006: Power for Land, Sea, and Air, Barcelona, Spain, 8–11 May 2006. ASME Paper 2006; GT2006-90388. [Google Scholar]
  34. Kumar, S.S.; Alone, D.B.; Thimmaiah, S.M.; Mudipalli, J.R.R.; Kumar, L.; Ganguli, R.; Kandagal, S.B.; Jana, S. Aerodynamic behavior of a transonic axial flow compressor stage with self-recirculating casing treatment. Aerosp. Sci. Technol. 2021, 112, 106587. [Google Scholar] [CrossRef]
  35. Guo, Y.; Mao, X.; Gao, L. Numerical investigation on the cross-stage self-recirculating casing treatment for a counter-rotating axial compressor. Aerosp. Sci. Technol. 2023, 135, 108161. [Google Scholar] [CrossRef]
  36. Zhang, H.; Wang, H.; Li, Q.; Jing, F.; Chu, W. Mechanism Underlying the Effect of Self-Circulating Casings with Different Circumferential Coverage Ratios on the Aerodynamic Performance of a Transonic Centrifugal Compressor. Aerospace 2023, 10, 312. [Google Scholar] [CrossRef]
  37. Vuong, T.D.; Kim, K.Y.; Dinh, C.T. Recirculation-groove coupled casing treatment for a transonic axial compressor. Aerosp. Sci. Technol. 2021, 111, 106556. [Google Scholar] [CrossRef]
  38. Guo, Y.; Gao, L.; Mao, X. Effect of self-recirculating casing treatment on the unsteady flow and stability of counter-rotating axial-flow compressor. Int. J. Turbo Jet-Eng. 2022, 1–13. [Google Scholar] [CrossRef]
  39. Ding, S.; Chen, S.; Wang, S.; Wang, Z. Flow mechanism of self-recirculating casing treatment in a low-reaction transonic compressor rotor. Aerosp. Sci. Technol. 2022, 130, 107925. [Google Scholar] [CrossRef]
  40. Kawase, M.; Rona, A. Effect of a Recirculating Type Casing Treatment on a Highly Loaded Axial Compressor Rotor. Int. J. Turbomach. Propuls. Power 2019, 4, 5. [Google Scholar] [CrossRef]
  41. Zhang, H.; Zhang, C.; Dong, F.; Zhong, X.; Chu, W. Effect of Different Radial Inclined Angles of Self-circulation Casing Treatment on the Transonic Axial Flow Compressor Performance. J. Appl. Fluid Mech. 2022, 16, 533–547. [Google Scholar]
  42. Akhlaghi, M. Application of a Vaned-Recessed Tubular-Passage Casing Treatment to a Multistage Axial-Flow Compressor. Ph.D. Thesis, University of Cranfield, Cranfield, UK, 2001. [Google Scholar]
  43. Zori, L.; Galpin, P.; Campregher, R.; Morales, J.C. Time-transformation simulation of a 1.5 stage transonic compressor. ASME J. Turbomach. 2017, 139, 071001. [Google Scholar] [CrossRef]
  44. Cornelius, C.; Biesinger, T.; Galpin, P.; Braune, A. Experimental and computational analysis of a multistage axial compressor including stall prediction by steady and transient CFD methods. ASME J. Turbomach. 2014, 136, 061013. [Google Scholar] [CrossRef]
  45. Menter, F.R. Two-equation eddy-viscosity turbulence models for engineering applications. AIAA J. 1994, 32, 1598–1605. [Google Scholar] [CrossRef]
  46. Akhlaghi, M.; Azizi, Y.; Nouri, N.M. Estimations of compressor stall and surge using passage stall behaviors. Machines 2022, 10, 706. [Google Scholar] [CrossRef]
Figure 1. Sketch of vaned-recessed casing treatment, including 23.2% exposure.
Aerospace 10 00763 g001
Figure 2. Computational flow domain.
Aerospace 10 00763 g002
Figure 3. Views of casing treatment and rotor blade grids: (a) front; (b) side; (c) down; (d) top.
Aerospace 10 00763 g003aAerospace 10 00763 g003b
Figure 4. Overall compressor maps for solid casing (SC) and casing treatment (CT) configurations.
Aerospace 10 00763 g004
Figure 5. Distribution of standard deviation at rotor tip: (a) 1.95 kg/s; (b) 1.6 kg/s.
Aerospace 10 00763 g005
Figure 6. Distribution of standard deviation inside the casing treatment: (a) 1.95 kg/s; (b) 1.6 kg/s.
Aerospace 10 00763 g006
Figure 7. FFT analysis at 1.95 and 1.6 kg/s.
Aerospace 10 00763 g007
Figure 8. Sketch of the rotor blade tip showing the locations selected for evaluation of velocity components analysis: (1) upstream of the leading edge; (2) leading-edge plane; (3) the mid-space between the leading edge and the trailing edge pressure side; (4) the mid-space between the leading edge and the trailing edge suction side; (5) trailing edge plane.
Aerospace 10 00763 g008
Figure 9. A velocity triangle.
Aerospace 10 00763 g009
Figure 10. Velocity triangles at 1.95 kg/s at t1, t2, and t3: midpoint of (a) line 1; (b) line 2; (c) line 3; (d) line 4; (e) line 5; (f) line 1; (g) line 2; (h) line 3; (i) line 4; (j) line 5; (k) line 1; (l) line 2; (m) line 3; (n) line 4; (o) line 5.
Aerospace 10 00763 g010aAerospace 10 00763 g010b
Figure 11. Velocity triangles at 1.6 kg/s at t1, t2 and t3: midpoint of (a) line 1; (b) line 2; (c) line 3; (d) line 4; (e) line 5; (f) line 1; (g) line 2; (h) line 3; (i) line 4; (j) line 5; (k) line 1; (l) line 2; (m) line 3; (n) line 4; (o) line 5.
Aerospace 10 00763 g011aAerospace 10 00763 g011b
Figure 12. Instantaneous flow fields at 1.95 kg/s during a rotor passing period: (a) t 1 ; (b) t 2 ; (c) t 3 .
Aerospace 10 00763 g012
Figure 13. Instantaneous flow fields at 1.6 kg/s during a rotor passing period: (a) t 1 ; (b) t 2 ; (c) t 3 .
Aerospace 10 00763 g013aAerospace 10 00763 g013b
Figure 14. Comparison of the time-averaged velocity vectors in the casing treatment: (a) 1.95 kg/s; (b) 1.6 kg/s.
Aerospace 10 00763 g014
Figure 15. Major flow streamline patterns inside the casing treatment: (A) Global flow recirculation; (B) and (C) local vortex flow; (a) 1.95 kg/s; (b) 1.6 kg/s.
Aerospace 10 00763 g015
Table 1. Design parameters of the low-speed axial compressor.
ParameterValue
Number of IGV blades34
Number of Rotor blades38
Number of Stator blades37
Rotor blade tip diameter405 mm
Rotor blade hub diameter284.4 mm
Tip clearance0.7 mm
Hub to tip ratio0.7
Rotor blade chord30.5 mm
Rotor blade aspect ratio2.0
Table 2. Effect of mesh size on local and global parameters.
Parameter Value
Total number of nodes791,7131,101,8032,224,4435,085,83510,565,038
Time-averaged pressure at monitor point 1 (Pa)100,860100,859100,851100,855100,856
Time-averaged pressure at monitor point 2 (Pa)101,444101,453101,459101,471101,472
Time-averaged pressure at monitor point 3 (Pa)101,879101,898101,947101,973102,002
Time-averaged pressure ratio1.0031.0031.0041.0041.004
Table 3. Comparison of numerical and experimental results for SC configuration.
ParameterExperimentalNumericalError (%)
M a s s   f l o w = 2.35   kg / s Total pressure at inlet101,628101,5950.032
Static pressure at outlet101,981101,8480.130
Total pressure at outlet102,722102,5780.140
Pressure ratio (t-s)1.0031.0020.051
Total pressure at inlet101,556101,5950.038
M a s s   f l o w = 2.12   kg / s Static pressure at outlet102,157102,0010.152
Total pressure at outlet102,777102,6510.122
Pressure ratio (t-s)1.0061.0040.199
Total pressure at inlet101,512101,5950.082
Static pressure at outlet102,206102,1030.101
M a s s   f l o w = 1.95   kg / s Total pressure at outlet102,724102,6190.102
Pressure ratio (t-s)1.0071.0050.199
Table 4. Comparison of numerical and experimental results for CT configuration.
ParameterExperimentalNumericalError (%)
M a s s   f l o w = 1.95   kg / s Total pressure at inlet100,281100,5700.288
Static pressure at outlet100,980101,0960.115
Total pressure at outlet101,479101,6860.204
Pressure ratio (t-s)1.0071.0050.176
M a s s   f l o w = 1.6   kg / s Total pressure at inlet100,293100,5400.246
Static pressure at outlet101,091101,1930.101
Total pressure at outlet101,451101,7340.279
Pressure ratio (t-s)1.0081.0060.149
Table 5. Distribution of instantaneous circumferential-averaged velocity components at 1.95 kg/s.
Timestep t 1 t 2 t 3
Velocity
Components (m/s)
V r W θ V z V r W θ V z V r W θ V z
Section1−0.4−58.513.3−0.6−58.313.1−0.8−59.713.4
20.5−58.211.60.1−58.110.80.6−59.211
32.2−23−7.52−24−7.52.3−21.8−8.8
4−0.3−28.20.91−280.50.4−28.9−1.9
50.6−18.82.90.5−17.53.20.6−183
Table 6. Distribution of instantaneous area-averaged velocity components at 1.95 kg/s.
Timestep t 1 t 2 t 3
Velocity
Components (m/s)
V r C θ V z V r C θ V z V r C θ V z
Inflow of the casing treatment2.23.64.935.253.64.35.9
Outflow of the casing treatment−1.40.14.5−1.9−0.93.8−1.70.53.9
Table 7. Distribution of instantaneous circumferential-averaged velocity components at 1.6 kg/s.
Timestep t 1 t 2 t 3
Velocity
Components (m/s)
V r W θ V z V r W θ V z V r W θ V z
Section1−3.4−69.310.9−3−69.512−2.7−6912.5
23.5−53.35.75.2−50.45.57.4−50.94.4
31.4−8.7−8.51.5−3.5−9.90.6−4.8−10.5
4−0.5−22.3−0.8−0.7−25.51.90.7−15.98.2
50.6−12.78.70.4−14.86.70.1−15.14.8
Table 8. Distribution of instantaneous area-averaged velocity components at 1.6 kg/s.
Timestep t 1 t 2 t 3
Velocity
Components (m/s)
V r C θ V z V r C θ V z V r C θ V z
Inflow of the casing treatment10.921.2−0.710.520.8−0.19.719.6−0.3
Outflow of the casing treatment−6.7−5.36.1−7.2−5.36.1−7.3−6.36.3
Table 9. Normalized bleeding and injecting mass flow at 1.95 and 1.6 kg/s at rotor/CT interface.
Time (s) t 1 t 2 t 3
Normalized bleeding/injecting mass flow at CT-1.95 (%)2.181.612.21
Normalized bleeding/injecting mass flow at CT-1.6 (%)7.107.928.23
Disclaimer/Publisher’s Note: The statements, opinions and data contained in all publications are solely those of the individual author(s) and contributor(s) and not of MDPI and/or the editor(s). MDPI and/or the editor(s) disclaim responsibility for any injury to people or property resulting from any ideas, methods, instructions or products referred to in the content.

