Article

Investigation of Vaned-Recessed Casing Treatment in a Low-Speed Axial Flow Compressor, Part I: Time-Averaged Results

School of Mechanical Engineering, Iran University of Science and Technology, Tehran 16846-13114, Iran
*
Author to whom correspondence should be addressed.
Aerospace 2023, 10(9), 764; https://doi.org/10.3390/aerospace10090764
Submission received: 9 June 2023 / Revised: 31 July 2023 / Accepted: 17 August 2023 / Published: 28 August 2023

Abstract

:
This paper investigates the effects of two modifications to a vaned recessed casing treatment. First, the shape of a circular curve was used in the top of the treated casing. Second, a fully curved guide vane was also applied. The goals of the modifications are to enhance the flow recirculation as well as to relieve the low-speed flow, which is normally accumulated within the corners of the vaned recessed casing treatment. The solid casing in addition to the two vaned recessed configurations with 23.2% and 53.5% rotor blade tip axial chord exposure have been studied numerically. The results indicated that two mechanisms are involved in the stall margin enhancement. First, the circumferential pressure gradient is reduced for both configurations. The reduction in pressure gradient largely reduces the development of tip leakage vortex and, thus, the generation of low-speed fluid is diminished. Second, the main flow/tip leakage interface moves toward downstream and the movement of interface toward the leading edge is delayed. The second configuration with a greater rotor blade tip exposure enables extra flow recirculation due to decreasing surface area and, therefore, could be superior to the application of the first casing treatment configuration. The major streamlines within the casing treatment are also discussed. The time-averaged results are presented in this paper, while the unsteady results including instantaneous flow fields, origins of the unsteadiness and frequency analysis are discussed in part II.

1. Introduction

Rotating stall and surge are complex aerodynamic phenomena that occur due to the breakdown of flow in gas turbine aeroengines. Rotating stall and surge limit the stable operating range of a compressor, pressure rise and isentropic efficiency and, for these reasons, are undesirable. Active [1,2,3] and passive [4] techniques have been applied to improve flow structure in stall conditions and delay onset of stall. While the study of several types of casing treatments such as circumferential, axial and axial skewed slots offer valuable insight, the physical mechanism of vaned recessed casing treatments has been explained less adequately. The effect of rotor tip axial chord exposure on the vaned recessed casing treatment was experimentally examined by Azimian [5]. The main mechanism was found to be the ability of the casing treatment to absorb reversed flow and reduce tangential velocity. Moreover, the analysis of the flow inside the recess indicates that at lower mass flow rates, flow separation occurs on the vanes inside the casing treatment. A series of axial rotor chord exposures in addition to the recess geometry were experimentally evaluated by Ziabasharhagh [6]. The analysis of the flow inside the recess demonstrates that the flow in the vaneless region of the recess is highly unsteady, whereas flow near to the outer wall is less unsteady. The effects of various vane recess casing treatment configurations in addition to rotor tip axial chord exposure were examined experimentally by Kang [7]. Of these recess configurations, the recess geometry with an inner ring of substantial cross-section and slightly curved vanes was able to produce maximum stall margin improvement. Furthermore, it was found that the casing treatment has the function of altering the tip leakage flow and replacing it with a radial flow. In contrast to the previous investigations on an isolated rotor fan, the effects of rotor tip axial chord exposure were experimentally studied in a multistage compressor by Akhlaghi [8]. All tested exposures (33.3%, 43.4%, 53.5%, 63.6% and 73.7%), except the one with 23.2%, were able to change the nature of stall to a progressive characteristic. In a first attempt to study the effect of vaned recessed casing treatment numerically, Ghila [9] performed steady-state computations on an axial flow fan. The findings indicate that, at lower mass flow rates, a large area of reversed flow is accumulated in the rotor tip region. In another analogous study, the effects of blade chord exposure and recess height of a vaned recessed casing treatment were numerically investigated by Yelmar [10]. The results show that both the rotor blade chord exposure and recess height improve stall margin. Corsini et al. [11] performed experimental and numerical investigations on an anti-stall ring. The flow analysis at different operating conditions inside the anti-stall ring were performed and the factors that lead to efficiency loss have been identified. Bonanni et al. [12] conducted numerical analysis based on the actuator disk theory. The approach provides fast computations and can be implemented in place of three-dimensional modelling of an axial flow fan with an anti-stall ring, where an approximation is sufficient. The effects of rotor blade tip axial chord exposure and cavity outlet distance of a vaned recessed casing treatment were numerically examined by Chen [13]. The findings indicate that increase in cavity outlet distance hardly causes efficiency loss, whereas extending rotor blade tip axial chord exposure incurs significant efficiency loss. The unsteady computation by Ghila [14] showed that the flow behavior inside the casing treatment is mostly dominated by steady-state flow process and steady-state simulations are adequate to capture main effects of the casing treatment. The effect of inlet angle of a vaned recessed casing treatment guide vane was numerically investigated by Chen et al. [15]. The necessary conditions that lead to stall based on the flow patterns inside the casing treatment were determined.
The above investigations have been very valuable to explain the effects of vaned recessed casing treatments. However, the present vaned recessed casing treatment investigation studies the effects of two modifications to the traditional vaned recessed casing treatments [5,6,9,10,11,12,13,14,15]. First, the shape of the vanes within the casing treatment is changed to fully curved sections, while the traditional vane inside the casing treatment is composed of curved and straight sections. Second, the top of the shroud surface of treated casing is changed to a circular curve. The goal of these modifications is to overcome the accumulation of low-speed fluid with less static pressure in the corners of the casing treatment and enhance flow recirculation. These modifications were designed and tested experimentally by the first author of this paper previously [8,16]. It is noteworthy that an investigation considering the two modifications is discussed numerically for the first time. The study of velocity components as well as velocity triangles for a deep understanding of the mechanism of the vaned recessed casing treatment are presented. Moreover, the rotor tip and casing treatment flow fields in addition to the physical mechanism of the vaned recessed casing treatment are also discussed.

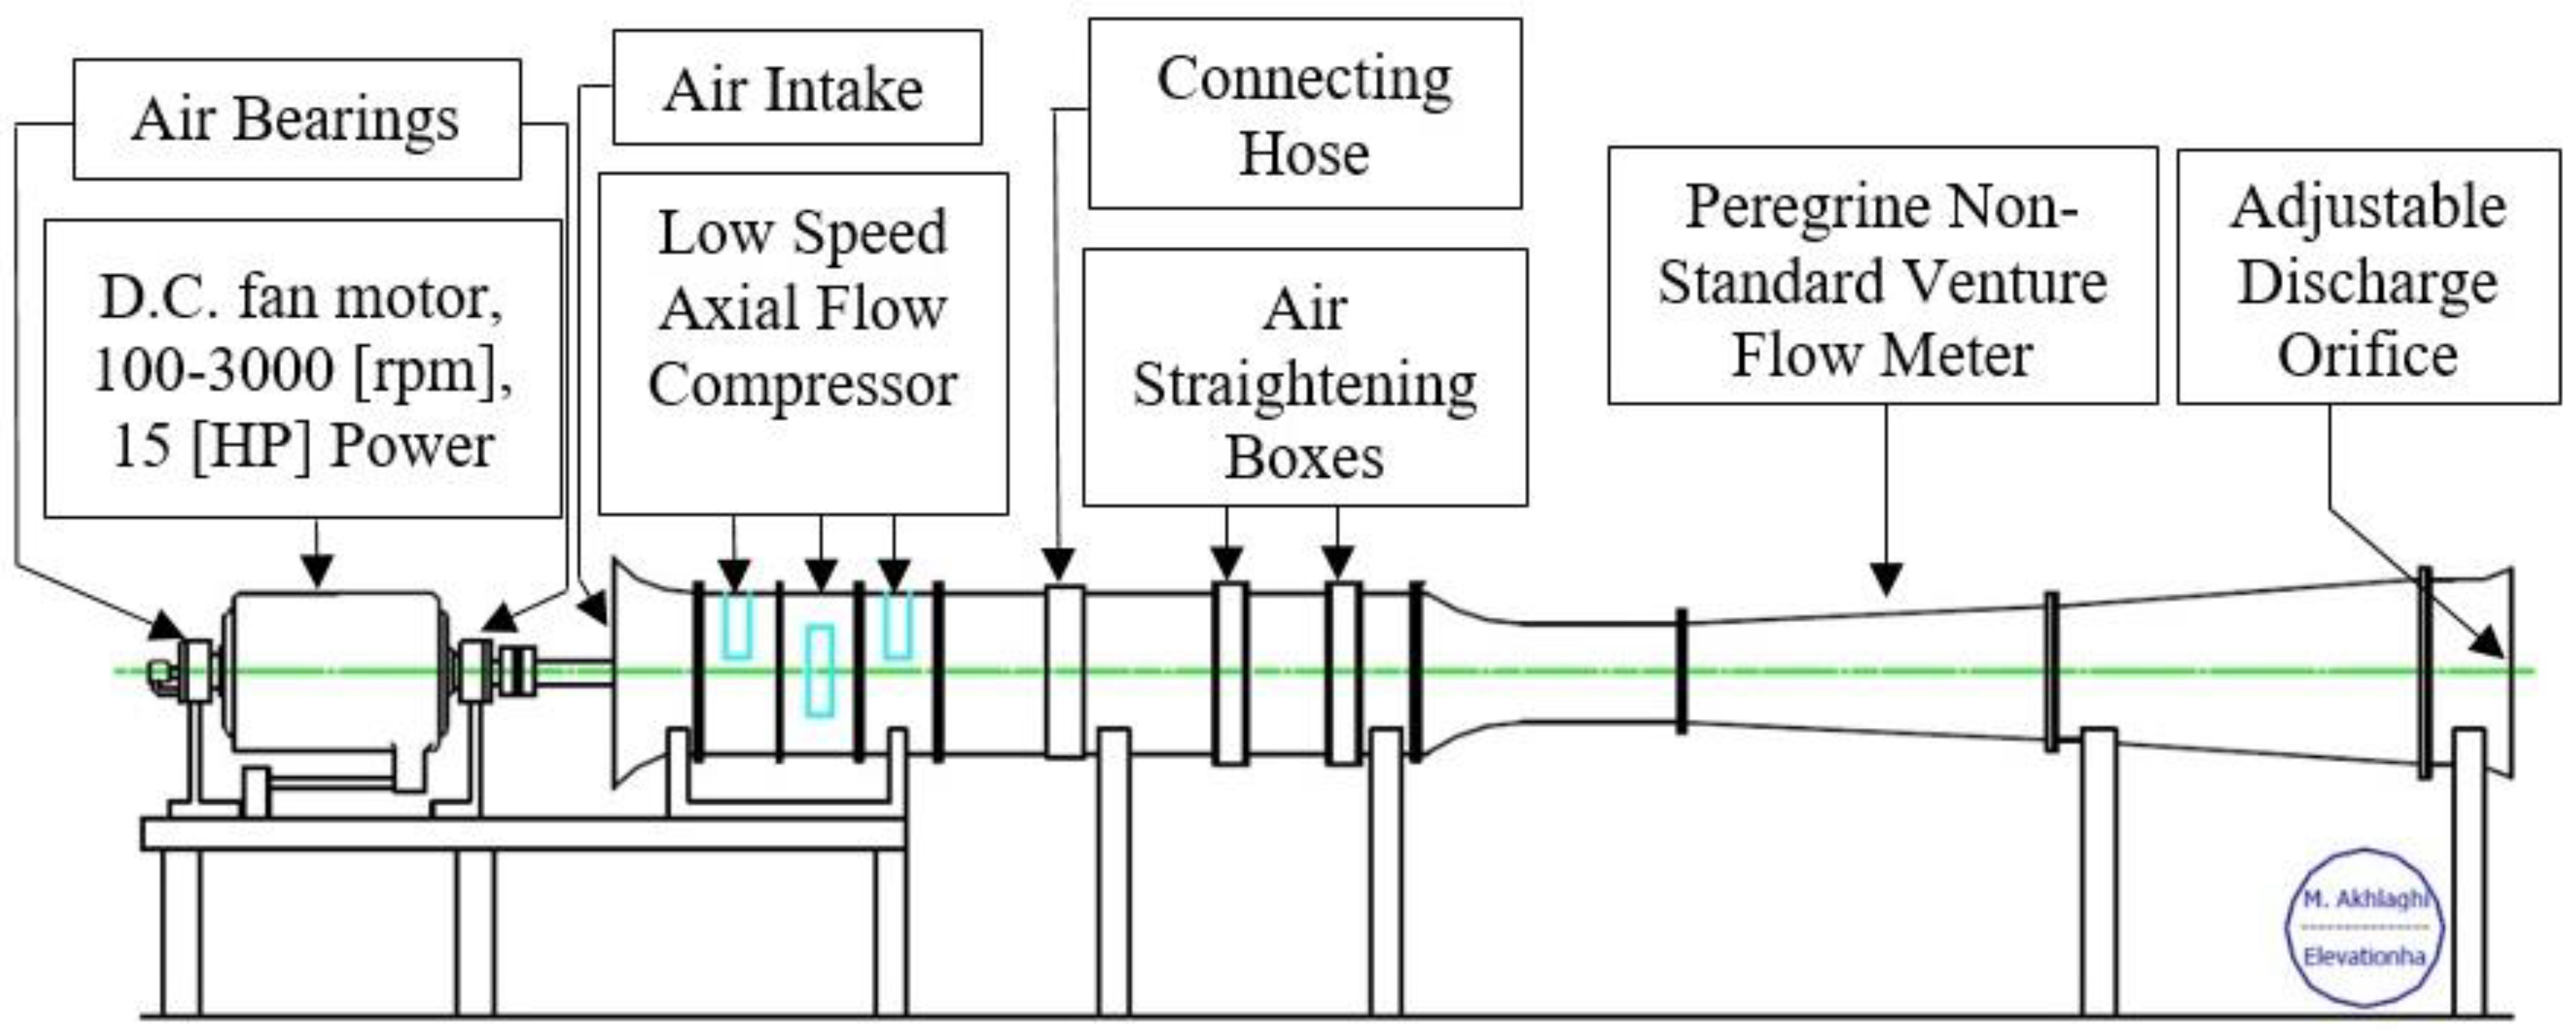
2. Investigated Compressor

The compressor test rig, the geometry of which is used for this numerical investigation, is a low-speed axial flow compressor. The test rig was named Peregrine and was tested by Akhlaghi [16] in Cranfield University. The test rig is composed of an electric motor with a bellmouth inlet, a row of IGV, three repeating stages, two honeycomb straighteners, a venturi flow meter, an electrically operated orifice and an outlet ducting. The rotor shaft was driven by an electric motor at the design speed of 3000 rpm. It is noteworthy that the row of IGV is fixed. A schematic of the test rig is shown in Figure 1.
The main characteristics of the compressor test rig are summarized in Table 1.
Detailed information on the characteristics of the test rig is given by Akhlaghi [16].

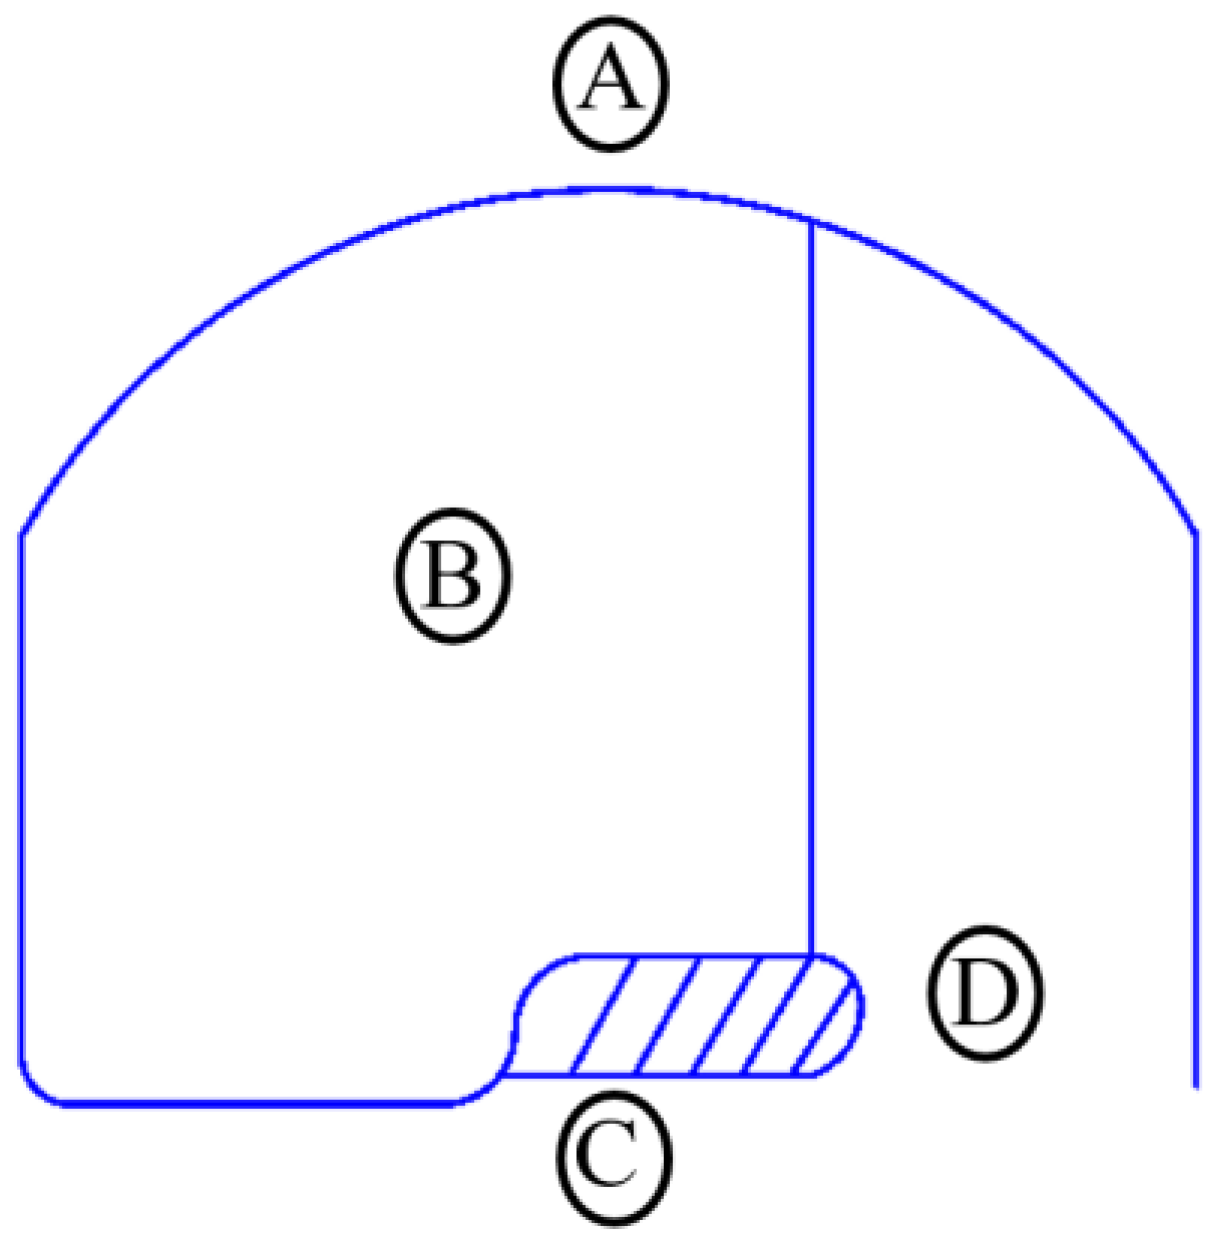
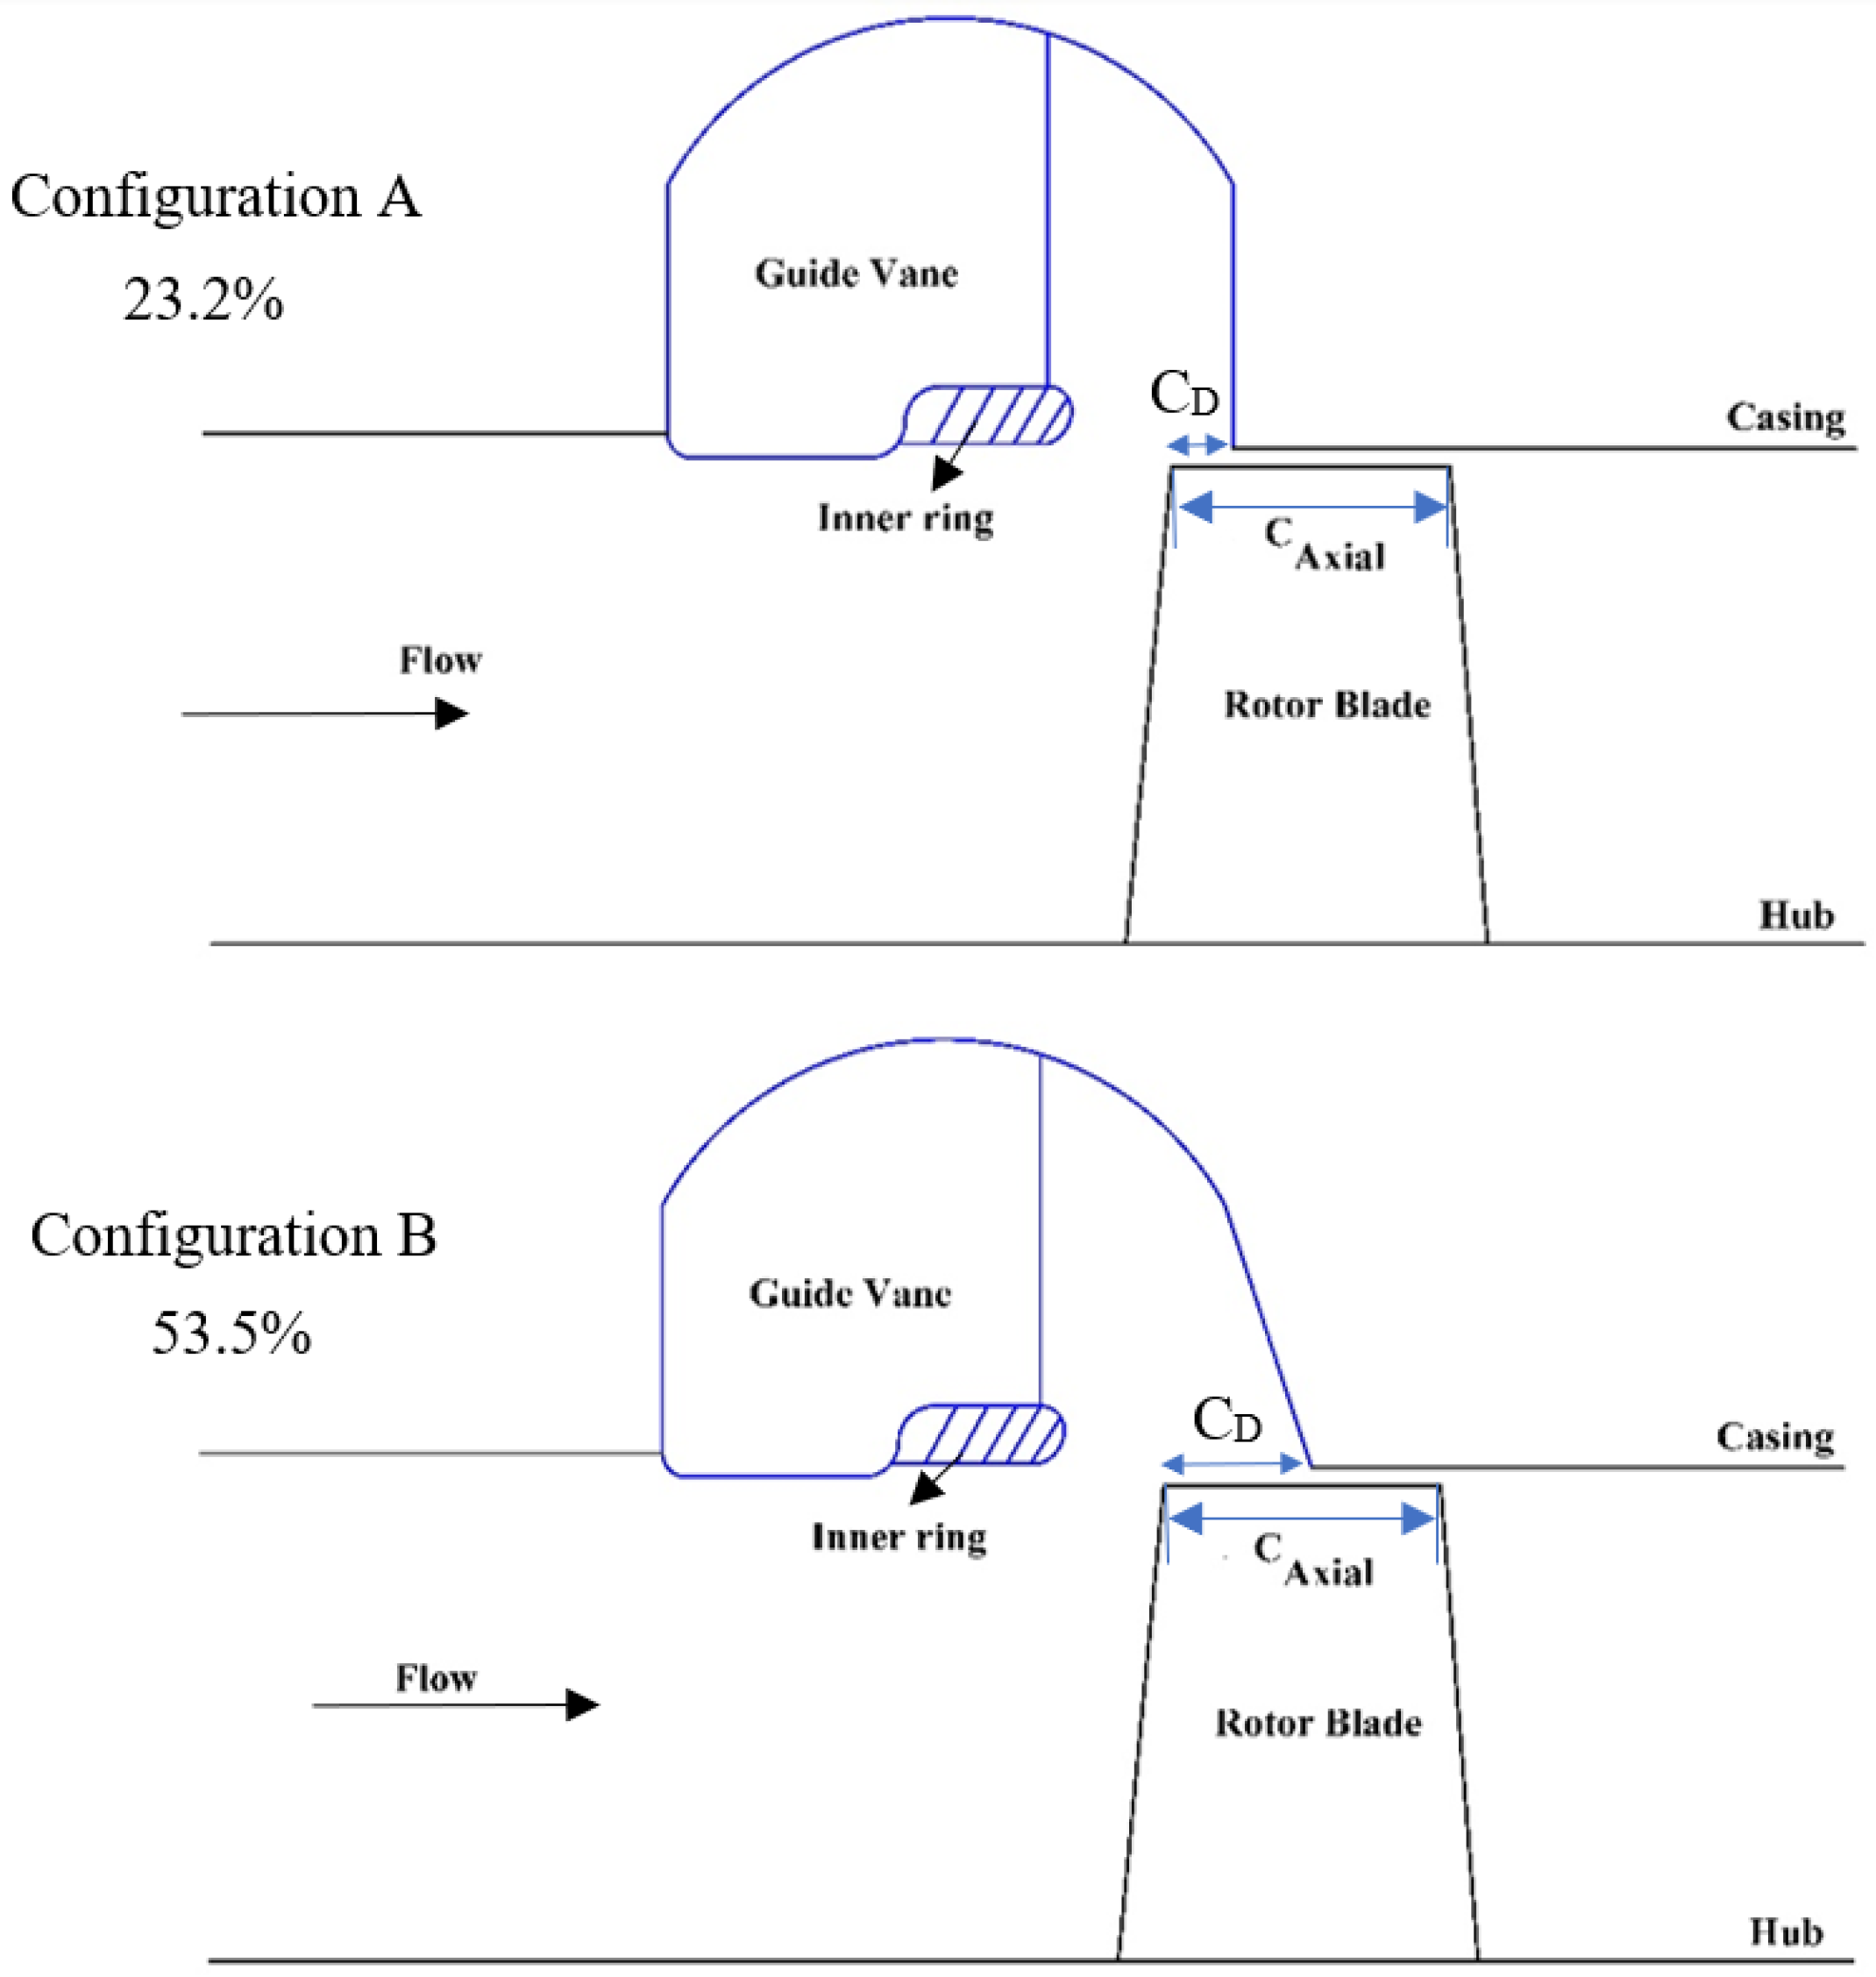
3. Investigated Casing Treatment Configurations

A schematic of the vaned recessed casing treatment selected for this study is shown in Figure 2. The vaned recessed casing treatment is composed of four regions: first, an outer casing which has a tubular shaped passage inside (region A in Figure 2). Second, a vaned region where a set of 120 curved guide vanes were evenly positioned in the annular recessed area (region B in Figure 2). The guide vanes have fully curved geometry, with a thickness of one millimeter. The reason for applying the guide vanes is to remove the swirl component from the stalled flow. Third, an inner ring has been applied to separate the mainstream from the recessed chamber and to separate the recessed length into two dissimilar lengths (region C in Figure 2). The vaned recessed casing treatment is placed partly upstream of the rotor blade with the vaneless region partly over the rotor blade tips (region D in Figure 2). This casing treatment was designed based on a conceptual design method by the first author of this paper and was tested experimentally in Cranfield University [8,16]. The selected distances of the rotor blade tip axial chord exposure CD for this study are 4.7 mm and 10.6 mm, corresponding to 23.2% and 53.5% of the rotor blade tip axial chord exposures, respectively. These configurations are named configurations A and B in this investigation, respectively, and are shown in Figure 3. The reason for selecting these configurations is their valuable results in stall margin improvement and efficiency enhancement. More details on the design of the casing treatment can be found in Akhlaghi [16].

4. Numerical Method

Rotating stall and surge are complex and unsteady phenomena, which require time-accurate unsteady simulations. Consequently, all the computations in this numerical study from maximum mass flow to near stall operating points were conducted in 3D and as unsteady and then the time-averaged results were computed. The solver is based on finite volume approach and utilizes a fully coupled approach, in which momentum and pressure equations are solved together. The solver utilizes a fully implicit numerical method. A total of 30 time steps per passing period corresponding to 1140 time steps in a full rotation of the rotor were selected for the simulations. The time step was chosen to be 1.75439 × 10⁻⁵ s. The transient interfaces were applied for IGV–rotor, rotor–casing treatment and rotor–stator interfaces. The pitch change ratios across these interfaces are 1.11, 1.05 and 1.02 for modelling one IGV blade, one rotor blade, three guide vanes inside the casing treatment and one stator blade, respectively. The transient interface used for the numerical simulation utilizes the profile transformation method, in which the flow profiles across the interfaces are circumferentially stretched or compressed. According to Zori [17] and Cornelius [18], the main limitation of this method is that there is a frequency error proportional to pitch ratio. In the current investigation, since the pitch ratios are close to unity and there is a slight frequency error of 0.3%, the utilized numerical method is considered appropriate.
The rotor shroud surface which is free of interface with the casing treatment has been modelled as a counter-rotating wall. The high-resolution model has been used for the advection scheme. The rotor passing period has been chosen as 0.0005263 s. As for the convergence control, the convergence criteria were set as 10−6 and a maximum of 30 inner coefficient loops were used.

4.1. Governing Equations

The governing equations that are solved numerically are composed of continuity, momentum, energy and turbulence transport equations.

4.2. Turbulence Model
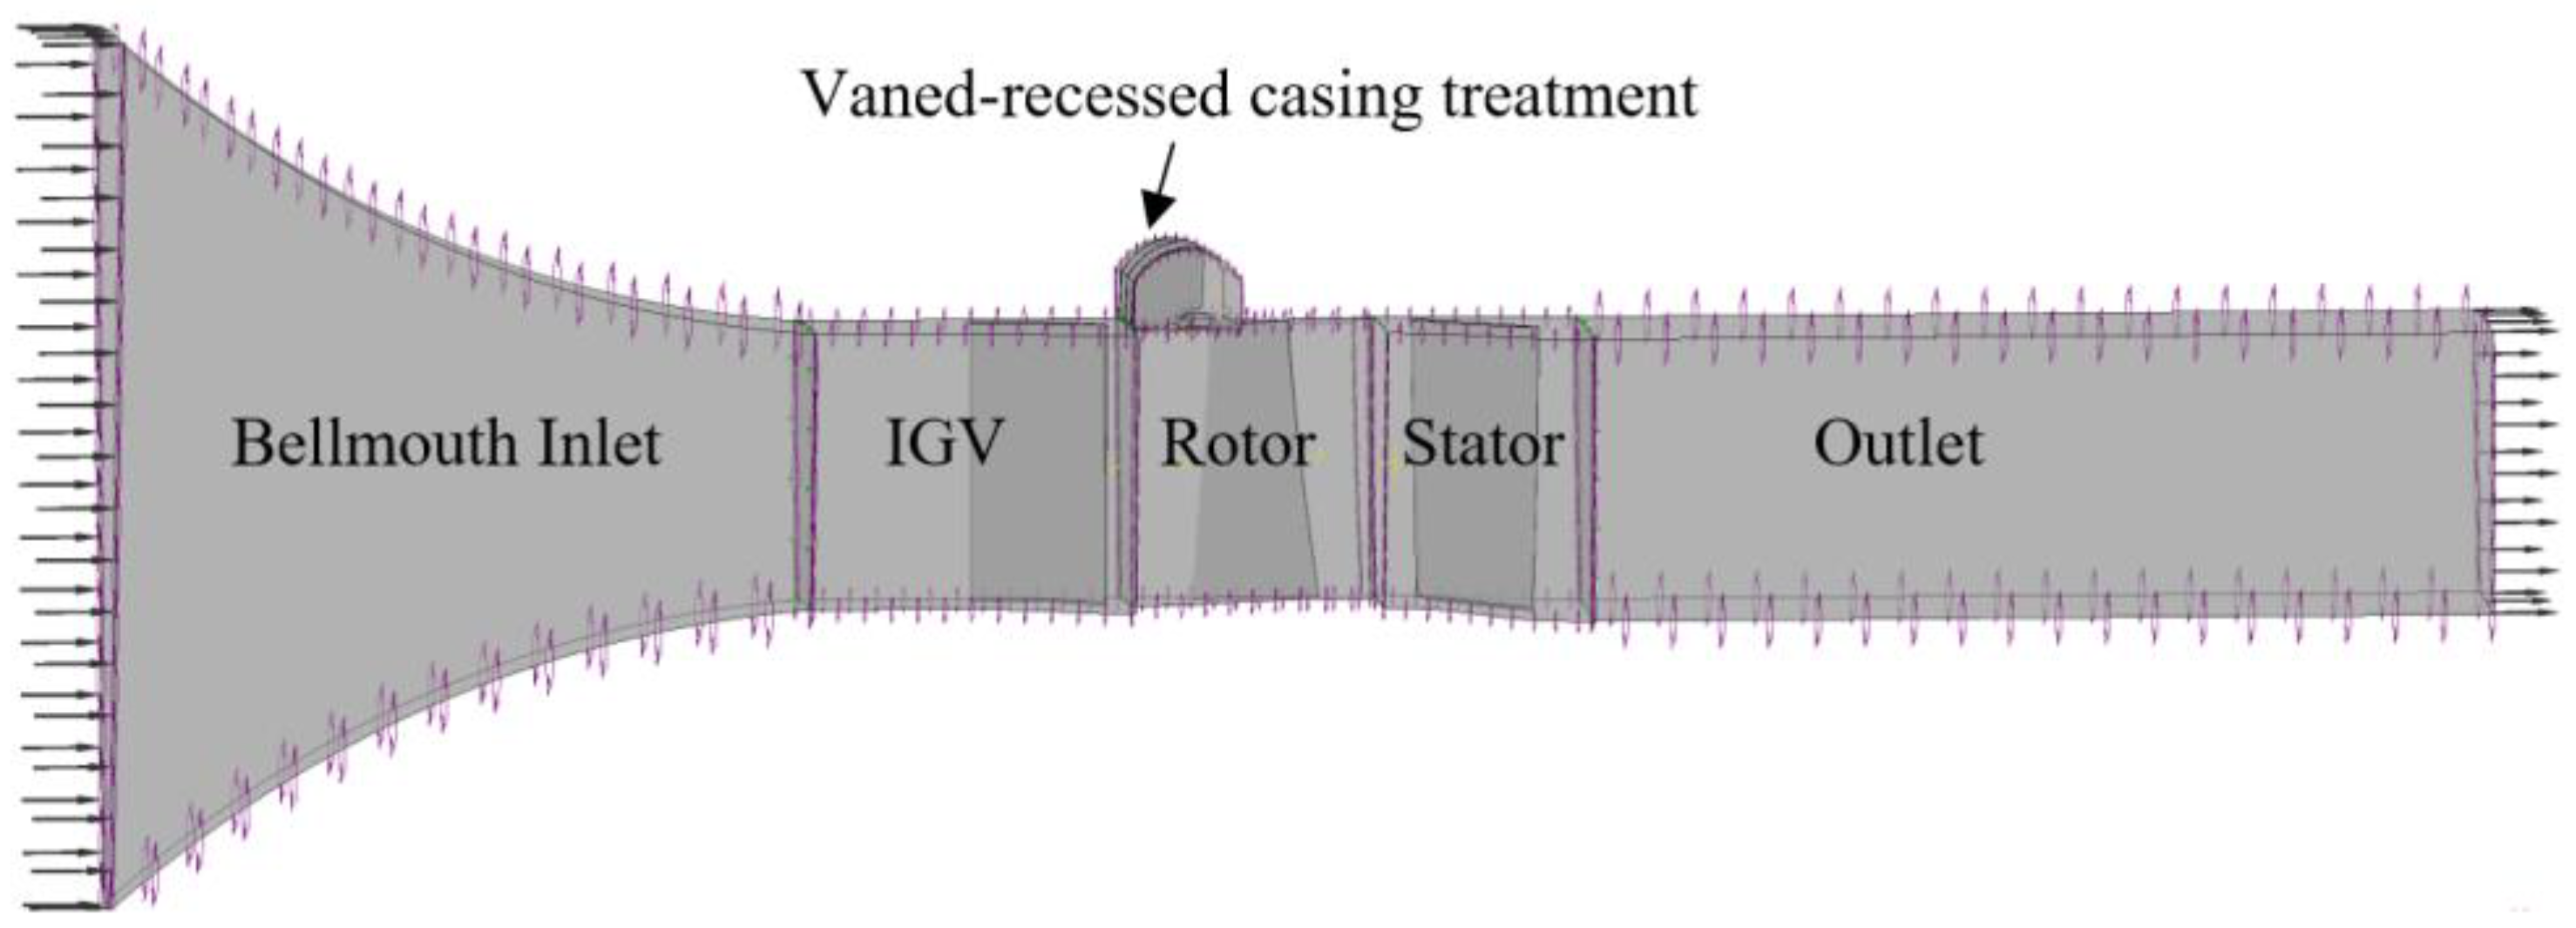
The turbulence was modelled by the shear stress transport k ω turbulence model. The closure of the governing equations is based on Boussinesq approximation, which assumes turbulent momentum transport is proportional to the mean strain rate. The SST turbulence model benefits from the accurate representations of k ω near wall regions and freestream independence of k ε model away from wall regions.

4.3. Geometry

Based on the requirements of CFD numerical method that pitch ratios should be close to unity across the transient interfaces, the numbers of IGV blade, rotor blade, guide vanes inside the casing treatment and stator blades to be modelled are 1, 1, 3 and 1, respectively. The computational flow domain consists of bellmouth inlet, IGV, rotor, stator, casing treatment and outlet. A schematic view of the computational flow domains is presented in Figure 4.

4.4. Boundary Conditions

Total temperature and total pressure were imposed at the inlet, while, at the outlet, either mass flow or static pressure boundary conditions were applied. It is assumed that the properties have uniform distributions at the inlet. Periodic boundary conditions were applied to the flow domains in the circumferential direction. The solid boundaries were chosen to be nonslip, adiabatic and smooth. The turbulence at inlet is set as 5% with medium intensity.

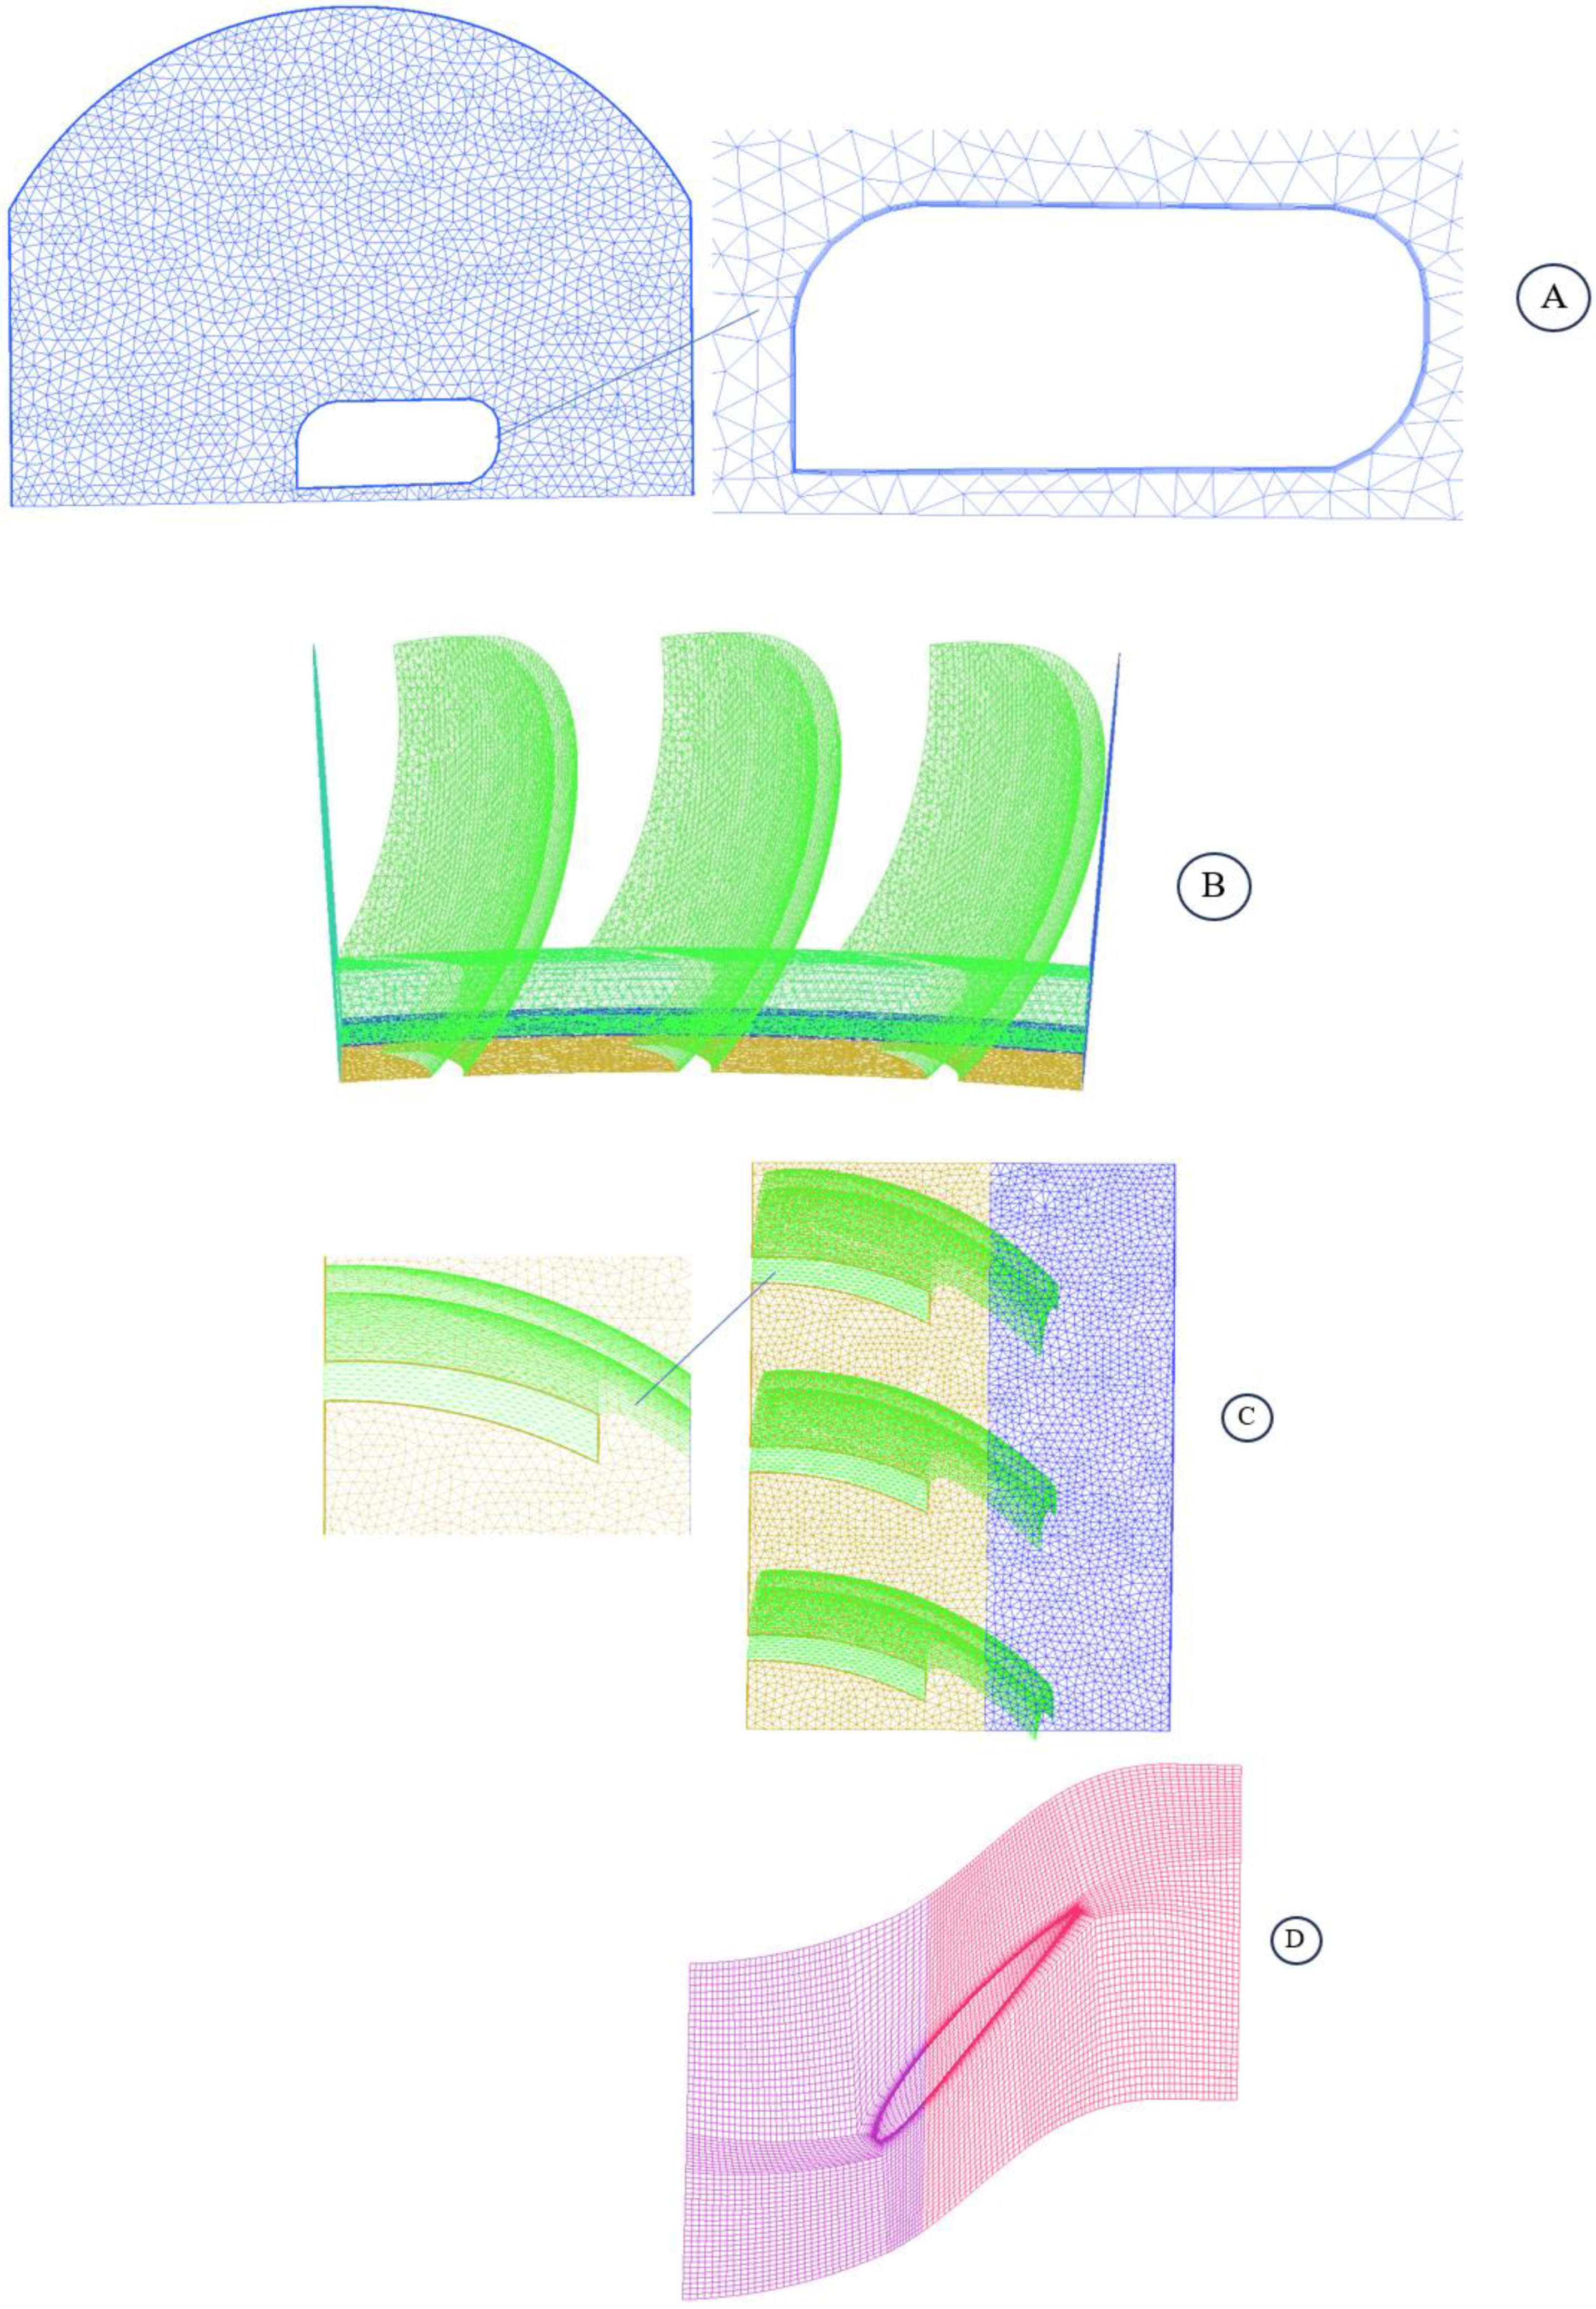
4.5. Meshing Details

IGV, rotor and stator were discretized with block-structured grids. Each blade passage employs an O-grid near the blade surface, while the other parts utilize an H-grid structure. A mixture of structured and unstructured grids was generated for the casing treatment. The grid density near the wall surfaces was increased to conform with y+ requirements of 2. Front, side and down views of the grids within the casing treatment and rotor grids are presented in Figure 5.

4.6. Grid Independence Study

A summary of five types of tested grids is shown in Table 2. The grid independence was judged based on the analysis of local and global parameters at the near peak efficiency and the near stall point. Three parameters, including local static pressure in the tip of rotor, pressure rise coefficient (t-s) in addition to pressure ratio (t-s) at a numerical probe, were selected for evaluation of grid independence. The numerical probe is located near the tip of the rotor and close to the suction side and is shown in Figure 6. At 2.12 kg/s, as the grid number increases, the pressure, pressure rise coefficient and pressure ratio increase slightly and finally become constant after using the medium grid type. As the mass flow is reduced to 1.95 kg/s, the same trend in the increase in pressure, pressure rise coefficient and pressure ratio among the coarse-1, coarse-2 and medium grids can be observed likewise. The analysis of the grids at the two operating points shows that grid independence has been achieved.

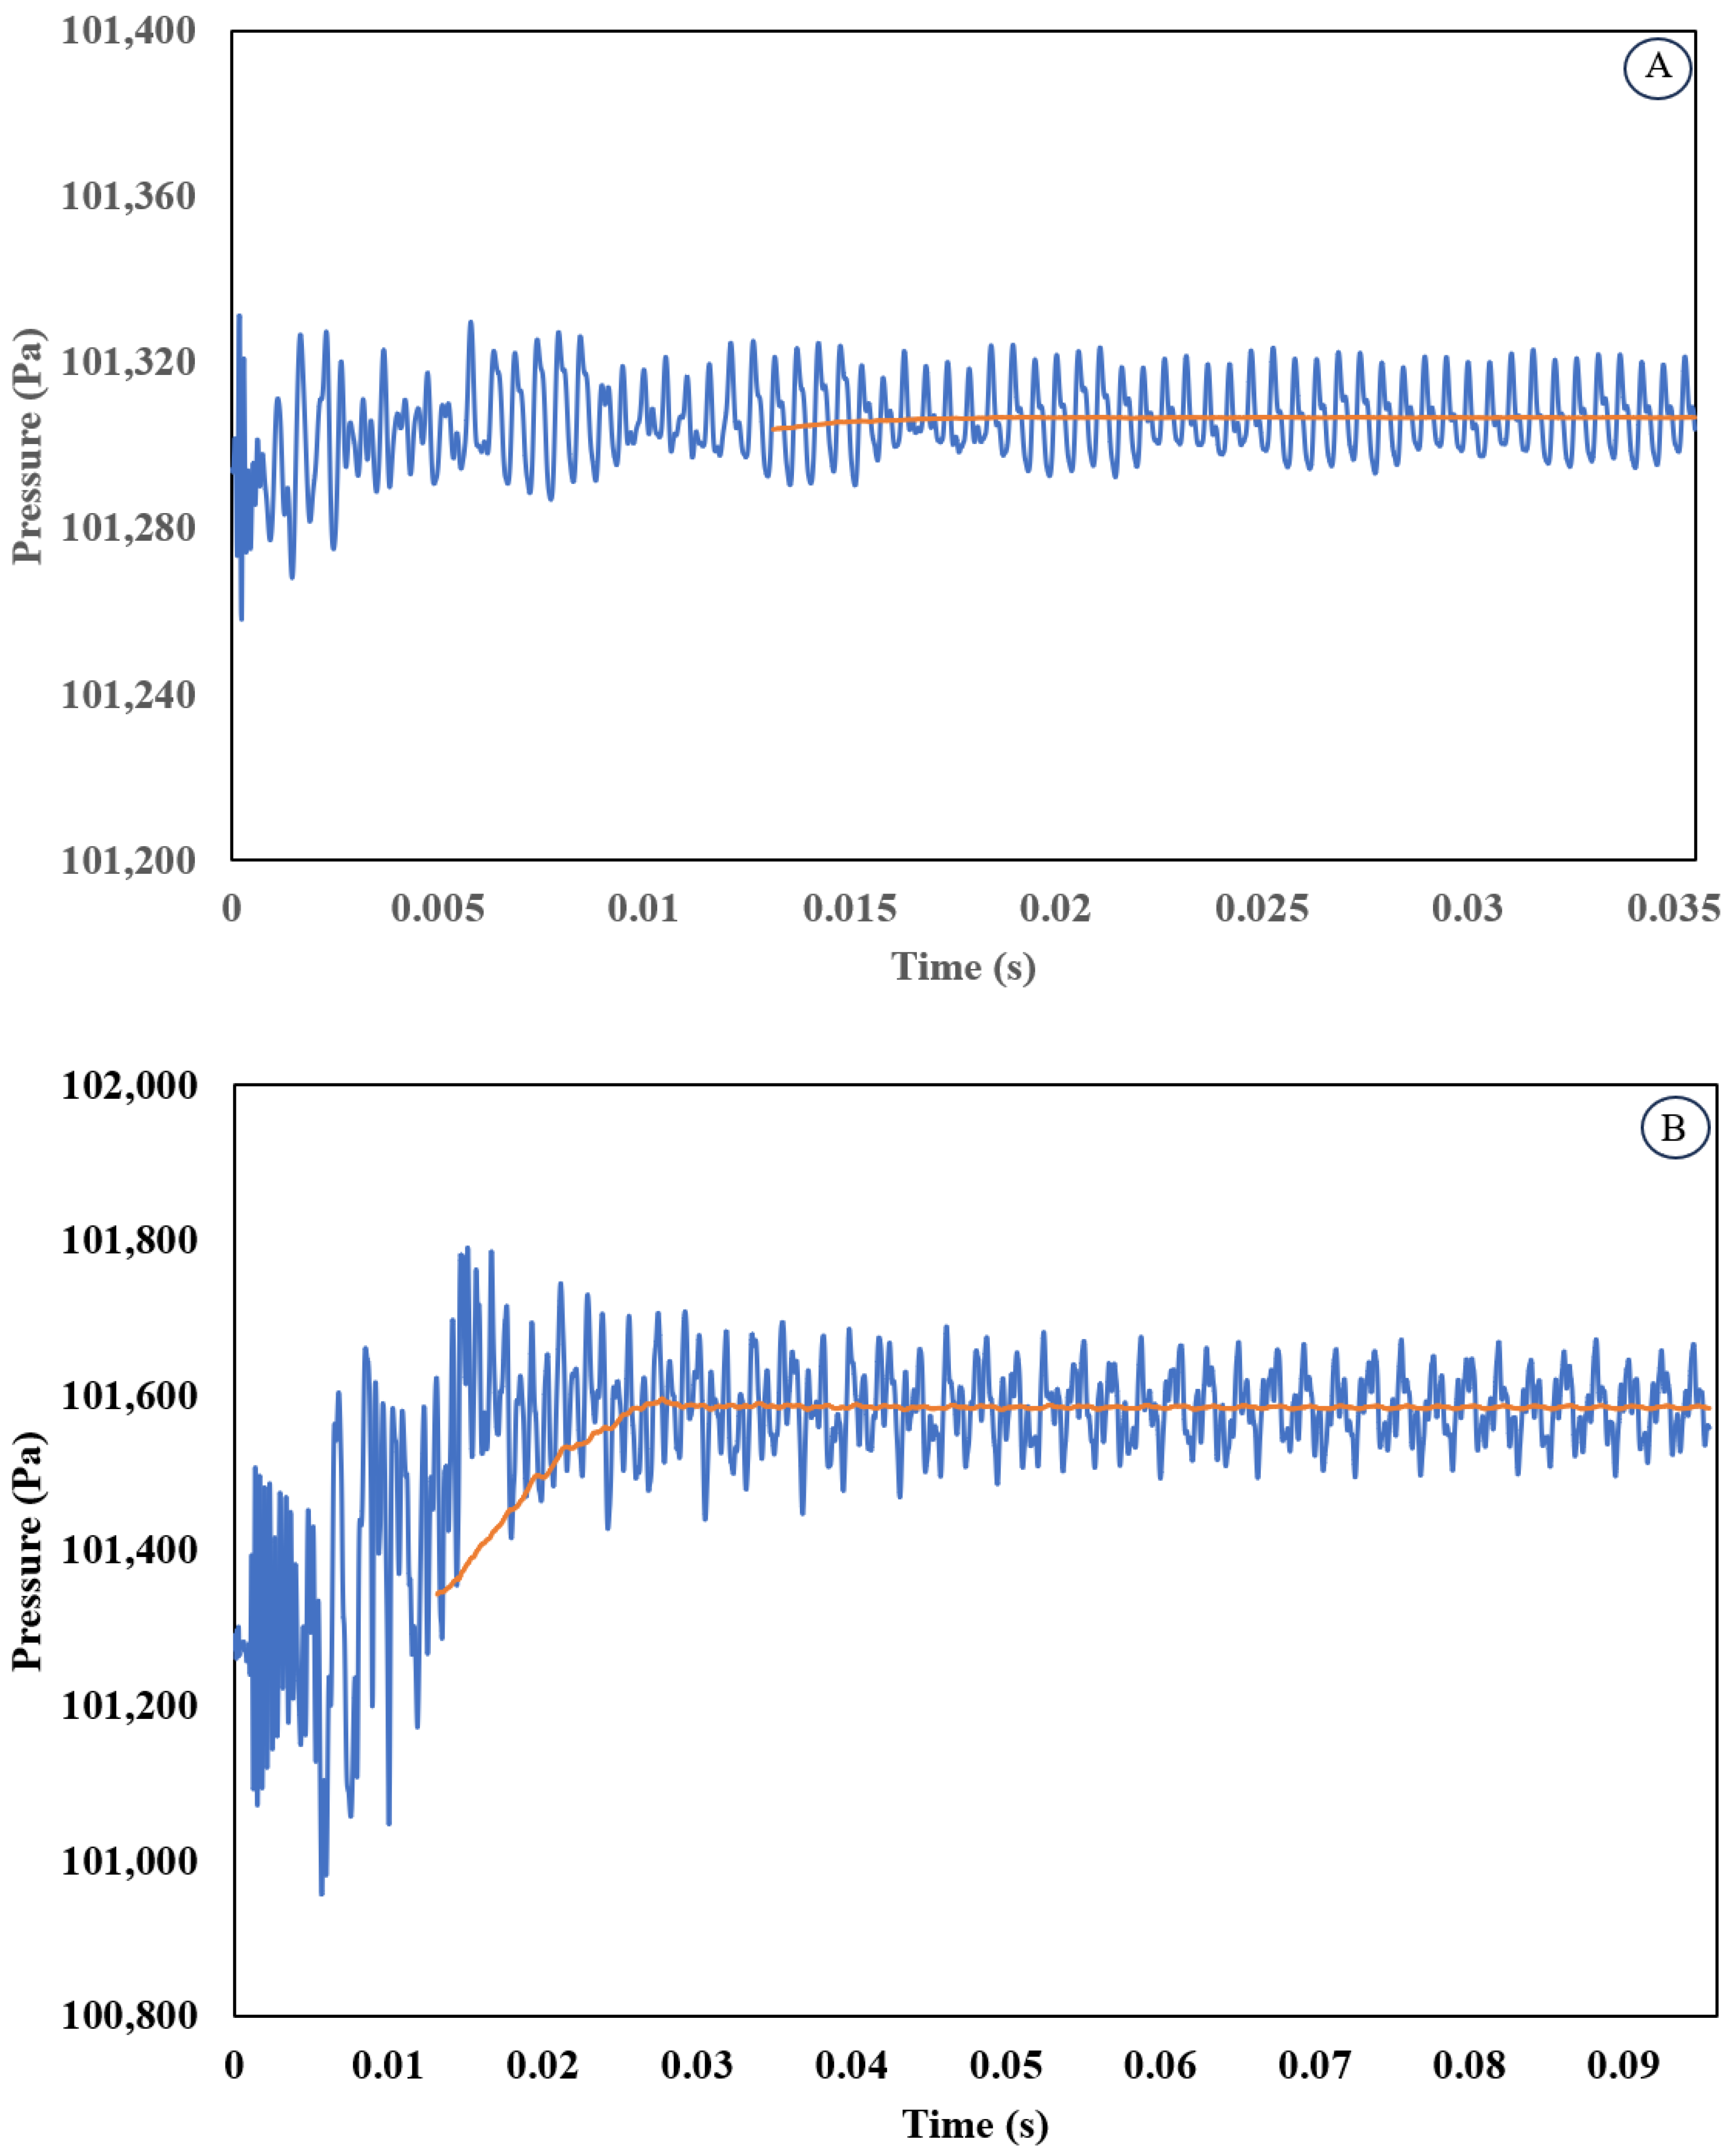
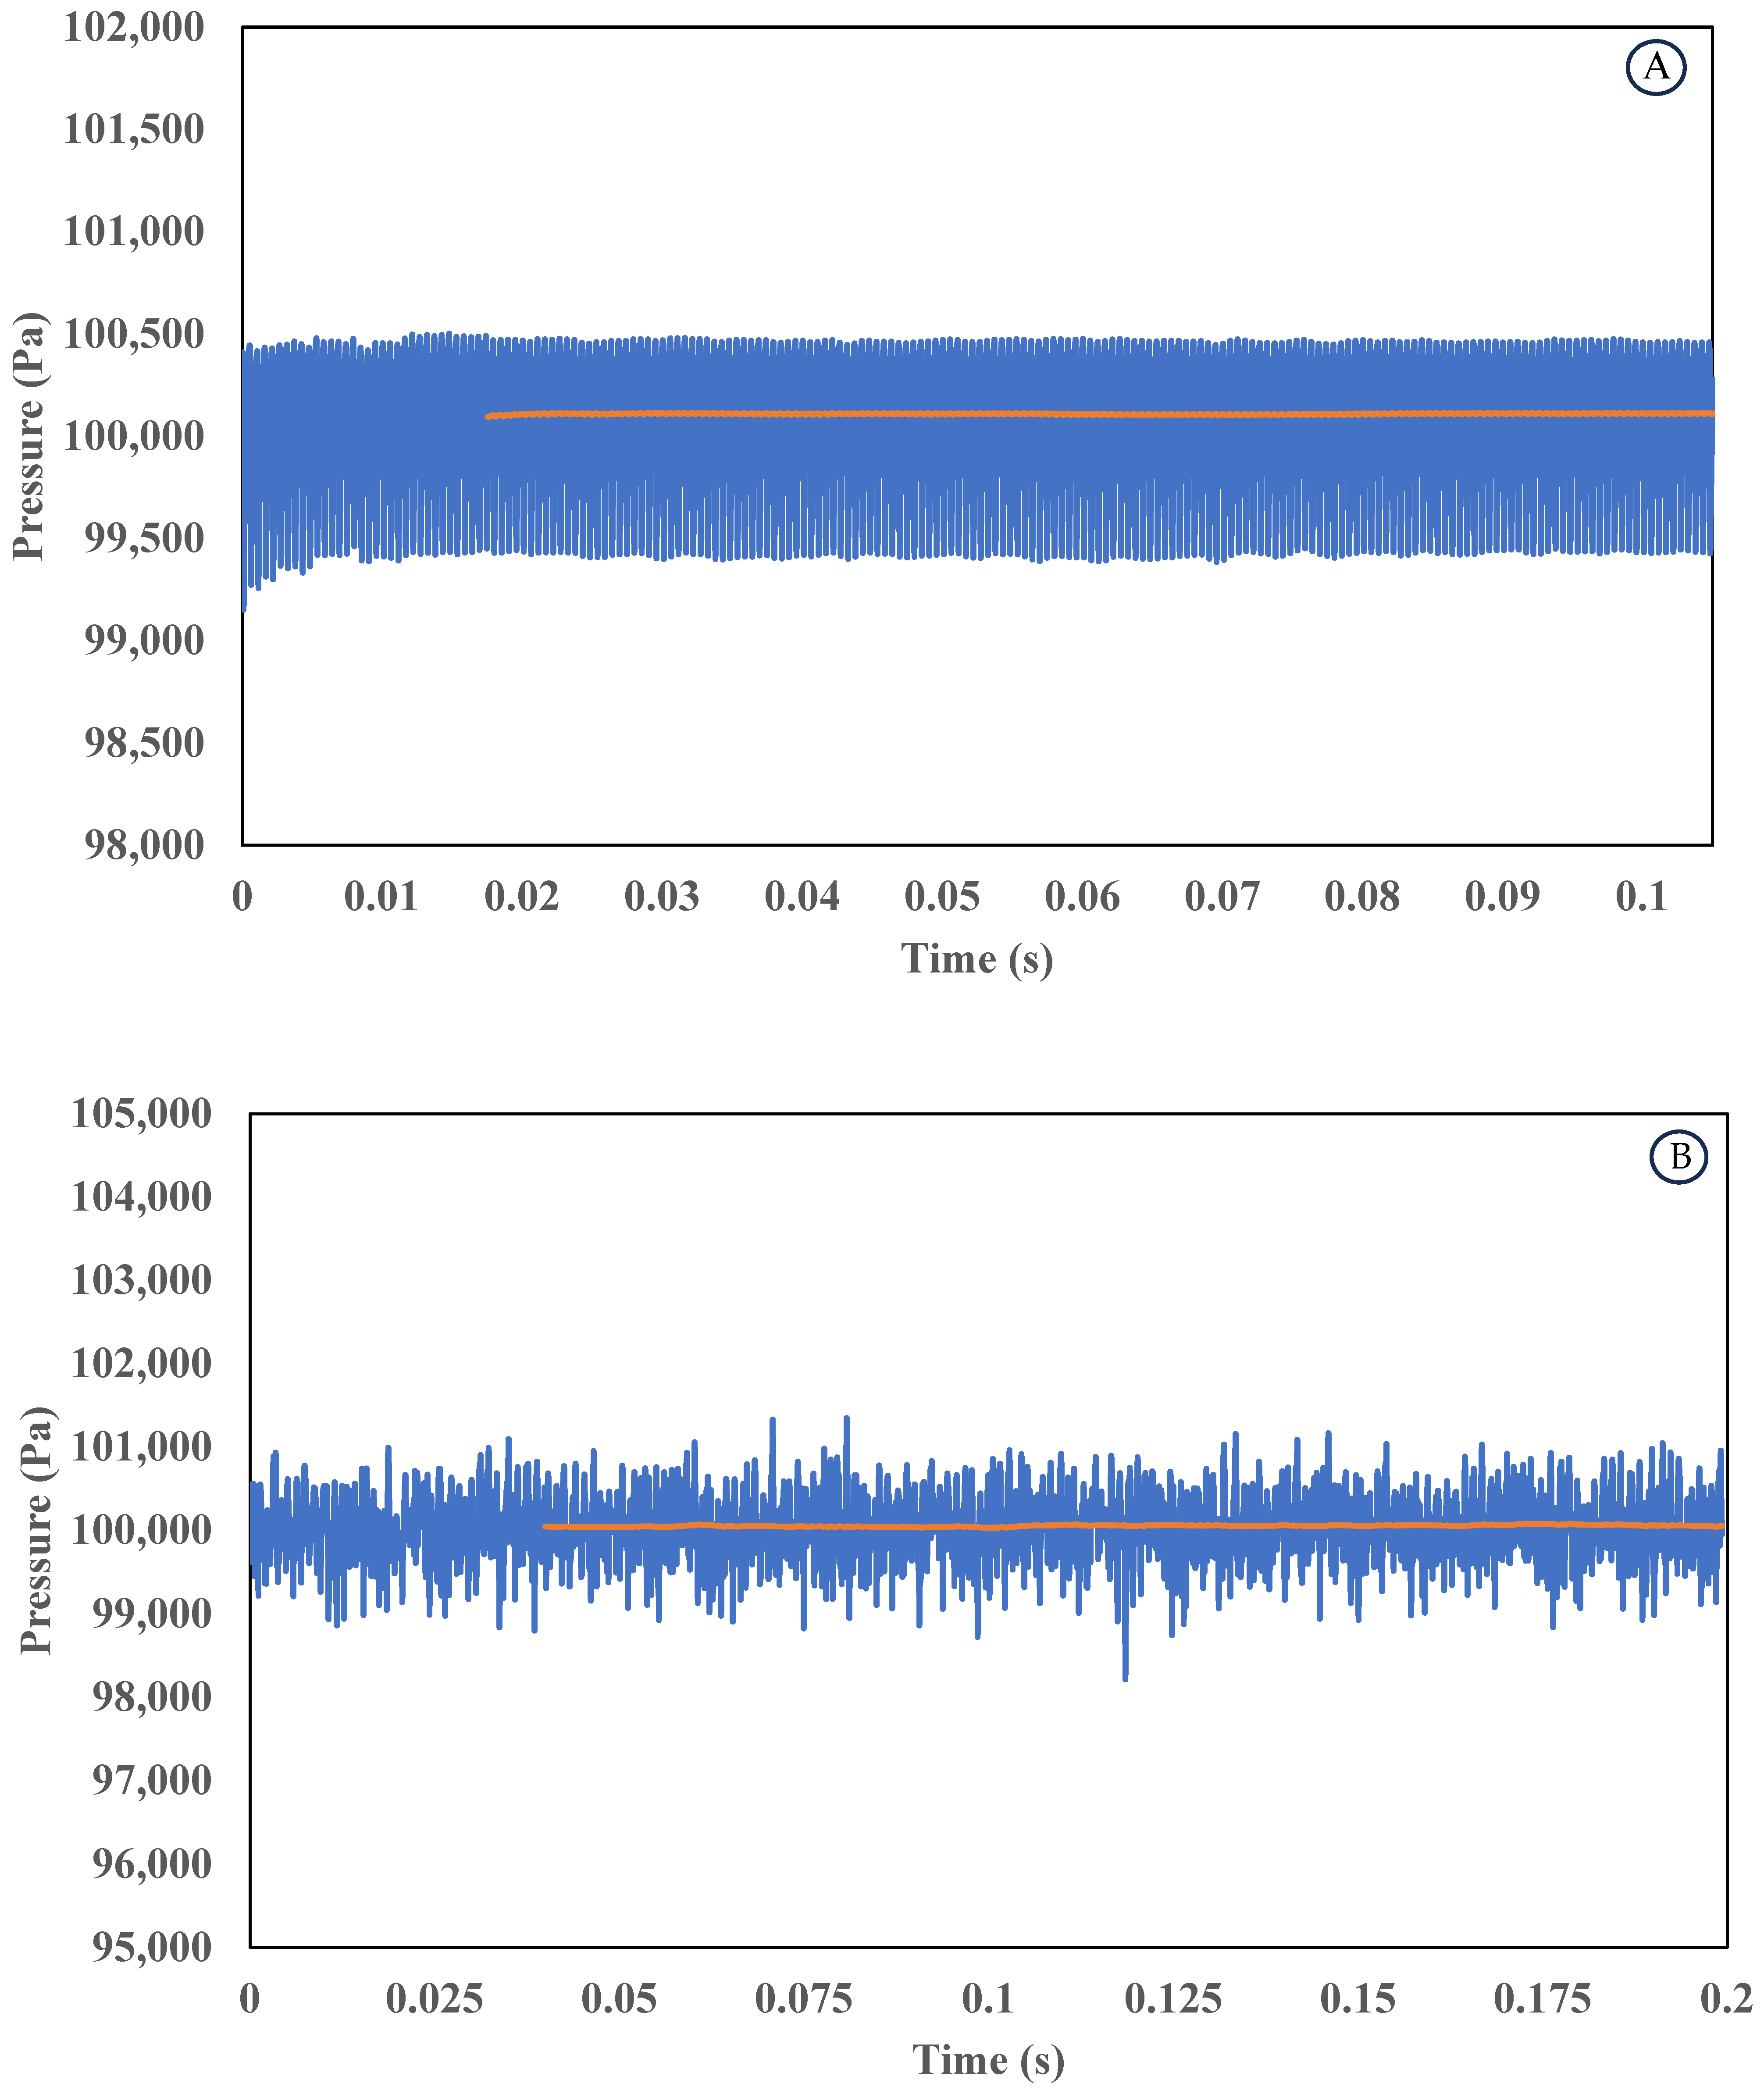
4.7. Convergence Assessment

The convergence of all the unsteady computations was assessed by analyzing pressure signals during the simulations. The computations were considered to be convergent when moving averages of pressure signals remained constant and presented periodic patterns. The time histories of pressure signals for SC configurations at PE and NS operating points are shown in Figure 7, while moving averages are superimposed on the pressure signals (center lines). The location of numerical probe for SC configuration is the same location of the numerical probe in the tip of rotor. A full rotation of rotor corresponds to 0.02 s or 38 passing periods.
At PE condition, about 0.01 s corresponding to 19 rotor passing periods was required to obtain periodicity. As the mass flow is reduced and the near stall condition is approached, about 0.02 s or 38 passing periods corresponding to a full rotor rotation were required to obtain periodic behavior.
The time histories of pressure signals for CT configuration at 1.95 kg/s and 1.6 kg/s operating points are shown in Figure 8. The location of the numerical probe for CT configurations is within the casing treatment. After the casing treatment is applied, the pressure signal inside the casing treatment shows a fully periodic pattern at 1.95 kg/s.
As the mass flow is reduced to 1.6 kg/s, the pressure signal undergoes significant change due to the presence of instabilities, however, the moving average remains constant after nearly 0.025 s. The analysis of the pressure signals shows that the moving averages remain constant in all cases and, as a result, the convergence of the computations has been achieved.

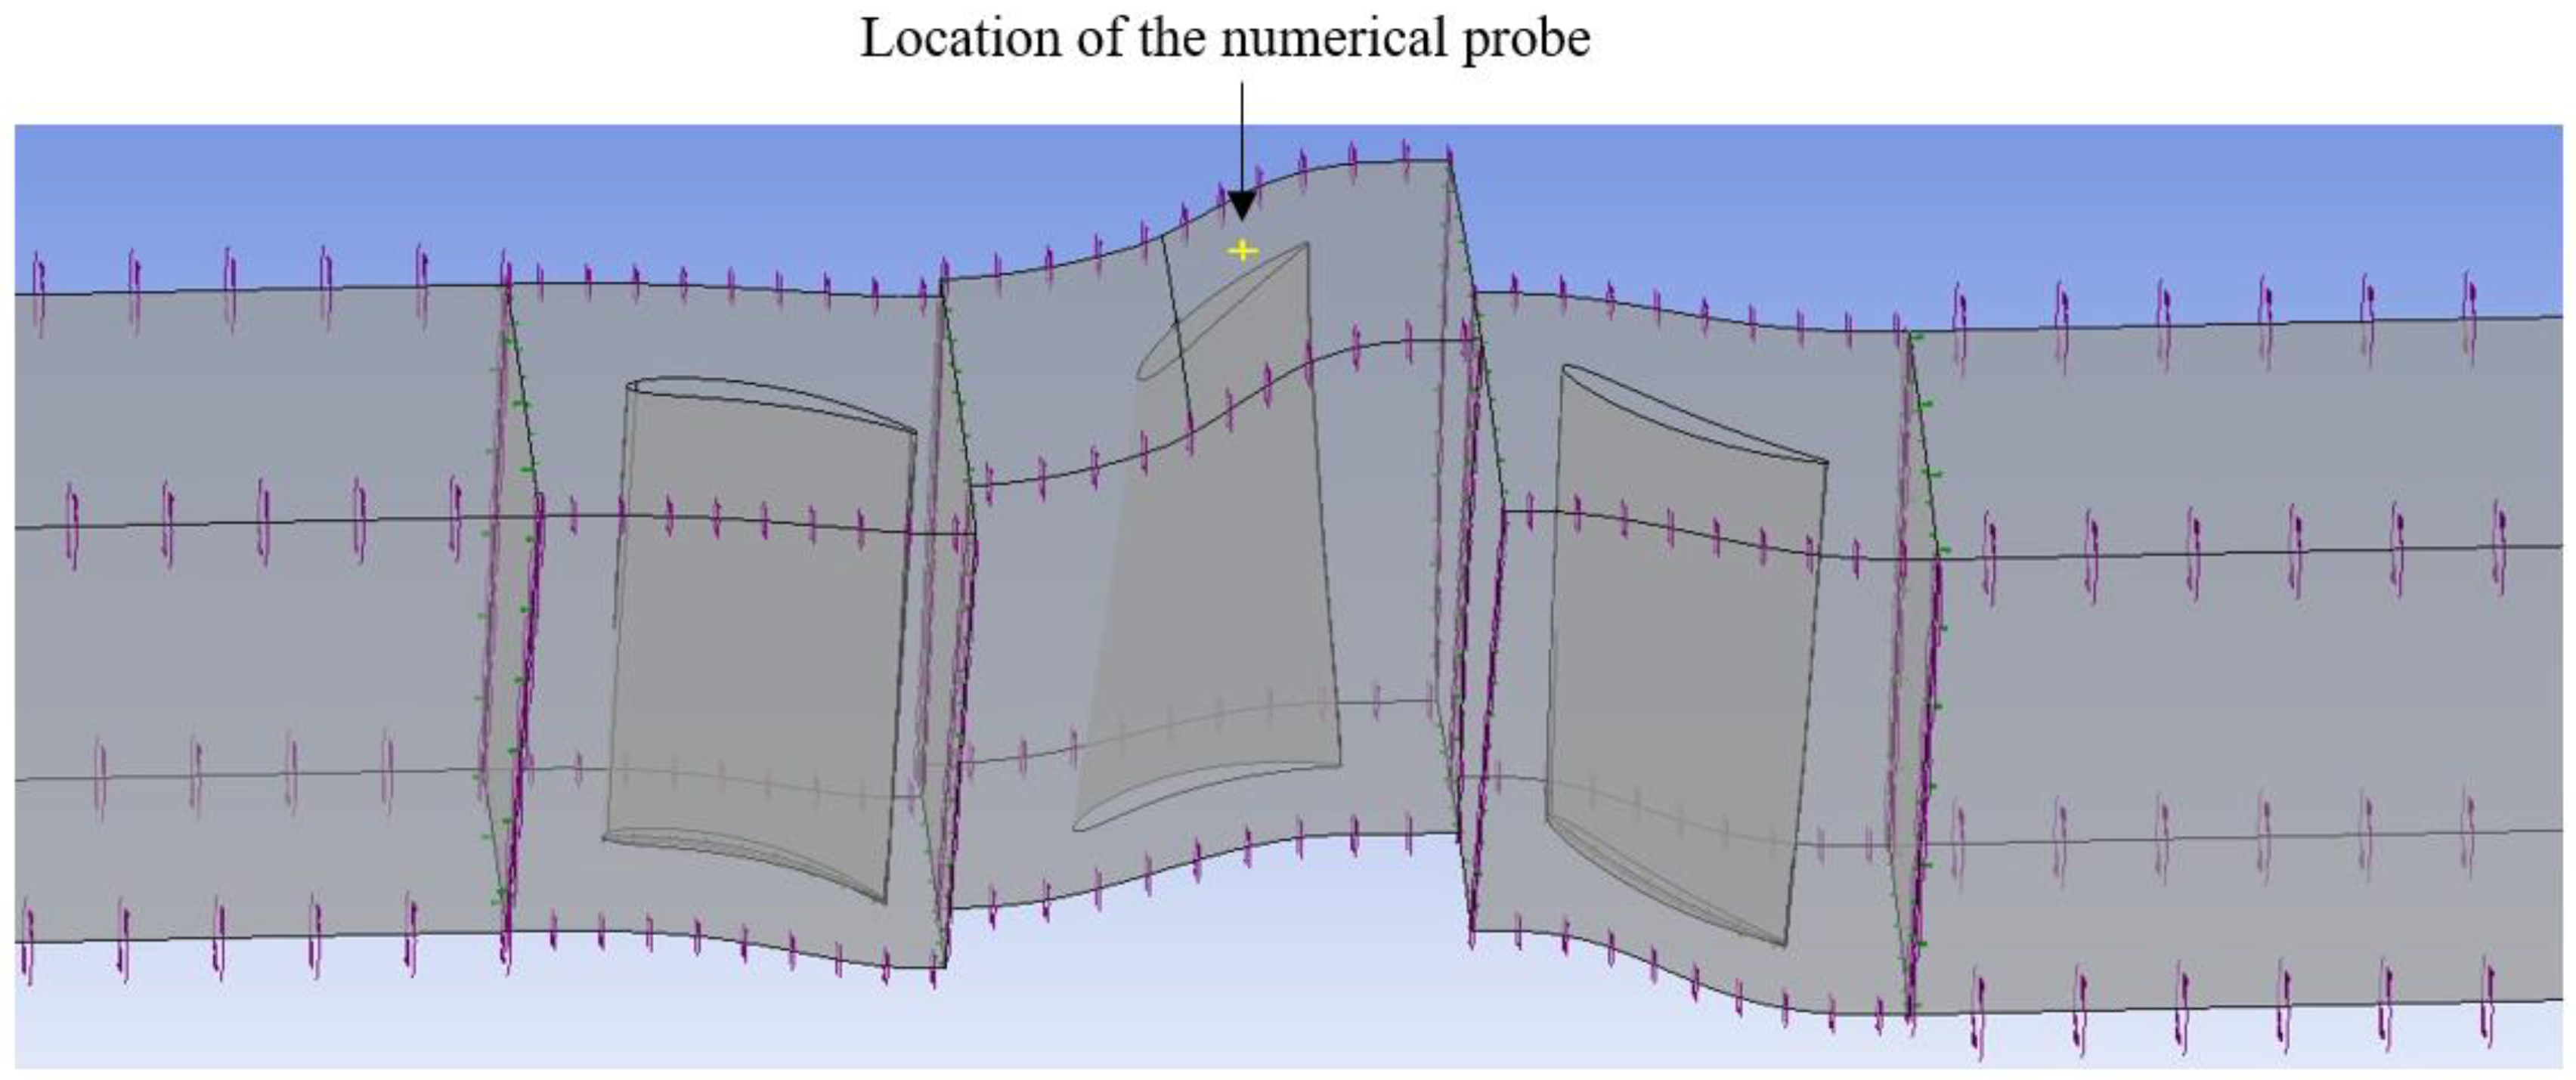
4.8. Stall Detection

The detection of stall has been challenging for the investigated compressor due to being low pressure rise and the presence of numerical error. Nevertheless, the detection of the onset of stall has been made by the analysis of pressure signals and a new approach. As can be found from the pressure signals in the previous section, at higher mass flow rates, pressure signals are fully periodic in time but, as the mass flow is reduced and the near stall point is approached, the periodicity of the pressure signals in time breaks down due to the presence of instabilities. Following Gourdain [19], simulations were run a sufficient time near stall conditions to reduce uncertainty associated with the results.
The last converged solutions have been selected as the near stall points for SC and CT configurations. Based on this approach, the onset of stall is initiated at 1.95 kg/s and 1.60 kg/s for SC and CT configurations, respectively.
More details on the detection of the onset of stall for the investigated compressor based on a new approach and using secondary flow total energy and spectral entropy can be found in Akhlaghi [20].

4.9. Validation

Table 3 and Table 4 compare the numerical and experimental results [16] for SC and CT configurations at 2.35, 2.12, 1.95 and 1.6 kg/s mass flow rates. Total pressure at inlet and outlet and static pressure at outlet and pressure ratio (t-s) were selected for validation of the numerical results. As can be seen, good agreement exists between the numerical and experimental results at these operating points and the maximum discrepancy between the numerical and experimental results is less than 0.3%. Based on the verification of the results with negligible error, the numerical method used in this study is assumed to be accurate.

5. Results

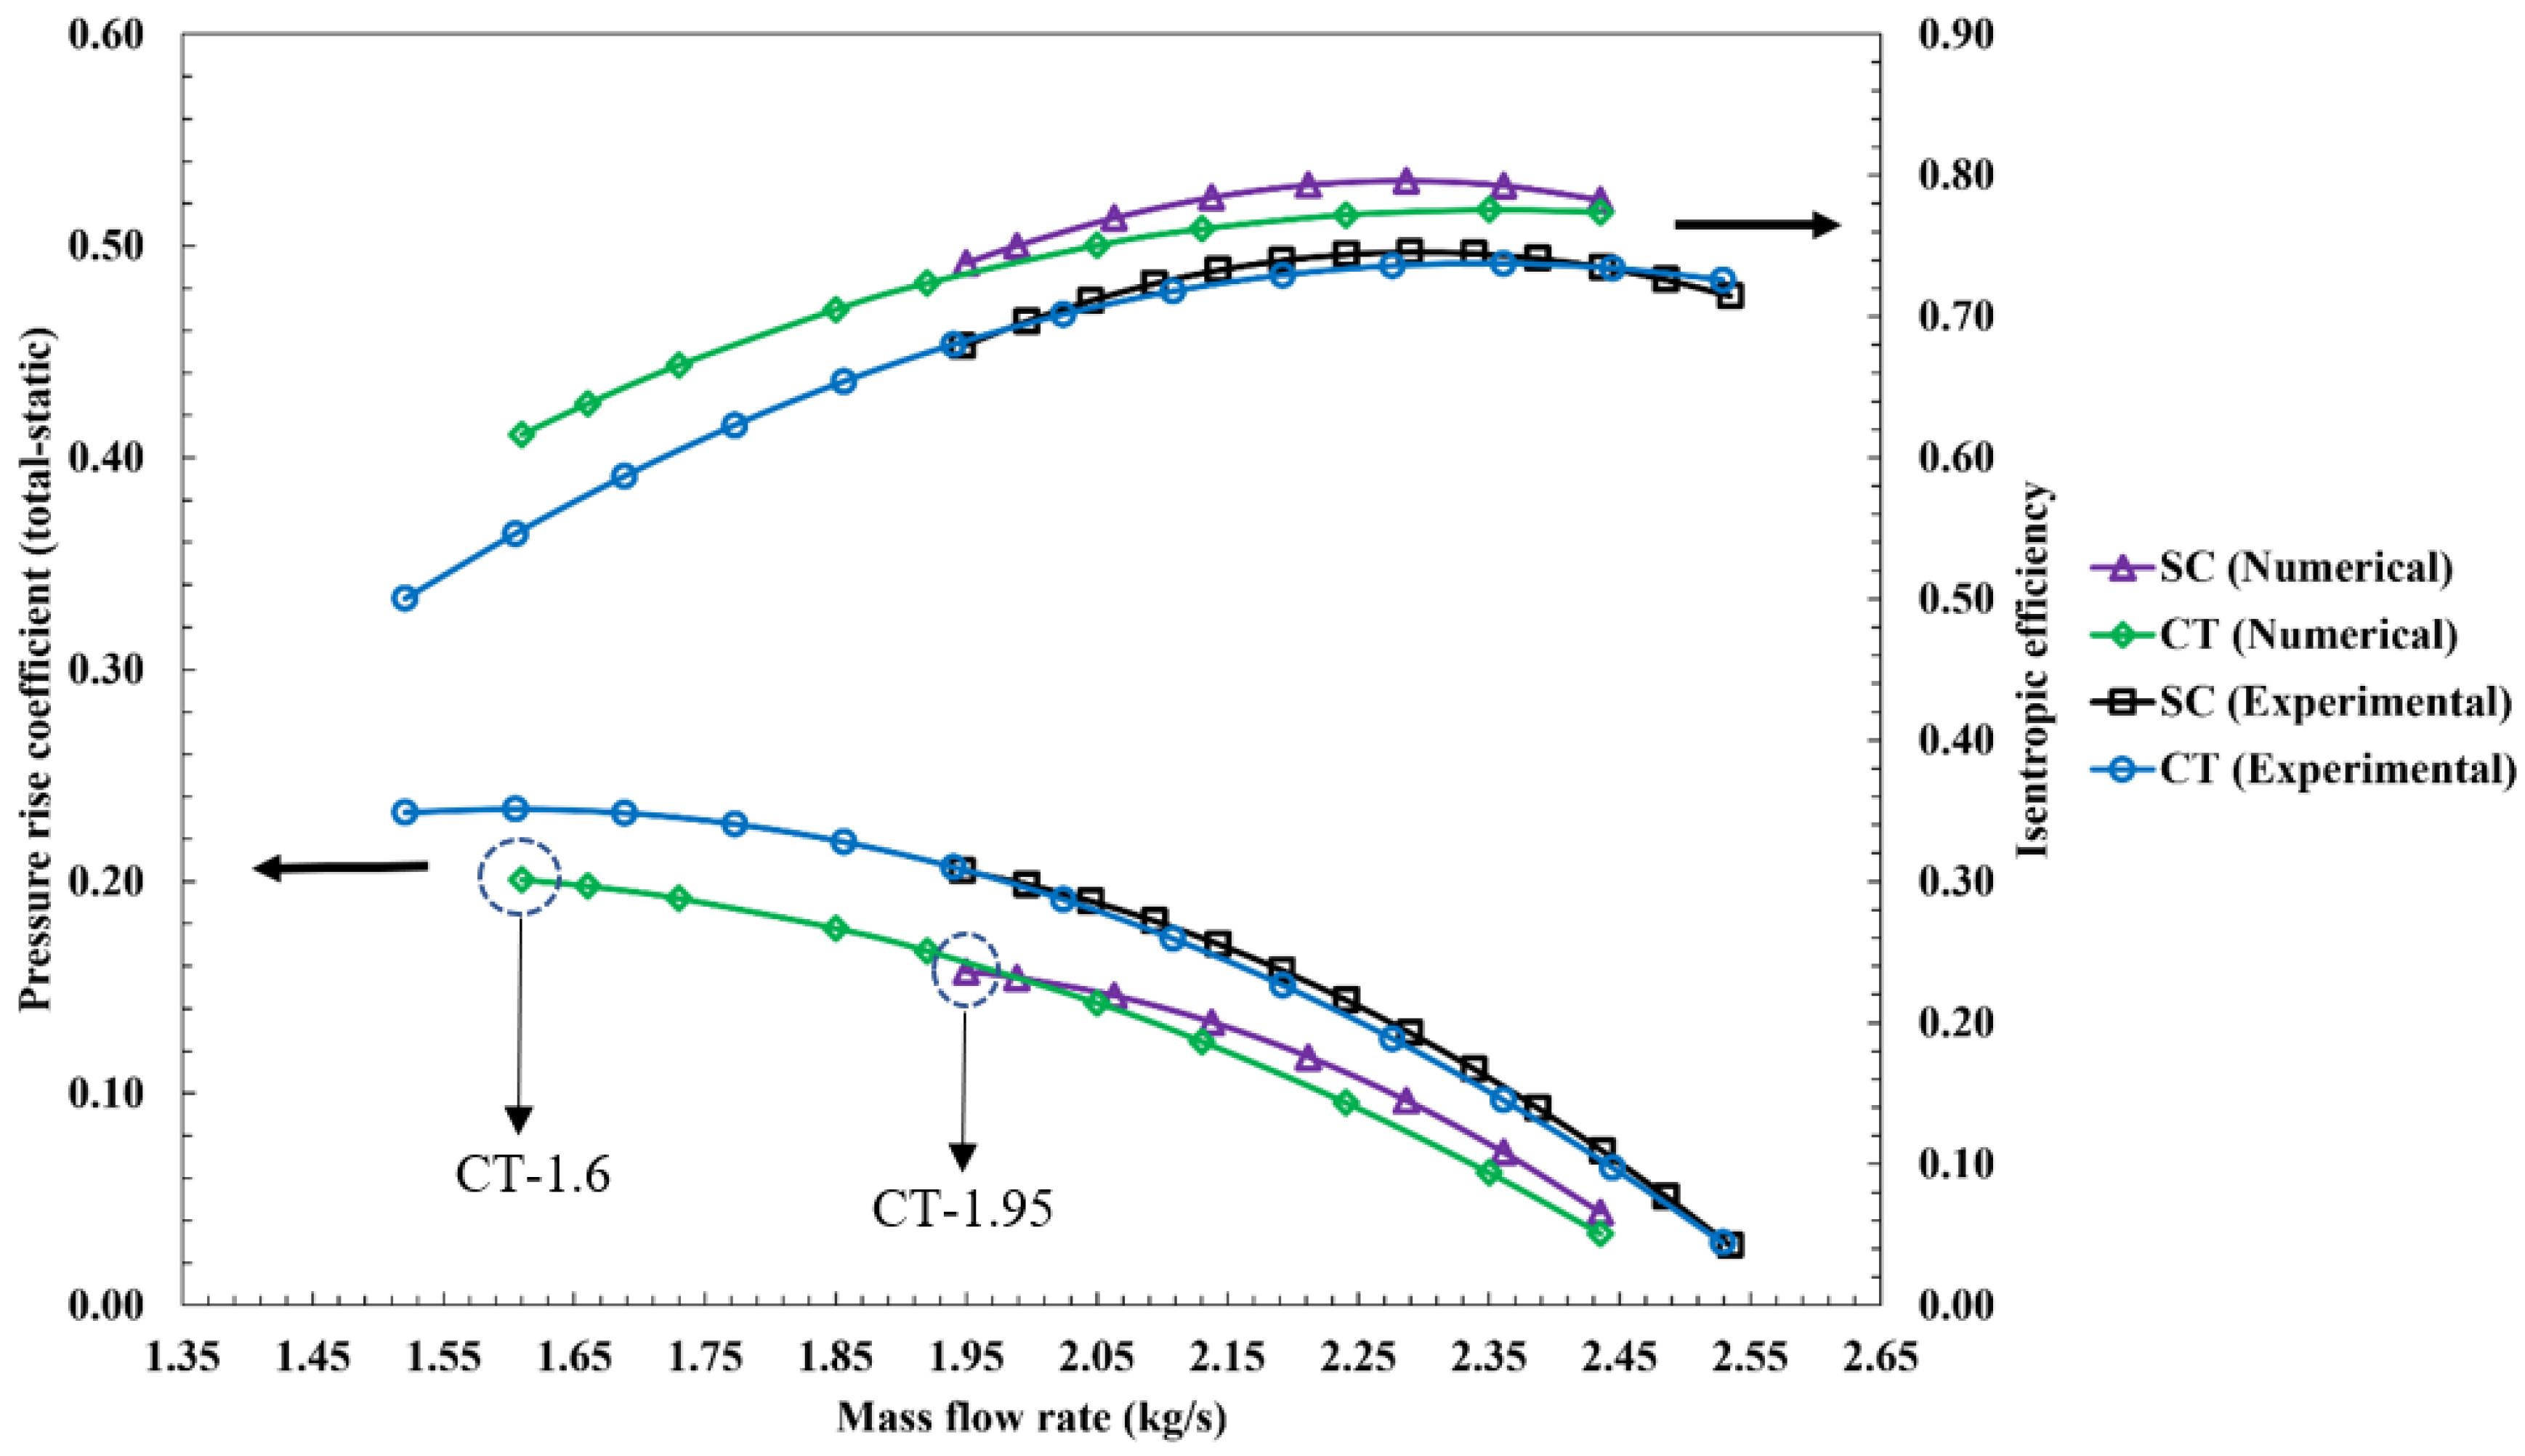
5.1. Compressor Characteristics

The time-averaged compressor performance maps including pressure rise coefficient (total-static) in addition to efficiency are compared to the experimental results from Akhlaghi [8,16] in Figure 9 for SC and CT configurations.
The Pressure rise coefficient (t-s) is defined as:
P r e s s u r e   r i s e   c o e f f i c i e n t   total static = Δ p total static 1 / 2 ρ U 2  
Maximum mass flow to stall operating points was obtained by reducing mass flow at the outlet. The simulations were conducted as 3D and fully unsteady.
As can be seen from Figure 9, reasonable agreement exists between the numerical and experimental results. Configuration A improves stall margin, but it causes a small penalty in the efficiency over the entire operating range of the compressor.
Regarding the difference between the numerical and experimental results of efficiency, the experimental efficiency has been calculated as the ratio of the actual pressure rise to the ideal work input to the compressor without including any losses in Reference [16] as:
η = Δ P A c t u a l Δ P I d e a l = Δ P A c t u a l ρ × Δ H    
The ideal work input to the compressor has been taken as the applied torque to the compressor times angular velocity of the rotor blade.
η = Φ × Δ P ρ × ω × τ A p p l i e d          
where Φ is mass flow rate.
However, as the applied torque in CFD results is the applied torque by the rotor blade against the fluid, any mechanical losses between the rotor and the shaft are not accounted by CFD results; hence, the efficiencies are slightly overestimated compared to the experimental results. However, the trend of the efficiency curves is correctly estimated by the simulations. Furthermore, compared to the experimental results, the numerical results at the most have 5% error in predicting the onsets of stall/surge.
Stall margin improvement (SMI) in terms of mass flow rates and the corresponding pressure ratios near the stall points for configuration A is calculated as:
S t a l l   m a r g i n   i m p r o v e m e n t = m ˙   S t a l l S C × P R S t a l l S C m ˙ S t a l l C T × P R S t a l l C T m ˙   S t a l l S C × P R S t a l l S C
where m ˙   S t a l l S C and m ˙ S t a l l C T are the mass flow rates and P R S t a l l S C and P R S t a l l C T are the pressure ratios, both near the stall points for SC and CT configurations, respectively. According to this equation, the stall margin improvement is 17.7%.
After introducing the casing treatment, regardless of the compressor operating conditions, some penalty in pressure rise coefficient (t-s) is seen. The reduction in pressure rise coefficient (t-s) at PE point for CTA is equal to 15%. Therefore, the stall margin improvement is achieved at the expense of some penalty in pressure rise.

5.2. Rotor Flow Fields

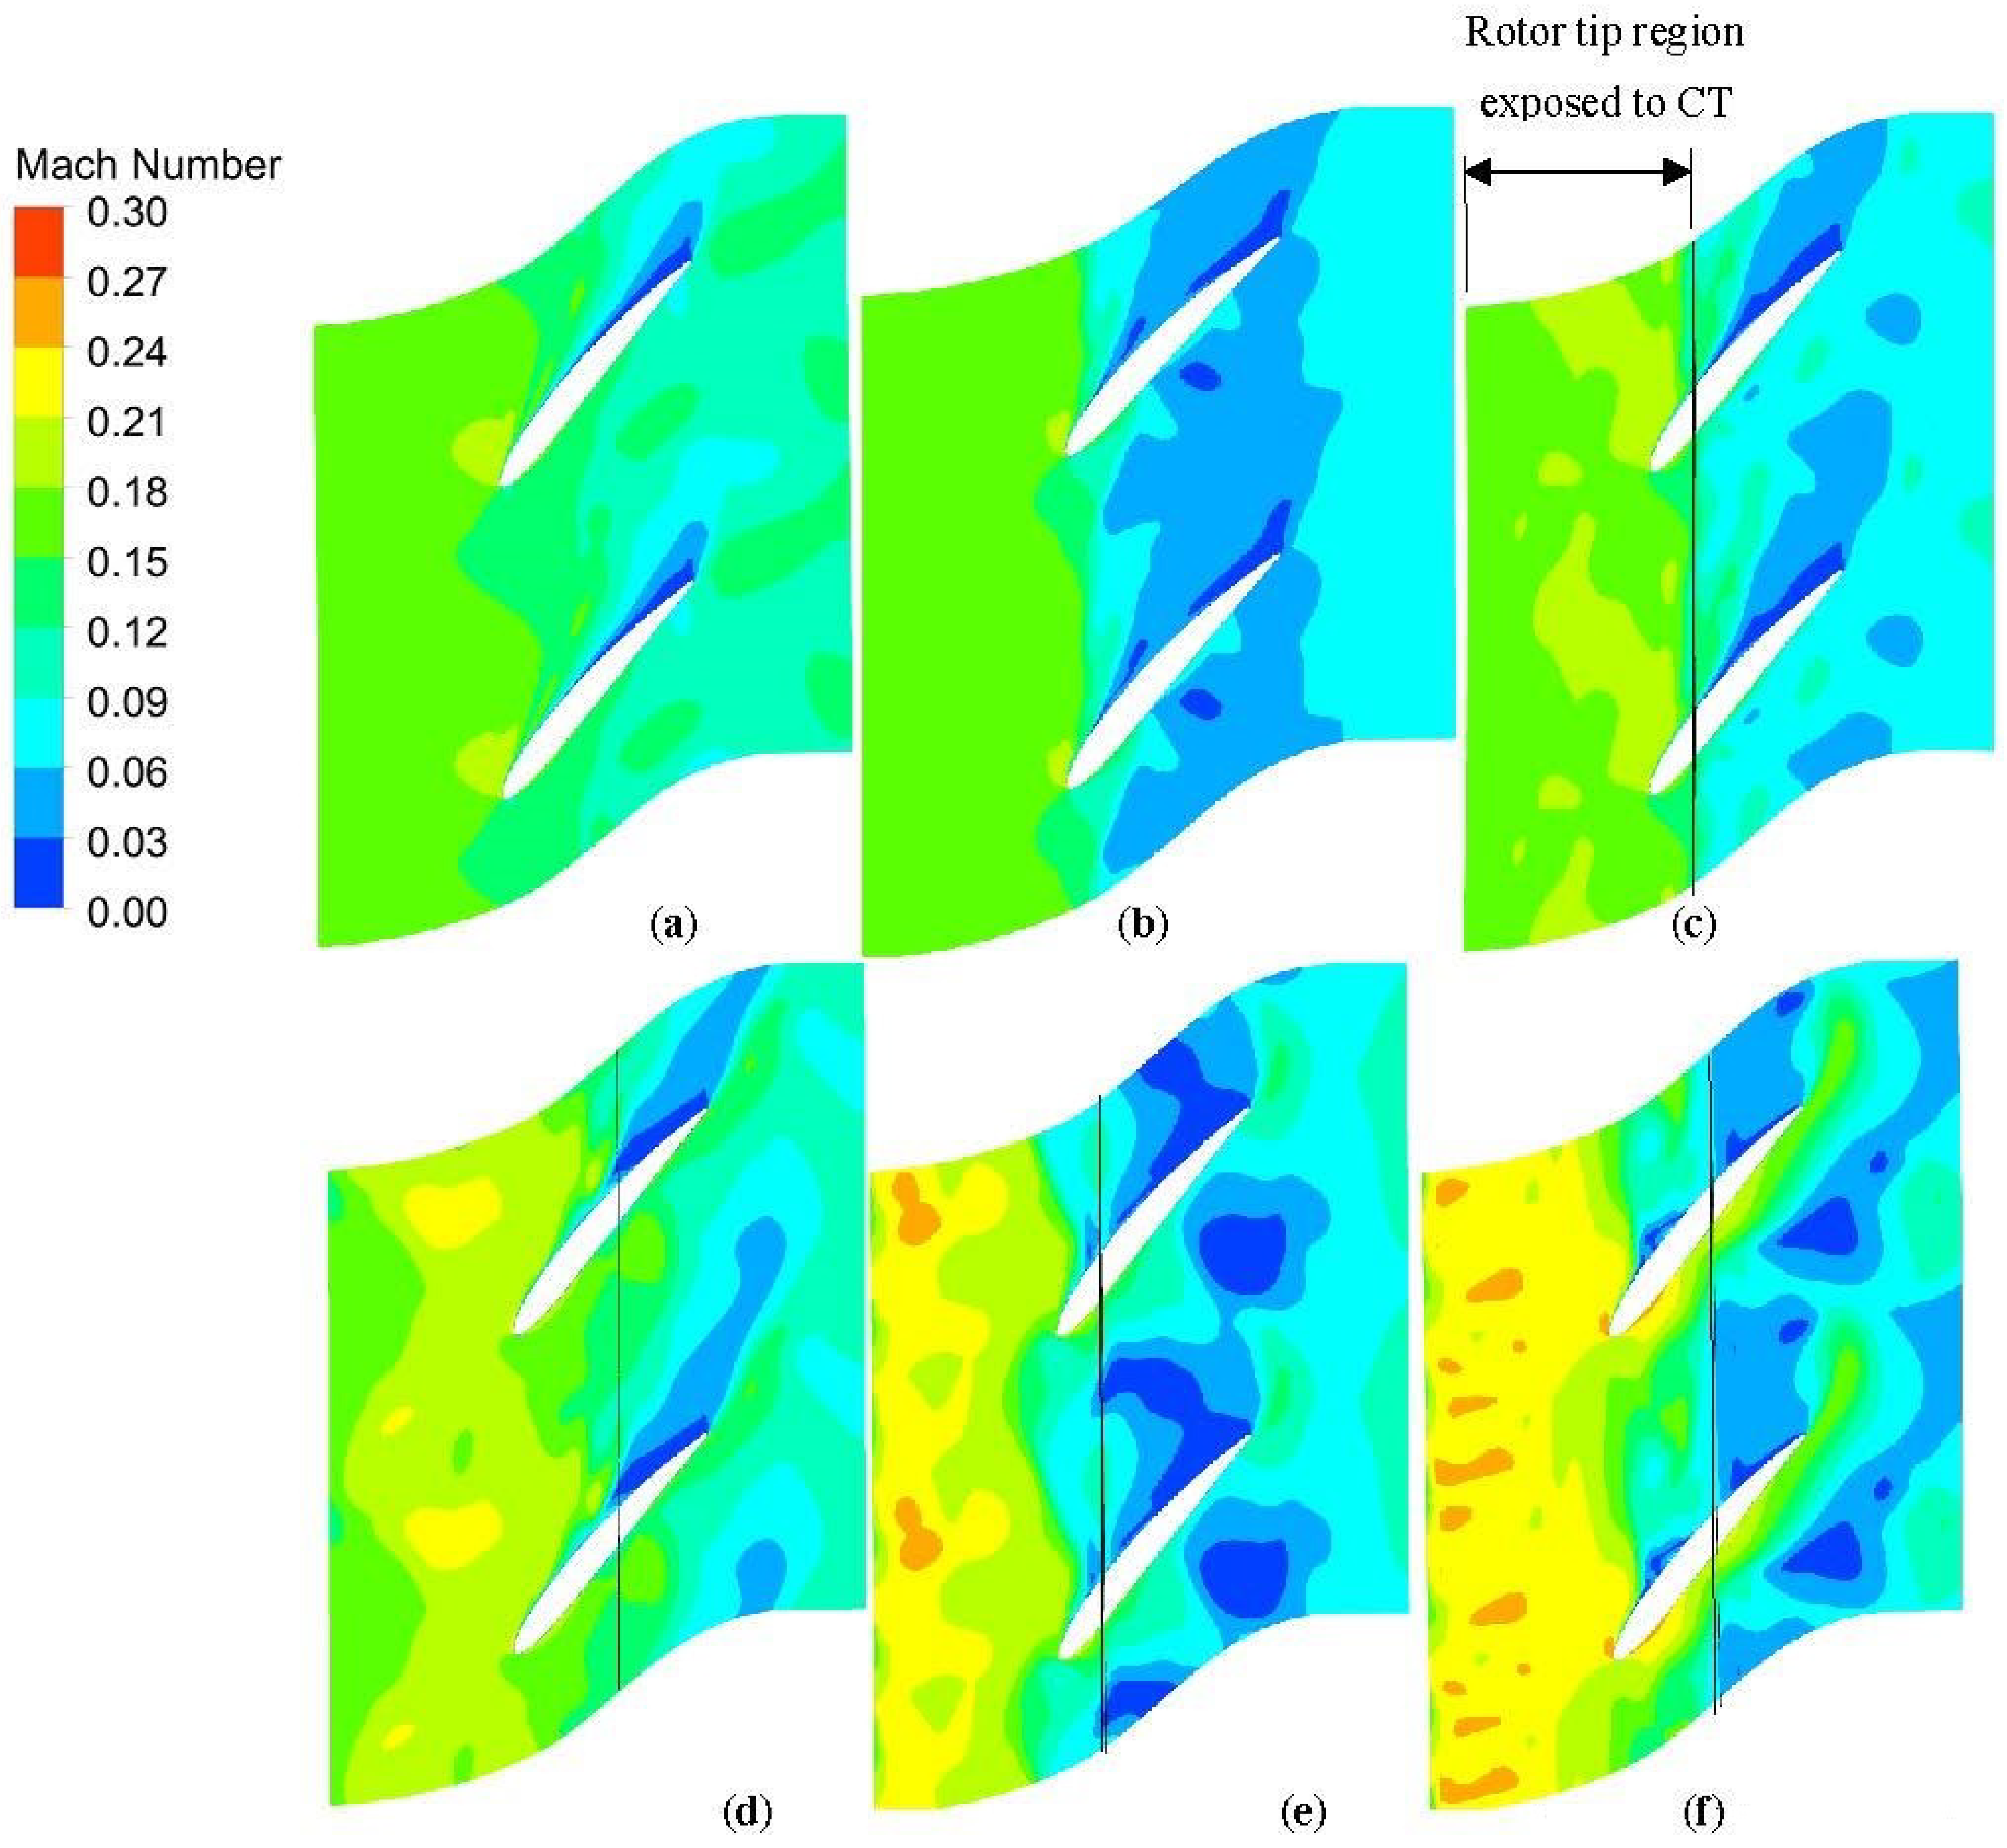
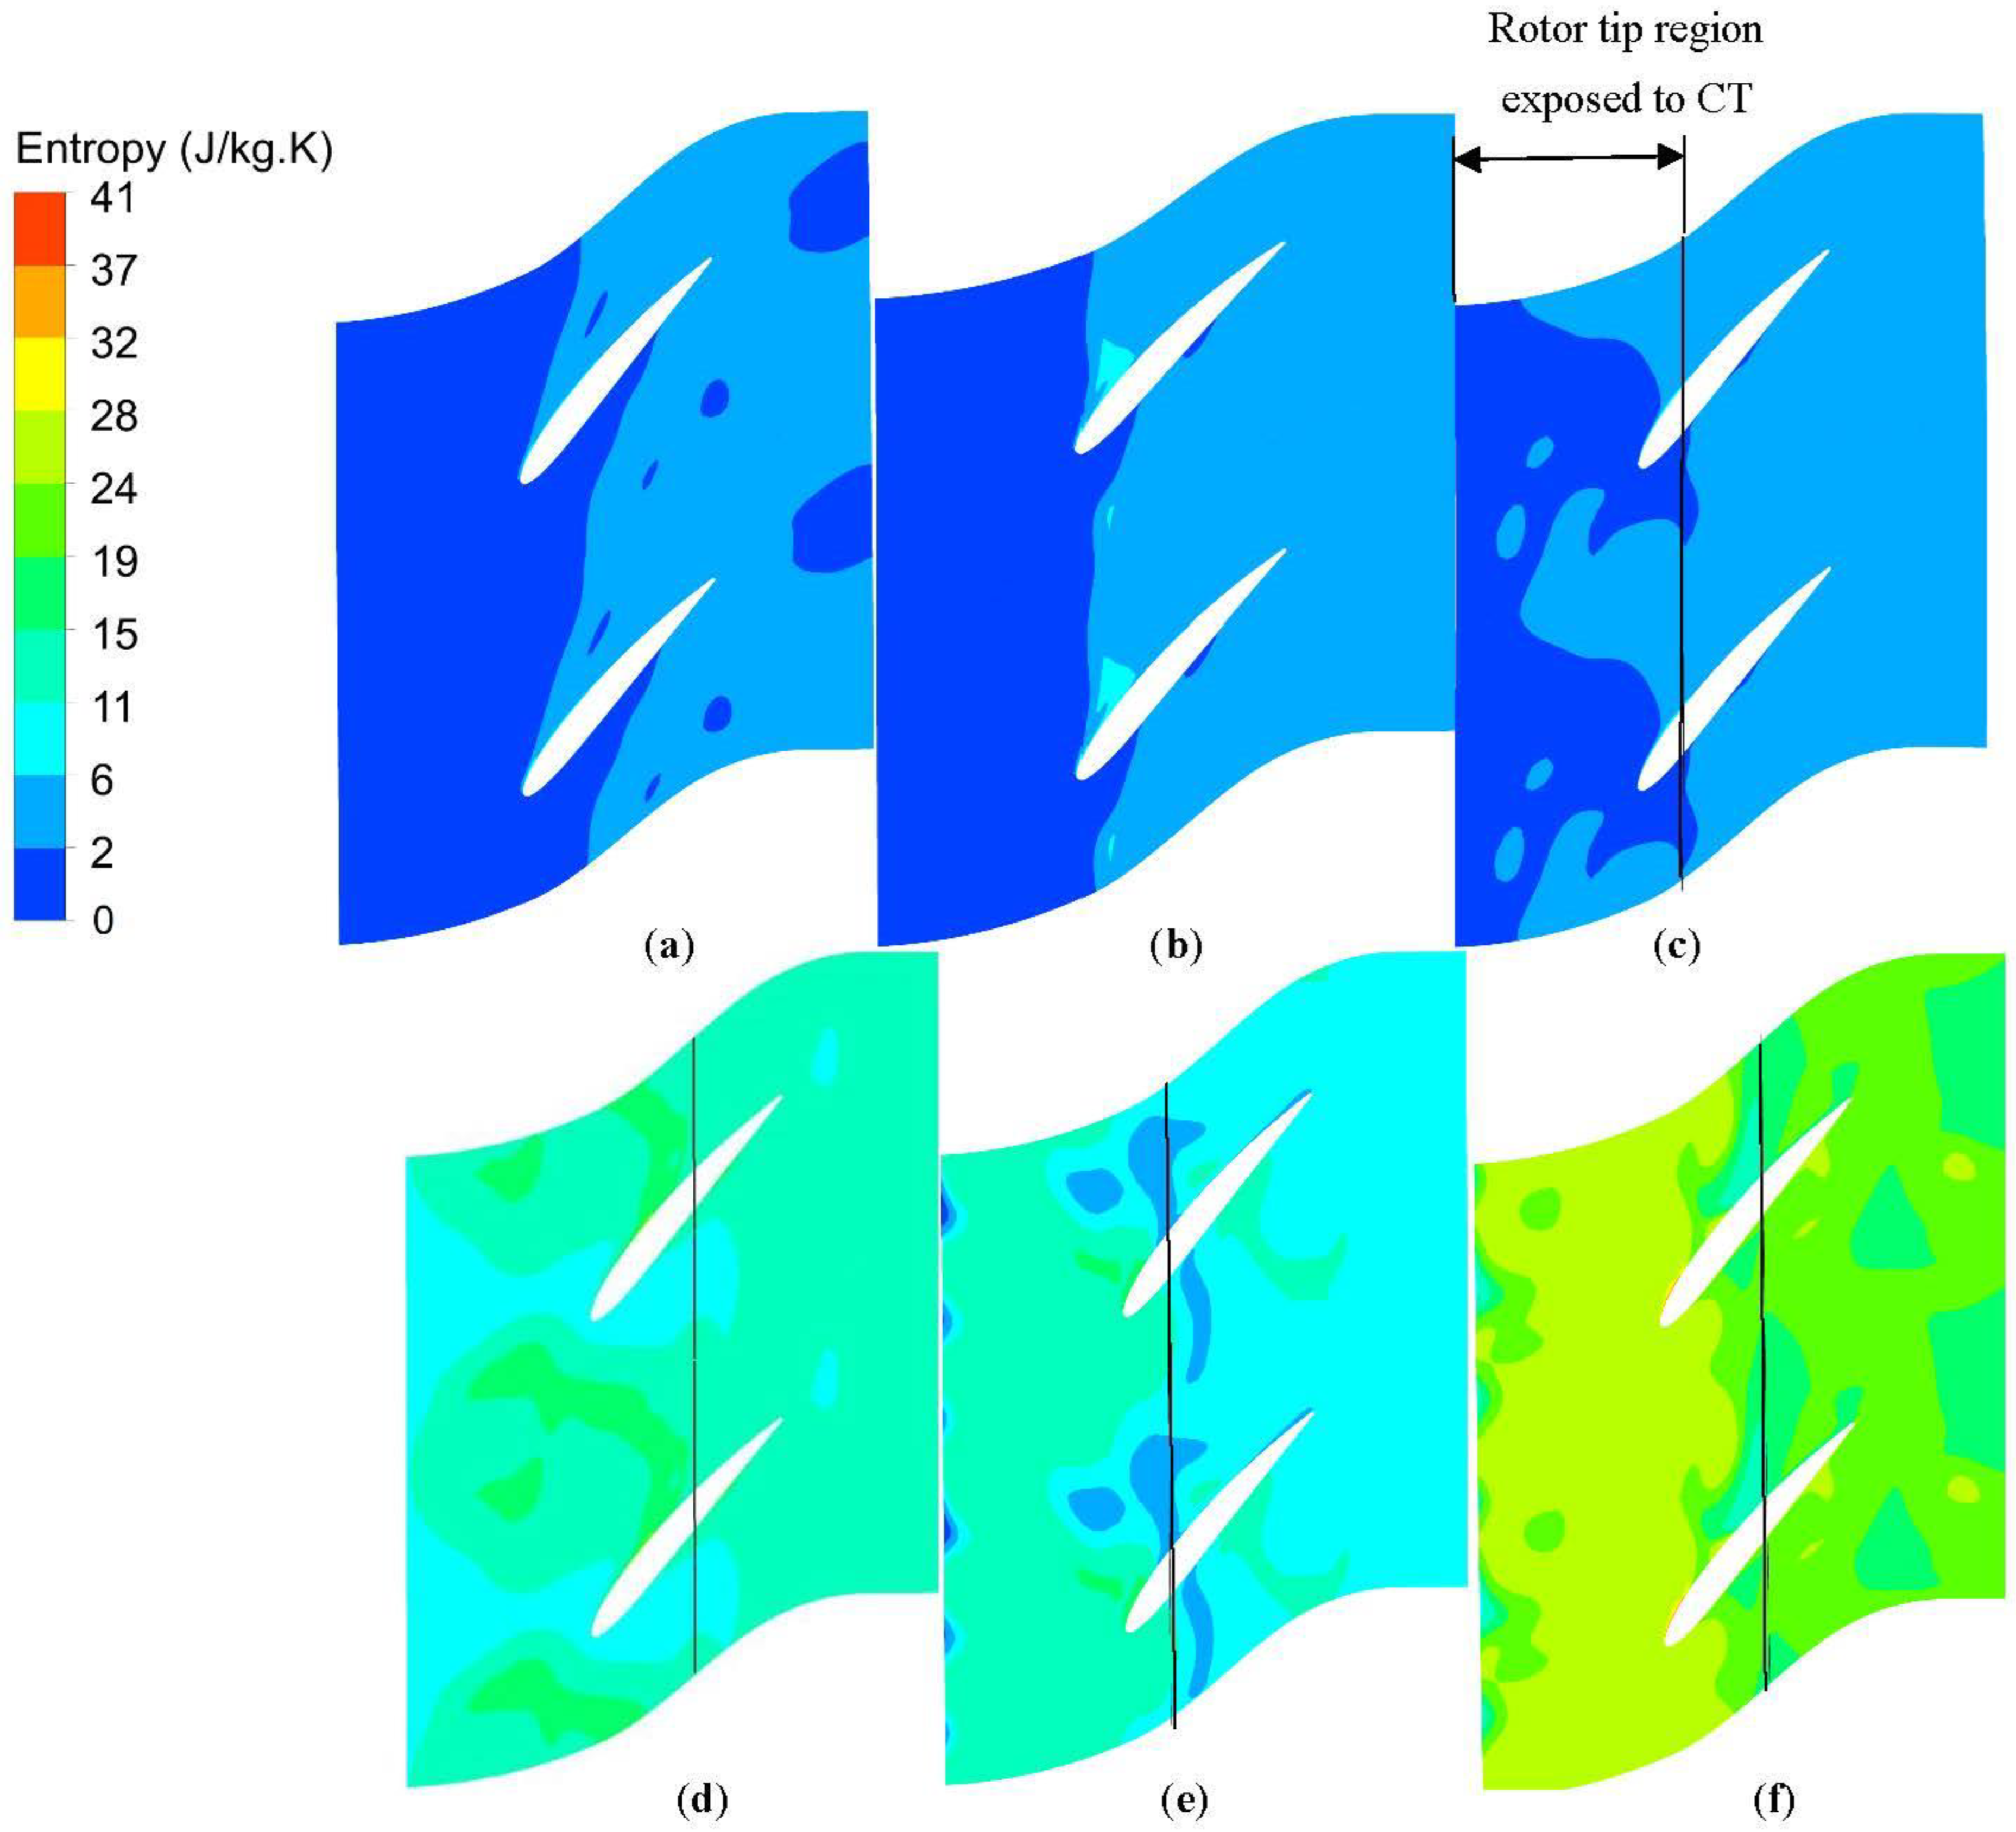
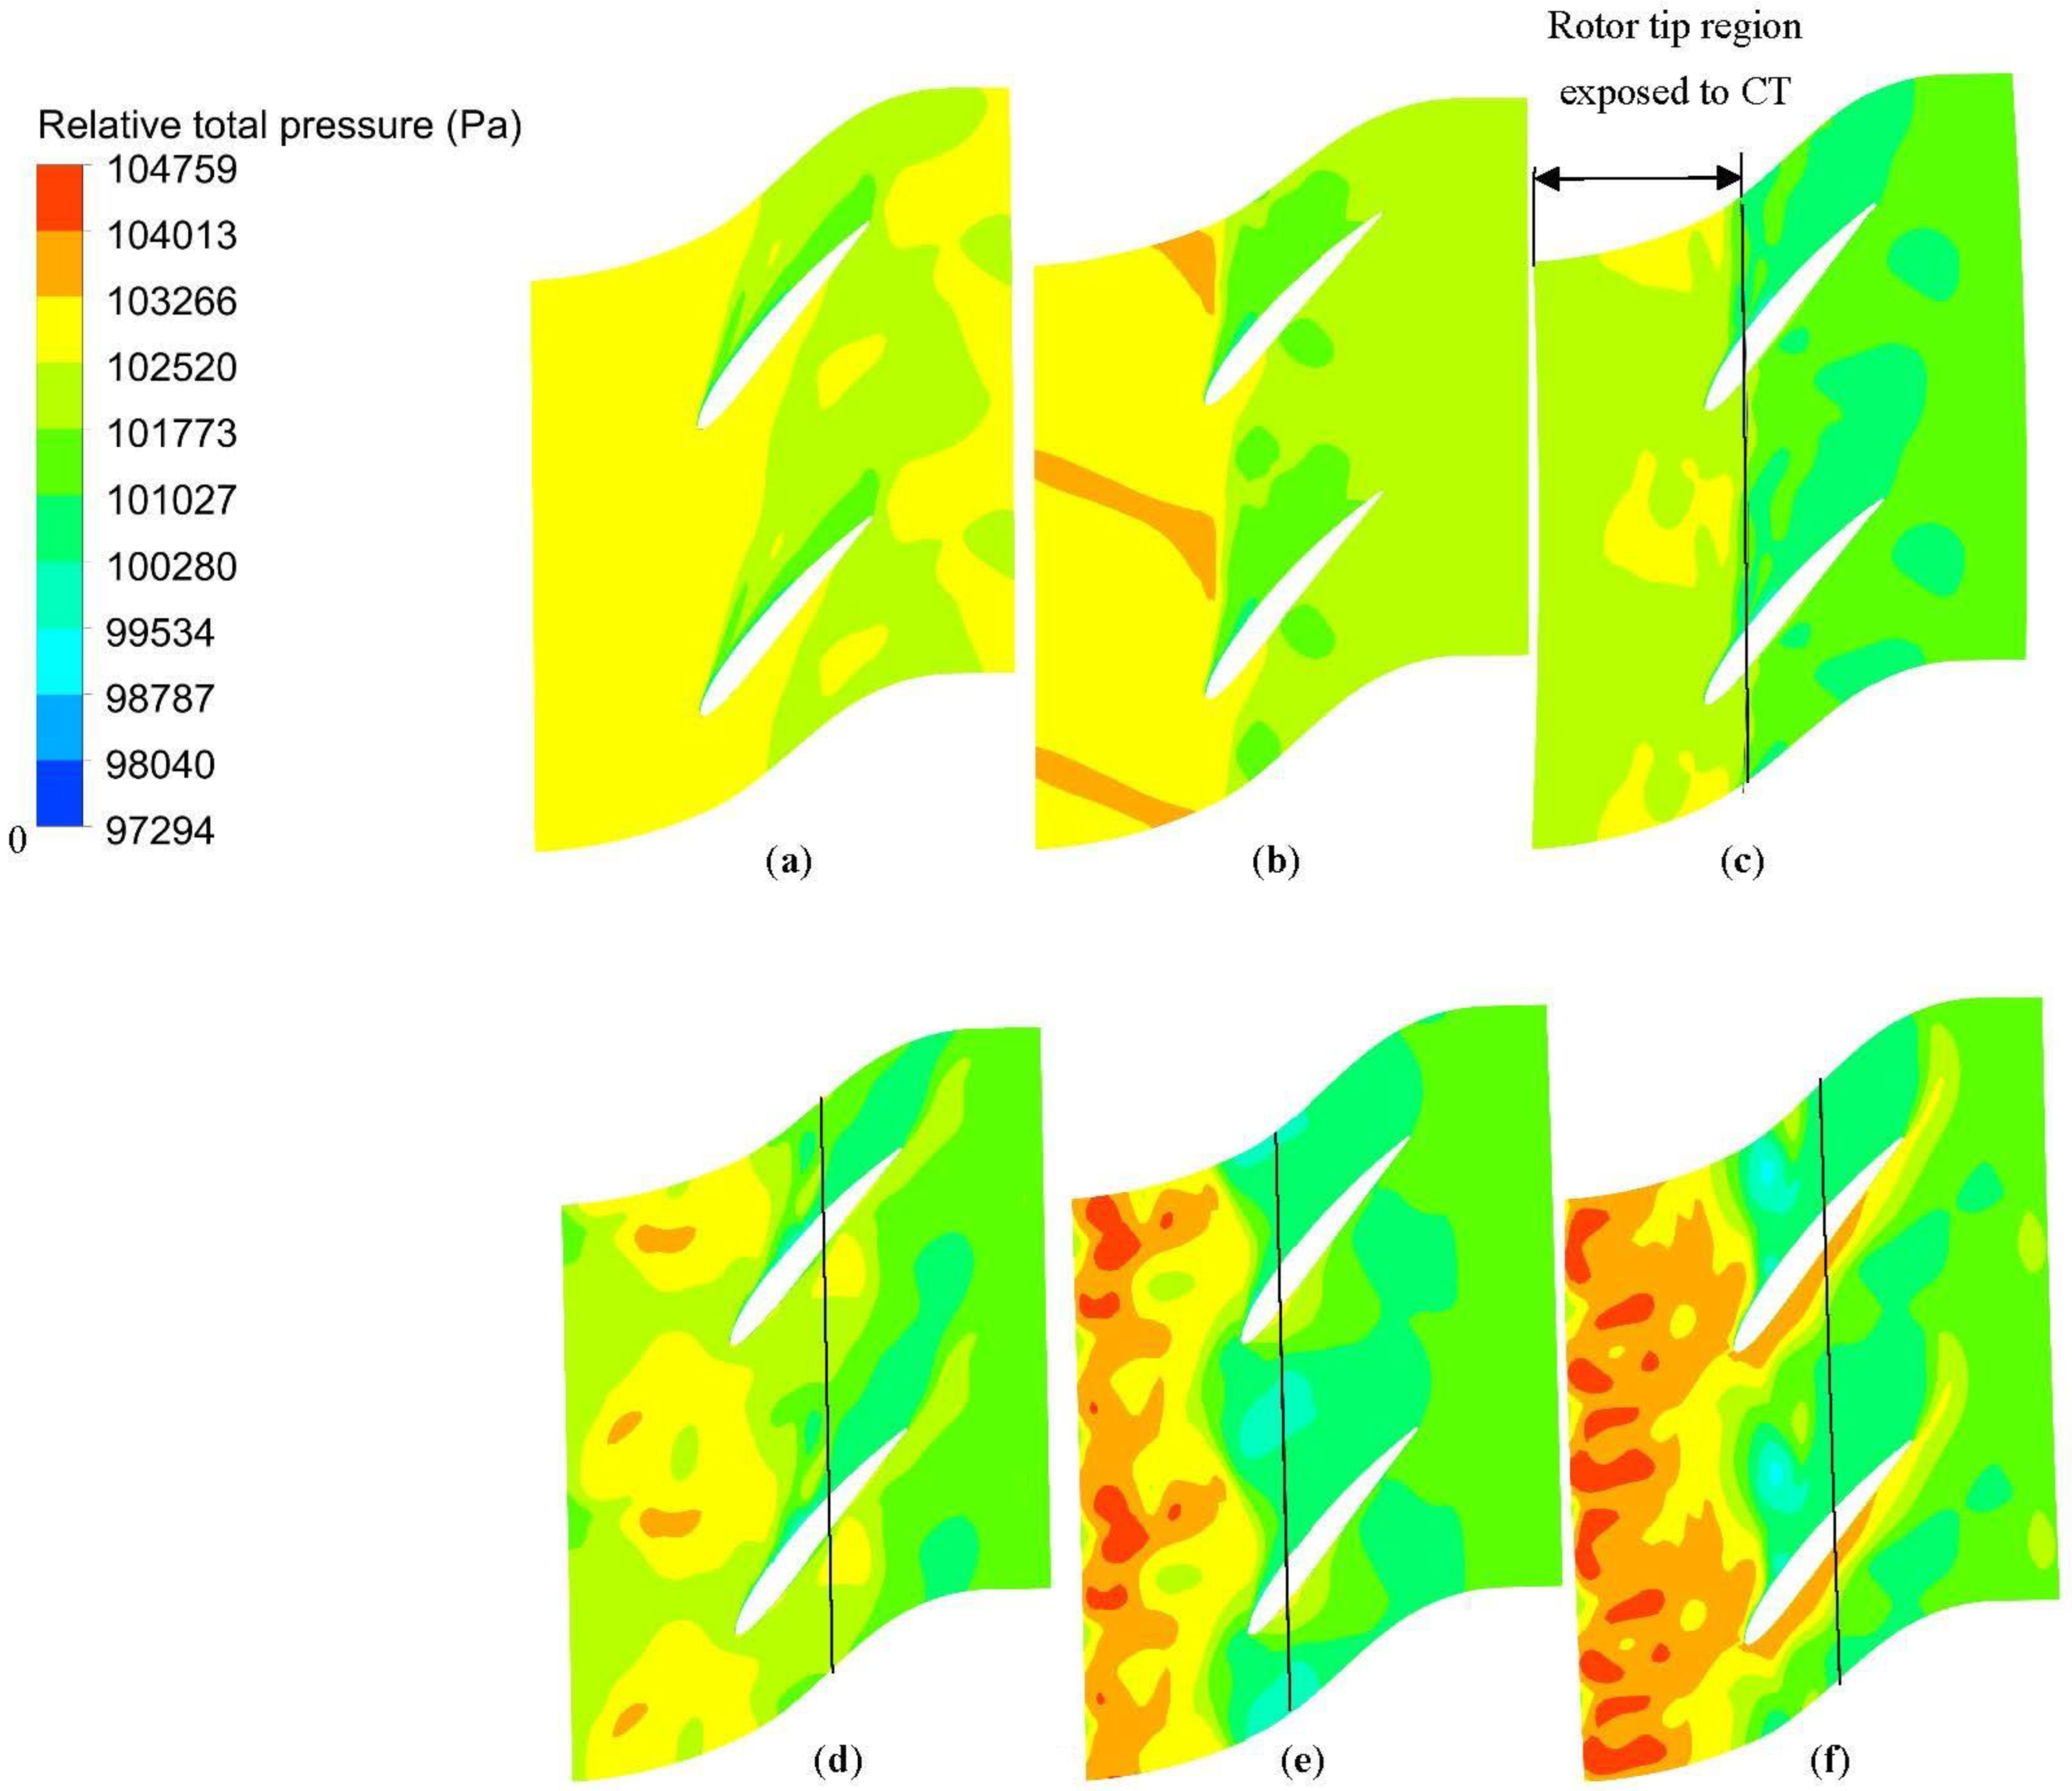
5.2.1. Mach Number, Entropy and Pressure Distributions

Figure 10, Figure 11 and Figure 12 show the flow fields for SC and CT configurations under the impact of the vaned recessed casing treatment configurations A and B at 99% span. The selected mass flow rates for the comparison are 2.28, 1.95 and 1.6 kg/s, which correspond to the peak efficiency (PE) point, near the stall (NS) points for SC and configurations A and B, respectively. It should be noted that Mach number was evaluated based on the relative velocity. The entropy generations are calculated as:
Δ s = C p ln T 2 T 1 R ln P 2 P 1
where T 1 and P 1 are reference temperature and reference pressure corresponding to the inlet boundary conditions and T 2 and P 2 are local temperature and local pressure, respectively.
The onset of stall is associated with flow blockage due to adverse pressure gradient, end wall and blade boundary layer, flow separations and tip leakage/mainstream interactions. As for the current compressor before the introduction of the casing treatment at PE operating point, the rotor passage is occupied with high momentum fluid (Figure 10, SC-2.28). As the mass flow is reduced to SC-1.95, the low-speed fluid is accumulated in the rotor passage due to the effects of boundary layers and flow diffusion. Under the influence of the casing treatment configurations A and B, the low-speed fluid is bled into the casing treatment and the regions containing the low-speed fluid regions shrink (Figure 10, CTA-1.95 and CTB-1.95). The degree to which the low-speed fluid regions are affected by the casing treatment is dependent on the rotor blade tip axial chord exposure under the influence of the casing treatment. Since the area under the impact of configuration A is smaller than configuration B, the casing treatment configuration B has a more profound effect on the tip flow field.
It has been proposed by Vo [21] that spike-type stall inception occurs when the line with high entropy gradient aligns with the leading edge. Following the onset of stall, flow spillage to adjacent rotor blade passages occurs. Based on Vo’s stall conditions, any method that can prevent the forward movement of the line with high entropy gradient or flow spillage to adjacent rotor blade passages can improve the stability of a compressor.
For the current compressor, at PE point, the line with the highest entropy gradient is located inside the rotor blade passage (Figure 11, SC-2.28). This line represents the interface between the incoming flow and the tip clearance flow. With reduction in the mass flow, this line moves further upstream and lines up with the leading edge plane at SC-1.95. After the casing treatment is applied, under the influence of the casing treatment’s suction and injection and flow mixing between rotor and casing treatment, the level of entropy increases.
The comparison of relative total pressure contours between SC, CTA and CTB configurations is shown in Figure 12. As can be seen, the relative total pressure values increase with reduction in mass flow mostly at the upstream locations. The comparison between total pressure values at SC-1.95 and CTA-1.95 indicates that slight loss occurs after introduction of the casing treatment. This is consistent with the entropy results that, after applying the casing treatment, the entropy levels increase. The most noticeable regions can be observed at the upstream locations with higher total pressure values at CTA-1.6 and CTB-1.6 operating points. The higher values are due to the injection of the flow from the casing treatment.

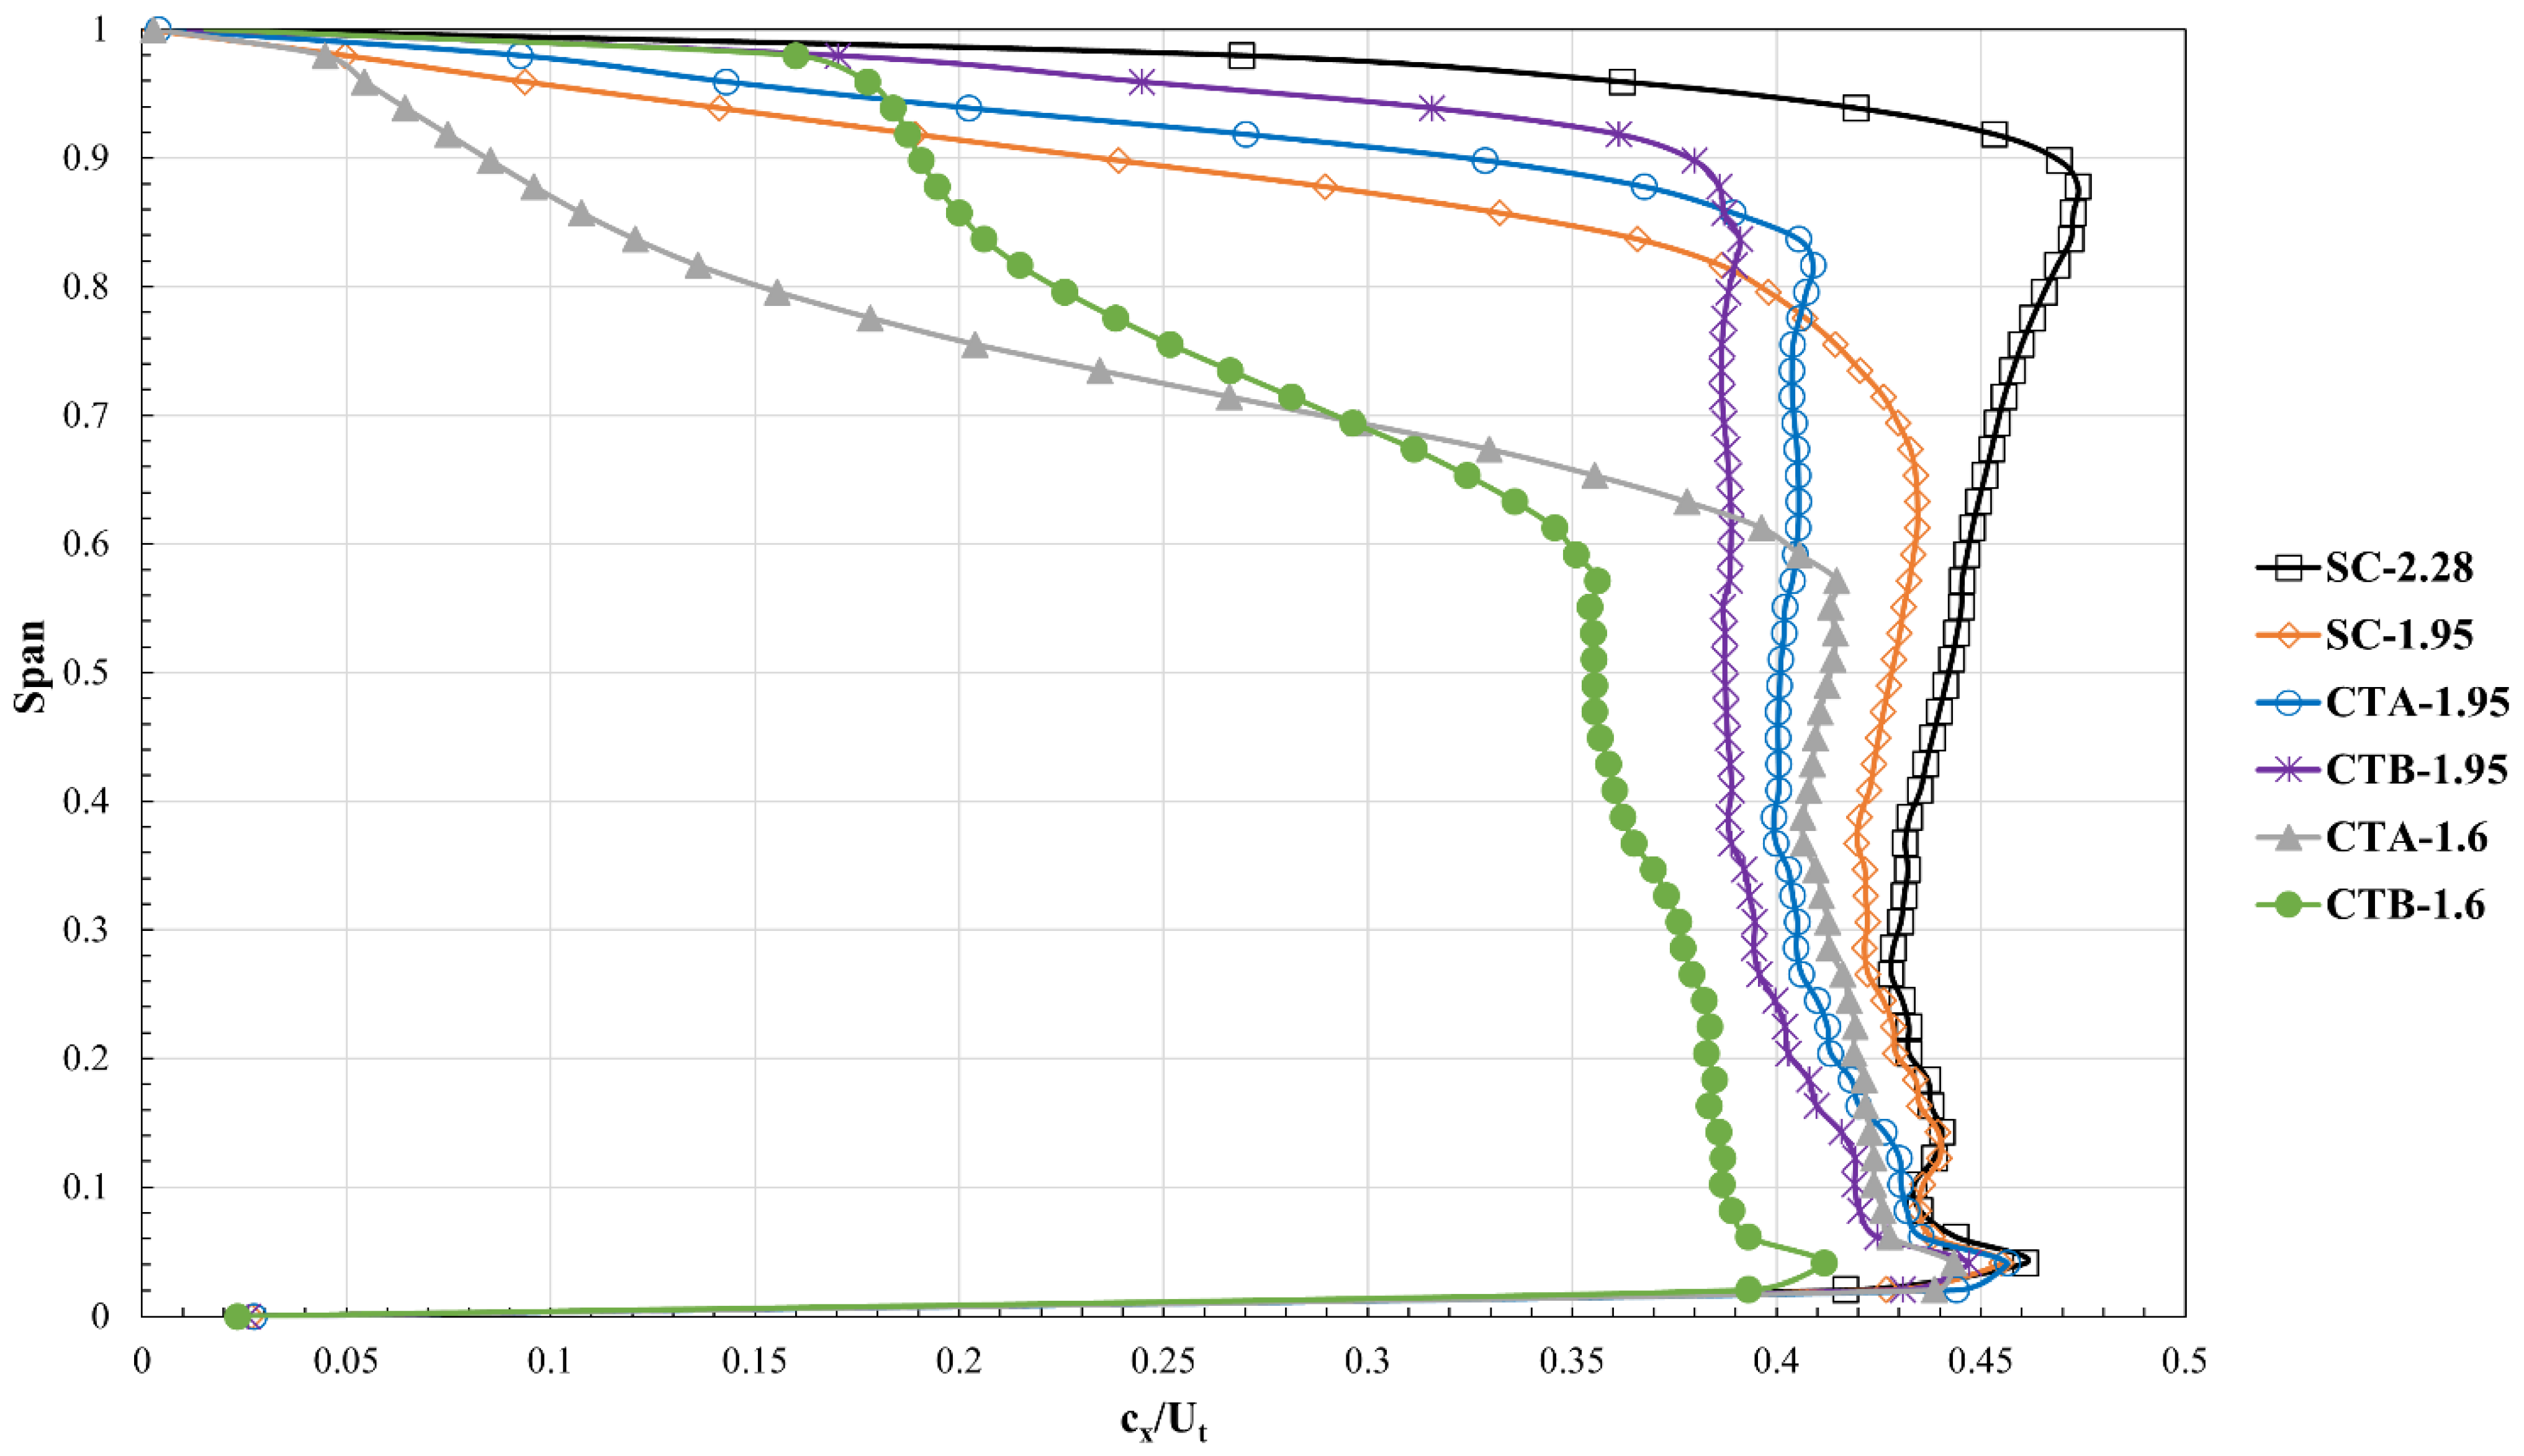
5.2.2. Axial Velocity Profiles

Figure 13 shows the spanwise distributions of the time-averaged and the circumferential-averaged axial velocity at the exit of the rotor for SC, CTA and CTB configurations. The axial velocity was normalized by the rotor tip tangential velocity. At SC-2.28, the flow passes through the rotor passage smoothly and the defect of the axial velocity is caused by the casing and hub boundary layers. As the mass flow rate decreases to SC-1.95, the defect of axial velocity is expanded in the radial direction above 70% span due to adverse pressure gradient. After the casing treatment is applied, flow exchange is established between the casing treatment and the rotor.
It can be observed that, under the effects of flow suction/injection, the defect of axial velocity is filled to some degrees near the blade tip at 1.95 kg/s for configurations A and B. Compared to SC-1.95, the axial velocity increases above 77% span for configuration A, while the axial velocity does not improve below 77% span. Similarly, the axial velocity is filled to some degrees for configuration B above 82% span, while it worsened below 82% span. Nevertheless, both configurations A and B tend to modify the axial velocity profiles and the distributions become more uniform.
As the mass flow reduces to 1.6 kg/s, the axial velocity profiles undergo notable changes especially above 60% span. Since the influence of configuration A is limited on the rotor tip compared to configuration B, the defect of the axial velocity is more intense above 70% span for configuration A. Furthermore, as configuration B has increased rotor blade tip axial chord exposure to the casing treatment, flow exchange between the rotor and the casing treatment enhances and the degree to which the flow is affected near the blade tip is increased. Consequently, the defect of axial velocity for configuration B at 1.6 kg/s improves to a larger extent compared to configuration A. The introduction of configurations A and B slightly modify the axial velocity distribution near the hub.

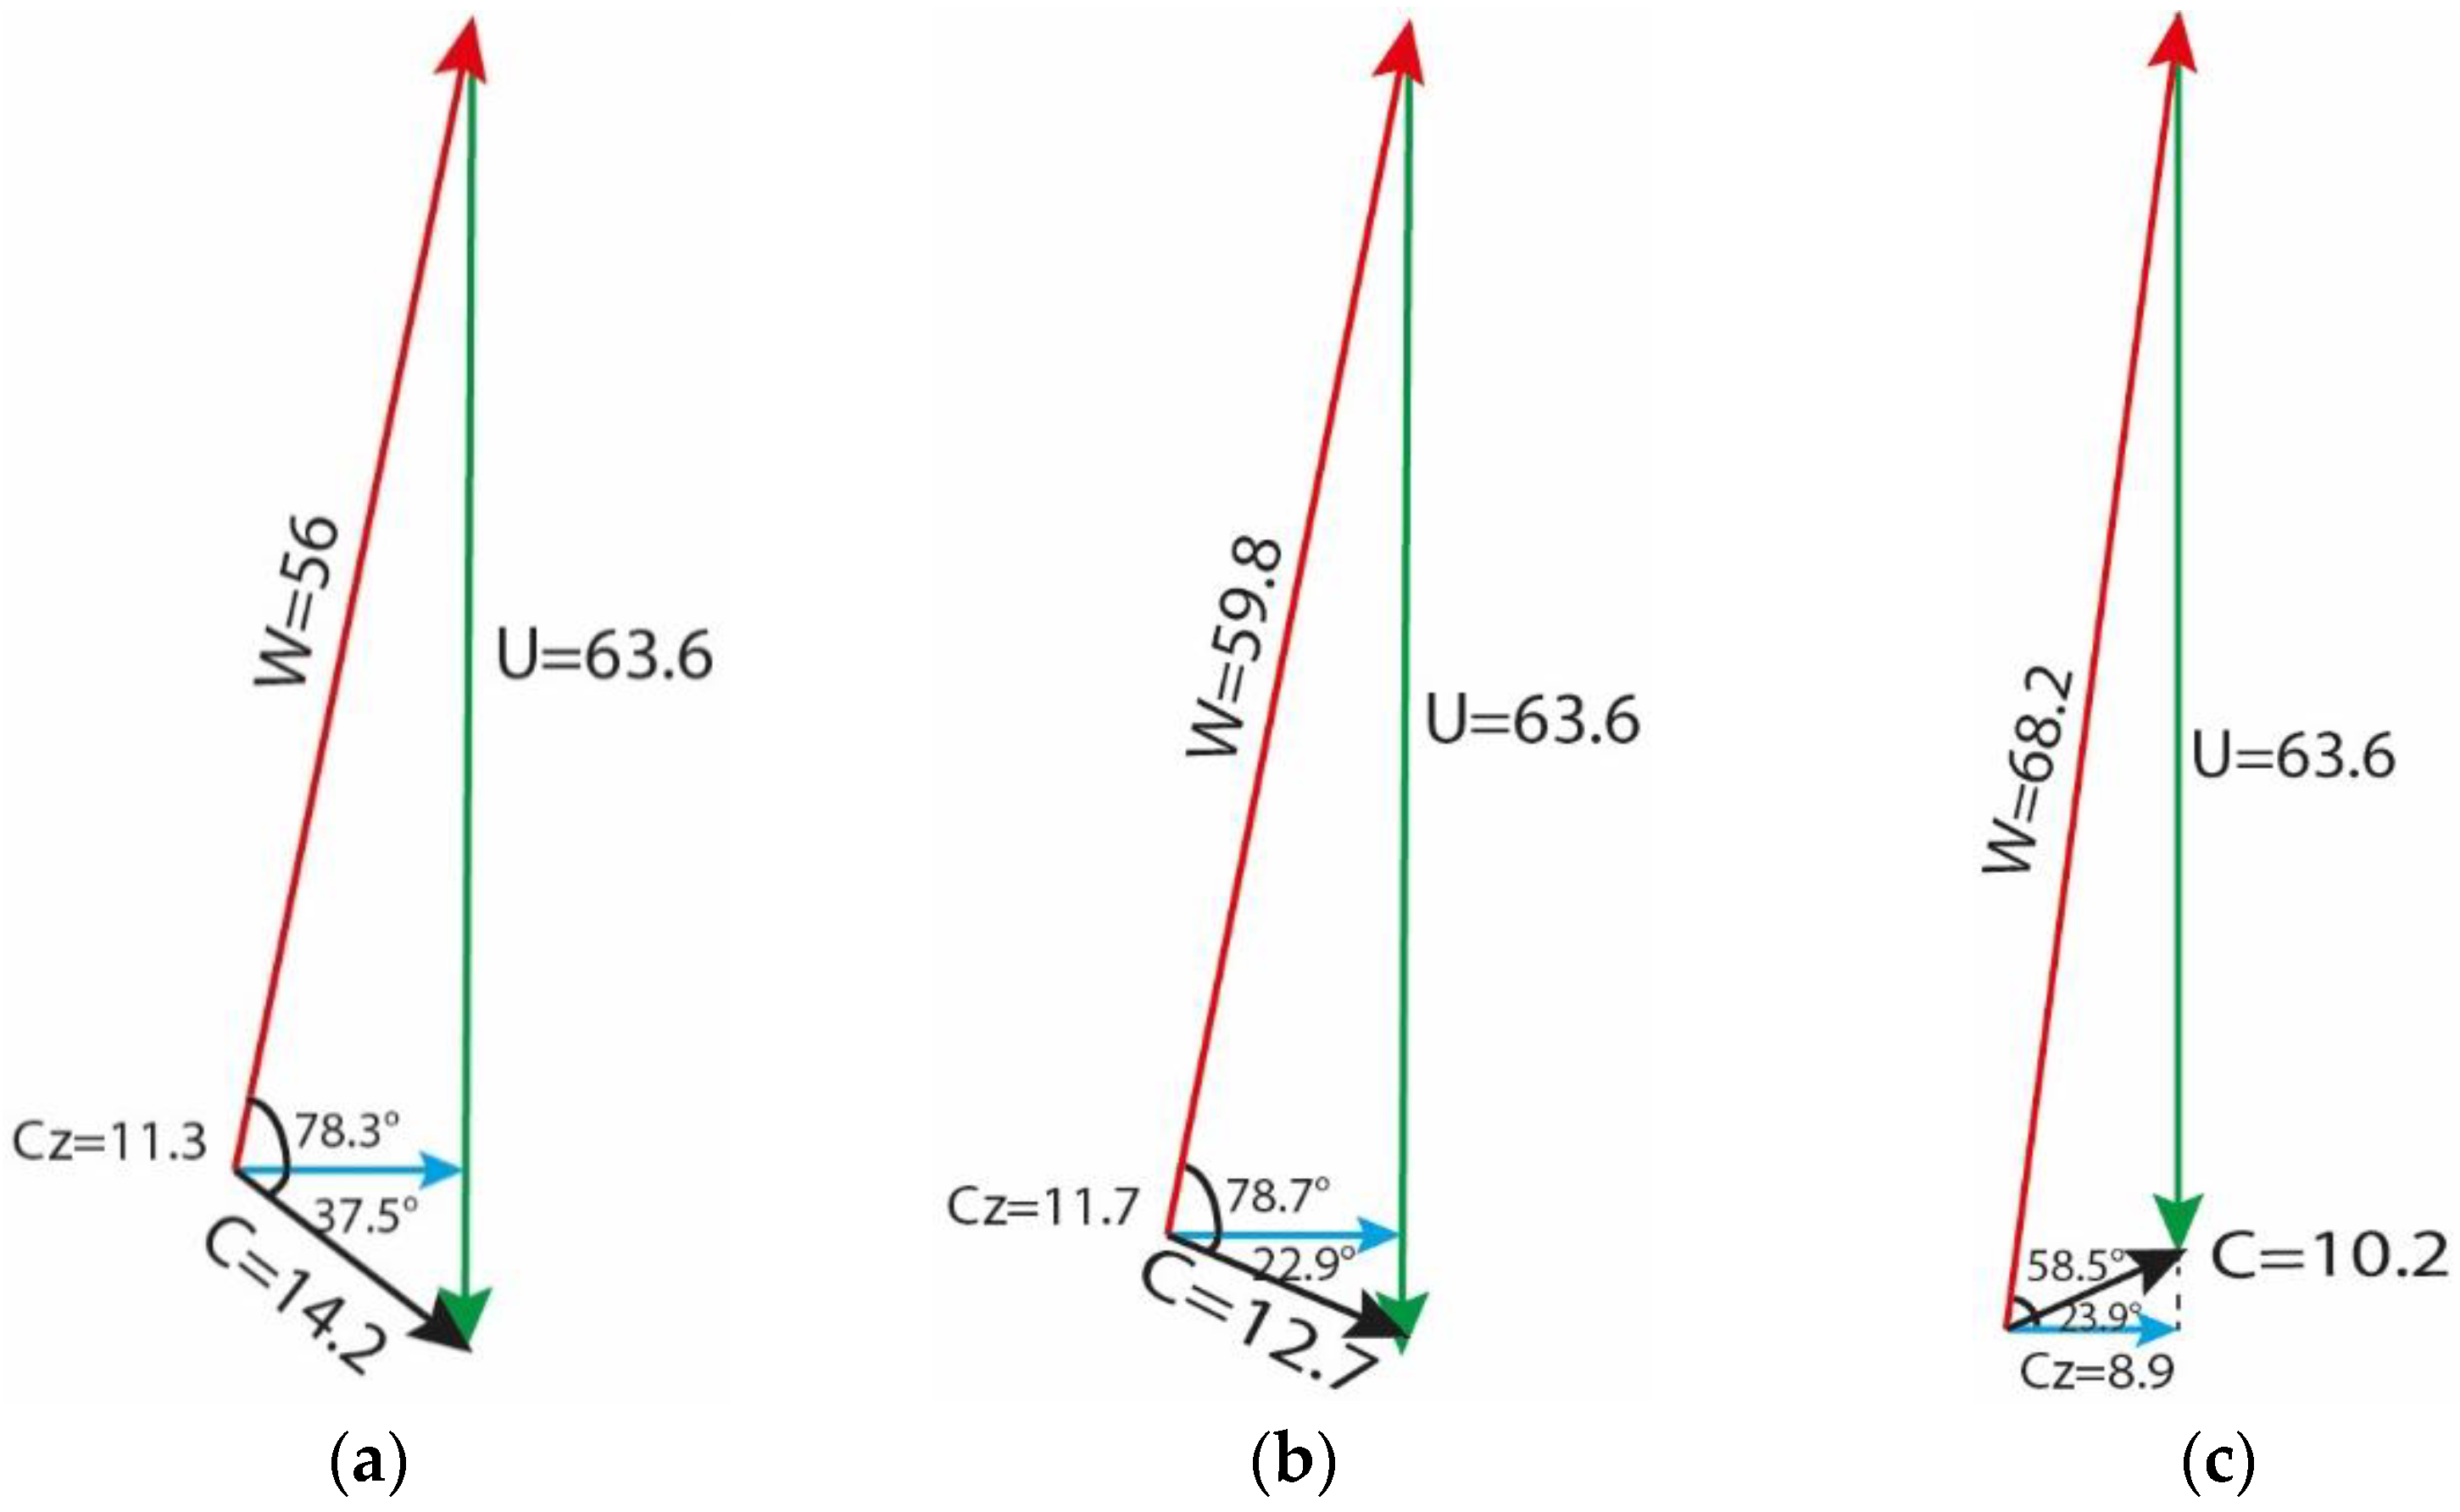
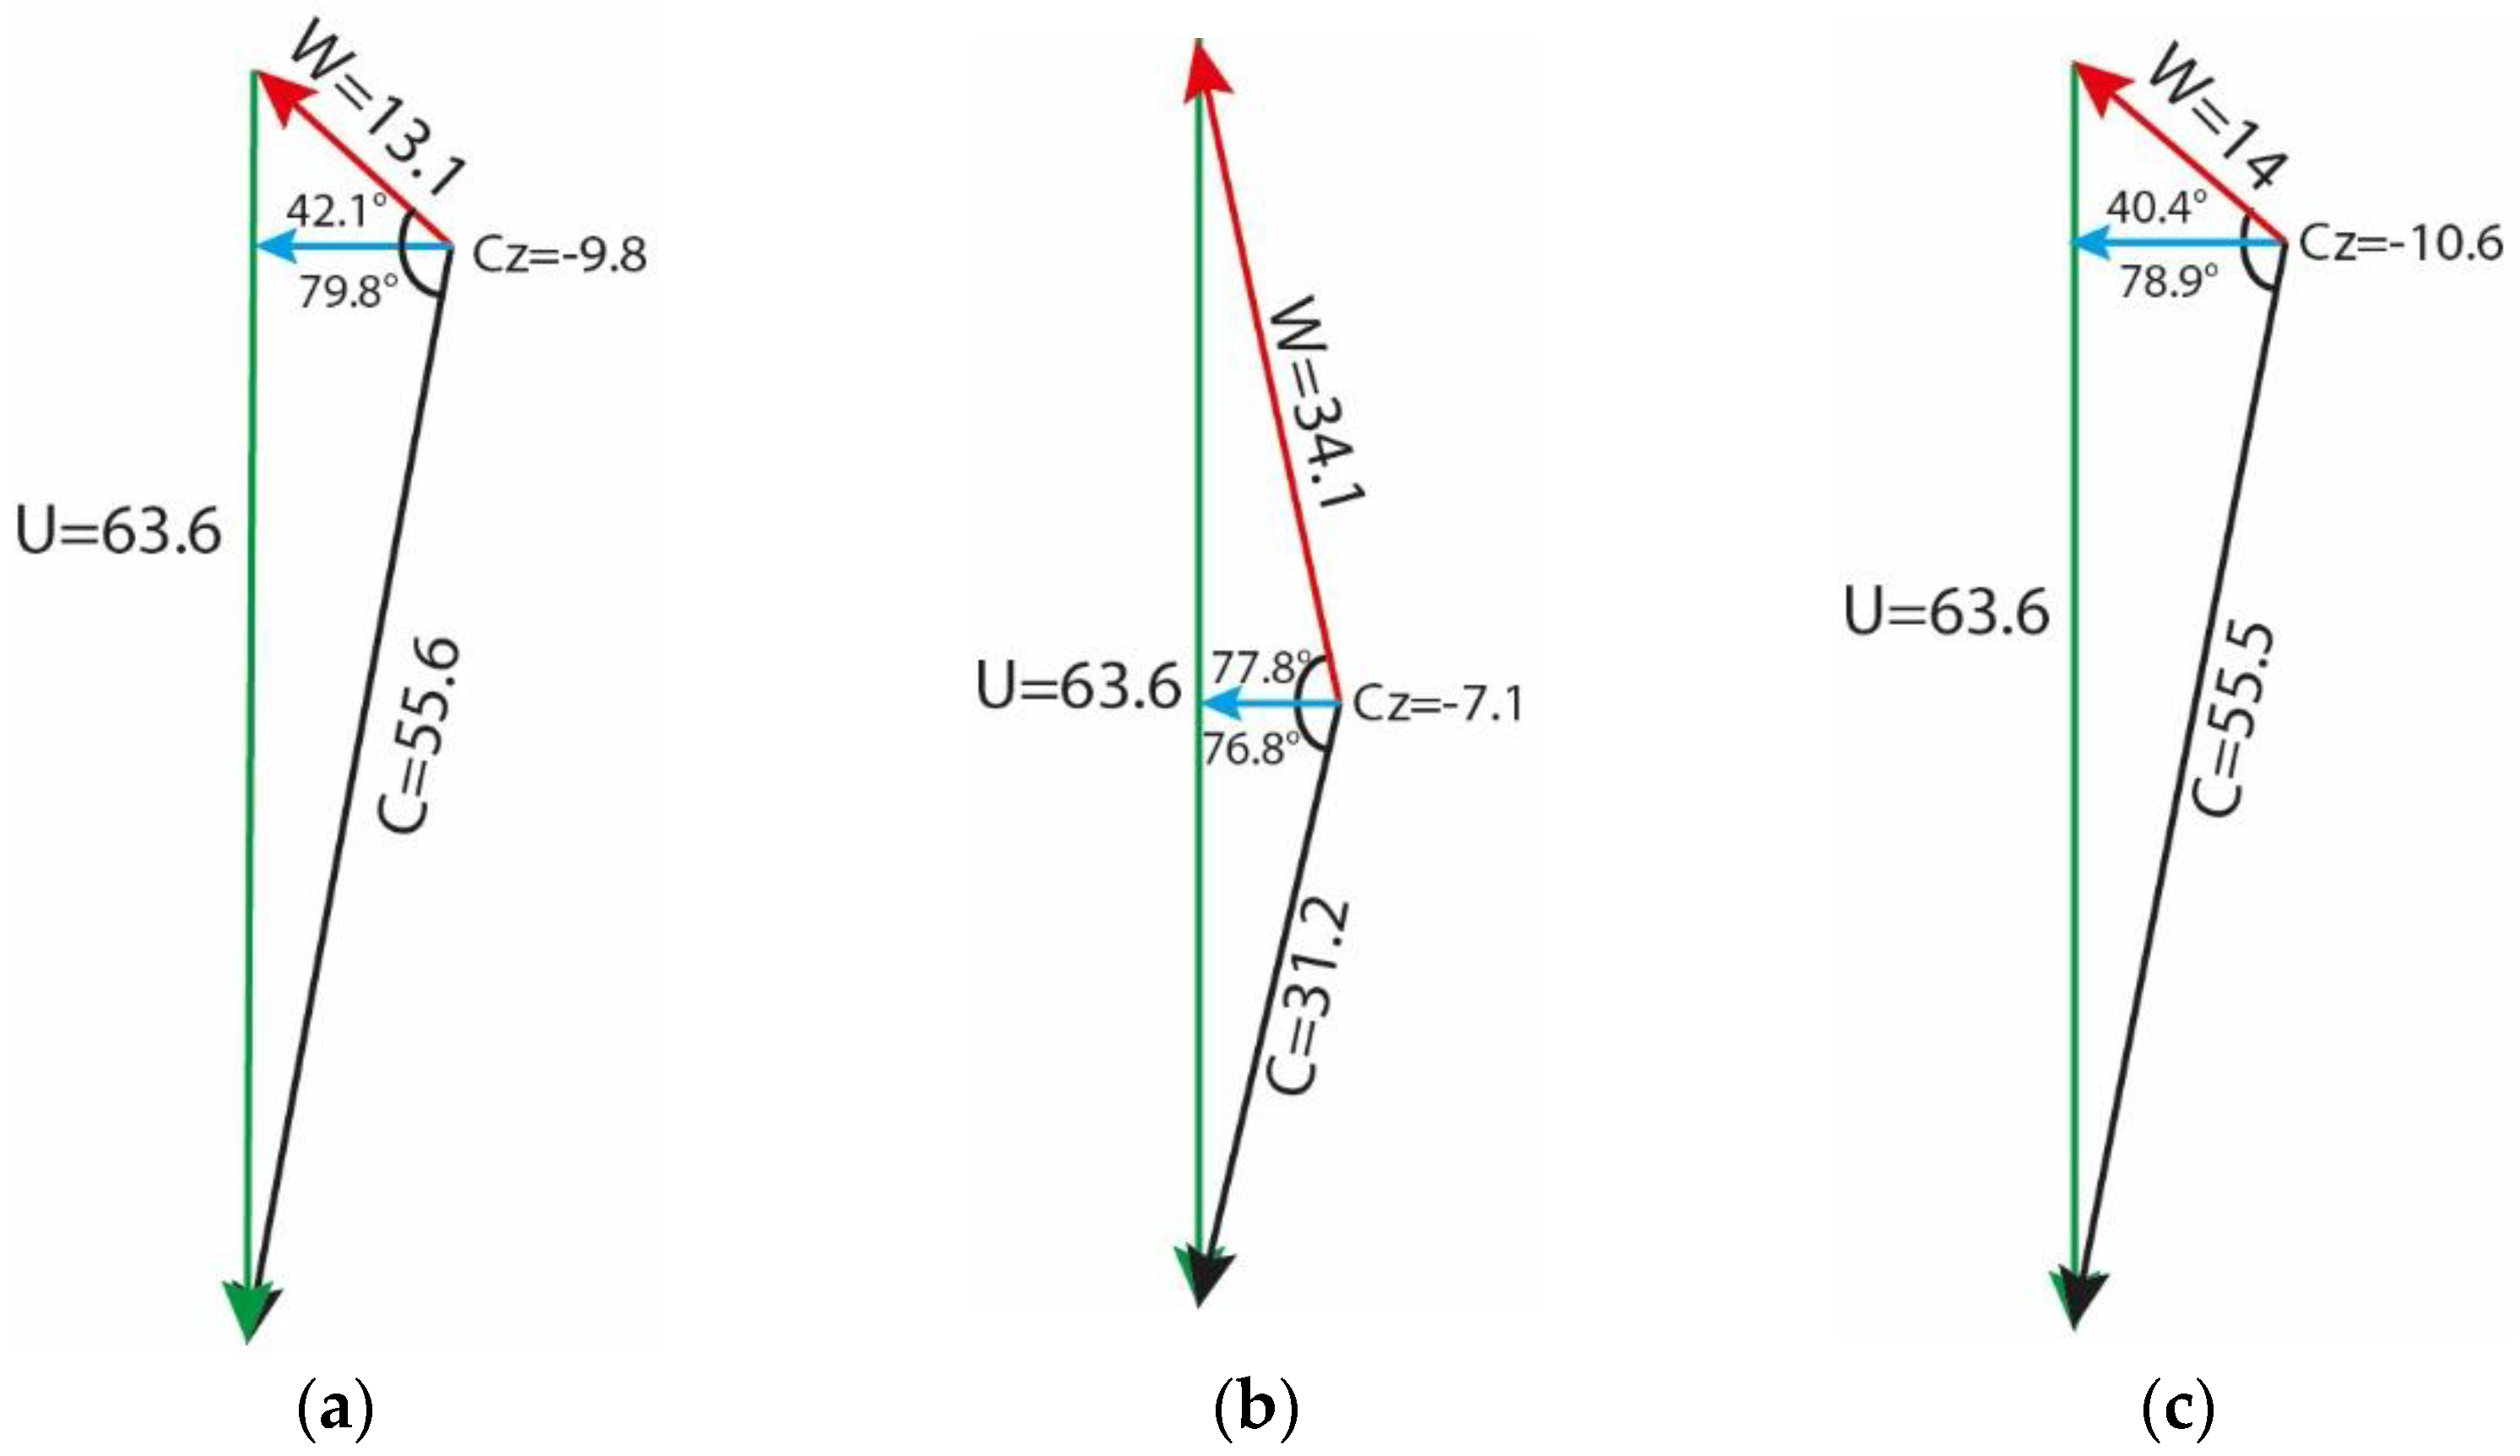
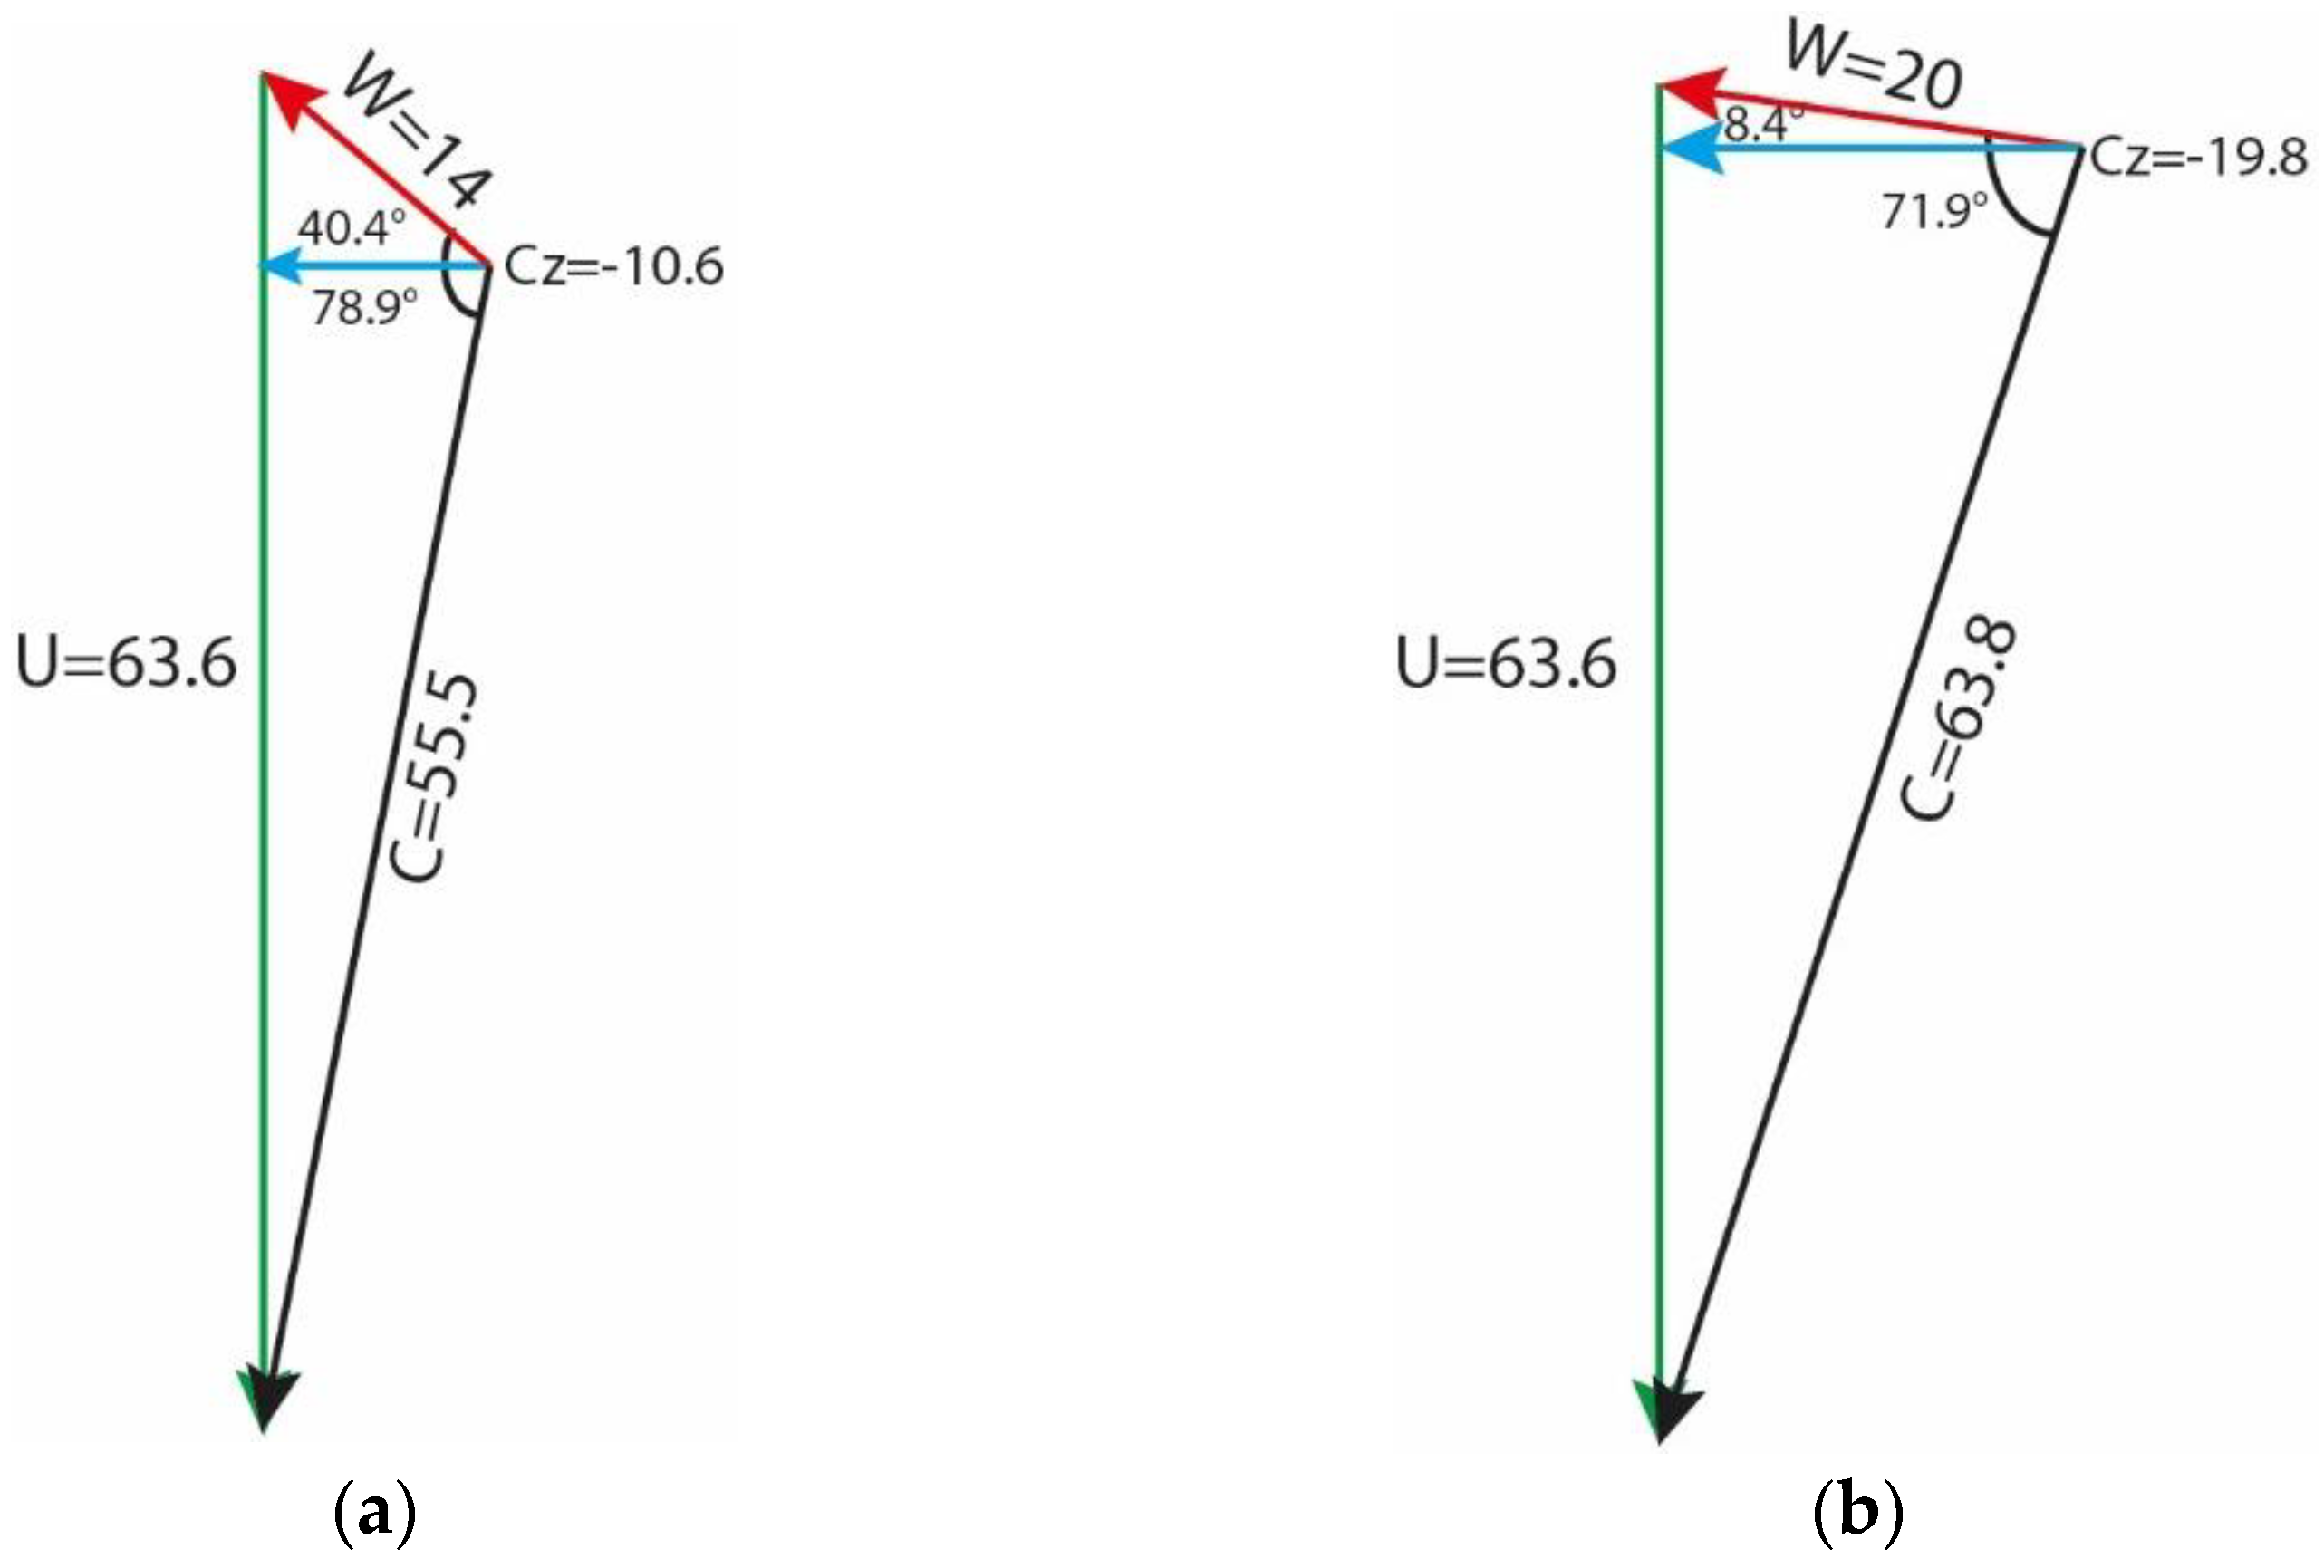
5.3. Velocity Components and Velocity Triangles

5.3.1. Influence of Configuration A

The extensive analysis of velocity components and triangles have been presented in this section to compare the influence and degree to which the casing treatment affects the end wall flow. In this regard, axial velocity and corresponding velocity triangles have been used to compare the effectiveness of the casing treatment in terms of reduction or elimination of reversed flows between configurations SC, CTA and CTB. Moreover, swirl velocity component has been used to compare the effectiveness of the casing treatment in reduction in stalled flow swirl velocity. To illustrate the influence of configuration A on the rotor tip flow field, Table 5 presents the time-averaged and the circumferential-averaged velocity components at 99% span. In the following, section numbers 1–5 correspond to the upstream of the leading edge, the leading-edge plane, the mid-space between the leading edge and the trailing edge pressure side, the mid-space between the leading edge and the trailing edge suction side and the trailing edge plane, respectively, as shown in Figure 14. The adopted sign convention is also shown in this figure. According to this convention, radial velocity component is considered positive when it is directed upward. Moreover, the swirl component of velocity is considered positive when it is in the direction of the rotor rotation. The onset of stall is associated with low axial-momentum fluid in rotor passages. It can be observed that, after the introduction of casing treatment configuration A, the axial velocity components increase with different degrees at CT-1.95 and even the reversed flows are eliminated at section 3. Figure 15 compares the velocity triangles at section 1, in which a slight increase in axial velocity and relative flow angle for CT-1.95 are evident. Moreover, configuration A slightly alters the radial velocity components, and the swirl components of the relative velocity are increased for the five sections. It should be noted that the absolute value of the swirl velocity is considered for the comparison. In particular, it can be observed that the increase in the swirl component of the relative velocity is more noticeable in sections 3 and 4. Figure 16 compares the velocity triangles in section 4. It can be found that configuration A has two effects on SC-1.95. First, it reduces the relative flow angle noticeably with respect to the axial direction (the positive axial direction is directed to the right). Second, the relative velocity increases 2.6 times. Consequently, the relative swirl component of the relative velocity component increases due to these two factors. It is noteworthy to mention that, since the direction of the relative swirl component of the relative velocity is opposite to the rotor rotation, it becomes negative.
With further reduction in the mass flow to CT-1.6, the radial velocity at the leading edge (section 2) increases 12.75 times compared to CT-1.95. This corresponds to the fluid, which is located at the blade pressure side and induces a high inward velocity to casing treatment. Furthermore, the comparison between CT-1.95 and CT-1.6 indicates that the swirl component of the relative velocity decreases for all the sections except for 1. The decrease and increase in the swirl component of the velocity can also be clarified by comparing the velocity triangles between CT-1.95 and CT-1.6 in Figure 15 and Figure 16, respectively.
Table 6 additionally demonstrates the velocity components for the inflow and the outflow of the casing treatment. These velocity components have been time- and area-averaged over the inflow and the outflow regions. It can be observed that the inflow to the casing treatment has positive axial velocity at CT-1.95. This is not beneficial since it does not promote flow recirculation inside the casing treatment. The reason for this is discussed in Section 5.4.1. Nevertheless, the casing treatment impacts the inflow by reducing all the three velocity components at CT-1.95. Furthermore, the comparison between CT-1.95 and CT-1.6 indicates that, unlike CT-1.95, the axial velocity of the outflow increases significantly. In addition, it can be found that configuration A reduces the radial and the swirl velocity components, while the reduction has been intensified. It is worth mentioning that the swirl velocity components reported for the five sections in Table 5 and Table 7 are the swirl components of the relative velocity, while the swirl velocity components in Table 6 and Table 8 are the swirl component of the absolute velocity; hence, they vary greatly.

5.3.2. Influence of Configuration B

As the rotor blade tip axial chord exposure increases in configuration B, more low-speed fluid is exposed to the casing treatment compared to configuration A. The velocity components for configuration B are summarized in Table 7 at the same five sections and the velocity components of the inflow and the outflow of the casing treatment are presented in Table 8. The comparison between the axial velocity components at SC-1.95 and CT-1.95 for configuration B indicate that, as the rotor blade tip axial chord exposure increases, the flow axial velocity components increase to a greater extent at the five sections relative to configuration A. In particular, this effect is noticeable at the mid-space between the leading edge and the trailing edge suction and pressure sides and the trailing edge itself. It can be observed that even the reverse flow that occurred for configuration A at section 4 has been eliminated. Moreover, the comparison of the swirl components of the relative velocity shows that the swirl velocity components also increase to a greater extent compared to configuration A. In addition, the comparison of radial velocity components demonstrates that there is a significant increase in radial velocity at sections 3 and 4. This can be explained by the increase in the rotor blade tip axial chord exposure and the proximity to the rotor blade pressure side, which induces high inward flow to the casing treatment. As the mass flow reduces further to 1.6 kg/s, the increase in the flow velocity components is amplified for almost five sections for configuration B. However, configuration B induces a stronger reverse flow at the suction side. To understand the reason for this stronger reverse flow, the velocity triangles are compared in Figure 17. It can be seen that, as the rotor blade tip axial chord exposure increases, the relative flow angle with respect to the positive axial direction and the relative velocity increase simultaneously, which induces a stronger reverse flow in the axial direction.
Table 7. Comparison of velocity components at 1.95 and 1.6 kg/s for SC and configuration B.
ConfigurationSC-1.95CT-1.95CT-1.6
Velocity
Components (m/s)
V ¯ r W ¯ θ V ¯ z V ¯ r W ¯ θ V ¯ z V ¯ r W ¯ θ V ¯ z
Section1−0.24−54.112.7−1.9−65.116.4−5.7−74.714
2−1.4−49.46.6−0.1−63.614.33.5−71.88.3
30.6−14.1−2.29.4−46.311.620.9−405.7
40.1−8.2−9.211.8−39.710.221.1−1.7−17.8
50.7−13.70.30.1−26.29.80.1−18.49
Table 8. Comparison of inflow and outflow velocity components for configuration B.
ConfigurationCT-1.95CT-1.6
Velocity
Components (m/s)
V ¯ r C ¯ θ V ¯ z V ¯ r C ¯ θ V ¯ z
Inflow of the
casing treatment
3.65.77.58.412.82.2
Outflow of the casing treatment−2.2−2.68.8−9.2−11.16.1
The comparison between the velocity components in Table 6 and Table 8 also indicates that the casing treatment behaves differently at CT-1.95 under the effect of configurations A and B. As for configuration A, the casing treatment affects the inflow by reducing all the three velocity components. However, as the rotor blade tip axial chord exposure increases, even though the radial and the swirl velocity components decrease, the flow axial velocity increases. This can be explained by the increase in the rotor tip exposure to the casing treatment, which, under the effect of increased recirculation, the axial velocity raises.
As the mass flow decreases to 1.6 kg/s, the comparison of velocity components for configurations A and B in Table 6 and Table 8 indicates that they exhibit similar behavior in which the radial and swirl velocity components decrease, while the axial velocity component increases. The comparison between the swirl components of the absolute velocity for configurations A and B is summarized in Table 9. It can be found that both configurations A and B behave similarly in decreasing the swirl components of the absolute velocity, while the influence of configuration B is greater.

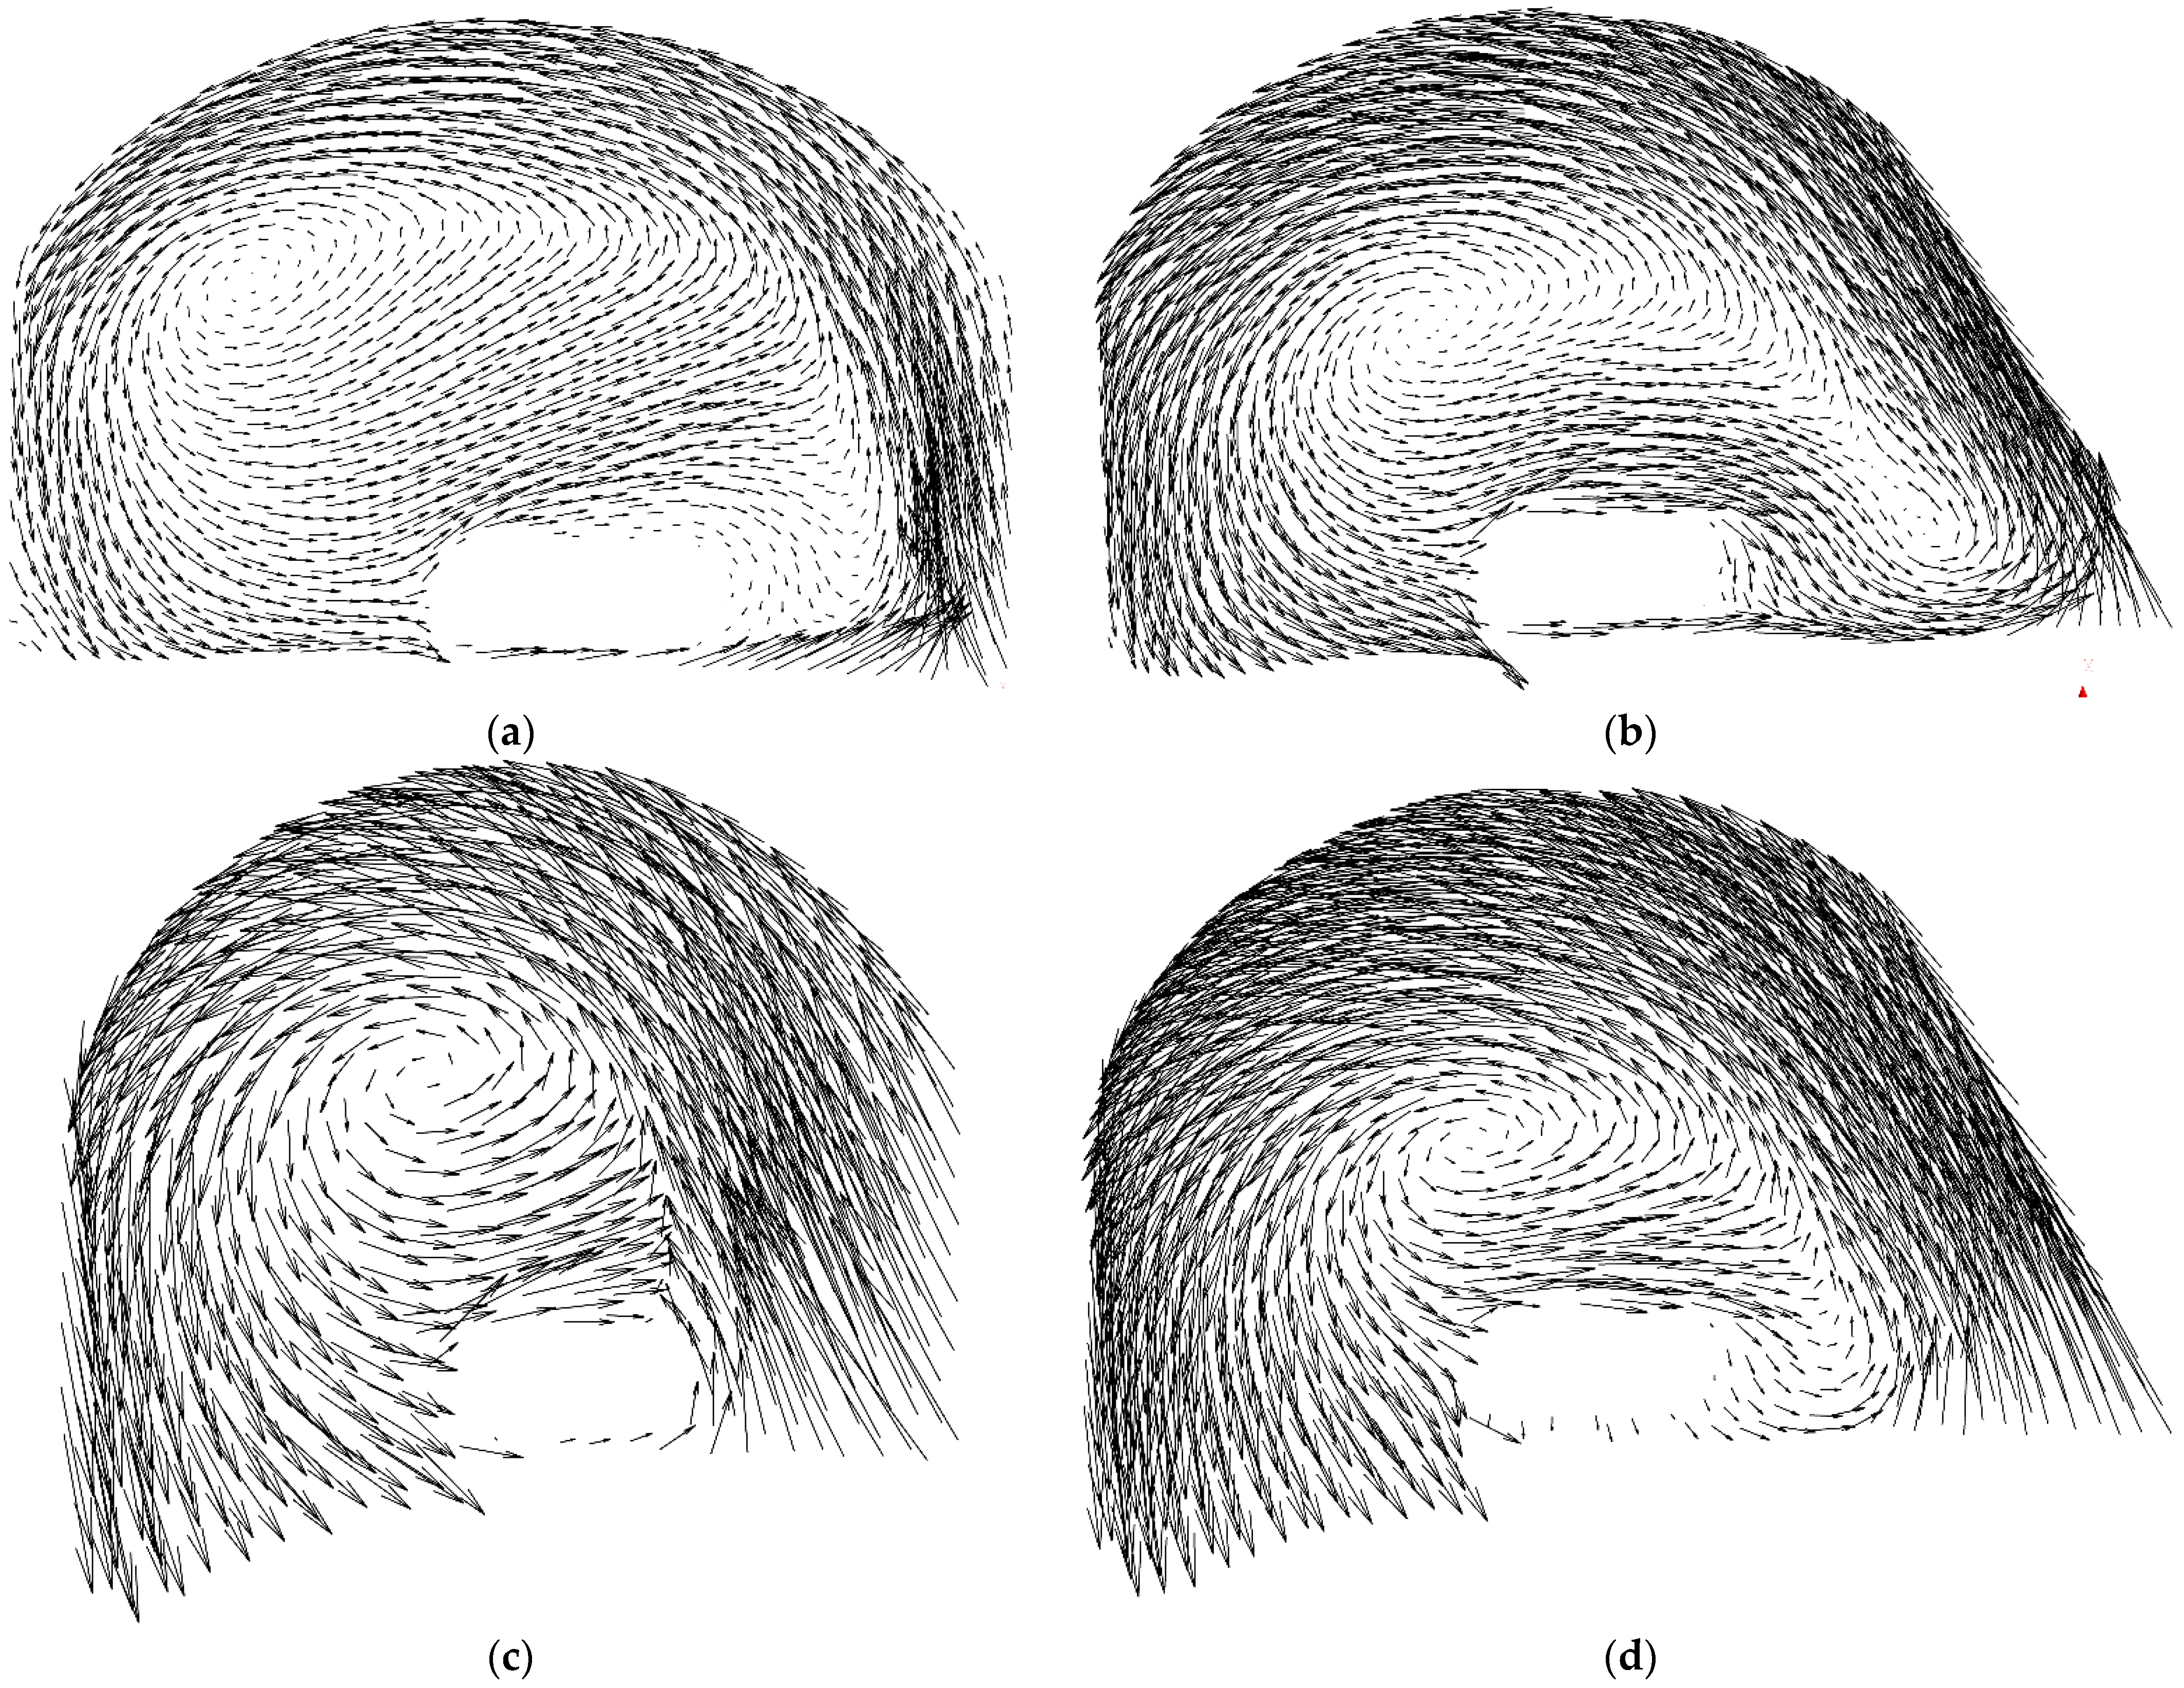
5.4. Casing Treatment Flow Fields and Operating Mechanism

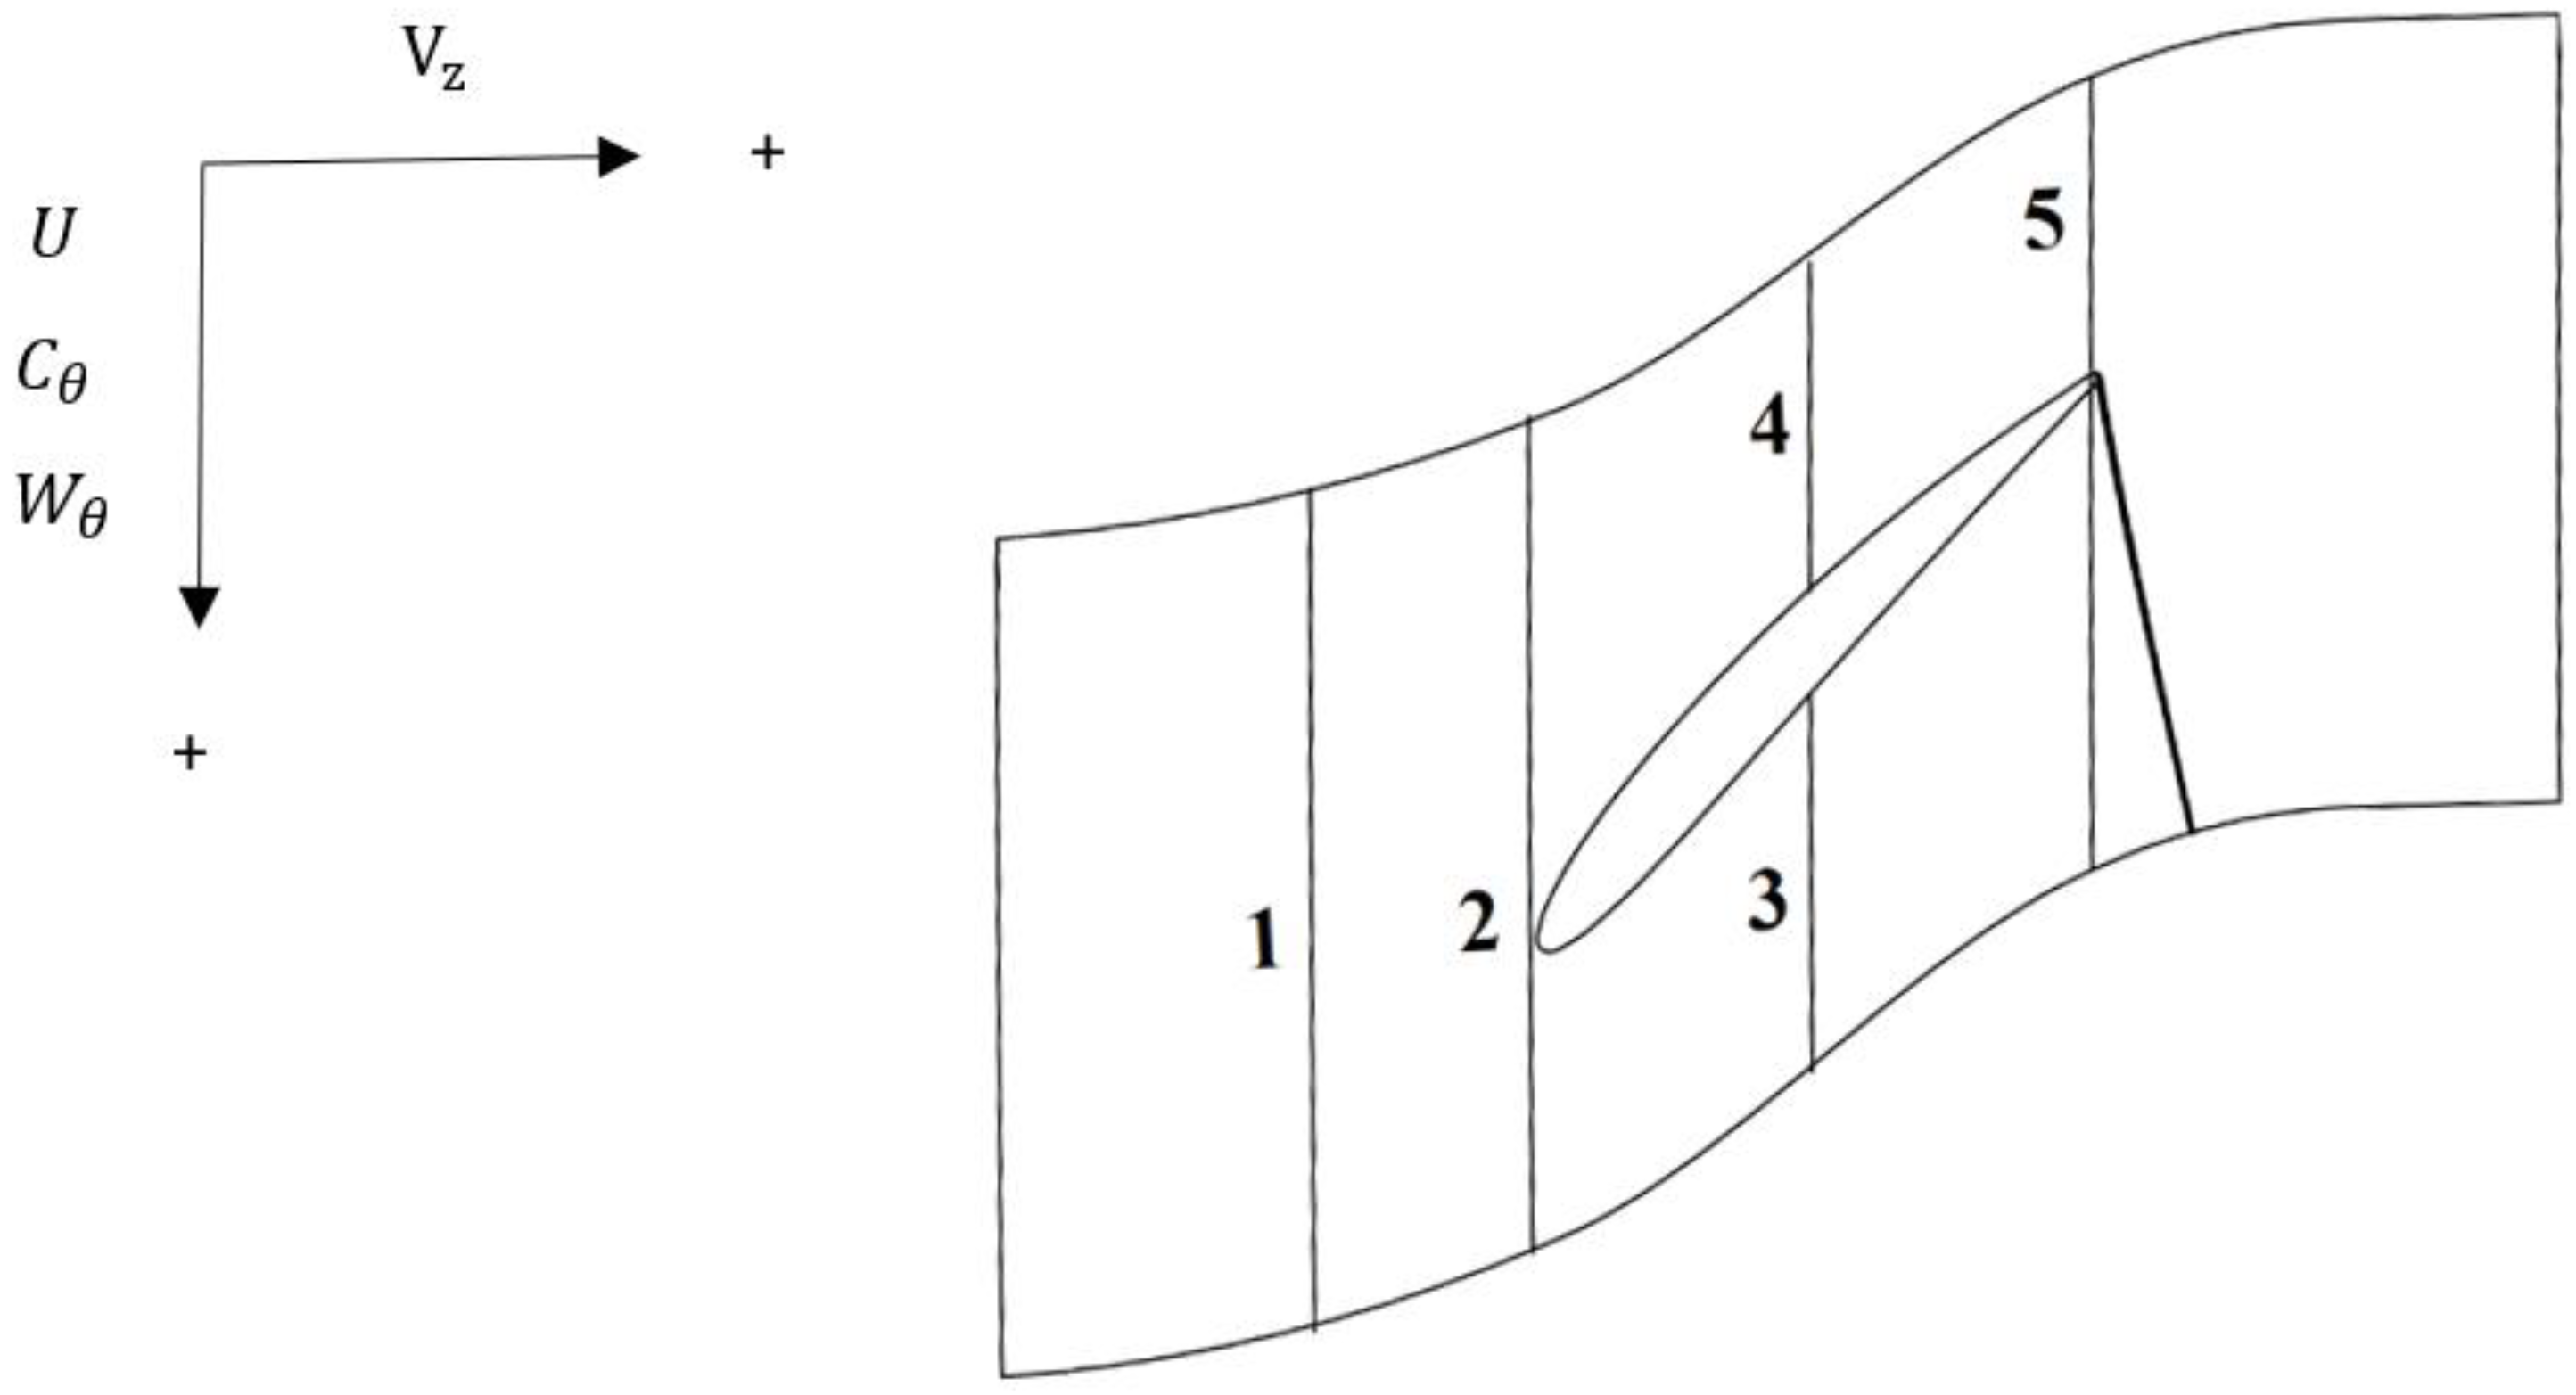
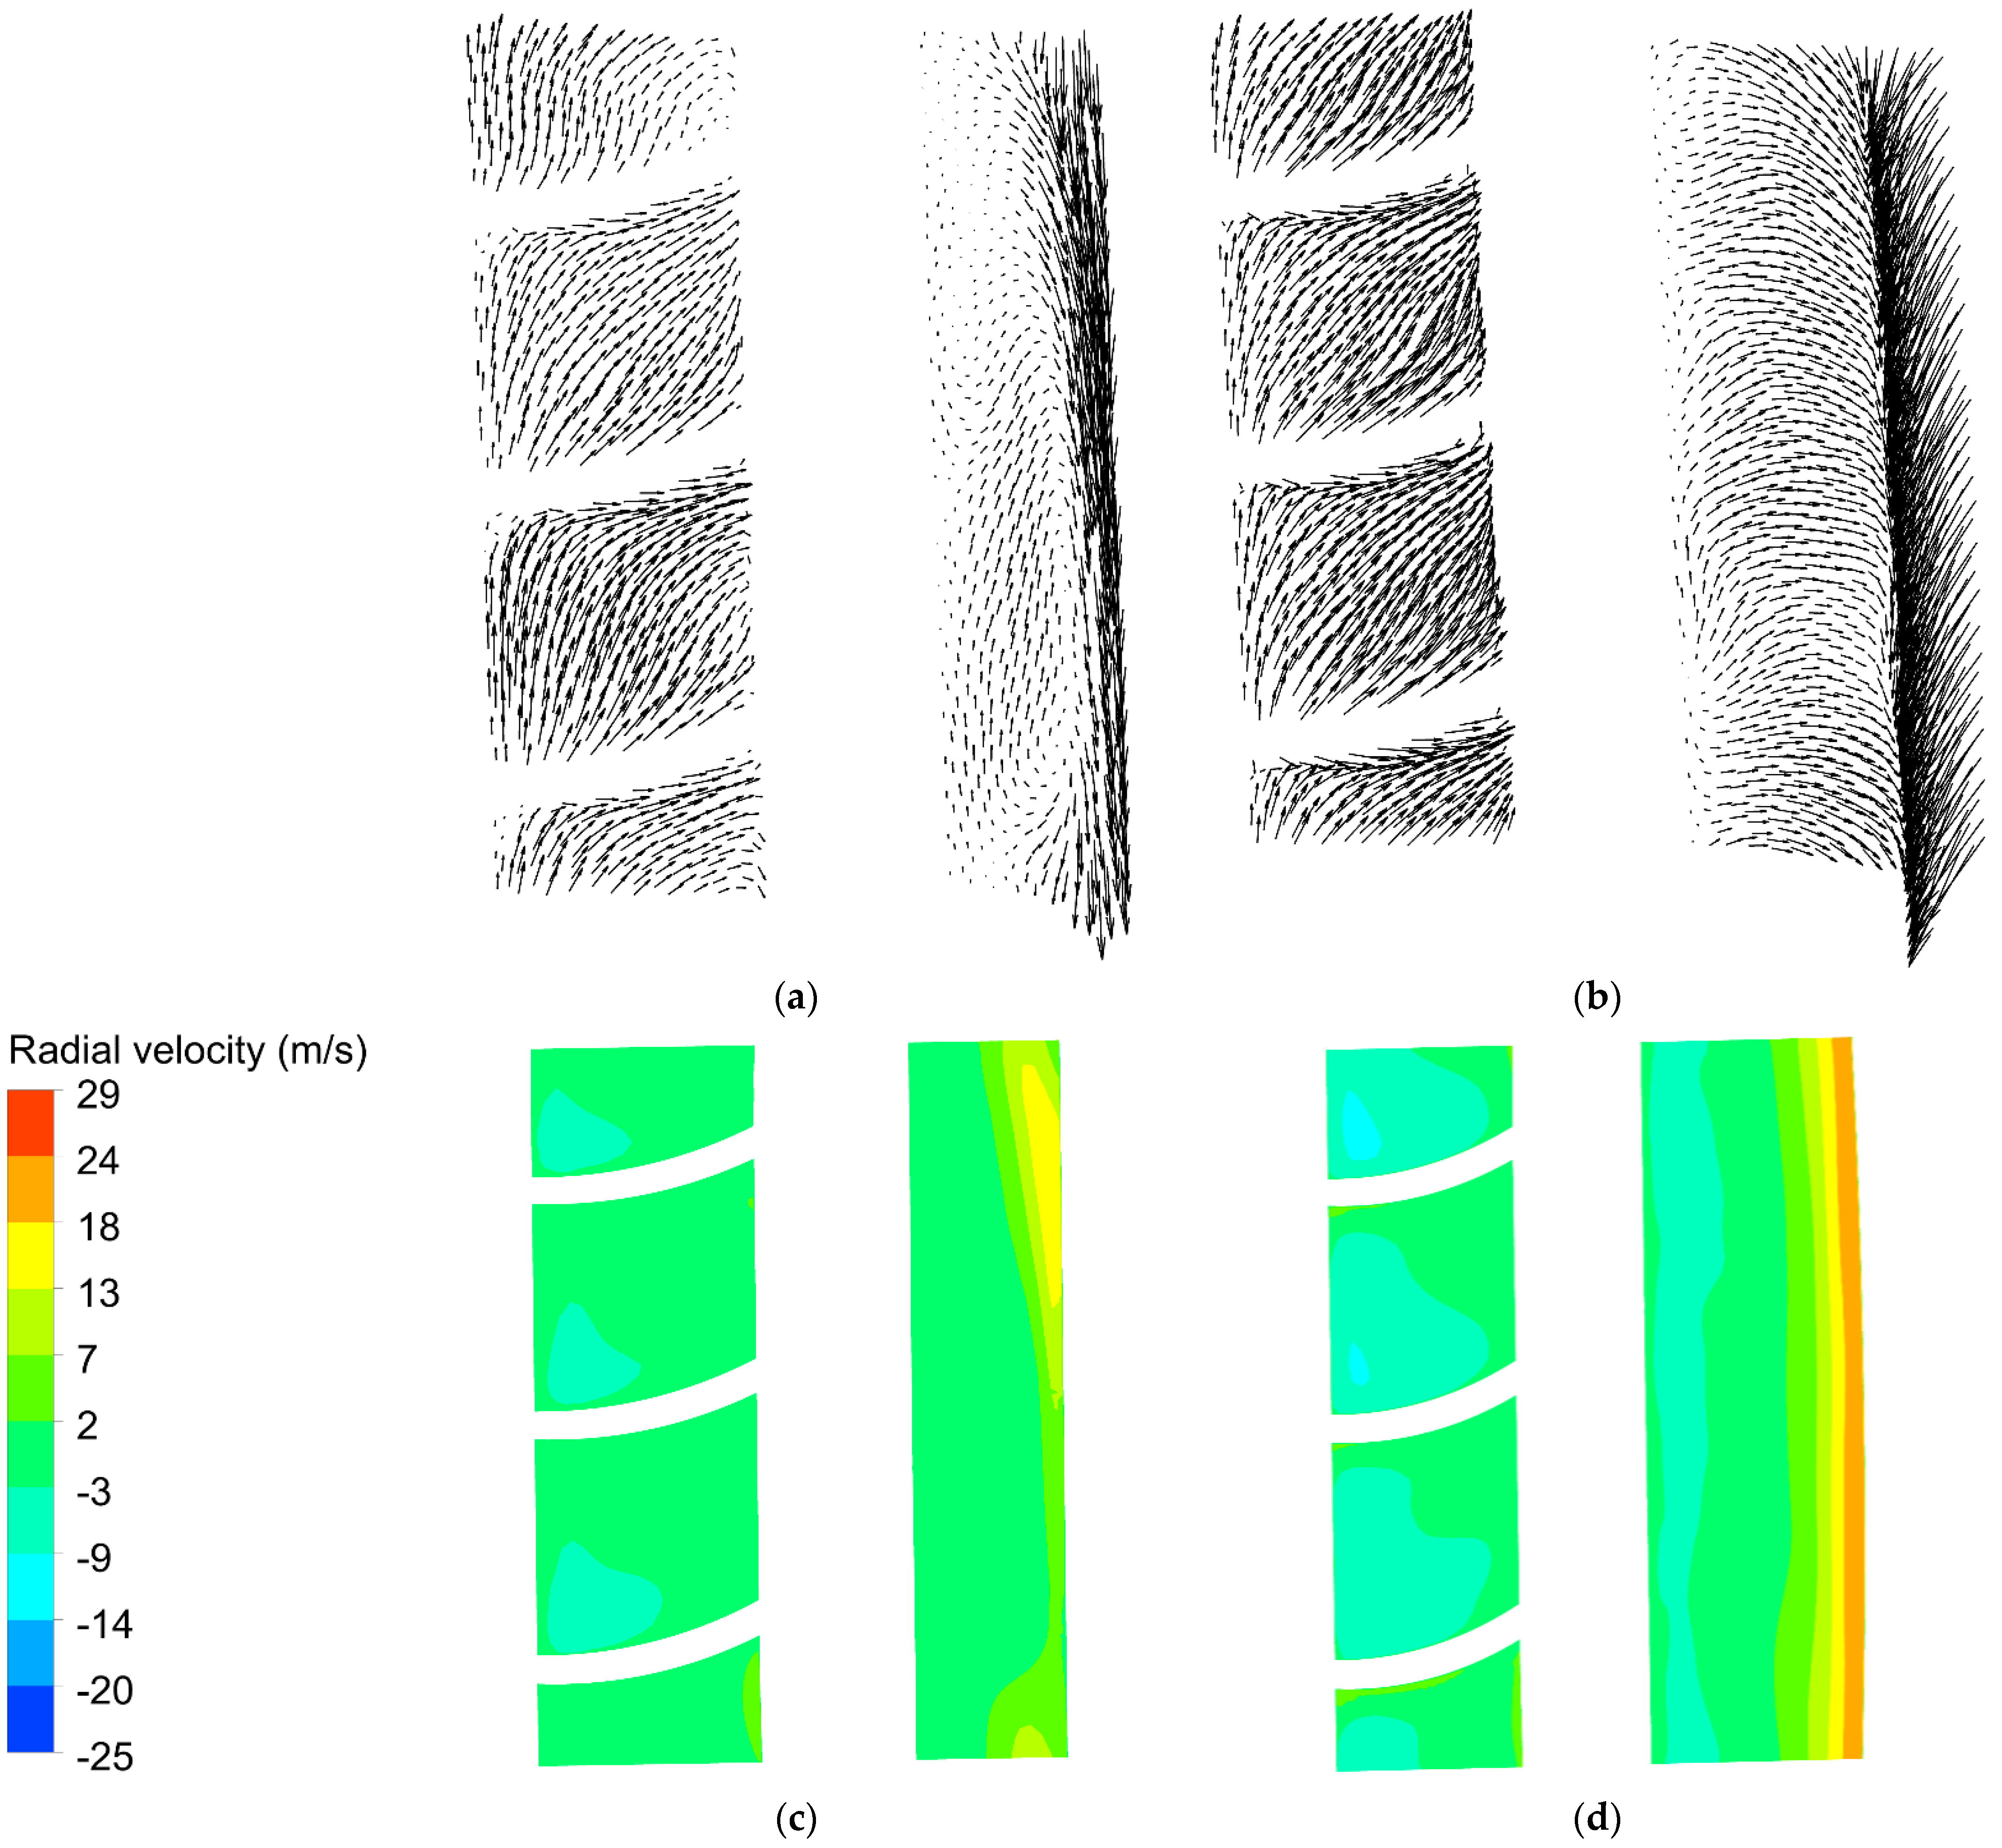
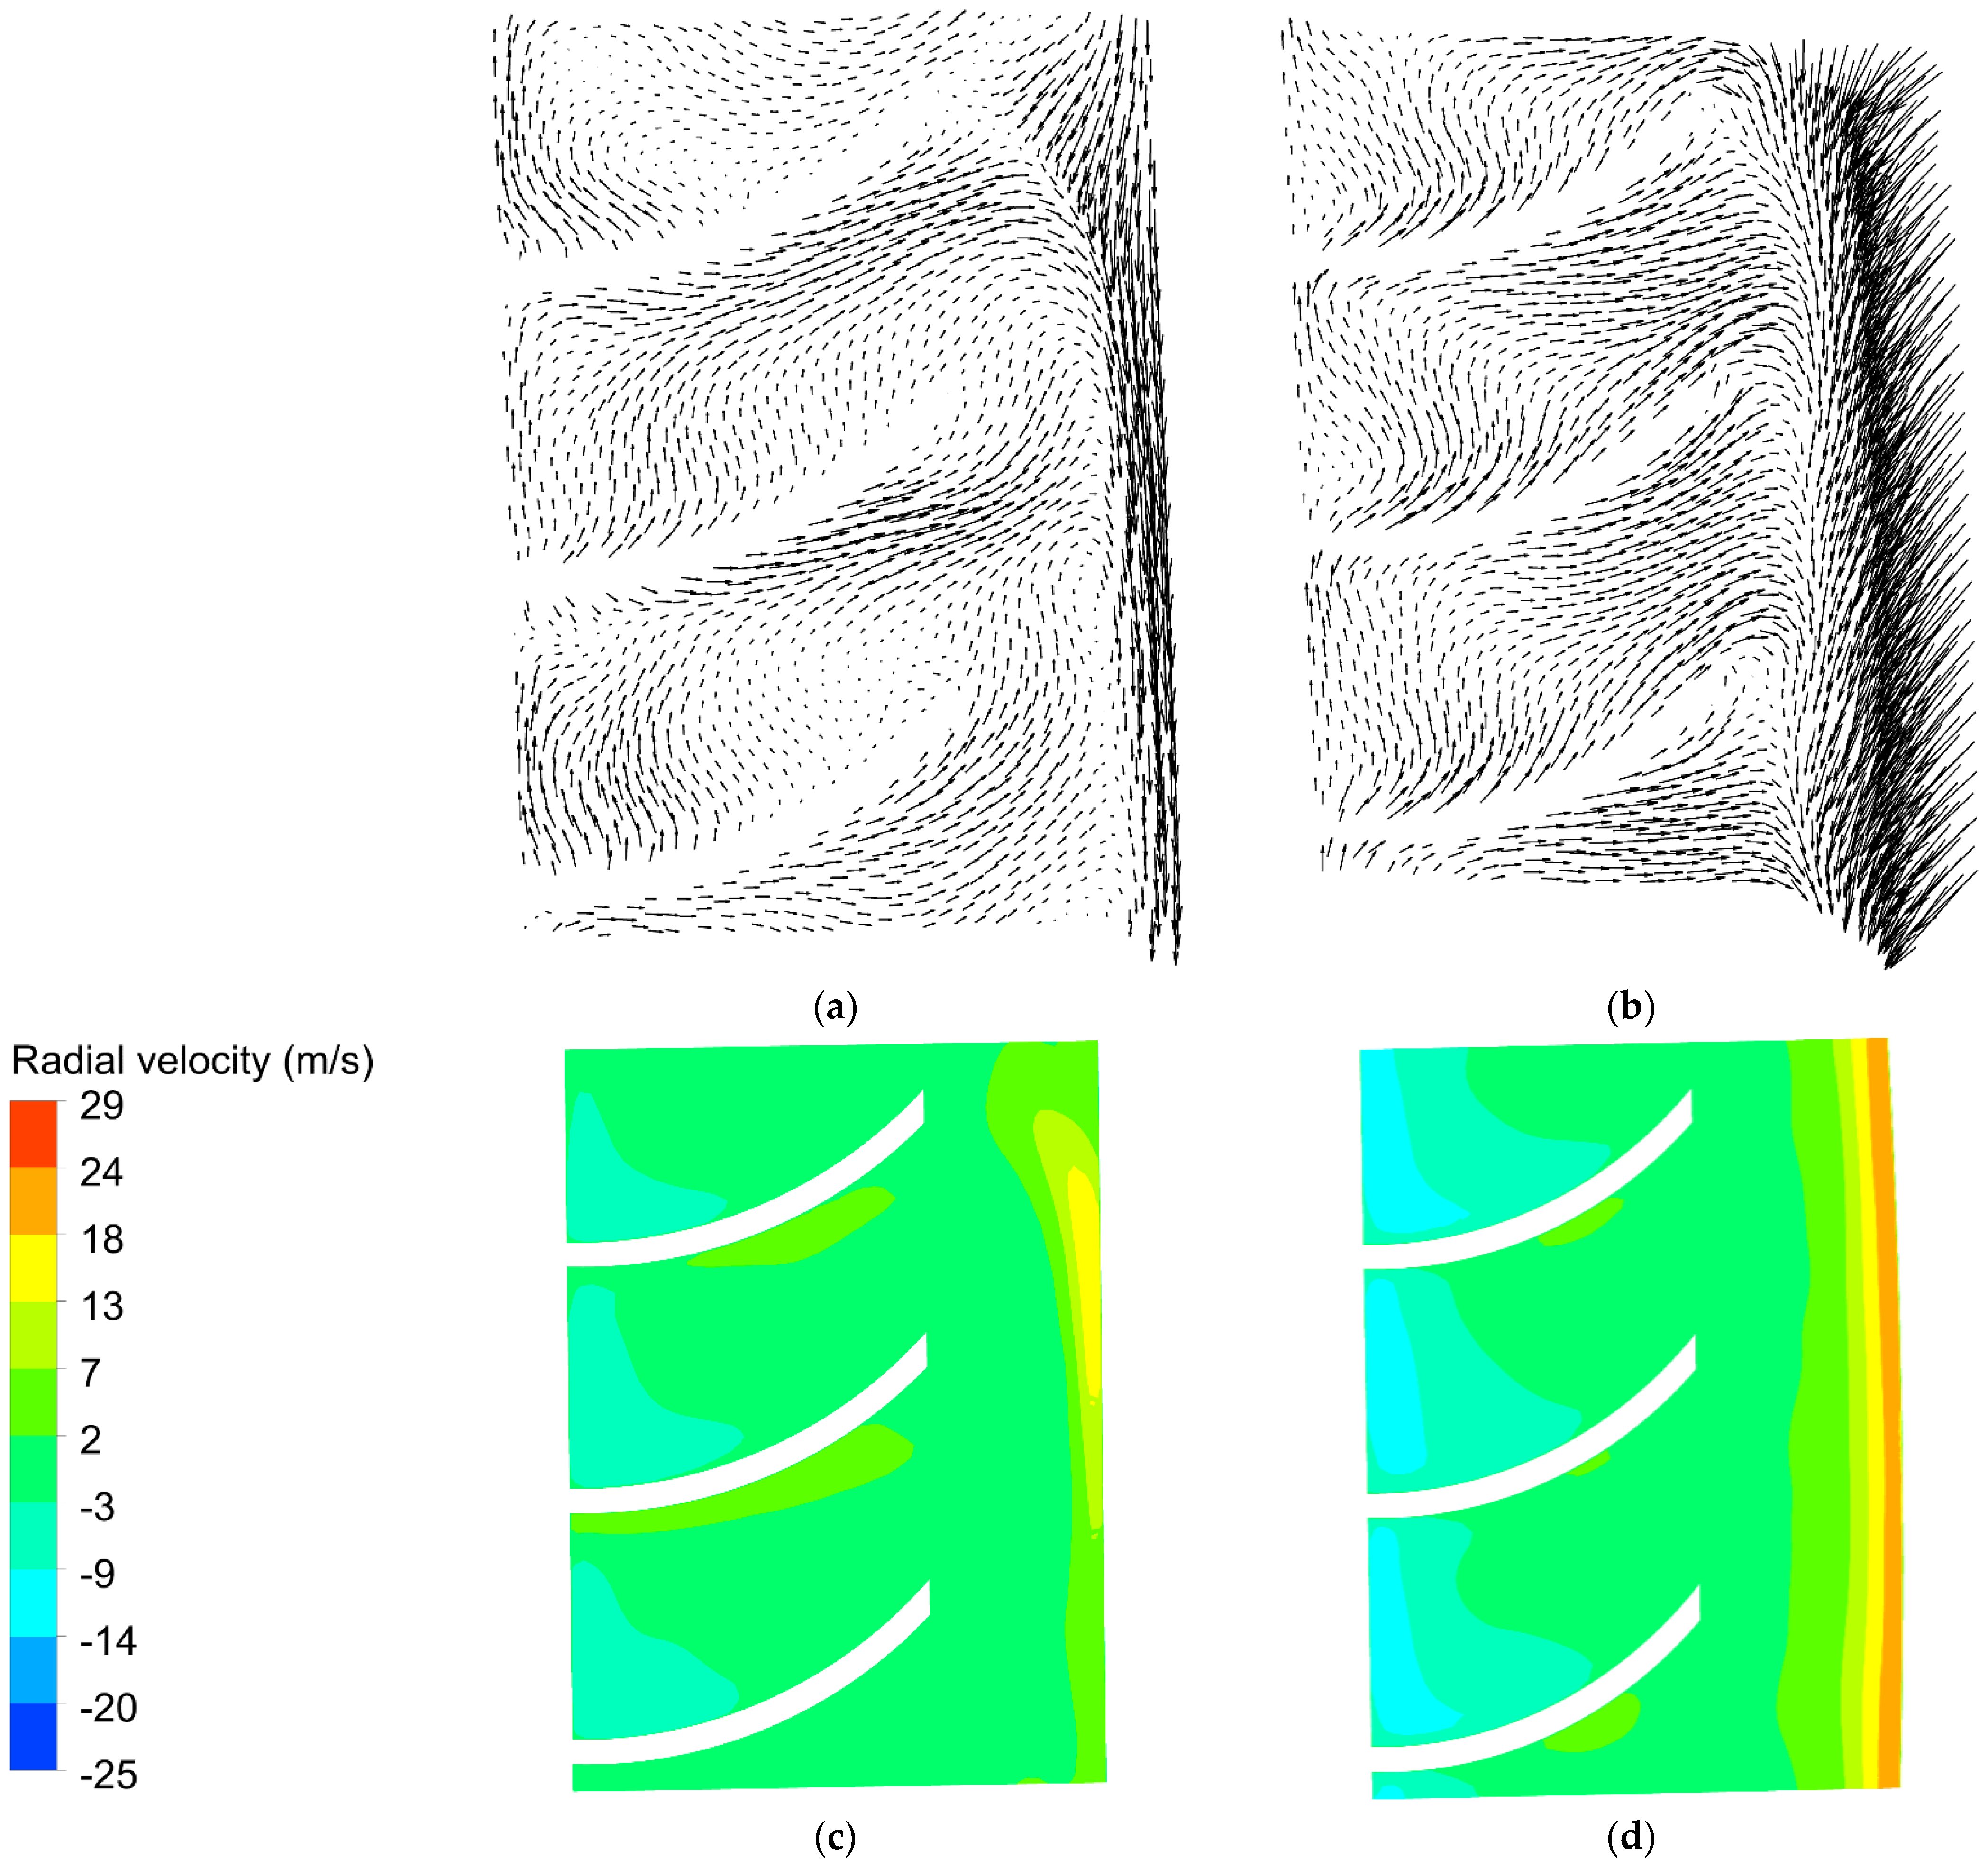
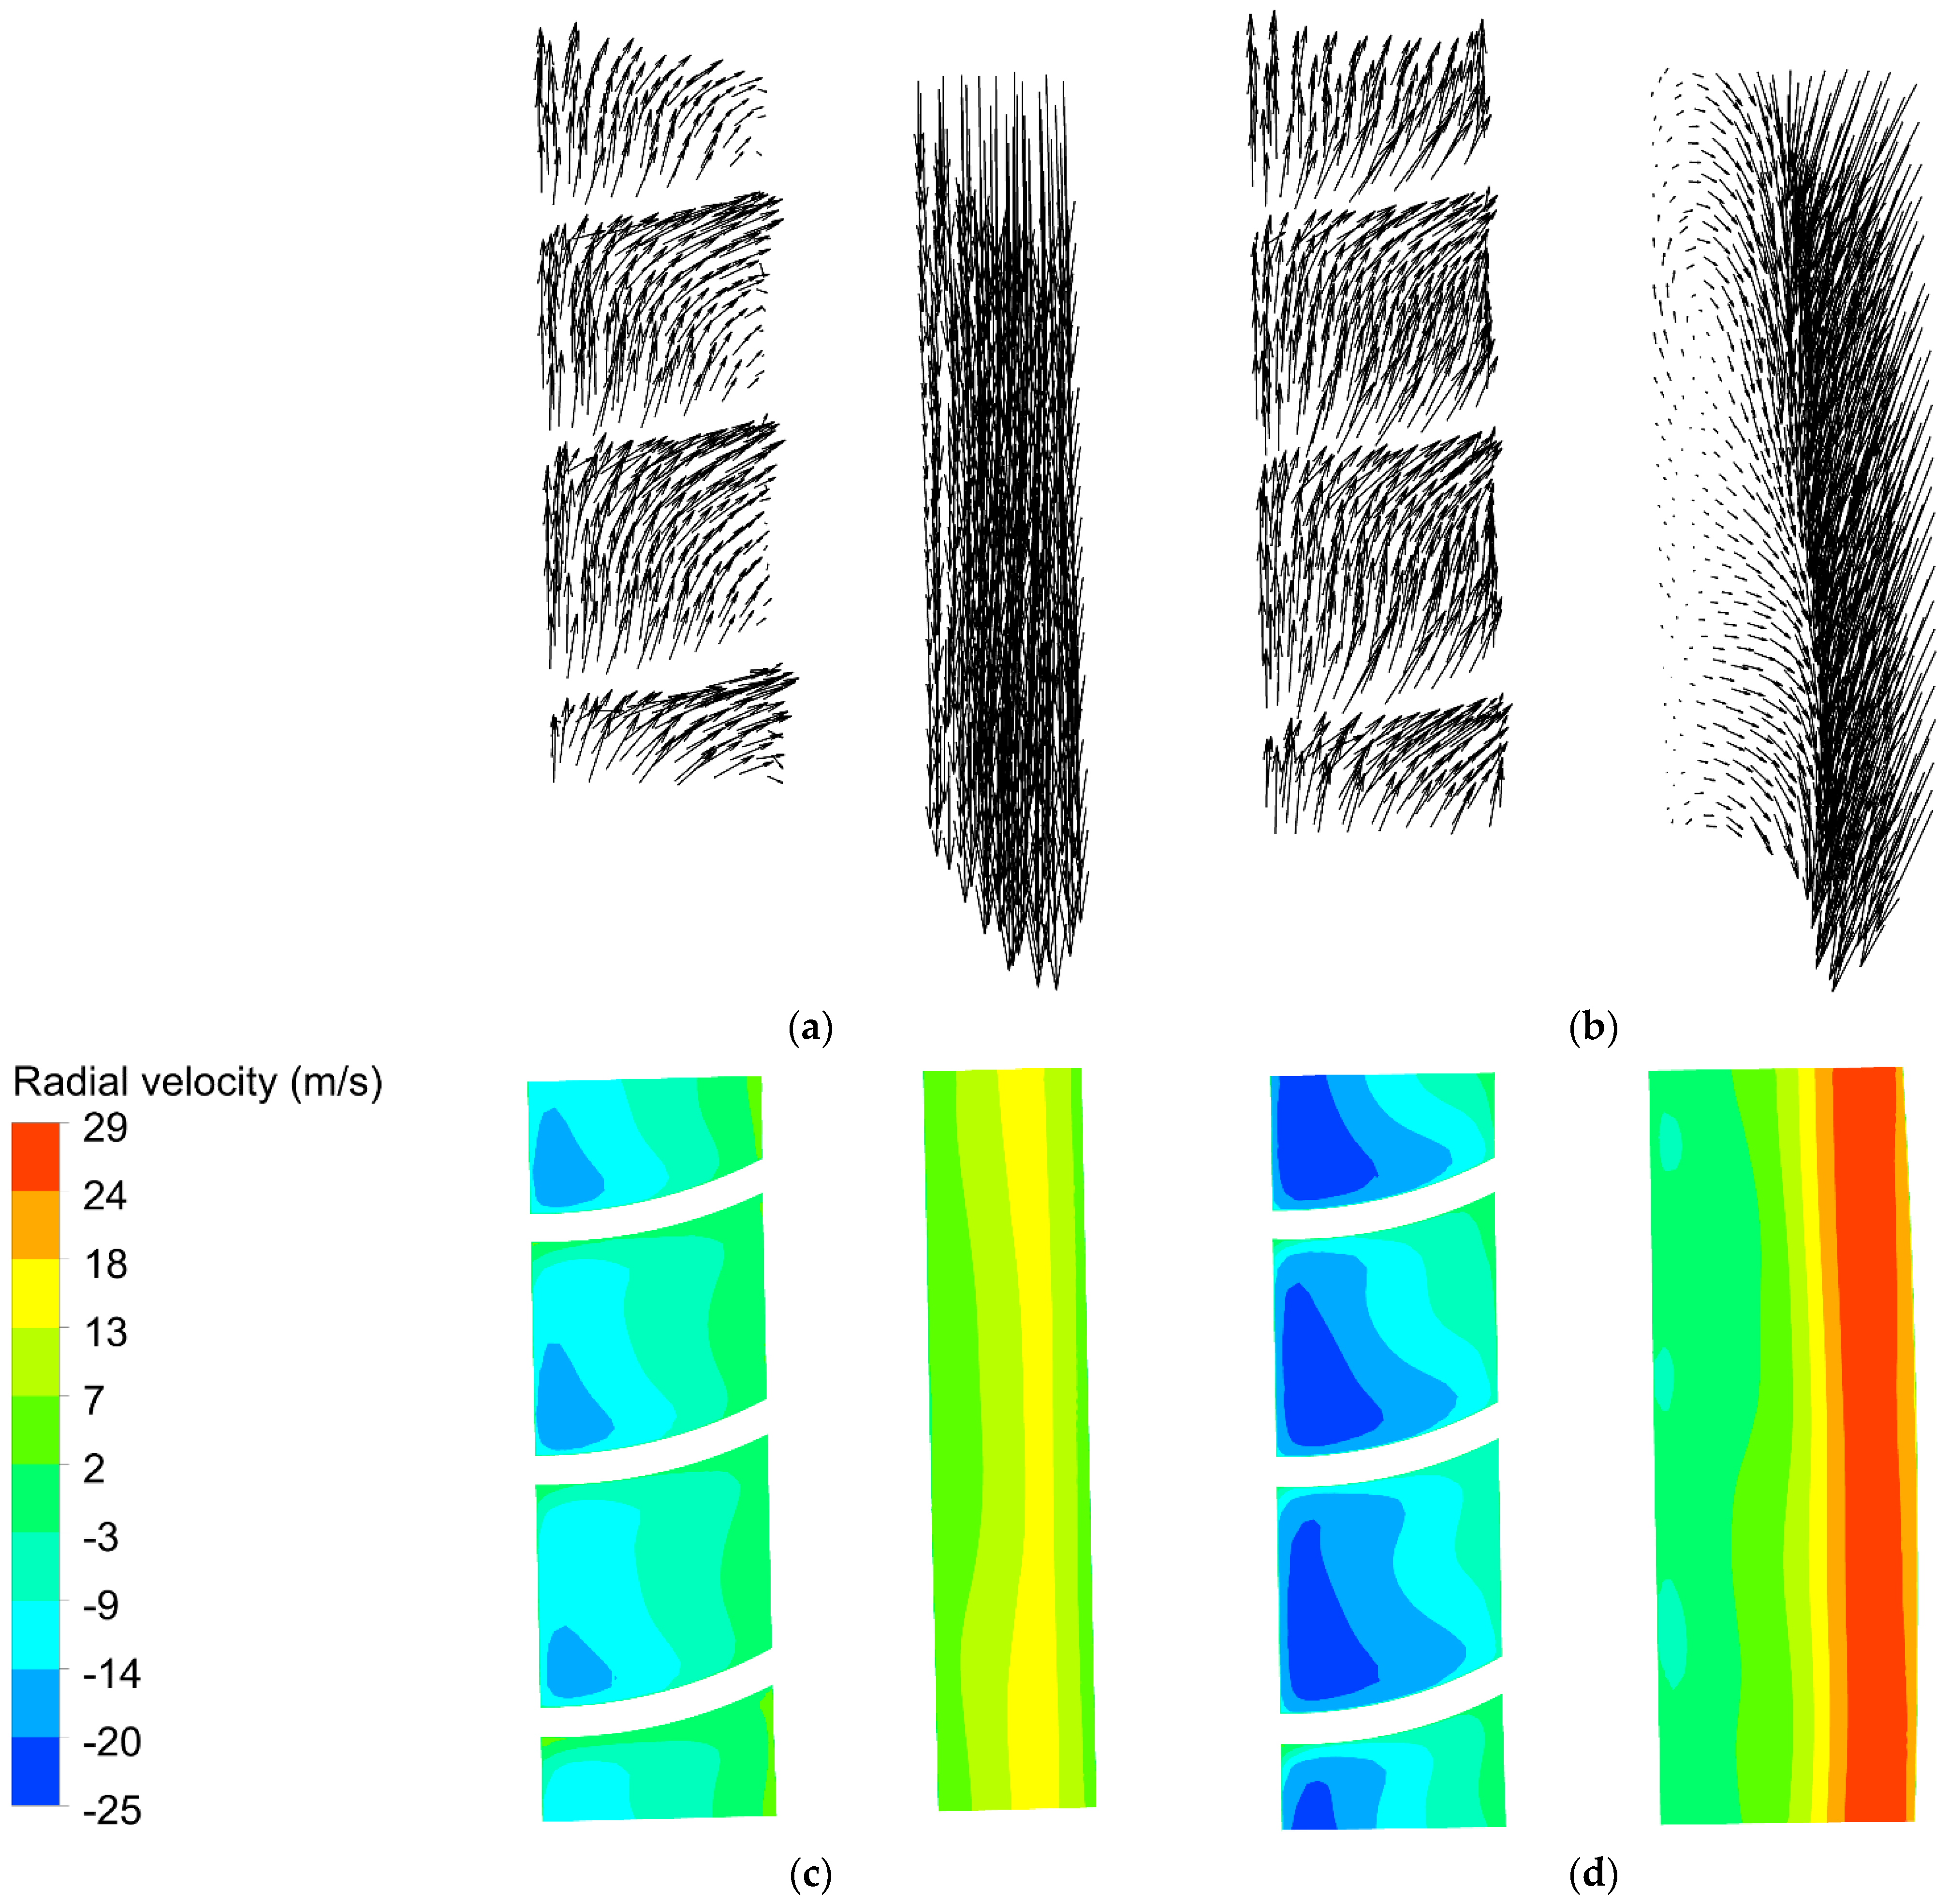
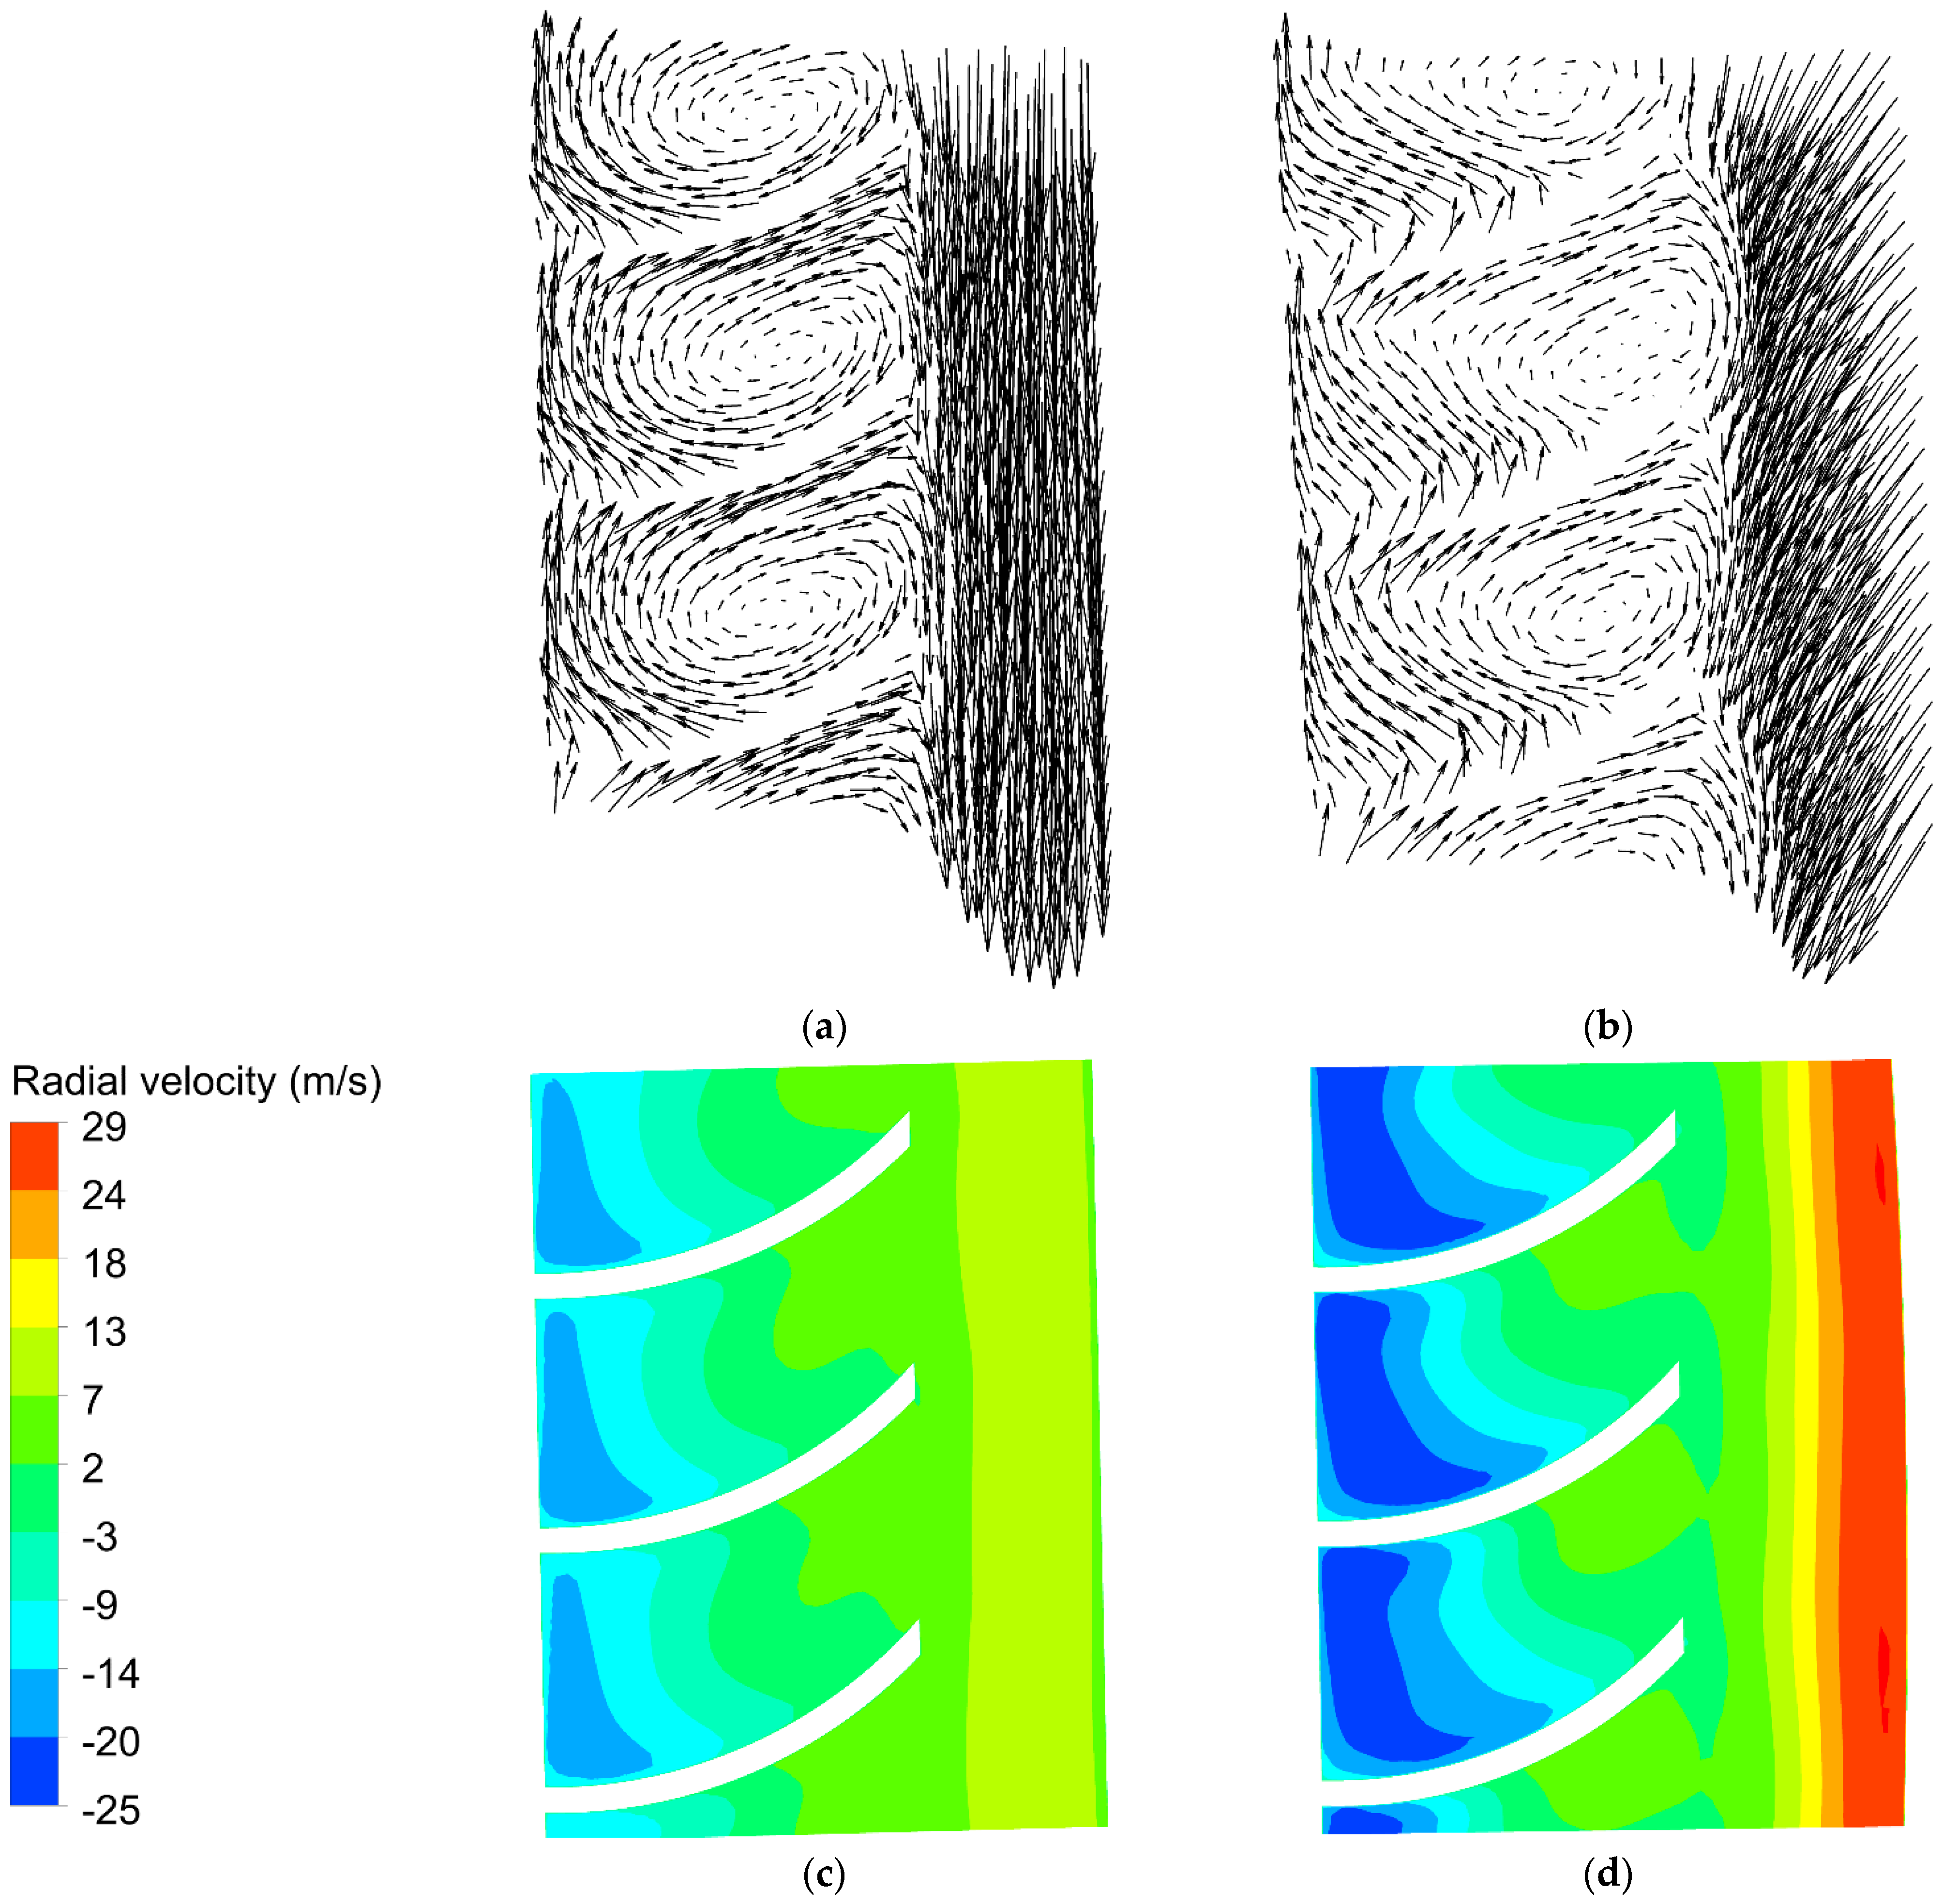
5.4.1. Velocity Vectors and Radial Velocity Distributions

In order to explain flow structure inside the casing treatment, the comparison of the flow fields between configurations A and B at the two operating points 1.95 and 1.6 kg/s are presented in this section. The meridional views of velocity vectors are taken from the mid-gap between the two vanes inside the casing treatment (Figure 18). The blade-to-blade views of velocity vectors and radial velocity distributions are computed at 2 mm and 7 mm above the casing (Figure 19, Figure 20, Figure 21 and Figure 22). These locations correspond to slightly above the rotor tip and the mid-height of the casing treatment, respectively.
The passage of fluid between the casing treatment and the rotor occurs for two reasons. First, a flow occurs to eliminate the pressure differences between the casing treatment and the rotor tip. Second, the pressure differences between the pressure side and the suction side of the rotor blade induce another flow. Two major flow streamlines can be identified inside the casing treatment for configurations A and B at the two operating points 1.95 and 1.6 kg/s (Figure 18). The first major streamline inside the casing treatment is formed due to the suction of the low-speed fluid from the rotor passage into the casing treatment and injection to the upstream of rotor. The suction and injection form a global flow recirculation between the casing treatment and the rotor. This recirculation flow has a significant impact on the stall delay mechanism. The other major streamline is formed due to the part of the fluid that is stored inside the casing treatment and is not discharged to the mainstream immediately. This part of the fluid forms a counterclockwise vortex flow inside the casing treatment. The vortex flow moves toward the middle of the casing treatment as the mass flow decreases.
At 2 mm above the casing, the velocity vectors show that an almost circumferential flow occurs slightly above the rotor blades (Figure 19, configuration A). This circumferential flow is generated due to the rotation of the rotor blade. After configuration B is applied, the mentioned flow direction varies to axial circumferential flow and is not purely circumferential anymore. In this case, a flow with axial circumferential components occurs due to an increase in the rotor blade tip axial chord exposure. As a result of this change, the flow is sucked with axial radial components to the casing treatment rather than just a radial component and, therefore, an axial component is added (Figure 19, configuration B).
Radial velocity distributions at 1.95 kg/s show that weak flow suction and injection occur for configuration A relative to the radial velocity distribution inside the casing treatment, 2 mm and 7 mm above the rotor blades, except that a region of high radial velocity is observed at the rearward of the casing treatment and in the right-hand side above the rotor blades (Figure 18, Figure 19 and Figure 20, configuration A). This region is located above and in close proximity to the blade pressure side that induces a high inward radial velocity. On the other hand, unlike configuration A, a few bands of circumferentially uniform radial velocity distributions can be seen for configuration B (Figure 18, Figure 19 and Figure 20, configuration B). It is higher toward the right-hand side of the casing treatment above the rotor blades and decreases as it moves away from the leading-edge plane. Another important observation for both configurations A and B is that a part of the bled flow to the casing treatment is discharged just above the rotor blades immediately (Figure 18, Figure 19 and Figure 20). As the mass flow decreases to 1.6 kg/s, this suction/injection still occurs for configuration B above the rotor with lower intensity, but it is not observed for configuration A (Figure 21 and Figure 22). As is explained in Section 5.4.2, this suction/injection forms a half-ellipse fluid trajectory.
The identified flow structures slightly evolve and amplify with reduction in mass flow to 1.6 kg/s. These flow structures include the global flow recirculation between the casing treatment and the rotor, the local vortex flow inside the casing treatment, the circumferential and the axial circumferential flow, the half-ellipse and the circumferentially uniform radial flow distributions.
As the mass flow decreases to 1.6 kg/s, the velocity vectors show a high-intensity circumferential flow, 2 mm and 7 mm, above the rotor blades (Figure 21 and Figure 22, configuration A). As mentioned earlier, this flow is generated due to the rotation of the rotor blade. On the other hand, the intensity of the axial circumferential flow above the rotor blades increases for configuration B (Figure 21 and Figure 22, configuration B). It can be observed that a few bands of radial flow with circumferentially uniform distributions occur for both configuration A and B likewise (Figure 21 and Figure 22). Furthermore, the radial velocity distributions show that configuration B has higher radial suction/injection velocity relative to configuration A. The reason for higher velocity distribution can be explained by decreasing casing treatment surface area for configuration B relative to configuration A, which has a constant surface area. This gives rise to higher radial velocity distributions for configuration B and enhances flow exchange between the casing treatment and the rotor. The effect of increased forcing from the blade tip due to the increased exposure could induce higher radial velocity.
Based on the flow-field analysis in this section, it can be concluded that the flow field inside the casing treatment is three-dimensional and the flow structure varies slightly between both configurations A and B in terms of velocity, velocity directions and intensity of flow suction/injection. It was also observed that the identified flow structures are amplified with reduction in the mass flow to 1.6 kg/s. Configuration B has an advantage over configuration A in that it promotes extra fluid suction/injection and can enhance stall margin. Nevertheless, either of these configurations bleed low axial-momentum fluid that induces flow blockage in the rotor passage, decreases the swirl component of absolute velocity and discharges it to upstream of the rotor.

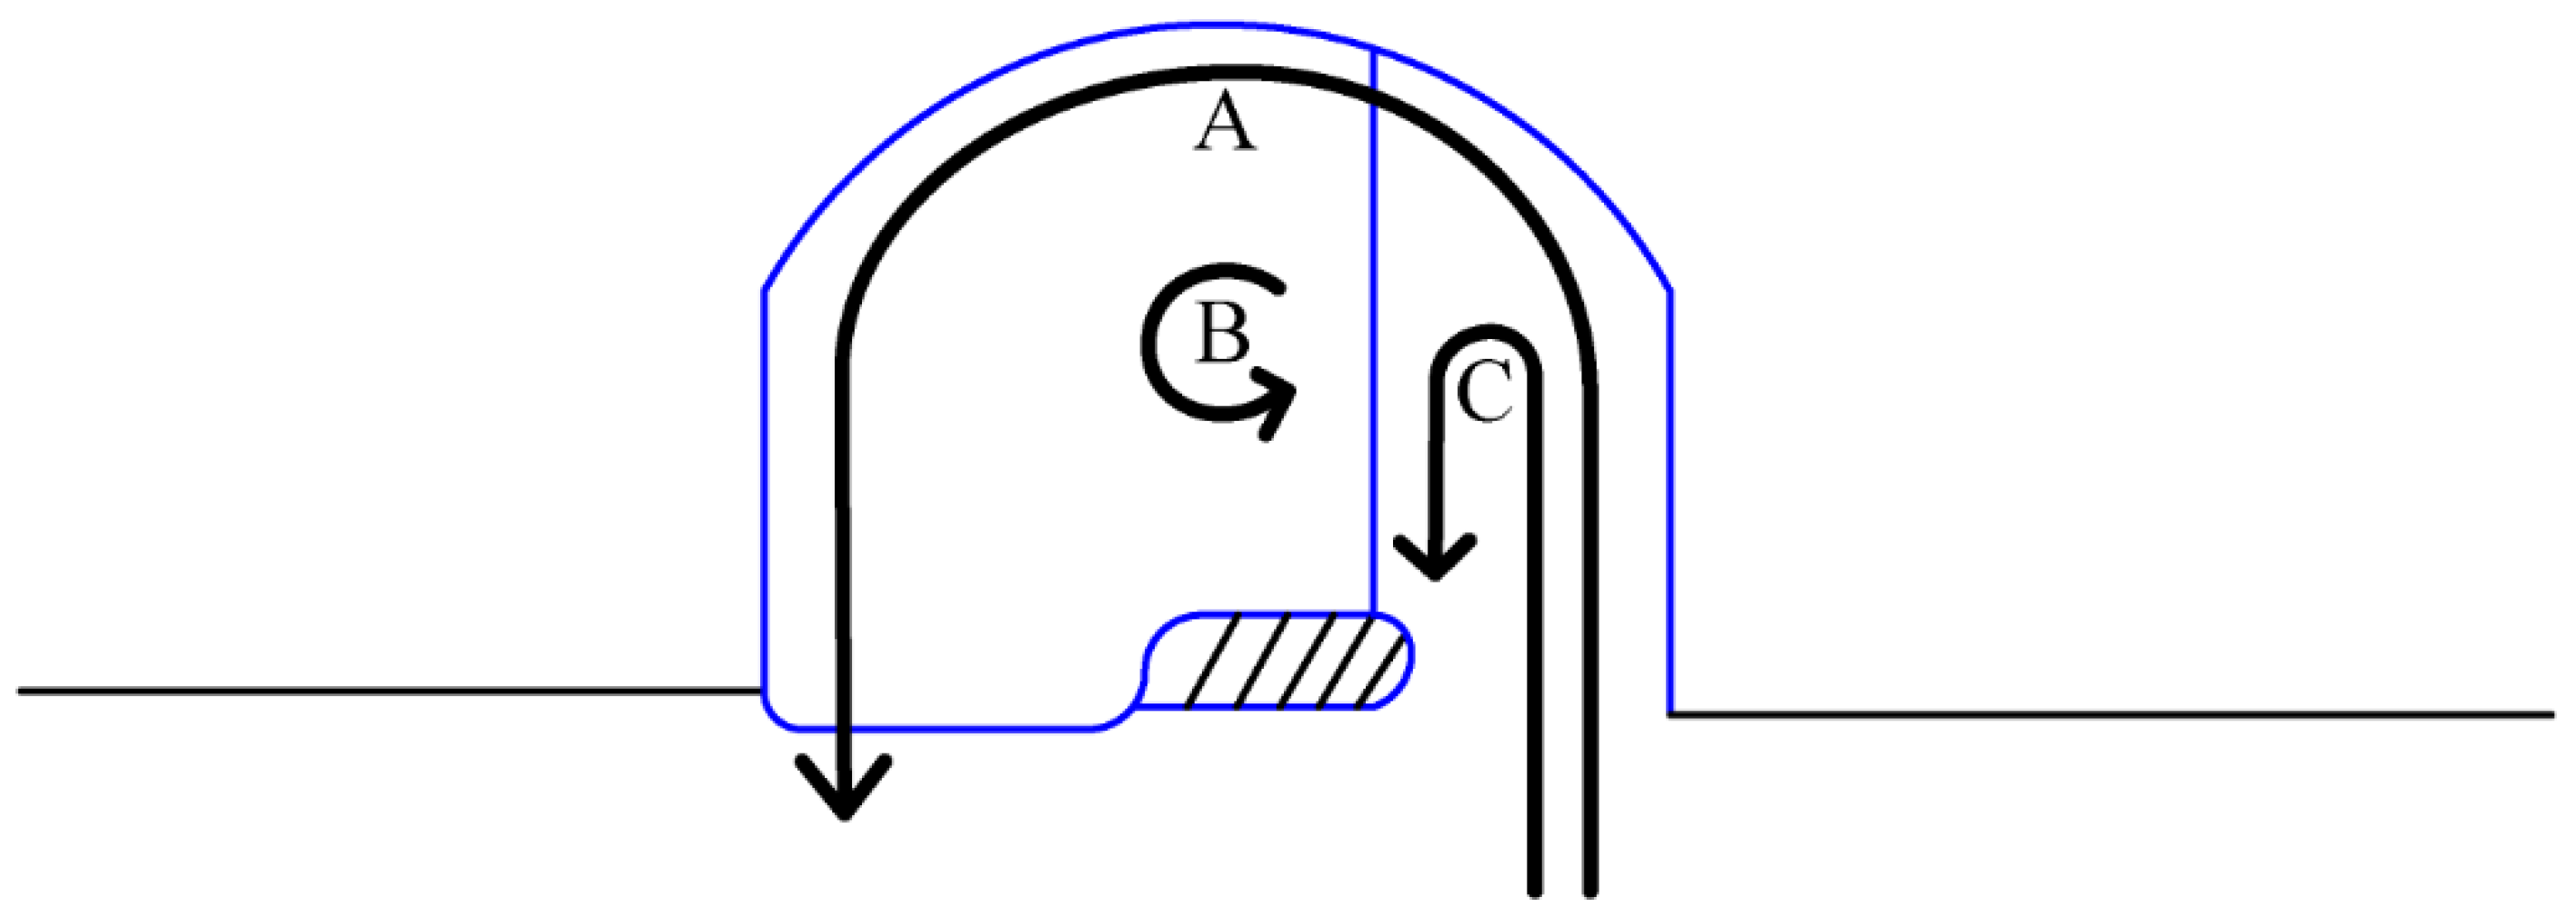
5.4.2. Operating Mechanism of the Casing Treatment

The flow fields for the two configurations A and B were explored in the preceding section. Based on the analysis of the flow structure for both configurations A and B, a schematic view of fluid particle trajectories inside the casing treatment is shown in Figure 23. It should be noted that fluid trajectory is demonstrated simply for configuration A, but the fluid trajectory for configuration B is similar with slight differences. Three fluid trajectories A, B and C can be identified inside the casing treatment as follows.
Fluid trajectory A: This fluid trajectory corresponds to the global flow recirculation between the rotor and the casing treatment, which is induced due to the pressure differences between the rotor and the casing treatment. This flow recirculation has a prominent effect on absorbing the low-speed fluid from the rotor passage and discharging into the upstream of the rotor and, consequently, it has a significant role on stall margin enhancement. This flow occurs for both configurations A and B at 1.95 kg/s and 1.6 kg/s and is augmented as the mass flow rate decreases to 1.6 kg/s.
Fluid trajectory B: After the flow is bled to the casing treatment, a local counterclockwise vortex flow forms inside the casing treatment. This fluid trajectory corresponds to the fluid that is stored inside the casing treatment and does not return to the main flow immediately. This fluid trajectory occurs for both configurations A and B at 1.95 kg/s. As the mass flow decreases to 1.6 kg/s, the storage of the fluid within the casing treatment is weakened, since the suction/injection mass flow increases.
Fluid trajectory C: This fluid trajectory corresponds to the fluid that is bled to the casing treatment but does not follow either fluid trajectory A or B. In this case, the fluid flow returns to the mainstream immediately above the rotor blades instead. This flow occurs for both configurations A and B at 1.95 kg/s and is eliminated and weakened for both configurations A and B as the mass flow decreases to 1.6 kg/s, respectively.
The analysis of this and Section 5.4.1 demonstrate the importance of the casing treatment rotor blade tip axial chord exposure, the three major flow streamlines and fluid trajectories, velocity components and velocity directions on the effectiveness of the casing treatment application. It is noteworthy to mention that, although the flow behavior for the two configurations A and B differs slightly in terms of flow structure, velocity components and velocity directions, the operation of the casing treatment is similar with few differences. As the mass flow decreases, the stalled flow is bled to the casing treatment and the three identified flow structures occur. Afterwards, the stalled flow strikes the curved guide vanes, which results in reduction in the swirl component of the absolute velocity. It should also be noted that the curved guide vanes do not increase the axial velocity of the flow directly. Consequently, the casing treatment has an indirect effect on the end wall flow, which may be accompanied by an increase or decrease in axial velocity. As an example, although the axial velocity of the inflow for configuration A decreases at CT-1.95 in Table 6, the reduction in the absolute swirl velocity alone leads to increase in axial velocity for the five sections in Table 5. As a result, the influence of the casing treatment on decreasing the swirl component of the absolute velocity is regarded as the main effect, which may be accompanied by an increase in the flow axial velocity.

5.5. Mechanism of Stall Margin Improvement

In order to understand the physical mechanism of the vaned recessed casing treatment, it is necessary to explain the mechanism of stall for the investigated compressor first. The stall in the investigated low-speed compressor results from the accumulation of the low-speed fluid in the rotor blade passage and end wall regions. This coincides with the movement of the main flow/tip leakage flow interface to the leading-edge plane. The distribution of entropy levels at SC-1.95 shows that the line with high entropy gradient lines up with the rotor leading-edge plane, as can be seen in Figure 11. After the casing treatment is introduced, the regions of rotor tip which are exposed to CT under the effect of CT injection will have higher entropy values due to flow exchange and mixing, but the downstream areas have a lower entropy level. The maximum entropy is found for configuration B at 1.6 kg/s, which implies that higher losses accompany this configuration. Moreover, the distribution of entropy levels demonstrates that, following the application of the casing treatment, the shape of the line with high entropy gradient changes and is no longer a straight line, especially for configurations A and B at 1.95 kg/s. The repositioning of the interface slightly toward the trailing edge can be observed especially for configuration B at 1.6 kg/s. Based on Vo’s stalling condition [21], the repositioning of main flow/tip leakage interface toward the downstream can improve stability margin.
Based on the axial velocity profiles, configurations A and B modify the axial velocity distributions to different degrees. After the vaned recessed casing treatment is applied, the low-speed fluid regions shrink to different degrees for configurations A and B, as can be found in Figure 10. In addition, configuration A increases the axial velocity components for the five sections and reversed flows are eliminated or largely reduced due to the reduction in the flow angle at 1.95 kg/s. As the mass flow is reduced further to 1.6 kg/s, the low-speed regions grow once again and accumulate the rotor passage. Configuration B largely increases the axial velocity components for the five sections and reversed flows are eliminated completely at 1.95 kg/s. The superior effect of configuration B is due to the decreasing surface area of the casing treatment, which results in the elimination of low-speed fluid and reversed flows to a greater extent. With the reduction in the mass flow to 1.6 kg/s, the low-speed fluid regions grow once again and accumulate in the rotor passage, but there are notable differences between both configurations A and B in terms of swirl and axial velocity components. Based on the distribution of relative total pressure in Figure 12, it is found that, under the influence of CTA at 1.95 kg/s, the relative total pressure values reduce slightly compared to SC-1.95, which is consistent with entropy results that entropy values increase.
Figure 24 demonstrates flow streamlines near the casing for all configurations at 1.95 kg/s. At SC-1.95, due to the pressure difference between the suction and pressure sides, the tip leakage vortex is formed and low-speed fluid and reversed flows are accumulated in the rotor passage. As the compressor is operating near the stall condition, the main flow/tip clearance interface moves toward the upstream and lines up with the leading-edge plane. After the casing treatment is applied, it was found in Section 5.2.1 and Section 5.2.2 that the axial momentum of fluid increases significantly and reversed flow regions are reduced and eliminated. Moreover, the pressure gradient between the suction and pressure sides is reduced for configurations A and B. Following the application of configurations A and B, different behavior in terms of stability enhancement can be found. Although the tip leakage vortex is still formed for configuration A, the trajectory of the interface is repositioned slightly toward the trailing edge, explaining how configuration A can delay the movement of the interface toward the leading-edge plane. On the other hand, the formation of tip leakage vortex is largely reduced for configuration B following the reduction in the pressure gradient and the trajectory of the interface moves further downstream toward the trailing edge. Therefore, the role of configurations A and B on stability enhancement includes the repositioning of the interface toward the downstream and lower probability of tip leakage vortex formation.

6. Conclusions

The effects of two modifications to the traditional vaned recessed casing treatment, including the geometry of guide vanes and upper shroud surface, have been investigated numerically for two configurations with smaller and larger rotor blade tip axial chord exposures. The following conclusions can be drawn:
(1)
The two modifications to the traditional vaned recessed casing treatment relieve the accumulation of the low-speed fluid with less static pressure within the vane passages and in the corners of the vaned recessed casing treatment and could enhance flow recirculation.
(2)
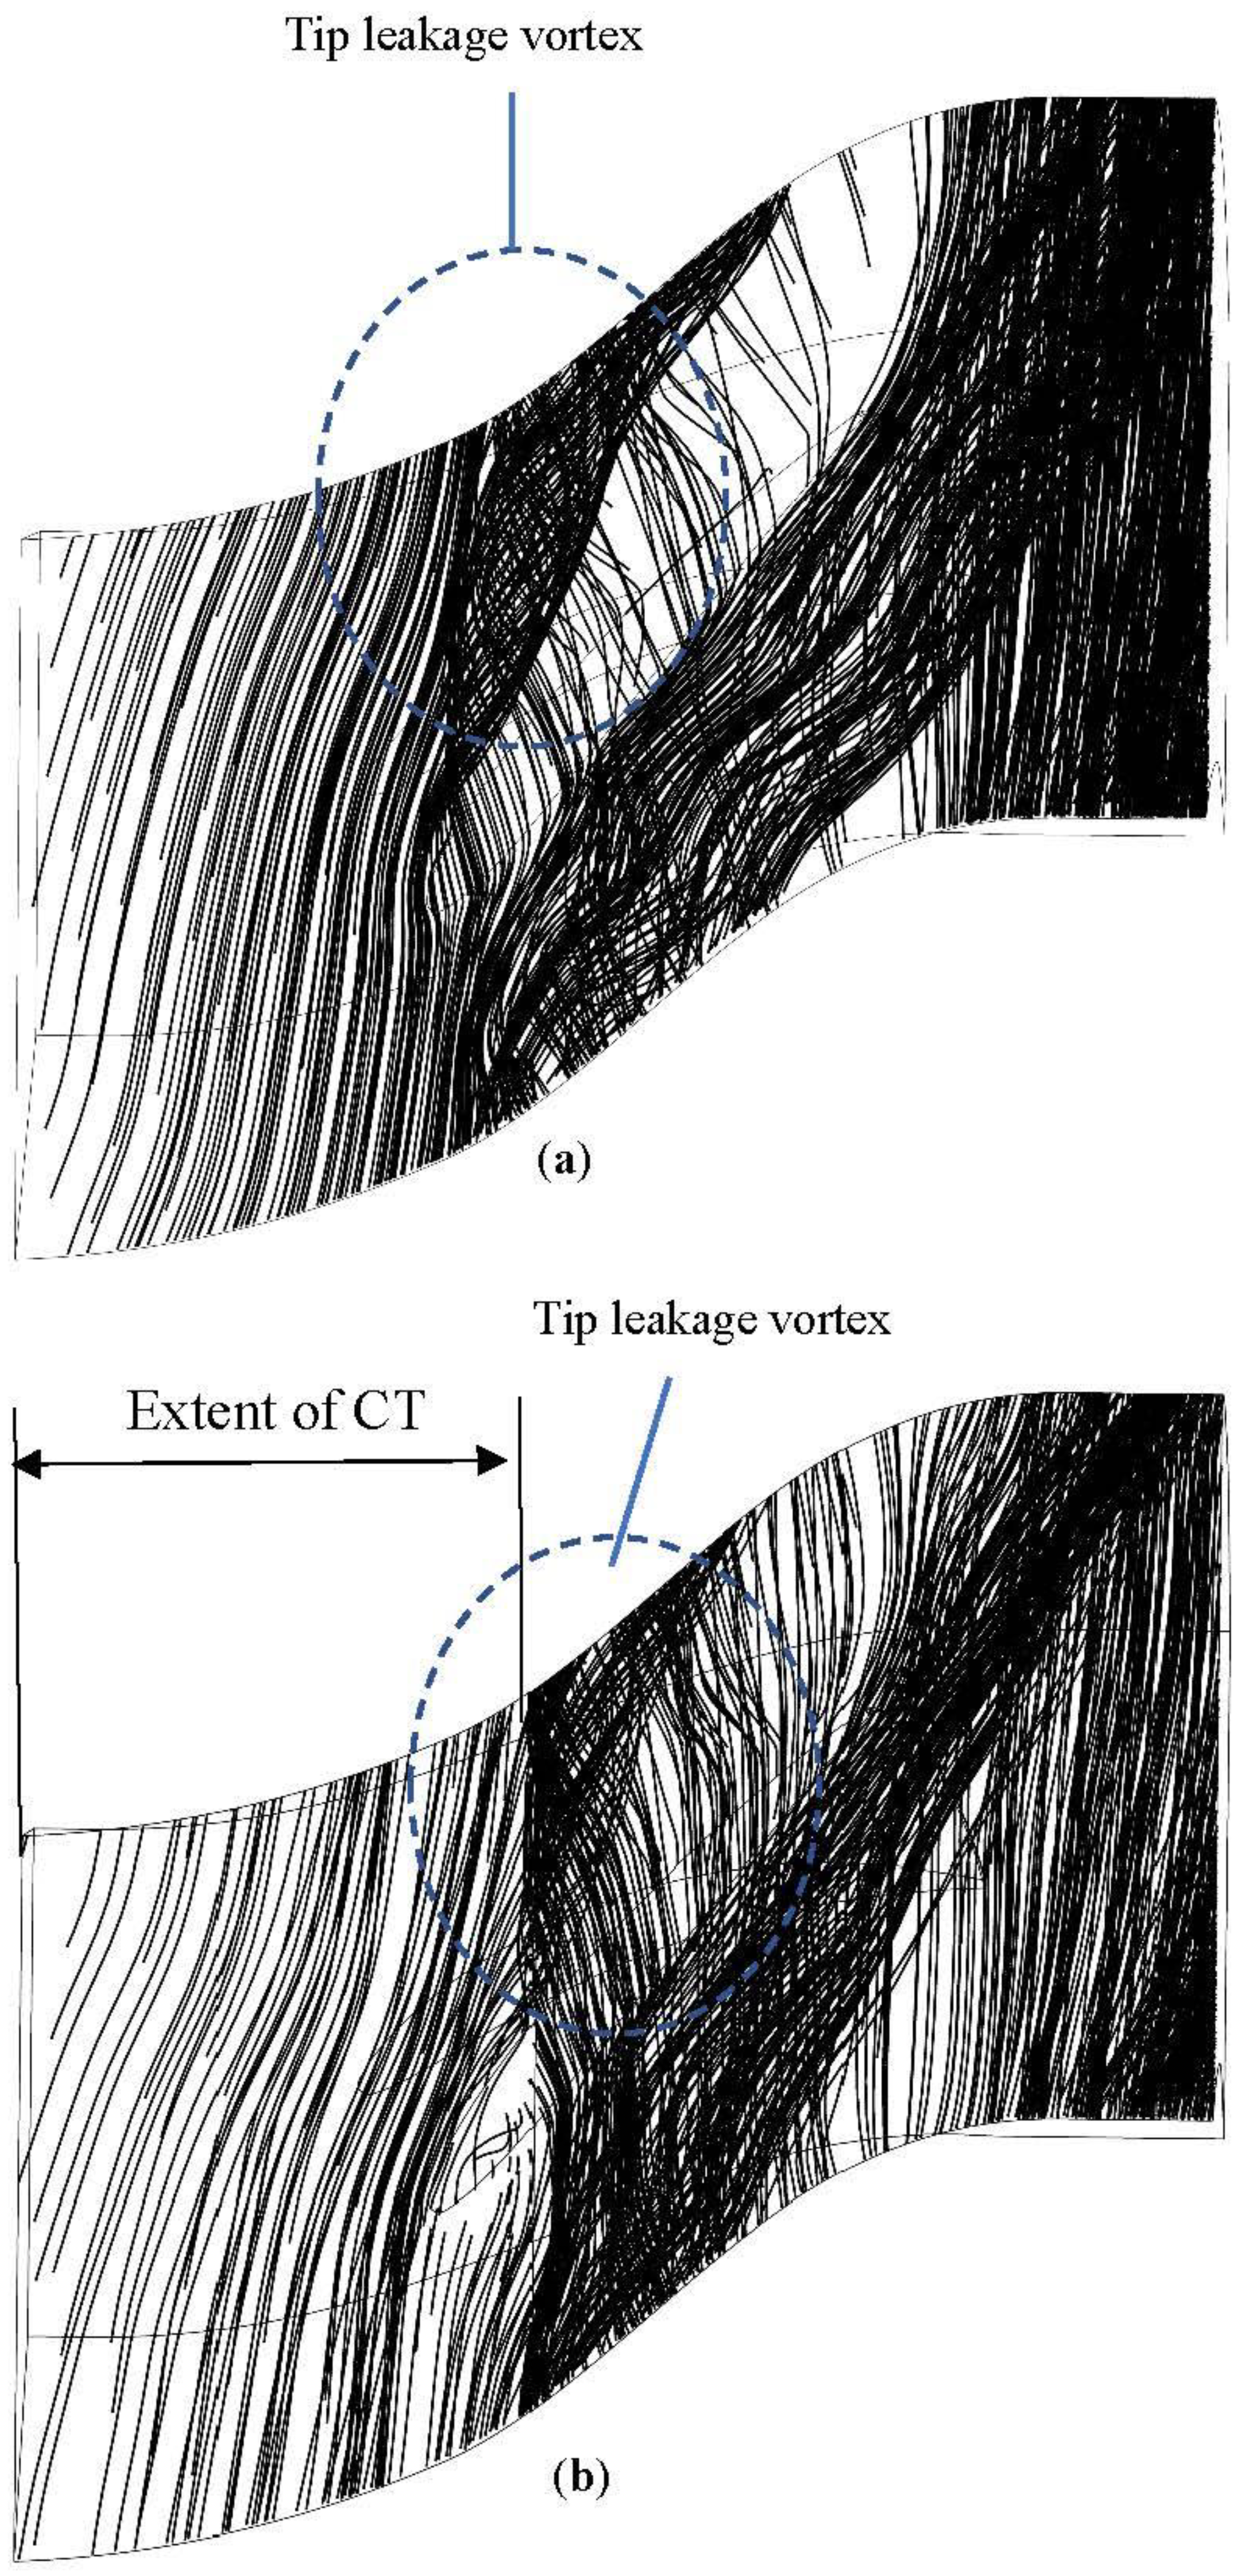
The main function of the casing treatment was found to be to reduce the pressure gradient along the rotor blade and mostly close to the leading edge and, thus, the development of tip leakage vortex, which is responsible for the generation of low axial momentum fluid being reduced and weakened. Furthermore, the casing treatment also moves the tip leakage flow/main flow interface toward the trailing edge and, thus, delays the movement of the interface toward the leading edge, explaining how stability enhancement occurs.
(3)
Both configurations A and B reduce and eliminate reversed flows. However, configuration B with a larger exposure enables extra flow recirculation due to decreasing surface area and, therefore, could be superior to configuration A.
(4)
Both configurations A and B reduce the swirl component of absolute velocity. This may be accompanied by an increase in axial velocity. Moreover, the injected flow to the rotor blade tip has a swirl velocity component contrary to the rotor blade rotation. This gives the injected flow a great swirl velocity component in the relative frame of reference.
(5)
Three major streamlines and fluid trajectories were identified within the vaned recessed casing treatment: global flow recirculation, local vortex flow and half-ellipse flow. The evolutions of the three streamlines showed that the strength of these flow structures amplifies as the mass flow is reduced.

Author Contributions

Conceptualization, M.A. and Y.A.; Formal analysis, Y.A.; Investigation, Y.A.; Methodology, M.A. and Y.A.; Resources, Y.A.; Software, Y.A.; Supervision, M.A. and Y.A.; Validation, M.A. and Y.A.; Writing—original draft, Y.A.; Writing—review & editing, Y.A. All authors have read and agreed to the published version of the manuscript.

Funding

This research received no external funding.

Data Availability Statement

Not applicable.

Conflicts of Interest

The authors declare no conflict of interest.

Nomenclature

CAxialRotor blade tip axial chord
CDRotor blade tip axial chord exposure to the casing treatment
CpSpecific heat at constant pressure (J/kg K)
CTCasing treatment
CTACasing treatment, configuration A
CTBCasing treatment, configuration B
C, W, UAbsolute, relative, blade velocity (m/s)
C ¯ θ Time-averaged absolute swirl (circumferential) velocity component
CzAxial velocity component (m/s)
H Enthalpy (J)
m ˙ Mass flow rate (kg/s)
NSNear stall
PPressure (Pa)
PEPeak efficiency
PRPressure ratio
PSPressure surface
Δ s Specific entropy (J/kg K)
SCSolid casing (no casing treatment)
SSSuction surface
t-stotal condition-static condition
TTemperature (K)
U t Rotor tip tangential velocity (m/s)
V ¯ r Time-averaged radial velocity component (m/s)
V ¯ z Time-averaged axial velocity component (m/s)
W ¯ θ Time-averaged relative swirl (circumferential) velocity component (m/s)
ρ Density (kg/m3)
Φ Mass flow rate (kg/s)
τ Torque (N.m)
ω Angular velocity (1/s)

References

  1. Day, I. Active Suppression of Rotating Stall and Surge in Axial Flow Compressors. ASME J. Turbomach. 1993, 115, 40–47. [Google Scholar] [CrossRef]
  2. Suder, K.L.; Hathaway, M.D.; Thorp, S.A.; Strazisar, A.J.; Bright, M.M. Compressor Stability Enhancement Using Discrete Tip Injection. ASME J. Turbomach. 2001, 123, 14–23. [Google Scholar] [CrossRef]
  3. Strazisar, A.; Bright, M.; Thorp, M.; Culley, S.; Suder, K. Compressor Stall Control Through Endwall Recirculation. In Proceedings of the ASME Turbo Expo 2004: Power for Land, Sea, and Air, Vienna, Austria, 14–17 June 2004. ASME Paper 2004; GT2004-54295. [Google Scholar]
  4. Hathaway, M. Passive Endwall Treatments for Enhancing Stability; NASA Technical Report No. NASA/TM-2007-214409; Glenn Research Center: Cleveland, OH, USA, 2007. [Google Scholar]
  5. Azimine, A.R.; Elder, R.L.; McKenzie, A.B. Application of recess vaned casing treatment to axial flow fans. ASME J. Turbomach. 1990, 112, 145–150. [Google Scholar] [CrossRef]
  6. Ziabasharhagh, M.; McKenzie, A.B.; Elder, R.L. Recess vane passive stall control. In Proceedings of the International Gas Turbine and Aeroangine Congress and Exposition, Cologne, Germany, 1–4 June 1992. ASME Paper 1992; 92-GT-36. [Google Scholar]
  7. Kang, C.S.; McKenzie, A.B.; Elder, R.L. Recessed casing treatment effects on fan performance and flow field. In Proceedings of the ASME 1995 International Gas Turbine and Aeroengine Congress and Exposition, Houston, TX, USA, 5–8 June 1995. ASME Paper 1995; 95-GT-197. [Google Scholar]
  8. Akhlaghi, M.; Elder, R.L.; Ramsden, K.W. Effects of a vane-recessed tubular-passage passive stall control technique on a multistage, low-speed, axial-flow compressor: Results of tests on the first stage with the rear stages removed. In Proceedings of the ASME Turbo Expo 2003, collocated with the 2003 International Joint Power Generation Conference, Atlanta, GA, USA, 16–19 June 2003. ASME Paper 2003; GT2003-38301. [Google Scholar]
  9. Ghila, A.; Tourlidakis, A. Computational analysis of passive stall delay through vaned recess treatment. In Proceedings of the ASME Turbo Expo 2001: Power for Land, Sea, and Air, New Orleans, LA, USA, 4–7 June 2001. ASME Paper 2001; GT-0342. [Google Scholar]
  10. Yelmar, K.; Viswanath, K. Computational analysis of recess vane geometry modification in the casing treatment approach to enhance stall margin in axial flow fans. In Proceedings of the ASME 2013 International Mechanical Engineering Congress and Exposition, San Diego, CA, USA, 15–21 November 2013. ASME Paper 2013; IMECE2013-63096. [Google Scholar]
  11. Corsini, A.; Delibra, G.; Rispoli, F.; Sheard, A.G.; Volponi, D. Investigation on Anti-Stall Ring Aerodynamic Performance in an Axial Flow Fan. In Proceedings of the ASME Turbo Expo 2014: Turbine Technical Conference and Exposition, Düsseldorf, Germany, 16–20 June 2014. ASME Paper 2014; GT2014-25794. [Google Scholar]
  12. Bonanni, T.; Corsini, A.; Delibra, G.; Volponi, D.; Sheard, A.G. Modelling of Axial Fan and Anti-Stall Ring on a Virtual Test Rig for Air Performance Evaluation. In Proceedings of the ASME Turbo Expo 2016: Turbomachinery Technical Conference and Exposition, Seoul, Republic of Korea, 13–17 June 2016. ASME Paper 2016; GT2016-56862. [Google Scholar]
  13. Chen, X.; Chu, W.; Zhang, H.; Li, J.; Lang, J. Numerical investigation of effect of recess vane casing treatments on an axial lift fan performance. In Proceedings of the ASME Turbo Expo 2017: Turbomachinery Technical Conference and Exposition, Charlotte, NC, USA, 26–30 June 2017. ASME Paper 2017; GT2017-63767. [Google Scholar]
  14. Ghila, A.; Tourlidakis, A. Unsteady simulations of recess casing treatment in axial flow fans. In Proceedings of the ASME Turbo Expo 2006: Power for Land, Sea, and Air, Barcelona, Spain, 8–11 May 2006. ASME Paper 2006; GT2006-90388. [Google Scholar]
  15. Chen, X.; Chu, W.; Zhang, H.; Li, X. Numerical study on inlet angle of guide vane in recess vaned casing treatment. Aerosp. Sci. Technol. 2019, 93, 105323. [Google Scholar] [CrossRef]
  16. Akhlaghi, M. Application of a Vane-Recessed Tubular-Passage Casing Treatment to a Multistage Axial-Flow Compressor. Ph.D. Thesis, University of Cranfield, Cranfield, UK, 2001. [Google Scholar]
  17. Zori, L.; Galpin, P.; Campregher, R.; Morales, J.C. Time-transformation simulation of a 1.5 stage transonic compressor. ASME J. Turbomach. 2017, 139, 071001. [Google Scholar] [CrossRef]
  18. Cornelius, C.; Biesinger, T.; Galpin, P.; Braune, A. Experimental and computational analysis of a multistage axial compressor including stall prediction by steady and transient CFD methods. ASME J. Turbomach. 2014, 136, 061013. [Google Scholar] [CrossRef]
  19. Gourdain, N.; Burguburu, S.; Leboeuf, F.; Michon, G.J. Simulation of rotating stall in a whole stage of an axial compressor. Comput. Fluids 2010, 39, 1644–1655. [Google Scholar] [CrossRef]
  20. Akhlaghi, M.; Azizi, Y.; Nouri, N.M. Estimations of compressor stall and surge using passage stall behaviors. Machines 2022, 10, 706. [Google Scholar] [CrossRef]
  21. Vo, H.D.; Tan, C.S.; Greitzer, E.M. Criteria for Spike Initiated Rotating Stall. ASME J. Turbomach. 2008, 130, 011023. [Google Scholar] [CrossRef]
Figure 1. Layout of the experimental test rig.
Aerospace 10 00764 g001
Figure 2. Main regions of the vaned recessed casing treatment.
Aerospace 10 00764 g002
Figure 3. Sketch of casing treatment configurations A and B including 23.2% and 53.5% exposures.
Aerospace 10 00764 g003
Figure 4. Computational flow domain including inlet/IGV/Rotor/Stator/Outlet/Casing treatment.
Aerospace 10 00764 g004
Figure 5. Views of casing treatment: front (A), side (B), down (C), and rotor top (D) grids.
Aerospace 10 00764 g005
Figure 6. Location of the numerical probe for evaluation of local pressure for GIS study.
Aerospace 10 00764 g006
Figure 7. Time histories of pressure at 2.28 kg/s (A) and 1.95 kg/s (B) operating points for SC configuration.
Aerospace 10 00764 g007
Figure 8. Time histories of pressure at 1.95 kg/s (A) and 1.6 kg/s (B) operating points for CT configuration.
Aerospace 10 00764 g008
Figure 9. Overall compressor maps including pressure rise coefficient and isentropic efficiency with respect to the mass flow for SC and CT configurations.
Aerospace 10 00764 g009
Figure 10. Comparison of Mach number contours at 2.28, 1.95 and 1.6 kg/s for configurations SC, A and B: (a) SC-2.28; (b) SC-1.95; (c) CTA-1.95; (d) CTB-1.95; (e) CTA-1.6; (f) CTB-1.6.
Aerospace 10 00764 g010
Figure 11. Comparison of entropy contours at 2.28, 1.95 and 1.6 kg/s for configurations SC, A and B: (a) SC-2.28; (b) SC-1.95; (c) CTA-1.95; (d) CTB-1.95; (e) CTA-1.6; (f) CTB-1.6.
Aerospace 10 00764 g011
Figure 12. Comparison of relative total pressure contours at 2.28, 1.95 and 1.6 kg/s for configurations SC, A and B: (a) SC-2.28; (b) SC-1.95; (c) CTA-1.95; (d) CTB-1.95; (e) CTA-1.6; (f) CTB-1.6.
Aerospace 10 00764 g012
Figure 13. Comparison of the time-averaged and circumferential-averaged normalized axial velocity at 2.28, 1.95 and 1.6 kg/s for configurations SC, A and B.
Aerospace 10 00764 g013
Figure 14. Sketch of the rotor blade tip showing the locations selected for evaluation of velocity components analysis: (1) upstream of the leading edge; (2) leading-edge plane; (3) the mid-space between the leading edge and the trailing edge pressure side; (4) the mid-space between the leading edge and the trailing edge suction side; (5) trailing edge plane.
Aerospace 10 00764 g014
Figure 15. Comparison of velocity triangles at section 1: (a) SC-1.95; (b) CT-1.95; (c) CT-1.6 configurations.
Aerospace 10 00764 g015
Figure 16. Comparison of velocity triangles at section 4: (a) SC-1.95; (b) CT-1.95; (c) CT-1.6 configurations.
Aerospace 10 00764 g016
Figure 17. Comparison of velocity triangles at section 4 at 1.6 kg/s for (a) configuration A; (b) configuration B.
Aerospace 10 00764 g017
Figure 18. Comparison of meridional views of velocity vectors at 1.95 and 1.6 kg/s at the mid-space between two vanes for configurations A and B: (a) CTA-1.95; (b) CTB-1.95; (c) CTA-1.6; (d) CTB-1.6.
Aerospace 10 00764 g018
Figure 19. Comparison of blade-to-blade views of velocity vectors and radial velocity distributions 2 mm above the inner ring at 1.95 kg/s for Configurations A and B: (a) CTA-1.95; (b) CTB-1.95; (c) CTA-1.95; (d) CTB-1.95.
Aerospace 10 00764 g019
Figure 20. Comparison of blade-to-blade views of velocity vectors and radial velocity distributions 7 mm above the inner ring at 1.95 kg/s for Configurations A and B: (a) CTA-1.95; (b) CTB-1.95; (c) CTA-1.95; (d) CTB-1.95.
Aerospace 10 00764 g020
Figure 21. Comparison of blade-to-blade views of velocity vectors and radial velocity distributions 2 mm above the inner ring at 1.6 kg/s for Configurations A and B: (a) CTA-1.6; (b) CTB-1.6; (c) CTA-1.6; (d) CTB-1.6.
Aerospace 10 00764 g021
Figure 22. Comparison of blade-to-blade views of velocity vectors and radial velocity distributions 7 mm above the inner ring at 1.6 kg/s for Configurations A and B: (a) CTA-1.6; (b) CTB-1.6; (c) CTA-1.6; (d) CTB-1.6.
Aerospace 10 00764 g022
Figure 23. Schematic of fluid trajectory in the casing treatment for configurations A and B: (A) Global flow recirculation; (B) local vortex flow; (C) fluid particles that returns to the mainstream immediately.
Aerospace 10 00764 g023
Figure 24. Comparison of flow streamlines near the casing at 1.95 kg/s for Configurations SC, A and B: (a) SC-1.95; (b) CTA-1.95; (c) CTB-1.95.
Aerospace 10 00764 g024aAerospace 10 00764 g024b
Table 1. Design characteristics of the low-speed axial flow compressor.
ParameterValue
Number of IGV blades34
Number of Rotor blades38
Number of Stator blades37
Rotor blade tip diameter405 mm
Rotor blade hub diameter284.4 mm
Tip clearance0.7 mm
Hub-to-tip ratio0.7
Rotor blade chord30.5 mm
Rotor blade aspect ratio2.0
Table 2. Effect of mesh size on local and global parameters.
ParameterValue
Grid typeCoarse-1Coarse-2MediumFine-1Fine-2
Total number of nodes791,7131,101,8032,224,4435,085,83510,565,038
Mass flow =
2.12 kg/s
Pressure (Pa)101,440101,450101,460101,470101,470
Pressure rise
coefficient (t-s)
0.090.090.140.140.14
Pressure ratio
(t-s)
1.0031.0031.0041.0041.004
Mass flow =
1.95 kg/s
Pressure (Pa)101,580101,600101,630101,630101,630
Pressure rise
coefficient (t-s)
0.120.120.160.160.16
Pressure ratio
(t-s)
1.0041.0041.0051.0051.005
Table 3. Comparison of numerical and experimental results for SC configuration.
ParameterExperimentalNumericalError (%)
Mass flow = 2.35 kg/sTotal pressure at inlet101,628101,5950.032
Static pressure at outlet101,981101,8480.130
Total pressure at outlet102,722102,5780.140
Pressure ratio (t-s)1.0031.0020.051
Total pressure at inlet101,556101,5950.038
Mass flow = 2.12 kg/sStatic pressure at outlet102,157102,0010.152
Total pressure at outlet102,777102,6510.122
Pressure ratio (t-s)1.0061.0040.199
Total pressure at inlet101,512101,5950.082
Static pressure at outlet102,206102,1030.101
Mass flow = 1.95 kg/sTotal pressure at outlet102,724102,6190.102
Pressure ratio (t-s)1.0071.0050.199
Table 4. Comparison of numerical and experimental results for CT configuration.
ParameterExperimentalNumericalError (%)
Mass flow = 1.95 kg/sTotal pressure at inlet100,281100,5700.288
Static pressure at outlet100,980101,0960.115
Total pressure at outlet101,479101,6860.204
Pressure ratio (t-s)1.0071.0050.176
Mass flow = 1.6 kg/sTotal pressure at inlet100,293100,5400.246
Static pressure at outlet101,091101,1930.101
Total pressure at outlet101,451101,7340.279
Pressure ratio (t-s)1.0081.0060.149
Table 5. Comparison of velocity components at 1.95 and 1.6 kg/s for SC and configuration A.
ConfigurationSC-1.95CT-1.95CT-1.6
Velocity
Components (m/s)
V ¯ r W ¯ θ V ¯ z V ¯ r W ¯ θ V ¯ z V ¯ r W ¯ θ V ¯ z
Section1−0.24−54.112.7−0.6−58.913.3−2.9−67.79.7
2−1.4−49.46.60.4−58.511.25.1−49.43.4
30.6−14.1−2.20.5−28.80.61.1−10.21.9
40.1−8.2−9.22.1−24.1−7.10.4−6.9−9.2
50.7−13.70.30.6−18.22.90.2−123.4
Table 6. Comparison of inflow and outflow velocity components for configuration A.
ConfigurationCT-1.95CT-1.6
Velocity
Components (m/s)
V ¯ r C ¯ θ V ¯ z V ¯ r C ¯ θ V ¯ z
Inflow of the
casing treatment
1.96.66.76.218.7−0.1
Outflow of the casing treatment−0.8−0.83.6−5.3−6.96.1
Table 9. Comparison of swirl components of the absolute velocity at 1.95 and 1.6 kg/s for configurations SC, A and B.
ConfigurationSC-1.95Configuration A
CT-1.95 CT-1.6
Configuration B
CT-1.95 CT-1.6
Section19.54.6−4.1−1.5−11
214.25.114.10−8.2
349.434.753.317.323.5
455.439.456.623.961.8
549.845.351.637.345.1
Disclaimer/Publisher’s Note: The statements, opinions and data contained in all publications are solely those of the individual author(s) and contributor(s) and not of MDPI and/or the editor(s). MDPI and/or the editor(s) disclaim responsibility for any injury to people or property resulting from any ideas, methods, instructions or products referred to in the content.

