Article

A Three-Dimensional Body Force Modeling of Fans in Windmilling Condition and Its Application

1
Sino-European Institute of Aviation Engineering, Civil Aviation University of China, Tianjin 300300, China
2
College of Safety Science and Engineering, Civil Aviation University of China, Tianjin 300300, China
*
Author to whom correspondence should be addressed.
Aerospace 2023, 10(8), 724; https://doi.org/10.3390/aerospace10080724
Submission received: 20 July 2023 / Revised: 11 August 2023 / Accepted: 16 August 2023 / Published: 18 August 2023

Abstract

:
To investigate the aerodynamic characteristics of the fan in windmilling conditions, a new body force model with the fan rotational speed prediction model was developed. The fan rotational speed prediction model was built based on the balance of fan output torque and resistance torque. The rotational speed of the fan spool can be iteratively solved simultaneously with solving the governing equations without requiring mass flow rate or other inputs. The comparison with the experimental results shows that using the body force model can accurately predict the rotational speed of the fan spool under different operating conditions. The radial distribution of flow parameters can be obtained. Moreover, numerical simulations of the fan under different circumferential total pressure distortion inflow conditions were conducted using the body force model. The results show that, unlike the design point and non-design point at which the fan operates normally, the high radius region of the fan is in the “turbine mode” while the low radius region is in the “compressor mode” under windmilling conditions. The different effects on the longitudinal vortex in the two regions deepen and alleviate the circumferential distortion, respectively. There are strong circumferential and radial pressure gradients at the junction of the distortion-affected zone and the non-distortion-affected zone, adding additional mixing losses.

1. Introduction

When an aircraft engine stops in the air or the combustion chamber flames out, the airflow passes through the unlit engine, and the spool is driven by the combined action of aerodynamic force, rotor inertia, and resistance torque. This sub-stable rotating state that stabilizes at a certain speed for a short period of time is called the “windmilling condition” [1]. It is very important to determine the key performance parameters of the fan windmilling during the design phase. On the one hand, the resistance characteristics of the engine in a windmilling condition will affect the design of the aircraft’s vertical stabilizer; On the other hand, the airflow rate, combustion chamber pressure, and temperature are directly related to each other in the windmilling condition, and these three parameters are important parameters for determining the ignition envelope of the engine in the air [2].
Numerical simulation is a feasible way to obtain aerodynamic characteristics of fan windmills. Gunn and Hall [3] conducted a study on a low-speed fan and a transonic fan and analyzed in detail the phenomenon of flow separation and blockage inside the rotor under windmilling conditions. Zachos [2] established a prediction model for the aerodynamic parameters and drag of a turbofan engine in a windmill state based on theoretical derivation and experiments. Prasad. [4] analyzed the numerical simulation results of a fan stage. The aerodynamic similarity of the flow parameters was examined, then an asymptotic model was developed to predict the self-similar flow field downstream of the rotor. In addition, scholars have used numerical simulation methods such as unsteady simulation [5,6,7] and detached eddy simulation [8] to study the flow details in the fan channel under windmill conditions.
Research on windmilling conditions in the past mainly focuses on the flow patterns and loss characteristics inside channels under uniform inflow conditions without considering more complex or dangerous operating conditions. For example, when encountering a crosswind, the status of windmilling fan under distorted inflow conditions may differ from that under uniform inflow conditions. Also, for the distributed propulsion system, because the transverse distance between fans is very short, the interaction between fans is significantly enhanced [9]. At the same time, the fans may also be sucked into the boundary layer of the fuselage [10,11]. The superposition effect of the two may deepen the inlet distortion of adjacent fans. And it will decline the surge margin of adjacent fans or even make it stall. A secondary failure could occur at this time. These issues are worthy of further detailed analysis and in-depth research.
However, conducting full three-dimensional numerical simulations with multiple fans under many different operating conditions will consume enormous computational resources. Thus, it is necessary to introduce some models to simplify the calculations to meet engineering needs. The actuator disk model is one of the feasible methods. It simplifies the blades into an infinitely thin disk. A sudden change in pressure will be introduced when the fluid passes through. The model is used to simulate the pressurization process of the compressor. Scholars [9,12,13] have applied it to the research of distributed propulsion systems. However, concentrating the effect of the blade row on the fluid on a plate without thickness cannot depict the complex flow field in the blade channel, which reduces the accuracy of the results.
Another feasible way is using the body force model. The body force model assumes that there are infinitely many, infinitely thin, and axially symmetric blades in the channel of the blade row area. The force exerted by the blades on the airflow is replaced by a uniformly distributed force field along the circumference. The body force is added as a source term to the Euler or Navier–Stokes equations to solve the flow field. Gong decomposed the force acting on the blades into body force terms perpendicular to and parallel to the airflow direction and established a body force model by analyzing the flow parameters in the channel [14]. This model cleverly takes the overall force exerted by the blades on the airflow as the source term. And the source term is applied to all blade areas through circumferential averaging. Defoe et al. [15] numerically studied the generation and upstream propagation of noise in engines under distortion conditions based on the Gong model, where a time-averaged body force source term is used to replace the fan blade. Kim et al. [16] implemented a numerical simulation of the entire N3-X hybrid wing-body concept aircraft based on the Gong model. Xu [17] developed a viscous body force model. The friction coefficient of the blade surface is extracted from the single-channel RANS calculation results. The viscous forces generated by the blade are treated as source terms in the modified Euler Equations. He successfully simulated the unsteady phenomenon of the distorted flow field of turbomachinery. Hall et al. [18] proposed a body force model based on the lift drag coefficient of isolated airfoils. The model is not based on numerical simulation or experimental results, and it is applied to conduct numerical simulation research on boundary layer ingestion (BLI) fans. In recent years, scholars [19,20,21,22] have further developed such models for performance research of distributed propulsion systems and aerodynamic design of ducted fans.
In general, the above body force models are all applied for normally operating turbomachines. The fan rotational speed needs to be controllable and treated as a known parameter. However, the rotational speed of the fan in the windmilling condition is unknown, so the above body force model cannot be used to simulate the windmilling fan. Thus, to begin with, a fan speed prediction model is developed using the variation law of the resistance torque of the fan rotor. Then, by combining the relationship between aerodynamic force and flow parameters in the fan windmilling conditions, a new body force model is built and validated. On this basis, a numerical simulation of the windmilling conditions under circumferential total pressure distortion was carried out. The characteristics of the distorted flow field inside the fan under windmilling conditions were analyzed with the help of the new body force model.

2. Body Force Modeling of Fan under Windmilling Conditions

The quantitative relationship between the body force terms between the variation of velocity circulation and entropy increase was established. Based on the characteristics of the windmilling conditions, a new rotational speed prediction model of the spool was developed, and then the body force model was built.

2.1. Three-Dimensional Body Force Modeling of Fan

By solving the Euler equation in the cylindrical coordinate system of the fan channel [23], the forces exerted by the blades on the airflow are added as the source term to the equations, namely:
Φ = Φ r Φ θ Φ x
The body force can be decomposed into viscous force f parallel to the flow direction and inviscid force F perpendicular to the flow direction. The viscous force characterizes the flow loss in the flow path, with the direction opposite to the flow direction, i.e.,:
Φ = F + f
f r , f θ , f x = f W r , W θ , W x W
F W = 0
where W is the relative velocity. Using the momentum equation of θ direction, the relationship between tangential body force and velocity circulation can be obtained. Further, the relationship between entropy increase along streamlines and viscous body force can be obtained from the First law of thermodynamics, namely:
Φ θ = ρ V m r r V θ m
f = T V m W s m
Once obtaining the radial distribution of velocity circulation variation and entropy increase along the streamline, by substituting Equations (5) and (6), the magnitude of tangential and inviscid body force terms can be deduced.
Research shows that for different operating points of the windmilling conditions, the values of r V θ / m and s / m also vary. However, the radial distribution of velocity circulation variation and entropy increase still has similarities [4]. Therefore, the method proposed in reference [23,24] can be used to obtain the velocity circulation variation and entropy increase distribution at different operating points, namely:
r V θ m = κ t m ˙ cor , n cor r V θ m ref
s m = κ s m ˙ cor , n cor s m ref
where κ t and κ s are correction factors that could be obtained by numerical simulation.

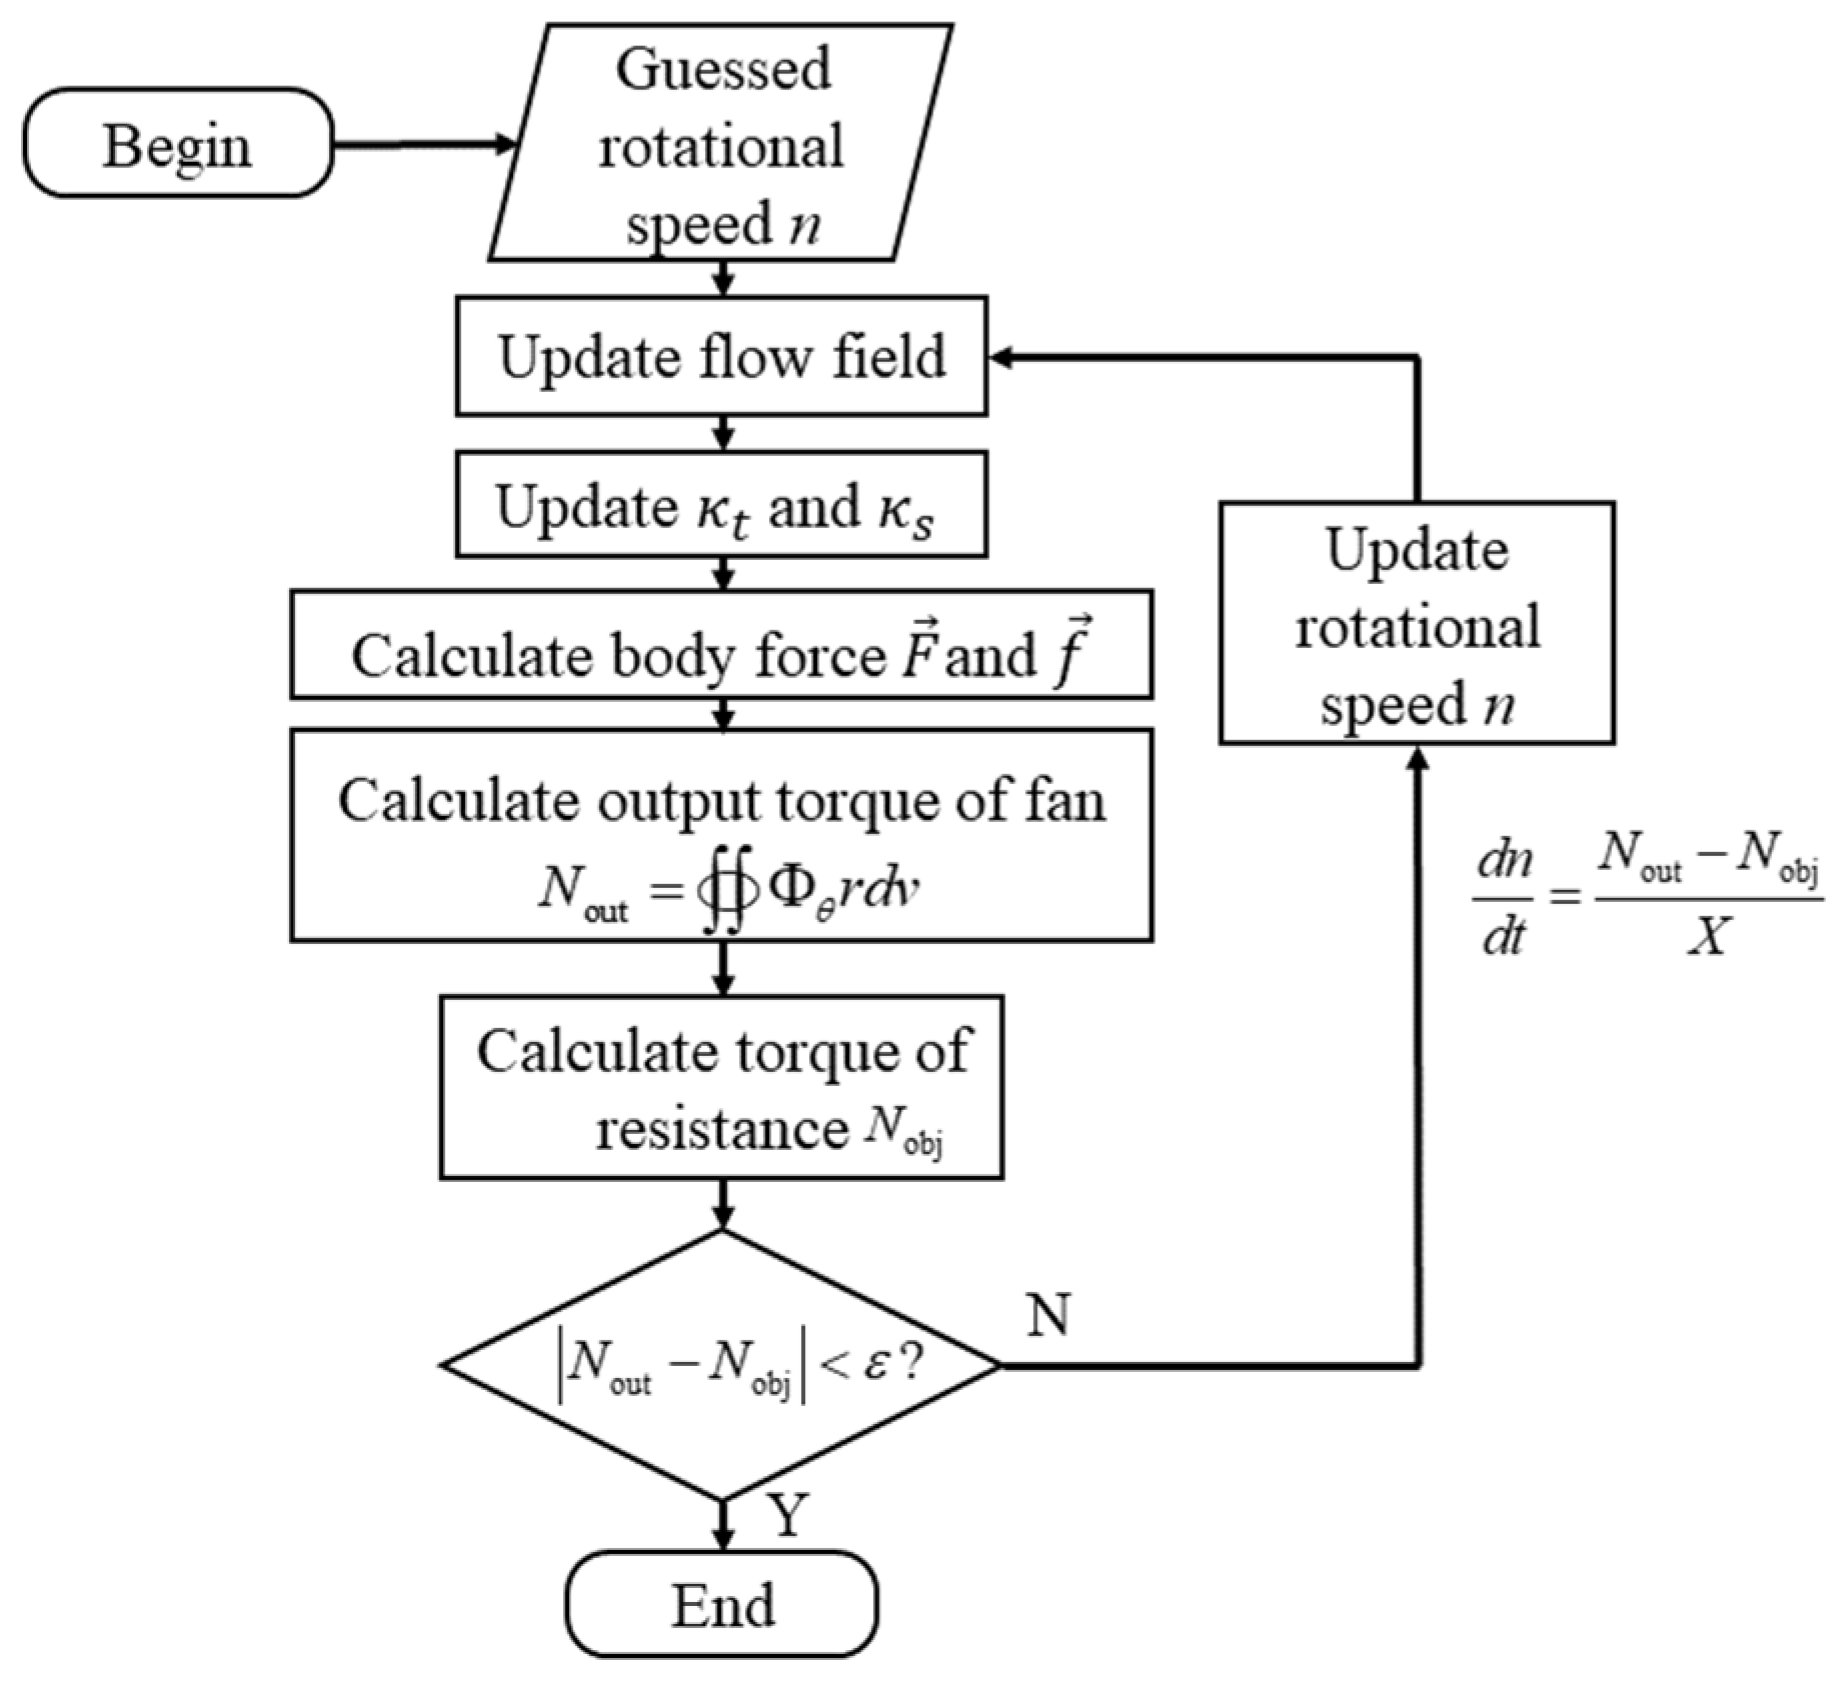
2.2. Rotational Speed Prediction Model of Fan Spool

For a normal operating fan, the rotational speed is a known quantity. Given the rotational speed and the boundary conditions at the inlet and outlet, a body force model can be used for the numerical simulation of the flow field. However, for the windmilling condition, the fan operates under the ram air, so its rotational speed is determined by the inlet and outlet boundary conditions, as well as the characteristics of the components. Therefore, to establish a body force model for the fan operating under windmilling conditions, a fan rotational speed prediction model needs to be established above all. Previous experimental results [3,25,26] have shown that the rotational speed of the fan in the windmilling condition is directly proportional to the corrected mass flow rate at the fan inlet. Reference [25] established a rotational speed prediction model based on the “zero work” assumption, but this model requires the fan inlet air flow rate as input. In fact, it is practically impossible to obtain the air mass flow rate first. Additionally, when there is distortion at the fan inlet, the accuracy of the model is downgraded. For example, when there is a low total pressure zone in a certain sector of the fan inlet, the flow conditions of the fan blades passing through the non-distorted and distorted regions are different, and the “local” corrected mass flow rate of different sectors is also different. However, it is obvious that the fan can only operate at one rotational speed. It is necessary to establish a rotational speed prediction model that does not rely on the airflow rate or other flow parameters as input.
In the windmilling condition, the work output by the fan blades is mainly used to overcome the resistance of the spool rotation. The resistance torque of the rotor varies at different rotational speeds, so it can be considered to use the torque balance relationship to establish the rotational speed prediction model. According to the literature [27,28], in windmilling conditions, the resistance torque of the fan spool mainly comes from aerodynamic resistance and frictional resistance. The aerodynamic resistance torque increases with the increase of rotational speed, roughly satisfying the following relationship:
M = A n 2
where M is the aerodynamic resistance torque, n is the rotational speed, and A is the coefficient related to the specific model of the components. The frictional resistance torque gradually decreases with the increase in rotational speed. It basically does not change with the change of rotational speed when the rotational speed exceeds a certain critical value. Therefore, through numerical simulation, the resistance torque N obj that the fan needs to overcome to maintain a certain rotational speed can be obtained.
When using the body force model for calculation, the output torque N out of the fan can be obtained by integrating the tangential blade force, namely:
N out = Φ θ r d v
where r is the local radius, and dv is the volume of a gird element. When N out < N obj , the output torque of the fan is less than the resistance torque that should be overcome to maintain the rotational speed and the rotational speed of the fan will decrease; on the contrary, the fan will accelerate. That is:
d n d t = N out N obj X
where X is the moment of inertia of the fan spool. Thus, the rotational speed of the fan spool can be iteratively solved simultaneously with solving the flow field. Firstly, an initial guessed rotational speed is given. Then, N obj and N out can be calculated for the current step, and the updated rotational speed is calculated through formula (11) for the next pseudo-time-step. When the difference between N obj and N out is small enough, the rotational speed will not change. So far, the body force modeling of the fan under windmilling conditions has been completed.

2.3. Numerical Simulation Method Based on the Body Force Model of Windmilling Condition

To summarize, the numerical simulation method based on the body force model of windmilling conditions is shown in Figure 1. Firstly, numerical simulation is used to obtain the radial distribution of the velocity circulation variation and entropy increase rate of the fan at the reference point of the windmilling condition, as well as the correction factors are also calibrated. To begin the iteration, an initial guessed rotational speed should be provided to update the flow field and correction factors. Then, the body force terms and the net output torque by the fan could be calculated. Comparing it with the resistance torque at the initial guessed rotational speed, the rotational speed will be updated. When the difference between the resistance torque and fan output torque is small enough, the calculation converges.

3. Implementation and Verification of the Body Force Model

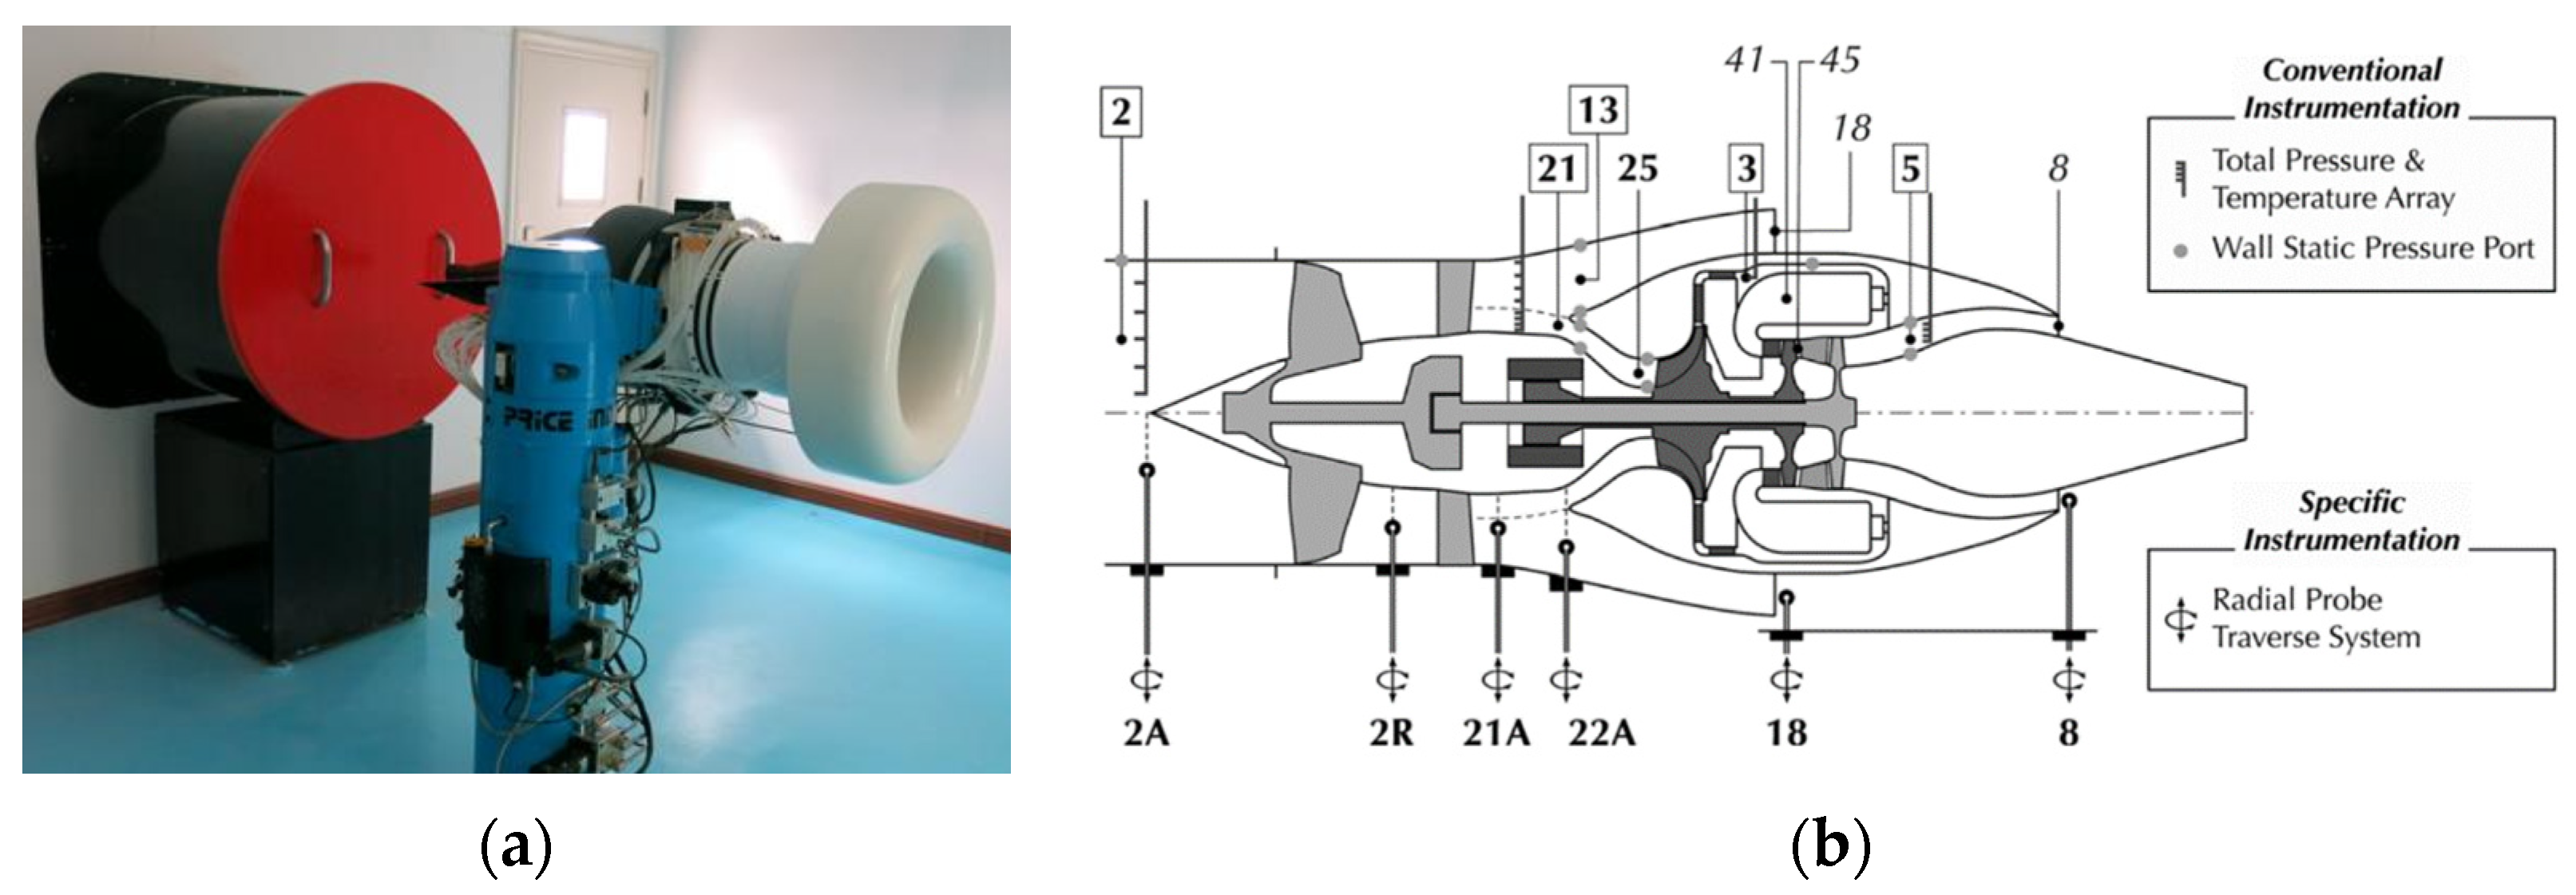
3.1. Data Extraction

To test and verify the body force model, the windmilling conditions of a fan of the DGEN380 engine are studied, as shown in Figure 2a. The DGEN380 engine is a small turbofan engine with a high bypass ratio designed and manufactured by Price Induction company. The maximum thrust of the engine is around 250 daN. It is a well-designed geared turbofan engine with a bypass ratio reaches 7.6. Figure 2b shows the architecture of the engine and the sensors’ locations. As for the measurement of flow parameters at fan inlet and outlet plane, namely “2A” and “2R” stations, radial rakes were installed and azimuthally distributed. Total pressure and temperature were measured by the acquisition system. The data were acquired at a sampling frequency of 10 Hz. The five-hole probes are used for total pressure measurement, with 0–10 kPa relative pressure transducer accurate to 0.2% full scale at a 95% uncertainty interval. Rosa et al. [29] and Dufour et al. [5] conducted experimental and unsteady numerical simulation studies on the fan windmilling conditions of the DGEN380 engine, respectively, which can provide a reference basis for the work of this article.
To obtain the parameters required to calculate the body force terms, a RANS simulation was conducted for the windmilling conditions of the fan. The computational domain of the fan rotor is established, as shown in Figure 3. To eliminate the influence of boundaries on the accuracy of the results, an inviscid inlet section is added at the rotor inlet. The 4H-O topology is used to generate the hexahedron structured grid. The grid independence check is performed with a set of mesh with 410,000, 550,000, 720,000, and 960,000 girds. The calculated mass flow rate with an inlet Mach number of 0.16 is compared in Figure 4a. Finally, the total number of single passage grids of approximately 720,000 is chosen. The grid has 69 grid nodes spanwise and 17 grid nodes in the tip clearance. The distance between the first layer of the grid on the wall is 0.003 mm, ensuring that the value of y+ near the wall is around 1. The schematic of the computational mesh is shown in Figure 4b.
The boundary condition parameters at the inlet, i.e., the total temperature, total pressure, and velocity direction, as well as the rotational speed of the fan spool, were set to refer to the experimental conditions in reference [29]. By adjusting the average static pressure at the outlet of the computational domain, the Mach number at the fan inlet is kept consistent with the experiment. The walls of the extended inlet section are set as a free-slip wall, while the other walls are set as non-slip walls. The Model selection is SST turbulence model was chosen as it performs better when dealing with separation flow under an adverse pressure gradient.
Figure 5 shows the radial distribution of the total pressure ratio and outlet Mach number of the fan under operating conditions in the windmill state with different inlet Mach numbers (Ma = 0.08 and Ma = 0.16). The axial position of the fan outlet section is shown in Figure 2b as “2R”, which is consistent with the experiment [29]. The radial distribution pattern of fan outlet parameters is basically consistent with experimental results under different inlet Mach numbers. In the area above 40% span, the total pressure ratio is less than 1, which indicates that the fan in this area is working in “turbine state”. The total pressure ratio below 40% span is greater than 1, indicating that the fan in this area is in “compressor state”. It is consistent with the experimental results. There are certain differences in the area above 80% height, which may be due to the intrusion of the probe reducing the measurement accuracy near the tip, as mentioned in reference [25]. Figure 6 shows the contour of the Mach number of the S1 surface at 90% span. The numerical result herein is in good agreement with the simulation results in reference [7], which improves the credibility of the results. Overall, the numerical simulation results are reliable and can be used to extract the relevant parameters required for body force modeling.
Five operating points under windmilling condition with averaged inlet Mach numbers of 0.08, 0.10, 0.12, 0.14, and 0.16 were selected for numerical simulation to extract the parameters required for body force modeling. The rotational speed of the fan spool is set according to the experimental results given in reference [29], and boundary conditions at the inlet of the calculation domain are given with the inlet total temperature, total pressure, and speed direction. By adjusting the averaged static pressure at the outlet, the inlet Mach number is consistent with the experimental conditions.
Figure 7 shows the variation of the circumferential averaged velocity circulation variation Δ(rVθ), and entropy increase Δs of the fan under different operating conditions. The velocity circulation variation is directly proportional to the change in enthalpy. Its positive and negative values represent the working state of the fan blades. The change in circulation in the 40–90% span area is less than zero, indicating a decrease in the enthalpy of the fluid in this area. The fan in this area is operating in a “turbine state”. The change in velocity circulation in the area below 40% span is greater than zero, indicating an increase in the enthalpy of the fluid in this area, which means that the fans in this area are in a “compressor state”. Higher than 90% height area, there is a positive circulation. The flow over the pressure surface is severely separated due to the large negative attack angle of the incoming flow in this area, which is consistent with Figure 6. The interaction with the secondary flow in the end zone, such as blade tip leakage flow, causes the relative airflow angle in this area to deviate significantly from the design point, causing significant flow losses. This phenomenon can also be corroborated by the radial distribution of entropy increase, with a significant increase in entropy in areas above 90% height, indicating significant flow losses in this area. From the distribution of velocity circulation variation and entropy increase under different conditions, the radial distribution of the two is similar under different operating conditions. Therefore, the method proposed in reference [23] can be used to treat non-reference points by multiplying the correction factors by the radial distribution of the reference point. The working condition with Ma = 0.08 was treated as the reference point, and the correction factors of κt and κs were calibrated by comparing them with the reference point.
The relationship between the rotational speed of the fan spool and resistance torque under different operating conditions was obtained using numerical simulation results, as shown in Figure 8. The relationship between resistance torque and rotational speed basically meets the quadratic function. It is consistent with the change rule of engine resistance torque mentioned in the literature [27,28]. Using the wind turbine speed prediction model proposed in this article to simulate the windmilling conditions based on the body force model can overcome the problem of requiring a known airflow rate in reference [25], and the working pattern of fan spool under distorted conditions can be predicted with the help of the new body force model.

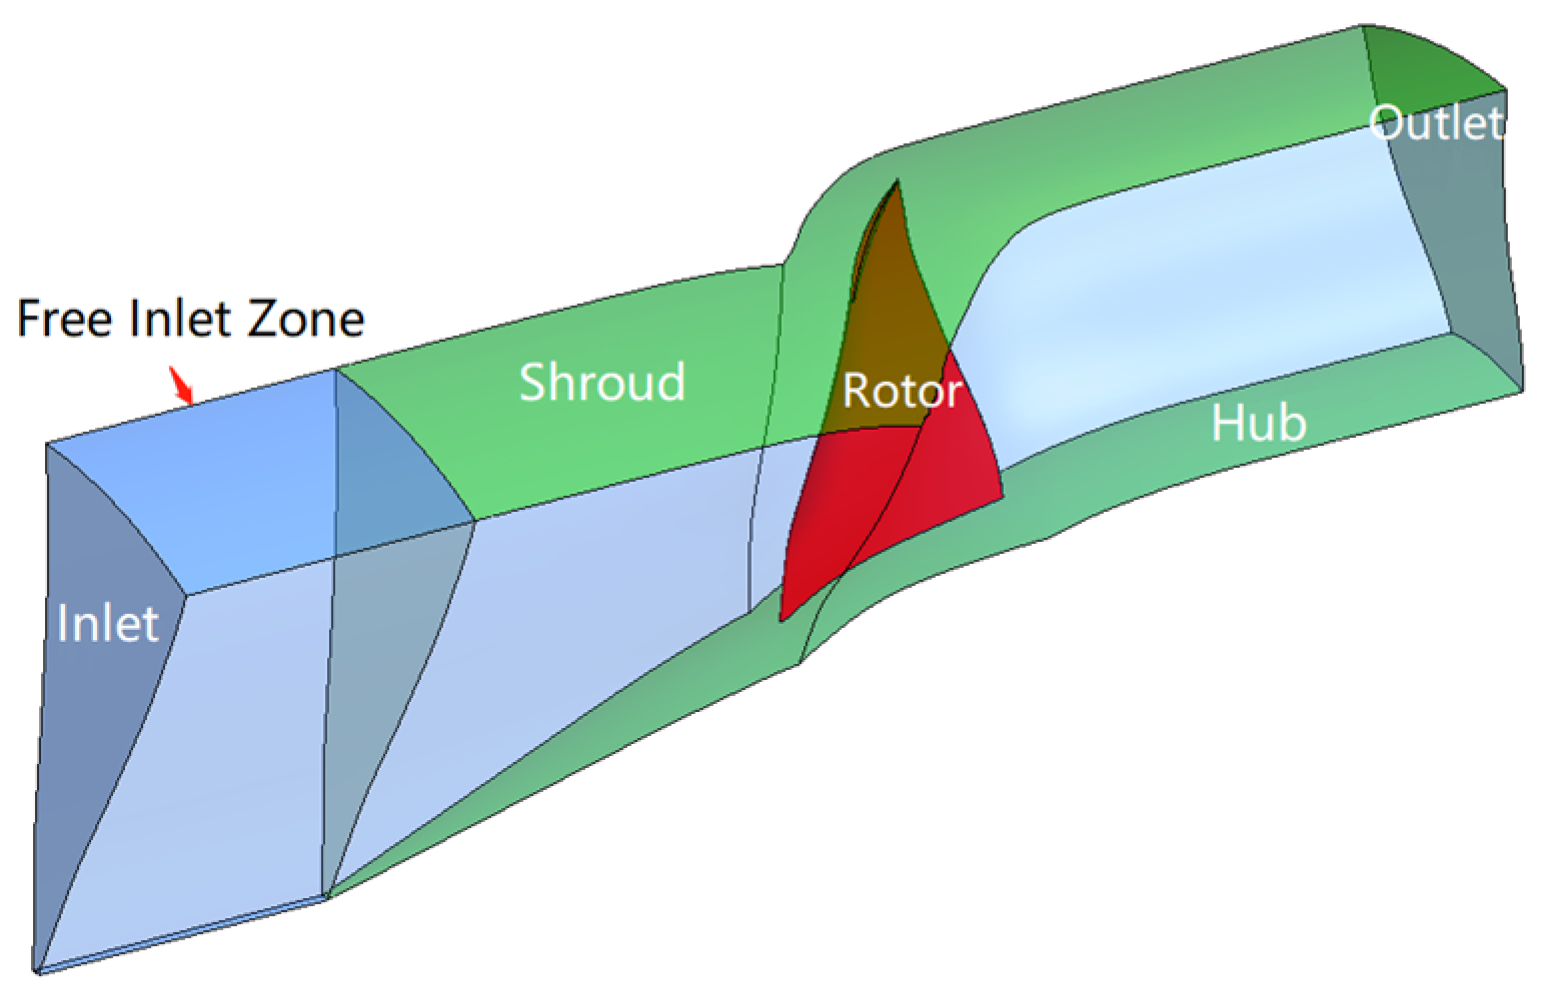
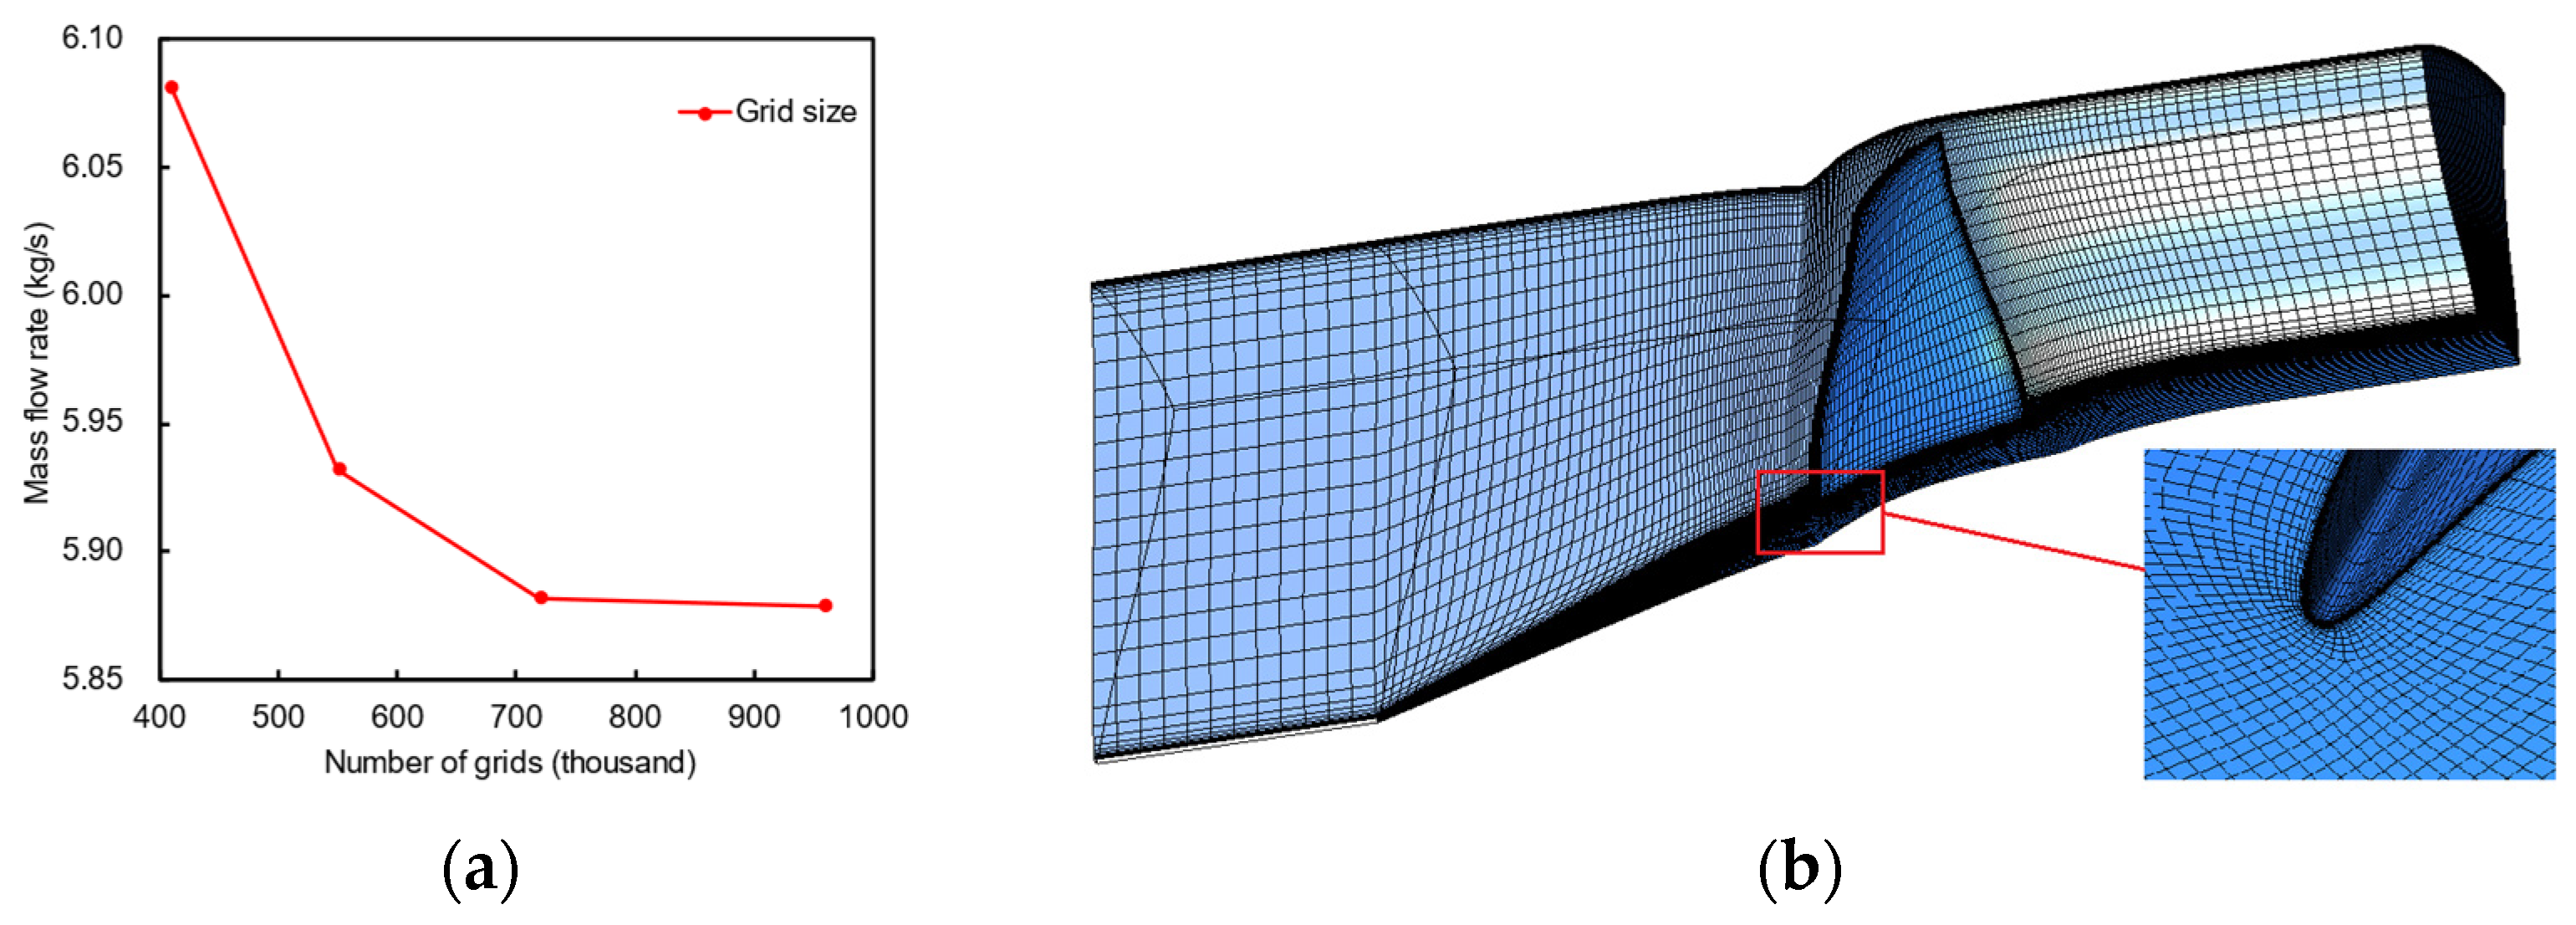
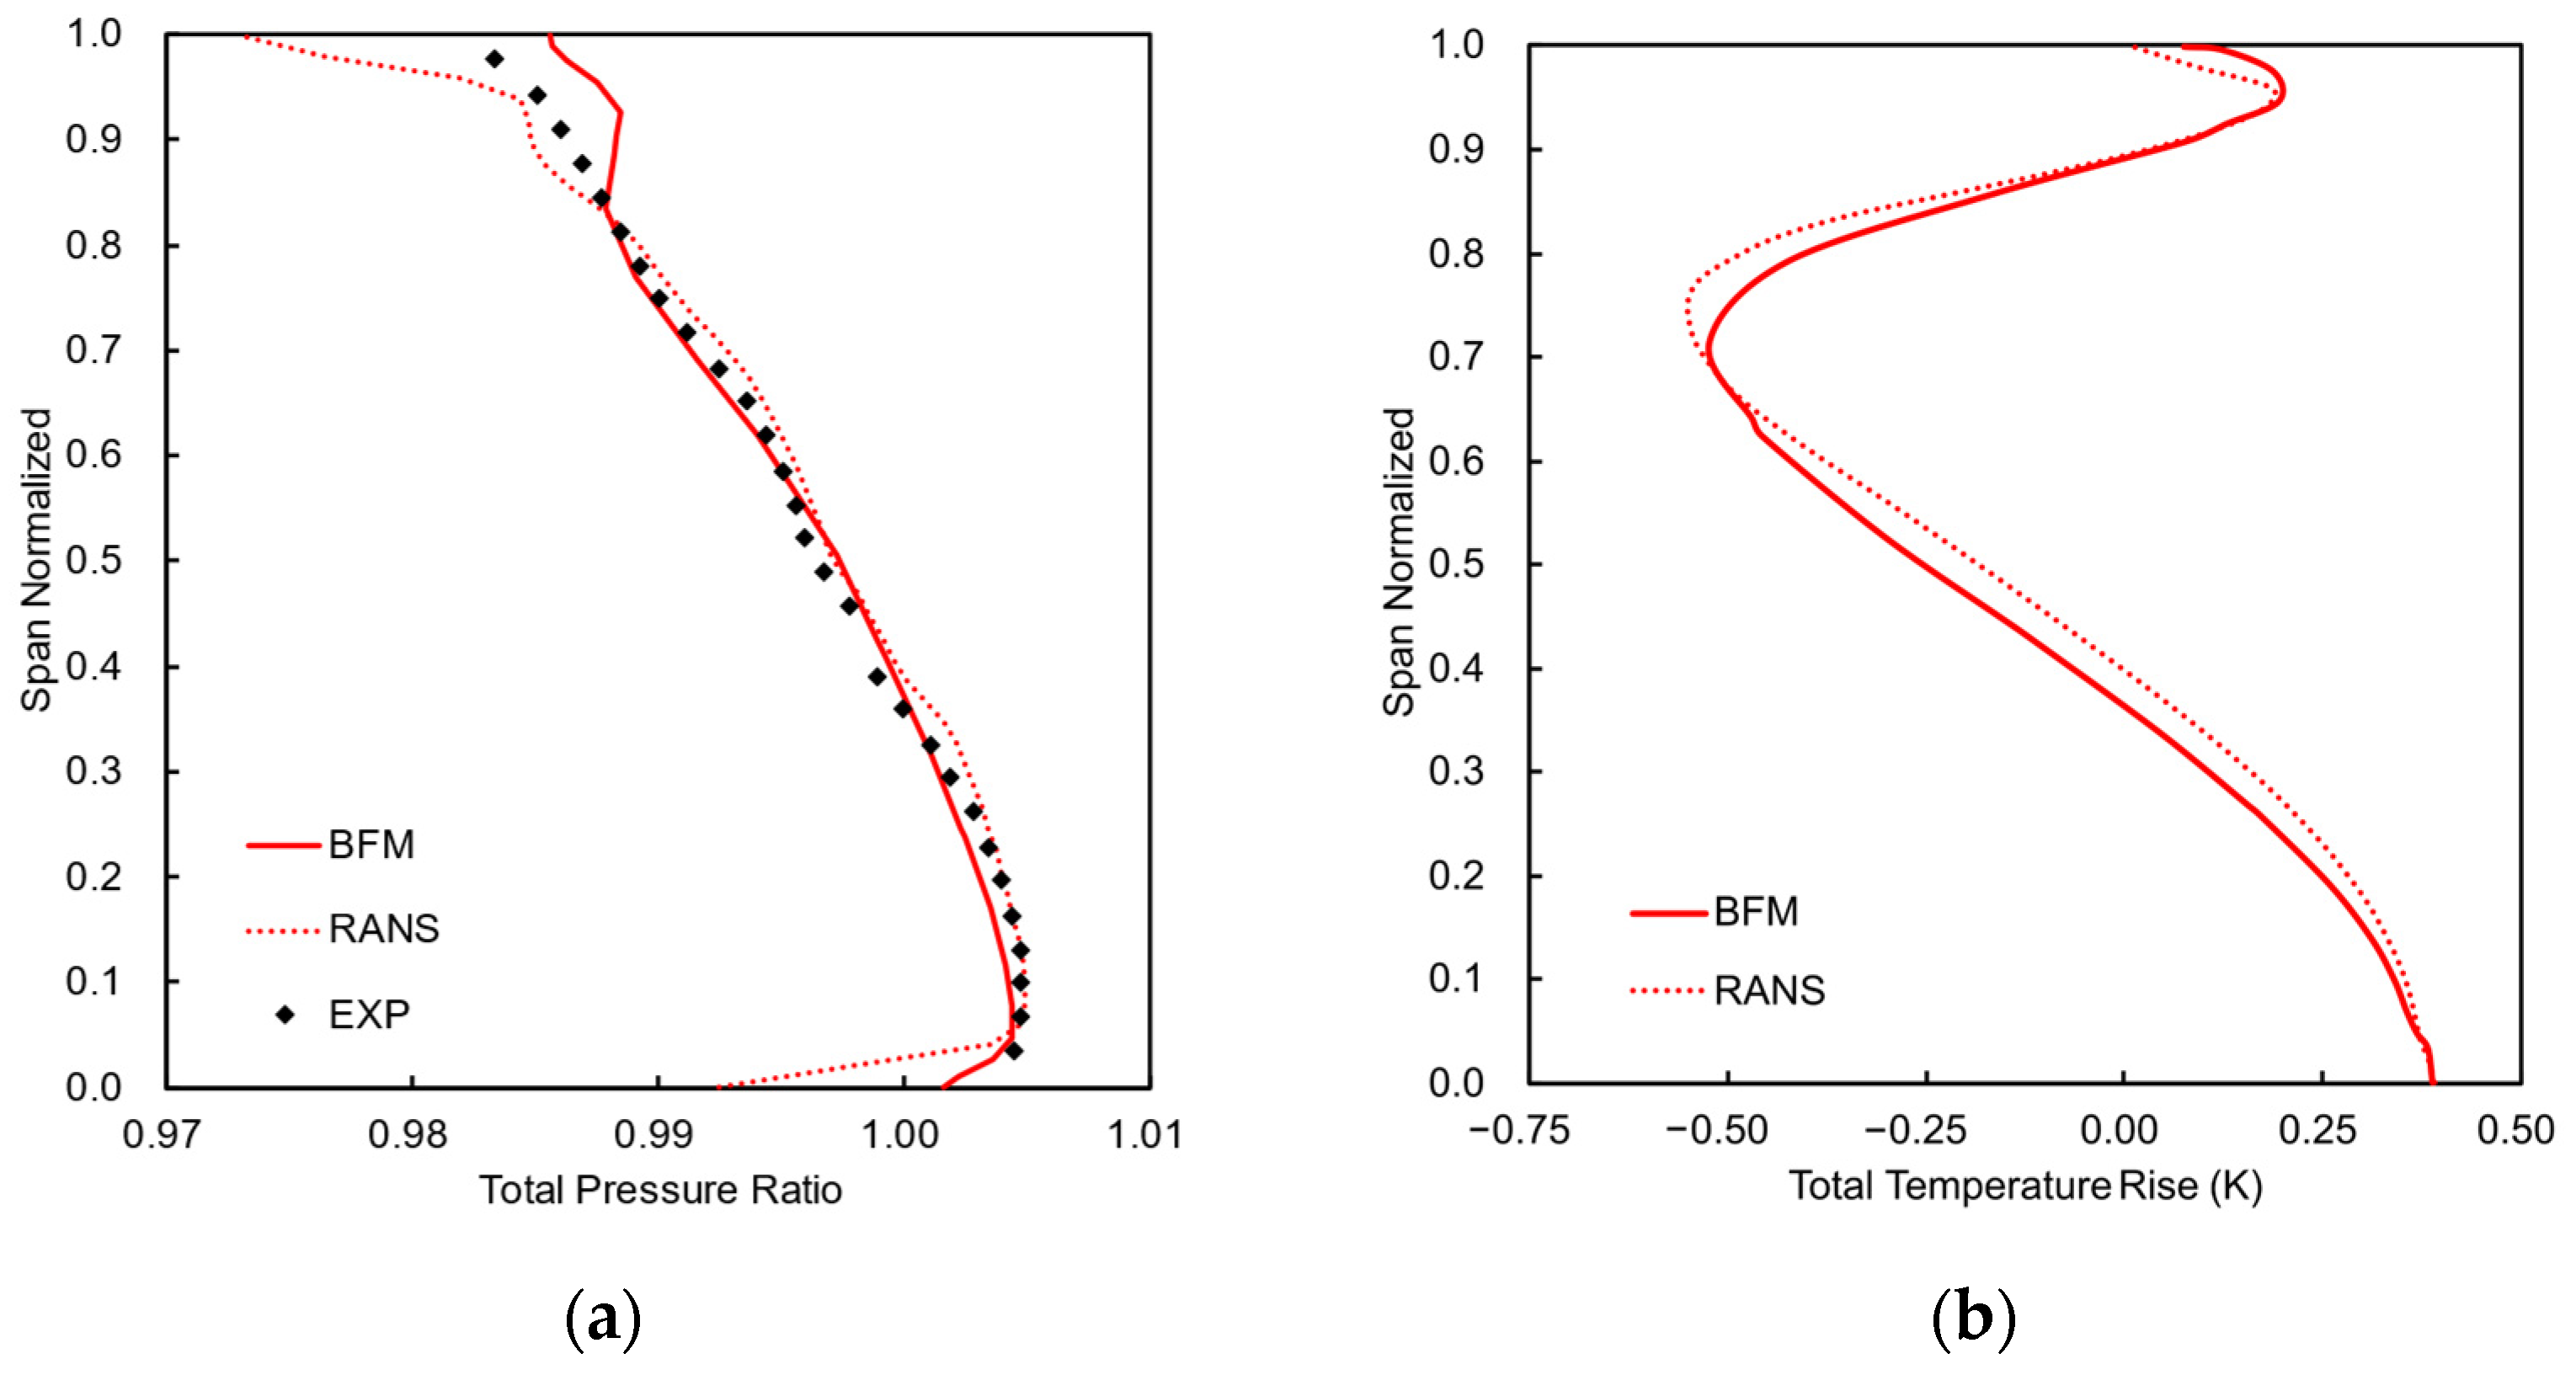
3.2. Numerical Simulation of Fan Windmilling Condition

The three-dimensional steady Euler equations were solved with the help of commercial software ANSYS Fluent. The fan under windmilling condition was treated as duct flow using the body force model. To apply the body force terms to the airflow, the user-defined function (UDF) was used. The body force terms were added as the source term of the equations and participated in the iteration. Due to the circumferential uniformity of the grid used to solve the flow in the fan duct, the blockage effect of the presence of blades on the flow cannot be considered. Research [30,31,32] has shown that disregarding the blockage effect of blades can have a certain impact on the accuracy of calculation results, especially for near-chocking conditions. Therefore, this article introduces the blockage coefficient b was introduced for considering the circumferential thickness of the blade during calculation, which can be calculated as follows:
b = 1 θ suc θ pre K / 2 π
where θsuc and θpre are the circumferential coordinates of the points on the suction and pressure surfaces of the blades, respectively, with the same axial and radial coordinate. K is the total number of blades. The blockage coefficient was added to the equations as the source terms with the following form:
S b = [ S 0      S 0 V r      S 0 V θ      S 0 V x      S 0 H ]
where S 0 = ρ V b / b . Due to the addition of source terms to the conservation equation, it is necessary to preprocess the blockage coefficient during simulation to ensure the conservation of mass through the fan.
Figure 9 is a computational grid used for a solver with the body force model. The hexahedron structured grid is adopted, 90 grids are evenly arranged in the circumferential direction, and 30 grids are arranged in the radial direction. The grid points were well clustered near the hub and casing wall. The entire computational domain was divided into three regions: inlet, blade, and outlet, with axial grid numbers of 44, 30, and 44, respectively. The verification of mesh independence is performed, and a total grid number of approximately 320,000 is chosen. Convergence is considered when the residuals of all equations are less than 10−3 and the variation of the rotational speed of below 1%. The number of fan blades for the DGEN380 engine is 14, and compared to the full annulus RANS calculation, the grid size based on the body force model is only about 1/30.
The comparison between the predicted fan spool rotational speed (BFM) using the body force model proposed in this paper and the experimental results (EXP) under different inflow Mach numbers is shown in Figure 10. The body force model can accurately predict the rotational speed of the fan spool under windmilling conditions. Compared with the models given in references [1,25], this new body force model could be used to predict the rotational speed by solving the three-dimensional body force field of the fan under given inlet and outlet conditions, without relying on parameters such as mass flow rate as input. This makes the model more practical and lays the foundation for further studying the flow field.
The radial distribution of the circumferentially averaged total pressure ratio and total temperature rise of the fan is shown in Figure 11. The results calculated using the body force model are basically consistent with the experimental and full three-dimensional numerical simulation results (RANS). For areas above 80% span, the total pressure ratio calculated based on the body force model is higher than the RANS results, indicating that the loss predicted by the body force model in this area is smaller than that calculated by RANS. Based on the previous analysis of RANS results, there is a significantly large separation zone in the flow in this region. The interaction between secondary flow and separation flow in the end region is very strong, which may further increase the losses in this region. However, when calculating based on the body force model, the entropy increase in this region is added to the flow through parallel body force terms, and there is no obvious radial mixing, thus underestimating this part of the loss. The total temperature rise characterizes the change in fluid enthalpy after passing through the fan. The total temperature in the area below 40% span increases, indicating that the fan blades in this area add work to the airflow, while the total temperature in the 40–85% span decreases, indicating that the airflow adds work to the fan blades. For areas above 85% span, due to the secondary flow in the end zone, the flow loss in this area significantly increases, resulting in an increase in total temperature. Comparing the two curves, the radial distribution of total temperature rise calculated using the body force model and fully three-dimensional numerical simulation is also basically consistent.

4. Numerical Simulation of Fan Windmilling Condition under Inlet Distortion

To further validate the effectiveness of the proposed body force model, a total pressure distortion zone was added to the inlet of the fan computational domain, as shown in Figure 12. The angles of the sector corresponding to the distortion zone are 60°, 90°, 120°, and 150°, respectively. The reference pressure is set at 101,325 Pa, the gauge total pressure in the normal intake zone is 0, and the gauge total pressure in the distortion zone is −1000 Pa. The other boundary conditions are consistent with the previous calculation.
The results of the windmill rotational speed of the fan spool and air mass flow rate under inlet distortion are presented in Table 1. As the range of the distortion zone increases, the rotational speed and air mass flow rate both decrease. The relationship between the two is basically linear. This is mainly due to the decrease in the total pressure of the incoming flow in the distortion zone, which leads to a decrease in the total pressure ratio. In the high radius zone of the “turbine mode”, the power output of the fan is reduced, and the net output power of the fan that overcomes the rotational resistance moment is reduced, resulting in the fan deceleration. The body force model is reasonable in predicting the variation pattern of fan rotational speed.
When a fan rotor in normal working condition experiences distortion at the inlet, the interaction between the fan rotor and the distorted flow field makes the parameters at the fan outlet tend to be uniform in the circumferential direction due to the suction effect of the blade row [24,33,34]. This effect mitigates the distortion impact. However, for the fan in a windmilling condition, the situation is different. Figure 13 shows the contour of the upstream swirl angle ahead of the fan. The swirl angle is defined as
α = arctan V θ / V x
There is a certain swirl angle around the interface between the distorted and non-distorted regions, which is caused by the vortex generated by the instability at the interface. The swirl angle mainly affects the area below 50% span, which may lay different effects of distortion on the fan in different radial portions.
As shown in Figure 14, the spanwise meridional flow angle λ distribution at the center of the distortion zone at a position 0.5 times the axial chord length upstream of the fan leading edge under different conditions. The meridional flow angle λ is defined as
λ = arctan V r / V x
The black line is the meridional flow angle far away from the distortion area. Because the fan adopts the design of equal outer diameter, the increase of hub radius causes radial velocity near the blade root, and the radial velocity decreases with the increase of the radius. Due to the mixing effect between the distorted and non-distorted regions, the radial position of the maximum meridional flow angle is away from the hub. As the area of the distortion zone decreases, the maximum meridional flow angle at the center of the distortion zone increases, and the position where the maximum value occurs is far away from the hub. For example, in case 1, the maximum value appears near the 20% span. The radial velocity in this region is mainly caused by the flow direction vortex generated by the instability at the interface between the high total pressure region and the low total pressure region. The larger the area of the distortion zone, the closer the meridional flow angle at the center of the distortion zone is to the distribution of the non-distortion zone. The appearance of a longitudinal vortex can cause fluid mixing in different radial regions and introduce an additional swirl angle at the leading edge of the fan, thereby affecting the working state of the fan.
Figure 15 shows the entropy increase along the axial direction in the fan passage under different conditions. The entropy increase here represents the mass flow averaged entropy at different axial positions of the cross-section minus the average entropy value of the inlet surface under this condition. The axial position coordinates are dimensionless, using the axial chord length of the fan blade as a characteristic length. The leading edge of the fan blade is set as the coordinate zero point. As the area of the distortion zone increases, the entropy increase passing through the fan decreases, indicating that the longitudinal vortex will interact with the blade force field of the fan. From the above analysis, Case 1 has the strongest longitudinal vortex, and the secondary flow has a strong impact on the fan, thus introducing additional flow losses.
The contour of total pressure at 0.5 times the axial chord length downstream of the fan is shown in Figure 16. The circumferential non-uniformity of the total pressure in the low radius region of the fan has been alleviated, while it is deeper in the high radius region. The circumferential non-uniformity of the flow parameters upstream of the fan forms a longitudinal vortex. Due to the high radius area of the fan being in “turbine mode” under the windmilling condition, the longitudinal vortex is stretched under the positive pressure gradient, which deepens the distortion degree in this area. Observing the junction between the distortion-affected zone and the non-distortion zone (marked by red circle in Figure 16), due to the presence of both radial and circumferential pressure gradients, the flow in each region undergoes strong mixing. A very uneven distribution of total pressure is formed in this area. Due to the mixing effect, the total loss increases, and the net output power of the fan further decreases, resulting in a decrease in speed. The power output of the fan in the high radius area decreases, and the spanwise pressure gradient and the mixing loss also decrease. When the resistance torque that the fan needs to overcome to maintain the specified rotational speed is rebalanced with its output net torque, the speed stabilizes. Comparing the total pressure distribution at the outlet of Case1–Case4, it can also be seen that as the distortion zone increases, the rotational speed decreases. The flow at the junction of the distortion-affected zone and the non-distortion zone becomes more uniform, which is consistent with the previous analysis. From the simulation results, it can be further inferred that for fans operating in a windmill state, the non-uniformity of flow parameters at the outlet of the high radius region will increase.
To further analyzing of the evolution mechanism of longitudinal vortex caused by circumferential distortion under the fan body force field, the vortex structure within the fan area is identified using the Q criterion, and the color of the iso-surface is colored using absolute velocity, as shown in Figure 17. The circumferential non-uniformity of the incoming flow causes mixing between different layers of fluids, forming a longitudinal vortex at the junction. After entering the fan area, due to the different working patterns of fans in different radial areas, a radial pressure gradient gradually forms through the blade area. Under the combined action of the fan body force field and radial pressure gradient, the flow vortex deflects along the circumference and induces a reverse vortex. The flow close to the blade hub is affected, introducing additional flow losses. Compared to models using actuator disks, using three-dimensional body force models can provide more flow details within the computational domain.
Figure 18 shows the circumferential distribution of absolute flow angles at different radial positions at 50% axial chord length downstream of the rotor under different distortion conditions. As mentioned before, the fan at 20% span position is in “compressor mode”, and the fan at 70% span position is in “turbine mode”. For the area near 20% span, the fan outlet flow is more sensitive to turbulence due to the adverse pressure gradient. Therefore, the two regions are affected to varying degrees in the distorted and non-distorted boundary areas. For the 20% span position, the flow becomes very unstable under the combined effect of circumferential and radial pressure gradients, so the fluctuation of the flow angle in this area is more obvious. Comparing the results of different circumferential distortion angle ranges, Case 1 and Case 2 exhibit significant fluctuations in the flow angle at the junction area, while as the angle of the distortion zone increases, the fluctuation of the flow angle is suppressed. Based on the above analysis, it can be concluded that this is due to the decrease in fan rotational speed; fan output power in the high radius region decreases while power consumption increases in the low radius region. The pressure gradient between different radial positions reduces. For the 70% span position, the inflow velocity of the fan in the distortion zone is low. The negative attack angle in this area further increases, resulting in more severe separation on the blade pressure surface and further increasing the lag angle. As the distortion range increases, the rotational speed of the fan decreases, and the angle of attack of the fan blades decreases. The degree of separation at the rotor outlet alleviates, resulting in a decrease in the absolute airflow angle at the outlet. The different working modes of the high and low radius regions of the fan result in inconsistent response patterns under circumferential distortion conditions in different regions. It is significantly different from the flow state at the design and non-design points when the fan operates normally.

5. Conclusions

A new body force model suitable for simulating the windmilling conditions of the fan was developed. Then, it is used to investigate the windmilling conditions of a small turbofan engine under inlet distortion. The main conclusions are as follows:
(1)
A new body force model coupled with a fan spool rotational speed prediction model was developed, which is suitable for the investigation fan under windmilling conditions. The fan rotational speed prediction model was built based on the balance of fan output torque and resistance torque. The rotational speed of the fan spool can be iteratively solved simultaneously with solving the governing equations without requiring other inputs.
(2)
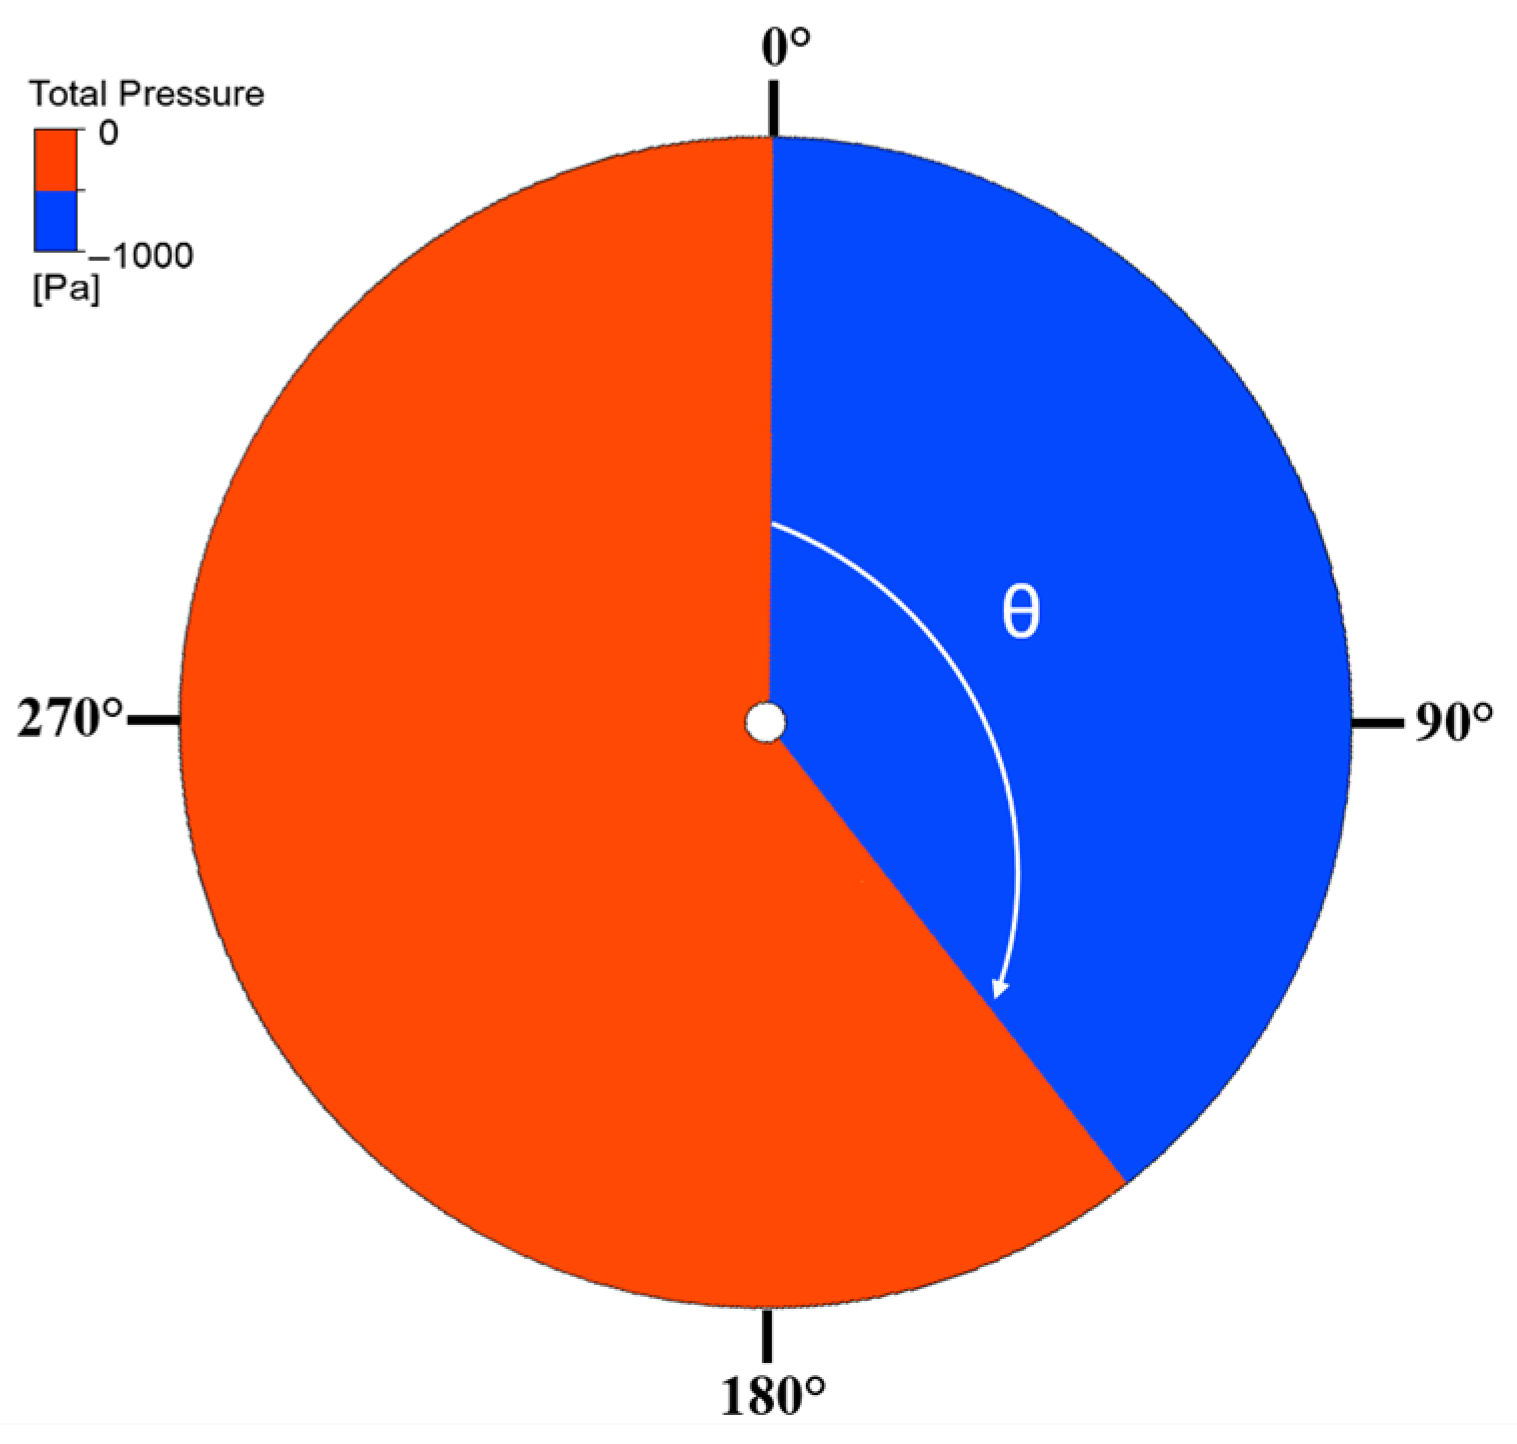
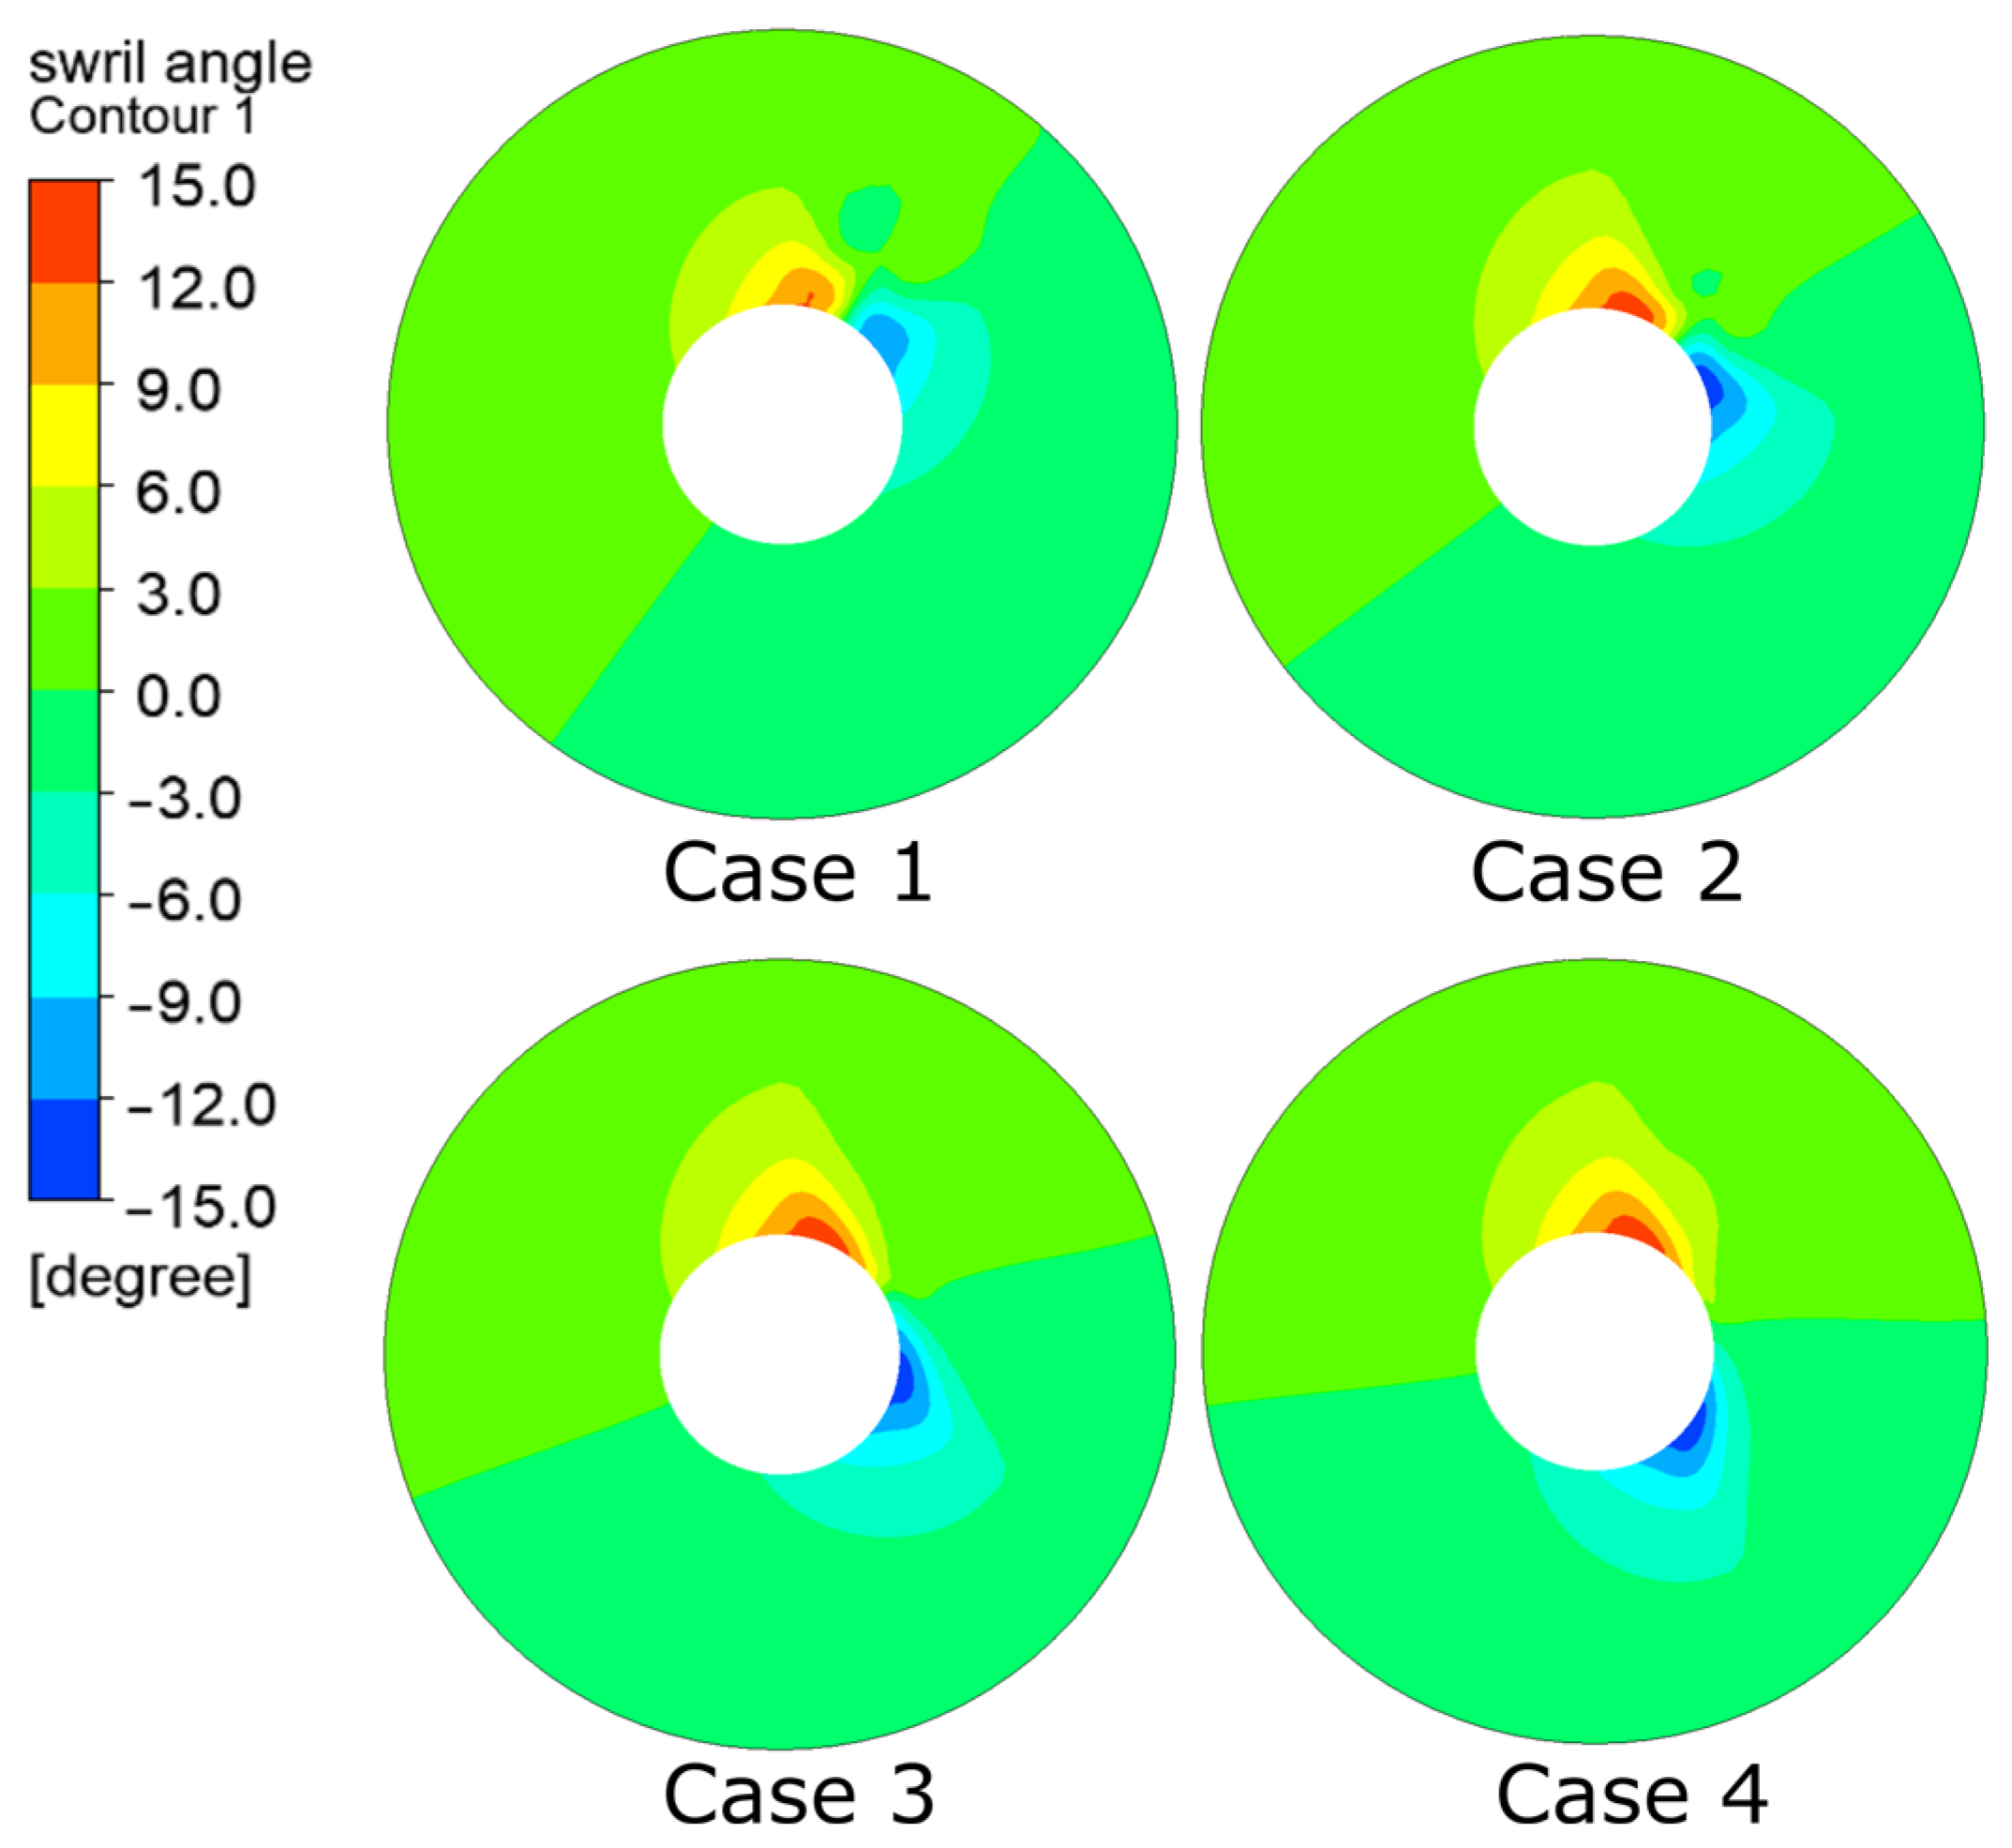
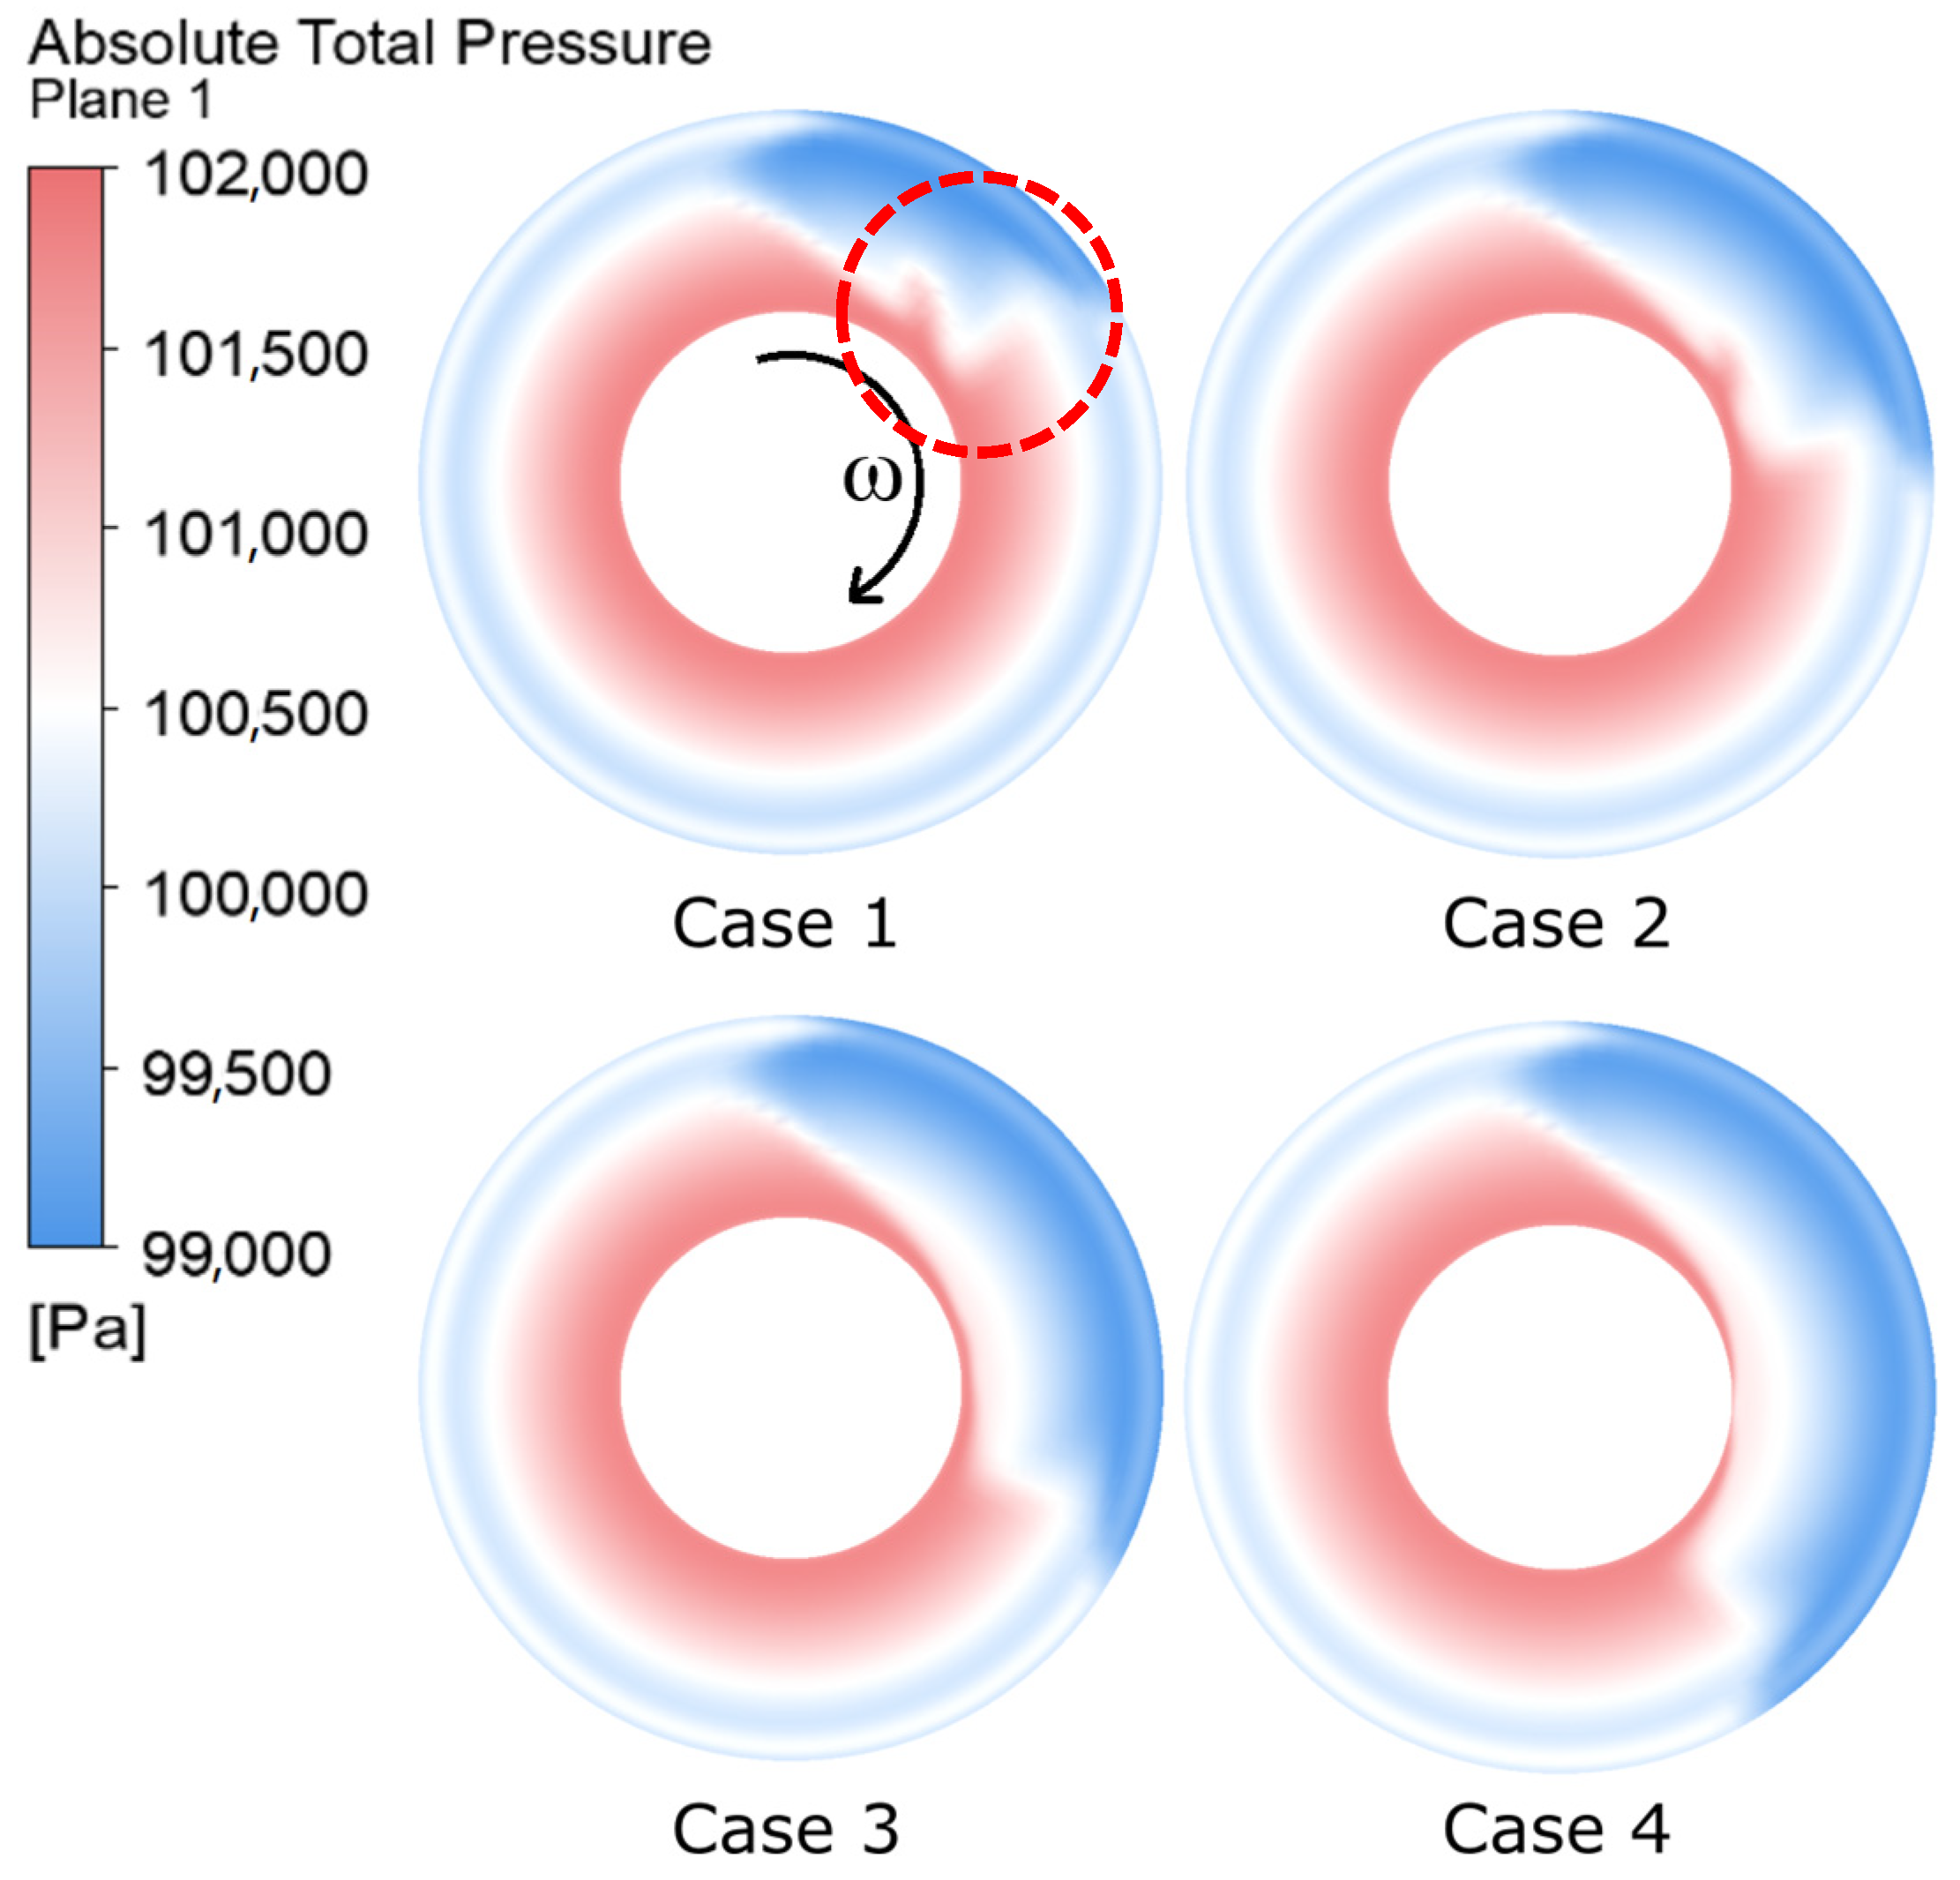
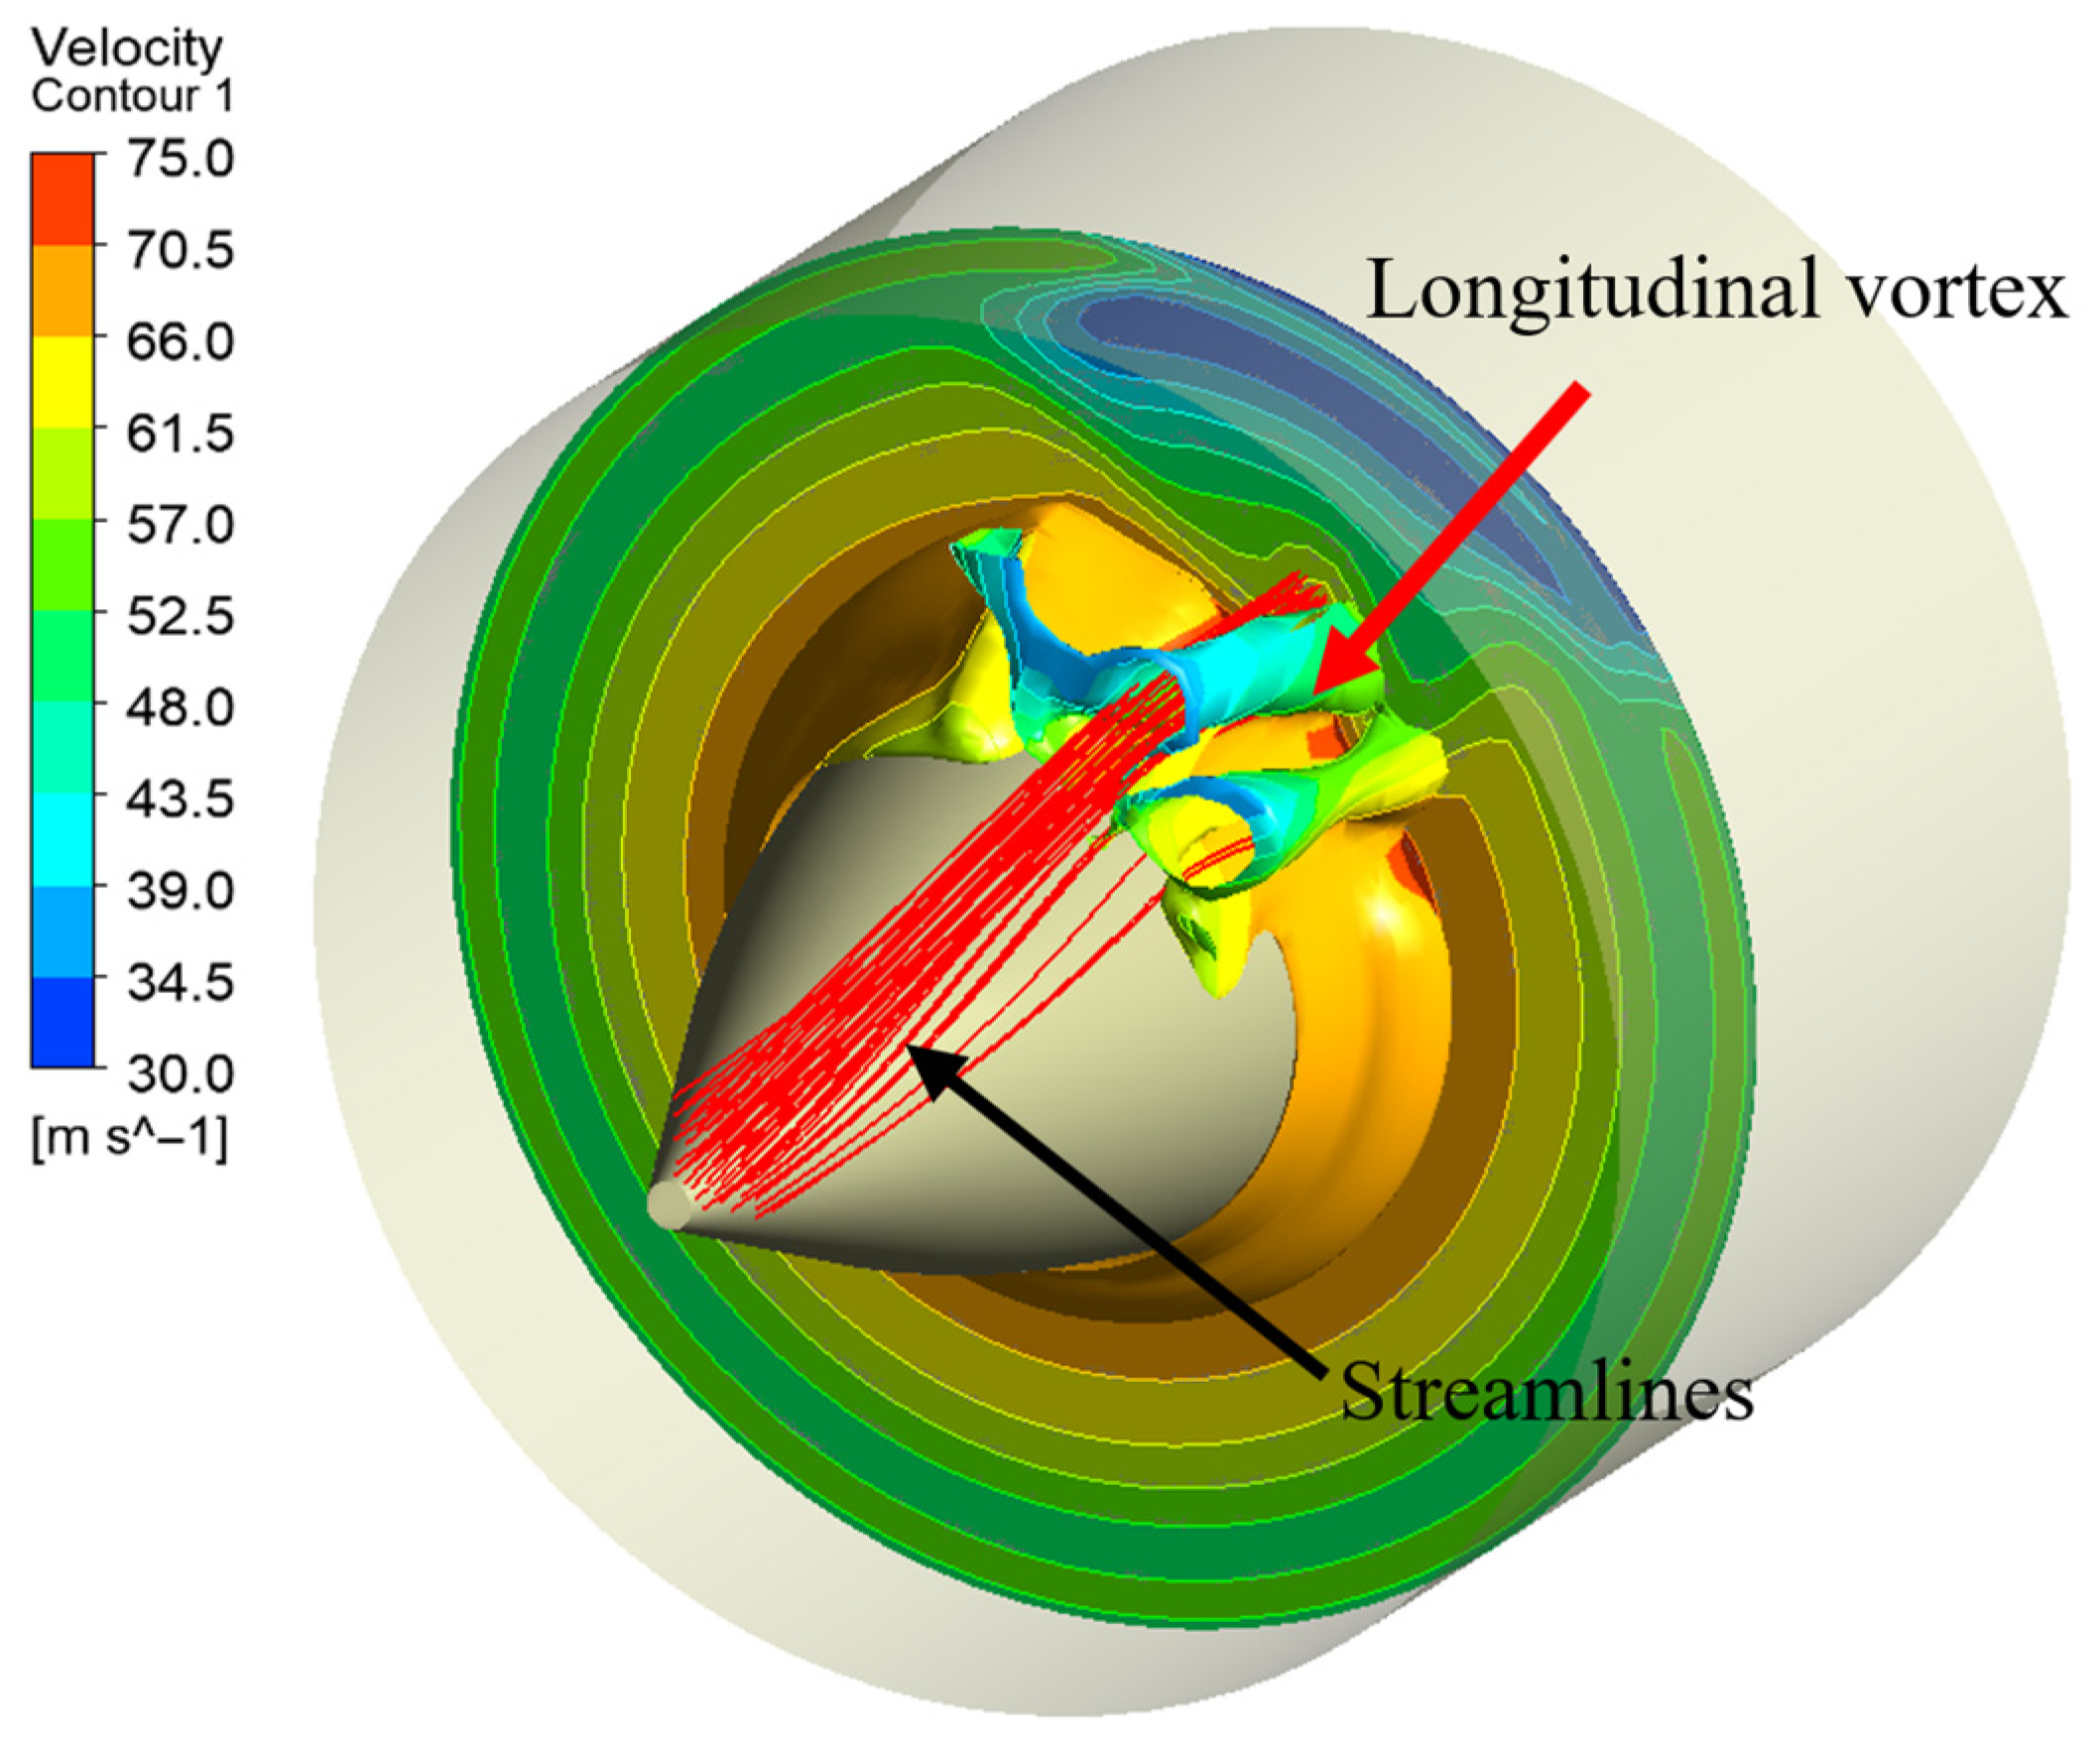
Numerical simulations of the fan under different circumferential total pressure distortion inflow conditions were conducted using the body force model. Since the working patterns are not alike at different spans, the stretching and compression effects of the longitudinal vortex in the two regions are opposite, resulting in strong circumferential and radial pressure gradients at the junction between the distortion-affected zone and the non-distortion-affected zone, introducing additional mixing losses. It is a unique flow phenomenon that is different from the flow state at both design and non-design points when the fan is operating normally.
(3)
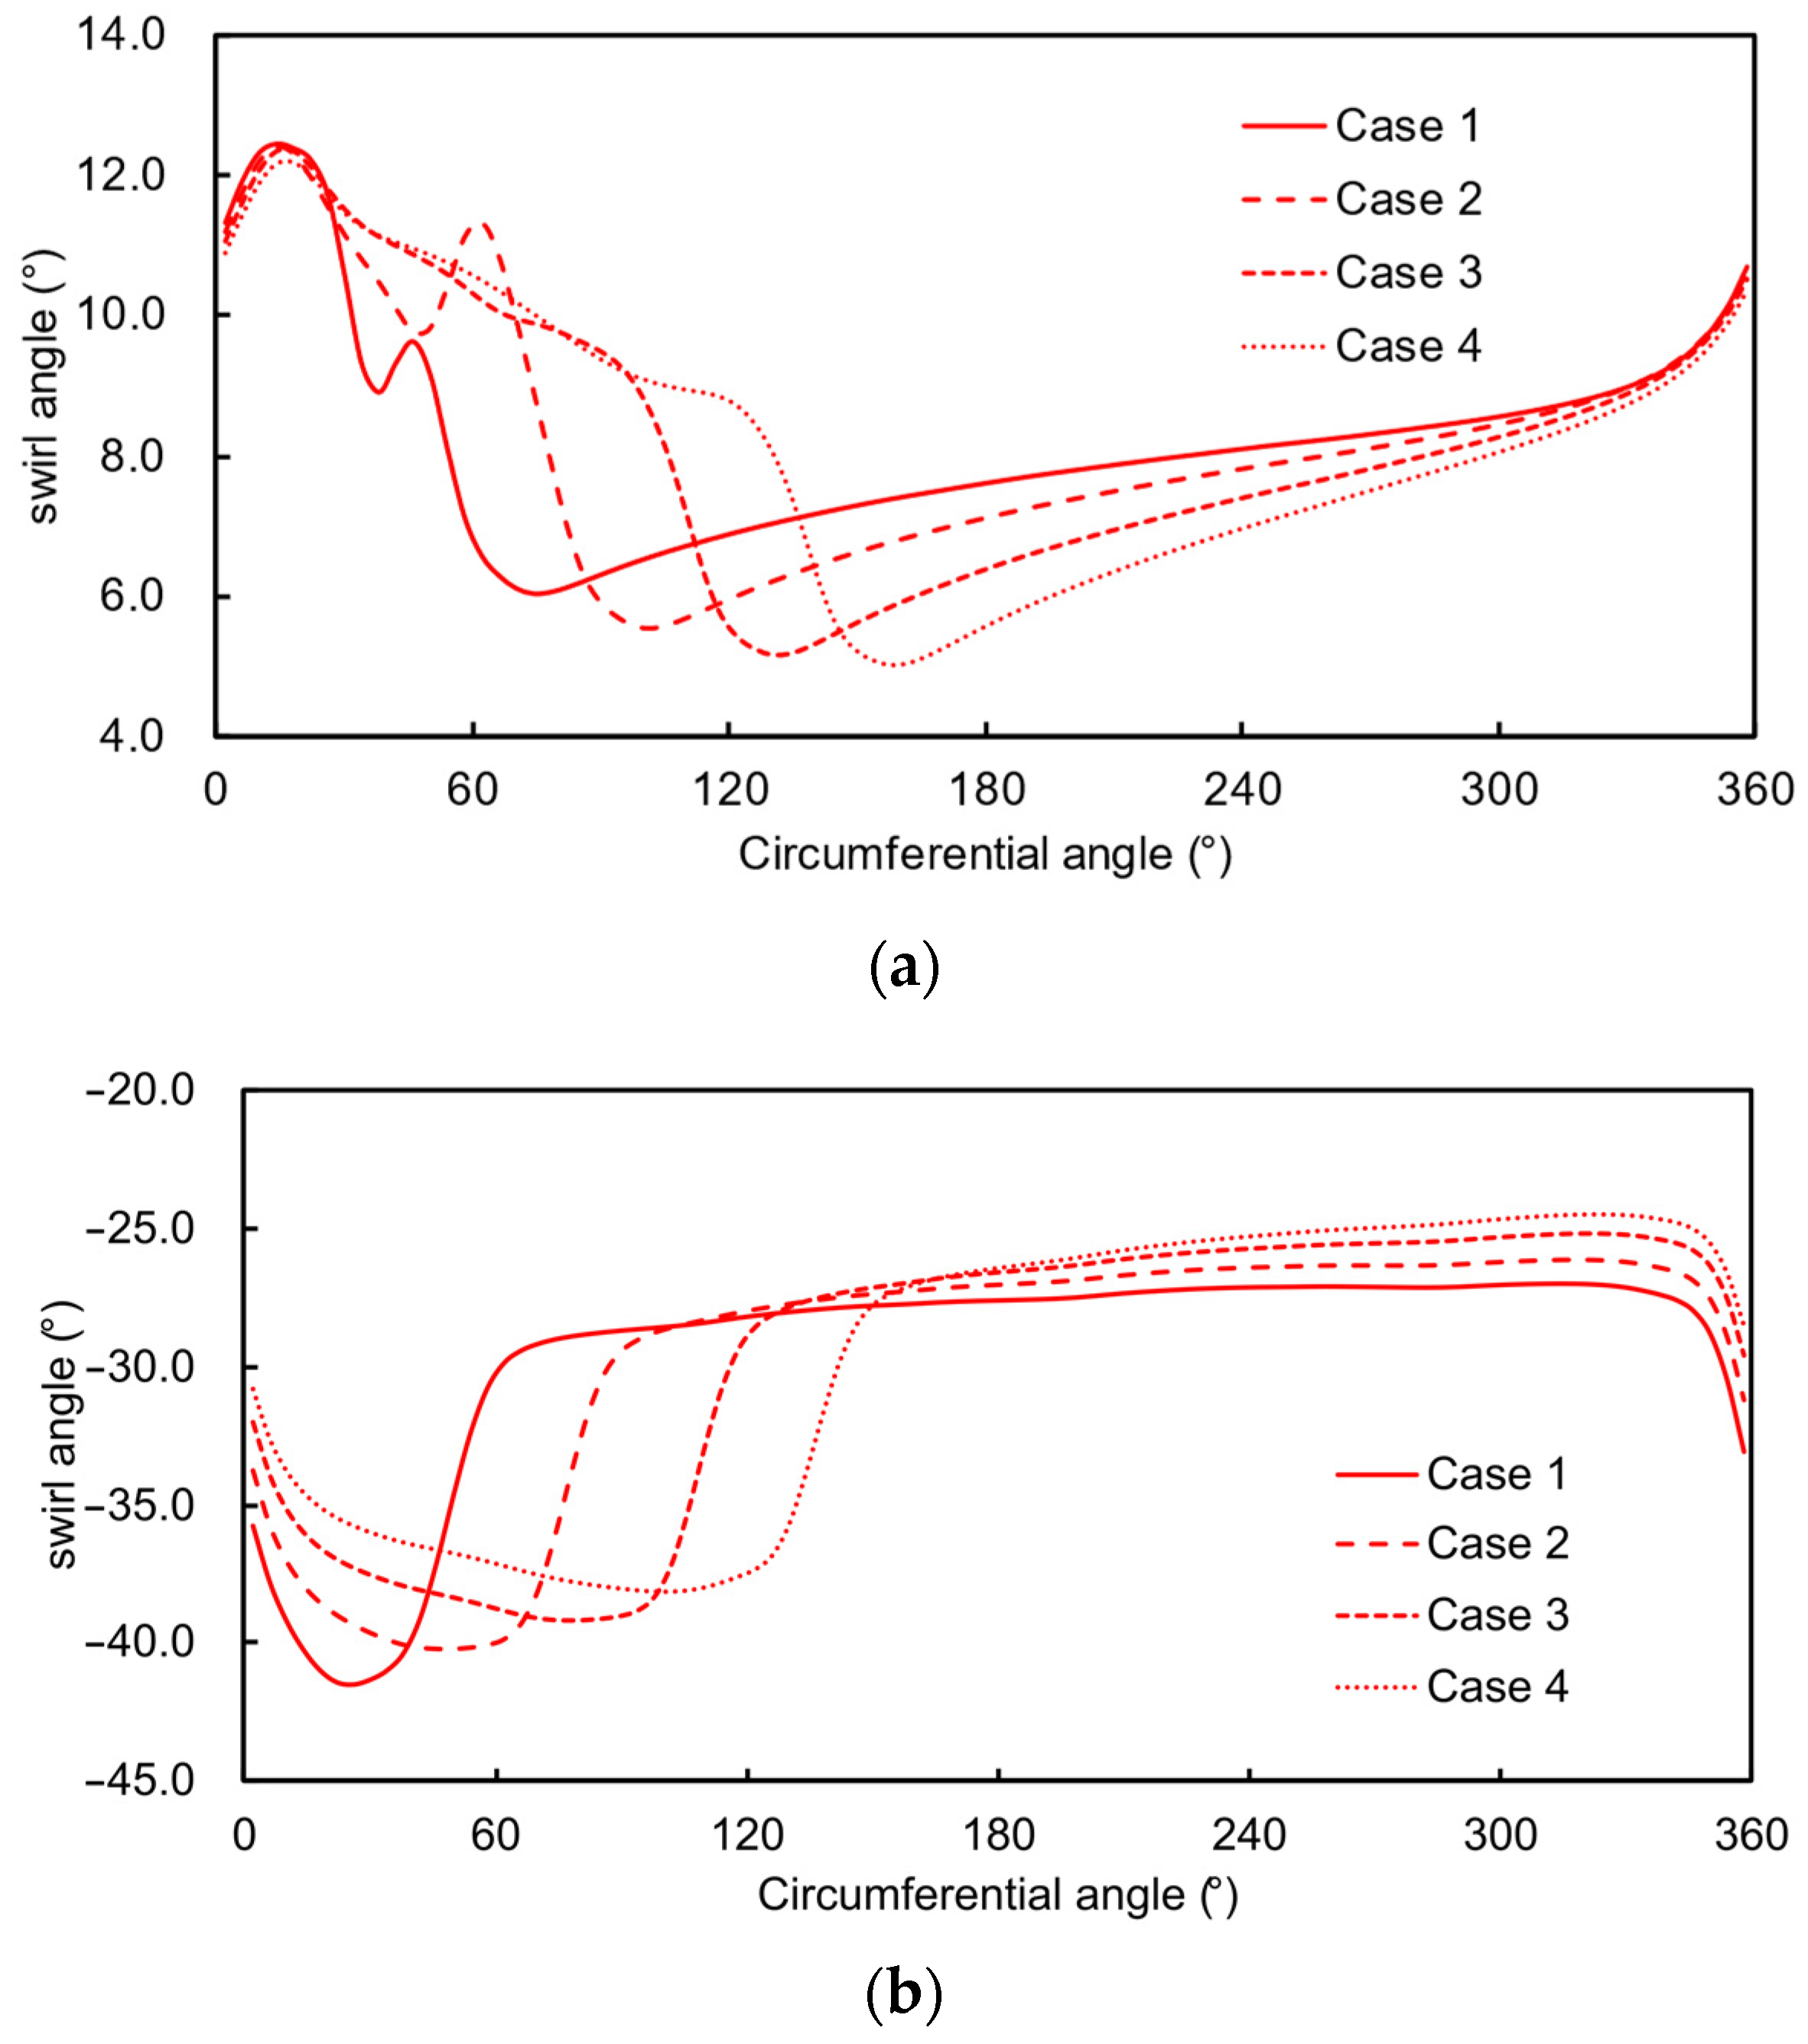
As the angle of the circumferential total pressure distortion zone increases, the expansion of the distortion sector weakens the mixing effect at the junction of the distortion-affected area and the non-distortion-affected area. The air mass flow rate and the rotational speed of the fan spool decrease. When the angle of the distorted sector increases from 60° to 150°, the windmill speed decreases by 5%, and the air mass flow rate decreases by 4.4%.

Author Contributions

Conceptualization, Q.K. and W.J.; methodology, Q.K. and W.J.; formal analysis, Q.K. and W.J.; writing—original draft preparation, Q.K.; writing—review and editing, Q.K. and W.J.; visualization Q.K. and W.J. All authors have read and agreed to the published version of the manuscript.

Funding

The present investigation is being conducted under the support of National Key R&D Program of China (2022YFB4301004) and the Fundamental Research Funds for the Civil Aviation University of China (3122019182).

Data Availability Statement

Not applicable.

Conflicts of Interest

The authors declare no conflict of interest.

Nomenclature

The following abbreviations are used in this manuscript:
Acoefficient of aerodynamic resistance torque related to type of fan
bblockage factor
f vector of viscous body force
F vector of inviscid body force
Htotal enthalpy
Knumber of blades
mmeridional coordinate
m ˙ mass flow rate
Maerodynamic resistance torque of fan rotor
MaMach number
nrotational speed of spool
Ntorque
r, θ, xcylindrical coordinates
sentropy
S vector of source term
Ttemperature
V vector of velocity in absolute coordinate system
W vector of velocity in relative coordinate system
Xmoment of inertia of the fan spool
αabsolute swirl angle
κcorrection factor
λmeridional flow angle
ρ density
Φ vector of body force
Subscripts
0source term of conservative equation
corcorrected value
mmeridional direction
outtorque output of fan blade
objtorque to maintain target rotational speed
prepressure side of blade
refreference value
r, θ, xradial, circumferential, and axial direction
sfactor of entropy increase
sucsuction side of blade
tfactor of velocity circulation variation

References

  1. Prasad, D.; Lord, W.K. Internal losses and flow behavior of a turbofan stage at windmill. J. Turbomach. 2010, 132, 031007. [Google Scholar] [CrossRef]
  2. Zachos, P.K. Modelling and analysis of turbofan engines under windmilling conditions. J. Propuls. Power 2013, 29, 882–890. [Google Scholar] [CrossRef]
  3. Gunn, E.J.; Hall, C.A. Loss and deviation in windmilling fans. J. Turbomach. 2016, 138, 101002. [Google Scholar] [CrossRef]
  4. Prasad, D. Aerodynamic Similarity Principles and Scaling Laws for Windmilling Fans. J. Turbomach. 2018, 140, 121004. [Google Scholar] [CrossRef]
  5. Dufour, G.; Carbonneau, X.; Rosa, N.G. Nonlinear harmonic simulations of the unsteady aerodynamics of a fan stage section at windmill. In Proceedings of the ASME Turbo Expo 2013: Turbine Technical Conference and Exposition, San Antonio, TX, USA, 3–7 June 2013. [Google Scholar] [CrossRef]
  6. Ortolan, A.; Courty-Audren, S.K.; Binder, N.; Carbonneau, X.; Bousquet, Y.; Challas, F. Assessment of steady and unsteady full annulus simulations predictivity for a low-speed axial fan at load-controlled windmill. Int. J. Rotating Mach. 2018, 2018, 7572631. [Google Scholar] [CrossRef]
  7. Dufour, G.; Rosa, N.G.; Duplaa, S. Validation and flow structure analysis in a turbofan stage at windmill. Proc. Inst. Mech. Eng. Part A J. Power Energy 2015, 229, 571–583. [Google Scholar] [CrossRef]
  8. Inada, T.; Sekino, R.; Fujisawa, N.; Ohta, Y. Effects of tip clearance on internal flow and loss generation mechanism in an axial compressor at windmilling conditions. In Proceedings of the ASME 2022 Fluids Engineering Division Summer Meeting, Toronto, ON, Canada, 3–5 August 2022. [Google Scholar] [CrossRef]
  9. Perry, A.T.; Ansell, P.J.; Kerho, M.F. Aero-Propulsive and Propulsor Cross-Coupling Effects on a Distributed Propulsion System. J. Aircr. 2018, 55, 2414–2426. [Google Scholar] [CrossRef]
  10. Zhao, X.; Van Hoorn, P.; Yao, H.-D.; Alderman, J. Parameter Sensitivity Study on Inflow Distortion of Boundary Layer Ingested Turbofans. Aerospace 2022, 9, 426. [Google Scholar] [CrossRef]
  11. Menegozzo, L.; Benini, E. Boundary Layer Ingestion Propulsion: A Review on Numerical Modelling. J. Eng. Gas Turbines Power 2020, 142, 120801. [Google Scholar] [CrossRef]
  12. Rosa Taddei, S.; Larocca, F. An actuator disk model of incidence and deviation for rans-based throughflow analysis. J. Turbomach. 2014, 136, 021001. [Google Scholar] [CrossRef]
  13. Wiart, L.; Atinault, O.; Boniface, J.-C.; Barrier, R. Aeropropulsive performance analysis of the NOVA configurations. In Proceedings of the 30th Congress of the International Council of the Aeronautical Sciences, DCC, Daejeon, Republic of Korea, 25–30 September 2016. [Google Scholar]
  14. Gong, Y.; Tan, C.S.; Gordon, K.A.; Greitzer, E.M. A Computational model for short wavelength stall inception and development in multi-stage compressors. J. Turbomach. 1999, 121, 726–734. [Google Scholar] [CrossRef]
  15. Defoe, J.; Narkaj, A.; Spakovszky, Z. A body-force based methodology for predicting multiple-pure-tone noise: Validation. In Proceedings of the 16th AIAA/CEAS Aeroacoustics Conference, Stockholm, Sweden, 7–9 June 2010. [Google Scholar] [CrossRef]
  16. Kim, H.J.; Liou, M.-S. Flow simulation of N3X hybrid wing body configuration. In Proceedings of the 51st AIAA Aerospace Sciences Meeting including the New Horizons Forum and Aerospace Exposition, Grapevine, TX, USA, 7–10 January 2013. [Google Scholar] [CrossRef]
  17. Xu, L.; Hynes, T.P.; Denton, J.D. Towards long length scale unsteady modelling in turbomachines. Proc. Inst. Mech. Eng. Part A J. Power Energy 2003, 217, 75–82. [Google Scholar] [CrossRef]
  18. Hall, D.K.; Greitzer, E.M.; Tan, C.S. Analysis of fan stage conceptual design attributes for boundary layer ingestion. J. Turbomach. 2017, 139, 071012. [Google Scholar] [CrossRef]
  19. Pazireh, S.; Defoe, J. A New Loss Generation Body Force Model for Fan/Compressor Blade Rows: Application to Uniform and Non-Uniform Inflow in Rotor 67. J. Turbomach. 2022, 144, 061005. [Google Scholar] [CrossRef]
  20. Hill, D.J.; Defoe, J.J. Innovations in body force modeling of transonic compressor blade rows. Int. J. Rotating Mach. 2018, 2018, 6398501. [Google Scholar] [CrossRef]
  21. Godard, B.; De Jaeghere, E.; Gourdain, N. Efficient design investigation of a turbofan in distorted inlet conditions. In Proceedings of the ASME Turbo Expo 2019, Phoenix, AZ, USA, 17–21 June 2019. [Google Scholar] [CrossRef]
  22. Vega, L.; Dufour, G.; Rosa, N.G. A fully coupled body force-engine performance methodology for boundary layer ingestion. In Proceedings of the AIAA Propulsion and Energy 2019 Forum, Indianapolis, IN, USA, 19–22 August 2019. [Google Scholar] [CrossRef]
  23. Chima, R.V. A three-dimensional unsteady CFD model of compressor stability. In Proceedings of the ASME Turbo Expo 2006, Barcelona, Spain, 8–11 May 2006. [Google Scholar] [CrossRef]
  24. An, Y.; Liu, H. Numerical simulation of compressor with inlet distortion. Acta Aeronaut. Et Astronaut. Sin. 2012, 33, 1624–1632. [Google Scholar]
  25. Dufour, G.; Thollet, W. Body force modeling of the aerodynamics of the fan of a turbofan at windmill. In Proceedings of the ASME Turbo Expo 2016, Seoul, Republic of Korea, 13–17 June 2016. [Google Scholar] [CrossRef]
  26. Ortolan, A.; Courty-Audren, S.-K.; Binder, N.; Carbonneau, X.; Rosa, N.G.; Challas, F. Experimental and Numerical Flow Analysis of Low-Speed Fans at Highly Loaded Windmilling Conditions. J. Turbomach. 2017, 139, 071009. [Google Scholar] [CrossRef]
  27. Cui, J.; Lei, J. Calculation and Analysis of Friction Resistance Moment in Aeroengine Starting Process. Aeroengine 2021, 47, 7–11. [Google Scholar]
  28. Qi, B.; Liu, T.; Yang, C.; Jia, F.; Zhu, M. Test and analysis on high and low temperature on starting performance of a turboshaft engine. J. Aerosp. Power 2021, 36, 2029–2035. [Google Scholar]
  29. Garcia Rosa, N.; Dufour, G.; Barenes, R.; Lavergne, G. Experimental analysis of the global performance and the flow through a high-bypass turbofan in windmilling conditions. J. Turbomach. 2015, 137, 051001. [Google Scholar] [CrossRef]
  30. Thollet, W.; Dufour, G.; Carbonneau, X.; Blanc, F. Body-force modeling for aerodynamic analysis of air intake–fan interactions. Int. J. Numer. Methods Heat Fluid Flow 2016, 26, 2048–2065. [Google Scholar] [CrossRef]
  31. Huang, J.; Lv, Y.; Xia, A.; Zhang, S.; Tuo, W.; Xue, H.; Sun, Y.; He, X. Improved body force model for estimating off-design axial compressor performance. Energies 2022, 15, 4389. [Google Scholar] [CrossRef]
  32. Zeng, H.; Zheng, X.; Vahdati, M. A method of stall and surge prediction in axial compressors based on three-dimensional body-force model. J. Eng. Gas Turbines Power 2022, 144, 031021. [Google Scholar] [CrossRef]
  33. Guo, J.; Hu, J.; Tu, B. Numerical investigation of total temperature distortion problem in a multistage fan based on body force approach. Int. J. Turbo Jet-Engines 2020, 35, 1–11. [Google Scholar] [CrossRef]
  34. Tao, Q.; Jin, H.; Liu, X.; Zhu, Z. A fast computational method of the aerodynamic performance of fan and booster with inlet distortion. Proc. Inst. Mech. Eng. Part C J. Mech. Eng. Sci. 2023, 237, 67–82. [Google Scholar] [CrossRef]
Figure 1. Numerical simulation method of fan at windmilling condition based on body force model.
Aerospace 10 00724 g001
Figure 2. DGEN380 turbofan engine. (a) DGEN380 Engine test bench. (b) Engine profile and sensors’ location [29].
Aerospace 10 00724 g002
Figure 3. Computational domain.
Aerospace 10 00724 g003
Figure 4. Grid independence check and computational mesh for RANS. (a) Calculated mass flow rate with inlet Mach number of 0.16 with different sizes of grids. (b) The schematic of the mesh.
Aerospace 10 00724 g004
Figure 5. Radial distributions of flow parameters downstream the fan at windmilling condition. (a) Total pressure ratio. (b) Mach number.
Aerospace 10 00724 g005
Figure 6. Contours of Mach number on S1 stream surface at 90% span for Ma = 0.16. (a) CFD result in Ref. [7]. (b) CFD result of present study.
Aerospace 10 00724 g006
Figure 7. Radial distributions of circumferentially averaged circulation change and entropy rise. (a) velocity circulation variation. (b) entropy increase.
Aerospace 10 00724 g007
Figure 8. Drag torque of different rotational speeds at windmilling condition.
Aerospace 10 00724 g008
Figure 9. Computational mesh based on body force model.
Aerospace 10 00724 g009
Figure 10. Rotational speed at windmilling condition for different inlet Mach numbers.
Aerospace 10 00724 g010
Figure 11. Radial distributions of total pressure ratio and total temperature rise for Ma = 0.16. (a) Total pressure ratio. (b) Total temperature rise.
Aerospace 10 00724 g011
Figure 12. Schematic diagram of circumferential distortion.
Aerospace 10 00724 g012
Figure 13. Contours of absolute swirl angle upstream of fan.
Aerospace 10 00724 g013
Figure 14. Radial distribution of meridional flow angle at the center of the distortion zone.
Aerospace 10 00724 g014
Figure 15. Entropy rise in axial direction.
Aerospace 10 00724 g015
Figure 16. Contours total pressure downstream of the fan.
Aerospace 10 00724 g016
Figure 17. Evolution of longitudinal vortex in the fan.
Aerospace 10 00724 g017
Figure 18. Circumferential distributions of absolute flow angle at different spans. (a) 20% Span. (b) 70% Span.
Aerospace 10 00724 g018
Table 1. Rotational speed and mass flow rate of fan windmilling under circumferential distortion conditions.
Case1234
Distortion sector angle (°)6090120150
Rotational speed (RPM)1817.41787.51755.11726.6
Mass flow rate (kg/s)5.004.934.854.78
Disclaimer/Publisher’s Note: The statements, opinions and data contained in all publications are solely those of the individual author(s) and contributor(s) and not of MDPI and/or the editor(s). MDPI and/or the editor(s) disclaim responsibility for any injury to people or property resulting from any ideas, methods, instructions or products referred to in the content.

