Article

Experimental and Numerical Investigation on Finned Vortex Reducer in a Rotating Cavity with a Radial Inflow

1
School of Energy and Power Engineering, Beihang University, Beijing 100191, China
2
Research Institute of Aero-Engine, Beihang University, Beijing 100191, China
*
Author to whom correspondence should be addressed.
Aerospace 2023, 10(7), 655; https://doi.org/10.3390/aerospace10070655
Submission received: 14 June 2023 / Revised: 12 July 2023 / Accepted: 21 July 2023 / Published: 23 July 2023

Abstract

:
In aero-engines, a secondary air system is used to cool the rotor discs and seal cavities between rotor and stator parts. The pressure loss caused by bleed air can be effectively reduced by setting the finned vortex reducer. Thus, the bleed system design can be optimized by researching the flow structure and pressure loss of each section in the cavity with a finned vortex reducer. In this study, the influence of different installation positions of a finned vortex reducer on the pressure loss characteristics was investigated through experimental and numerical simulation methods, focusing on the radial inflow of the secondary air system. The results indicate that the inlet and outlet positions of the fins affect the flow structure in the cavity. The aerodynamic parameters (rotational Reynolds number ReΦ and mass flow rate coefficient Cw), together with the inlet and outlet radii of the fins, influence the pressure loss in the cavity. Considering the swirl ratio β constrained by the fins, a pressure loss model was established, which showed good agreement with the experimentally measured pressure loss. This model reflects the impact of the inlet and outlet positions of the fins on the pressure loss characteristics.

1. Introduction

Aero-engines’ secondary air system serves the primary purpose of cooling the hot components, such as turbine blades, and providing high-pressure air for sealing purposes [1]. The system draws air from the compressor and introduces cooling air primarily through the gaps between the stages of the compressor [2]. The air then flows radially toward the center of the rotating cavity and through internal passages toward the turbine components. During the radial inflow process, the air experiences both centrifugal and Coriolis force, leading to significant pressure losses [3]. By designing an efficient air intake structure and flow pattern, it is possible to reduce the flow losses in the secondary air system and enhance the cooling efficiency [4].
The source–sink flow model, a theoretical model extended by Hide [5], simplifies the corotating disc cavity structure. It divides the radial inflow into four regions: the source region, the Ekman layer, the interior core zone, and the sink region. Researchers such as Owen [6] and Firouzian et al. [7,8] experimentally validated Hide’s model and analyzed the mechanisms of pressure losses. They also developed a calculation model for static pressure coefficients, providing theoretical guidance for the estimation of pressure losses in corotating cavities with radial inflow.
To reduce pressure losses, researchers have designed various types of vortex reducer structures inside corotating cavities. There are three typical structures: de-swirl nozzles [9], tubed vortex reducers [10], and finned vortex reducers [11]. Researchers have conducted numerical simulations [12] and experimental studies [13] for each type. By studying and evaluating these various vortex reducer structures through numerical simulations and experimental research, researchers aim to optimize the design of corotating disc cavities and minimize pressure losses, improving efficiency in aerospace applications.
The de-swirl nozzle structure is designed to counteract the rotational flow by introducing an opposite swirl direction, effectively reducing the overall swirl in the cavity. The tubed vortex reducer aims to guide the flow along a smooth path with reduced swirl, minimizing the pressure losses caused by excessive rotation.
Farthing et al. [14] combined theory and experimental research to demonstrate the flow structures inside the cavity through flow visualization and obtained an “S”-shaped variation in pressure drop with the flow rate. The pressure model derived from the momentum integral equation matched well with the experimental observations. David et al. [15] established a transient, 1D model of flow in a rotating cavity. The model allows the vortex profile to change with the through-flow rate, and links this to estimates of disc windage, tangential velocity, and consequently, vortex pressure gradient. Negulescu [16] and Pfitzner et al. [10] conducted research on both tubed and tubeless vortex reducer systems, which are utilized in the operational BR700 aircraft engine. The characteristics and advantages of these two systems were discussed, and experimental results from device and engine testing were presented. Meanwhile, André Günther et al. [13] conducted experimental research on various forms of tubed vortex reducers. The study revealed the patterns of pressure loss for different structures. Sibilli et al. [17] discussed the numerical results and the setup of one-dimensional network models and computational fluid dynamics (CFD) models for various configurations. The study demonstrated the performance improvement of systems utilizing the vortex reducer compared to those without a vortex reducer. Bai et al. [18] analyzed the influence of turbulence parameters on the flow characteristics of tubular swirl restrictor structures and proposed a method for modifying turbulence parameters.
Compared to tubed vortex reducers, finned vortex reducers have gained increasing attention due to their simplicity and lack of complex vibration issues. Unlike de-swirl nozzles, finned vortex reducers do not exhibit hysteresis. Chew et al. [2] conducted theoretical analysis and experimental research on a corotating disc cavity with radial inflow using fins. They numerically solved the complete momentum integral equations and provided an approximate linear solution. They obtained a simple expression for pressure losses, which could be reduced to approximately 1/20 of the value without fins. Du et al. [19] carried out extensive three-dimensional steady-state numerical simulations on finned vortex reducers. They analyzed the influence of two fin numbers and four fin shapes on the flow rate in the corotating disc cavity. The results showed that reducing the deflection angle of the baffle at the cavity inlet and decreasing the rate of curvature change effectively optimized the flow path inside the compressor disc cavity. Bai et al. [20] conducted numerical studies on the impact of the deflector shape on the total pressure loss characteristics of finned vortex reducers. They found that, under given boundary conditions, there is an optimal number and shape of deflectors. Placing the deflector inlet at a swirling ratio of one could reduce the total pressure loss at the inlet. Hou et al. [21] conducted numerical simulations to study the effect of fin installation height on drag reduction effect, and found that, when the dimensionless height of the lower end of the fin was 0.476, the drag reduction effect was at its best.
On the basis of the above considerations, most scholars have simplified the shape of the fins to a regular rectangular structure. The research mainly focuses on the shape and numbers of fins, lacking a specific analysis of the flow along the cavity. By analyzing the flow structure of the disc cavity, considering the geometric structure, this study divides the disc cavity into various regions to analyze the flow characteristics and pressure loss of each section in further detail. In this study, experimental and numerical simulation methods were employed to primarily investigate the different radial installation positions of the fins. The study obtained the variation patterns of the flow characteristics under different speeds, mass flow rates, and fin installation heights. It provides a design basis for optimizing a finned vortex reducer.

2. Experimental and Simulation Methods

2.1. Test Rig

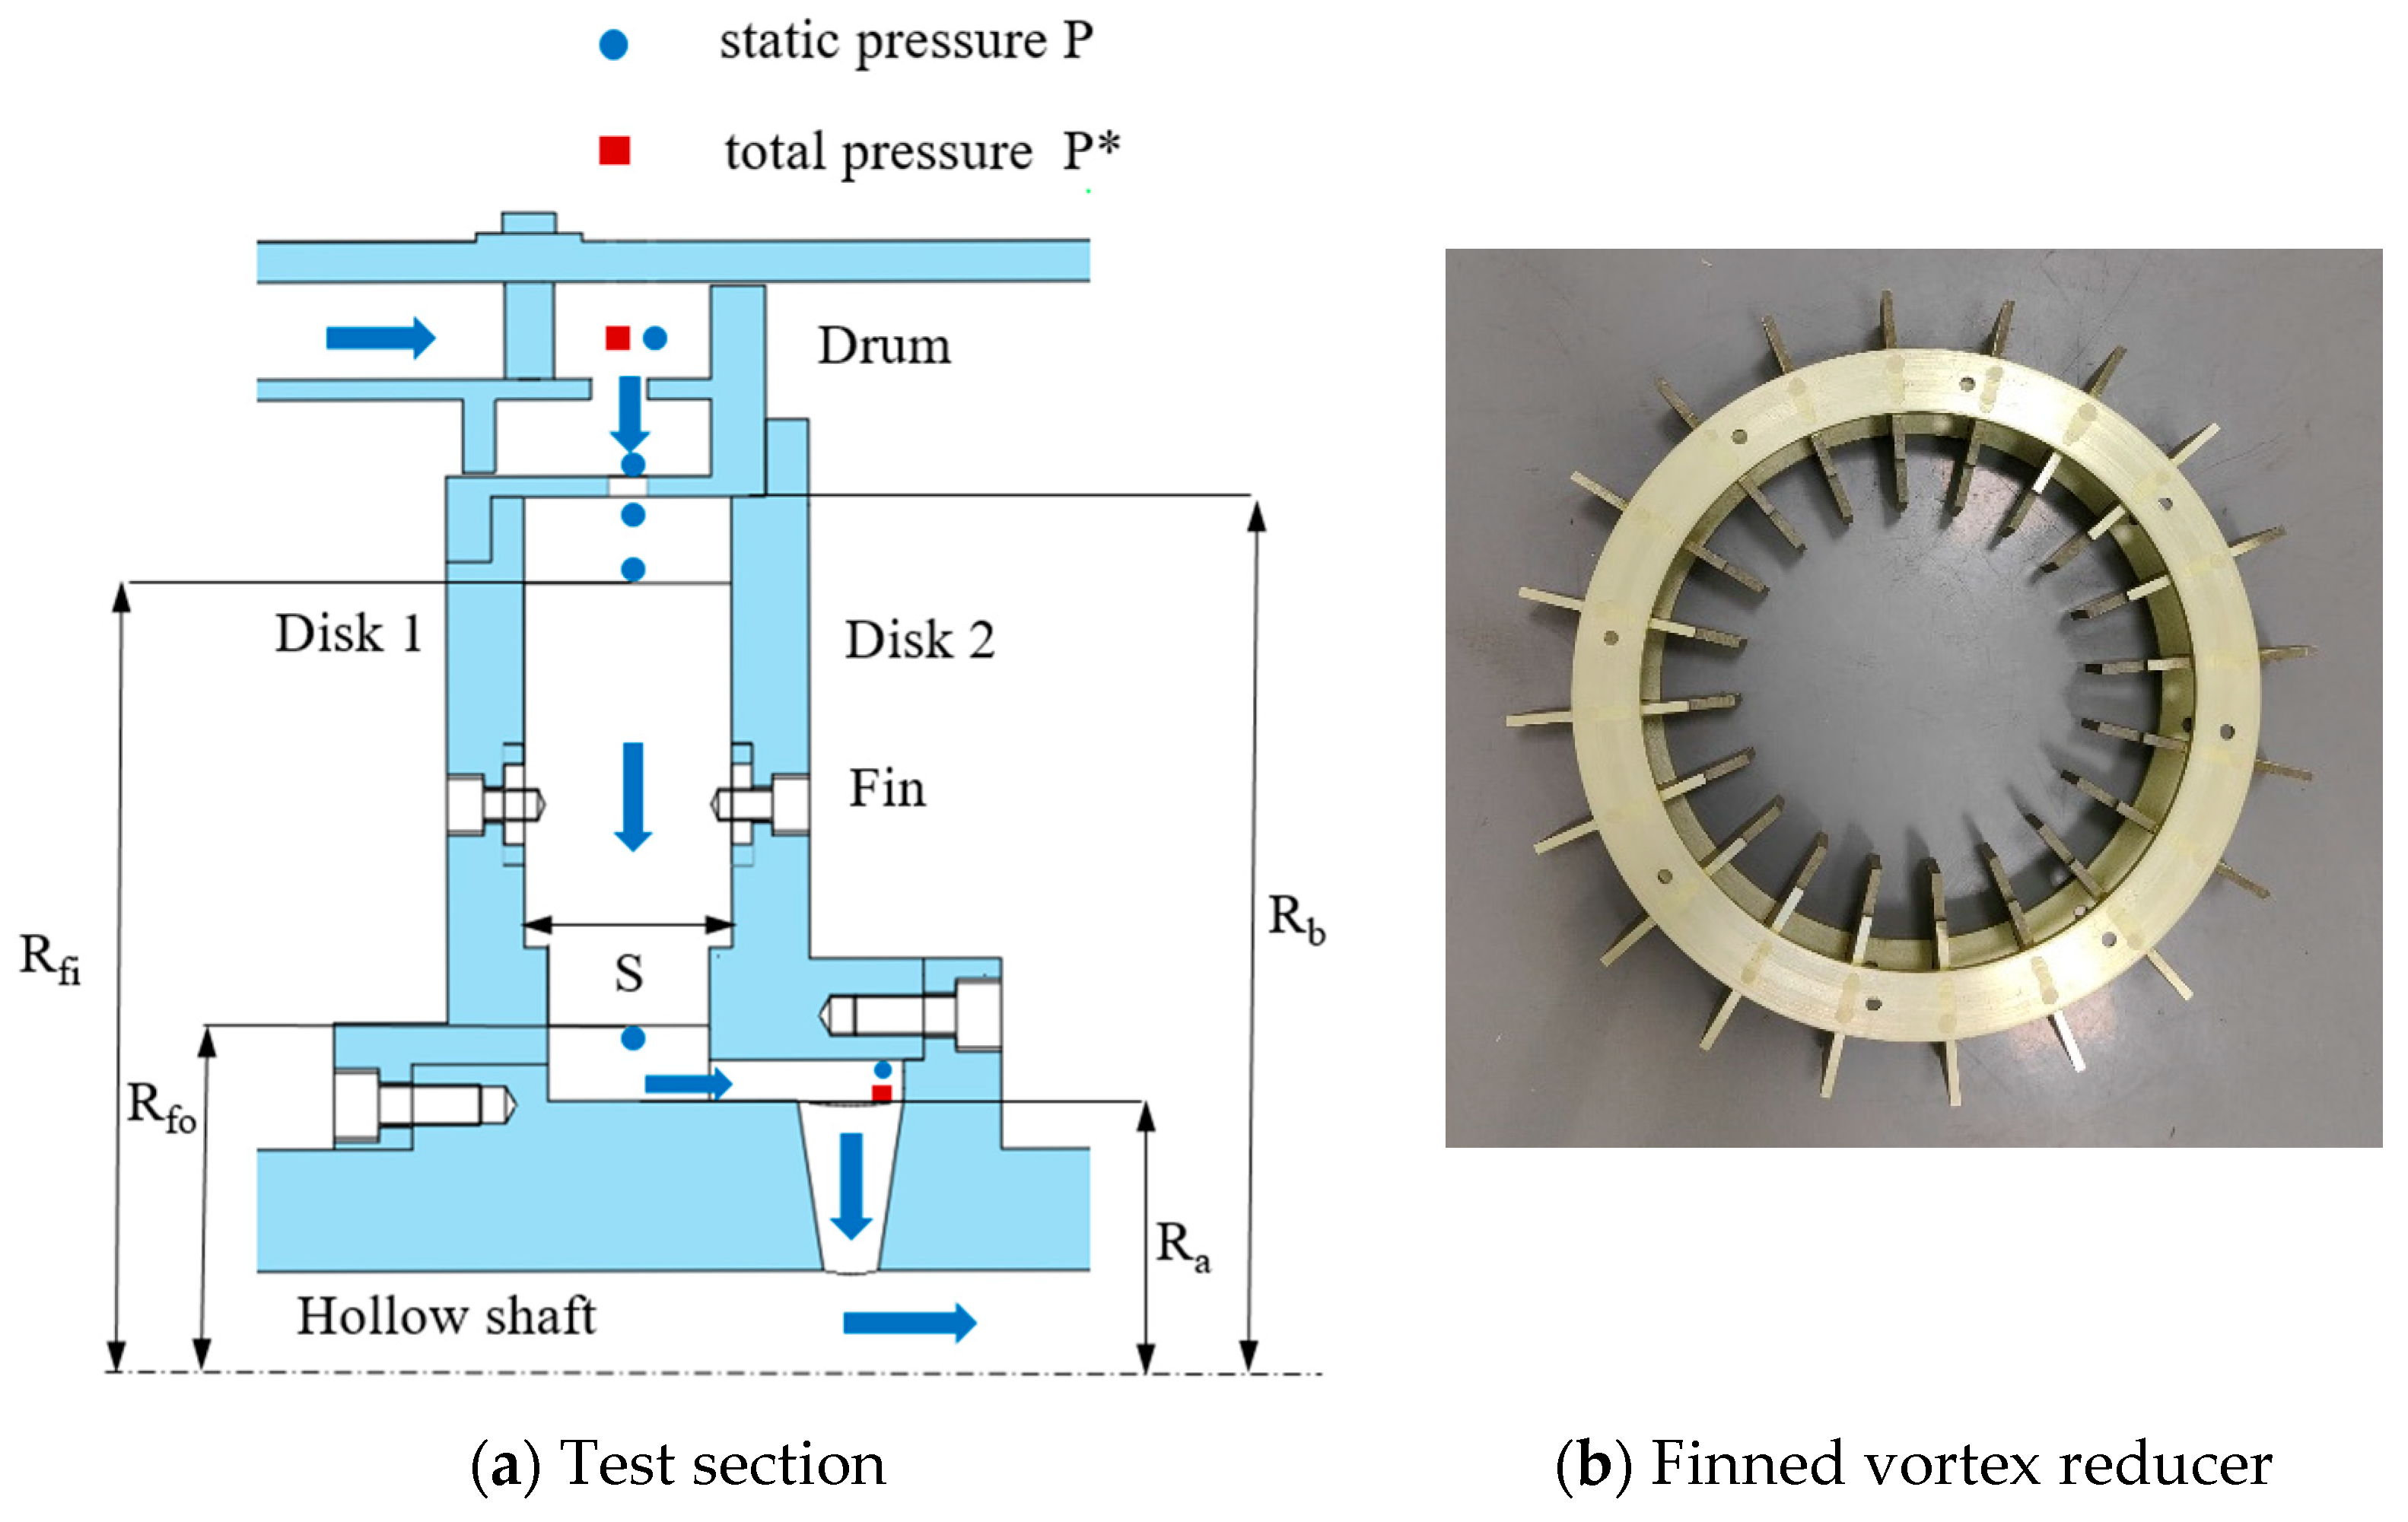
A schematic of the test rig is shown in Figure 1. It consists of a power system, an air supply system, a data acquisition system and a rotating test section. As the most important part of the experiment, the rotating test section is mainly composed of two corotating discs driven by a DC motor. An air flow rate up to 0.3 kg/s is allowed through the whole test section from the air filtration system. Pressure transducers are employed on the inlet, shroud, disc, and shaft to obtain pressure variation. To measure the rotating signal, the copper wire of the transducers is stretched along the shaft and rotates with it at the same angular speed.
The signals from the stationary area are collected using an Adam data acquisition module, while the signals from the rotating area are collected via a telemetering device. The signals collected by the rotating acquisition module are transmitted to the signal receiver through an antenna and then fed into the system. The speed-controlled DC motor with 80 kW and a gearbox allows rotational speeds of 8500 rpm; these speeds are measured using a laser tachometer. The air resource, supplied by a 110 kW compressor pump, can be regulated by valves and measured by a thermal mass flow-meter.

2.2. Test Section

The experimental setup simplified the radial air intake system of an actual engine, and its overall structure is shown in the diagram. The experimental section consists of both rotor and stator components. The stator part includes an outer casing and an inner casing, which provide rectification and support. The rotor part includes a primary rotor disc, a secondary rotor disc, a drum, a central shaft, and a fin-type swirl reducer. The rotor disc is connected to the drum, the rotor disc and the swirl reducer, and the rotor disc and the hollow shaft, all using bolts. The rotation is driven by an electric motor. The fin structure and main measurement points of the cavity are shown in Figure 2.
The specific structural parameters are shown in Figure 2. The outer radius of the rotating disc Rb is 216 mm. The gap ratio G(S/Rb) is 0.236 and the nondimensional outer and inner radius of finned vortex reducer Xfi (Rfi/Rb) and Xfo (Rfo/Rb) are listed in Table 1.

2.3. Numerical Model

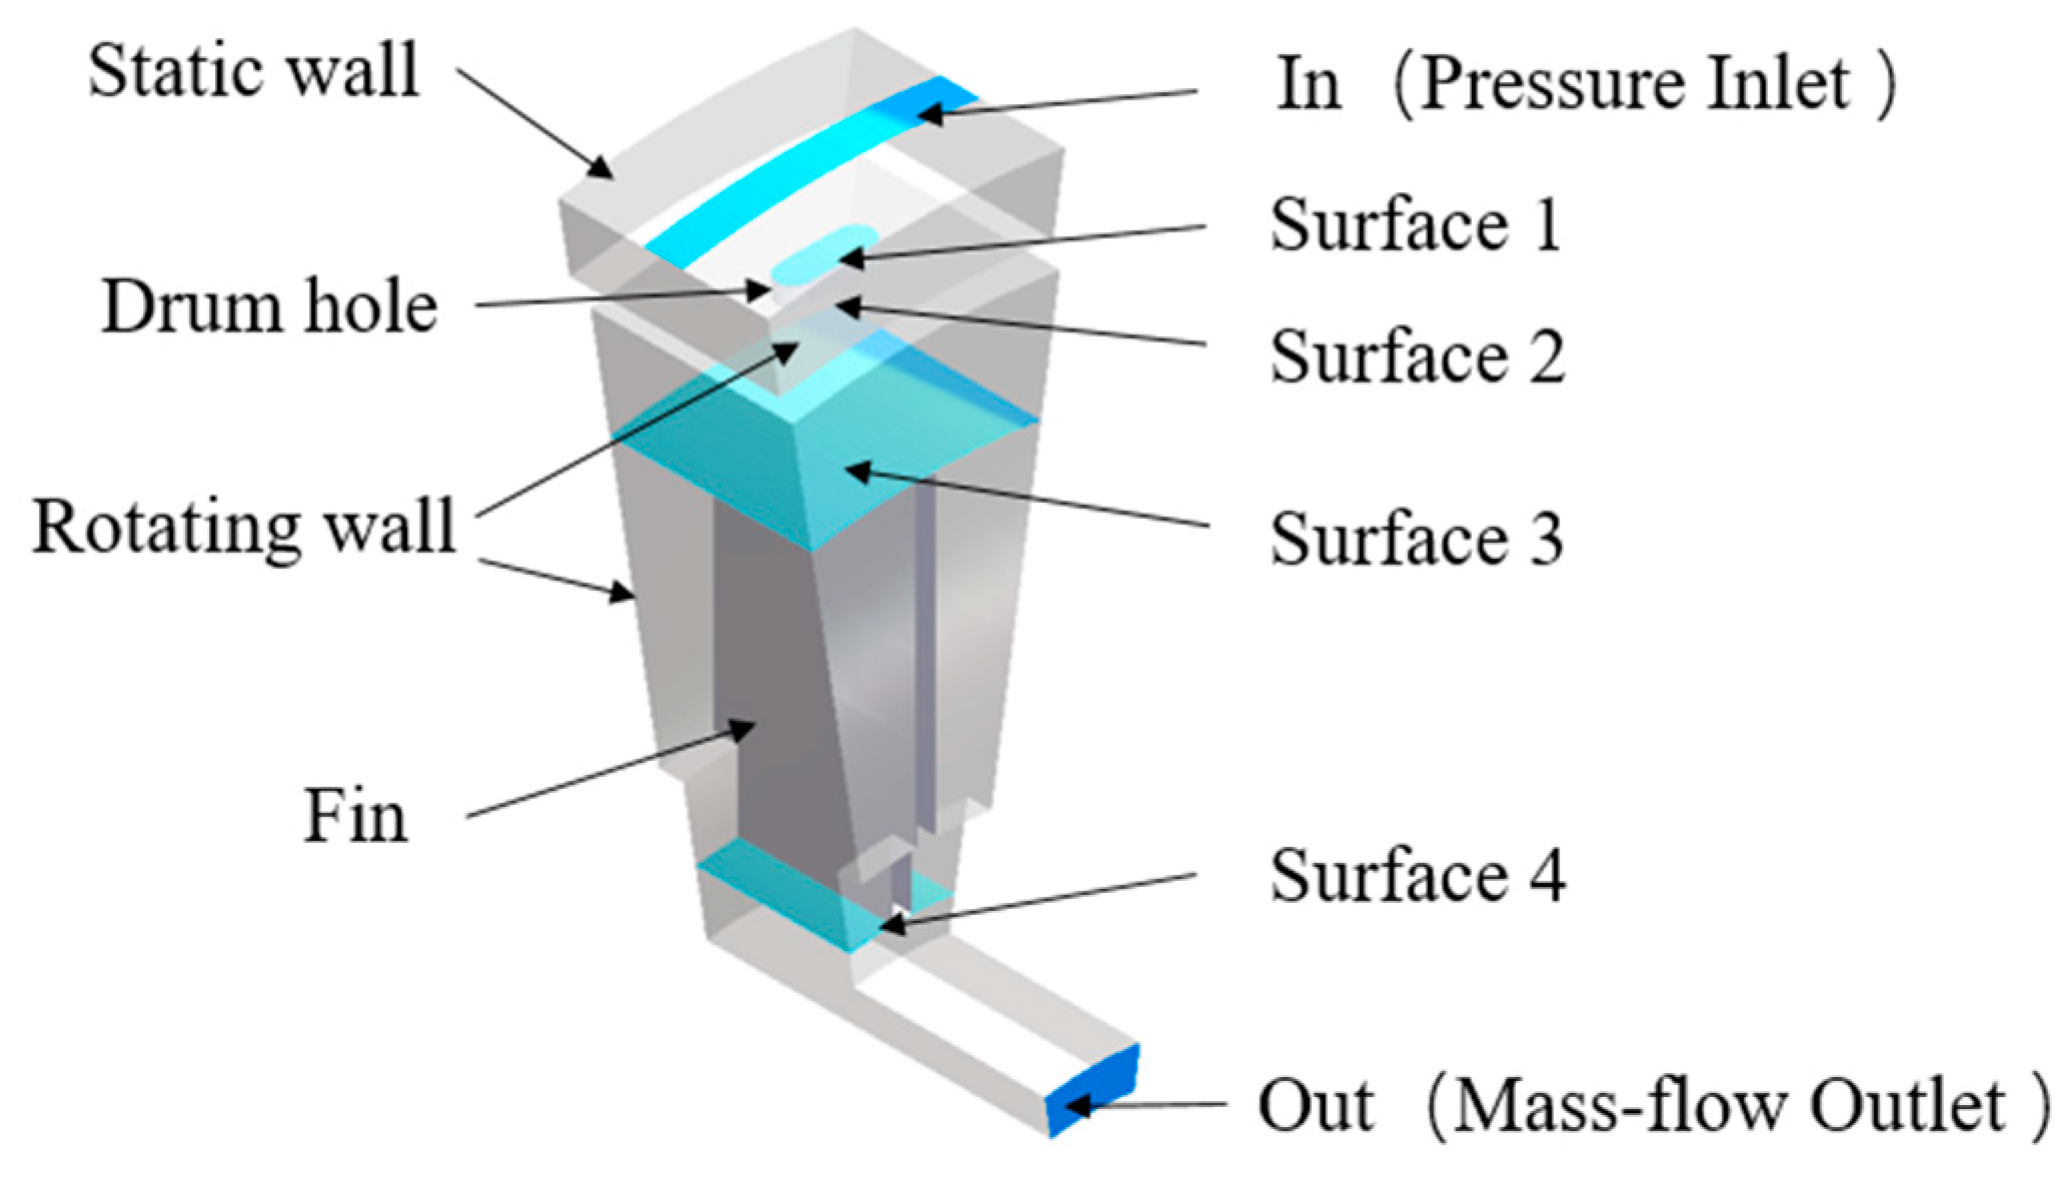
The steady simulation was conducted using the software package ANSYS CFX in combination with the grid generator ICEM in this study. The computational domain (shown as Figure 3) selected in this study starts from the plenum chamber and sequentially passes through the drum-hole and the fins, finally reaching the outlet of the cavity. The computational domain was consistent with the experimental setup, as shown in Figure 2.
The boundary conditions are listed in Table 2. The inlet was a pressure inlet boundary with experimental data; the outlet of the axial air passage was a flow outlet. The rotating disc and axial air passage had adiabatic and no-slip wall conditions, and the working fluid was assumed to be an ideal gas. Pressure and flow monitoring points were set at the inlet and outlet, respectively. The calculation was considered to be converged when the pressure difference between any two iterations within 100 steps was less than 0.05% and the residual was less than 10−5.
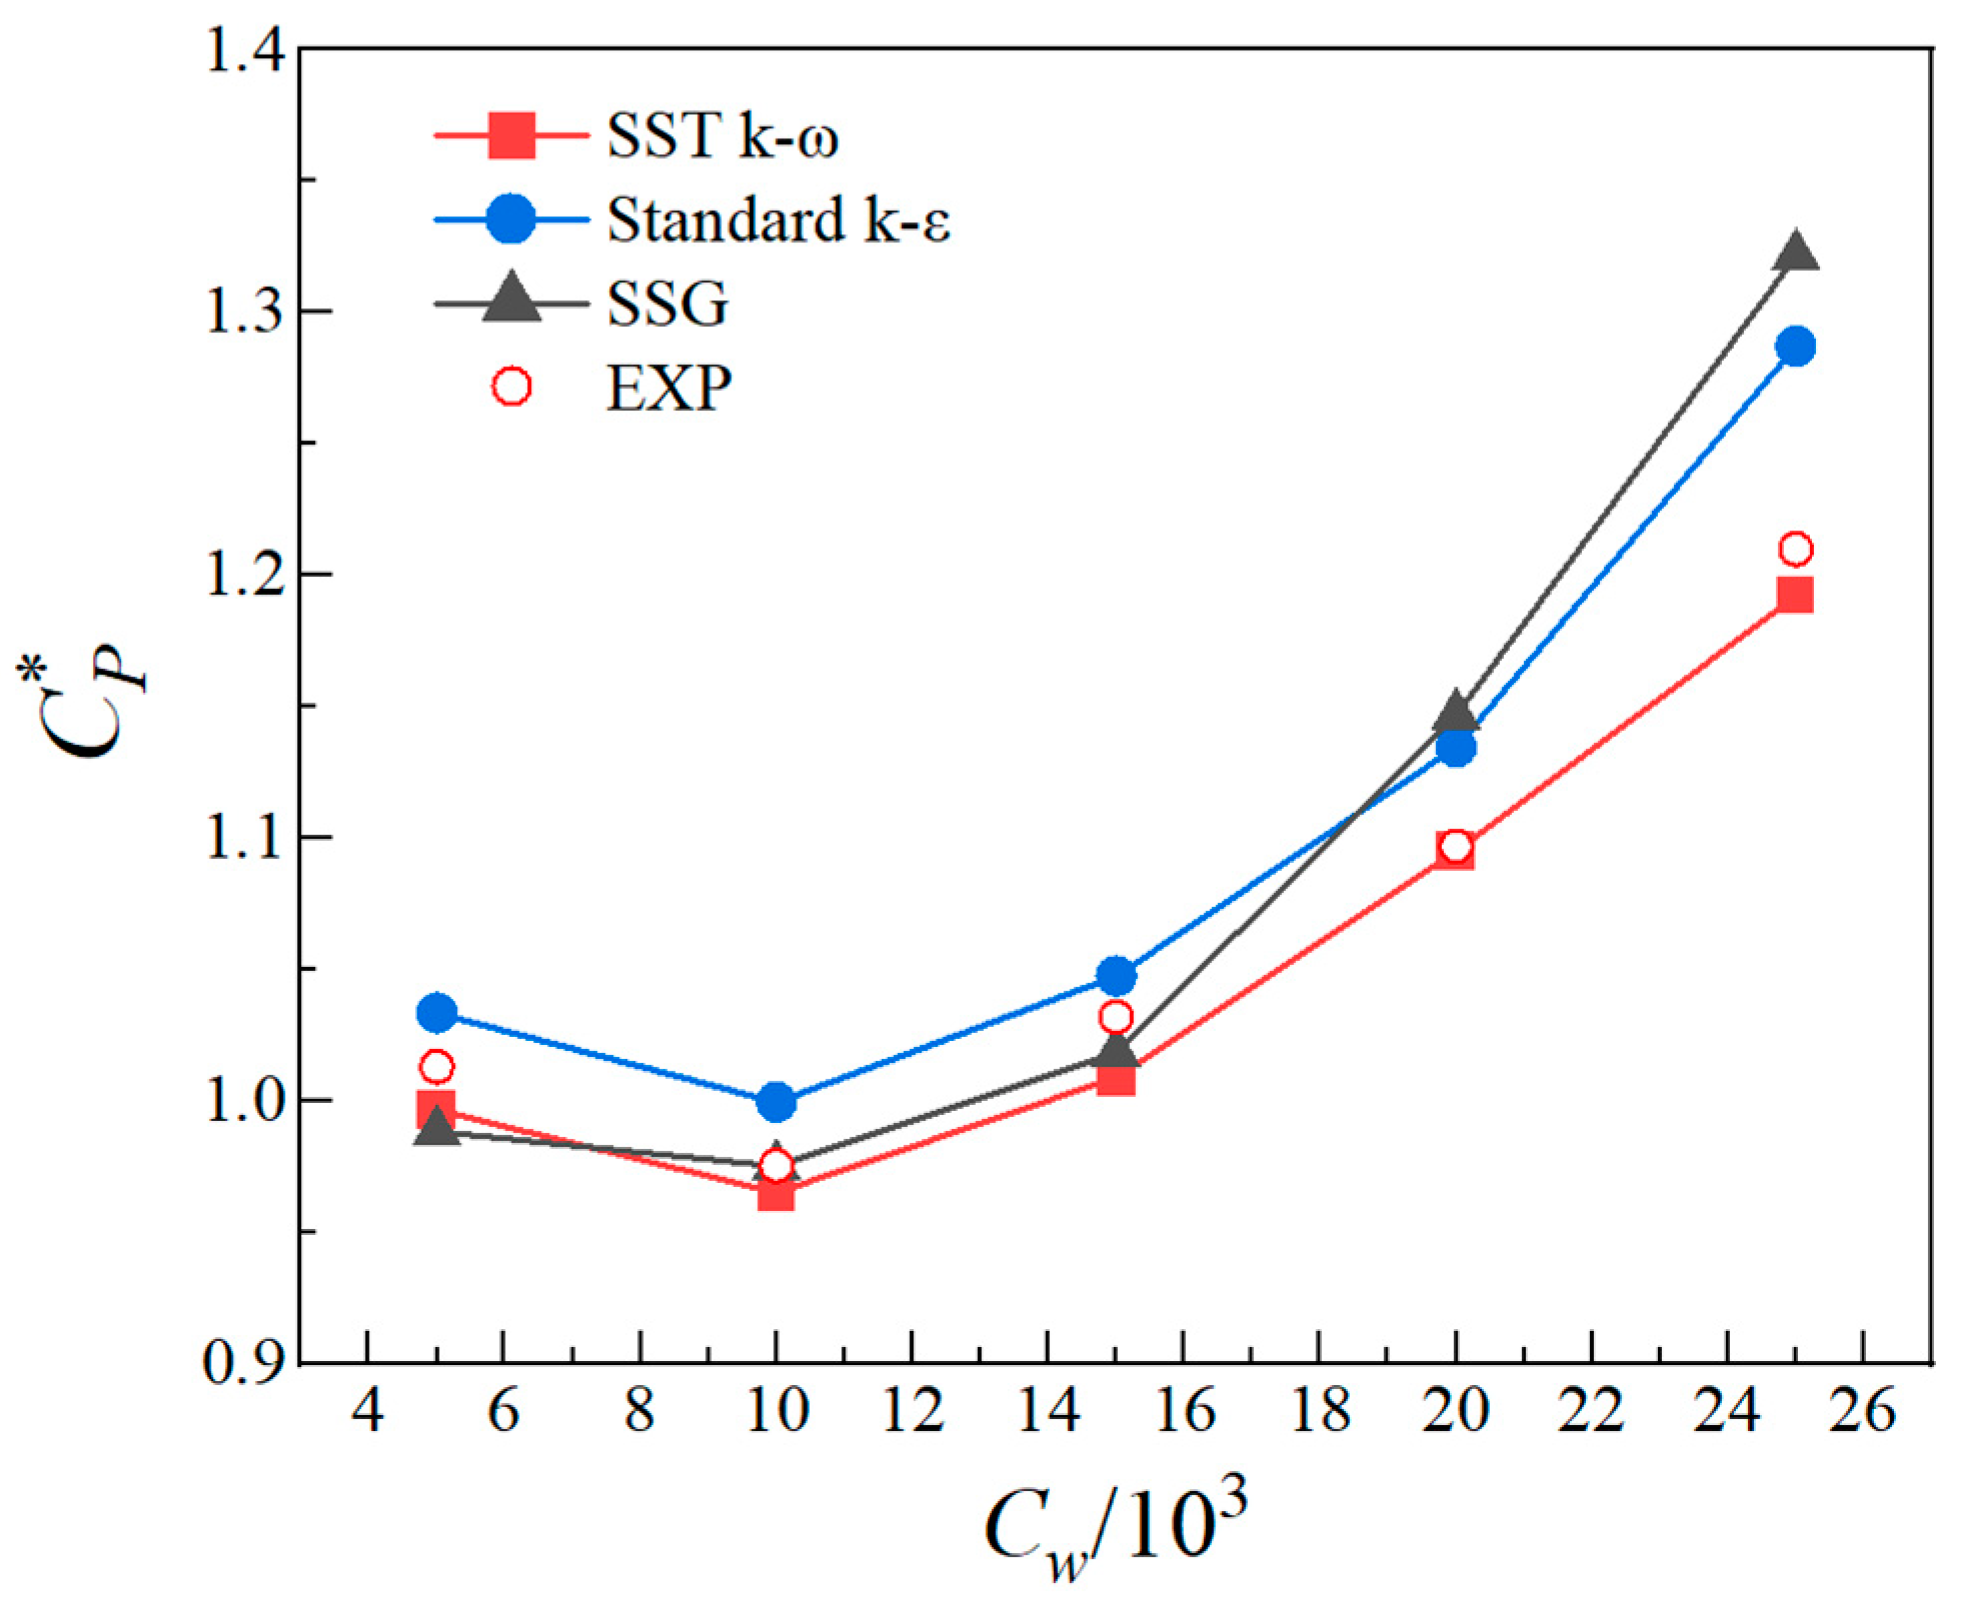
After comparing different turbulence models with experiment data (as shown in Figure 4), the SST k–ω turbulence model was selected for turbulent flow simulation in this study, incorporating a hybrid wall function to address the issue of excessive mesh density near the walls, thereby balancing accuracy and computational efficiency.
Unstructured grids were employed for mesh generation, with grid refinement near the wall region. The first layer of cells near the wall had a height of 0.005 mm and a growth factor of 1.2, resulting in a total of 15 boundary layers with 20 < y+ < 50, satisfying the requirements of the SST k–ω turbulence model’s wall function. Figure 5 shows the results of the calculation of different grids. When the number of grids was greater than one million, the pressure loss of the disc cavity tended to be stable, particularly when combined with the Grid Convergence Index (GCI) criteria [22], the results of which are listed in Table 3. Considering accuracy and efficiency, the total number of grids chosen was approximately 1.8 million.
A comparison of the experimental and CFD results is shown in Figure 6. The CFD calculation results agreed well with the experimental data. The average error was less than 5%. This validates the accuracy of the CFD calculation method in this paper.

2.4. Nondimensional Parameters

The nondimensional parameters used in this paper are defined below.
The rotational Reynolds number is  R e ϕ :
R e ϕ = ω R b 2 ν ,
where  ω  is the angular velocity of the cavity, and  ν  is the kinetic viscosity.
The nondimensional mass flow rate is  C w :
C w = m ˙ ν R b ,
where  m ˙  is the mass flow rate.
The total pressure loss coefficient is  C p * :
C p * = p * 1 2 ρ ω 2 R b 2 ,
where  ρ  is the fluid density and  Δ p * = p i n * p o u t * .
The swirl ratio β is calculated as follows:
β = V ϕ ω r ,
where  V ϕ  is the tangential velocity.

3. Results and Discussion

3.1. Flow Structure

This article obtains the flow field structure inside the cavity via numerical simulations and analyzes the impact of the vane structure on pressure loss. Figure 7 shows the streamlines and swirl ratio distribution in the r– θ  cross-section at different rotating Reynolds numbers (the stationary domain is not shown in the figure). The calculation was performed with xfi = 0.856, xfo = 0.394, and Cw = 1.00 × 10⁵. After passing through the plenum chamber, the airflow enters the rotating cavity through the holes in the drum. In the upstream region of the vane, the airflow deviates in the direction of rotation within the rotating cavity, forming a large region of rotational core and a rapidly increasing swirl ratio. The vane structure constrains the radial flow direction of the airflow, and the swirl ratio changes less in the region of the vanes, remaining close to one with limited growth. As the rotating Reynolds number increases, the swirl ratio in the vane-induced region remains almost unchanged, while the swirl ratio downstream of the vane gradually decreases.
With an increase in rotation speed, the swirl ratio in the upstream region of the vane gradually increases. After flowing out from the lower radius of the vane, the streamlines quickly deviate toward the direction of rotation as the radius decreases, resulting in an increase in the swirl ratio. The swirl ratio gradually increases below the outlet of the vanes in the radial direction, while the swirl ratio at the same radial position decreases with the increase in rotation speed. Finally, the flow exits the swirl reducer through the axial passage.
Figure 8 shows the streamline and swirl ratio distribution in the r–θ cross-section at different dimensionless mass flow rates. In the cross-section, the airflow separates on the suction surface of the fin, forming clockwise vortices between adjacent vanes, while another portion flows radially inward along the suction surface. The clockwise vortices flow radially inward along the surface after reaching the pressure surface. The swirl ratio within the radial range of the vane arrangement increases with the mass flow rate. Below the outlet of the vanes, the swirl ratio gradually increases in the radial direction, and, at the same radial position, the swirl ratio increases with the mass flow rate.
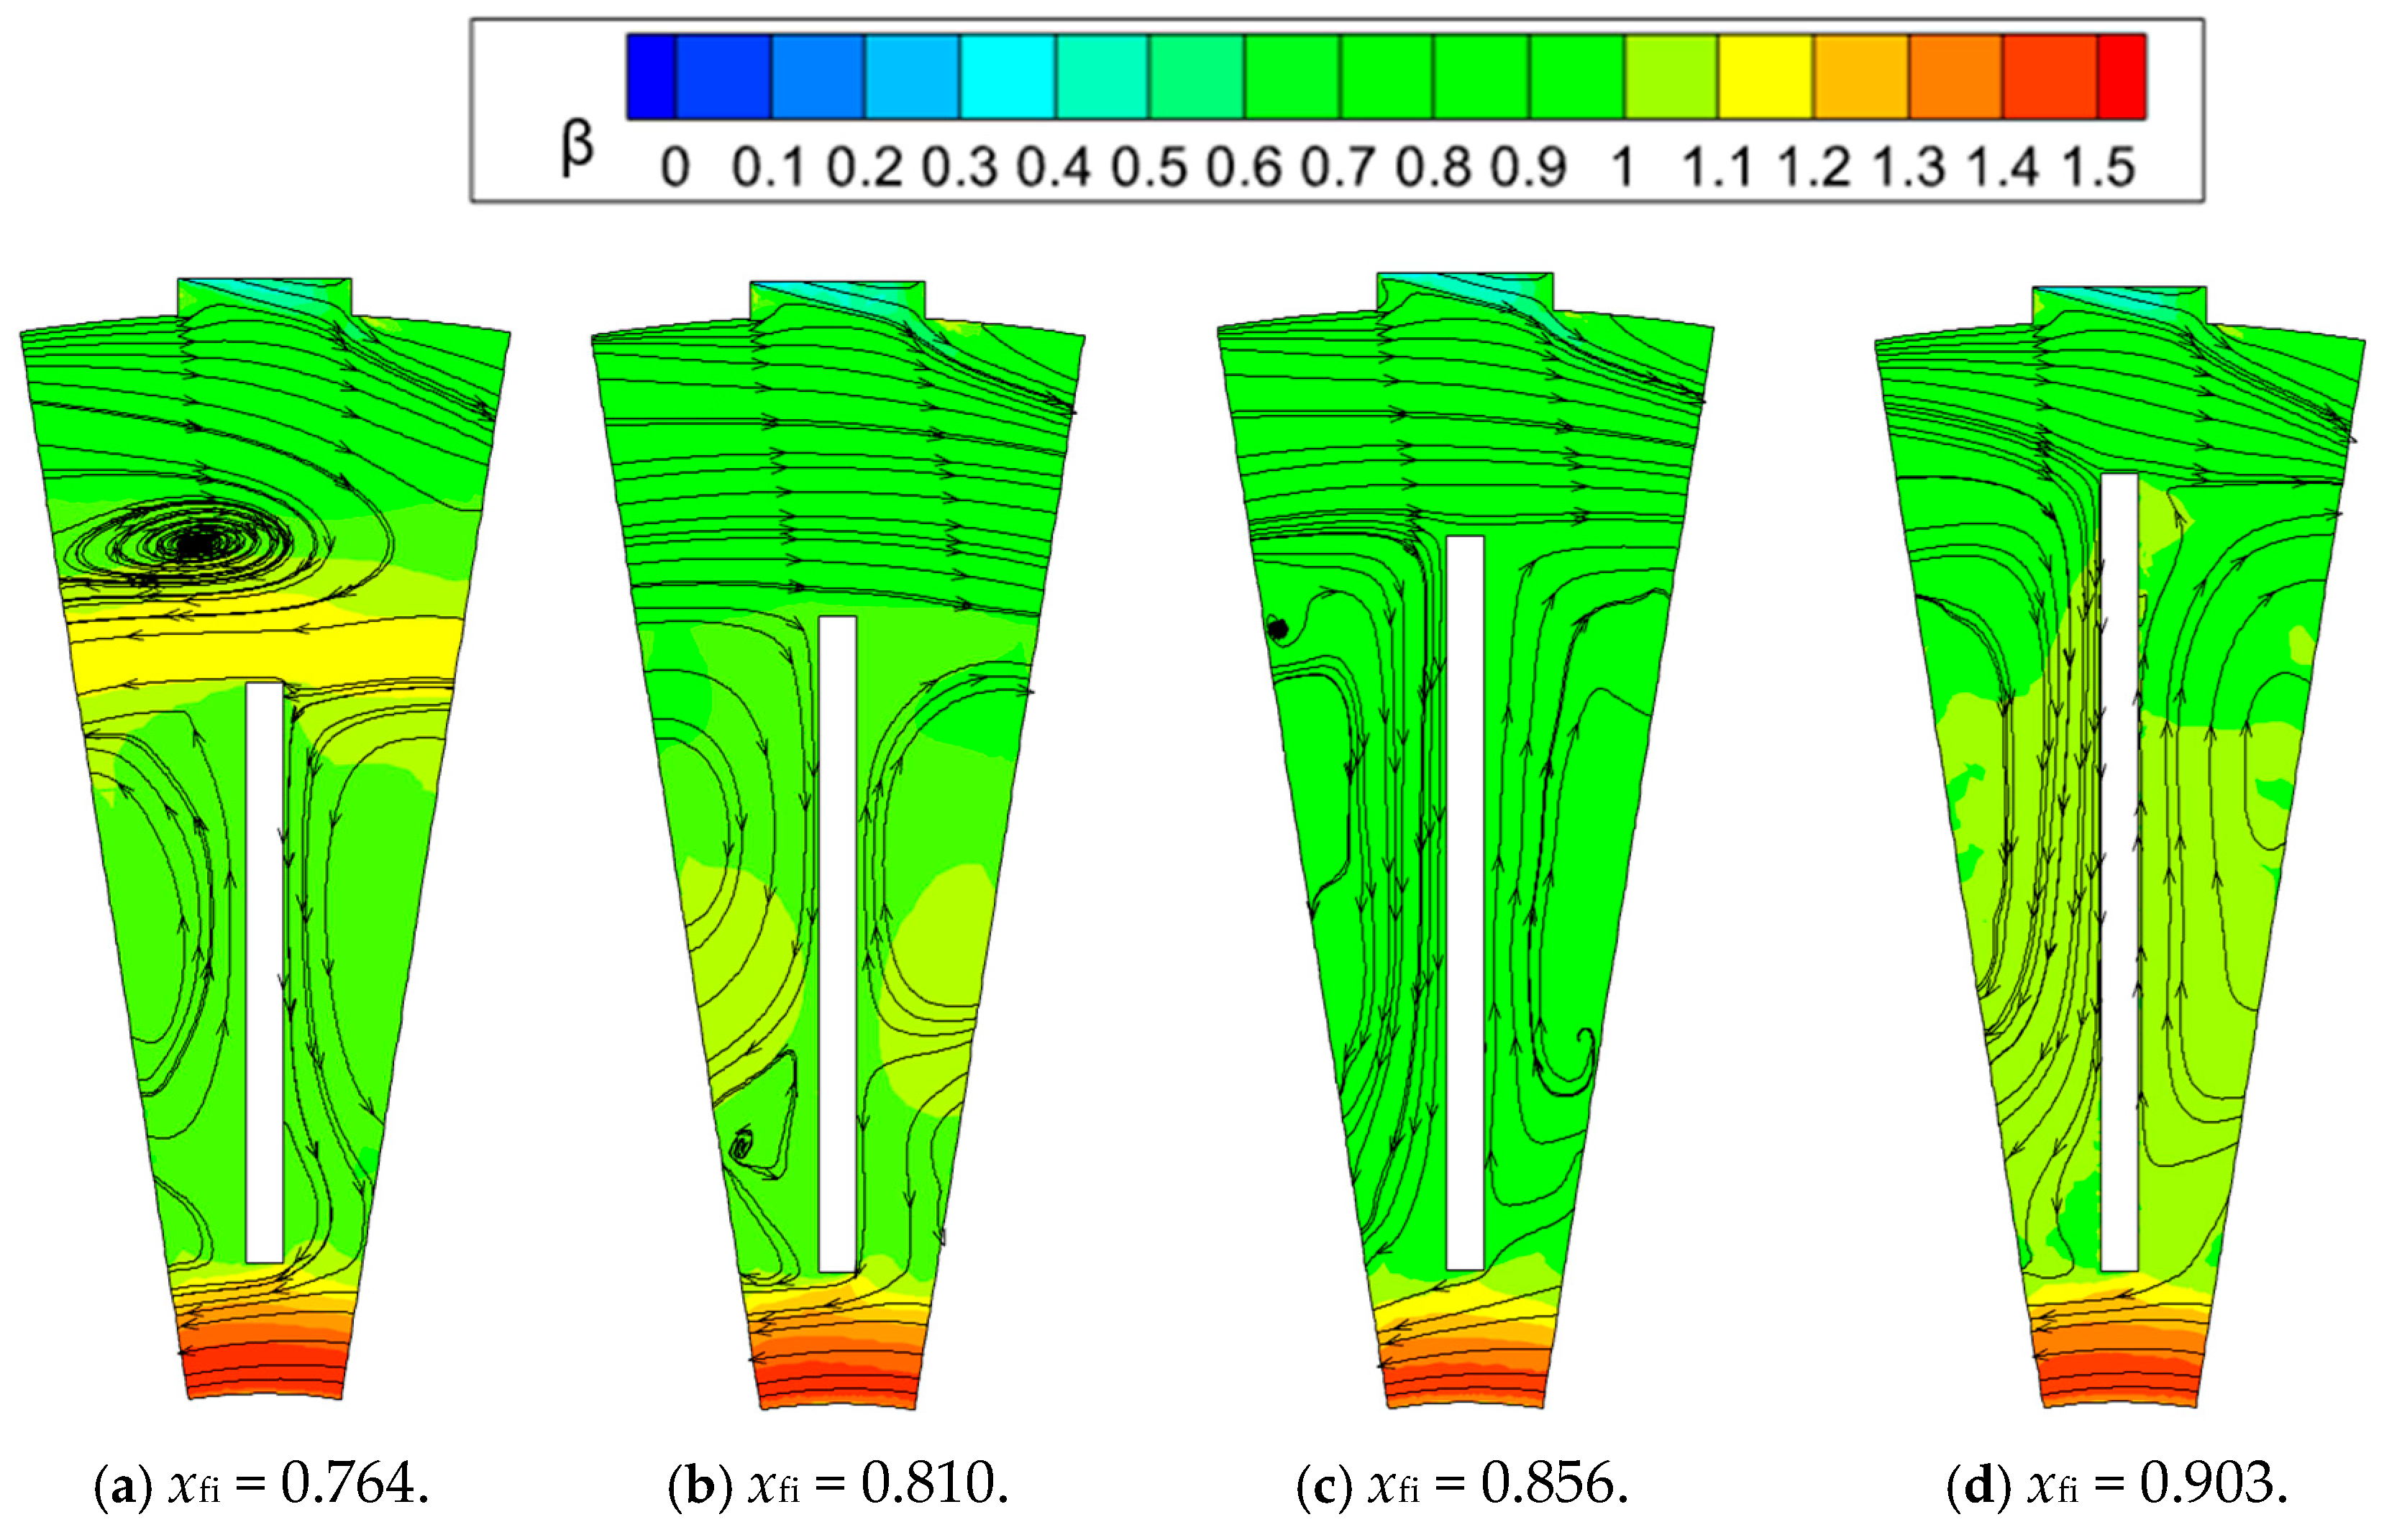
On the basis of the cavity structure and flow patterns, we define the region from the exit surface of the drum holes (surface 2) to the radius section, where the inlet of the fin is located (surface 3) as region I. The region from the fin inlet to the fin outlet section (surface 3) is defined as region II. The downstream region from the fin outlet (surface 3) to Ra is defined as region III. We observe the flow characteristics in each of these regions.

Region I

The flow streamline distribution and swirl ratio maps are shown in Figure 9, for the same rotational speed and flow rate (ReΦ = 1.82 × 10⁶, Cw = 1.00 × 10⁵), but with different blade inlet radii. When the blade inlet radius is smaller, the airflow gradually develops upstream, resulting in an increased swirl ratio greater than one, with the same rotational direction as the rotor. However, when the blade inlet radius is larger (e.g., xfi = 0.903), the swirl ratio does not increase to one before flowing into the fin region.
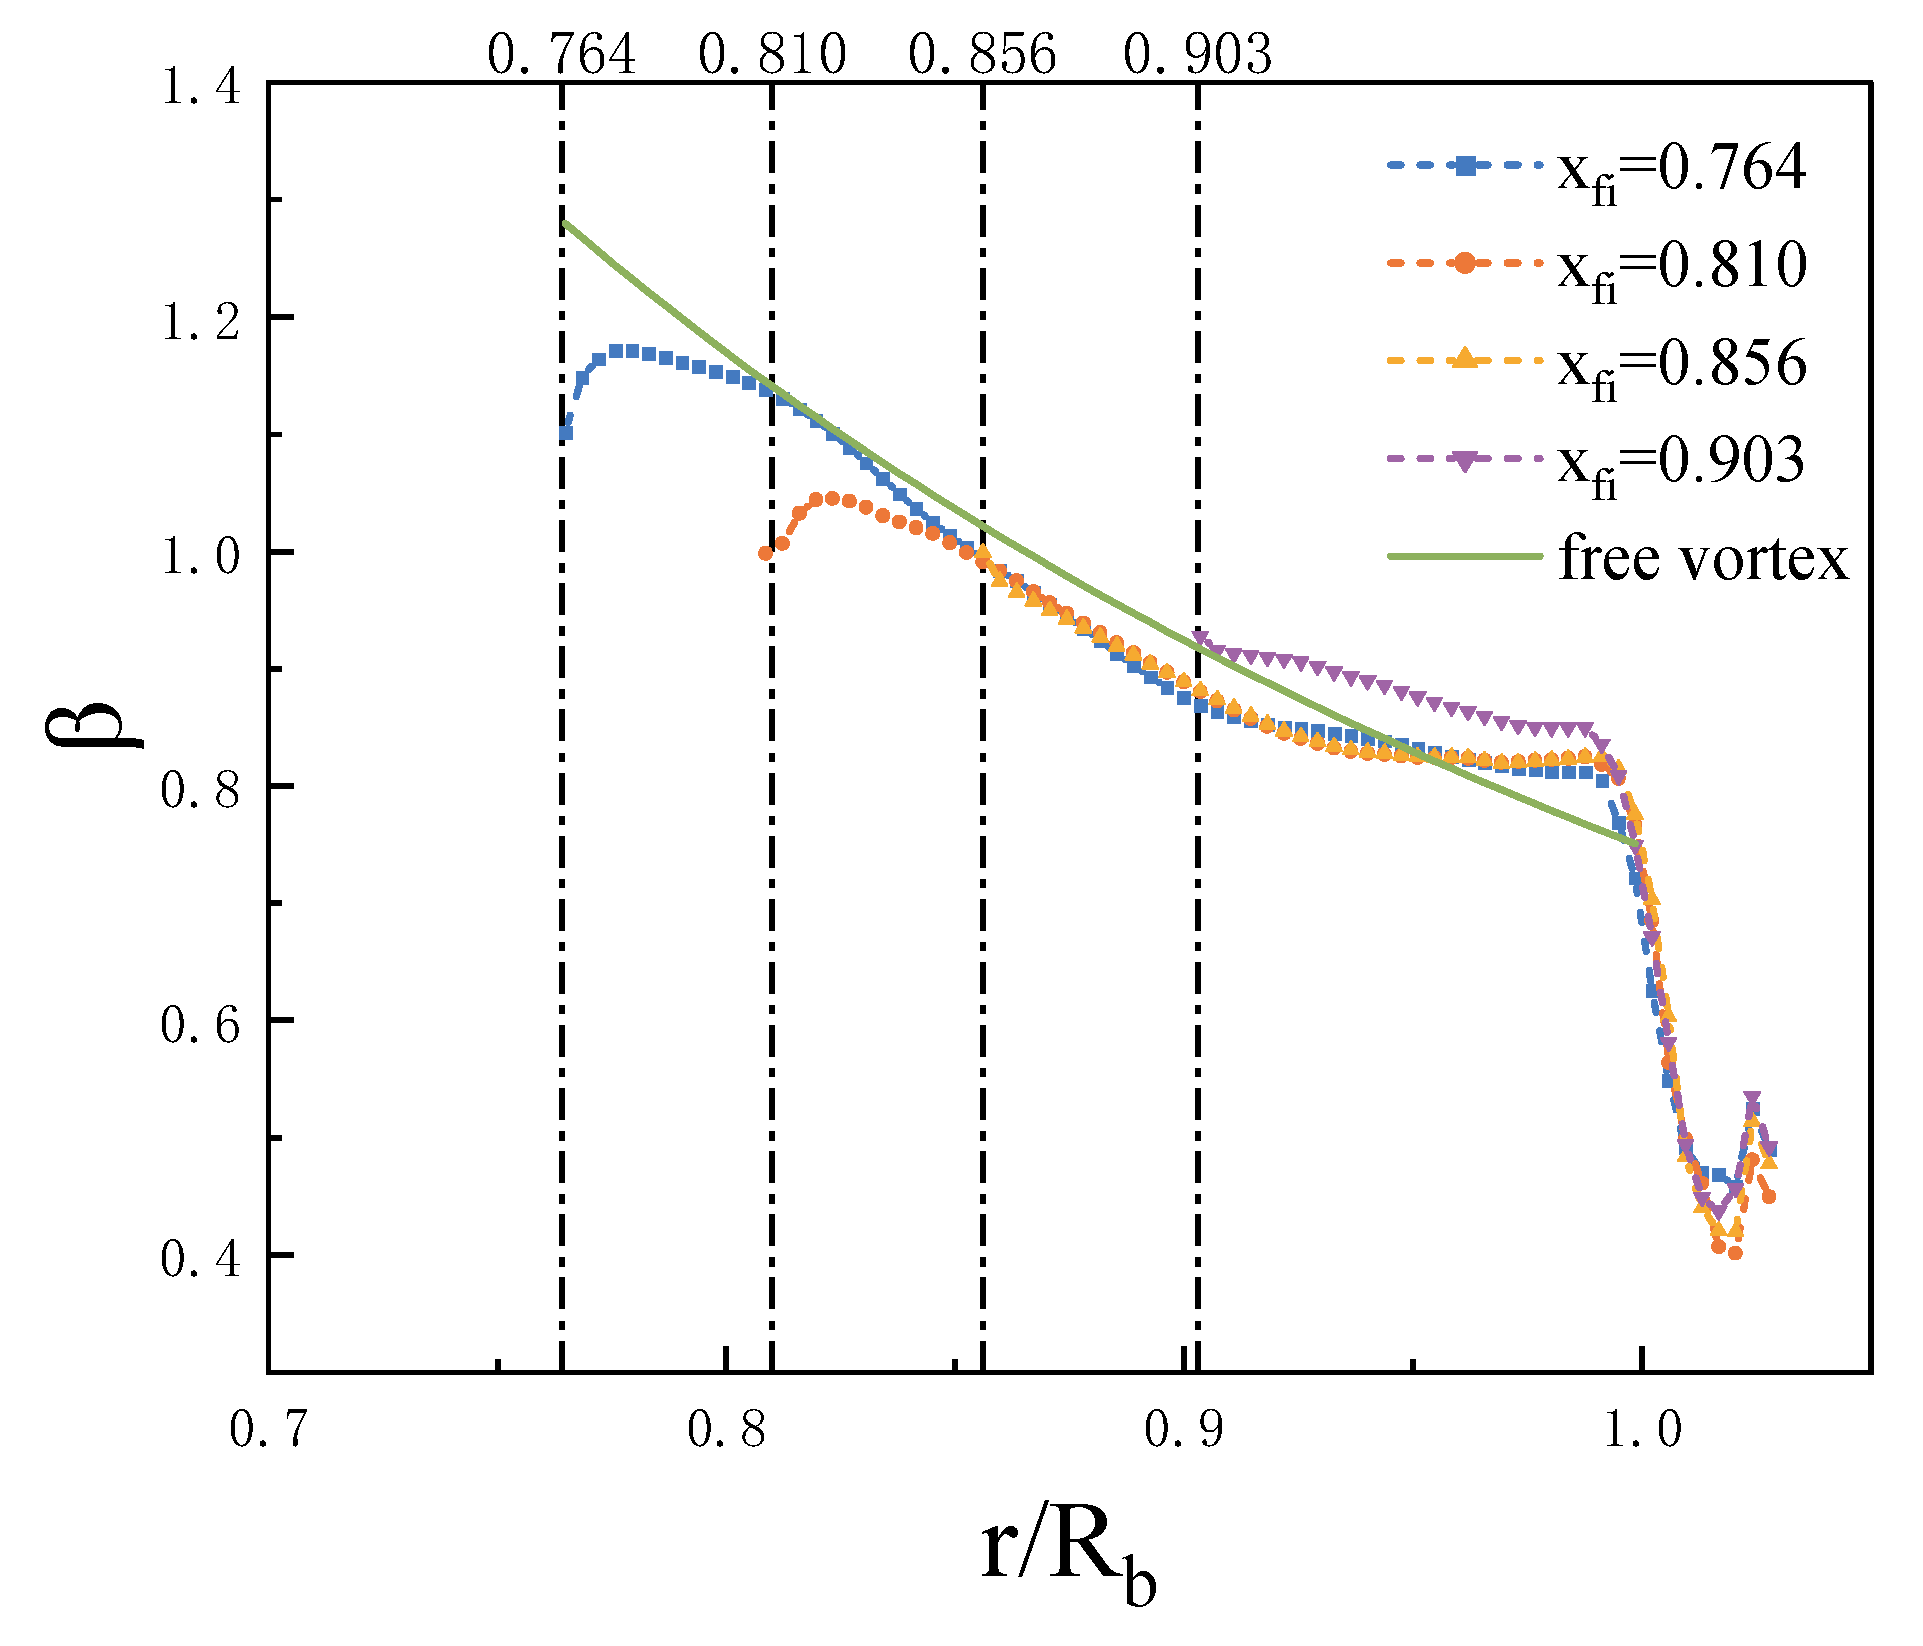
The swirl ratio within this region is shown in Figure 10. The airflow is influenced by the action of the drum holes and possesses a certain amount of pre-swirl, denoted as “c”, upon entering the cavity. Subsequently, under the influence of the cavity, the tangential velocity gradually increases. Within the source region, angular momentum conservation can be assumed according to the hypothesis of the free vortex theory (see [7] for further details).
V Φ Ω r = c x 2 .
Due to the nonuniformity of the incoming airflow and the influence of the fins on the upstream flow, the swirl ratio is slightly lower than that predicted by the free vortex model. Additionally, as the airflow approaches the vicinity of the fin inlet, the impact of the fins on the flow causes the swirl ratio to approach one.

Region II

Due to the action of the fins, the airflow is constrained in the radial direction. The swirl ratio in the region of the guide vanes changes only slightly and remains close to one, with limited growth. After the airflow impinges on the guide vanes, it splits into two paths on the suction surface. One part flows radially inward along the suction surface of the guide vanes, while the other flows radially outward and forms a counterclockwise vortex system in the high-radius region. This vortex system crosses the outer radius of the guide vanes and enters the pressure surface, flowing radially inward.

Region III

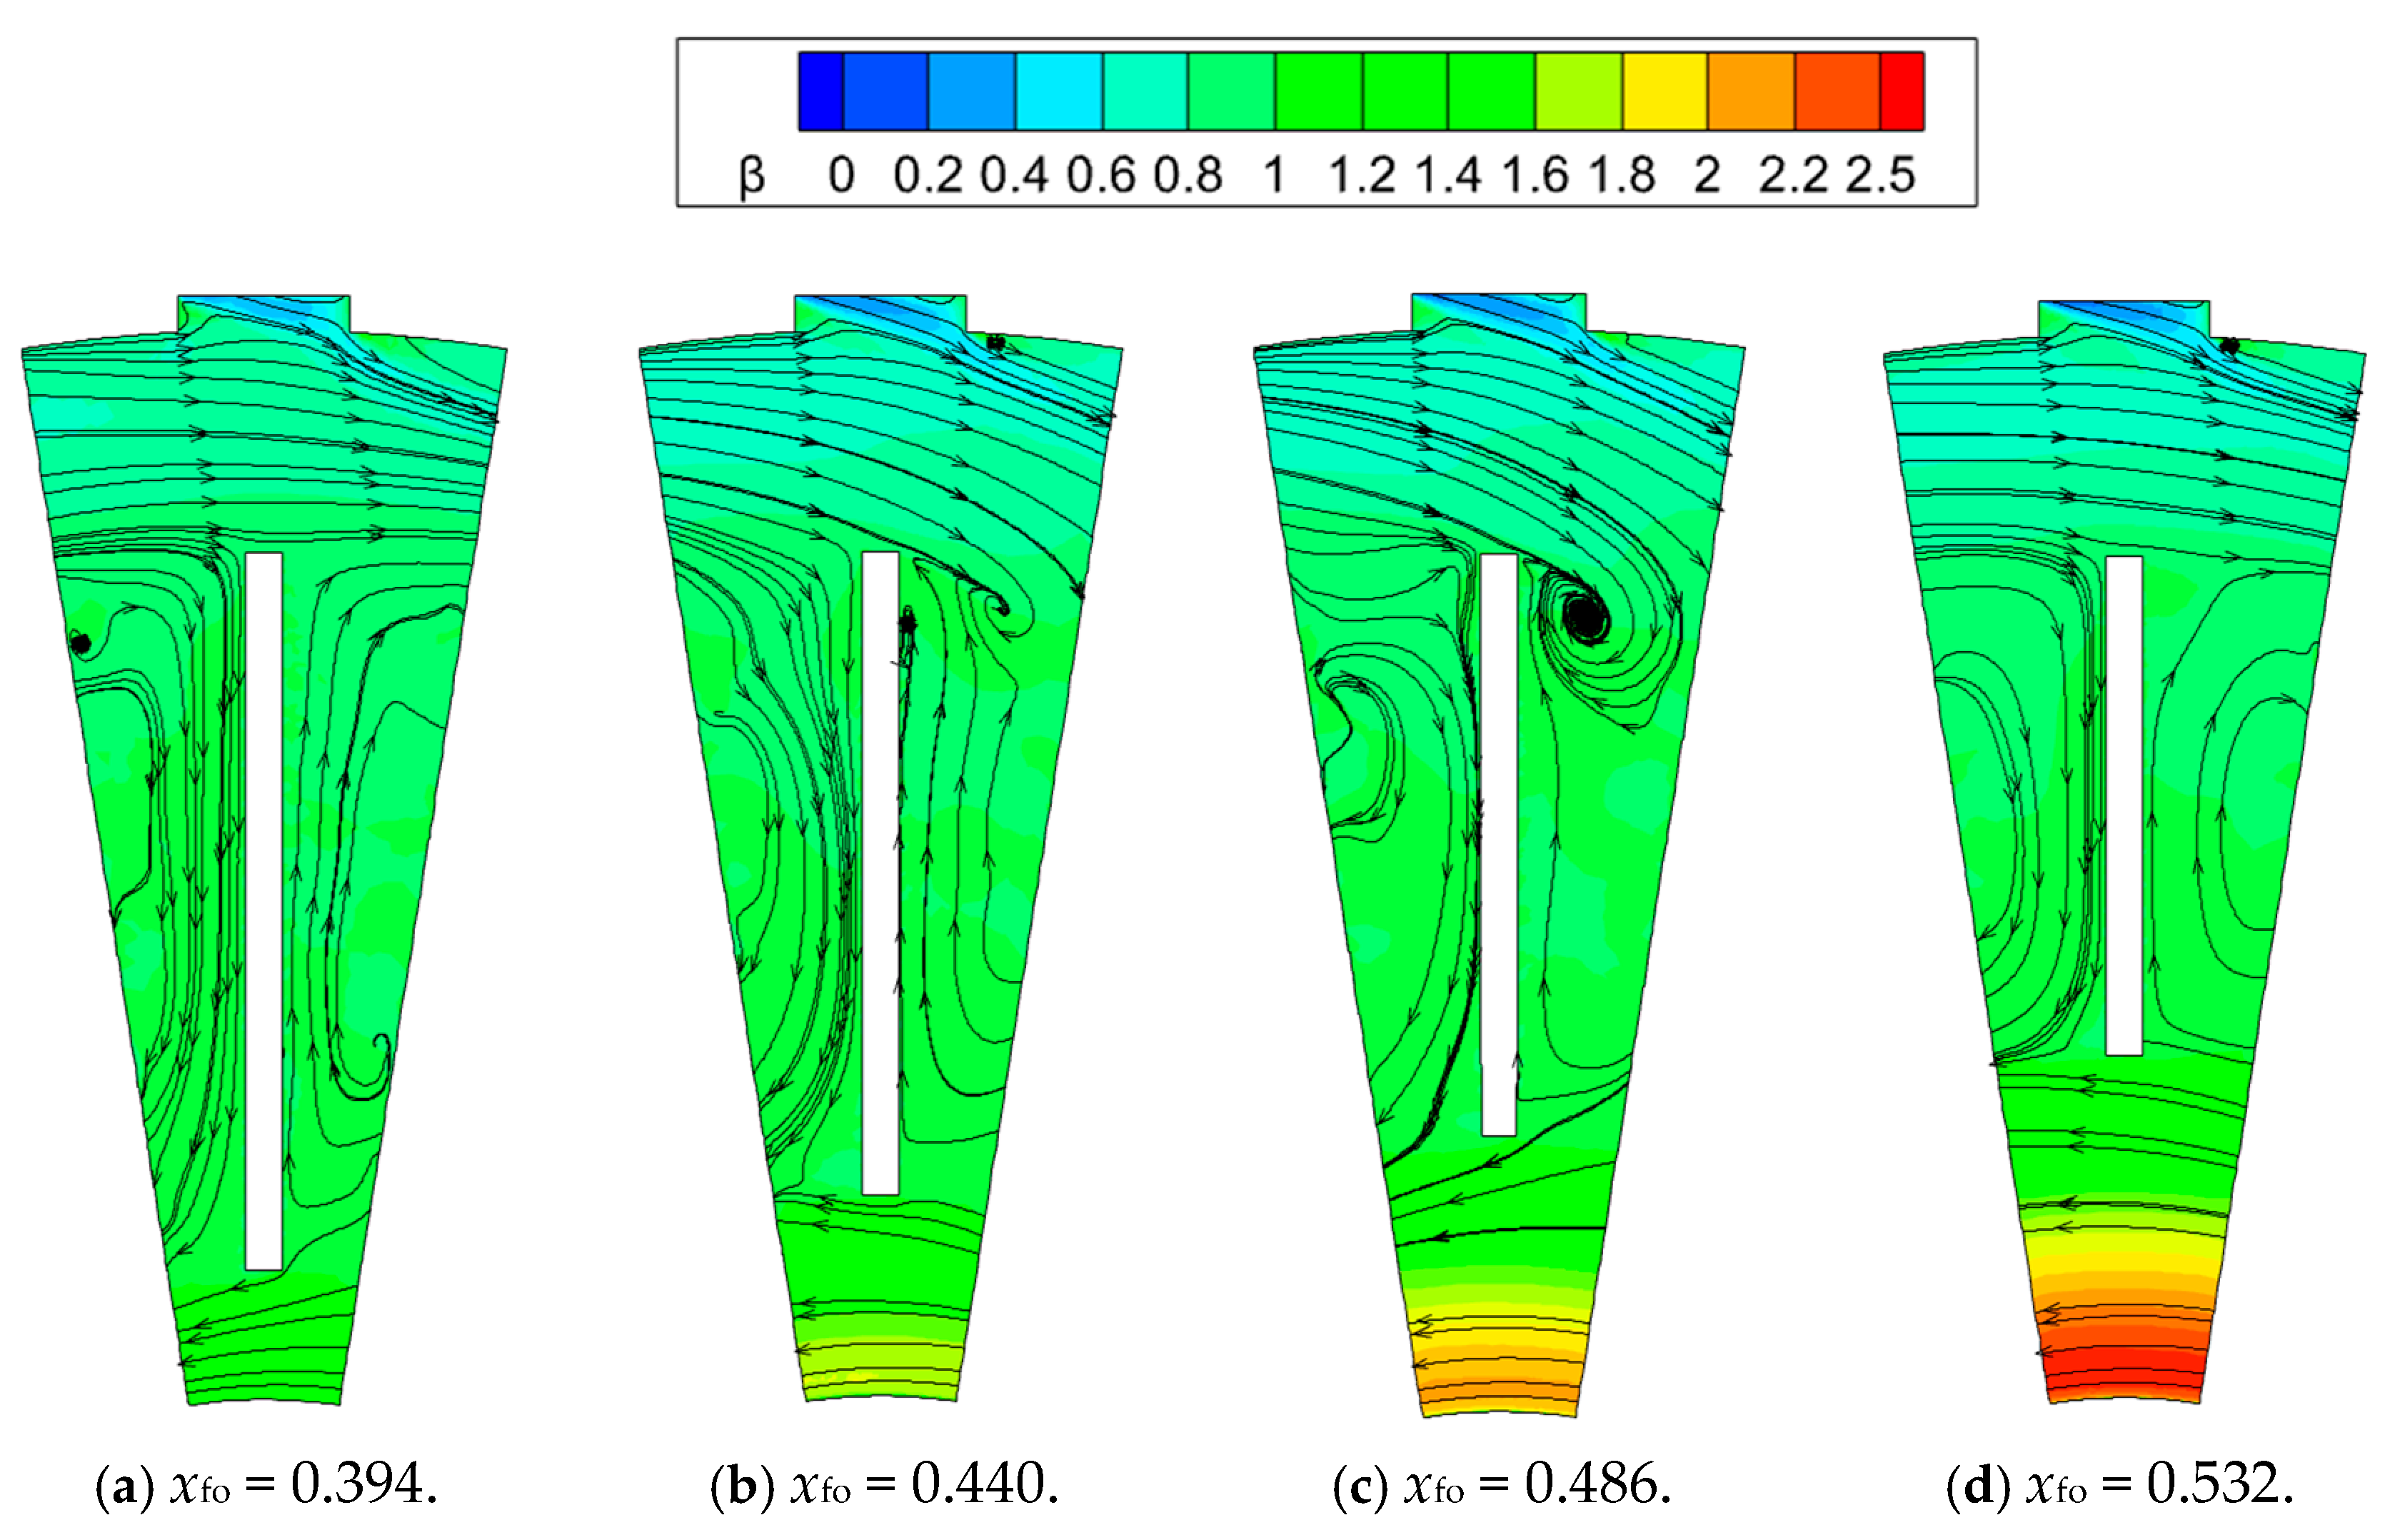
The flow structure of region III is shown in Figure 11. Considering the fin exit as the new starting point of the cavity, it can be observed that region III also conforms to the free vortex theory (as shown in Figure 12). Due to the presence of turns in the cavity structure, the airflow transitions from radial inflow to axial flow at corresponding locations. The swirl ratio significantly decreases at the turning points.

3.2. Pressure Loss

In this study, numerical simulations and experiments were conducted to obtain the total pressure at the inlet and outlet of the rotating cavity, as well as the static pressure data along the flow path. The total pressure loss coefficient was calculated on the basis of these measurements. It was observed that the numerical simulation results were in good agreement with the experimental results.
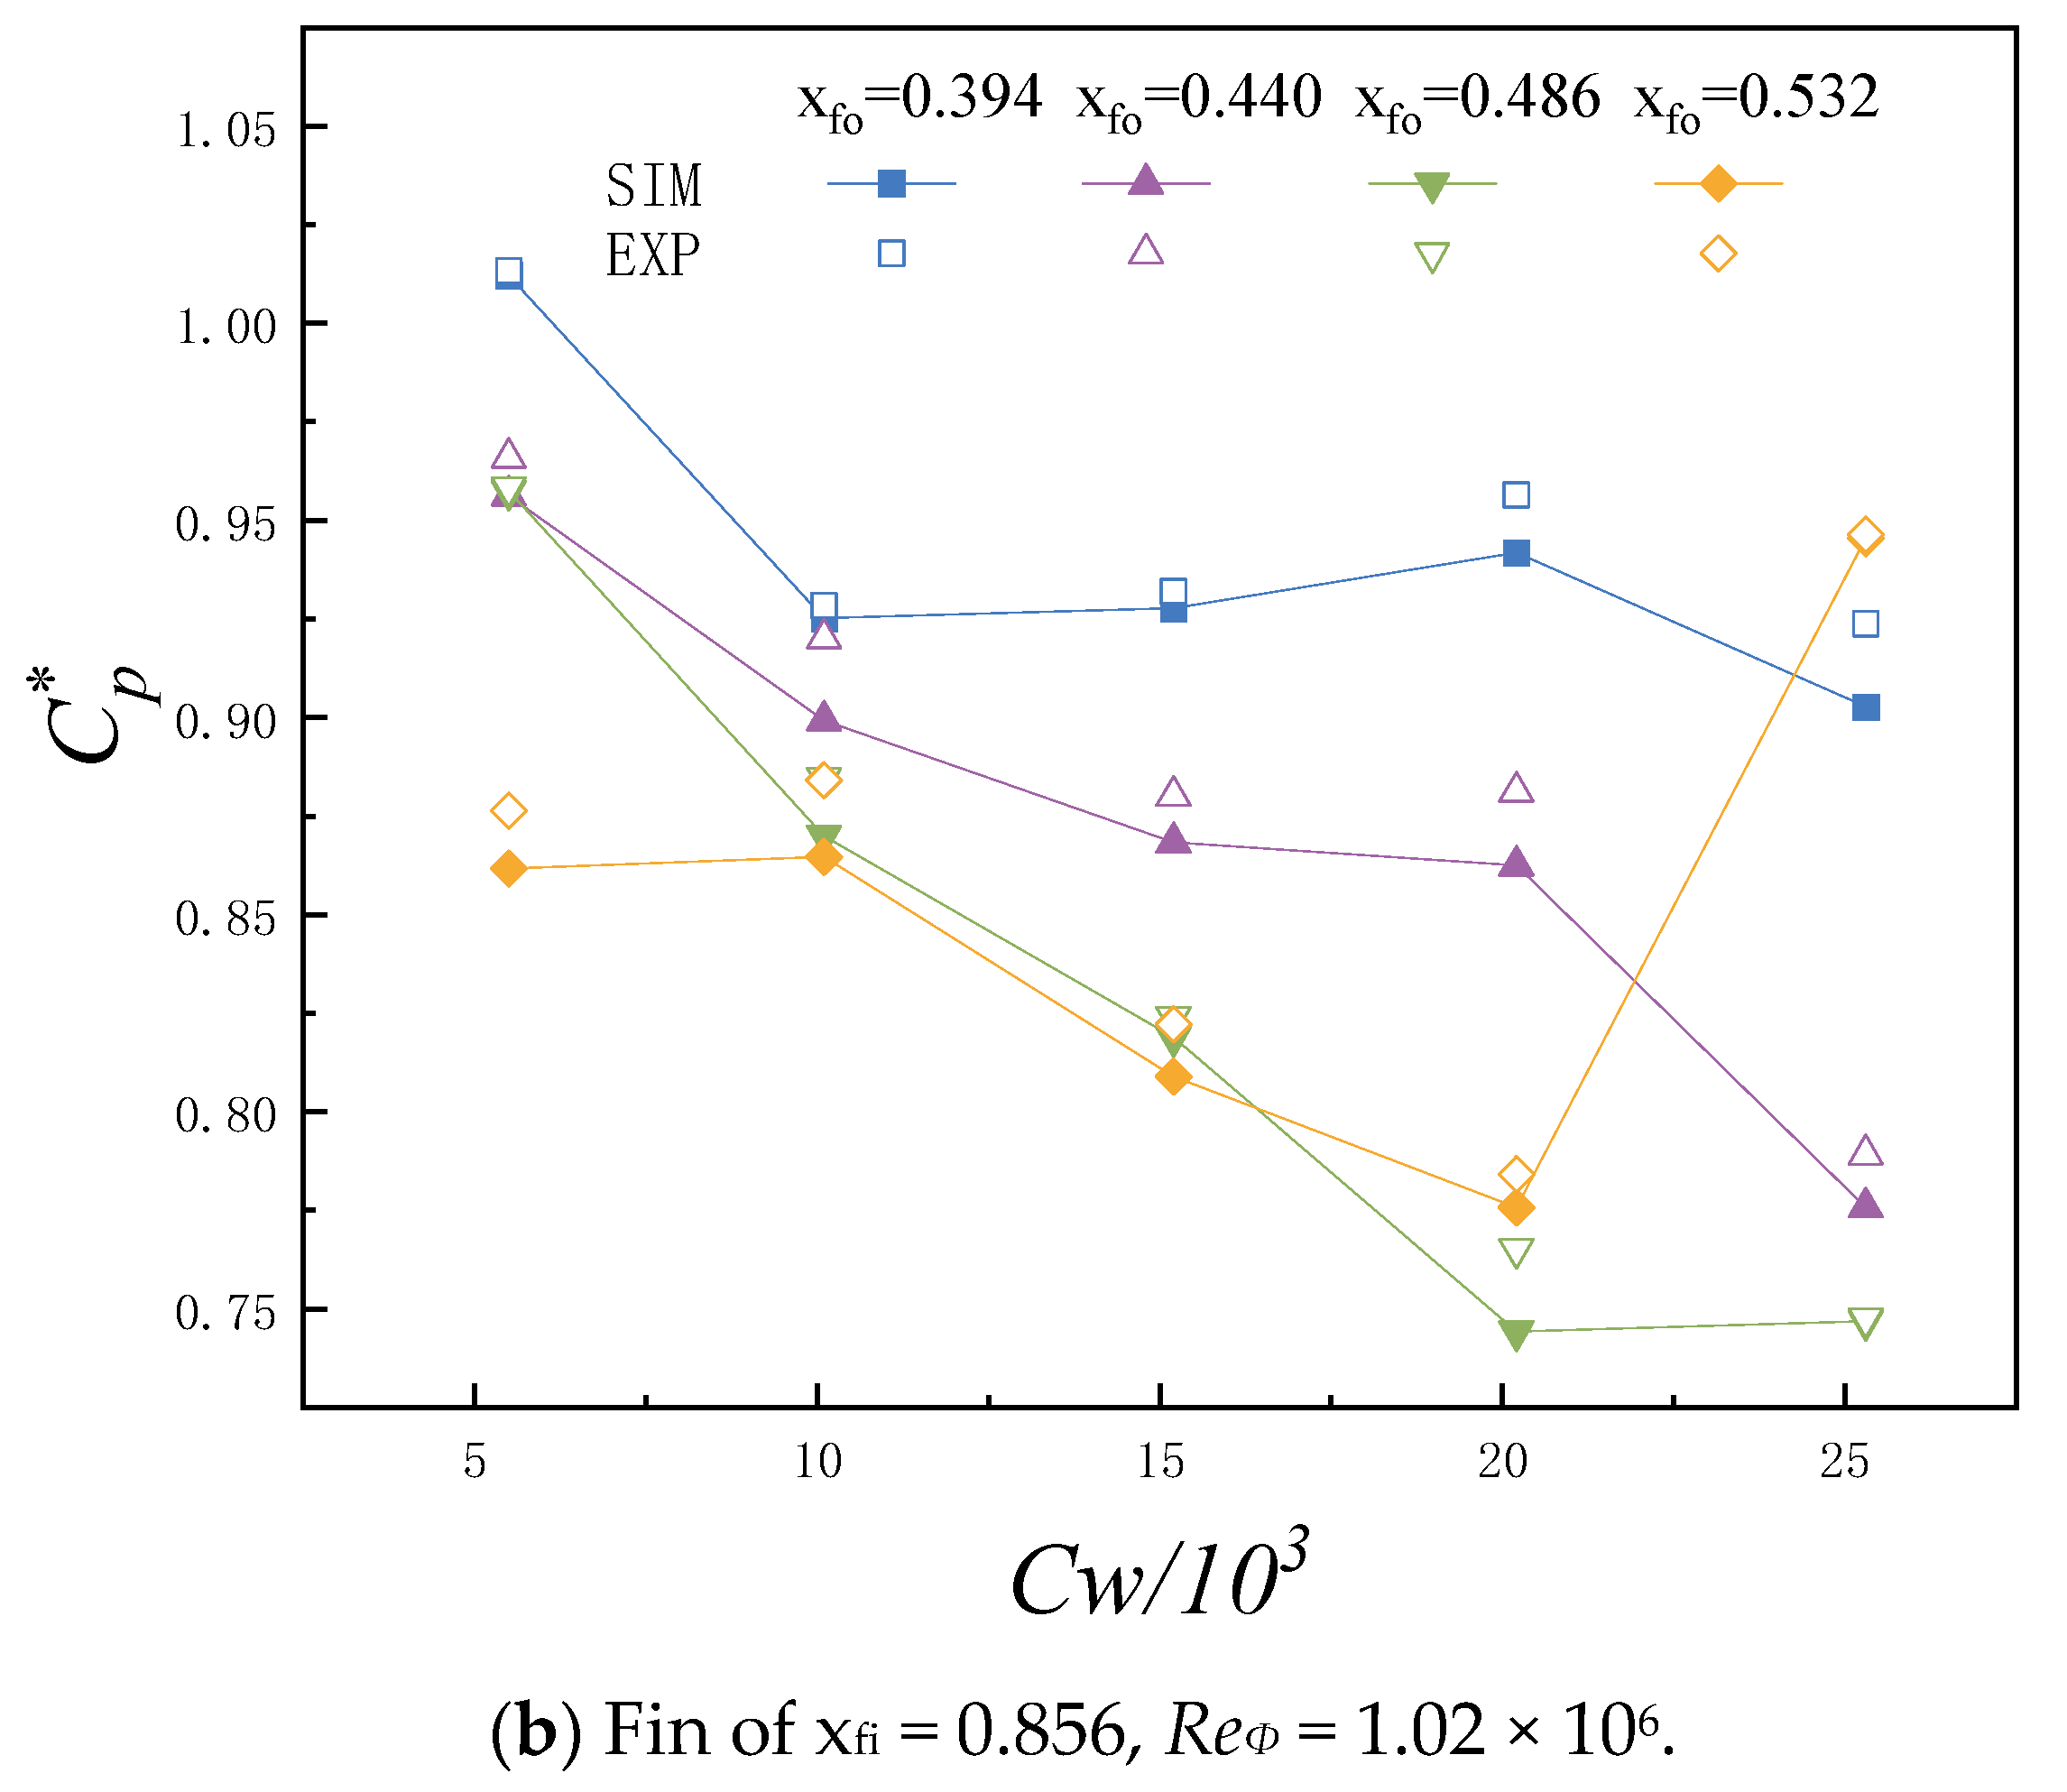
For the inlet and outlet positions of the rotating cavity in this study, it was found that within the range of operating conditions, the total pressure loss coefficient increases with the flow rate when the rotational speed is relatively low. However, for higher rotational speeds, the relationship between the total pressure loss coefficient and the flow rate is not strictly monotonic (as shown in the Figure 13). Instead, there is a minimum value of the pressure loss coefficient at a specific flow rate.
Considering the analysis of the flow structure mentioned earlier, this behavior can be attributed to the combined influence of the rotational Reynolds number and the flow rate coefficient on the tangential velocity of the air at the inlet of the fins. When the tangential velocity of the air is significantly larger or smaller compared to the rotational speed of the rotor, it can result in the occurrence of significant dissipation and increased pressure losses due to impingement on the fins. Therefore, when swirl ratio at the fin inlet equal to 1, influence jointly the rotational Reynolds number and flow rate coefficient, the total pressure loss coefficient is minimized.
In regions where viscous effects are negligible and where the radial and axial components of velocity are small compared with the tangential component,  V ϕ , the radial pressure gradient can be calculated as follows:
d p ρ d r = V ϕ 2 r .
Equation (6) can be written in the integral form,
Δ p = ρ ω 2   r β 2 d r .
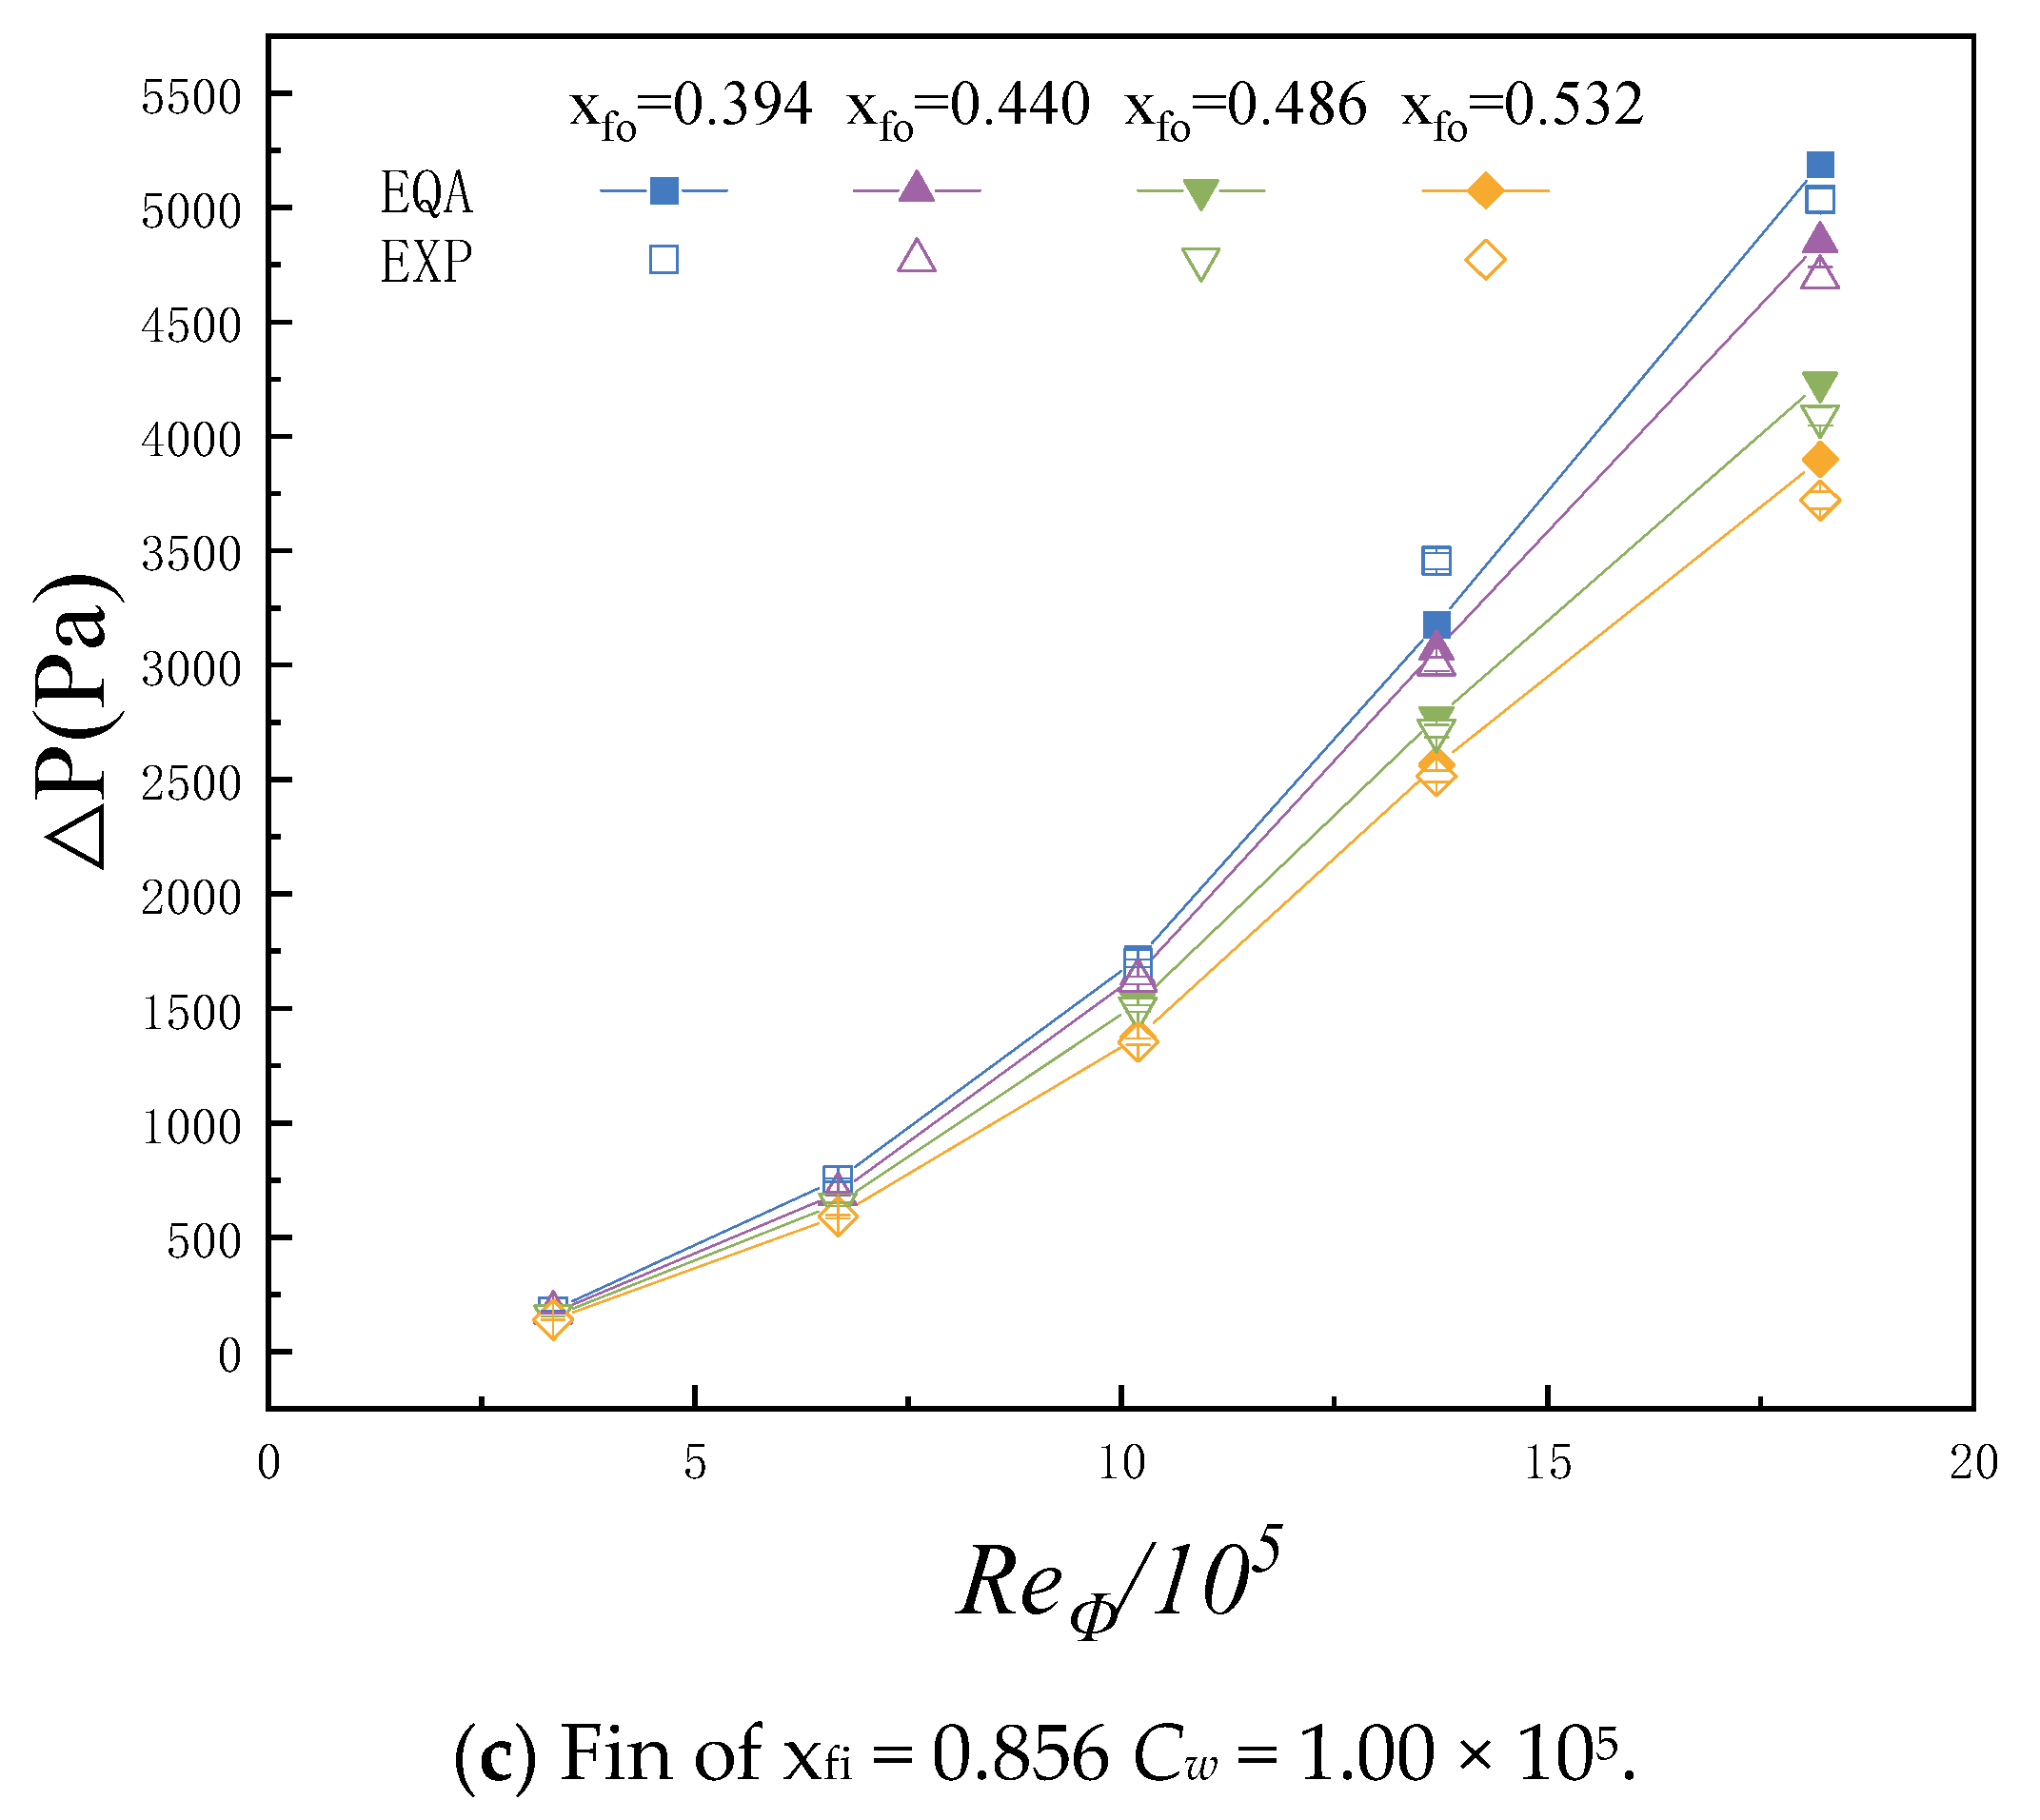
Assuming a swirl ratio of 1 inside the fin channel, the pressure loss in region II can be determined via Equation (7). As shown in Figure 14, the calculated static pressure loss from Equation (7) is consistent with the experimental data, with a relative difference of less than 5%. This indicates that the radius positions of the inlet and outlet of the fin affect the pressure losses, rather than the length of the fin.
Raising the outlet position of the fins can reduce the pressure loss within region II of the airflow. However, this also leads to an increase in region III, increasing the swirl ratio as the airflow reaches the turning point of the cavity. This results in an increase in kinetic energy loss due to the turning. Therefore, the overall pressure loss does not simply decrease with the increasing height of the fin outlet (as shown in Figure 15). Considering these two factors together, further research is needed to understand the impact of the fin outlet position on the overall pressure loss.

4. Conclusions

This study investigated the impact of a finned vortex reducer on the pressure loss of radial inflow. Experimental measurements of pressure along the flow path were obtained, and subsequently combined with numerical simulations to analyze the variation mechanism of pressure loss during the flow through the fin passages. The main conclusions drawn from the study are as follows:
  • The flow structures in different regions of the radial inflow with the presence of the finned vortex reducer exhibit characteristic patterns. The cavity structure is divided into different regions, in which the flow in region I and region III conforms to the free vortex flow model. The swirl ratio increases radially, with a decrease at the junction and turning points due to shock dissipation. Inside the fin passages, the swirl ratio is constrained to be near one, representing a forced flow structure.
  • The fins restrict the flow to a radially inward motion, acting as a rectifier. This inhibits the growth of the swirl ratio within the cavity and reduces the radial Coriolis force acting in the outward direction, reducing the pressure loss of the finned vortex reducer.
  • The pressure loss of the cavity is influenced by a combination of aerodynamic parameters such as the rotational Reynolds number and flow coefficient, as well as the radial positions of the inlet and outlet of the fins. The minimum pressure loss of the cavity is achieved when the inlet position corresponds to a swirl ratio of one. Further research is needed to understand the impact of the outlet position of the fins on the overall pressure loss of the cavity.
  • The pressure loss between different sections of the finned vortex reducer increases with higher rotational Reynolds numbers and dimensionless mass flow rates. Within the range of rotational Reynolds numbers considered in this study, the pressure loss models based on flow characteristics in region II, obtained through integral calculations, effectively reflect the pressure variation.
The content of this paper demonstrates a high level of expertise and provides comprehensive insights into the pressure loss characteristics of the finned vortex reducer under radial inflow conditions.

Author Contributions

Conceptualization, J.H. and X.L.; methodology, J.H. and Y.B.; software, J.H. and A.S.; validation, J.H.; formal analysis, J.H. and Y.B.; investigation, J.H., X.L. and Y.B.; resources, J.H.; data curation, J.H., Y.B. and T.Y.; writing—original draft preparation, J.H.; writing—review and editing, X.L., Y.B., A.S. and T.Y.; visualization, J.H. and Y.B.; supervision, X.L.; project administration, X.L.; project administration, X.L.; funding acquisition, X.L. All authors have read and agreed to the published version of the manuscript.

Funding

This research was funded by National Science and Technology Major Project (2017-III-0011-0037). And the APC was funded by National Science and Technology Major Project (2017-III-0011-0037).

Data Availability Statement

The data presented in this study are available on request from the corresponding author. The data are not publicly available due to privacy.

Acknowledgments

The authors wish to thank the National Science and Technology Major Project (2017-III-0011-0037) for supporting this research.

Conflicts of Interest

The authors declare no conflict of interest.

References

  1. Brillert, D.; Reichert, A.W.; Simon, H. Calculation of Flow Losses in Rotating Passages of Gas Turbine Cooling Systems. In Proceedings of the ASME 1999 International Gas Turbine and Aeroengine Congress and Exhibition, Indianapolis, IN, USA, 7–10 June 1999. [Google Scholar]
  2. Chew, J.W.; Snell, R.J. Prediction of the Pressure Distribution for Radial Inflow Between Co-Rotating Discs. In Proceedings of the ASME, Gas Turbine and Aeroengine Congress and Exposition, Amsterdam, The Netherlands, 6–9 June 1988. [Google Scholar]
  3. Alberga, D.G.; Stephens, G.E.; Johnson, B.V. Comparison of Predicted and Measured Velocities in a Compressor Disk Drum Model. In Turbo Expo: Power for Land, Sea, and Air; American Society of Mechanical Engineers: Anaheim, CA, USA, 1987. [Google Scholar]
  4. Owen, J.M.; Wilson, M. Some current research in rotating-disc systems. Ann. N. Y. Acad. Sci. 2001, 934, 206–221. [Google Scholar] [CrossRef]
  5. Hide, R. On source-sink flows in a rotating fluid. J. Fluid Mech. 1967, 32, 737–764. [Google Scholar] [CrossRef]
  6. Owen, J.M.; Pincombe, J.R.; Rogers, R.H. Source–sink flow inside a rotating cylindrical cavity. J. Fluid Mech. 1985, 155, 233–265. [Google Scholar] [CrossRef]
  7. Firouzian, M.; Owen, J.M.; Pincombe, J.R.; Rogers, R.H. Flow and heat transfer in a rotating cavity with a radial inflow of fluid Part 1: The flow structure. Int. J. Heat Fluid Flow 1985, 6, 228–234. [Google Scholar] [CrossRef]
  8. Firouzian, M.; Owen, J.M.; Pincombe, J.R.; Rogers, R.H. Flow and heat transfer in a rotating cylindrical cavity with a radial inflow of fluid: Part 2: Velocity, pressure and heat transfer measurements. Int. J. Heat Fluid Flow 1986, 7, 21–27. [Google Scholar] [CrossRef]
  9. Farthing, P.R.; Chew, J.W.; Owen, J.M. The Use of De-Swirl Nozzles to Reduce the Pressure Drop in a Rotating Cavity with a Radial Inflow. J. Turbomach. 1991, 113, 106–114. [Google Scholar] [CrossRef]
  10. Pfitzner, M.; Waschka, W. Development of An Aeroengine Secondary Air System Employing Vortex Reducers. In Proceedings of the International Congress of Aeronautical Sciences, ICAS, Harrogate, UK, 27 August–1 September 2000. [Google Scholar]
  11. Chew, J.W.; Farthing, P.R.; Owen, J.M.; Stratford, B. The Use of Fins to Reduce the Pressure Drop in a Rotating Cavity with a Radial Inflow. J. Turbomach. 1989, 111, 349–356. [Google Scholar] [CrossRef]
  12. Luo, X.; Feng, A.; Quan, Y.; Zhou, Z.; Liao, N. Experimental analysis of varied vortex reducers in reducing the pressure drop in a rotating cavity with radial inflow. Exp. Therm. Fluid Sci. 2016, 77, 159–166. [Google Scholar] [CrossRef]
  13. Günther, A.; Uffrecht, W.; Kaiser, E.; Odenbach, S.; Heller, L. Experimental Analysis of Varied Vortex Reducer Configurations for the Internal Air System of Jet Engine Gas Turbines. In Proceedings of the ASME Turbo Expo 2008: Power for Land, Sea, and Air, Berlin, Germany, 9–13 June 2008. [Google Scholar]
  14. Farthing, P.R.; Owen, J.M. De-swirled radial inflow in a rotating cavity. Int. J. Heat Fluid Flow 1991, 12, 63–70. [Google Scholar] [CrossRef]
  15. May, D.; Chew, J.W.; Scanlon, T.J. Prediction of Deswirled Radial Inflow in Rotating Cavities With Hysteresis. J. Turbomach. 2013, 135, 41025. [Google Scholar] [CrossRef] [Green Version]
  16. Negulescu, D.; Pfitzner, M. Secondary Air Systems in Aeroengines Employing Vortex Reducers. In Proceedings of the ASME Turbo Expo: Power for Land, Sea, & Air, New Orleans, LO, USA, 4–7 June 2001; p. V003T001A072. [Google Scholar]
  17. Sibilli, T.; Cho, G.H. Numerical Analysis of Industrial Gas Turbine Secondary Air Systems Employing Vortex Reducers. In Proceedings of the ASME Turbo Expo 2018: Turbomachinery Technical Conference and Exposition, Oslo, Norway, 11–15 June 2018. [Google Scholar]
  18. Bai, Y.; Luo, X.; He, J. Influence of turbulence parameters on flow characteristics of cavity with tubed vortex reducer. J. Aerosp. Power 2022, 37, 1295–1305. [Google Scholar]
  19. Du, X.Q.; Zhu, H.R.; Zhang, Z.W. Numerical Study on Varied Vortex Reducer Configurations for the Flow Path Optimization in Compressor Cavities. In Proceedings of the ASME Turbo Expo: Turbine Technical Conference & Exposition, Vancouver, BC, Canada, 6–10 June 2011. [Google Scholar]
  20. Bai, Y.; Luo, X.; He, J. Numerical simulation of total pressure loss on vortex reducer with bafflers. J. Aerosp. Power 2019, 34, 2120–2130. [Google Scholar]
  21. Hou, X.-T.; Wang, S.-F.; Zhang, K. Numerical Investigation on Effects of Installation Height of Fins on Drag Reduction Performance of Co-Rotating Cavity. J. Propuls. Technol. 2020, 41, 1457–1463. [Google Scholar]
  22. Roache, P.J. Quantification of Uncertainty in Computational Fluid Dynamics; Annual Reviews Inc.: Palo Alto, CA, USA, 1997; Volume 29, pp. 123–160. [Google Scholar]
Figure 1. Schematic of the test rig.
Aerospace 10 00655 g001
Figure 2. The structure of the core part of the test section.
Aerospace 10 00655 g002
Figure 3. Computational domain.
Aerospace 10 00655 g003
Figure 4. Comparison of different turbulence models.
Aerospace 10 00655 g004
Figure 5. Result of grid independence.
Aerospace 10 00655 g005
Figure 6. Comparison of experimental and CFD results.
Aerospace 10 00655 g006
Figure 7. Streamline and swirl ratio distribution on plane under different ReΦ. Fin of xfi = 0.856, xfo = 0.394, and Cw = 1.00 × 10⁵.
Aerospace 10 00655 g007
Figure 8. Streamline and swirl ratio distribution under different Cw. Fin of xfi = 0.856, xfo = 0.394, and ReΦ = 1.82 × 10⁶.
Aerospace 10 00655 g008
Figure 9. Streamline and swirl ratio distribution under different structure. Fin of xfo = 0.394, ReΦ = 1.82 × 10⁶, and Cw = 1.00 × 10⁵.
Aerospace 10 00655 g009
Figure 10. Radial distribution of swirl ratio in different cavities in region I.
Aerospace 10 00655 g010
Figure 11. Streamline and swirl ratio distribution under different structures. Fin of xfi = 0.864, ReΦ = 1.82 × 10⁶, and Cw = 1.00 × 10⁵.
Aerospace 10 00655 g011
Figure 12. Radial distribution of swirl ratio in different cavities in region III.
Aerospace 10 00655 g012
Figure 13. Total pressure loss coefficient of the cavity with the increase in the mass flow rate coefficient.
Aerospace 10 00655 g013
Figure 14. Comparison of pressure losses between the model and experimental results.
Aerospace 10 00655 g014aAerospace 10 00655 g014b
Figure 15. Total pressure loss coefficient of the cavity with the increase in the mass flow rate coefficient.
Aerospace 10 00655 g015aAerospace 10 00655 g015b
Table 1. The main geometric sizes of the cavity.
Rb216 (mm)
Xa0.310
Xfi0.764, 0.810, 0.856, 0.903
Xfo0.394, 0.440, 0.486, 0.532
G0.236
Table 2. Boundary conditions.
PressureRotate Speed
(rpm)
ReΦMass Flow Rate
(kg·s−1)
Cw
Consistent with experimental data10003.34 × 1050.025.00 × 104
20006.68 × 1050.041.00 × 105
30001.02 × 1060.061.51 × 105
40001.37 × 1060.082.01 × 105
50001.82 × 1060.12.52 × 105
Table 3. GCI criteria results.
Grid Number
(million)
Fsp△P (Pa)GCI
0.8368762
1.073684513.5%
1.353684892.6%
1.803684121.8%
2.303684381.1%
Disclaimer/Publisher’s Note: The statements, opinions and data contained in all publications are solely those of the individual author(s) and contributor(s) and not of MDPI and/or the editor(s). MDPI and/or the editor(s) disclaim responsibility for any injury to people or property resulting from any ideas, methods, instructions or products referred to in the content.