Article

Numerical Investigation of Unsteady Characteristics of Gas Foil Journal Bearings with Fluid–Structure Interaction

1
College of Automation Engineering, Nanjing University of Aeronautics and Astronautics, Nanjing 210016, China
2
College of Astronautics, Nanjing University of Aeronautics and Astronautics, Nanjing 210016, China
*
Author to whom correspondence should be addressed.
Aerospace 2023, 10(7), 616; https://doi.org/10.3390/aerospace10070616
Submission received: 30 May 2023 / Revised: 22 June 2023 / Accepted: 24 June 2023 / Published: 5 July 2023
(This article belongs to the Special Issue Applied Aeroelasticity and Fluid-Structure Interaction)

Abstract

:
Gas foil journal bearings (GFJBs) have been widely employed in high-speed rotating machinery in the aviation industry. However, the role of fluid–structure interaction in the unsteady aerodynamic character of the gas film and the dynamic response of the elastic foils have not yet been clarified. In this study, an unsteady shearing flow interacting with an exciting deformation of the top or bump foils was investigated by means of a large eddy simulation with bidirectional fluid–structure interaction (BFSI). The result shows that the main frequencies and amplitudes of stable fluctuations of different flow field parameters at different positions are different. The oscillating duration in the solid domain is much less than that in the fluid domain. The main positions for the interaction between the gas film pressure and the elastic foil are on both sides of θ = π. Compared with the case without FSI, the presence of the elastic foil flattens the distribution of the pressure of the gas film. As the rotational speed increases, the main frequency and the amplitude of pressure in the fluid domain continuously increase. With FSI, there is no interference frequency near the main frequency, which improves the stability of the shearing flow. However, an interference frequency appears near the main frequency of total displacement in the solid domain. The analysis in this paper lays the foundation for unsteady fluid–structure interaction research.

1. Introduction

Taking advantage of their simple structure, ultimate high speed, and oil-free operation, gas foil journal bearings (GFJBs) have been widely employed in rotational machinery in the aviation industry, including in air turbines, refrigeration units, fans, and auxiliary power units [1]. The load capacity of GFJBs results from the aerodynamic effect of the viscid gas film, where relative motion between the rotator and the stator occurs in the wedge clearance [2,3]. There is a strong fluid–structure interaction (FSI) between the shearing flow of the gap gas film and the elastic foils, which plays a significant role in the performance of GFJBs [4,5]. Therefore, it is essential to explore the mechanism of the fluid–structure incited by elastic foils in the gas film between the rotator and the stator.
The Taylor–Couette flow induced by relative motion between the rotator and the stator in GFJBs has been a classic research theme, which is the aerodynamic principle laid out in GFJBs [6,7,8]. Scholars and engineers have clarified that the planar shearing flow is closely associated with several influencing factors, such as the rotational speed, nominal clearance height, and lubricating medium [9]. For the GFJB, the shearing flow of the gas film between the stator and the rotator can be resolved using the classic Reynolds equation. The consensus had been that the aerodynamic performance of GFJBs is tightly associated with the geometrical parameters of the wedge-shaped channel between the rotator and the top foil and the rotational speed [10,11]. Paghdar et al. [12] and Wei et al. [13] further illustrated the shearing flow and instantaneous evolution of the Taylor vortex at different rotating Reynolds numbers and the dependence of the angular velocity and eccentricity. Sytin et al. [14] explored the role of the shearing flow in the dynamic characteristics of GFJBs by means of a numerical simulation. The influencing parameters include the geometric parameters of the gas film and the temperature of the supplied lubricant, which weakens the elastic and damping properties of the bearing. However, the previous research studies above have assumed that the shearing flow channel is strictly rigid, without deformation of the elastic foils. Therefore, it is worth revealing the influence of the deformation of the elastic foil on the flow field in the gas film.
The new generation of GFJBs are characterized by the support of an elastic foil, which can enhance the carry capacity and improve its dynamic response [15,16,17]. The deformation of the elastic foils would definitely have a great impact on the carry capacity, stiffness, and damping of GFJBs. Numerous researchers have also carried out experimental and numerical studies on the deformation of the elastic foil. For instance, Barzem et al. [18] employed high-speed digital cameras to measure the vibration of the foils, and the elastoplastic deformation of the foil under shock loads was observed. Feng et al. [19]. found the minimum film thickness and dynamic stiffness of the bearings by means of the journal trajectory. The relationship between experiments and numerical calculations has been demonstrated. Ywica et al. [20,21] pointed out that the dynamic stiffness of FTB increases while the equivalent damping decreases with an increase in excitation frequency. Early scholars [22,23,24] used the wading method to solve the dynamic characteristics of bearings, and the influence of the working conditions and structural parameters on the dynamic stiffness coefficient and dynamic damping coefficient has also been analyzed. For instance, Balducchi et al. [22] solved the Renault equation and linearized dynamic equations. With the increase in rotational speed, the stiffness increases nonlinearly while the damping decreases rapidly. Pronobis et al. [23] pointed out that the main stiffness value increases with the increase in excitation frequency, while the damping decreases with the increase in excitation frequency. The absolute values of the cross-coupling, oblique symmetry stiffness, and damping parameters decrease with the increase in excitation frequency. Zhou et al. [24] found that the stiffness tends to stabilize with the increase in disturbance frequency. Additionally, the damping tends to zero with the increase in disturbance frequency. Sim et al. [25] further pointed out that both stiffness and damping increase with increasing frequencies. As the shaft temperature increases, the direct stiffness coefficients decrease by 8% and the direct damping coefficients decrease by approximately 30%. It is noted that the aerodynamic exciton and its influence on the deformation of the elastic foil have rarely been emphasized or paid much attention in the previous research studies.
In industrial applications, a strong interaction between the film shearing flow of the gas film and the elastic foil structure takes place in the GFJB. Some researchers began to pay attention to the FSI between the gas film and elastic foils [26,27]. For instance, Hoffmann et al. [28] obtained the linearized stiffness and damping through applying a perturbational Reynolds equation. The nonlinear bump structure is simplified by means of a link–spring model in which Coulomb friction effects from the elastic corrugated structure are illustrated. Kan et al. [29] proposed a fluid–structure model for bump-type foil thrust bearings. The transient fluid flow and structural deformation of elastic foils were discussed. The multi-physics computational framework can predict the steady-state and dynamic performances [30,31,32]. Furthermore, in this decade, some researchers had begun to consider FSI in GFJBs and its influence on the load capacity and dynamic response by means of the finite element method and the finite volume method [33]. For instance, Bou-Sad et al. [34] considered the nonlinear isothermal elastic aerodynamic lubrication of radial bearings. The effects of rotational speed and unbalanced eccentricity on the nonlinear response of rigid and flexible bearings were compared. Wang et al. [35] studied the bifurcation of GFJB and solved the Reynold equation using the successive iteration method. The dynamic response along the horizontal and vertical directions was analyzed using the system state trajectory, Poincare diagram, power spectrum, and bifurcation plot. Kim et al. [36] obtained the impact response of GFJB from an external 5.55 g load of lateral acceleration. It was found that there was synchronous vibration and sub-synchronous vibration in the rotor supported by the foils. and under forced excitation, the forced response dominated the deformation of the bearing. Lehn A et al. [37] found the capacity of the GFJB is superior to rigid thrust bearings. The overall compliance of the pads in a GFJB had resulted in the superior behavior of the GFJB to rigid thrust bearings. Overall, the work on the FSI in GFJB is still deficient, and its mechanism needs to be furtherly explored.
As concluded above, several researchers have paid much attention to fluid–structure interaction in the GFJB and its influence on carry capacity and dynamic response. However, the understanding of the unsteady fluid–structure interaction between gas film and elastic foils is extremely inadequate and complicated, especially at higher rotational speeds. Therefore, it is necessary to investigate the unsteady fluid–structure interaction between gas film and elastic foils. This study aims to reveal the unsteady characteristics of GFJBs with fluid–structure interaction. The shearing flow in the gap between the rotator and stator is solved via large eddy simulation, and the time-resolved deformation of the preloaded foils is simulated using the Conventional Serial Staggered (CSS) method. The mesh-based parallel-code coupling interface (MpCCI) is used to control the coupling process and exchange forces and displacements across the fluid–structure interfaces. The dynamic response of the flow field and elastic foils in the time and frequency domain has been interpreted and compared with the non-FSI case. The analysis of this article can provide technical support for the design of non-contact rotor support structures for high-speed rotating machinery in airborne environments with high overload and strong vibration.

2. Computational Methodology

2.1. Physical Model

Figure 1 shows the scheme of the GFJB, which consists of the rotator, top foil, and bump foil, as well as the stator. The gas film is formed by the top foil and rotator. The rotor is assumed to be massless and fully rigid, which indicates the rotor’s dynamic behavior is not taken into account in numerical simulations. The top foil is supported by the bump foil with several evenly distributed bumps beside the bearing sleeve. The axial view of the GFJB with top/bump foils is shown in Figure 1b, as well as the combined relationship between the top foil and the bump foil. Several bumps have been distributed on the back of the top foil, which is in contact with the top foil and bearing house. Here, r, θ, and z are specified as the radius, circumferential, and axial coordinates, respectively. h is the thickness of the gas film. R and R′ are the radius of the rotator and stator, respectively. Table 1 shows the parameters employed in the present study. It is noted that the nominal gas film thickness h1 is specified as 200 μm, and the rotational speed n0 is specified as 105 r/min.

2.2. Solution Domain and Computational Grid

To guarantee converged simulation results, the comprehensive time and grid analyses were performed. The mesh resolution and details regarding the mesh partition in fluid and solid domains are shown in Figure 2. In the fluid domain, the shearing flow and deformation were the most sensitive to the mesh resolution. Hence, grid refinement has been conducted. A resolution of 0.001 mm near clearance height is proved to be sufficient along the tangential direction, as shown in Figure 2a. Meanwhile, an even distribution of the grid was specified along the radial direction to capture the evolution of the Taylor vortexes induced by the shearing flow. As a result, the grid was uniform and structural in the gas film. After several adjustments, it was discovered that the wall y+ varied from 1 to 2 in most areas of the surface attached to the rotator and top foil. The grid independency test had been performed to fit the requirement of the simulation. After adjustments of several mesh generation schemes, the final control volume in the computational mesh was approximately 6,250,000. The simulations are realized using the unsteady solver with a second-order implicit time in Fluent 18.0, and the velocity-pressure coupling is set as SIMPLE. The time step of this study was specified as 10−5 s, which was 1/1000 of the operation period of the rotator. A total of 200 iterations were conducted per time step, which was sufficient to converge the simulation. The residual of the continuity and pressure was set as 10−5.
Figure 2b presents the mesh resolution in the solid domain. The solid domain mesh is specified as a 10-node quadratic tetrahedron with a mesh size of 0.001 mm and a deviation factor of less than 0.1. To reveal the dynamic response of the foil, the grid was structured with a grid type of S4R, and the maximum grid concentration is near the top foil. Solid domain meshes are generated by means of ABAQUS pretreatment applications. To fully verify the independence of the mesh, the mesh of the top and support foil are calculated separately. In a grid independency test, the total mesh cell numbers of 1,500,000 have been demonstrated to be adequate, such that the computational results were affected by the grid quantity. The top foil, bump foil, and bearing sleeve are all established using shell elements, and the bearing sleeve is set as a rigid body. The fixed end of the rigid bearing sleeve, top foil, and corrugated foil are used to limit the axial movement of the top foil and corrugated foil. The contact between the corrugated foil, bearing sleeve, and top foil is set as hard contact, and the contact rule is a penalty function. Considering the friction and damping of the foil, transient implicit dynamics are used to analyze the GFJB. The time step is consistent with the fluid domain, which is 10−5 s.
Considering the huge workload and complex settings, the computational simulation in this study was performed via supercomputing on the Sunway Taihu Light, which was equipped with an Intel® X®(R) CPU E5-2683. A total of 1500, in which each node contained 32 cores nodes, has been specified. A total of 72,000 core hours have been spent to execute 20 operational cycles.

2.3. Boundary Conditions

Figure 3 presents the boundary conditions. In the fluid domain, the computational domain is divided into two regions. The first one is the gas film which is between the top foil and the rotator, and the second one comprises the ambiance outlet the gas film, which is defined as a pressure outlet. The outer diameter of the gas film is specified as the interface to exert fluid–structure interaction. The energy source of shearing flow is originated from the internal diameter of the gas film in which the rotational motion of the rotator exerts. The end of the gas film is connected with the ambiance which is specified as the interior. Also, the ambiance is specified as the pressure outlet whose static pressure is P0 and temperature of 101,325 Pa and 300 K, respectively. The rotator is defined separately, and a user-defined function is described for its reciprocating rotational motion. A domain independence test was conducted, and the result shows that ambient size in the computation domain did not affect the computational results. At this condition, the computational domain of ambiance is assigned as 10 R1 along the axial direction and 10 R1 along the radial direction. In the solid domain, the inner-diameter side of the top foil is specified as the interface to exert fluid–structure interaction, which corresponds to the outer-diameter side of the gas film. The lower side of the top foil is contacted with the upper side of the bump foil. Moreover, the bump foil is contacted with the fixed bearing sleeve.

2.4. Fluid–Structure Interaction

To better understand the dynamic response of the elastic foils and the instantaneous flow field of shearing flow, an integrated fluid–structure interaction simulation has been performed. The CFD solver FLUENT and CSD solver ABAQUS have been adopted in the fluid domain and solid domains. A two-way interaction between the fluid and the structure is accomplished using the mesh-based parallel-code coupling interface (MpCCI) in a loosely coupled manner.

2.4.1. CFD Solver

Large eddy simulations (LESs) model small-scale turbulent structures while resolving large-scale turbulent eddy structures. Therefore, the mass and the momentum conservation can be shown as follows:
ρ t + x i ( ρ u i ) = 0
t ( ρ u i ) + x j ( ρ u i u j ) = p x i + x j σ i j + x j ( ρ u i u j ¯ )
where ρ is fluid density (kg/m3), t is time (s), u is the fluid velocity (m2/s), and p is pressure (Pa). The stress tensor σij and Reynold stress term ( ρ u i u j ¯ ) are shown as follows:
σ i j = ( μ + μ t ) ( u i x j + u j x i 2 3 u k x k δ i j )
ρ u i u j ¯ = μ t ( u i x j + u j x i ) 2 3 ( ρ k + μ t u k x k ) δ i j
where μ is dynamic viscosity (Pa·s), μt is turbulent dynamic viscosity (Pa·s), δij is the Kronecker delta, and k is turbulent kinetic energy (m2/s2). The energy conservation equation can be expressed as follows:
t ( ρ E ) + x i [ u i ( ρ E + p ) ] = x i ( K e f f T x j + u i τ i j )
where E is the total energy (J), T is the temperature of the fluid (K), and the effective thermal conductivity keff (W/(m·K)) is shown as follows:
K e f f = K + c p μ t / P r t
where cp is specific heat capacity (J/K) and Prt is the turbulent Prandtl number. In this study, the turbulent Prandtl number Prt was set to 0.9, and the viscous Prandtl number was fixed as 0.713, which corresponds to a heat conductivity coefficient of 0.0257 W/mK.
In this study, the wall-adapting local eddy-viscosity (WALE) model was set in this simulation as in [38,39]. The turbulent viscosity μt in the WALE subgrid-scale model can be expressed as follows:
μ t = ρ Δ 2 ( S i j d S i j d ) 3 / 2 ( S ¯ i j S ¯ i j ) 5 / 2 + ( S i j d S i j d ) 5 / 4
where Δ is the length scale in terms of the cell volume V, defined as
Δ = m i n   ( κ d ,   C w V 1 / 3 )
In Equation (8), κ is the von Karman constant; d is cell distance from the wall; Cw is the switching coefficient, which was set to 0.544 in this study. The strain tensors can be defined as
S ¯ i j = 1 2 ( u ¯ i x j + u ¯ j x i )
S i j d = 1 2 ( ( u ¯ i x j ) 2 + ( u ¯ j x i ) 2 ) 1 3 δ i j ( u ¯ k x k ) 2
In the numerical setting, the spatial discretization of the gradient is chosen as Green-Gauss Cell-Based. Also, the momentum term is specified as Bounded Central Differencing.

2.4.2. CSD Solver

The force on the top and bump foils can be shown as follows:
[ M ] { x ¨ } + [ C ] { x ˙ } + [ K ] { x } = { F }
where {x} is the displacement vector; [M], [C], and [K] are the matrix of mass, damping, and stiffness, respectively. {F} indicates the aerodynamic force from the shearing flow, in which pressure and viscous stress are included. To resolve the force on the elastic foils, the Newmark integration has been performed, its underlying assumptions [40] are shown as follows:
{ x ˙ } t + Δ t = { x ˙ } t + [ ( 1 δ ) { x ¨ } t + δ { x ¨ } t + Δ t ] Δ t
{ x } t + Δ t = { x } t + { x ˙ } t Δ t + [ ( 1 2 β ) { x ¨ } t + β { x ¨ } t + Δ t ] Δ t 2
β and δ are fixed as 1/4 and 1/2, respectively.

2.4.3. Fluid–Structure Interaction

To realize the fluid–structure interaction, the exchange of forces and displacements in the fluid–structure interfaces become more critical in this study. The exchange of data streams between the ANSYS fluent and ABAQUS is conducted on the platform MpCCI. It guarantees direct communication between the fluid domain of the shearing flow and the solid domain of the elastic foil through the application programming interfaces (APIs). In fluid–structure interfaces, the compatibility of displacements and the forces can be obtained using Equation (14) and Equation (15), respectively, shown as follows:
x f = x s
p f · n f σ f · n f = σ s · n s
where x f and x s are the displacement in the interfaces of the fluid domain and solid domain, respectively. n f and n s are the unit vector in the interfaces specified n f = n s . p f is the pressure from the interfaces in the fluid domain. Σf and σs are the fluid viscous stress and structural stress, respectively, in the solid domain.
In this section, the Conventional Serial Staggered (CSS) procedure has been employed to conduct a two-way loosely coupled ANSYS fluent and ABAQUS [41]. Figure 4 presents the procedure of fluid–structure interaction. Here, W is the vector of variables in the fluid domain [ ρ ρ v e ] , U is the vector of variables in the solid domain [ u s u ˙ s ] , F is the force vector solved using ANSYS fluent solver. Moreover, the superscript n corresponds to the nth time station. Five steps are shown as follows: (1) giving Wn and Un at the time-step n; (2) drawing aerodynamic force Fn in the fluid domain and then executing it in the interface; (3) processing U n + 1 = C S D ( U n , F n ) in the solid domain; (4) executing the displacements of the top foil onto the ANSYS fluent boundary—thus x f n + 1 = u s n + 1 ; (5) renovating the grid in the fluid domain and the solid domain—thus W n + 1 = C F D ( W n , x f n + 1 ) . In this study, a steady-state solution in the fluid domain had been conducted before the fluid–structure interaction, which acted as the initial solution.

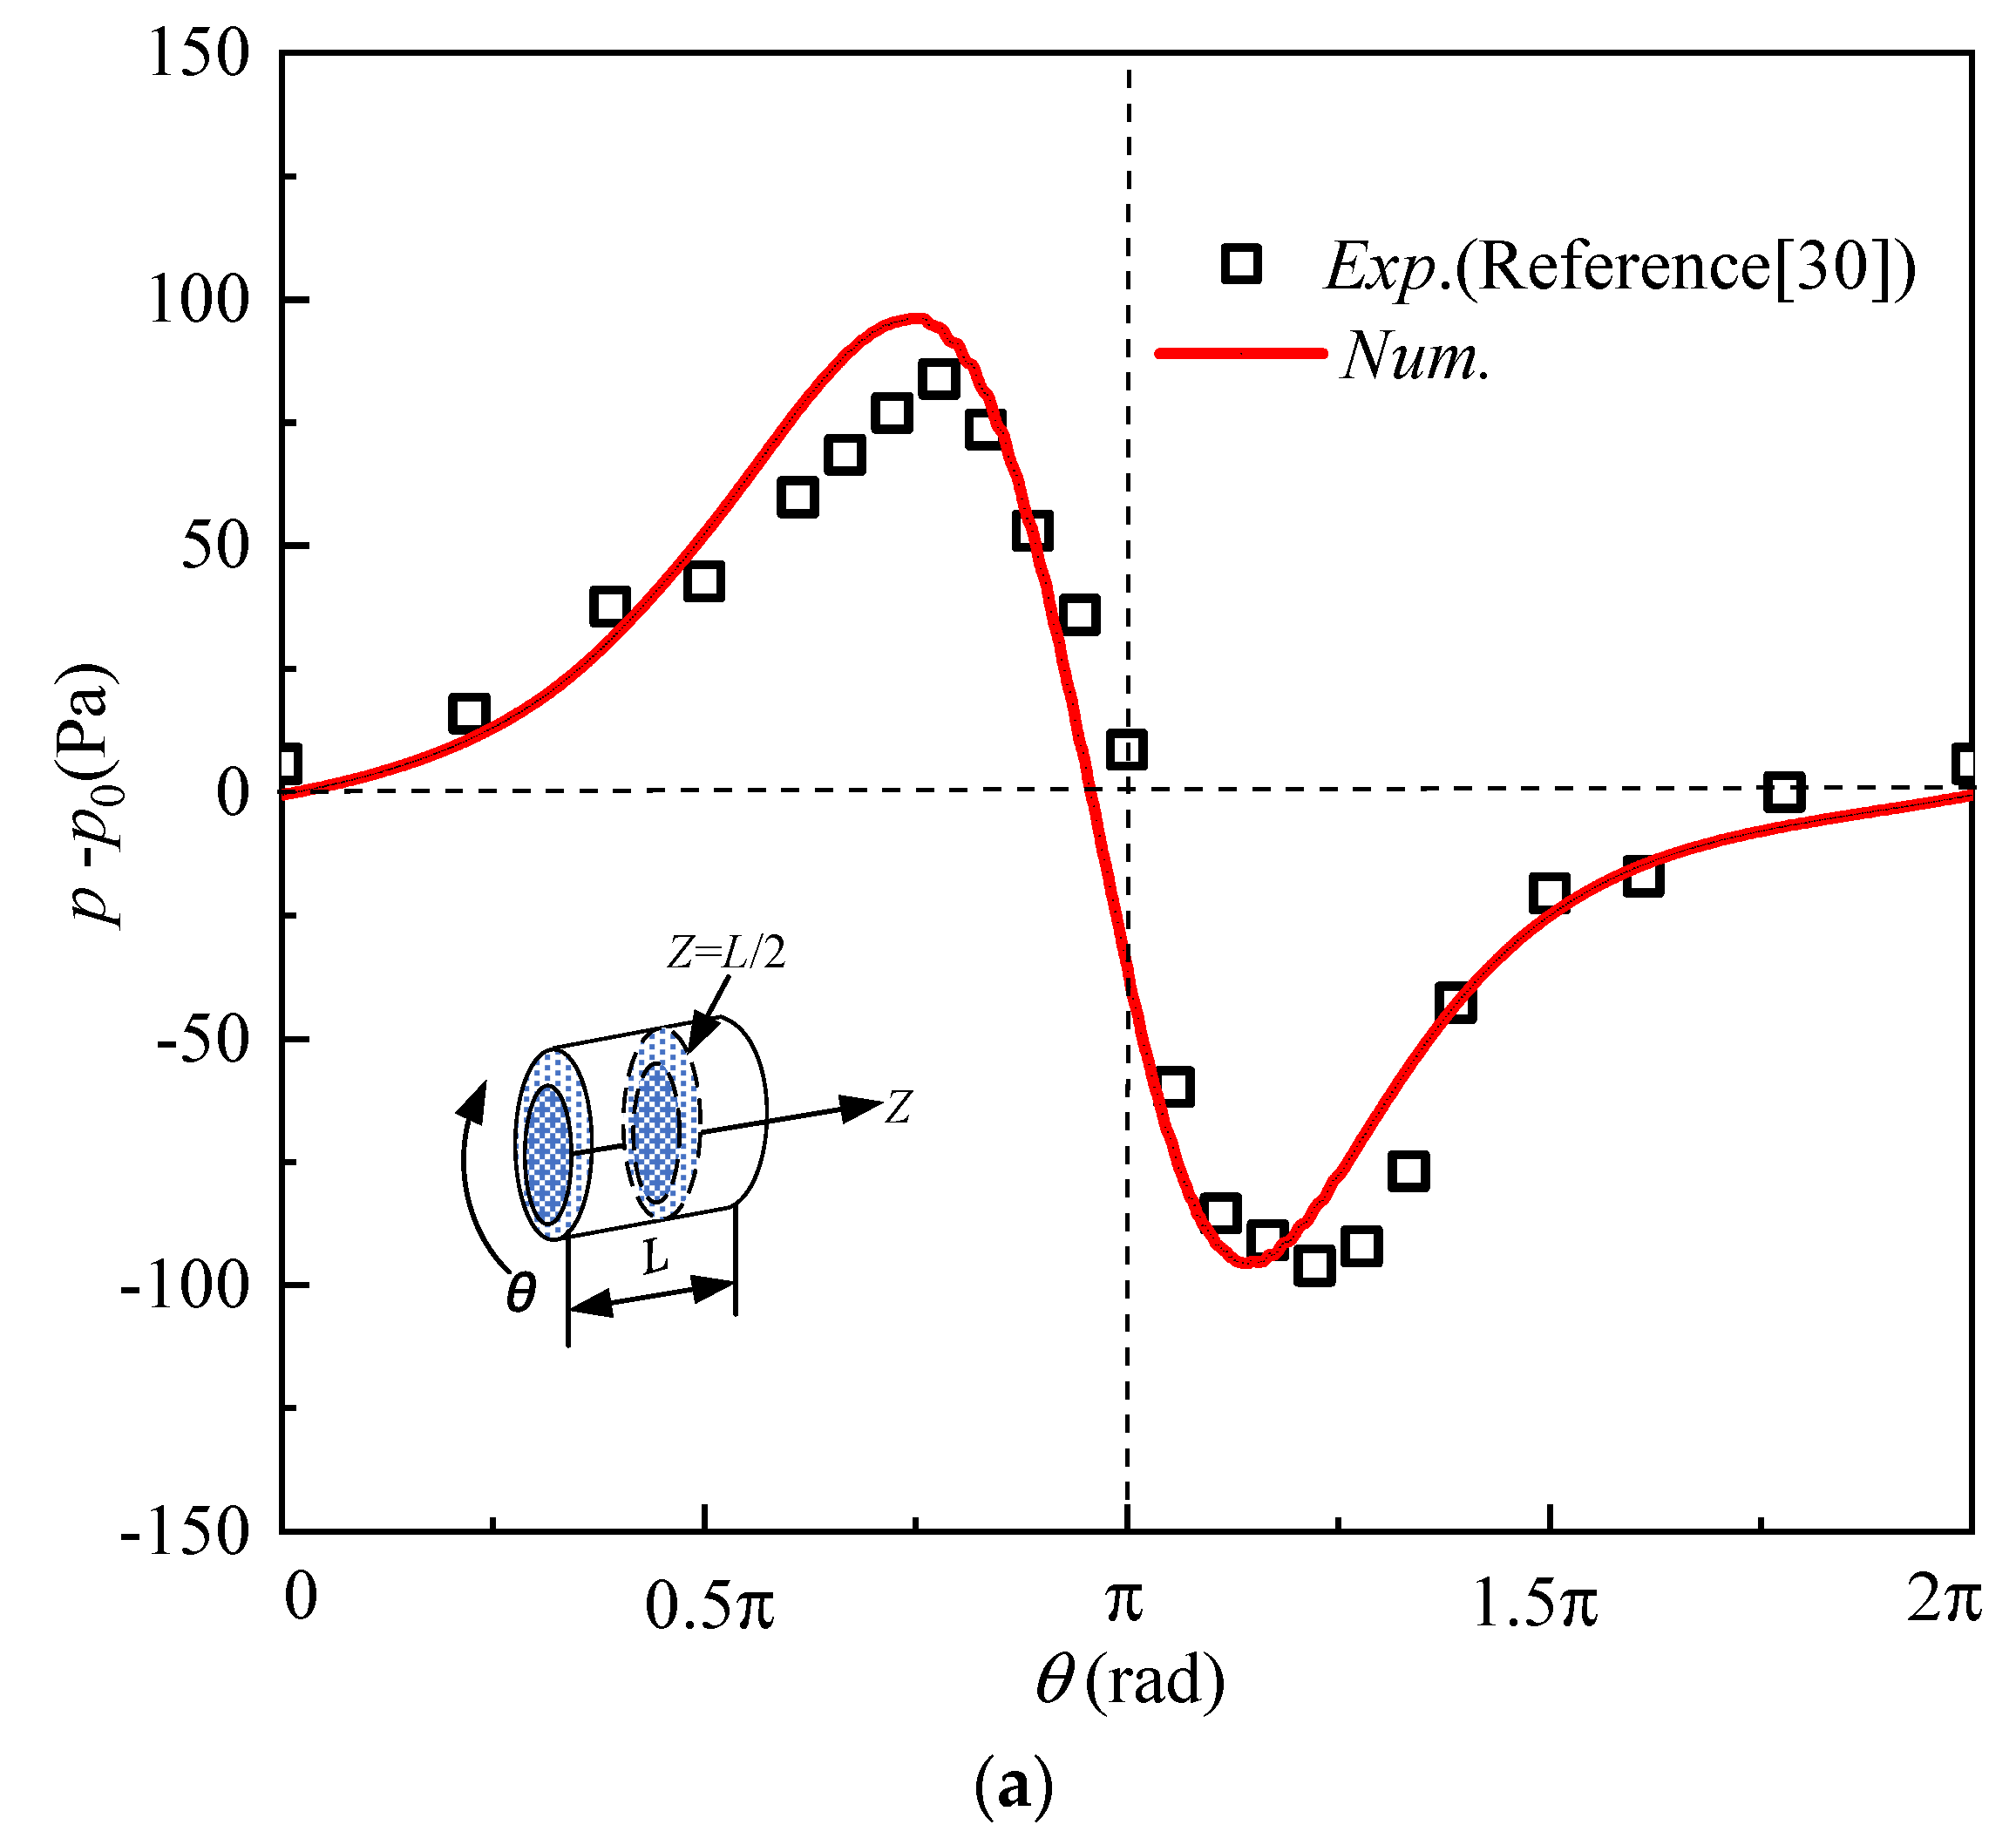
2.5. Validation and Data Reduction

Currently, experimental measurements in which contact friction has been strengthened are greatly lacking. Although some researchers have obtained the aeroelastic characteristics of GDFBs, their details are still inadequate. This section verifies the numerical calculation method employed in this article. As observed from Figure 5a, the distribution of pressure along the circumferential direction, conducted via LES in this study, agrees well with the experimental measurement conducted by Fatu et al. [30]. The former is overpredicted near θ = 0.75π and underpredicted near θ = 1.25π, whose maximum error of 14.5% takes place near θ = 0.75π. It is attributed to the violently turbulent state near the end of the gas film, where a large velocity gradient as well as backflow occur. Additionally, keeping the bearing parameters consistent with the experiment in Reference [42], the variation pattern of the minimum gas film thickness with bearing load capacity was obtained at R = 19.05 mm and L = 19.05 mm, as shown in Figure 5b. The maximum error of 7.8% takes place at F = 100 N, which is attributed to the complex thermal boundary condition in the experimental configuration. Discrepancies between the numerical simulations with BFSIs employed in this study and those in published works occurred due to two reasons. The first reason was the complicated operating conditions of the experimental measurement, and published works have not been presented in adequate detail. The second reason is the assumption of axial rotation without defection in the simulation, which is inconsistent with that in actual operation. In general, the LES performed in this study can reveal the behavior of the flow field in GFJBs more reliably.

3. Result and Discussion

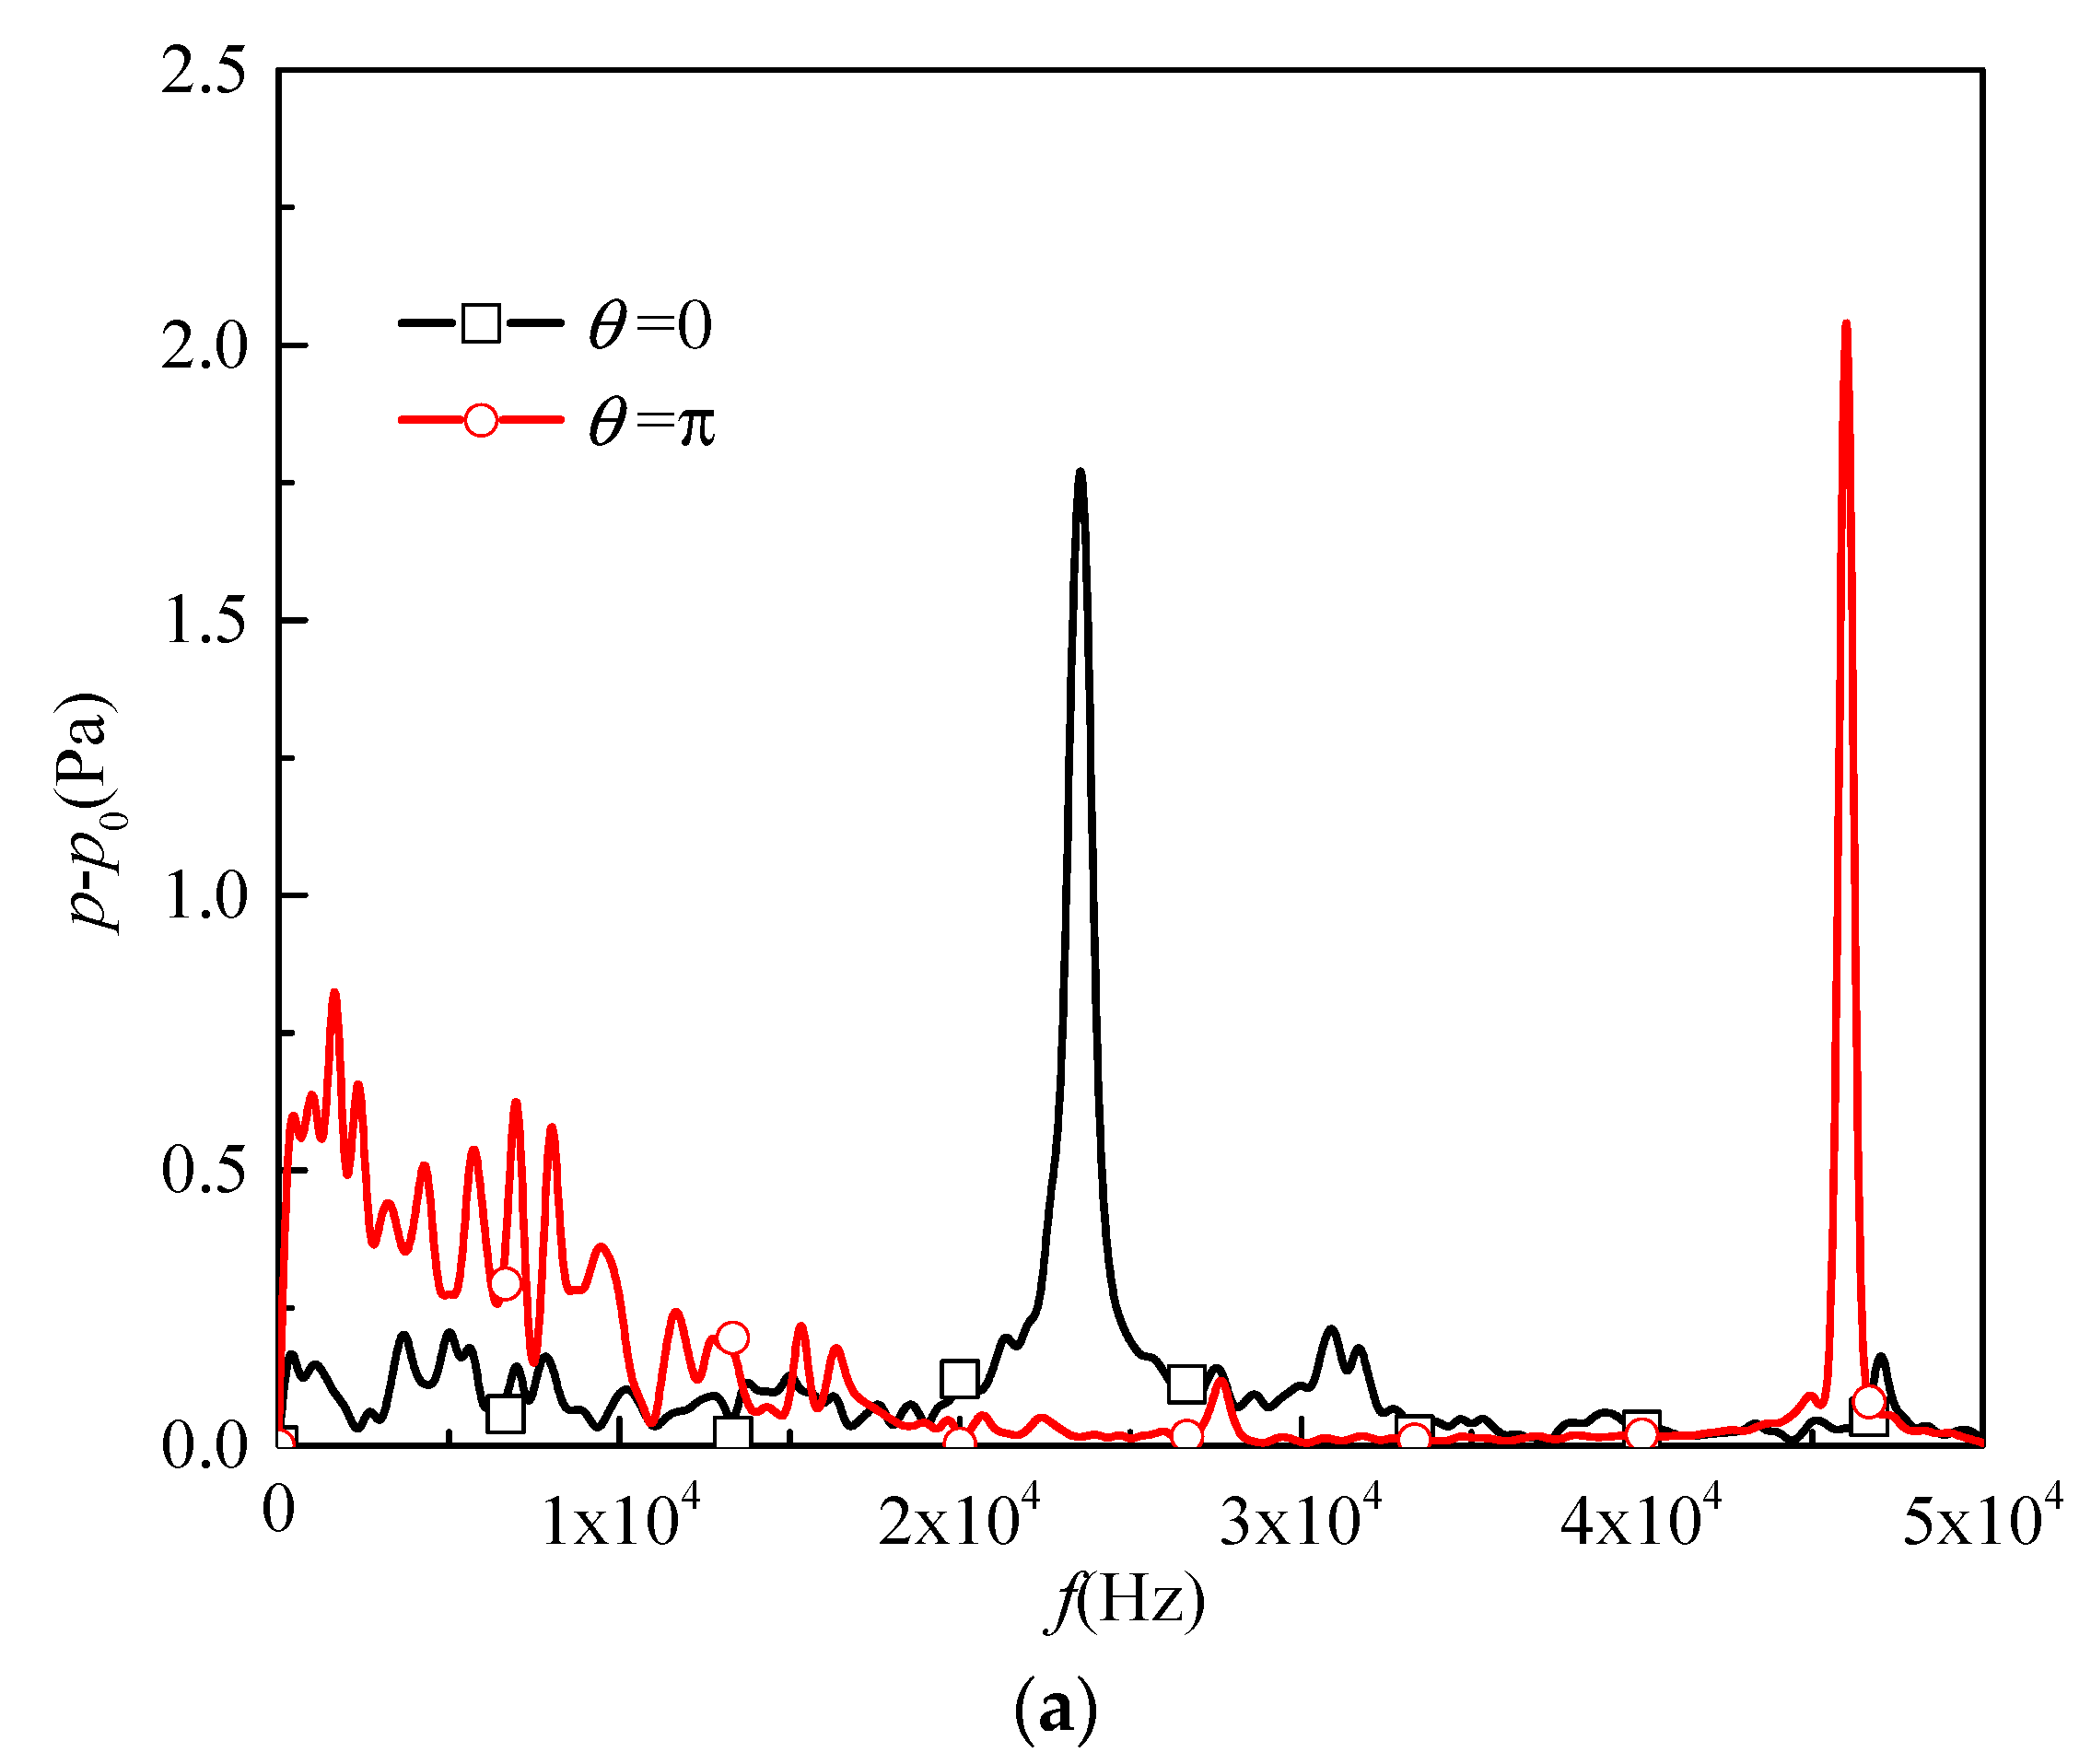
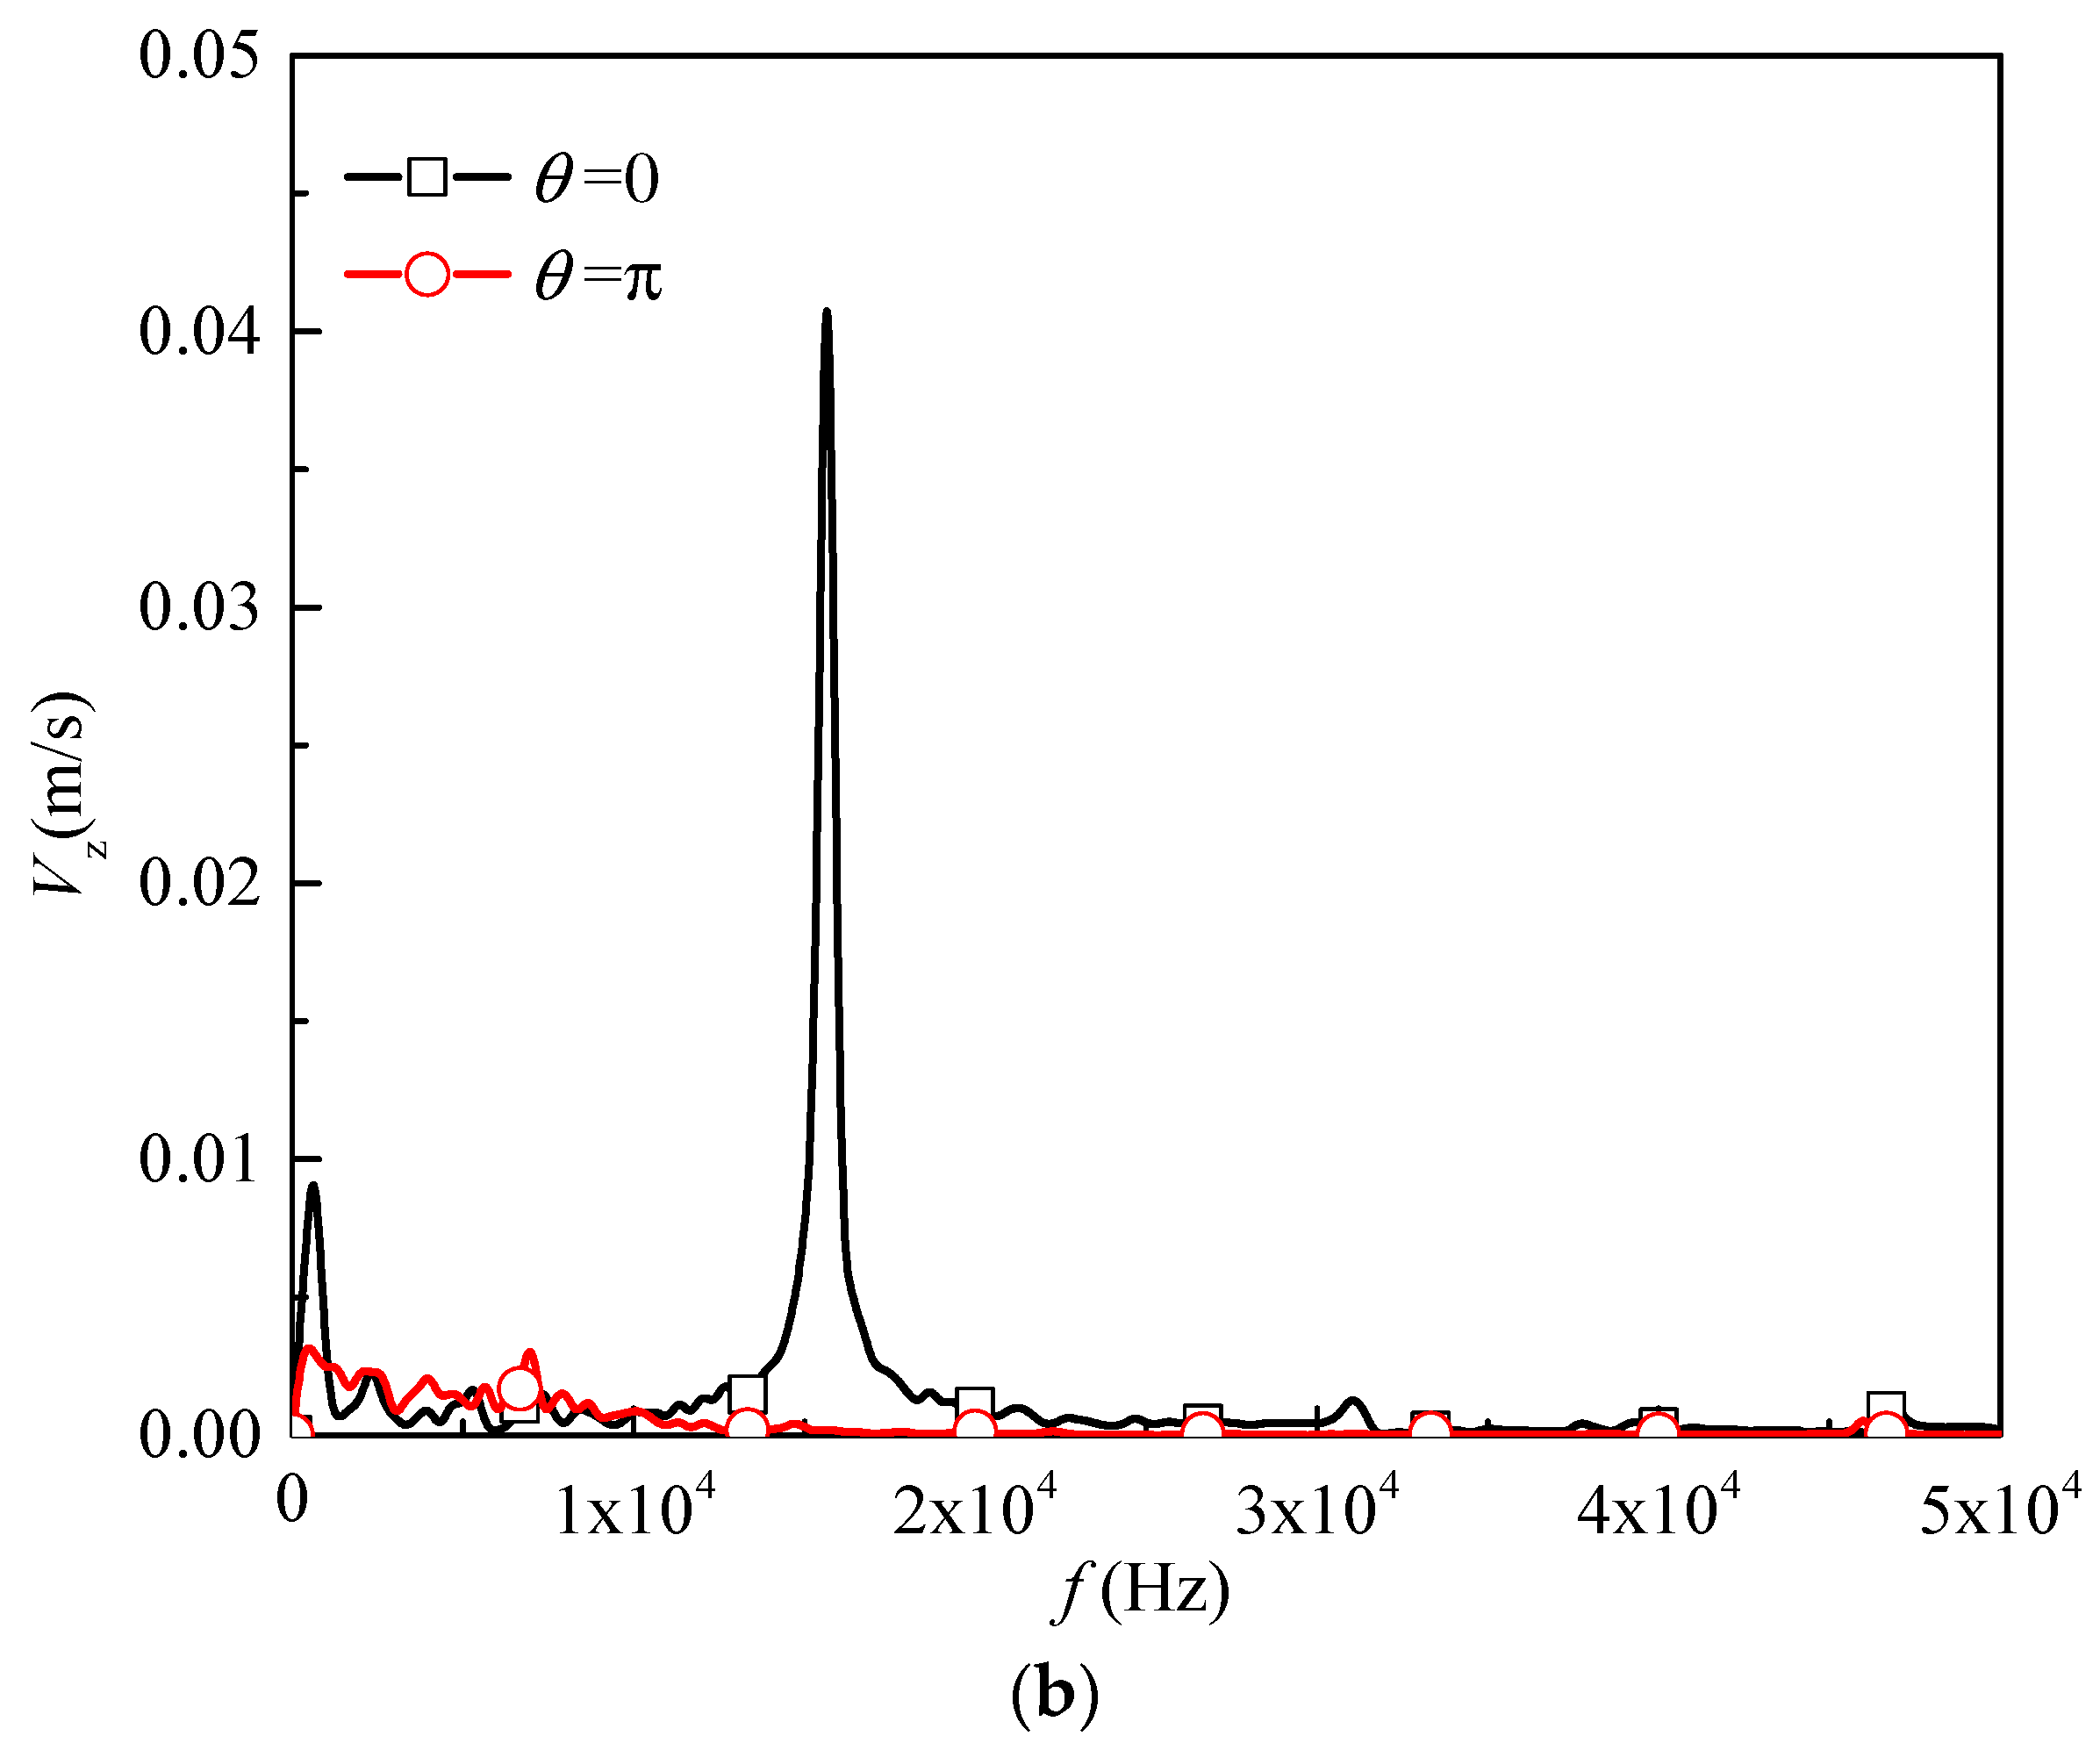
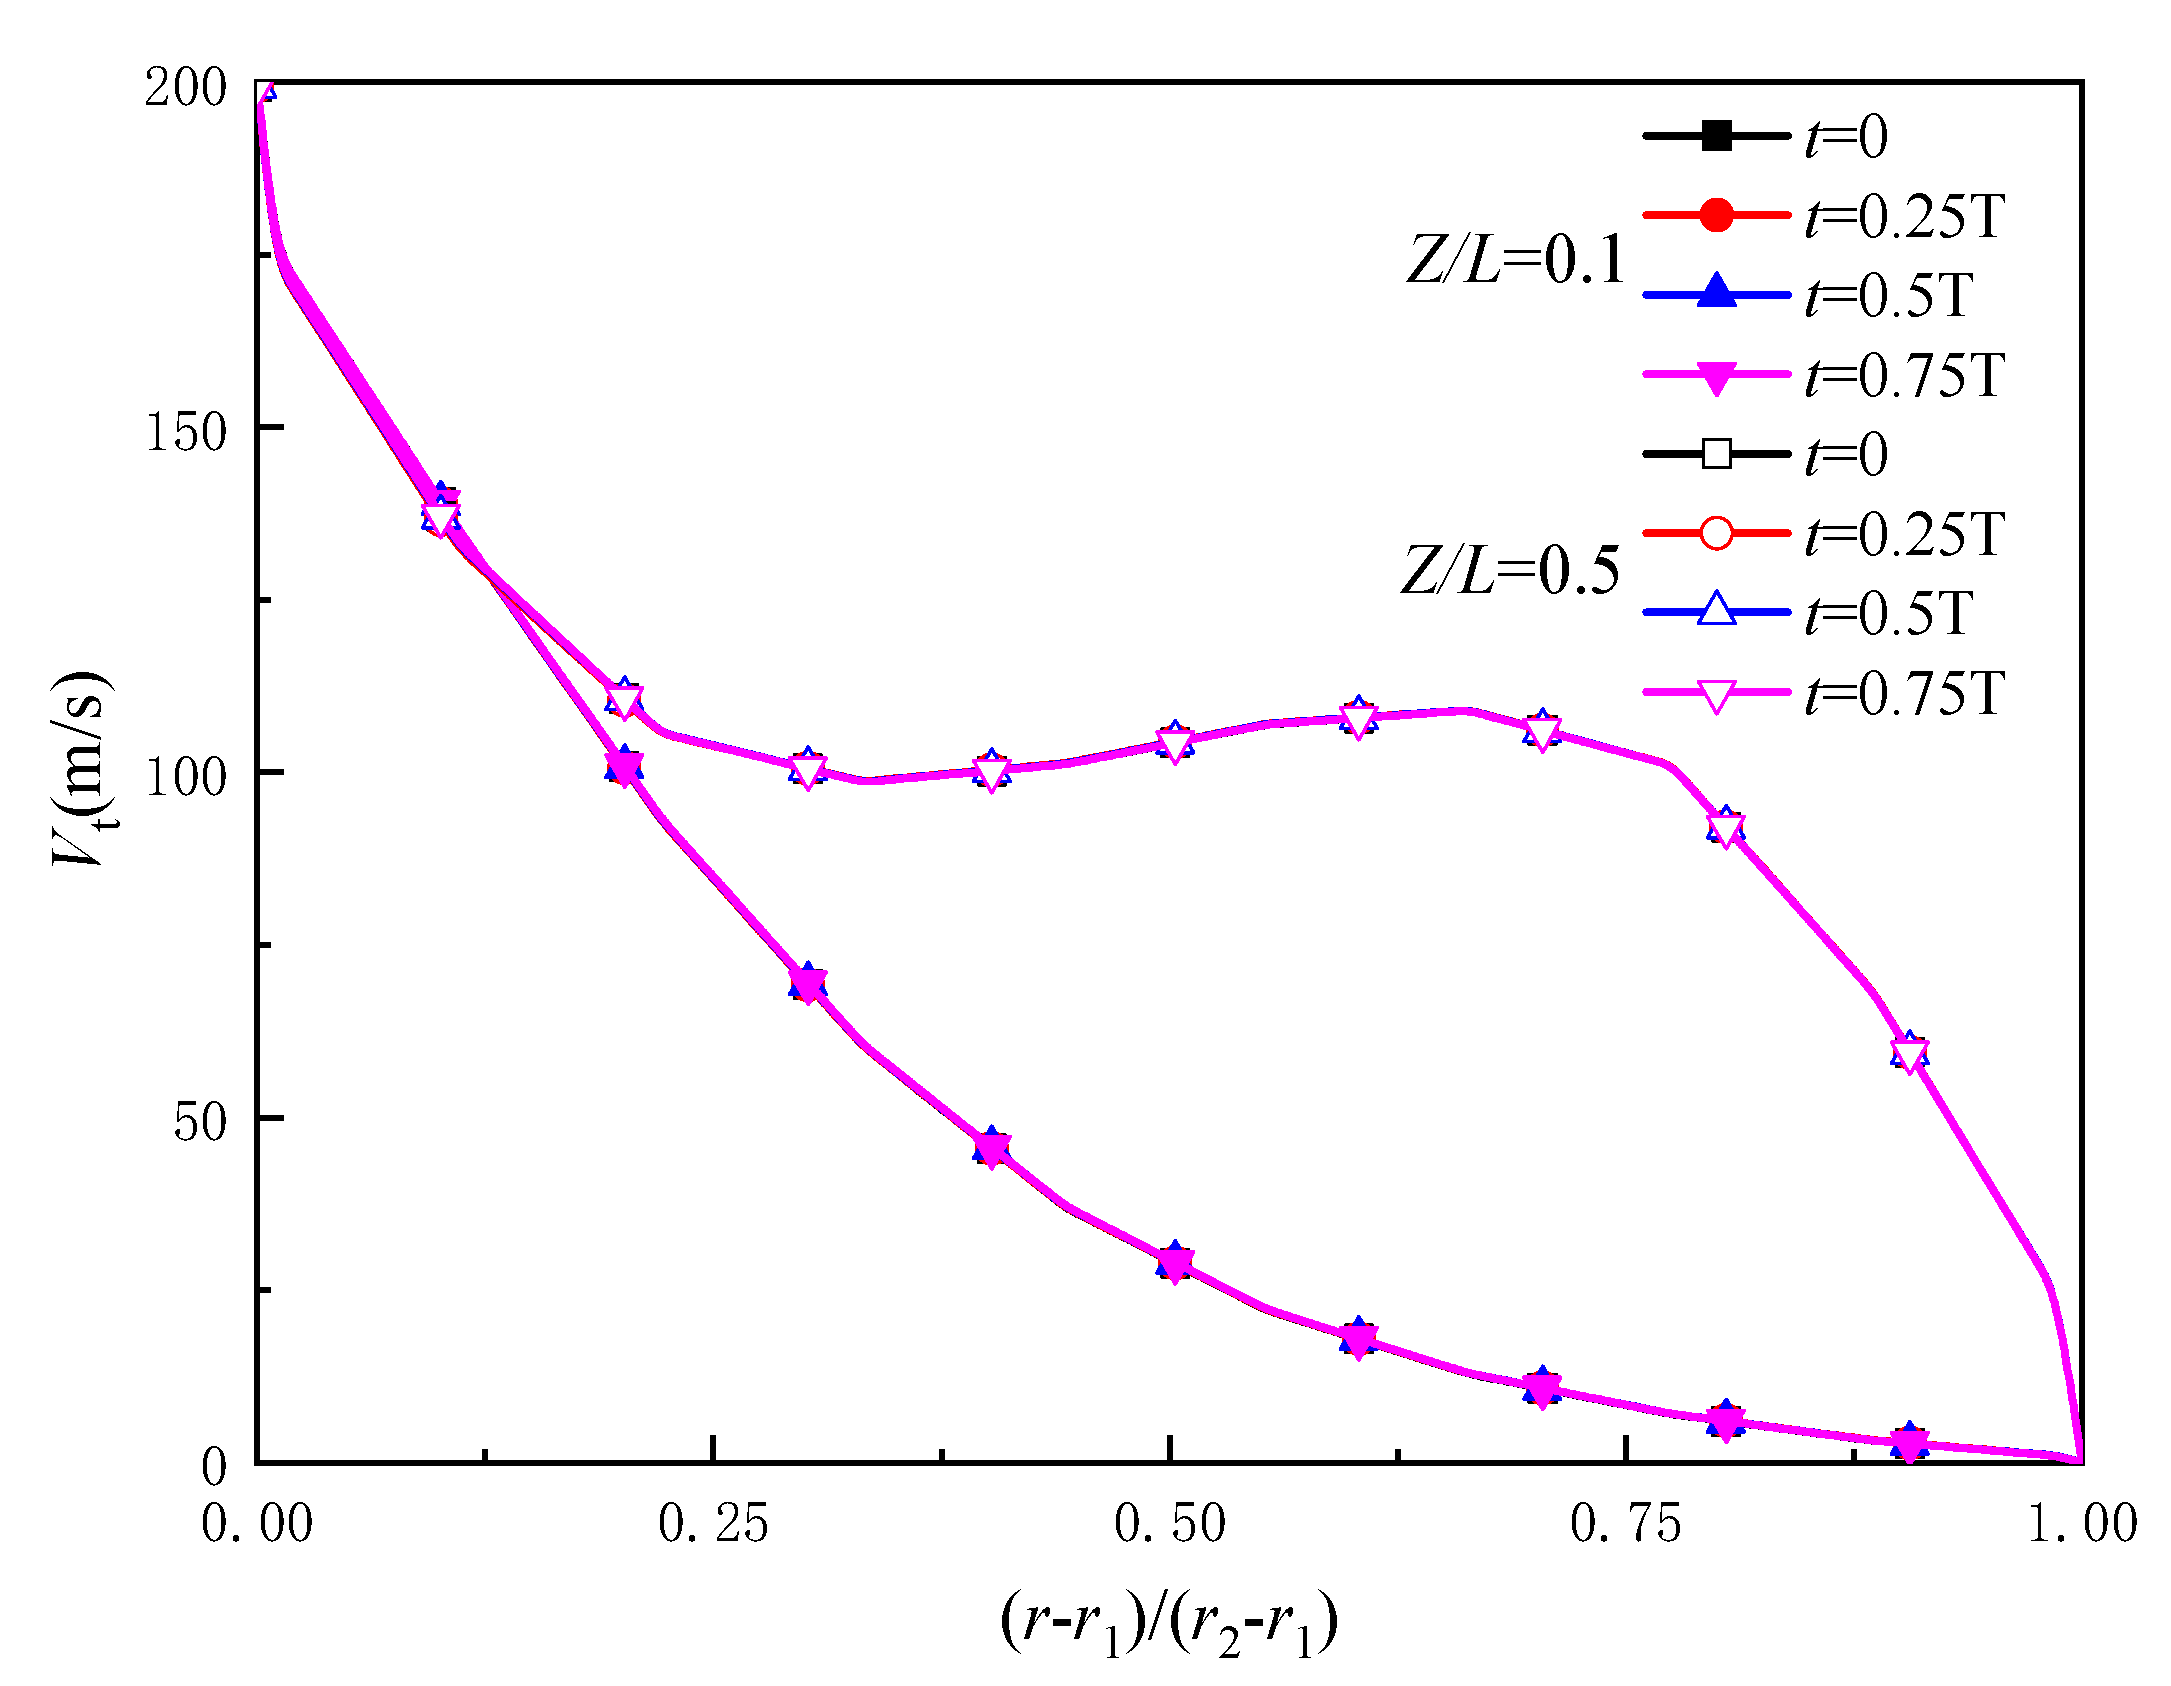
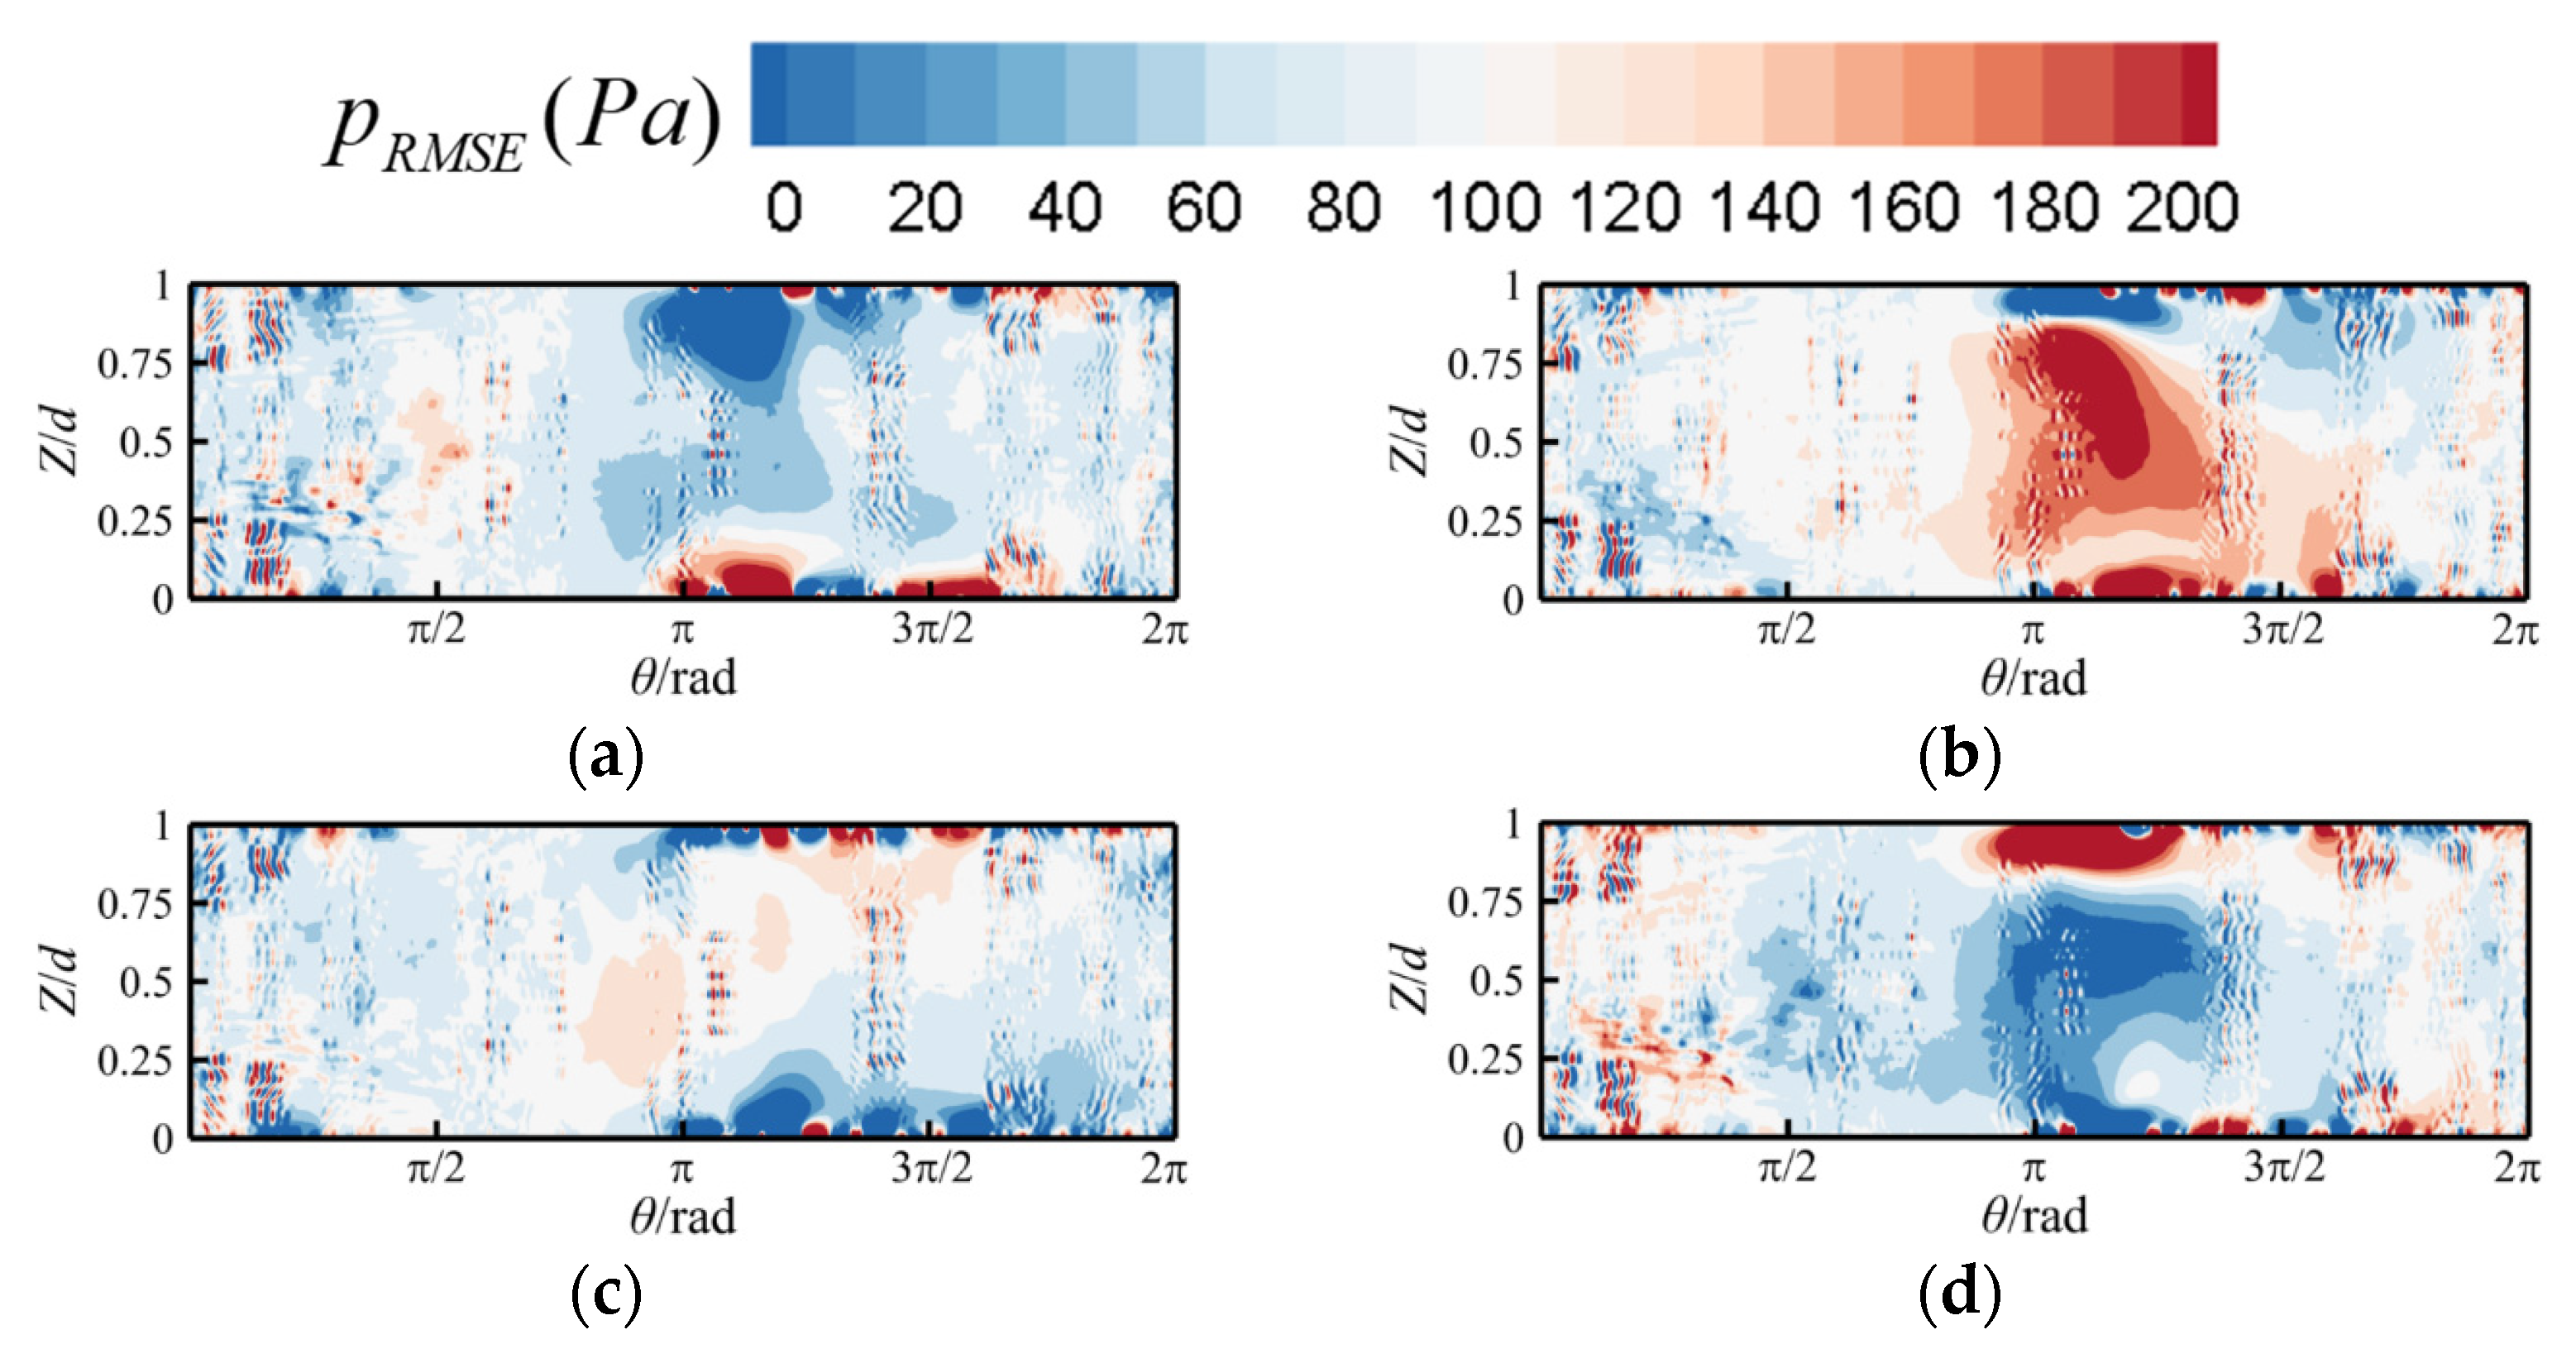
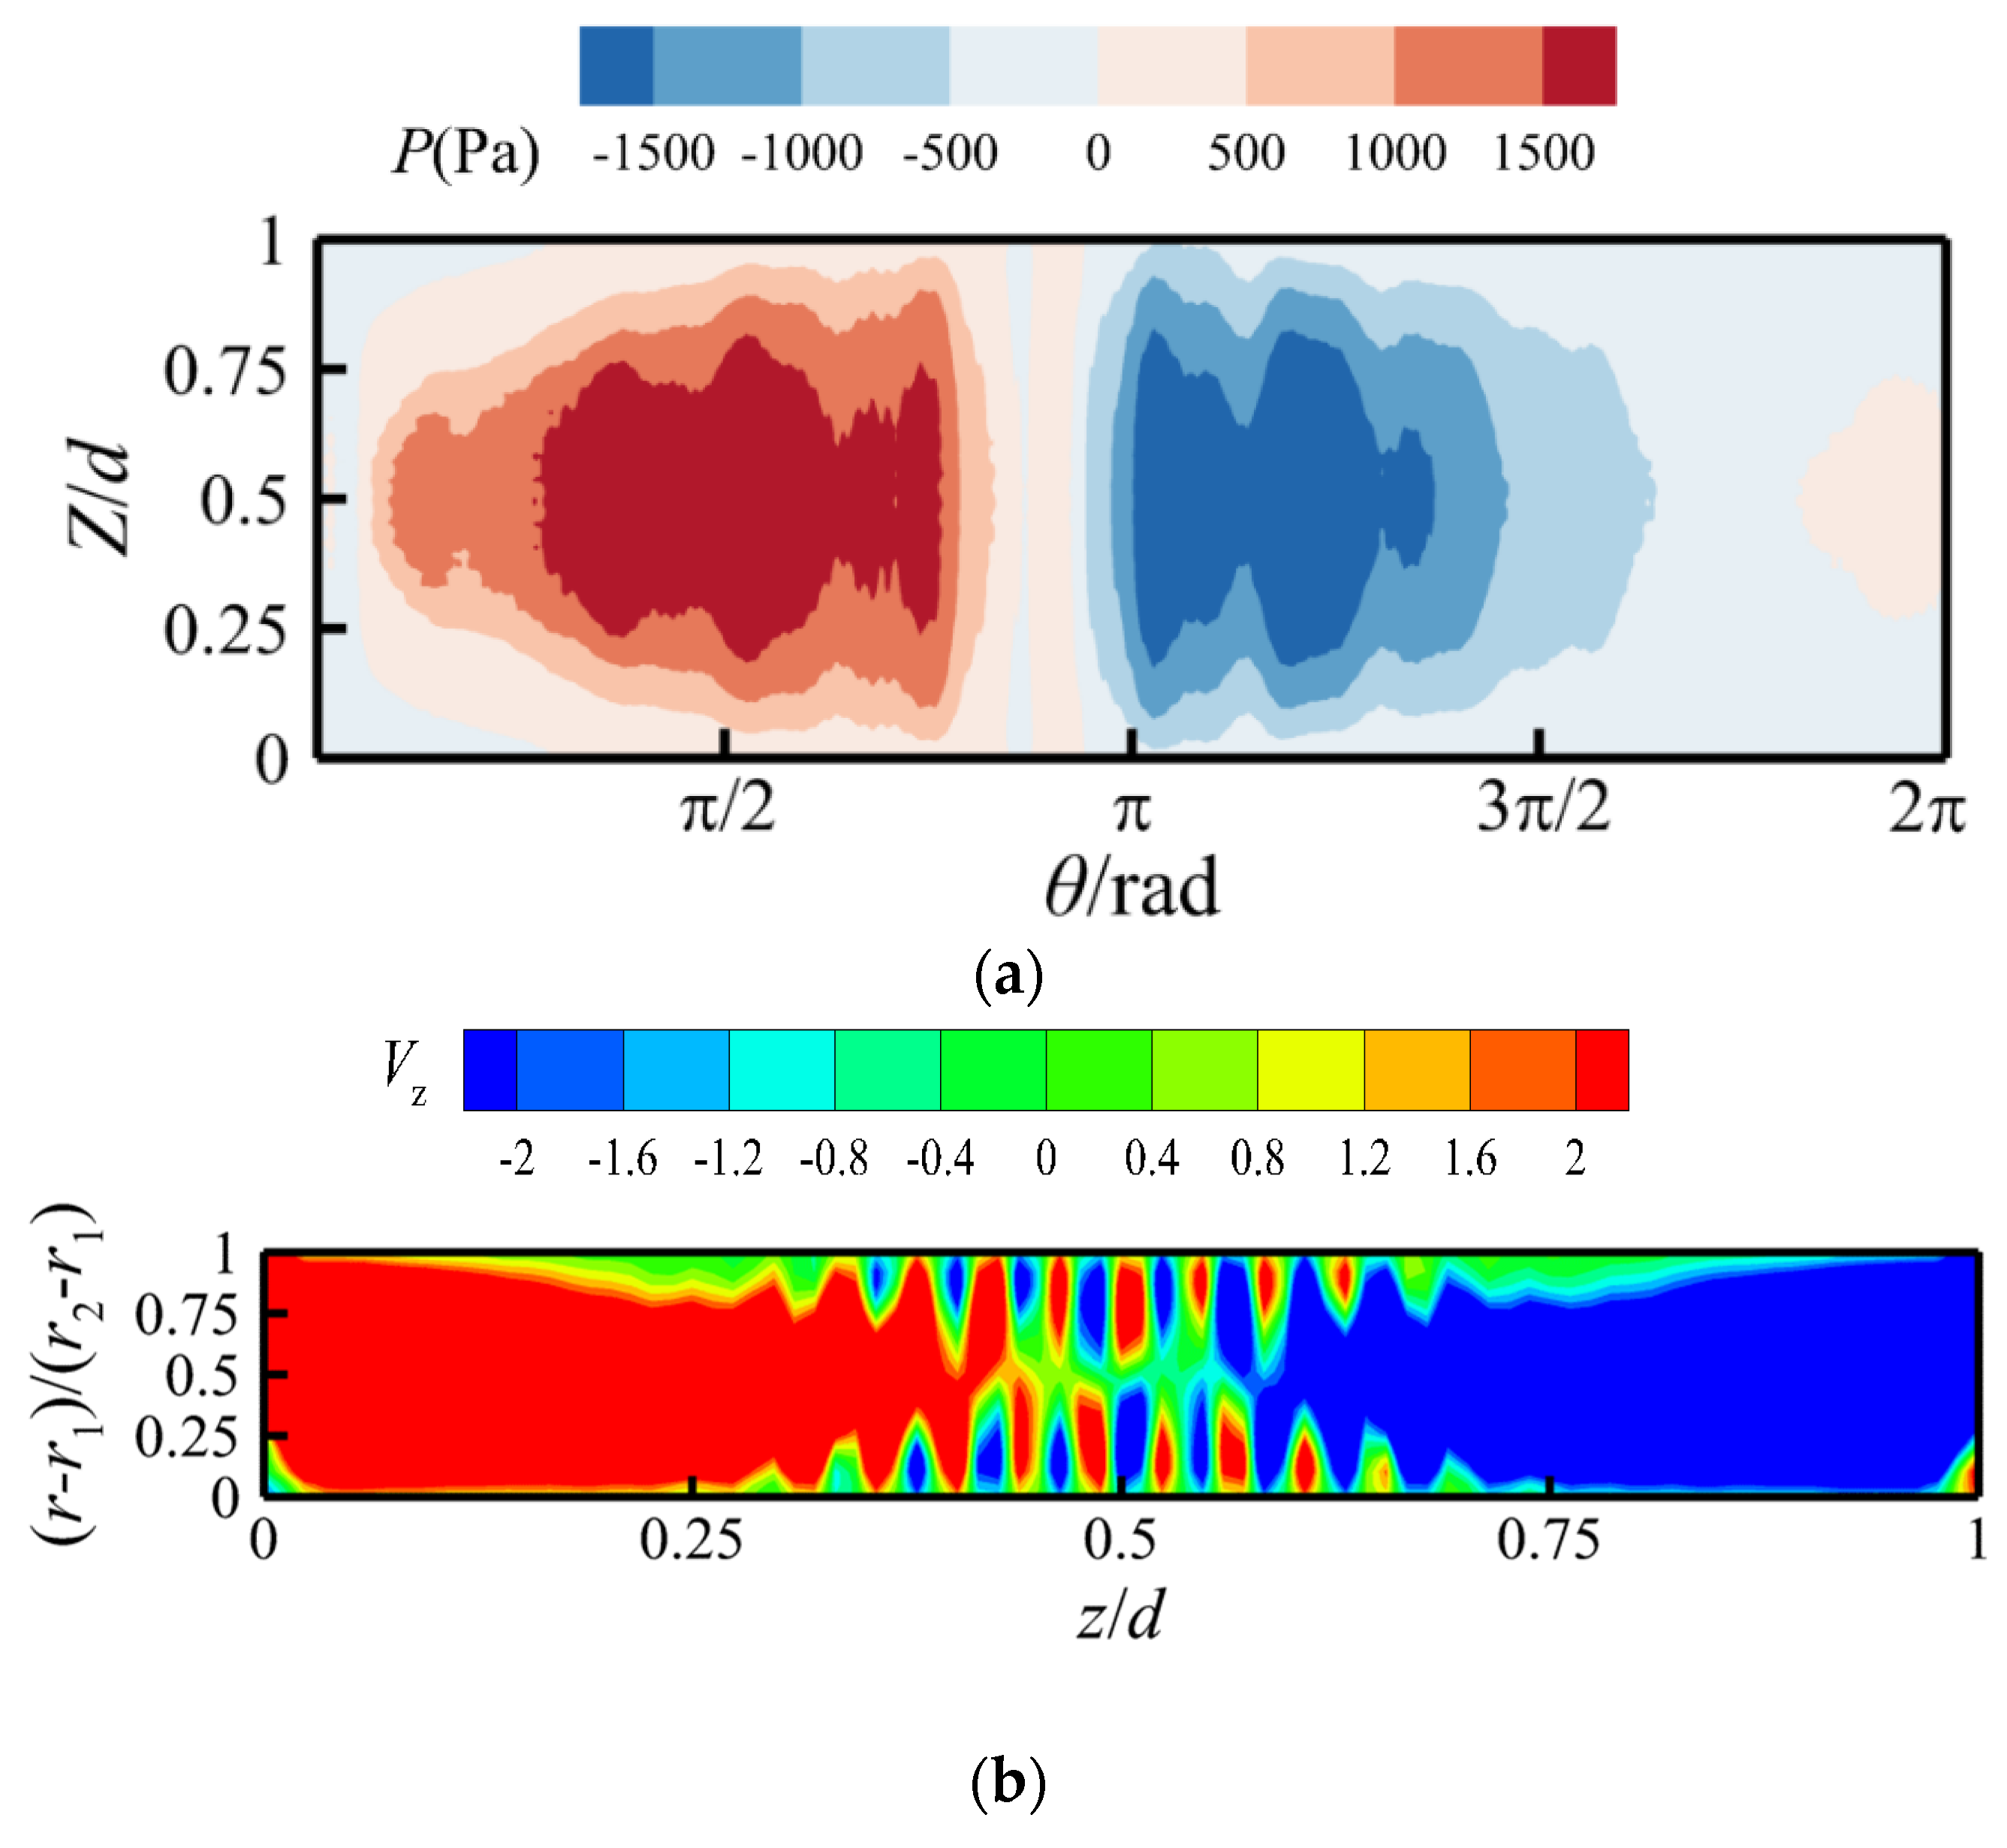
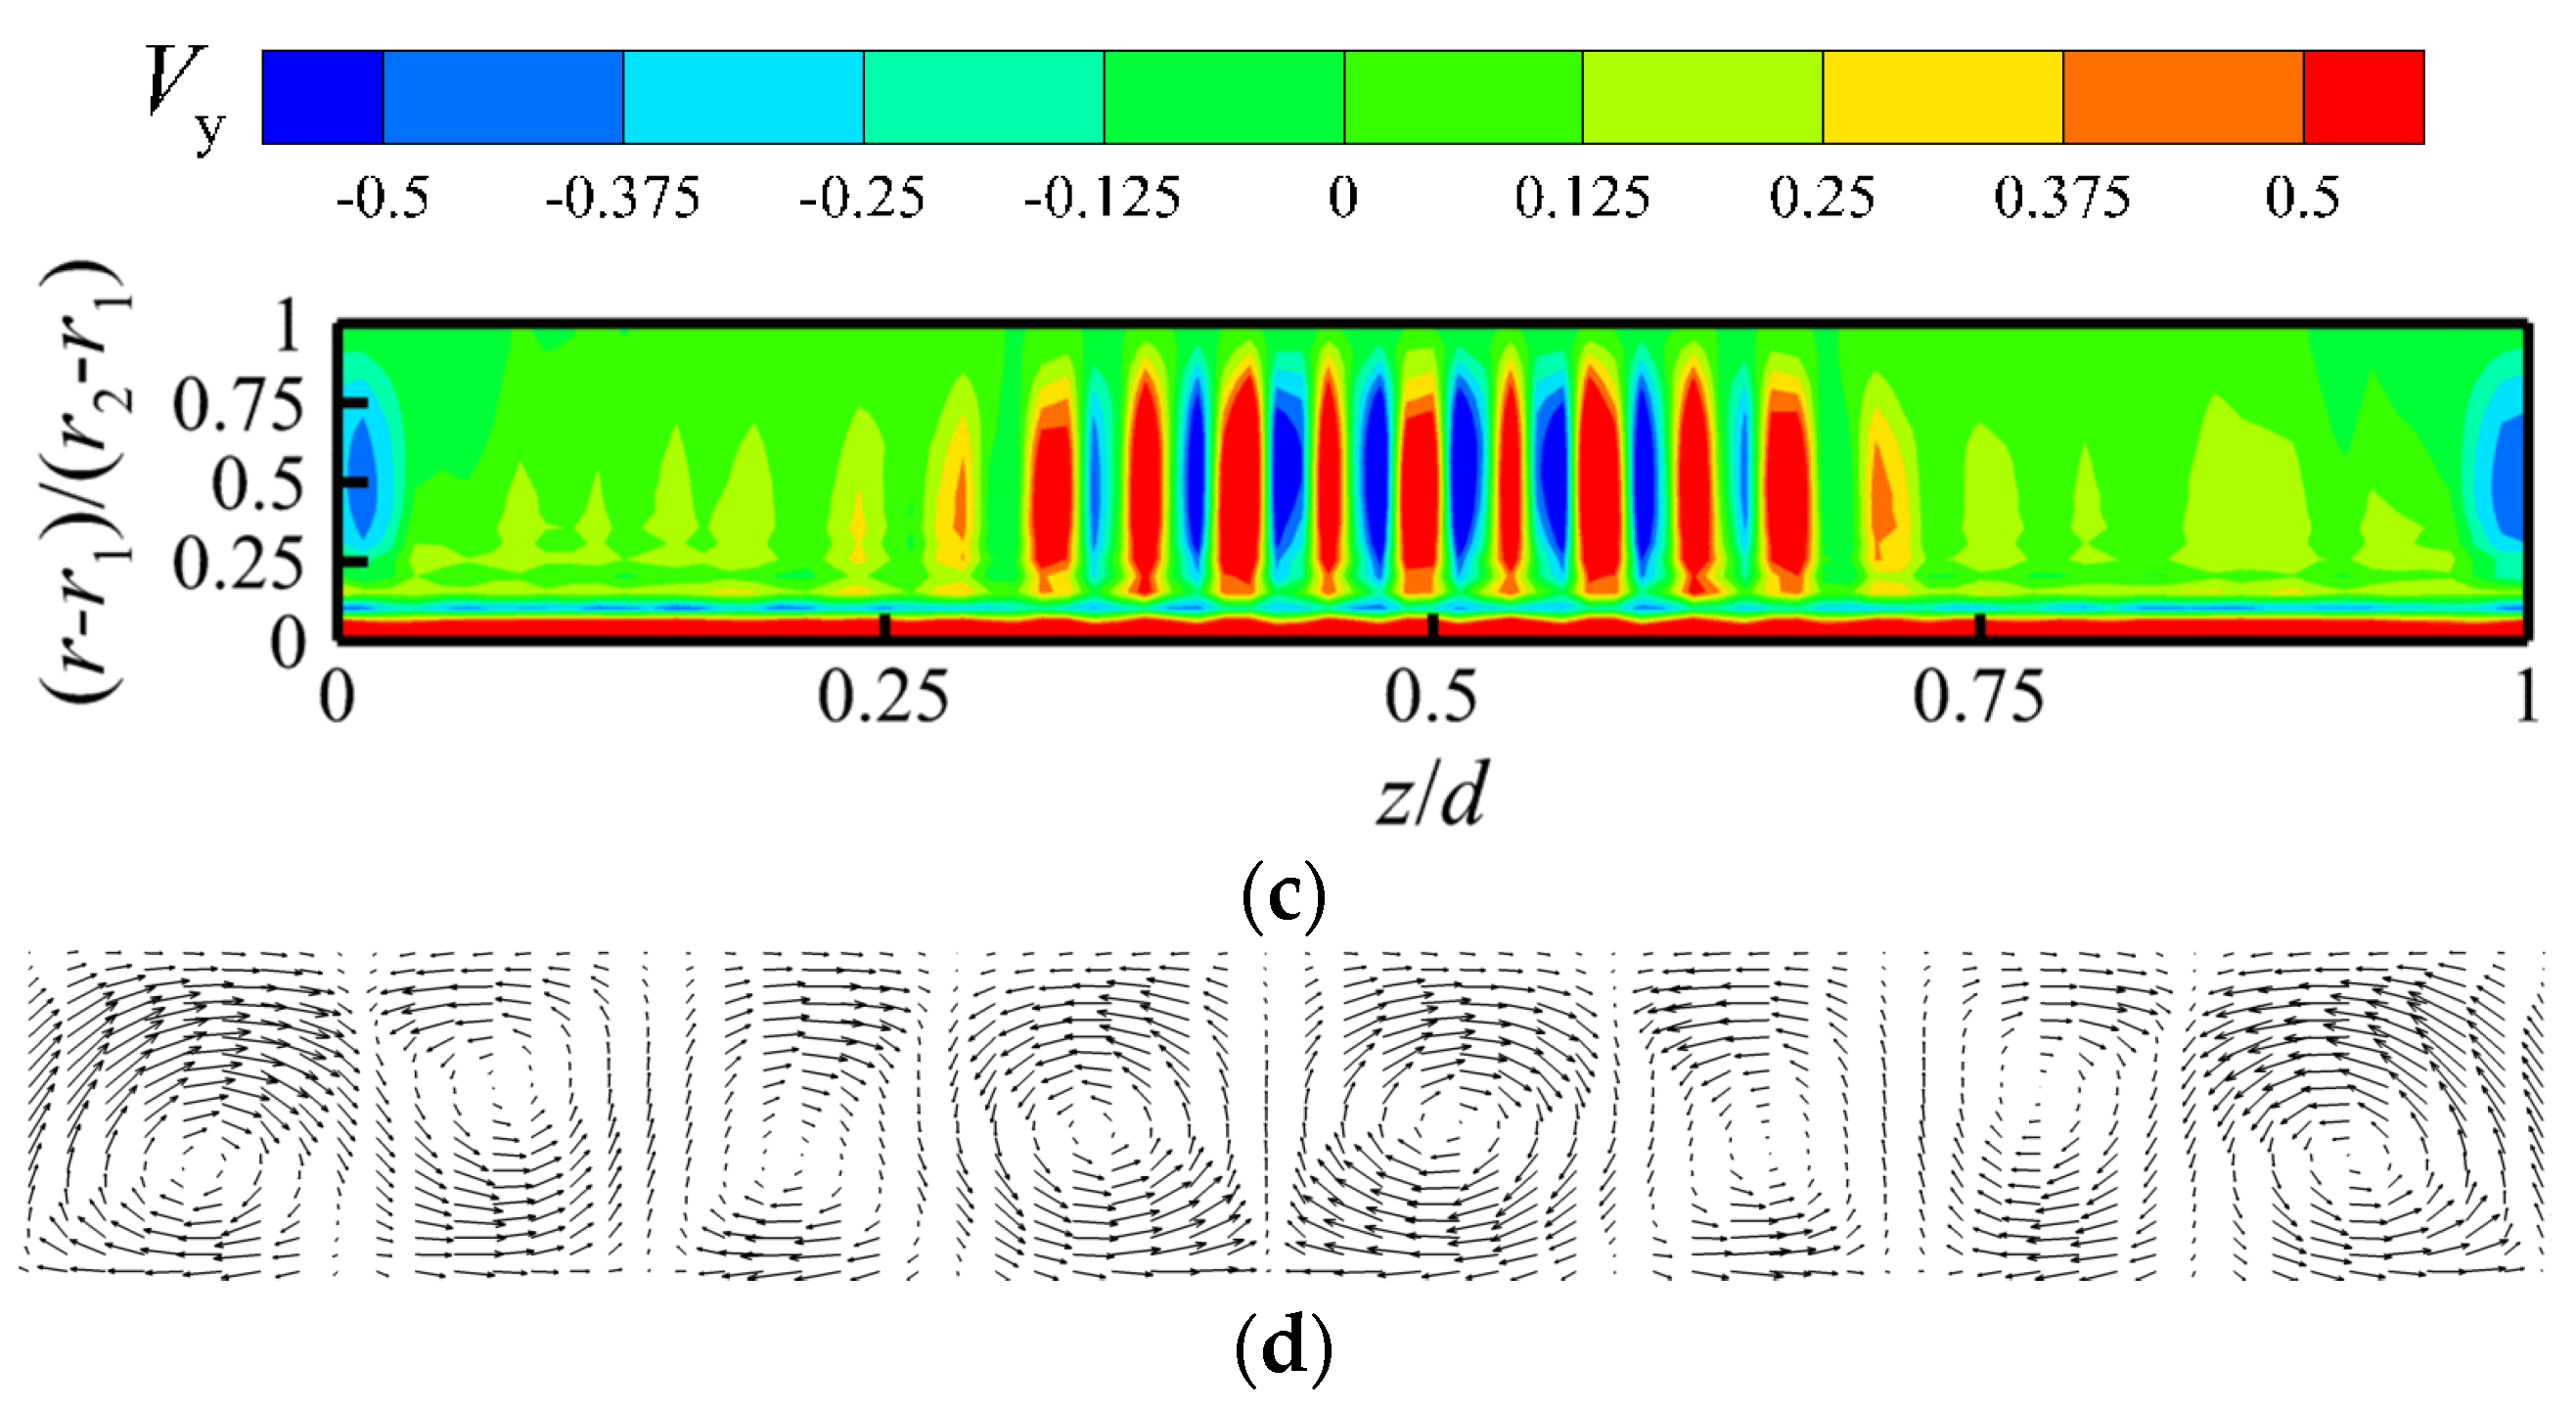
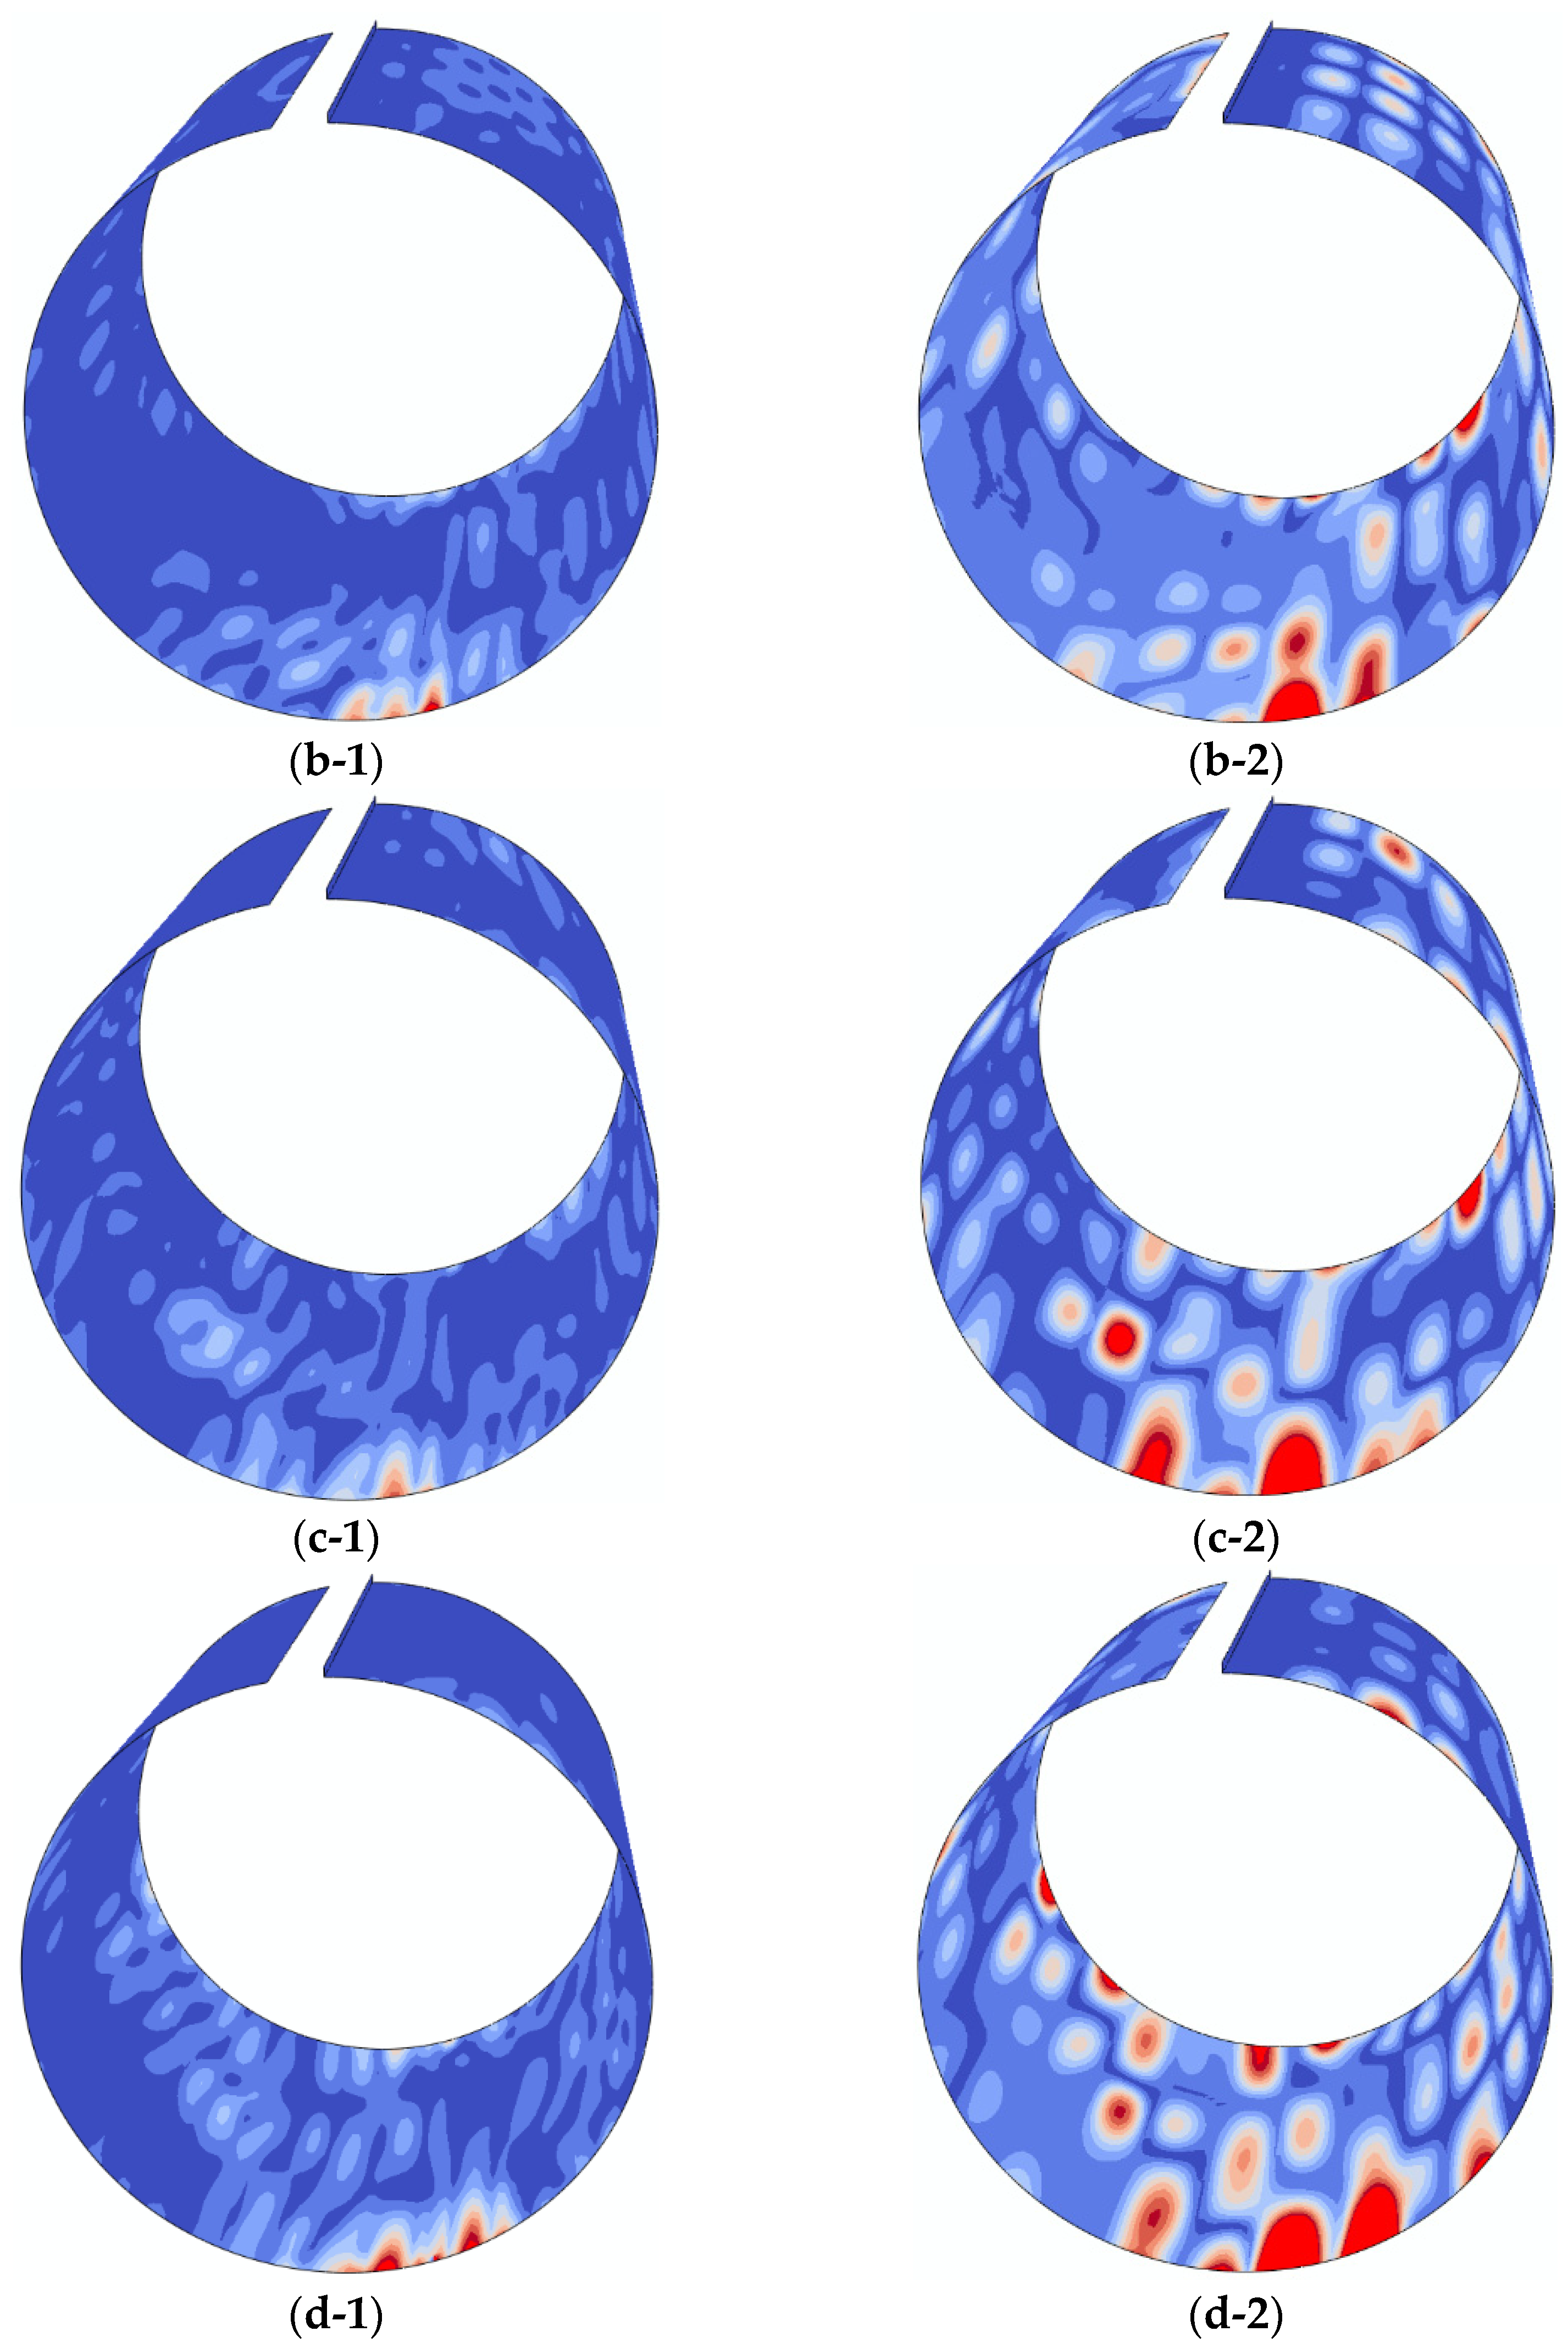
3.1. Flow Field in the Gas Film

In this section, the flow field of the shearing flow induced by the rotator has been explored. Figure 6 and Figure 7 present the variation of the pressure and the axial velocity in real time. The pressure and axial velocity of the shearing flow all attenuate while oscillating with the real-time at t > 15 ms, as shown in Figure 6a and Figure 7a. It is attributed to the inherent pulsation of the Taylor-Couette flow. The magnitude of pulsation in the pressure of the gas film near maximum clearance height (θ = 0) is larger than the minimum clearance height (θ = π). Moreover, the frequency near low-frequency region of the former is also larger than the latter, as shown in Figure 6b. Near θ = 0, the axial velocity is under oscillating in real time because of coupling of the end leakage. Moreover, the variation of pressure and axial velocity in the frequency domain have been presented, as shown in Figure 8. The oscillation at different positions can intuitively reflect the main frequency, which is conducive to studying the unsteady characteristics of fluctuations in pressure. The low-frequency range (0 < f < 104 Hz) is affected by the rotational speed, while the mid-frequency range (104 Hz < f < 5 × 10⁴ Hz) and high-frequency region (f > 5 × 10⁴ Hz) are mainly affected by the coupling effect of shearing flow and foil deformation. Figure 8a shows the variation of pressure in the frequency domain. In the low-frequency region, the corresponding main frequency at θ = π is equal to the rotational speed of the rotor, while the main frequency at θ = 0 is not significant, and the amplitude at θ = π becomes higher. In the mid-frequency range, the amplitude at θ = π is higher than at θ = 0. In the high-frequency region, the amplitude at θ = π is lower than that at θ = 0, which is at odds with the mid-frequency region. Figure 8b shows the variation of axial velocity in the frequency domain. In the low-frequency and mid-frequency regions, the amplitude at θ = π is higher than that at θ = 0; in the high-frequency region, there is no obvious dominance. It is attributed that θ = π is located at the minimum gap, where the pressure amplitude is large and greatly affected by the rotor rotational frequency, which is odd with θ = 0. In the mid-frequency range, the amplitude at θ = 0 is higher than that at θ = π, which is attributed to generation of Taylor vortices at θ = 0 and oscillation of pressure induced by end leakage. For axial velocity, in the low-frequency and mid-frequency regions, the amplitude at θ = 0 is higher than that at θ = π due to the generation of Taylor vortices at θ = 0. However, in the high-frequency region, there is no obvious dominant frequency at different positions. This is because the interaction between convection and solid coupling is sensitive to axial velocity.
Overall, the oscillation of the shearing flow is highly associated with the occurrence of end leakage. From excitation to stable operation, the parameters of the shearing flow all attenuate while oscillating in real time. After t = 15 ms, the pressure and velocity of the shearing flow stay unchanged. The main frequency and amplitude of stable fluctuations of different flow field parameters at different positions are different. In engineering applications, the elastic foil structure of bearings should be reasonably designed so that there is a certain difference between the natural frequency of the elastic foil and the main frequency of the flow field parameters to avoid resonance.
Figure 9 presents the variation of tangential velocity along the dimensionless radius near θ = 0. Near the midsection of the clearance (Z/L = 0.5), the tangential velocity first increases at (rr1/r2r1) < 0.25, then stays almost unchanged at 0.25 < (rr1/r2r1) < 0.75; lastly, it gradually decreases to zero at (rr1/r2r1) > 0.25. In contrast, the tangential velocity near the end of the clearance (Z/L = 0.1) decreases along the radial direction monotonously. It is noted that for the quasi-steady state, the tangential velocity almost stays unchanged at different times both for Z/L = 0.1 and Z/L = 0.5, which indicates the shearing flow is dominated by low-level turbulence over the period. The distribution of instantaneous pulsating pressure of the shearing flow has been presented in Figure 10. Near θ = 4π/5, the regional pulsating pressure first increases and then decreases. This is because the pressure near θ = 4π/5 is significantly affected by the deformation of the elastic foils, while other positions are the opposite and less affected by the deformation of the elastic foils.
The time-averaged distribution of pressure and velocity has also been presented, as shown in Figure 11. The pressure of the shearing flow downstream of the minimum clearance height is less than the ambiance, while the pressure upstream of the minimum clearance height is larger than the ambiance. Also, near maximum clearance height, the pressure of the shearing flow is close to the ambiance. Moreover, the gauge pressure of the shearing flow near the end of the clearance is close to zero. Based on previous studies [10], the shearing flow is characterized by the paring of the Taylor vortexes and can be clearly found in this section. The distribution axial velocity and radial velocity indicated the formation and shading of the Taylor vortexes. The Taylor vortexes are formed near the midsection and keep complete shapes. It gradually moves towards the end of the clearance and then distorts and breaks at the outlet of the clearance.
Overall, the shearing flow is characterized by the circular channel between the rotator and the top foil, which has been confirmed in previous studies [10,43]. After time-averaged treatment, the paring of the Taylor vortexes can be found near the midsection of the clearance. Also, the end leakage has a great impact on the formation of the Taylor vortexes. Near the outlet of clearance, the Taylor vortexes have been distorted and broken. From excitation to the quasi-steady state, its pressure and velocity are under violent oscillation in the time domain. For the quasi-steady state, the tangential velocity almost stays unchanged while the pressure pulsation is in an oscillating condition.

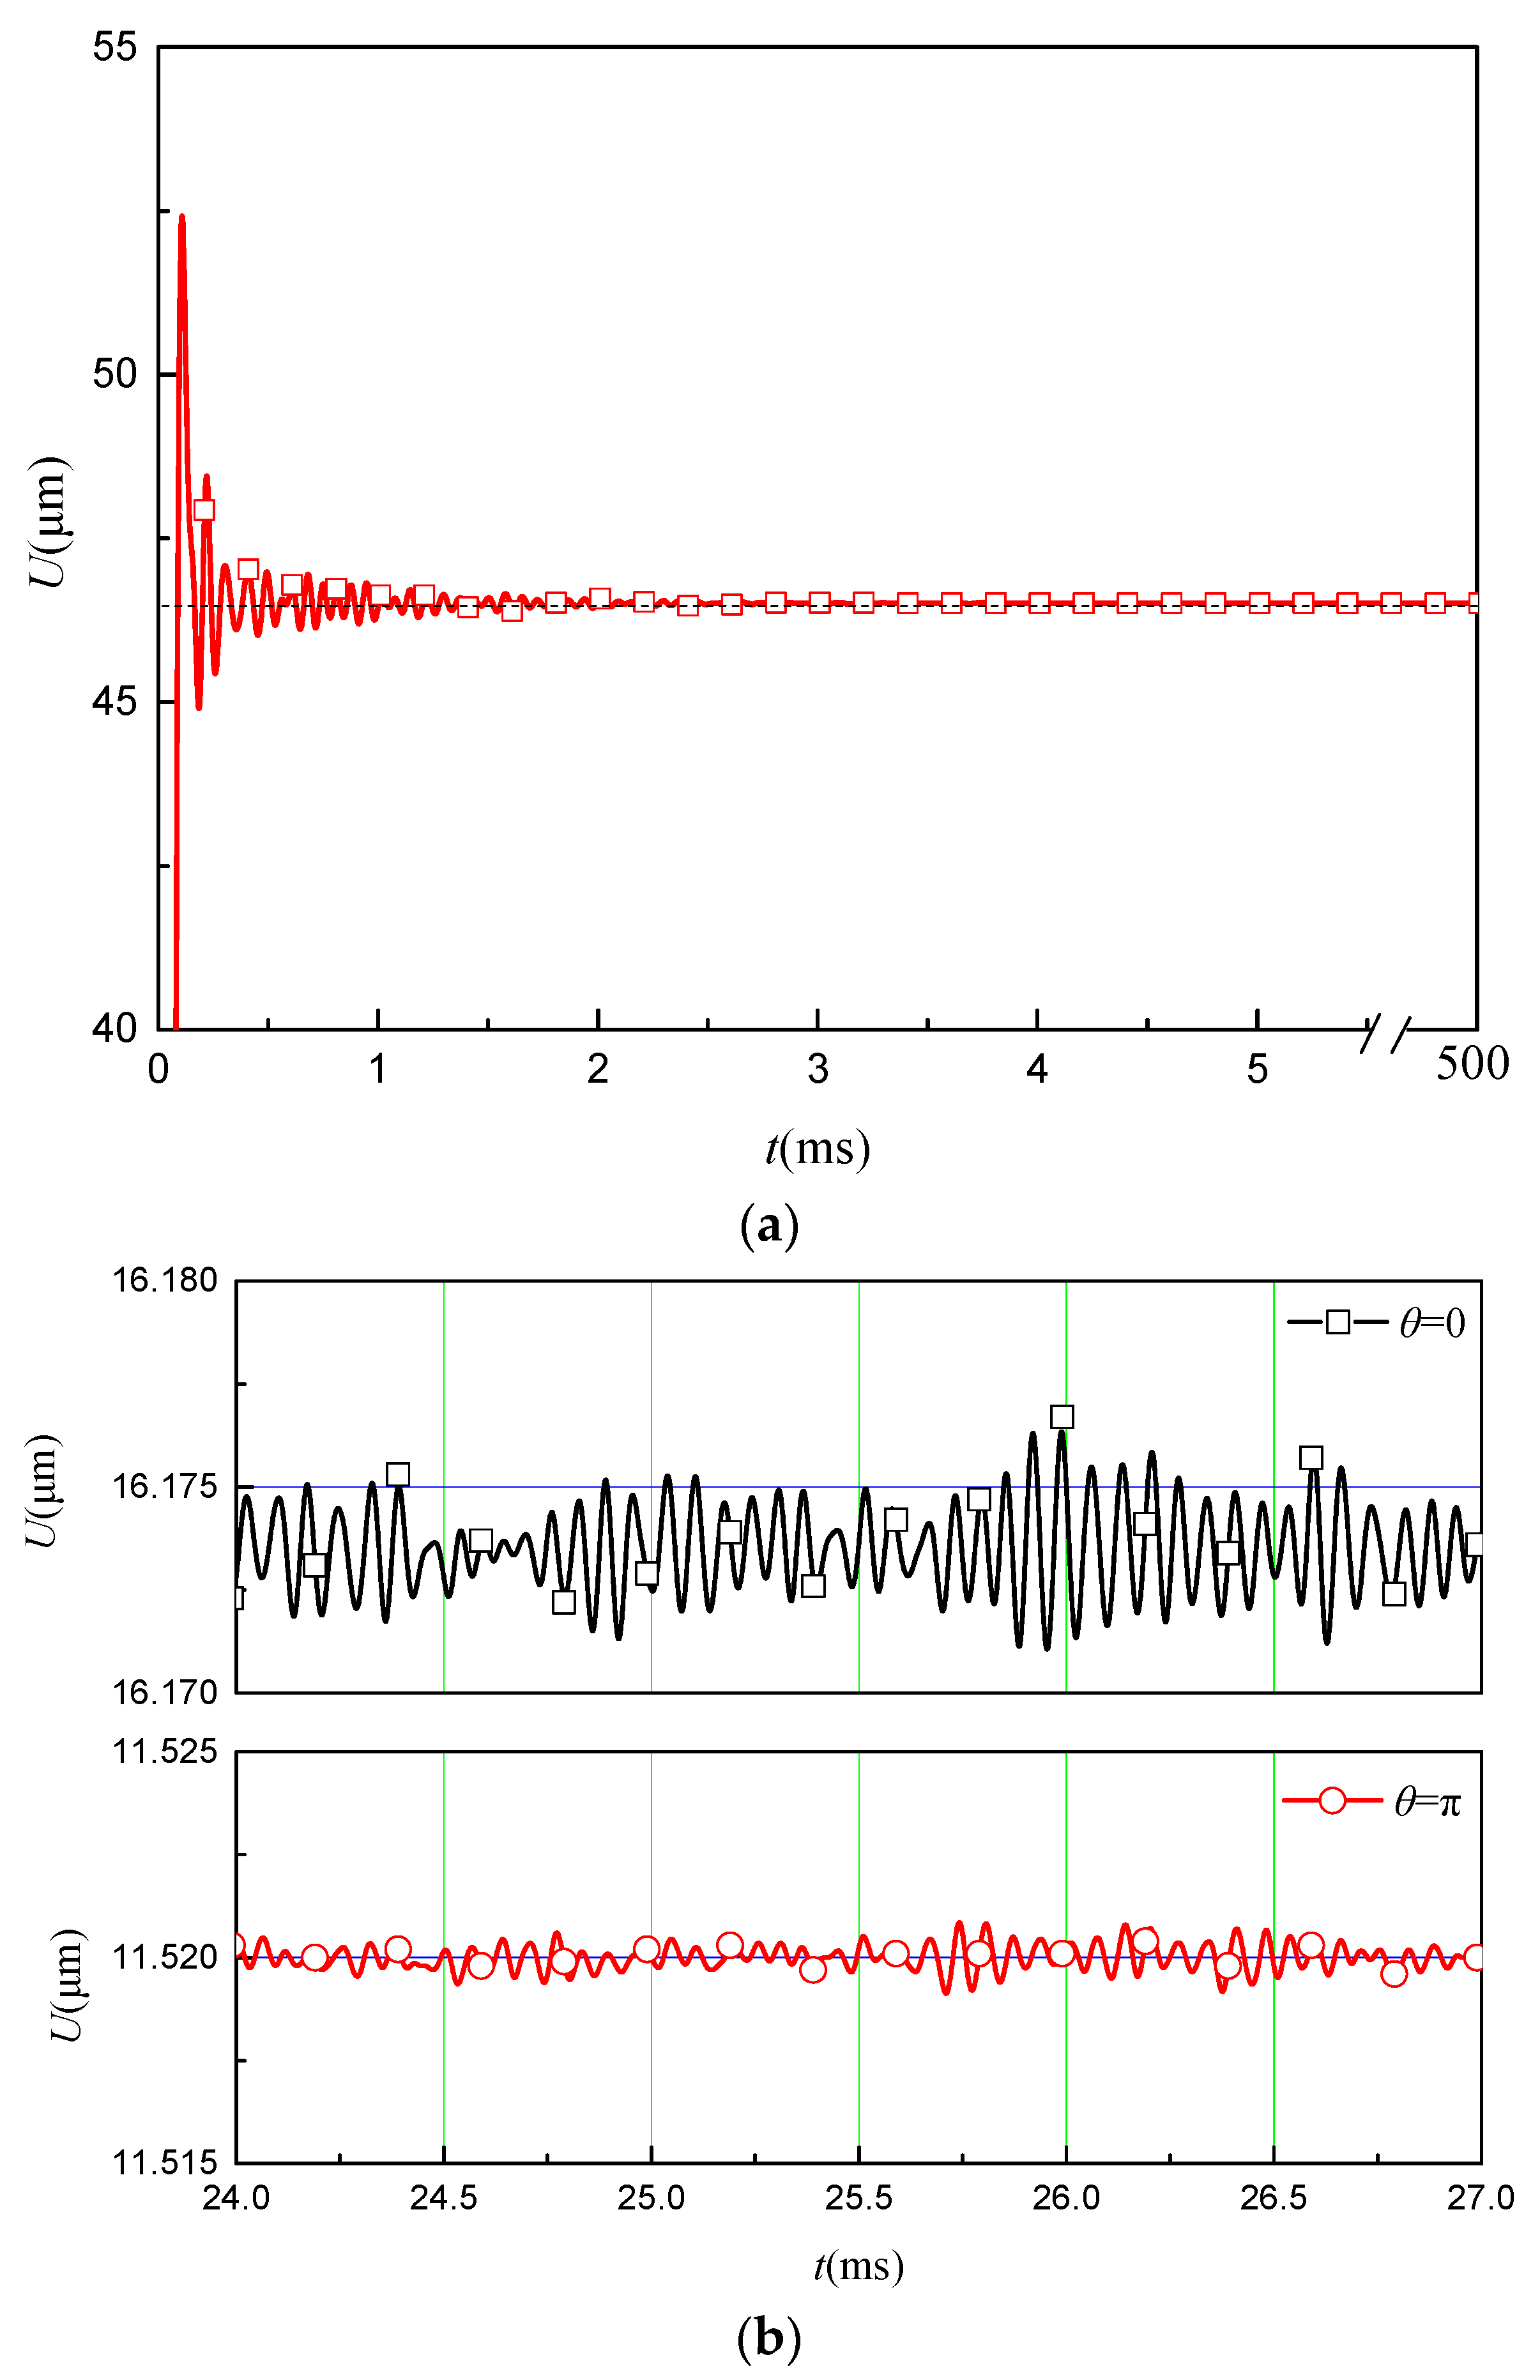
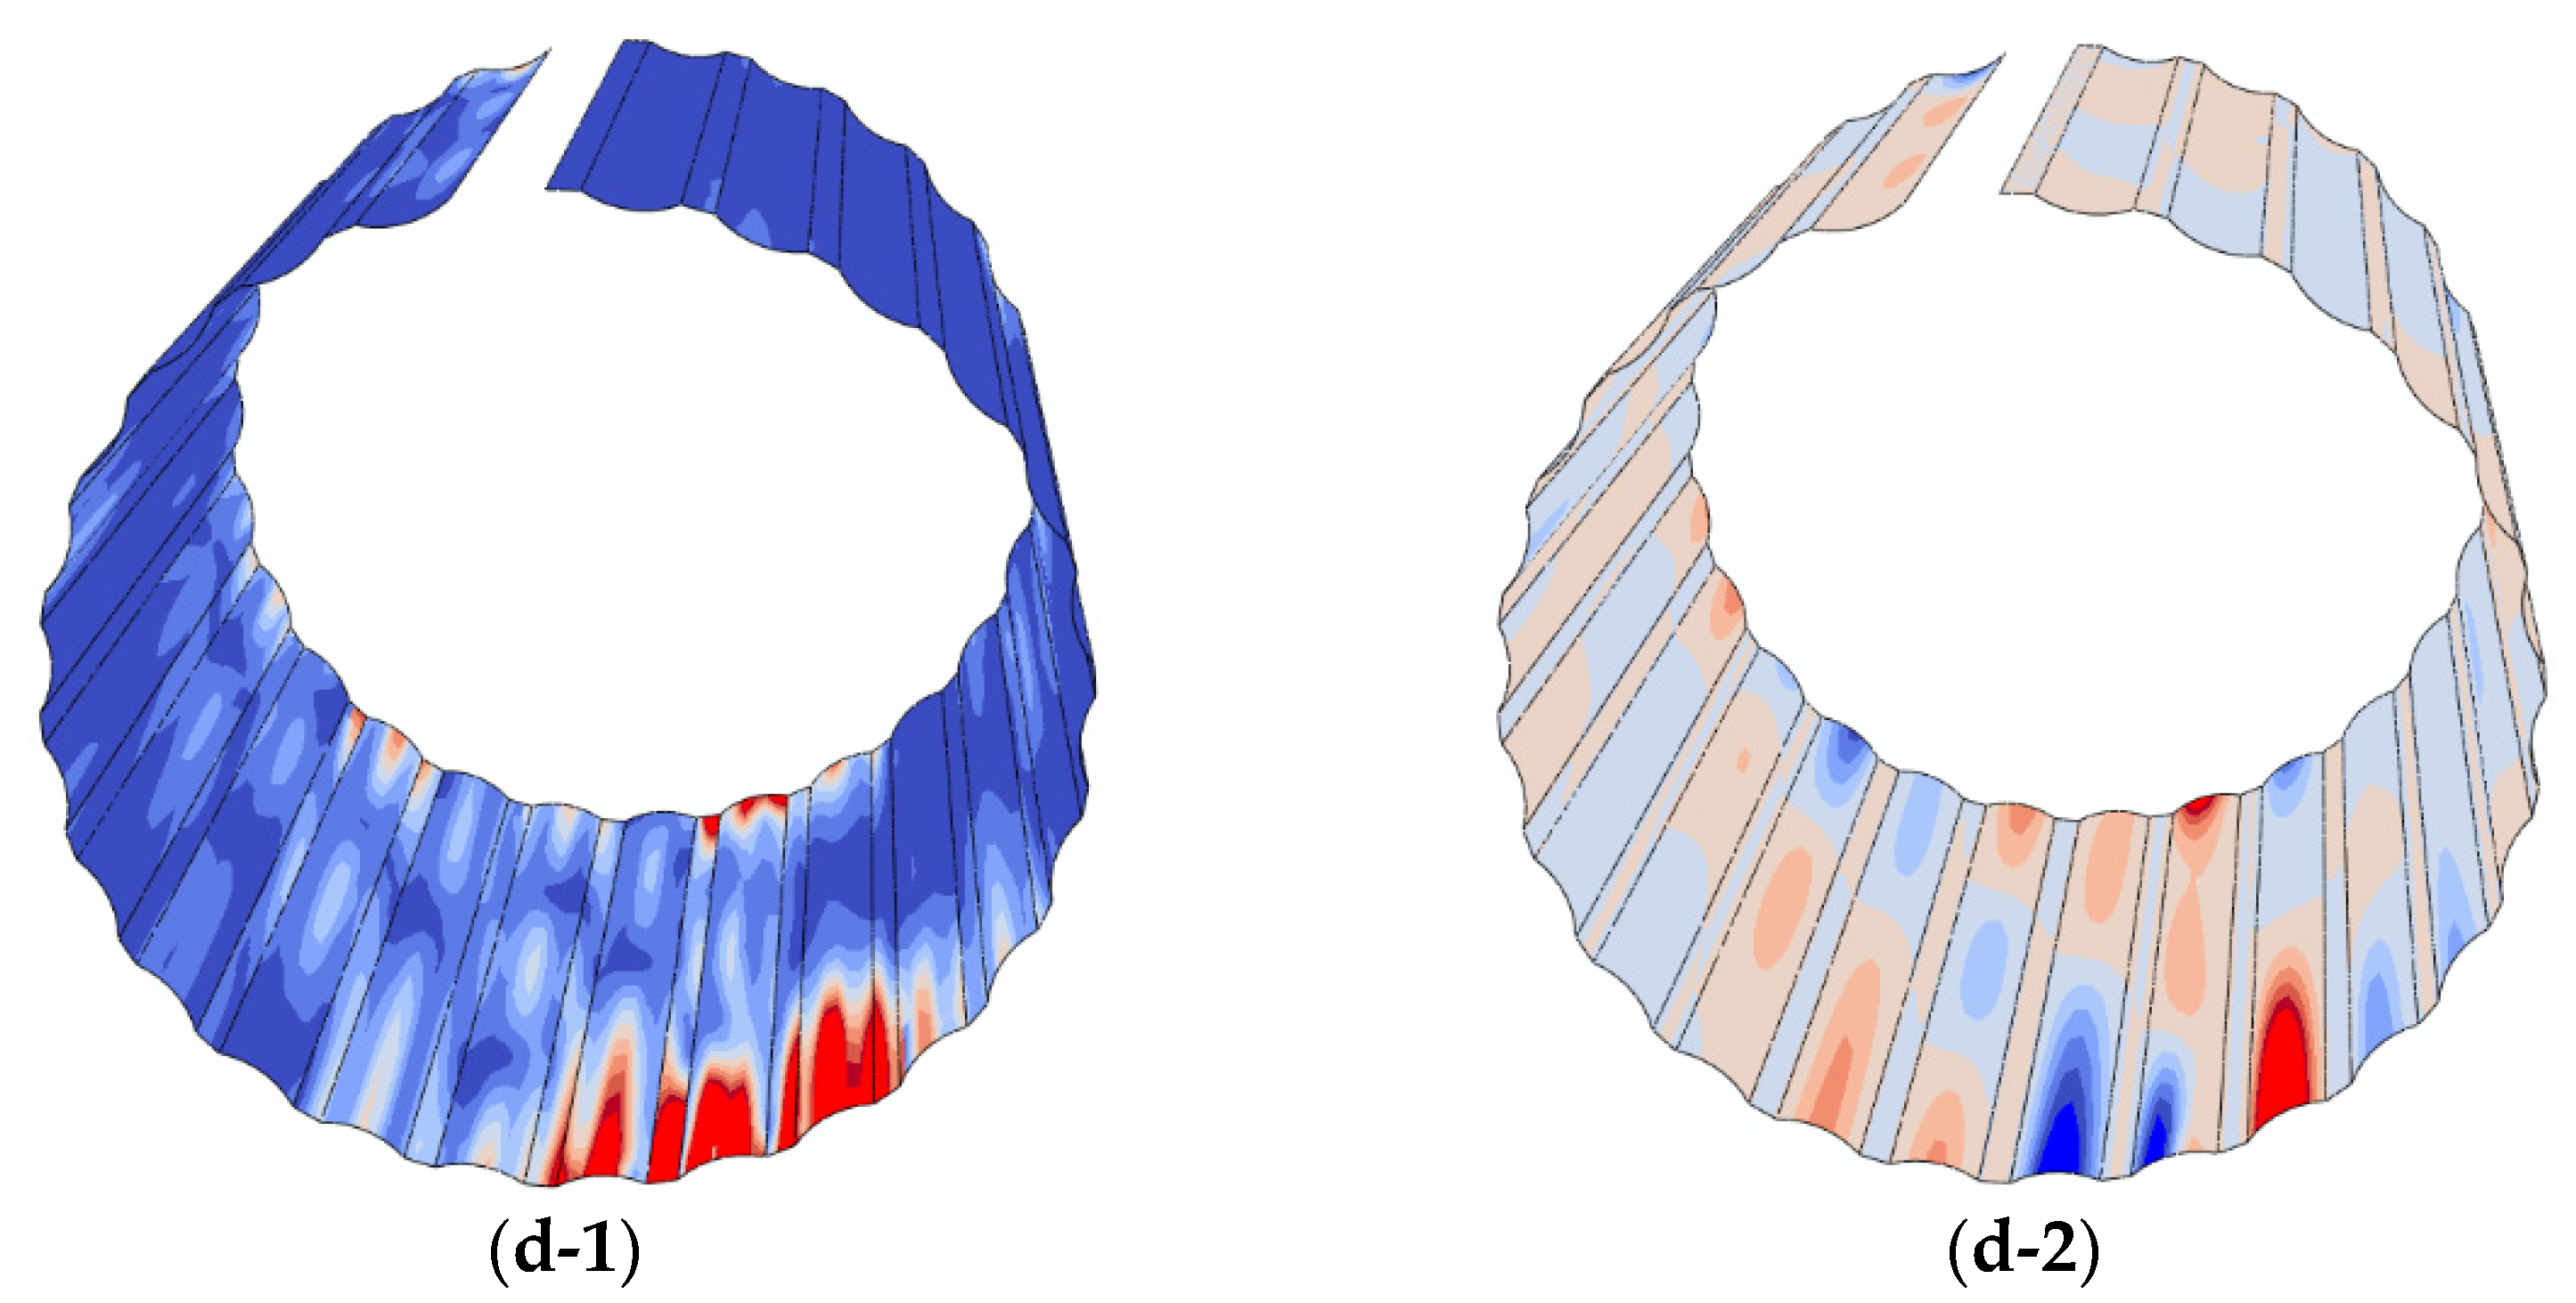
3.2. Solid Field of Foils

The deformation and dynamic response of elastic foils in the solid domain are also the concerned issues of this study. In this section, the instantaneous deformation of the top foil and bump foil has been presented. Figure 12 presents the variation of the radial displacement of the top foil in real time near θ = π. Monitor #1 and monitor #2 are, respectively, a point on the top foil that is in direct contact with the bump foil and a point that is not in direct contact with the bump foil. Similar to the pressure and velocity in the fluid domain, the radial displacement attenuates while oscillating in real-time. Then, the radial displacement of the top foil is almost unchanged at t > 3 ms. It is indicated the oscillating duration in the solid domain is much less than the fluid domain. The vibration magnitude of radial displacement near θ = π is less than θ = 0, which corresponds to the pressure and velocity of the shearing flow. Figure 13 presents the variation of the radial displacement in the frequency domain near θ = π. The main frequency of radial displacement at monitor #1 and monitor #2 is similar, but the amplitude of radial displacement differs significantly. The amplitude of monitor #1 is about three times that of monitor #2. In engineering applications, the elastic foil structure of bearings should be reasonably designed so that there is a certain difference between the natural frequency of the elastic foil and the main frequency of the flow field parameters to avoid resonance phenomena.
Figure 14 and Figure 15 present the instantaneous contours of stress and radial displacement of the top foil and the bump foil. The stress of the top foil is in a high level near the region where it contacts with the bump foils. Moreover, the maximum radial displacement takes place near the minimum clearance height and the end of the clearance, which is attributed to the larger gradient of pressure in the shearing flow. As shown in Figure 15, the maximum stress and radial displacement are located near θ = π and Z/L = 1.
For the top foil, the stress within the quarter circle to the right of θ = 0 firstly increases and then decreases. In contrast, at θ = π, the stress distribution on both sides firstly decreases and then increases. The distribution of displacement for both positions is opposite, indicating that the change in displacement lags behind the force. For the bump foil, the stress and displacement on both sides at θ = π firstly decrease and then increase, indicating that the deformation of bump foil lags behind the top foil. Except for the above positions, there is no obvious periodic pattern, indicating that the main positions for the interaction between the gas film pressure and the elastic foil are on both sides at θ = π.
Figure 16 presents the time-averaged contours of stress and radial displacement for top foil and bump foil. After time-averaged treatment, the maximum stress of the top foil is located in the contact zone between the top foil and the bump foil, as shown in Figure 16a. In contrast, the maximum stress on the bump foil takes place near the fixed end. This is attributed to the accumulation of stress and the radial movement of the top foil. Moreover, the maximum radial displacement occurs near the free end.

3.3. Comparison of with and without FSI

The role of the fluid–structure interaction on the carry capacity and flow field has been presented and illustrated in this section. A comparison of carry capacity between cases with FSI and without FSI has been presented. The FSI indicates the case with fluid–structure interaction, such that the deformation of the top/bump foils is tightly associated with distribution of pressure of the gas film. In contrast, the case without FSI indicates the condition of infinite stiffness of the top/bump foils that its morphology does not change with aerodynamic pressure. Figure 17 presents the distribution of mean pressure contours on the foil side along the circumferential direction. Figure 18 presents the variation of pressure and film thickness along the angled direction at Z/L = 0.5. For the case without FSI, the peak pressure downstream of the minimum clearance height is larger than the case with FSI, as shown in Figure 17. Also, for the case without FSI, the curve of pressure along the circumferential direction is smoother than with FSI. Therefore, compared the case without FSI, the fluid–structure interaction between the shearing flow and elastic foils had weakened its carry capacity. Moreover, for the case without FSI, the peak pressure is 16.8% larger than the case with FSI. This is because the deformation of the elastic foil had enlarged the local clearance height, and the carry capacity had been impaired correspondingly. For the case without FSI, the clearance height is less than the case with FSI, as shown in Figure 18b. In summary, compared with the classical sinusoidal curve of the pressure distribution generated by the case without FSI [24], the presence of the elastic foil flattens the distribution of the pressure of the gas film. The pressure downstream of the minimum clearance height had decreased. Moreover, it is furtherly confirmed that, for the case with FSI, pulsation of pressure is dominated by the elastic foil. For the case without FSI, the pulsation of pressure is inherently featured by shearing flow itself, which is consistent with published experiments [44].

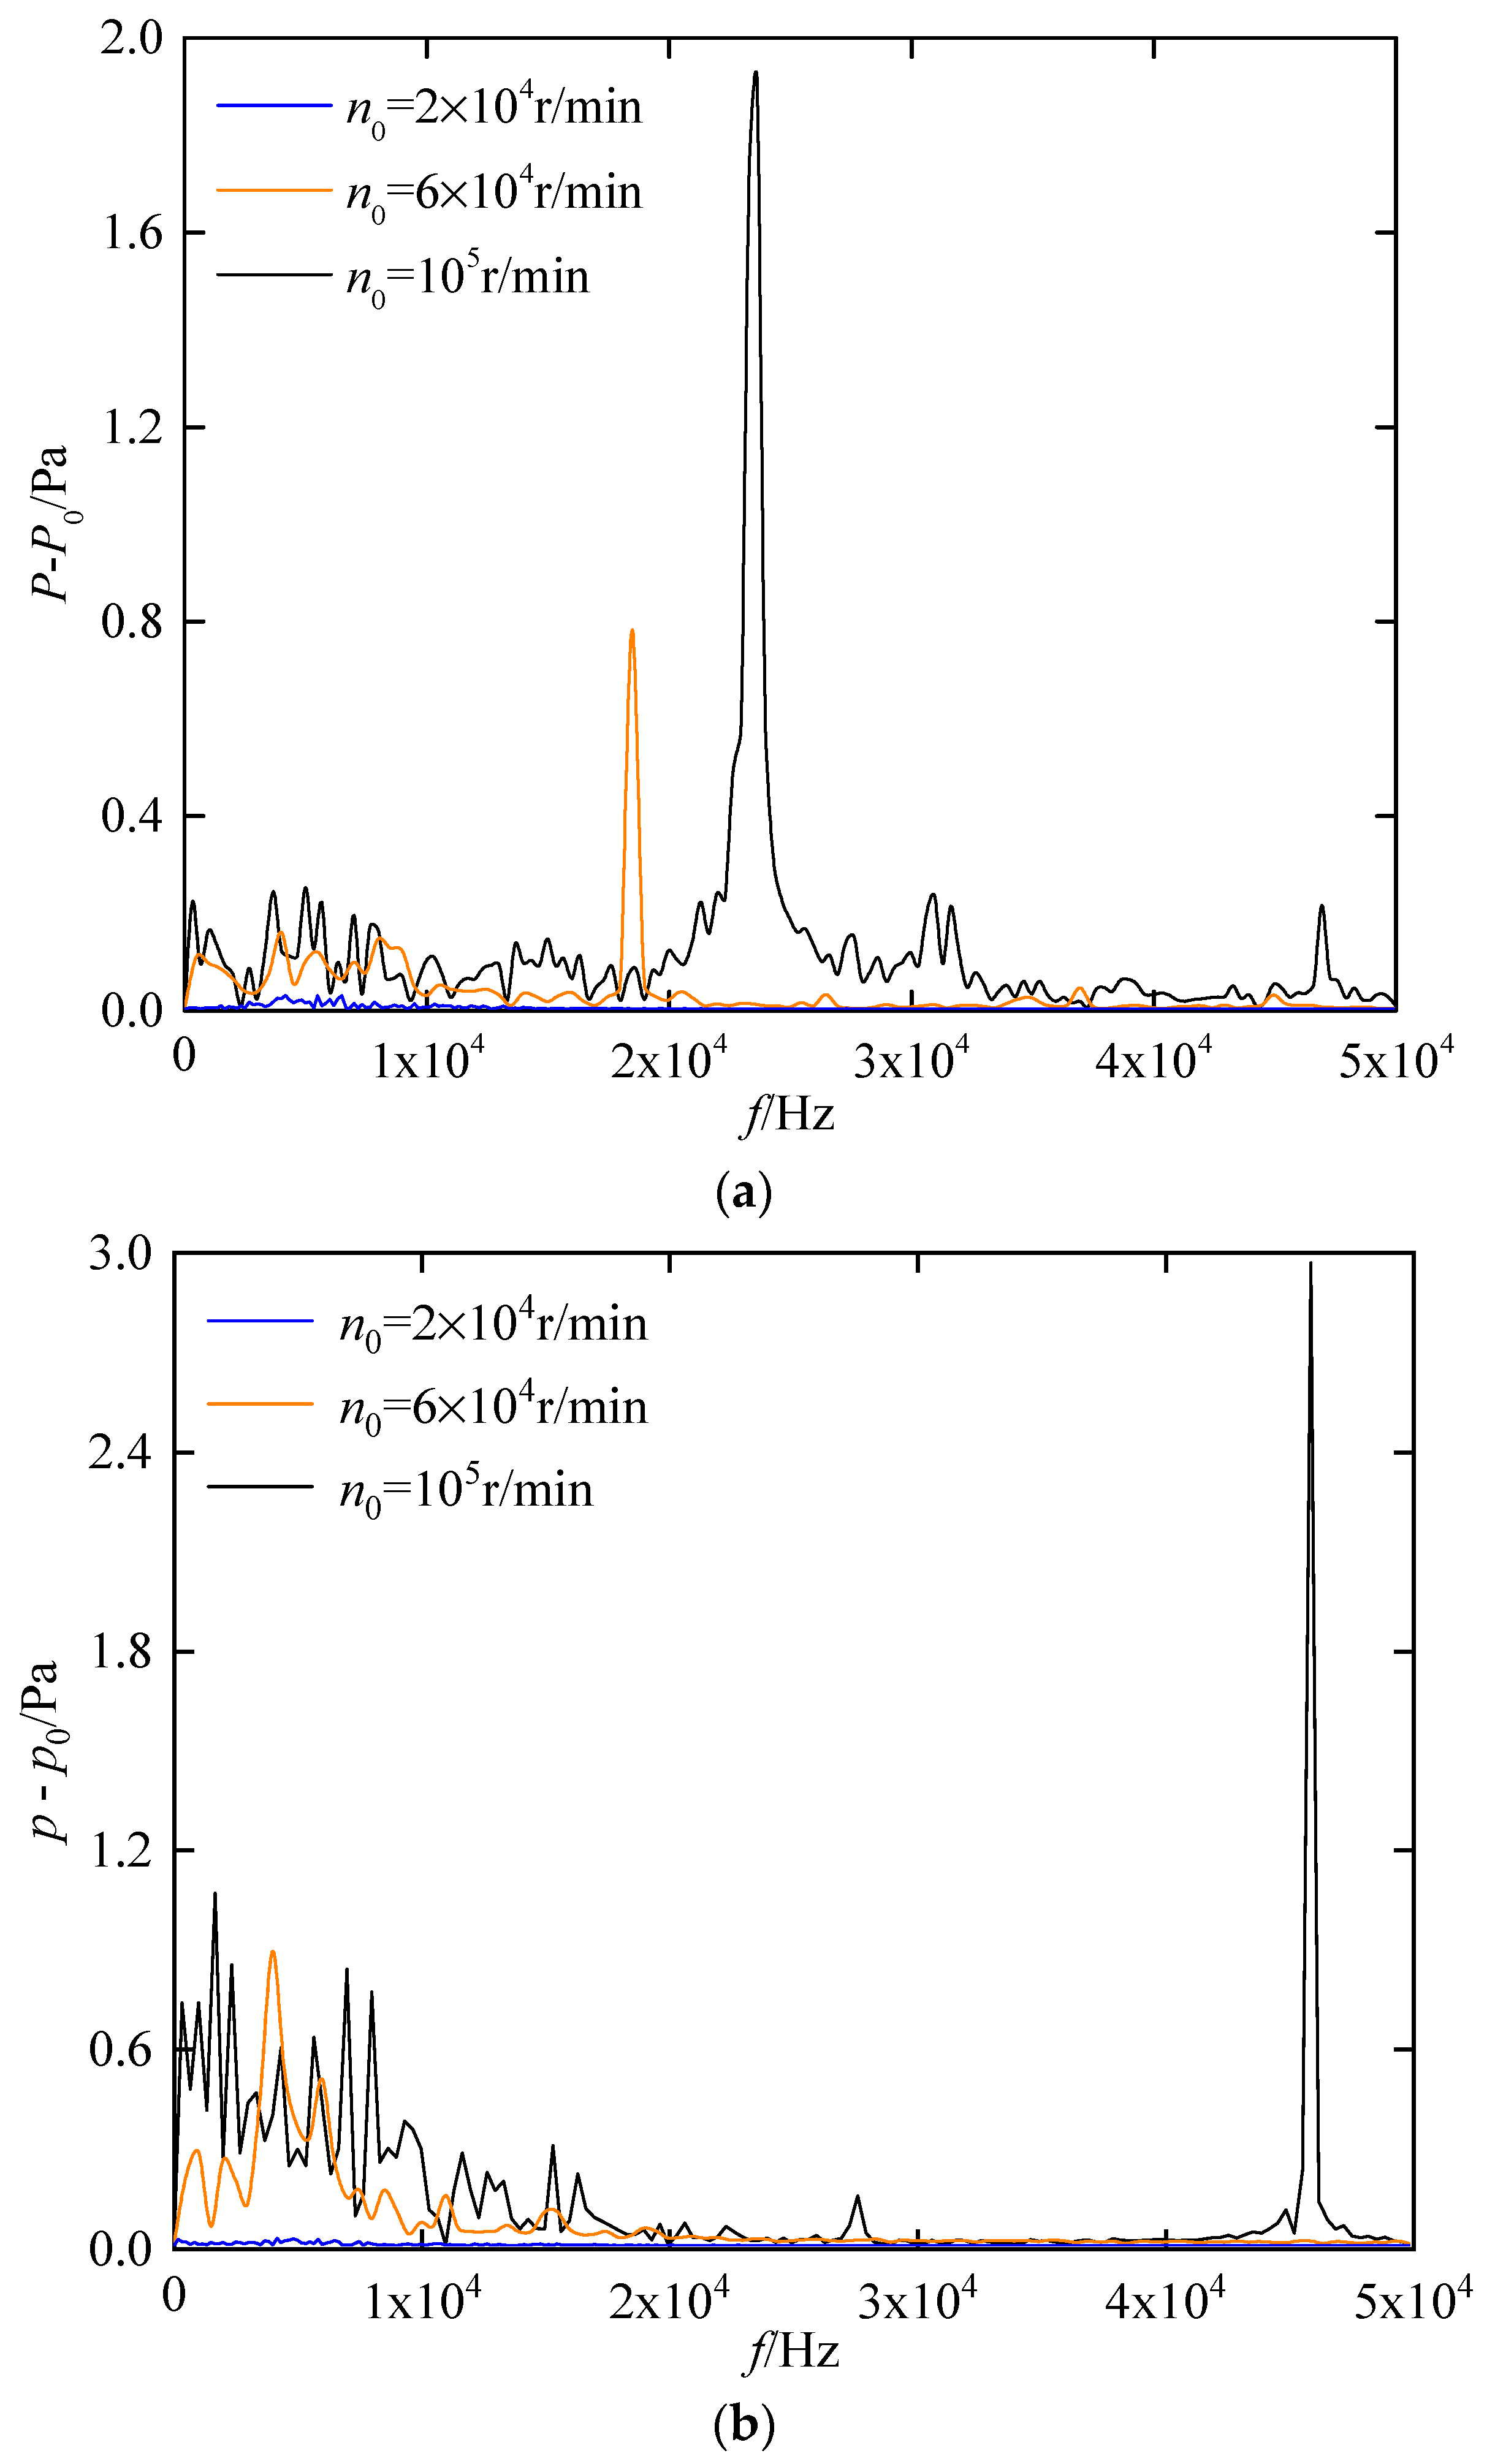
3.4. Influence of the Rotational Speed

3.4.1. Fluid Domain

Figure 19 and Figure 20 show the variation of pressure in the frequency domain without and with FSI as a function of rotational speed, respectively. For cases with FSI or without FSI at n0 = 2 × 10⁴ r/min, there is no significant change in amplitude at θ = 0 and θ = π. With FSI, the amplitude is less than or close to the amplitude without FSI. As the rotational speed increases, the amplitude continuously increases at θ = 0 and θ = π, regardless of the presence or absence of FSI. Compared with the case without FSI, the case with FSI reduces the amplitude of pressure oscillation, and there is no significant interference frequency near the main frequency in the mid-frequency region and high-frequency region. As the rotational speed increases, the main frequency continuously increases correspondingly.

3.4.2. Solid Domain

Taking monitor #1 as an example, Figure 21 shows the variation of the total displacement in the frequency domain with rotational speed. As the rotational speed increases, the amplitude also increases. The main frequency is located in the mid frequency range, and the interference frequency near the main frequency increases. This is because as the rotational speed increases, the amplitude of the fluctuation of the elastic foil increases. There is an interference frequency near the main frequency, and the vibration amplitude of displacement of the top foil caused by fluid pulsation is much lower than the vibration amplitude caused by the characteristics of the elastic foil itself.
In summary, as the rotational speed increases, the main frequency and the amplitude of pressure in the fluid domain also increase. For the case with FSI, there is no interference frequency near the main frequency, which improves the stability of the shearing flow. However, interference frequency appears near the main frequency of total displacement in the solid domain. Therefore, in practical engineering applications of gas foil journal bearings, an appropriate rotational speed can achieve the best stability and load-bearing performance in bearings.

4. Conclusions

In this study, a numerical investigation of gas foil journal bearings (GFJBs) with conjugation between the unsteady aerodynamic behavior of shearing flow and the dynamic response of elastic foils has been performed. Additionally, the role of fluid–structure interaction on the characteristic of the fluid and solid domains has been illustrated. The results are concluded as follows:
(1) The shearing flow in the gap between the rotator and stator is solved via large eddy simulation, and the time-resolved deformation of the preloaded foils is simulated using the Conventional Serial Staggered method. A mesh-based parallel-code coupling interface is used to control the coupling process, and the exchange of forces and displacements across the fluid–structure interface has been specified. The computational model in this article can better reveal the unsteady characteristics of GFJBs with fluid–structure interaction, which cannot be calculated using a traditional quasi-static computational method. In the future, the unsteady characteristics of GFTBs under the influence of fluid–thermal–structure interactions as well as its rotor dynamics can be further analyzed.
(2) The oscillation of the shearing flow is highly associated with the occurrence of end leakage. From excitation to stable operation, the parameters of the shearing flow all attenuate while oscillating in real time. After t = 15 ms, the pressure and velocity of the shearing flow stay unchanged. In engineering applications, the elastic foil structure of bearings should be reasonably designed so that there is a certain difference between the natural frequency of the elastic foil and the main frequency of the flow field parameters to avoid subsynchronous resonance.
(3) The oscillation duration in the solid domain is much less than in the fluid domain. The maximum stress of the top foil is located in the contact zone between the top foil and the bump foil. In contrast, due to the accumulation of stress and the radial movement of the top foil, the maximum stress on the bump foil takes place near to the fixed end. The maximum radial displacement occurs near the free end. The main positions for the interaction between the gas film pressure and the elastic foil are on both sides of θ = π.
(4) Compared with the case without FSI, in the case with FSI, the elastic foil flattens the distribution of the pressure of the gas film. The fluid–structure interaction between the shearing flow and elastic foils had weakened the carry capacity compared with the rigid case. Moreover, it is further confirmed that the pulsation of pressure with fluid–structure interaction is dominated by the elastic foil. Without fluid–structure interaction, the pulsation of pressure is inherently featured by the shearing flow itself.
(5) As the rotational speed increases, the main frequency and the amplitude of pressure in the fluid domain continuously increase. For the case with FSI, there is no interference frequency near the main frequency, which improves the stability of the shearing flow. However, interference frequency appears near the main frequency of displacement in the solid domain. Therefore, in practical engineering applications of gas foil journal bearings, an appropriate rotational speed can achieve the best stability and load-bearing performance of bearings.

Author Contributions

Conceptualization, C.Y., Y.L. and J.Z.; methodology, Z.C., Z.W. and Y.L.; software, C.Y. and Z.C.; validation, C.Y., Z.C. and Z.W.; formal analysis, C.Y. and Z.C.; investigation, C.Y. and Z.W.; resources, Y.L.; data curation, Z.C.; writing—original draft preparation, C.Y. and J.Z.; writing—review and editing, Z.C., Z.W. and Y.L.; visualization, C.Y.; supervision, J.Z.; project administration, J.Z.; funding acquisition, Y.L. and J.Z. All authors have read and agreed to the published version of the manuscript.

Funding

National Natural Science Foundation of China (Grant No. 52206091; 51776097), the Natural Science Foundation of Jiangsu Province (Grant No. BK20210303), Interdisciplinary Innovation Foundation for Graduates, NUAA, China (No. KXKCXJJ202309), and Advanced Jet Propulsion Innovation (Grant No. HKCX2022-01-001).

Data Availability Statement

Not applicable.

Conflicts of Interest

The authors declare no conflict of interest.

Nomenclature

Nomenclature entries should have the units identified
bRamp extent ratio
[C] damping matrix
Cpspecific heat capacity (J/(kg·K))
Dcell distance from the wall (mm)
E0Young’s modulus (GPa)
Etotal energy
eeccentricity
Fbearing load capacity (N)
{F} aerodynamic force matrix
hthickness of the gas film (μm)
h1maximum thickness of the gas film (μm)
h2minimum thickness of the gas film (μm)
[K] stiffness matrix
kturbulent kinetic energy (m2/s2)
keffeffective thermal conductivity
LLength of bearing (mm)
[M] mass matrix
nunit outward normal vector
n0rotational speed (r/min)
jwaypoint index
Ktrailing-edge nondimensional angular deflection rate
lhalf of span of bump element (mm)
Prtturbulent Prandtl number
ppressure (Pa)
p0pressure of environment (Pa)
rradial coordinate
r1minimum radial position of thickness (mm)
r2maximum radial position of thickness (mm)
Rrotator radius (mm)
Rstator radius (mm)
R1inner radius (mm)
R2outer radius (mm)
sthickness of orifice plate (m)
Sstrain tensors
Ttemperature (K)
ttime (s)
ttThickness of top foil (μm)
tbThickness of bump foil (μm)
ufluid velocity (m/s)
Utotal displacement (mm)
U1radial displacement (mm)
radial displacement
Vcell volume
{x} the displacement vector
y+dimensionless height of the first layer
zcoordinate across film thickness
Greek Letters
ρdensity (kg/m3)
θangular coordinate
βtop foil opening angle
μdynamic viscosity (Pa·s)
μtturbulent dynamic viscosity (Pa·s)
σstress tensor
δKronecker delta
Δ length scale
κvon Karman constant
Subscripts
bbump
ffluid
sstructure
ttop

References

  1. Samanta, P.; Murmu, N.; Khonsari, M. The evolution of foil bearing technology. Tribol. Int. 2019, 135, 305–323. [Google Scholar] [CrossRef]
  2. Dellacorte, C. Oil-Free shaft support system rotor dynamics: Past, present and future challenges and opportunities. Mech. Syst. Signal Process. 2012, 29, 67–76. [Google Scholar] [CrossRef] [Green Version]
  3. Khonsari, P. On the limiting load-carrying capacity of foil bearings. J. Tribol. 2004, 126, 817–818. [Google Scholar]
  4. Bensouilah, H.; Lahmar, M.; Bou-Said, B. Elasto-aerodynamic lubrication analysis of a self-acting air foil journal bearing. Lubr. Sci. 2012, 24, 95–128. [Google Scholar] [CrossRef]
  5. Xu, H.; Liu, Z.; Zhang, G. Design and experiment of oil lubricated five-leaf foil bearing test-bed. J. Eng. Gas Turbines Power 2009, 131, 054505. [Google Scholar] [CrossRef]
  6. Hosain, M.; Fdhila, R.; Ronnberg, K. Taylor-Couette flow and transient heat transfer inside the annulus air-gap of rotating electrical machines. Appl. Energ. 2017, 207, 624–633. [Google Scholar] [CrossRef]
  7. Petrolo, D.; Longo, S. Buoyancy transfer in a two-layer system in steady state. Exp. A Taylor-Couette Cell. J. Fluid Mech. 2020, 8, 31–52. [Google Scholar]
  8. Peng, Z.; Khonsari, M. Thermohydrodynamic Analysis of Foil Journal Bearings. J. Tribol. 2006, 128, 534–541. [Google Scholar] [CrossRef]
  9. Liu, X.; Li, C.; Du, J.; Nan, G. Thermal characteristics study of the bump foil thrust gas bearing. Appl. Sci. 2021, 11, 4311. [Google Scholar] [CrossRef]
  10. Luo, Y.; Zhang, J. Analysis of gas film thermal characteristics of gas thrust bearing. Mach. Build. Autom. 2019, 48, 5–25. [Google Scholar]
  11. Hu, L.; Zhang, G.; Liu, Z. Performance analysis of multi-leaf oil lubricated foil bearing. J. Eng. Tribol. 2013, 227, 962–979. [Google Scholar] [CrossRef]
  12. Paghdar, D.; Jogee, S.; Anupindi, K. Large-eddy simulation of counter-rotating Taylor-Couette flow: The effects of angular velocity and eccentricity. Int. J. Heat Fluid Flow 2019, 81, 108514. [Google Scholar] [CrossRef]
  13. Wei, T. Properties of the mean momentum balance in turbulent Taylor-Couette flow. J. Fluid Mech. 2020, 891, A10. [Google Scholar] [CrossRef]
  14. Sytin, A.; Rodichev, A.; Babin, A. Experimental study of foil gas-dynamic bearing elastic elements deformation. Procedia Eng. 2017, 206, 334–339. [Google Scholar] [CrossRef]
  15. Arakere, N.; Nelson, H. An analysis of gas-lubricated foil-journal bearings. Tribol. Trans. 1992, 35, 1–10. [Google Scholar] [CrossRef]
  16. Lee, D.; Kim, Y.; Kim, K. The effect of coulomb friction on the static performance of foil journal bearings. Tribol. Int. 2010, 43, 1065–1072. [Google Scholar] [CrossRef]
  17. Liu, J.; Du, F. Simulation of compliant bump foil journal bearing using coupled Reynolds equation and finite element model method. Adv. Mater. Res. 2012, 479, 2499–2503. [Google Scholar] [CrossRef]
  18. Barzem, L.; Bou-Said, B.; Rocchi, J. Aeroelastic bearing effects on rotor dynamics: A numerical analysis. Lubr. Sci. 2013, 25, 463–478. [Google Scholar] [CrossRef]
  19. Feng, K.; Liu, L.; Guo, Z.; Zhao, X. Parametric study on static and dynamic characteristics of bump-type gas foil Thrust bearing for oil-free turbomachinery. J. Eng. Tribol. 2016, 230, 944–961. [Google Scholar]
  20. Żywica, G.; Bagiński, P.; Andrearczyk, A. Experimental research on gas foil bearings with polymer coating at an elevated temperature. Tribologia 2016, 267, 217–227. [Google Scholar] [CrossRef]
  21. Zywica, G.; Baginski, P.; Bogulicz, M. Experimental and numerical evaluation of the damping properties of a foil bearing structure taking into account the static and kinetic dry friction. J. Braz. Soc. Mech. Sci. Eng. 2021, 43, 7. [Google Scholar] [CrossRef]
  22. Balducchi, F.; Arghir, M.; Gauthier, R. Experimental analysis of the dynamic characteristics of a foil thrust bearing. J. Tribol. 2015, 137, 021703. [Google Scholar]
  23. Pronobis, T.; Ramin, A.; Liebich, R. Numerical study on the influence of gas foil Thrust bearings on the vibrational behavior. In IFToMM 2018: Proceedings of the 10th International Conference on Rotor Dynamics, Rio de Janeiro, Brazil, 23–27 September 2018; Springer: Cham, Switzerland, 2018. [Google Scholar]
  24. Zhou, Y.; Shao, L.; Zhang, C. Numerical and experimental investigation on dynamic performance of bump foil journal bearing based on journal orbit. Chin. J. Aeronaut. 2021, 34, 586–600. [Google Scholar] [CrossRef]
  25. Kyuho, S.; Yong-Bok, A. Identification of the dynamic performance of a gas foil journal bearing operating at high temperatures. J. Mech. Sci. Technol. 2014, 28, 43–51. [Google Scholar]
  26. Khonsari, P. Hydrodynamic analysis of compliant foil bearings with compressible air flow. J. Tribol. 2004, 126, 542–546. [Google Scholar]
  27. Guo, Z.; Feng, K.; Liu, T. Nonlinear dynamic analysis of rigid rotor supported by gas foil bearings: Effects of gas film and foil structure on subsynchronous vibrations. Mech. Syst. Signal Process. 2018, 107, 549–566. [Google Scholar] [CrossRef]
  28. Hoffmann, R.; Liebich, R. Characterization and calculation of nonlinear vibrations in gas foil bearing systems-An experimental and numerical investigation. J. Sound Vib. 2018, 412, 389–409. [Google Scholar]
  29. Kan, Q.; Jacobs, P.; Keep, J.A. A fluid-structure-thermal model for bump-type foil thrust bearings. Tribol. Int. 2018, 121, 481–491. [Google Scholar]
  30. Fatu, A.; Arghir, M. Numerical analysis of the impact of manufacturing errors on the structural stiffness of foil bearings. J. Eng. Gas Turbines Power 2018, 140, 041506. [Google Scholar] [CrossRef]
  31. Hou, Y.; Ma, B.; Yang, S. Experimental study on bump-foil gas bearing with different diametric clearance configurations. J. Mech. Sci. Technol. 2015, 29, 2089–2095. [Google Scholar] [CrossRef]
  32. Hou, Y.; Zheng, Y.; Chen, S. The numerical study of static and dynamic characteristics of multi-layer protuberant foil bearing. J. Adv. Mech. Des. Syst. Manuf. 2015, 9, 58–64. [Google Scholar] [CrossRef] [Green Version]
  33. Christopher, M.; Valco, V. Load capacity estimation of foil air journal bearings for oil-free turbomachinery applications. Tribol. Trans. 2000, 43, 774–780. [Google Scholar]
  34. Bou-Saïd, B.; Lahmar, M.; Mouassa, A.; Bouchehit, B. Dynamic performances of foil bearing supporting a jeffcot flexible rotor system using FEM. Lubricants 2020, 8, 14. [Google Scholar] [CrossRef] [Green Version]
  35. Wang, C.; Chen, C. Bifurcation analysis of self-acting gas journal bearings. J. Tribol. 2001, 123, 755–767. [Google Scholar] [CrossRef]
  36. Kim, D.; Nicholson, B.; Rosado, L. Rotordynamics performance of hybrid foil bearing under forced vibration input. J. Eng. Gas Turbines Power 2018, 140, 012507. [Google Scholar] [CrossRef]
  37. Lehn, A.; Mahner, M.; Schweizer, B. Characterization of static air foil thrust bearing performance: An elasto-gasdynamic analysis for aligned, distorted and misaligned operating conditions. Arch. Appl. Mech. 2018, 88, 705–728. [Google Scholar] [CrossRef]
  38. Nicoud, F.; Toda, H.; Cabrit, O. Using singular values to build a subgrid-scale model for large eddy simulations. Phys. Fluids 2011, 23, 085106. [Google Scholar] [CrossRef] [Green Version]
  39. Foss, J.; Zaman, K. Large-and small-scale vortical motions in a shear layer perturbed by tabs. J. Fluid Mech. 1999, 382, 307–329. [Google Scholar] [CrossRef]
  40. Stickan, B.; Dillinger, J.; Schewe, G. Computational aeroelastic investigation of a transonic limit-cycle-oscillation experiment at a transport aircraft wing model. J. Fluids Struct. 2014, 49, 223–241. [Google Scholar] [CrossRef]
  41. Jaiman, R.; Geubelle, P.; Loth, E. Transient fluid–structure interaction with non-matching spatial and temporal discretizations. Comput. Fluids 2011, 50, 120–135. [Google Scholar] [CrossRef]
  42. Ruscitto, D.; Mc Cormick, J.; Gray, S. Hydrodynamic Air Lubricated Compliant Surface Bearing for an Automotive Gas Turbine Engine Journal Bearing Performance: NASA-CR-135368; NASA Technical Report; Mechanical Technology Incorporated: Latham, NY, USA, 1978. [Google Scholar]
  43. Kim, A. Analysis of Gas Foil Bearings Integrating FE Top Foil Models. Tribol. Int. 2008, 42, 111–120. [Google Scholar]
  44. Breńkacz, L.; Bagiński, P.; Żywica, G. Experimental research on foil vibrations in a gas foil bearing carried out using an ultra-high-speed camera. Appl. Sci. 2021, 11, 878. [Google Scholar] [CrossRef]
Figure 1. Scheme of the multi-leaf compliant foil bearing. (a) Foil journal bearing. (b) Schematic diagram of foil journal bearing.
Aerospace 10 00616 g001
Figure 2. Mesh resolution. (a) fluid domain: (a-1) global view; (a-2) local view near the gas flim. (b) solid domain: (b-1) global view; (b-2) local view near the gas flim.
Aerospace 10 00616 g002
Figure 3. Boundary conditions. Interaction.
Aerospace 10 00616 g003
Figure 4. Fluid–structure interaction. (a) Iteration procedure. (b) Data Exchange.
Aerospace 10 00616 g004
Figure 5. Validation of numerical method by pressure and the minimum film thickness at Z/L = 0.5. (a) pp0 vs. θ; (b) h2 vs. F.
Aerospace 10 00616 g005aAerospace 10 00616 g005b
Figure 6. Variation of the pressure with real time at different locations. (a) θ = 0 and Z/L = 0.5. (b) pressure after stable operation.
Aerospace 10 00616 g006
Figure 7. Variation of the axial velocity with real time at different locations. (a) θ = 0 and Z/L = 0.5. (b) axial velocity after stable operation.
Aerospace 10 00616 g007
Figure 8. Variation of pressure and axial velocity in the frequency domain. (a) pressure. (b) axial velocity.
Aerospace 10 00616 g008aAerospace 10 00616 g008b
Figure 9. Variation of tangential velocity along the dimensionless radius at θ = 0.
Aerospace 10 00616 g009
Figure 10. Distribution of instantaneous pulsating pressure attached to the top foil. (a) t = T/4. (b) t = T/2. (c) t = 3T/4. (d) t = T.
Aerospace 10 00616 g010
Figure 11. Time-averaged contours. (a) pressure attached the top foil. (b) axial velocity. (c) radialradial velocity. (d) velocity vector.
Aerospace 10 00616 g011aAerospace 10 00616 g011b
Figure 12. Variation of the radial displacement in real time at different locations. (a) θ = 0 and Z/L = 0.5. (b) radial displacement after stable operation.
Aerospace 10 00616 g012
Figure 13. Variation of the radial displacement in the frequency domain.
Aerospace 10 00616 g013
Figure 14. Instantaneous contours of stress and radial displacement of the top foil. (a-1) t = 0. (a-2) t = 0. (b-1) t = 0.25T. (b-2) t = 0.25T. (c-1) t = 0.5T. (c-2) t = 0.5T. (d-1) t = 0.75T. (d-2) t = 0.75T.
Aerospace 10 00616 g014aAerospace 10 00616 g014b
Figure 15. Instantaneous contours of stress and radial displacement of the bump foil. (a-1) t = 0. (a-2) t = 0. (b-1) t = 0.25T. (b-2) t = 0.25T. (c-1) t = 0.5T. (c-2) t = 0.5T. (d-1) t = 0.75T. (d-2) t = 0.75T.
Aerospace 10 00616 g015aAerospace 10 00616 g015b
Figure 16. Time-averaged contours of stress and radial displacement for top foil and bump foil. (a) stress: (a-1) top foil. (a-2) bump foil. (b) displacement: (b-1) top foil. (b-2) bump foil.
Aerospace 10 00616 g016
Figure 17. Distribution of mean pressure contours with and without FSI. (a) without FSI. (b) with FSI.
Aerospace 10 00616 g017
Figure 18. Variation of pressure and film thickness along angled direction at Z/L = 2. (a) pp0 vs. θ. (b) hmin vs. θ.
Aerospace 10 00616 g018
Figure 19. Variation of pressure in the frequency domain with rotational speed (without FSI). (a) θ = 0. (b) θ = π.
Aerospace 10 00616 g019
Figure 20. Variation of mean pressure contours with rotational speed (with FSI). (a) θ = 0. (b) θ = π.
Aerospace 10 00616 g020
Figure 21. Variation of the total displacement in the frequency domain with rotational speed.
Aerospace 10 00616 g021
Table 1. Parameters employed in this study.
ParametersUnitScale
Radius of rotatorR/mm19.05
Radius of statorR′/mm19.25
Length of bearingL/mm38.1
Thickness of top foiltt/μm100
Thickness of bump foiltb/μm100
Length of bump elementS/mm4.064
Span of bump element2l/mm3.434
Poisson’s ratioυ0.29
Young’s modulusE0/GPa207
Pressure of environmentP0/Pa1.013 × 105
Dynamic viscosityμ/Pa·s1.84 × 10−5
Disclaimer/Publisher’s Note: The statements, opinions and data contained in all publications are solely those of the individual author(s) and contributor(s) and not of MDPI and/or the editor(s). MDPI and/or the editor(s) disclaim responsibility for any injury to people or property resulting from any ideas, methods, instructions or products referred to in the content.

