1. Introduction
Shock wave boundary layer interactions (SBLIs) are flow phenomena that occur when shock waves interact with the turbulent boundary layer on a wall, causing changes in the flow field and wave system. On transonic wings, SBLI can lead to increased drag and instability. Several airplane accidents have been attributed to shock wave boundary layer interactions (SBLIs), including the following: Japan Airlines Flight 123 crashed into a mountain in Japan on 12 August 1985, which resulted in the death of 520 out of the 524 passengers and crew members on board. The reason behind the crash was the rupture of the rear pressure bulkhead caused by an SBLI-induced vertical stabilizer flutter. Similarly, USAir Flight 427 crashed near Pittsburgh, Pennsylvania on 8 September 1994, killing all 132 people on board. The investigation revealed that the accident was caused by an SBLI-induced rudder deflection that led the plane to roll and enter an uncontrolled descent. Likewise, Air France Flight 447 crashed into the Atlantic Ocean on 1 June 2009, killing all 228 people on board. The accident was attributed to a combination of factors, including SBLI-induced stall and pilot error.
In order to prevent flow separation and instability, a flow control device is used to control the flow field characteristics before or during the interaction, so as to reduce the harm of SBLI and improve the performance of aircrafts. In recent years, the control effects of both active and passive control devices on transonic wings have been studied. Examples of these flow control systems include vortex generators [
1], wall cavity [
2] and jets [
3]. The vortex generator exchanges momentum perpendicular to the wall by generating the streamwise vortex, injecting more energy into the low-momentum region. This results in an increase in wall shear stress and a fuller velocity profile that is less prone to separation [
4]. In the beginning of the 1960s, Wallis et al. [
5,
6] proposed the control function of air jet vortex generators (AJVGs). It was found that the AJVGs can produce the same control effect as the classical vane vortex generator (VVGs). The AJVG creates a streamwise vortex through the interaction between the free stream flow and air jet, avoiding parasitic drag. The flow control system consists of an array of jet holes perpendicular to the flow direction. The vortex flow is generated by mixing the jets from each orifice with the free air flow [
7]. Interest in the AJVG control system increased in the early 1990s [
8,
9,
10,
11], with a focus on controlling turbulent boundary layers using synthetic jets, blowing, jet vortex generators, and various types of fixed vortex generators [
12]. Both fixed (solid) and jet vortex generators have been studied for basic flow cases and complex configurations and applications [
13,
14,
15,
16]. The height (h) of the VVGs is typically larger than the boundary thickness (δ), resulting in parasite drag, which is effectively avoided by the AJVGs. However, designing an effective AJVG for the specific condition remains challenging due to the numerous interrelated parameters that must be taken into account.
The transonic wing SBLI was simulated at angle of attack and Mach number for the classical NACA0012 wing using the open-source OpenFOAM. This study selected the classical NACA0012 wing due to the experimental results achieved by NASA. This condition is the common transonic wing flight condition. To explore the effect of the jet vortex generator, different parameters need to be studied. However, experimental research requires a set of experimental models for the selection of one parameter, which will lead to an increase in experimental cost and lower efficiency. This paper explores the control effect of the jet vortex generator on SBLI through the simulation of the jet vortex generator with different jet angles, providing some ideas for the design of the control device of the transonic wing.
2. Model and Grid in Numerical Simulation
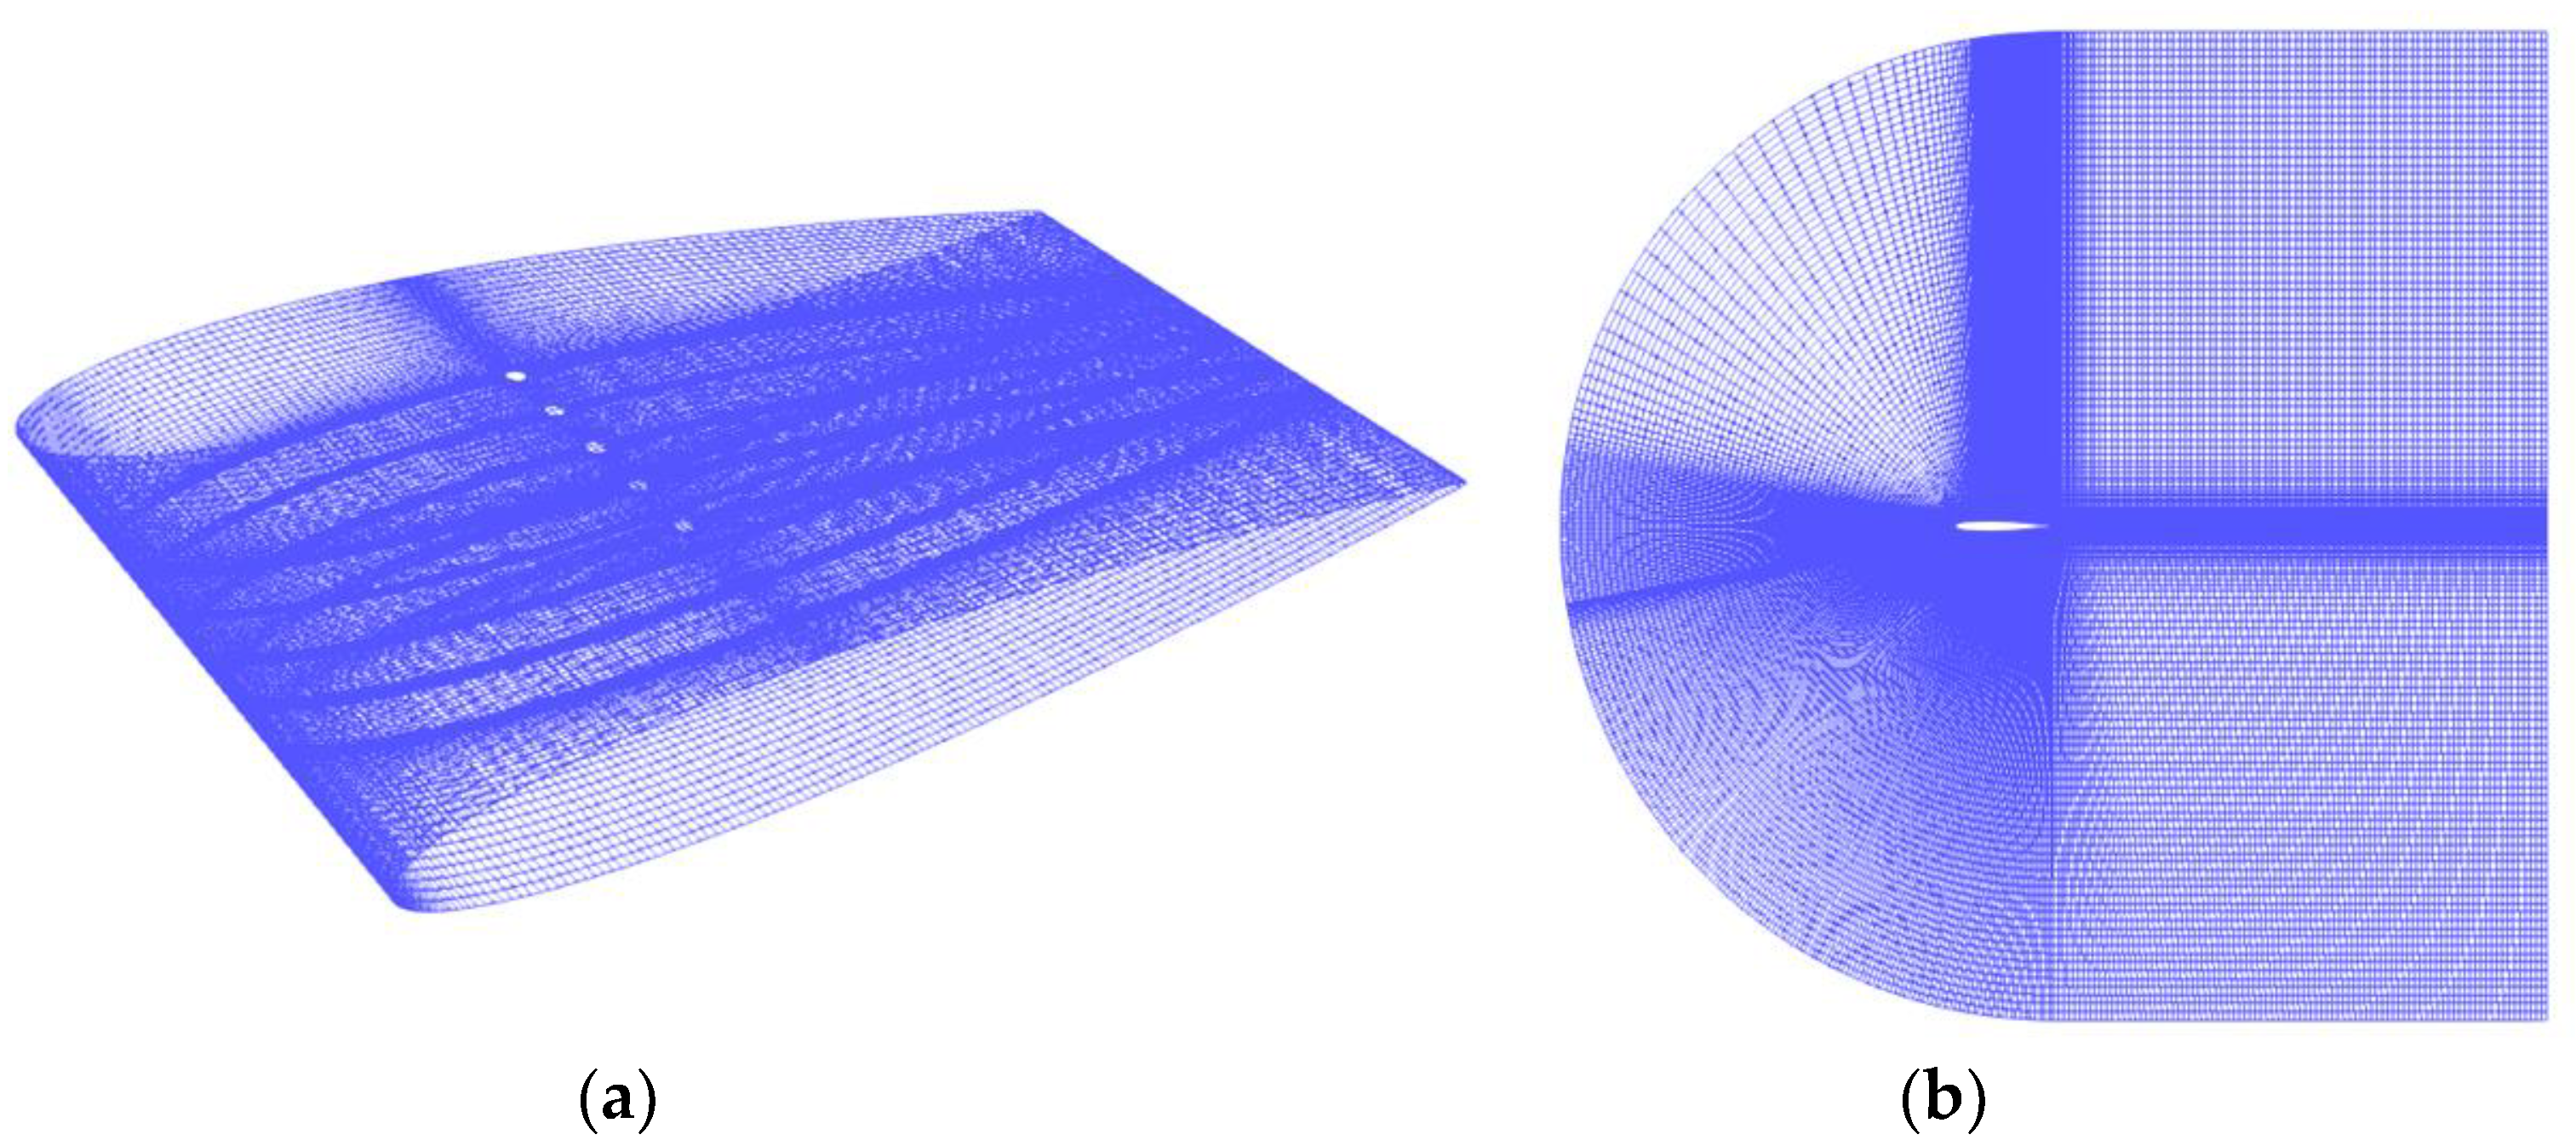
Figure 1a displays the NACA0012 airfoil used in the physical model, while
Figure 1b illustrates the outer flow field area. The wing chord length
c is 100 mm, and the outer flow field area is set to 10 times the wing length, with a distance of 1000 mm, to ensure that the boundary conditions of the external flow field do not affect the wing flow field. The span is 50 mm, and a quasi-three-dimensional model is employed to observe the three-dimensional effect of the jet vortex generator. The front of the outer flow field has a fan-shaped region, including the wing portion, which is divided into O-shaped grids to enable the dense arrangement of boundary layer grids on the wing surface. Grid layer
y, which is closest to the wing, is set to ensure
, while the jet array section divides the vicinity of the jet hole through the O grid and encrypts the area around the jet hole to capture the jet’s detailed structure. The total number of meshes in the grids is approximately 8 million.
According to the previous study [
17] on the experimental study of different parameters of the jet vortex generator, the jet vortex generator has the best effect when it is placed at 0.3
c of the wing where
c is the wing chord length, and the diameter of the jet hole is 1.5%
c–1.5mm. The jet parameters are listed in
Table 1.
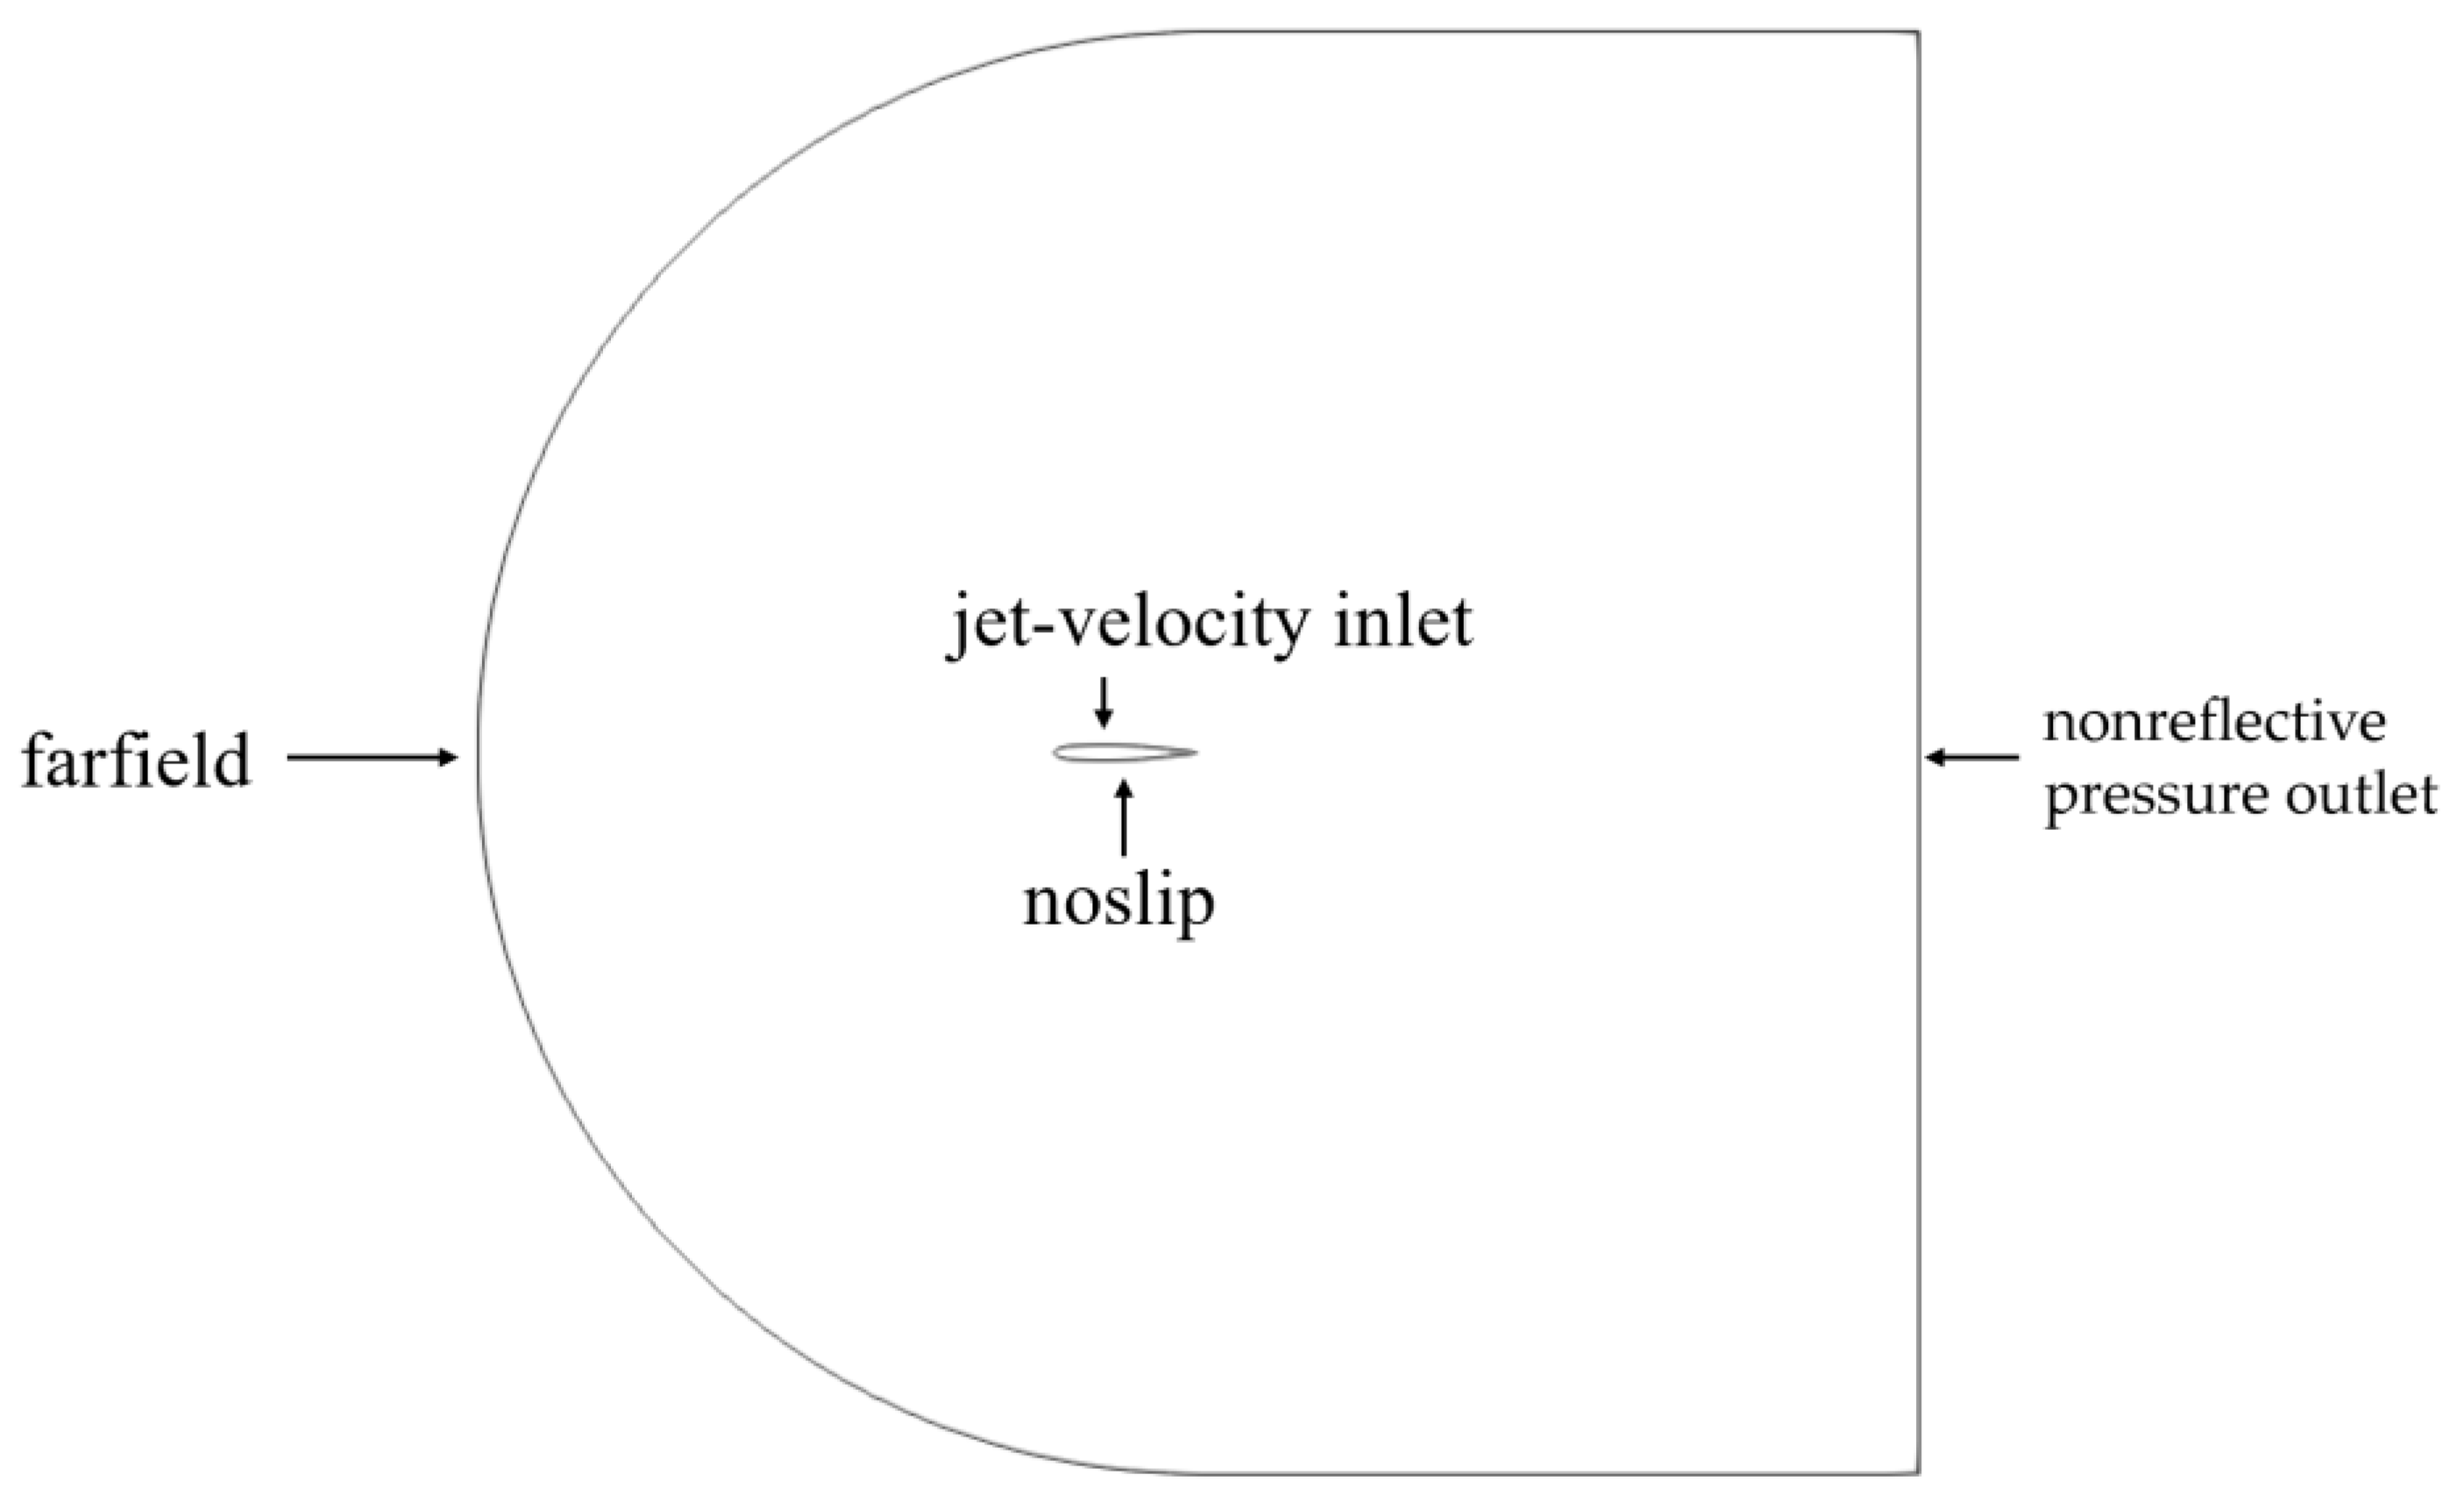
Figure 2 shows the boundary condition of the simulation. The outlet boundary adopts a nonreflective boundary pressure outlet condition for the domain’s boundary conditions to ensure that it does not affect the flow. The far-field boundary condition is used for the outer-flow-field boundary conditions, and the parameters match the flow parameters to ensure consistency with the reference experimental conditions. The wing boundaries adopt a nonslip condition, and periodic boundary conditions are used for the front and rear boundaries to prevent any effect on the flow. A velocity boundary inlet is used for the jet inlet because the jet’s direction needs to be changed. The relevant jet velocity is obtained by an equivalent calculation of jet pressure to realize the jet flow.
OpenFOAM was used for simulation, and the unsteady solver rhoPimpleFOAM based on compressible flow was used for the solver. Euler was used for time discretization, and Gauss linear was used for gradient discretization. The dispersion scheme of the turbulence term is Gauss upwind, and the bonded Gauss linear upwind limit is used for the energy term. The turbulence model adopts
SST [
18].
Referring to Harris’s experiment [
19] to set the physical parameters of the forward incoming flow at the entrance, the Mach number is
, the far-field pressure is
, the far-field static temperature is
, and the angle of attack is
. The value of
k is set as 0.01, and the value of
is set as 10 for the farfield conditions; the
k and
for jet inlet are set as zeroGradient, which is the Neumann boundary condition in OpenFOAM.
The temporal used for simulation is the adjusted time-step in OpenFOAM, the time interval for each step is calculated using a maximum courant number, which is set to 0.3. The condition of convergence is set as a lift coefficient change in the wing of less than 0.00001.
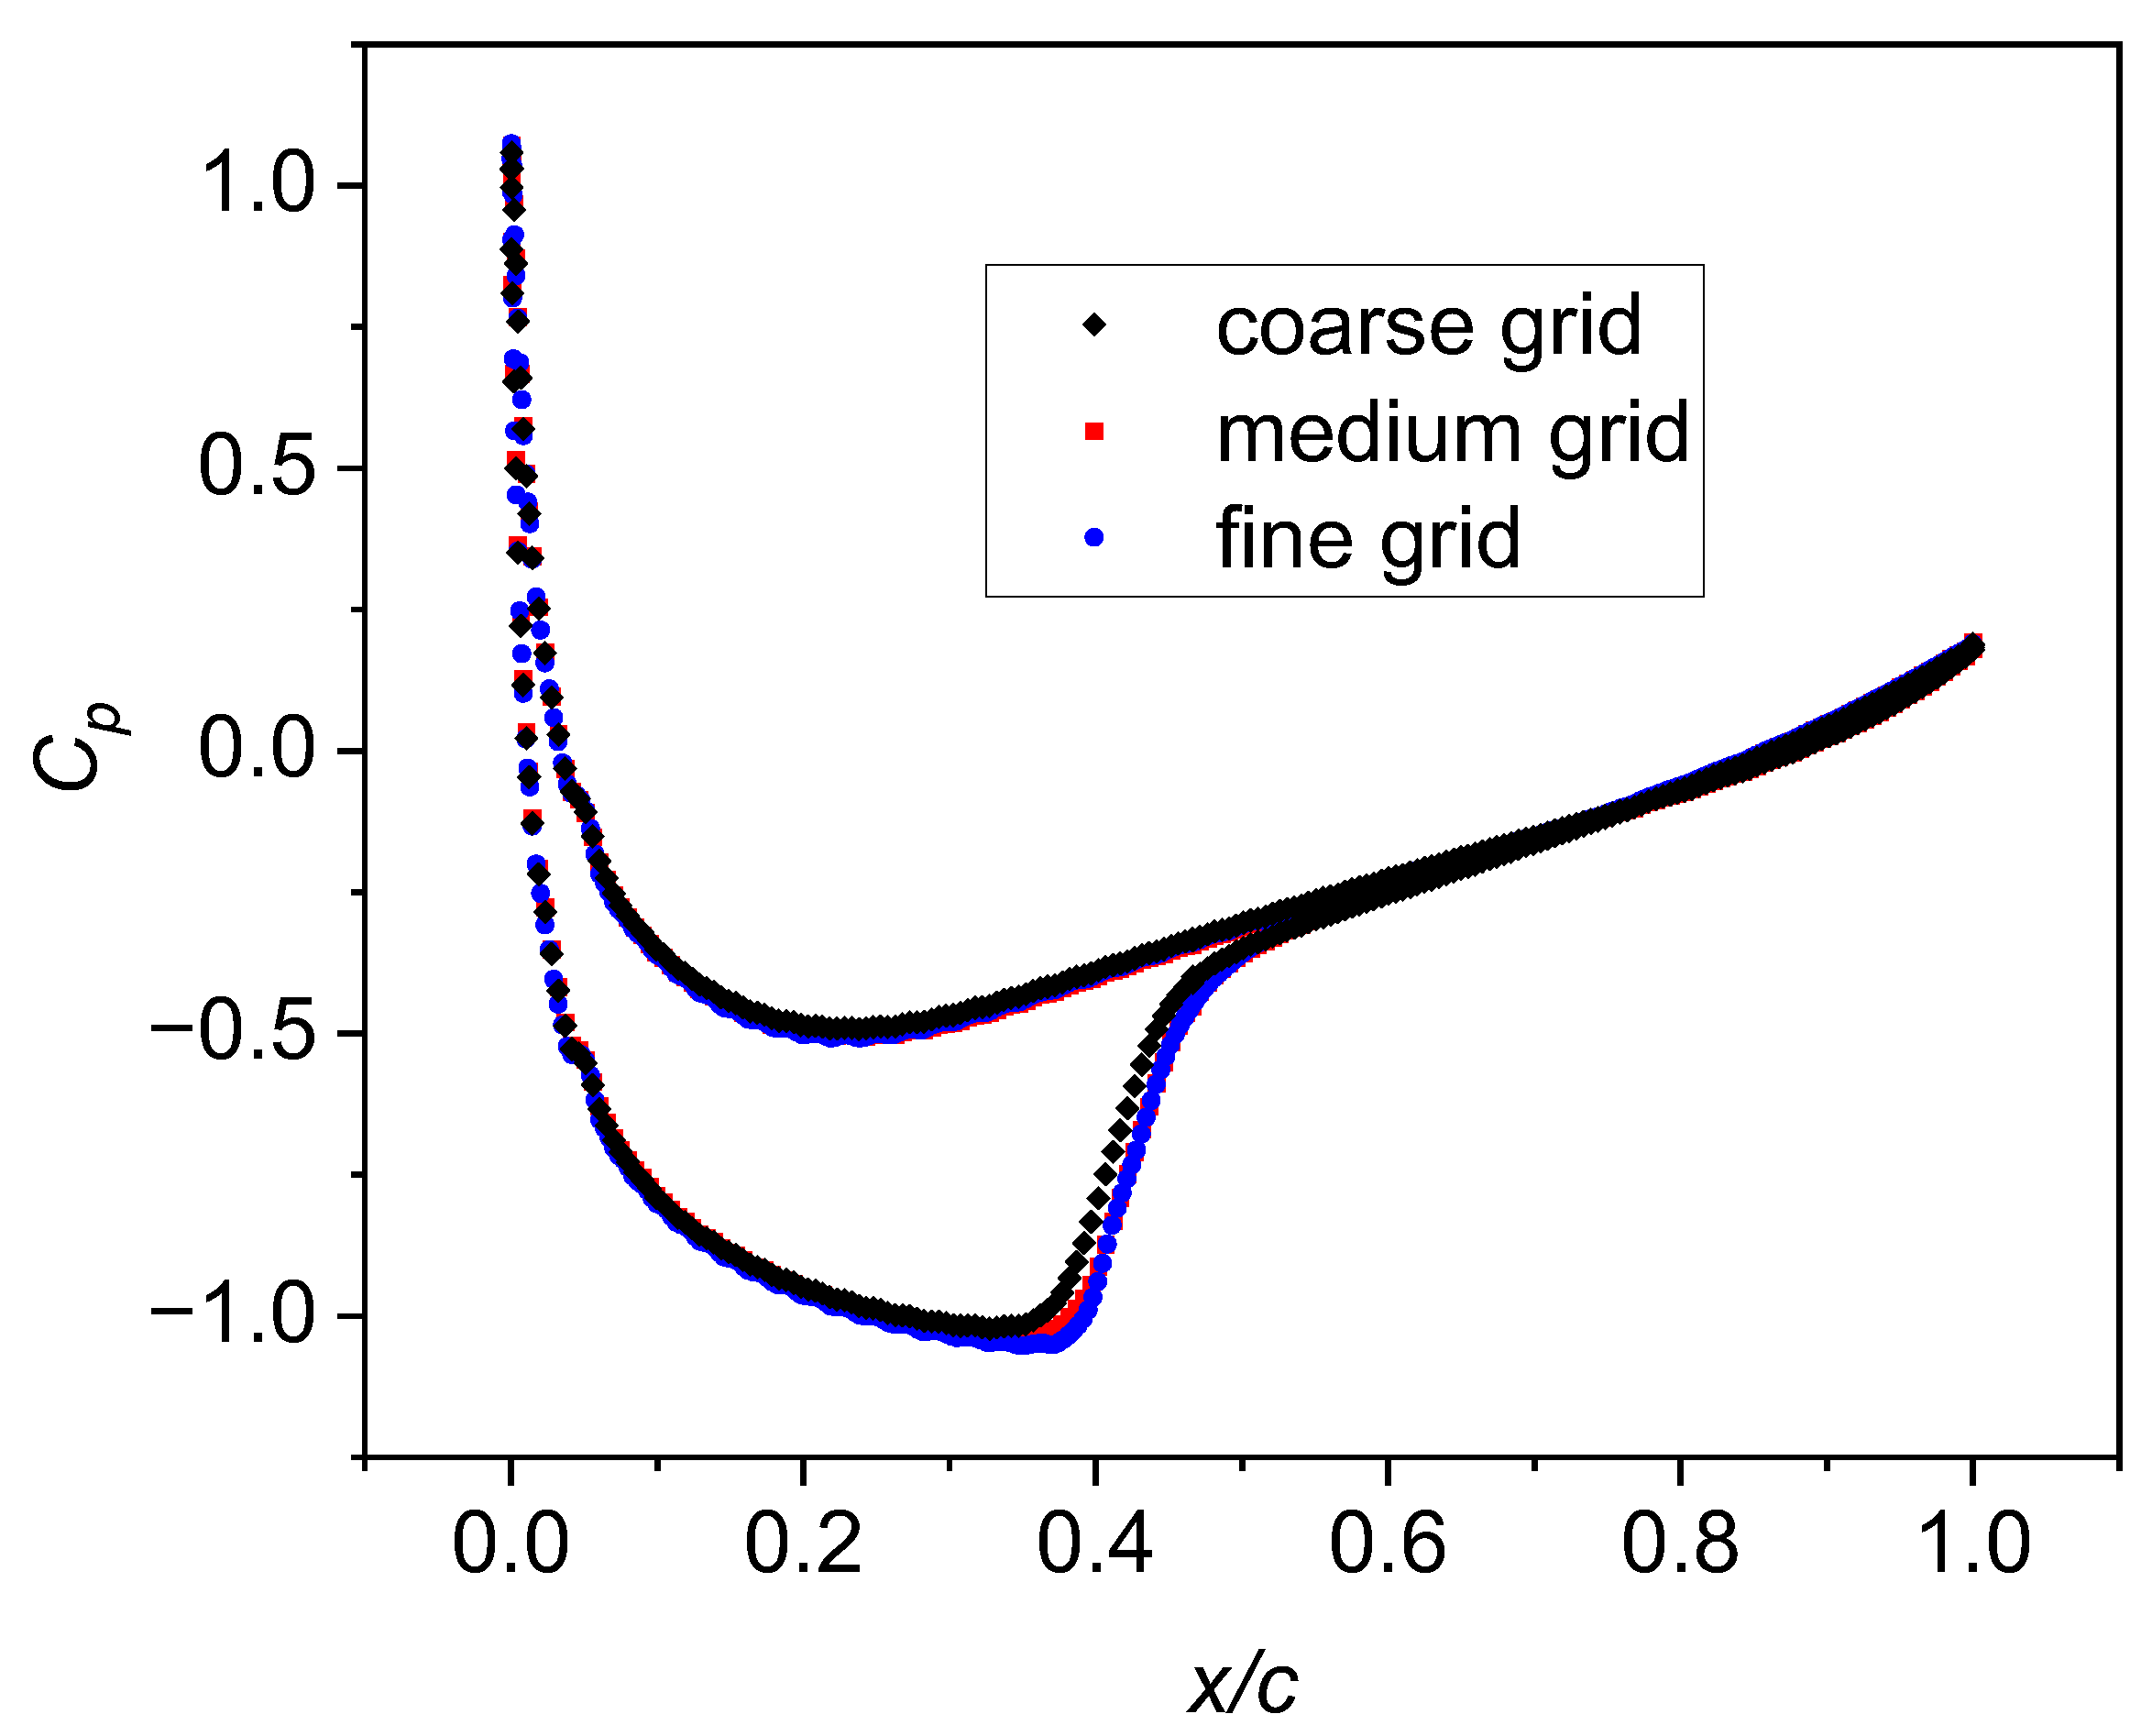
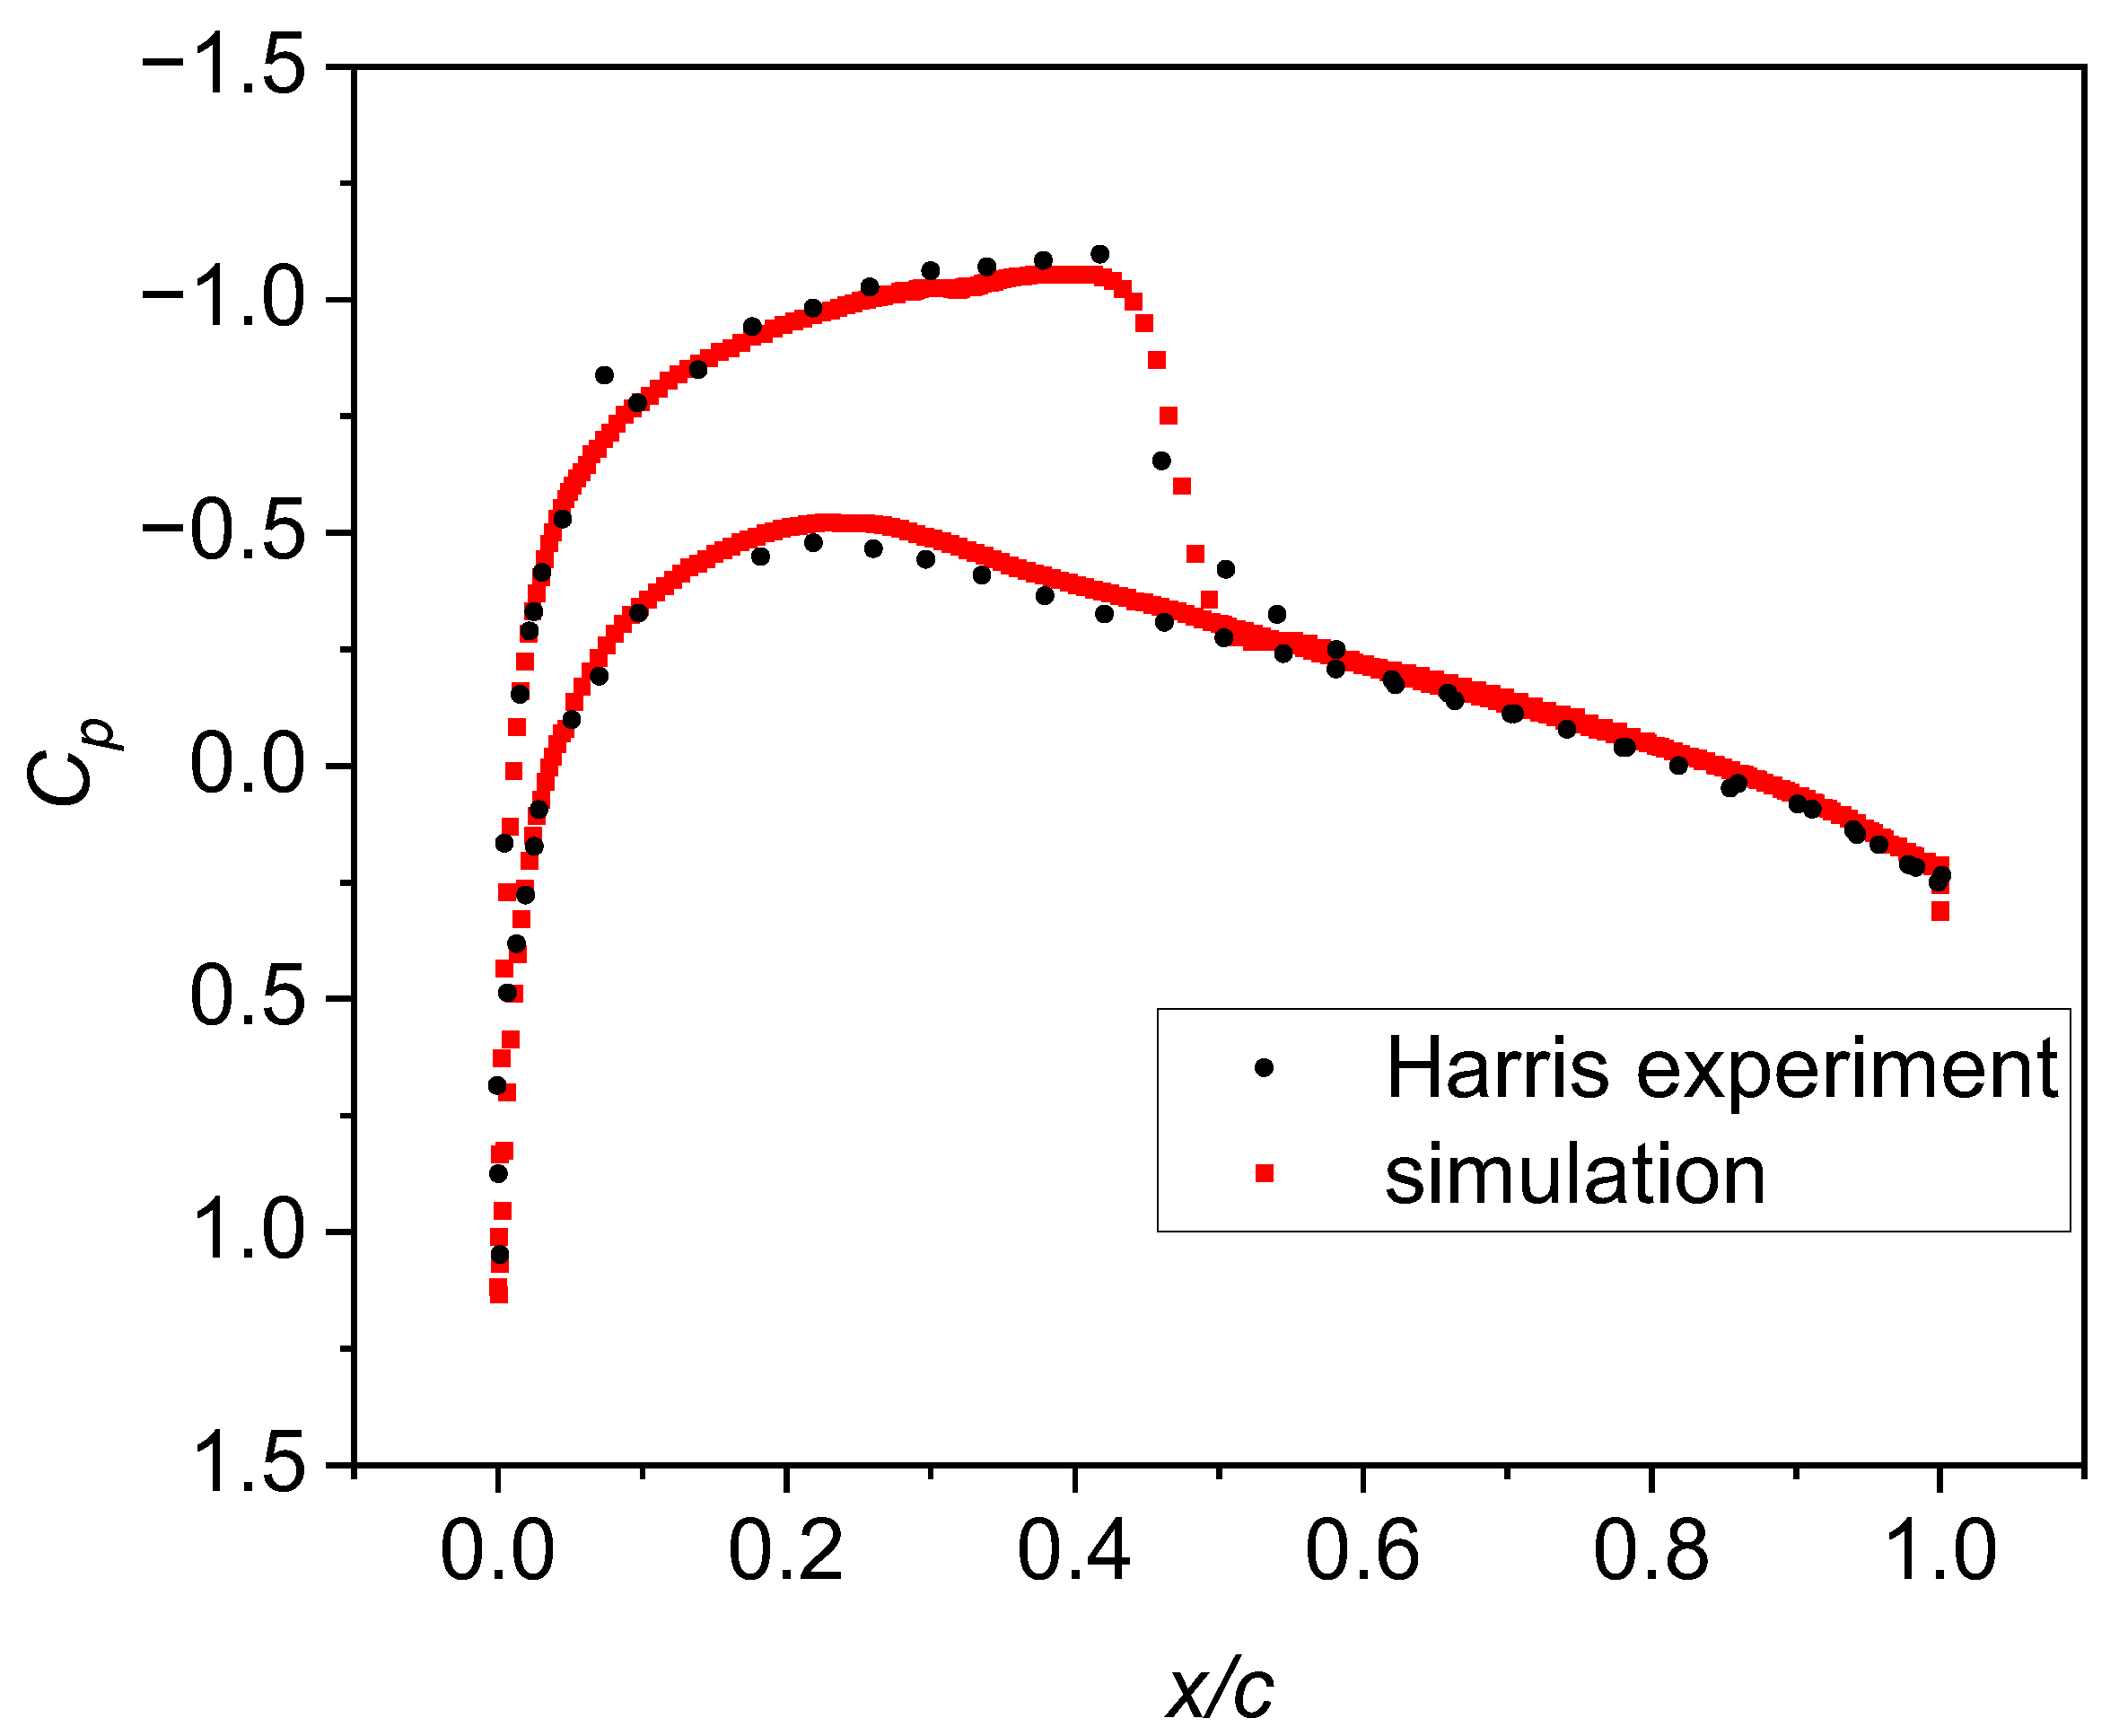
Figure 3 depicts the grid-independent verification of the transonic wing, which uses the pressure coefficient of the wing surface as the criterion. The mesh settings in the middle are illustrated in
Figure 1, with a total of approximately 8 million meshes. The number of nodes in the coarse grid and fine grid is scaled up by 1.2 times. The coarse grid consists of approximately 5 million meshes, while the fine grid comprises approximately 14 million meshes.
Figure 3 displays the pressure distributions on the three mesh surfaces. The shock pressure distributions in the coarse mesh are nearer to the leading edge of the wing, whereas the pressure distributions in the medium and fine meshes are consistent, verifying the grid’s independence.
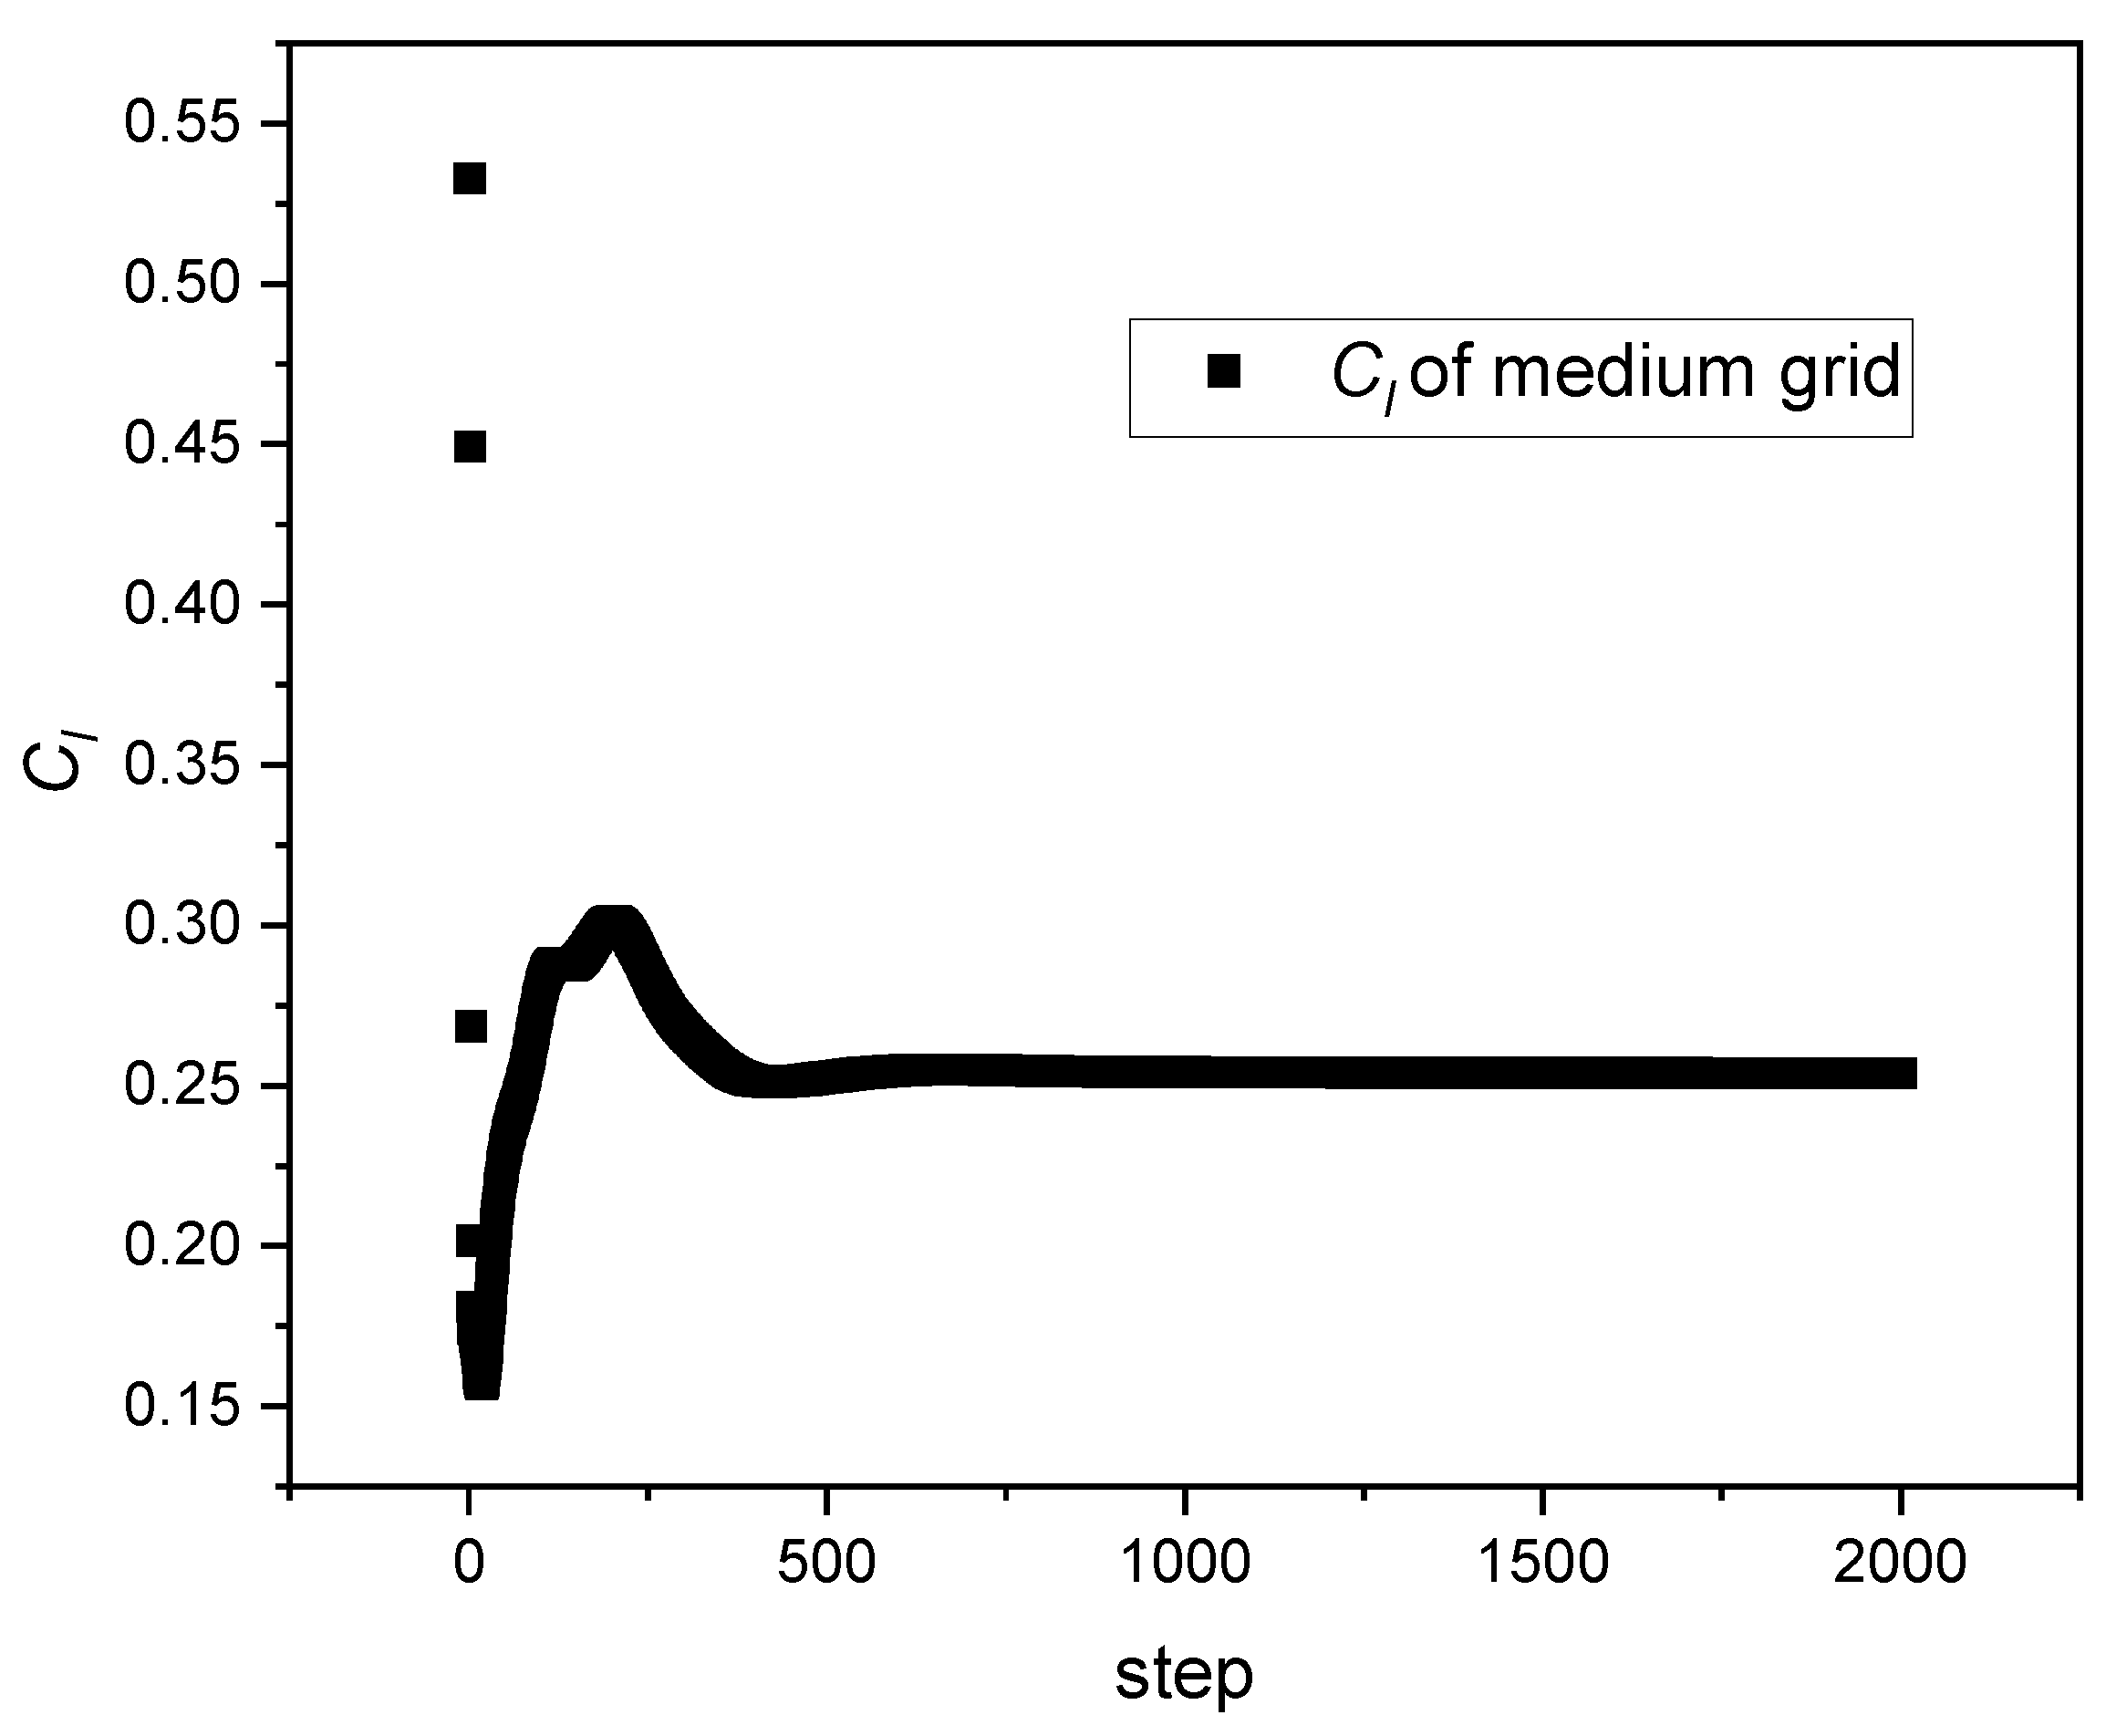
Figure 4 shows convergence graph of
. When the number of steps is 1967, the change in the value of
is less than 0.0001, which means that
converges.
3. Results and Discussion
Figure 5 shows the simulation result of the pressure distribution on the wing surface. Compared with Harris’s experimental data [
19], the pressure distribution on the upper and lower surfaces is basically the same, with a maximum error of less than 2%. It can also be seen from the pressure distribution that the boundary layer interference structure of shock waves is clear, as well as the wave separation after the presence of shock waves.
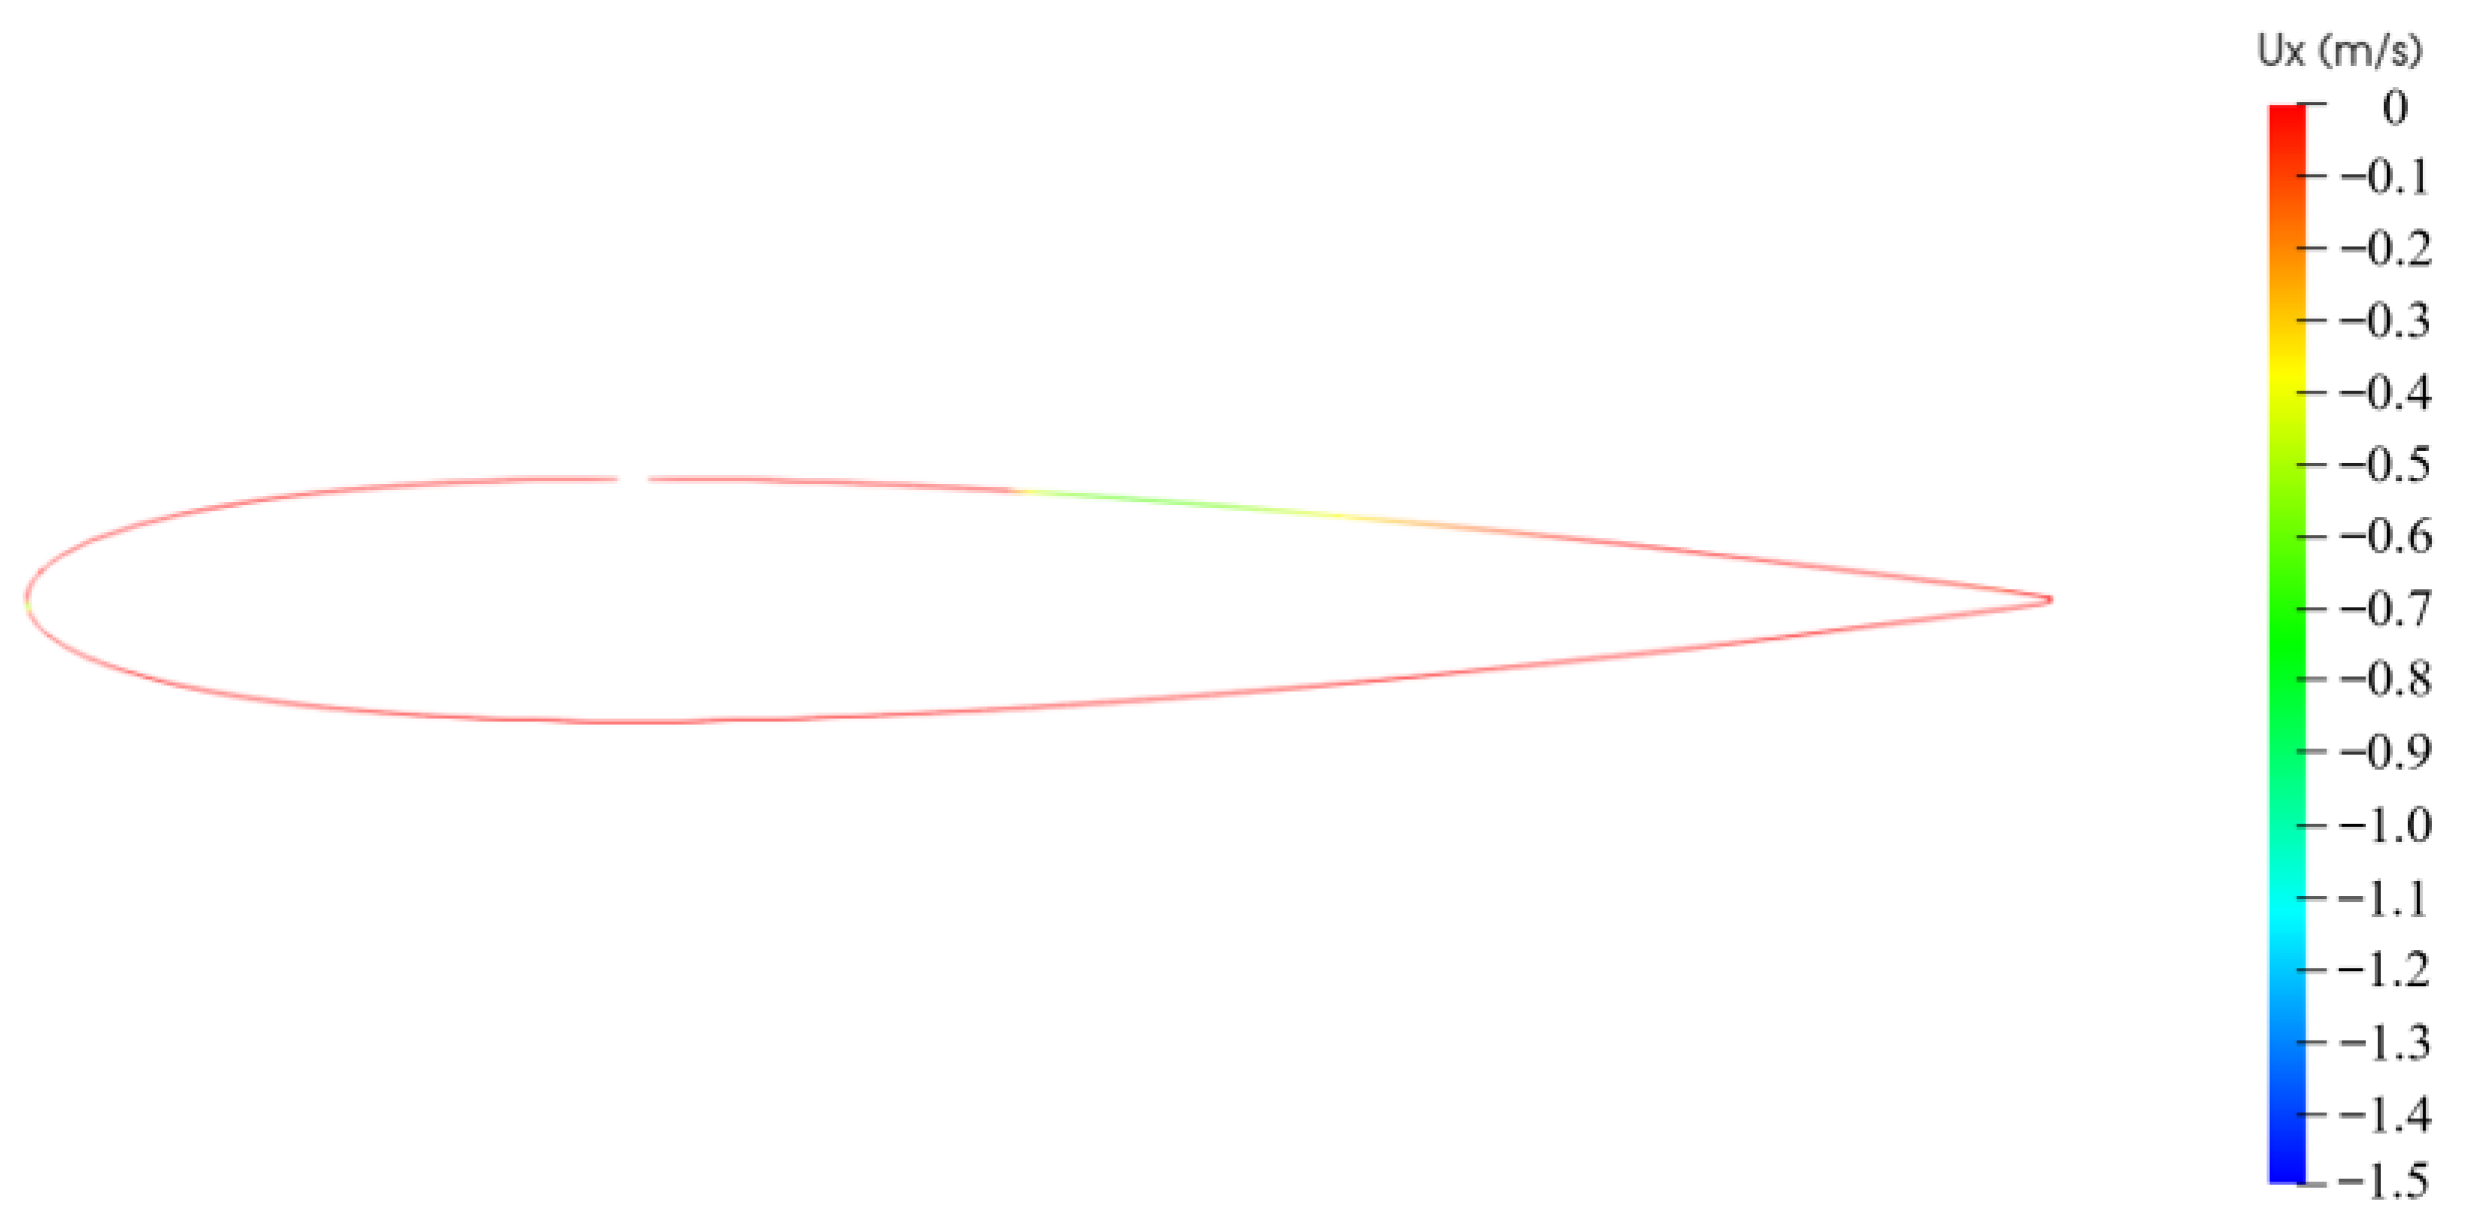
Figure 6 shows the flow velocity diagram of the wing center section, showing a velocity of less than 0, and the velocity greater than 0 is shown in red. From
Figure 6, it can be observed that there is a clear backflow area (negative velocity) on the wing surface, which is caused by the flow separation caused by SBLI and is a hazard caused by SBLI.
To reduce the harm caused by shock boundary layer interference, we try to use a jet vortex generator to reduce separation.
Table 2 shows the change in the lift coefficient under the action of efflux. The lift coefficient
under the condition with efflux is greater than that without efflux, and efflux has an increasing effect on the lift coefficient. With increasing angle, the increase in the lift coefficient is also greater. In this paper, the best control effect of the jet array on the transonic wing SBLI occurs when the jet angle is 60°;
increases the most, from 0.24645 without the jet flow case to 0.25225, with an increase of 2.35%.
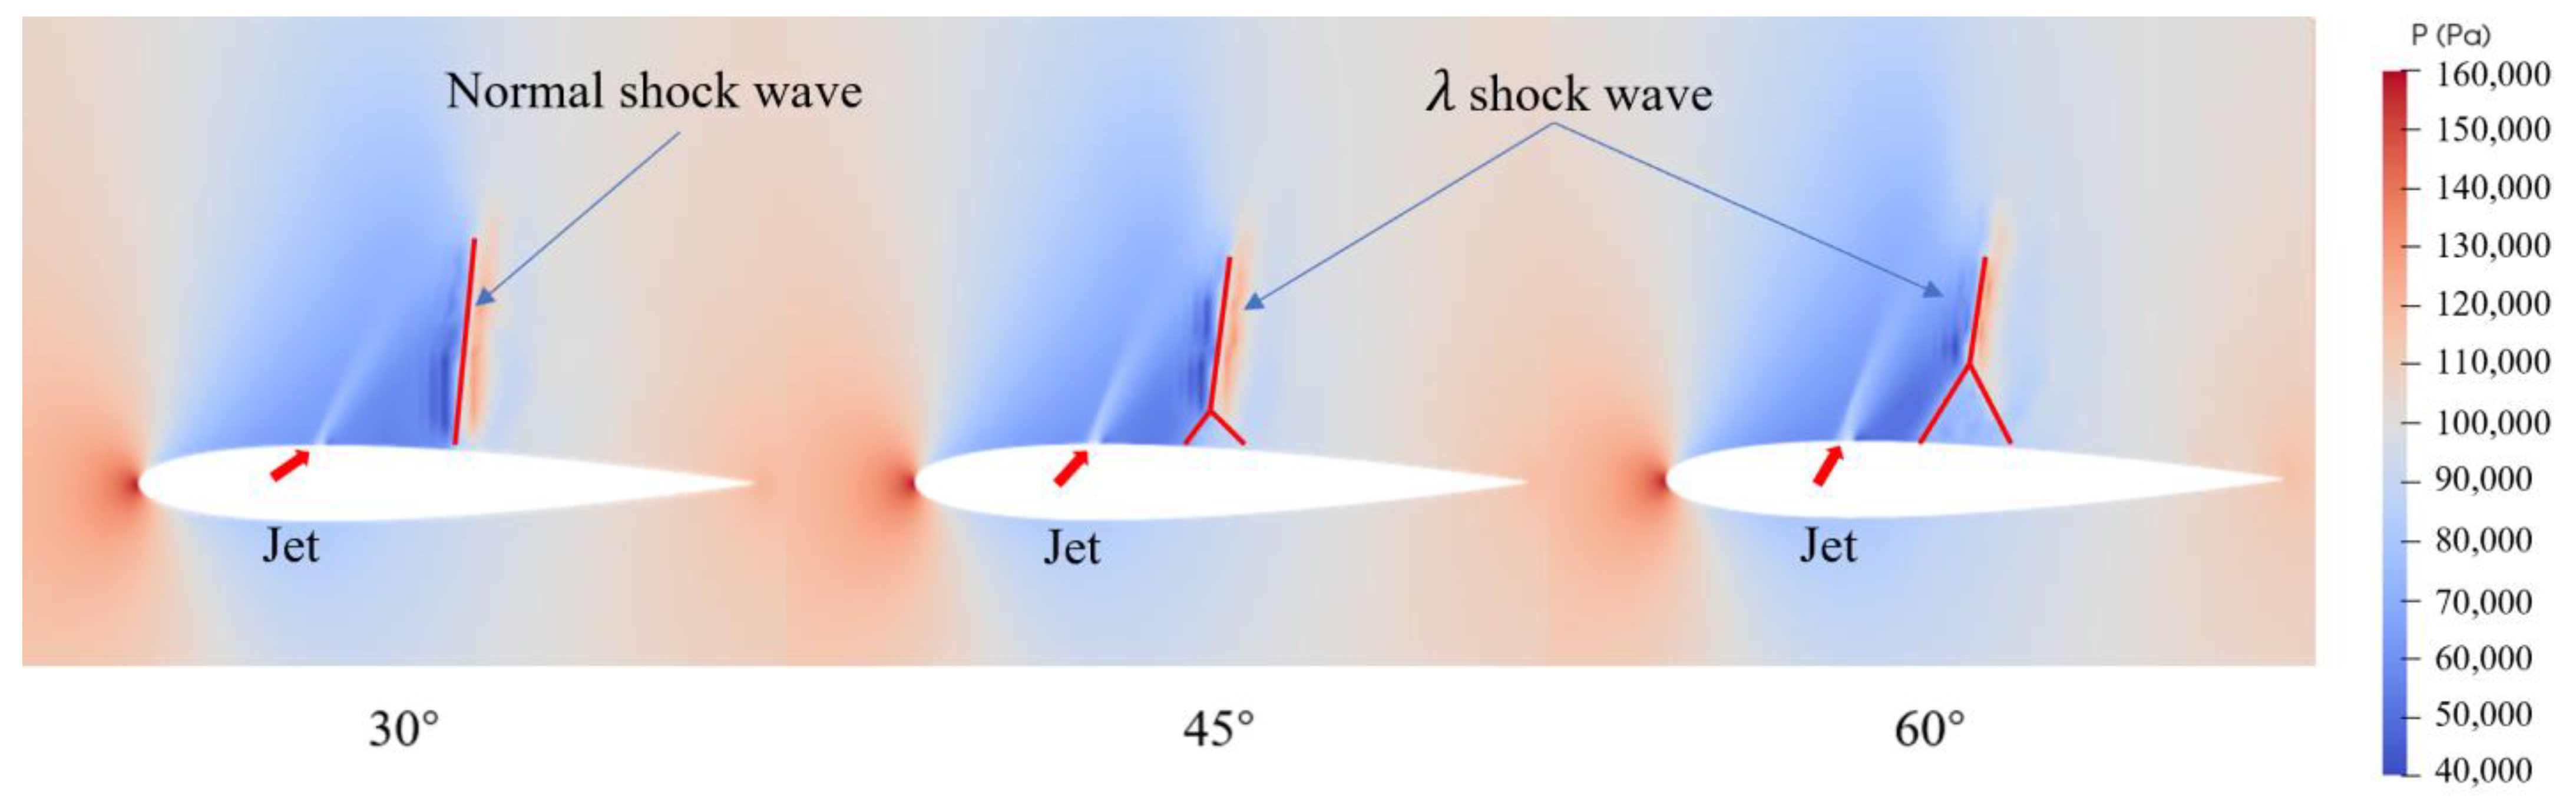
The boundary layer interference of transonic shock waves is analyzed at different pitch angles of 30°, 45° and 60°.
Figure 7 shows the pressure cloud image near the wing at 30°, 45°, and 60° jets.
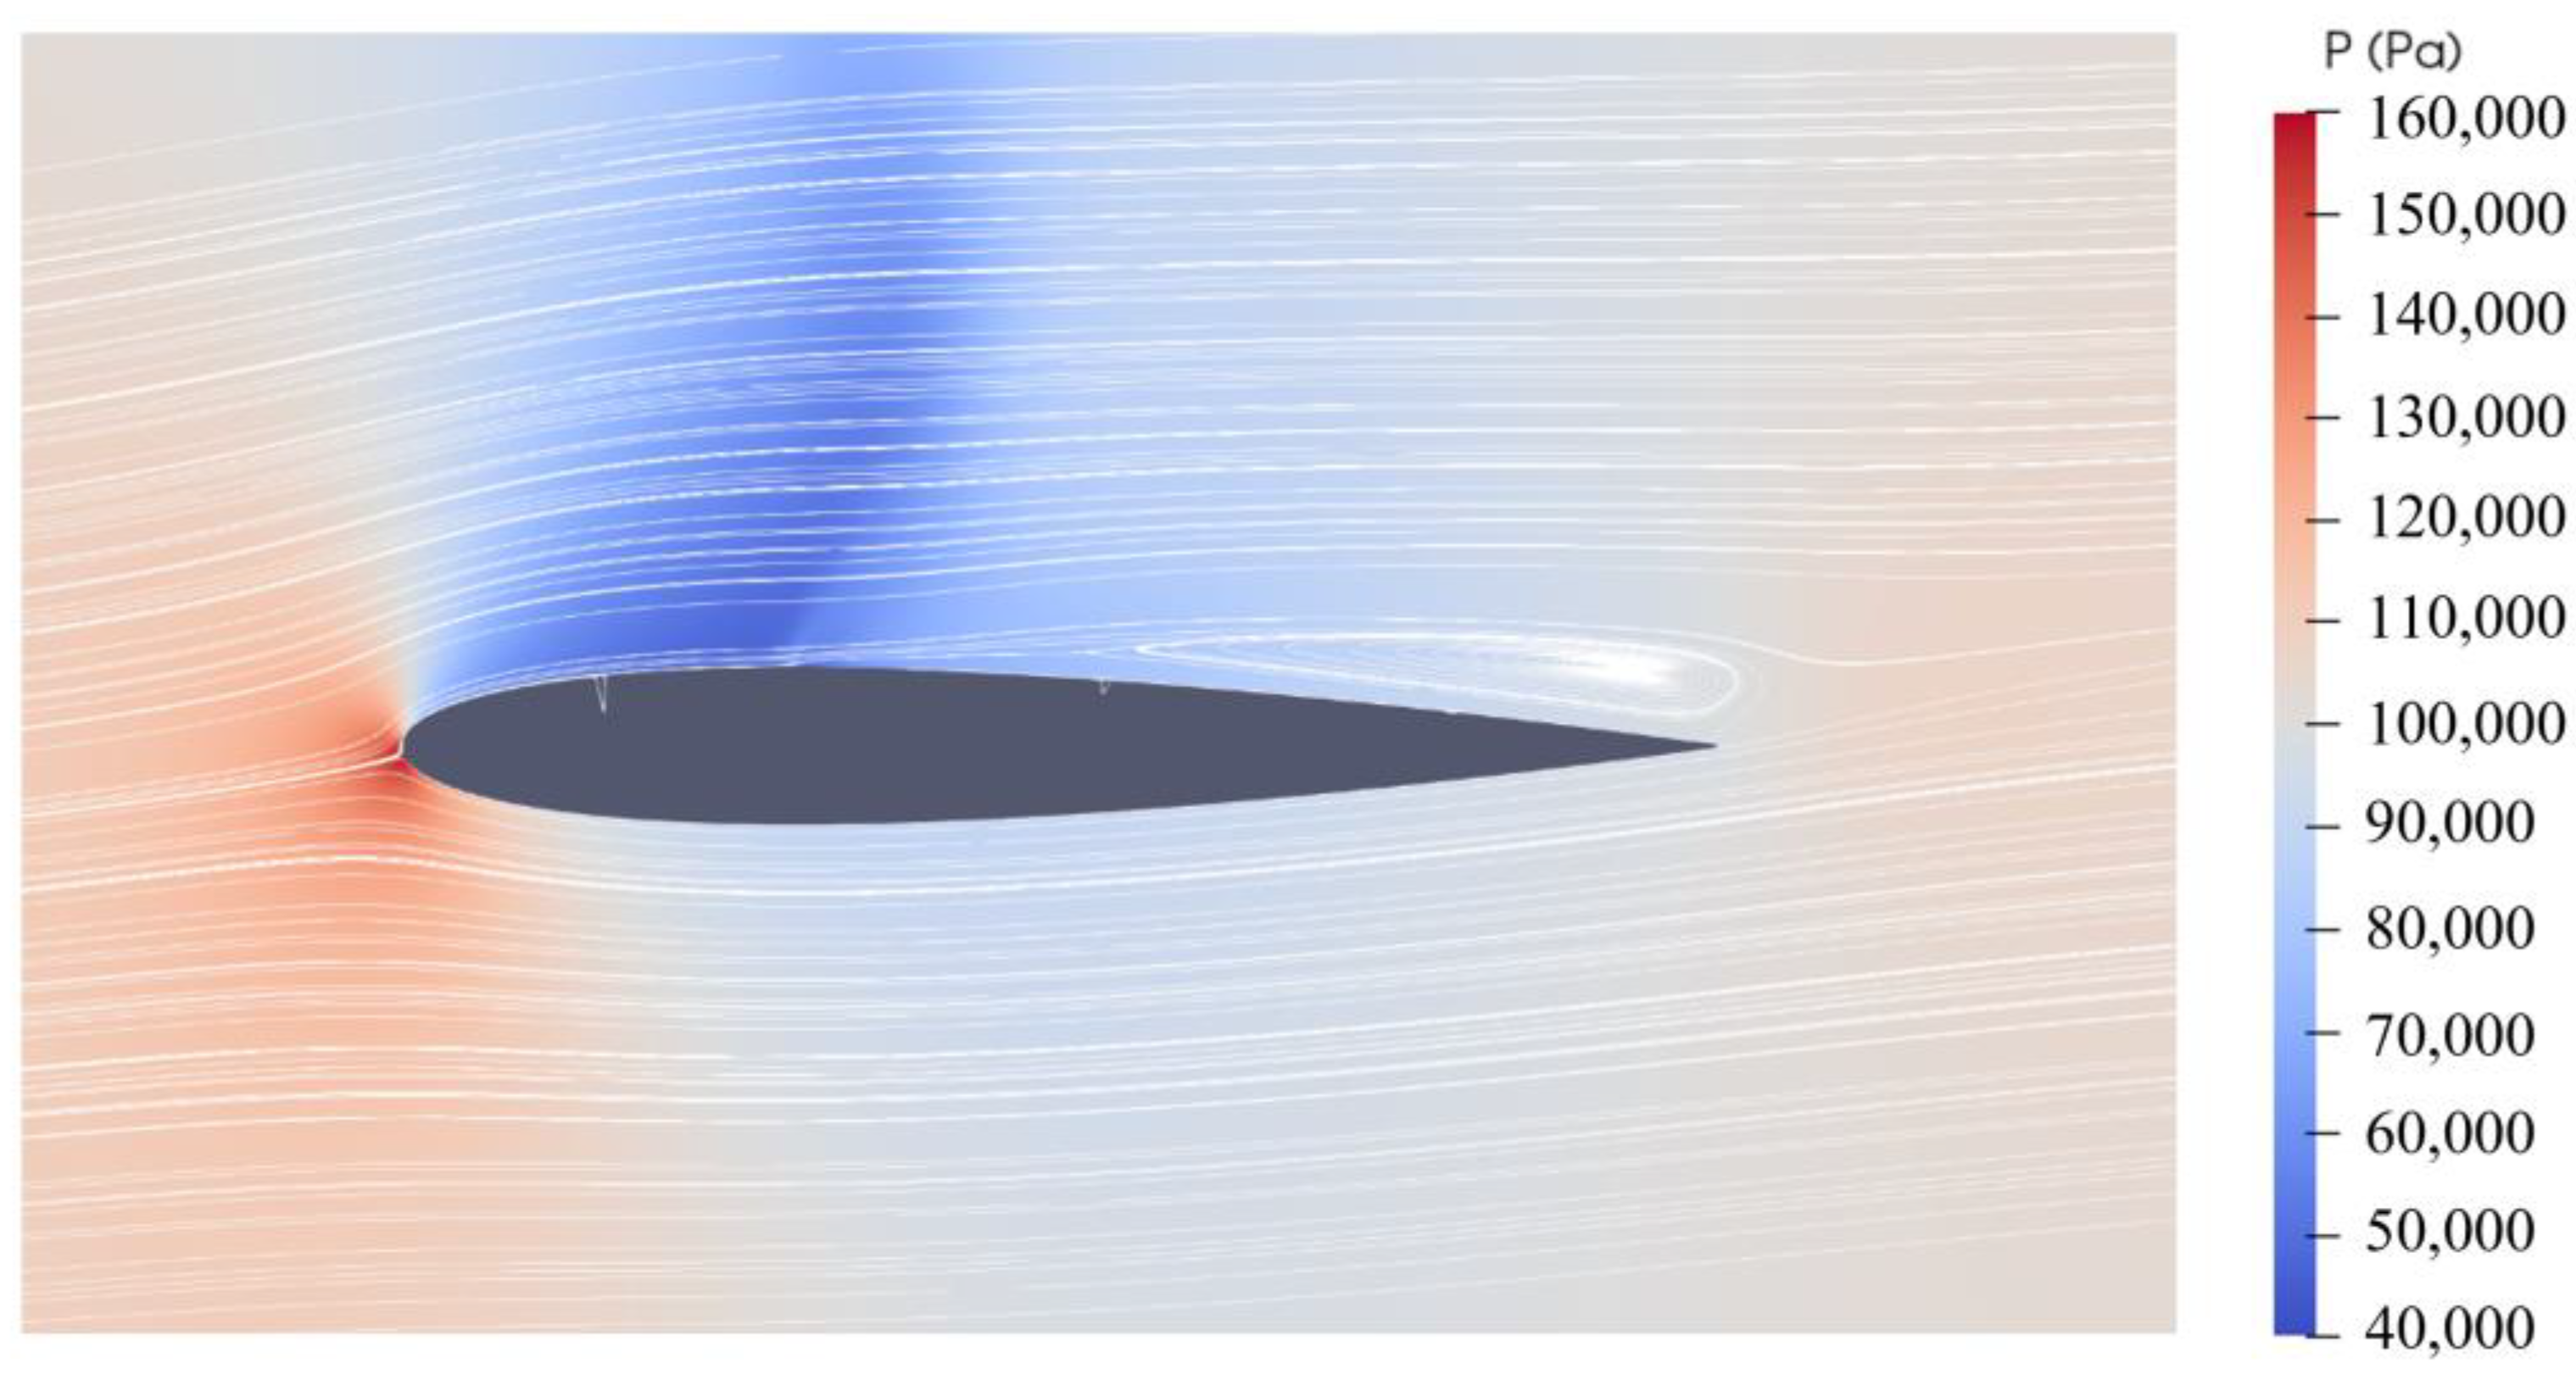
Figure 8 shows the pressure cloud image with streamlines when jet angle is 60°.
Figure 7 shows that, with increasing jet angle, the shock wave gradually develops from a normal shock from the wall into λ shock waves in which the two oblique shock wave intensities are weaker, reducing the strength of the shock wave. The greater the angle, the larger the λ shock wave.
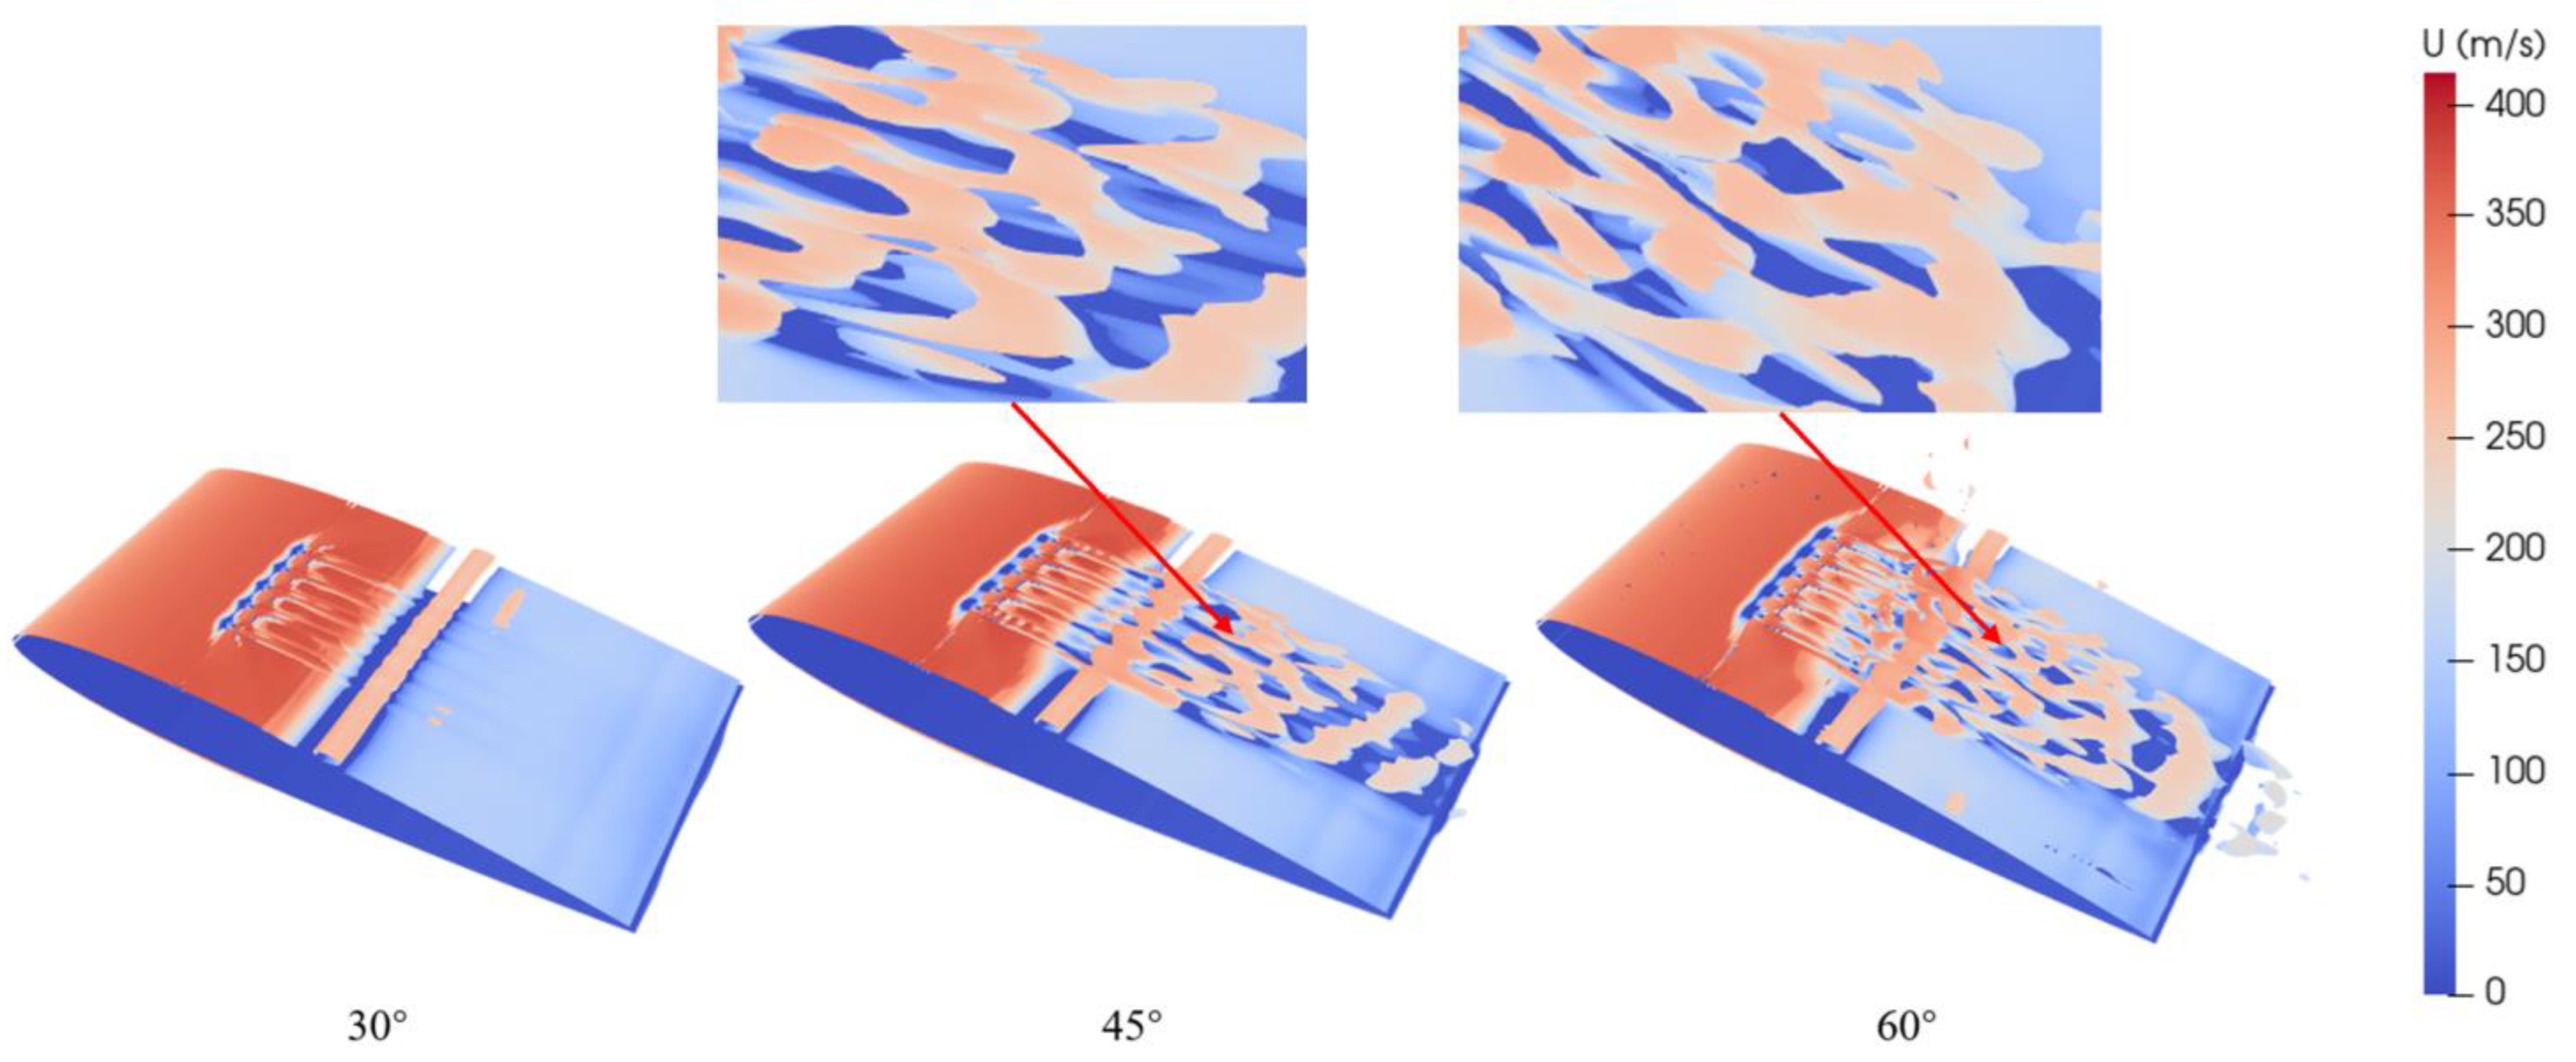
According to the Q criterion [
20], which is a vortex extraction/recognition method vorticity identification diagram in
Figure 9, it can be found that, with increasing jet angle, the intensity of the generated vorticity becomes increasingly larger.
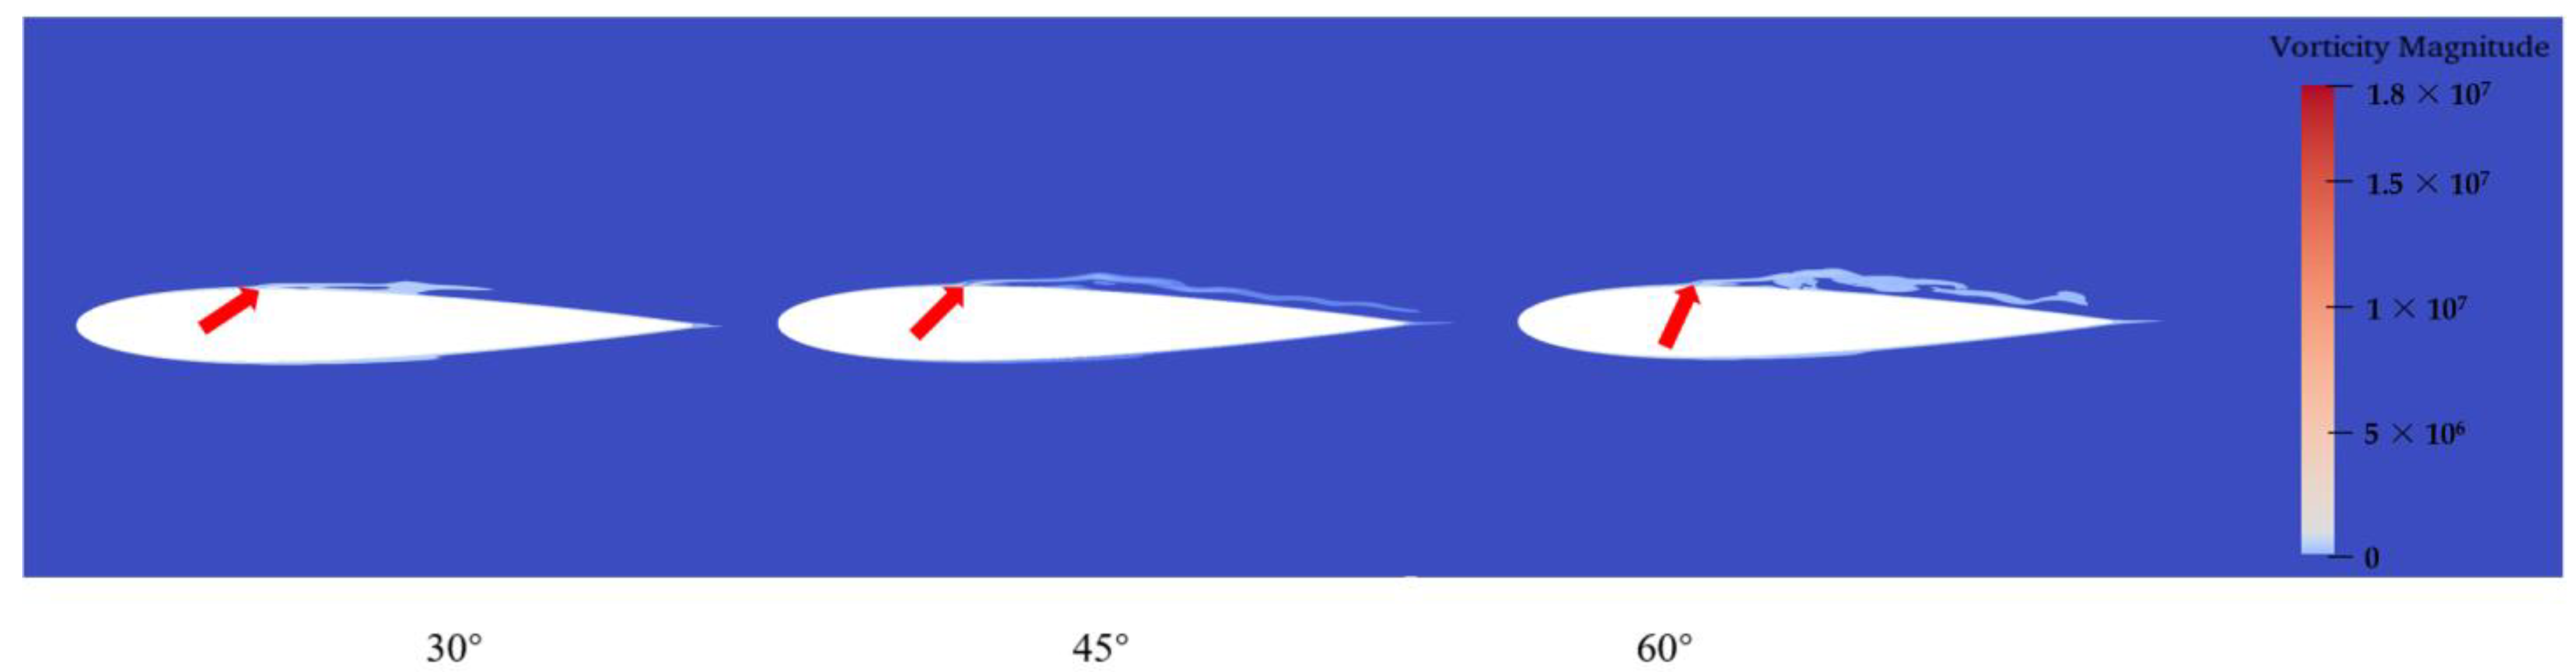
Figure 10 shows vorticity diagram of jet vortex generators with different jet angles. The vorticity generated at 30° has basically no influence on the flow after the shock wave, while the vortex structure generated by the 45° and 60° jets directly affects the downstream shock wave, and the region of the vortex is consistent with that of the λ shock wave. The 45° and 60° jets can have vortices of sufficient strength to produce λ shock waves. This reduces the intensity of the shock wave and is the reason to reduce the separation area.
The momentum exchange caused by the vortex structure formed by the jet vortex generator can suppress the effect of the shock inverse pressure gradient and make the boundary layer difficult to separate. Such a suppression of boundary layer separation will generate a weak shock wave, the pressurization of the weak shock wave will slowly thicken the boundary layer in front of the wave, and no transition and separation will occur. This deflects the gas flow inward, reflecting off a series of weak compression waves on the boundary layer in front of the wave and merging with the main shock wave to form what is called a λ wave. The jet flow vortex generator can reduce the separation hazard of shock boundary layer interference by transforming strong positive shock wave into weak λ shock waves.
4. Conclusions
In this paper, a control simulation of a jet array on a NACA0012 airfoil was conducted, and the following conclusions were drawn:
1. By arranging a jet array on the upper surface of the airfoil, separation after a shock wave can be inhibited. The vortex structure generated by the jet vortex generator effectively reduces the separation caused by SBLI.
2. The jet vortex generator transforms the normal shock wave into a λ shock wave, reducing the intensity of the shock wave and subsequently reducing the area of separation, resulting in an improved lift coefficient of the airfoil.
3. The study investigates the effect of the jet flow at different angles and finds that the larger the jet flow angle, the stronger the vortex formation and the greater the improvement in the lift coefficient. When the jet angle is set to 60°, increases the most, from 0.24645 in the case without jet flow to 0.25225, representing an increase of 2.35%.
4. The simulation mainly focuses on exploring the effect of the jet angle and obtaining the jet parameters with the best control effect, which effectively reduces the damage caused by the SBLI and improves the lift coefficient of the airfoil. This study also provides an example for simulating other parameters of the jet vortex generator.
Author Contributions
Conceptualization, T.D.; methodology, B.Z.; investigation, T.D.; writing—original draft, T.D.; writing—review and editing, B.Z.; supervision, B.Z.; funding acquisition, B.Z. All authors have read and agreed to the published version of the manuscript.
Funding
This research was funded by the National Natural Science Foundation of China (Grant No.: 12272234), the Innovation Program of Shanghai Municipal Education Commission (Grant No.: 2023KEJI05-75), and the Shanghai Science and Technology Planning Project (Grant No.: 22190711500).
Conflicts of Interest
The authors declare no conflict of interest.
References
- Lin, J.C. Review of research on low-profile vortex generators to control boundary-layer separation. Prog. Aerosp. Sci. 2002, 38, 389–420. [Google Scholar] [CrossRef]
- Tejero, F.; Doerffer, P.; Szulc, O. Shock Wave Induced Flow Separation Control by Means of Air-Jet and Rod Vortex Generators. TASK Q. Sci. Bull. Acad. Comput. Cent. Gdan. 2015, 19, 167–180. [Google Scholar] [CrossRef]
- Ali, M.Y.; Alvi, F.S.; Kumar, R.; Manisankar, C.; Verma, S.B.; Venkatakrishnan, L. Studies on the Influence of Steady Microactuators on Shock-Wave/Boundary-Layer Interaction. AIAA J. 2013, 51, 2753–2762. [Google Scholar] [CrossRef]
- Chung, K.-M.; Su, K.-C.; Chang, K.-C. The Effect of Vortex Generators on Shock-Induced Boundary Layer Separation in a Transonic Convex-Corner Flow. Aerospace 2021, 8, 157. [Google Scholar] [CrossRef]
- Wallis, R.; Stuart, C. On the Control of Shock-Induced Boundary-Layer Separation with Discrete Air Jets; ARC CP No. 595; Her Majesty’s Stationery Office: London, UK, 1958. [Google Scholar]
- Wallis, R. A Preliminary Note on a Modified Type of Air Jet for Boundary-Layer Control; Ministry of Aviation, Aeronautical Research Council: Melbourne, Australia, 1960. [Google Scholar]
- Deng, Q.; Wang, H.; He, W.; Feng, Z. Cooling Characteristic of a Wall Jet for Suppressing Crossflow Effect under Conjugate Heat Transfer Condition. Aerospace 2022, 9, 29. [Google Scholar] [CrossRef]
- Johnston, J.P.; Nishi, M. Vortex generator jets—Means for flow separation control. AIAA J. 1990, 28, 989–994. [Google Scholar] [CrossRef]
- Compton, D.A.; Johnston, J.P. Streamwise vortex production by pitched and skewed jets in a turbulent boundary layer. AIAA J. 1992, 30, 640–647. [Google Scholar] [CrossRef]
- Selby, G.V.; Lin, J.C.; Howard, F.G. Control of low-speed turbulent separated flow using jet vortex generators. Exp. Fluids 1992, 12, 394–400. [Google Scholar] [CrossRef]
- Henry, F.S.; Pearcey, H.H. Numerical model of boundary-layer control using air-jet generated vortices. AIAA J. 1994, 32, 2415–2425. [Google Scholar] [CrossRef]
- Godard, G.; Stanislas, M. Control of a decelerating boundary layer. Part 1: Optimization of passive vortex generators. Aerosp. Sci. Technol. 2006, 10, 181–191. [Google Scholar] [CrossRef]
- Doerffer, P.; Flaszynski, P.; Magagnato, F. Streamwise vortex interaction with a horseshoe vortex. J. Therm. Sci. 2003, 12, 304–309. [Google Scholar] [CrossRef]
- Paul, A.R.; Ranjan, P.; Patel, V.K.; Jain, A. Comparative studies on flow control in rectangular S-duct diffuser using submerged-vortex generators. Aerosp. Sci. Technol. 2013, 28, 332–343. [Google Scholar] [CrossRef]
- Ibrahim, M.; Kartuzova, O.; Volino, R.J. LES and URANS Computational Investigations of LPT Blade (L1A) Separation Control Using Vortex Generator Jets; Mechanical Engineering Faculty Publications: Tampa, FL, USA, 2009. [Google Scholar]
- Gomes, R.A.; Niehuis, R. Aerothermodynamics of a high-pressure turbine blade with very high loading and vortex generators. Turbo Expo Power Land Sea Air 2012, 43994, 1815–1827. [Google Scholar] [CrossRef]
- Szwaba, R. Influence of air-jet vortex generator diameter on separation region. J. Therm. Sci. 2013, 22, 294–303. [Google Scholar] [CrossRef]
- Menter, F.R. Two-equation eddy-viscosity turbulence models for engineering applications. AIAA J. 1994, 32, 1598–1605. [Google Scholar] [CrossRef]
- Harris, C.D. Two-Dimensional Aerodynamic Characteristics of the NACA 0012 Airfoil in the Langley 8 Foot Transonic Pressure Tunnel. No. NASA-TM-81927, 1 April 1981. [Google Scholar]
- Da Silva, C.B.; Pereira, J.C.F. Invariants of the velocity-gradient, rate-of-strain, and rate-of-rotation tensors across the turbulent/nonturbulent interface in jets. Phys. Fluids 2008, 20, 055101. [Google Scholar] [CrossRef]
| Disclaimer/Publisher’s Note: The statements, opinions and data contained in all publications are solely those of the individual author(s) and contributor(s) and not of MDPI and/or the editor(s). MDPI and/or the editor(s) disclaim responsibility for any injury to people or property resulting from any ideas, methods, instructions or products referred to in the content. |
© 2023 by the authors. Licensee MDPI, Basel, Switzerland. This article is an open access article distributed under the terms and conditions of the Creative Commons Attribution (CC BY) license (https://creativecommons.org/licenses/by/4.0/).


