Article

A Coaxial Pulsed Plasma Thruster Model with Efficient Flyback Converter Approaches for Small Satellites

1
Faculty of Engineering, South East Technological University, Carlow Campus, Kilkenny Rd, R93 V960 Carlow, Ireland
2
Institut für Raumfahrtsysteme/Institute of Space Systems (IRS), University of Stuttgart, Pfaffenwaldring 31, 70569 Stuttgart, Germany
3
Breakthrough Prize Foundation, NASA Research Park, Building 18, P.O. Box 1, Moffett Field, CA 94035, USA
4
Microchip Technology Inc., Cork, Co., D03 Y564 Cork, Ireland
*
Author to whom correspondence should be addressed.
Aerospace 2023, 10(6), 540; https://doi.org/10.3390/aerospace10060540
Submission received: 1 March 2023 / Revised: 1 June 2023 / Accepted: 1 June 2023 / Published: 5 June 2023
(This article belongs to the Special Issue Numerical Simulations in Electric Propulsion)

Abstract

:
Pulsed plasma thrusters (PPT) have demonstrated enormous potential since the 1960s. One major shortcoming is their low thrust efficiency, typically <30%. Most of these losses are due to joule heating, while some can be attributed to poor efficiency of the power processing units (PPUs). We model PPTs to improve their efficiency, by exploring the use of power electronic topologies to enhance the power conversion efficiency from the DC source to the thruster head. Different control approaches are considered, starting off with the basic approach of a fixed frequency flyback converter. Then, the more advanced critical conduction mode (CrCM) flyback, as well as other optimized solutions using commercial off-the-shelf (COTS) components, are presented. Variations of these flyback converters are studied under different control regimes, such as zero voltage switching (ZVS), valley voltage switching (VVS), and hard switched, to enhance the performance and efficiency of the PPU. We compare the max voltage, charge time, and the overall power conversion efficiency for different operating regimes. Our analytical results show that a more dynamic control regime can result in fewer losses and enhanced performance, offering an improved power conversion efficiency for PPUs used with PPTs. An efficiency of 86% was achieved using the variable frequency approach. This work has narrowed the possible PPU options through analytical analysis and has therefore identified a strategic approach for future investigations. In addition, a new low-power coaxial micro-thruster model using equivalent circuit model elements is developed.This is referred to as the Carlow–Stuttgart model and has been validated against experimental data from vacuum chamber tests in Stuttgart’s Pulsed Plasma Laboratory. This work serves as a valuable precursor towards the implementation of highly optimized PPU designs for efficient PPT thrusters for the next PETRUS (pulsed electrothermal thruster for the University of Stuttgart) missions.

Graphical Abstract

1. Introduction

Electric propulsion (EP) enhances the range, lifetime, reliability, and capabilities of small satellites (smallsats), whilst taking up the minimum payload space, due to high fuel efficiency [1,2]. While most EP devices have heritage from the 1960s, pulsed plasma thrusters (PPT), shown in Table 1, were among the first to be successfully demonstrated in 1964 with the Soviet Mars probe Zond 2 [3,4]. PPTs provide a broad range of operational power from 1 to 200 W, without loss of performance [5]. Their simplistic design and implementation [6], notably their enhanced precision control due to a variable power draw, provide extreme versatility [7]. Since they use solid inert propellants, they require less certification, are safer, and use no tank valve controllers, enhancing their low risk and robustness [8,9,10]. Past research was mostly limited to the United States, Russia, and Germany. Now, research laboratories from all over the world are considering PPTs as a potential cubesat propulsion technology: notably Japan [11], the UK [12], Austria [13], China [14], Singapore [15], Taiwan [16], and, recently, Ireland [1]. This renewed interest in PPTs is due to the development of small and nano-satellites for various industrial and scientific end applications.
A PPT usually consists of two copper electrodes positioned close to a propellant, typically polytetrafluoroethylene (PTFE), also known as Teflon®. The electrodes are connected to an energy storage unit (ESU) or a capacitor bank, which is charged using a power processing unit (PPU). When the ESU is fully charged, a spark supplied by an igniter close to the propellant source allows a breakdown of electrons, which establishes a flow of current from one electrode to the other across the surface of the PTFE, creating an instantaneous arc. This causes ablation and sublimation of the propellant. The heat generated by this arc causes the resultant gas to become ionized in the form of a plasma. As the charged plasma allows the flow of electrons between the electrodes, this flow creates a strong electromagnetic field that then exerts a Lorentz force on the plasma. Additionally, due to the high joule heating, thermal expansion also contributes to this acceleration. Hence, a plasma sheet expands through the electromagnetic field and exits through the nozzle, creating thrust. This successive pulsing process ablates the solid propellant over time. The propellant is pushed into the gap between the electrodes using a simple spring mechanism after each pulsing process. This process is explained in greater detail with respect to thruster head modeling in Section 2. PPTs can come with a variety of electrode geometries (rail, coaxial, or Z-pinched), propellant matters, shape and feed methods, ignition mechanisms, and lastly energy classes [33]. Depending on their size, they can range from 1–100 J of capacitor bank energy. The unsteady types operate with pulse lengths of <10 µs and energy in the region <20 J, and quasi-steady state devices operate in the <1 ms pulse length, with >20 J energy [34]. This paper compares a traditional coaxial PPT equivalent circuit model with a current state-of-the-art thruster, namely PETRUS [30] (pulsed electrothermal thruster for the University of Stuttgart), in Section 2. This is referred to as the Carlow–Stuttgart model. Figure 1 shows a high level description of the modeling approaches and proposed experimental framework.
The power processing unit (PPU) converts energy from the power supply, which usually incorporates solar cells, to charge the energy storage unit (ESU). Then a spark discharges the energy stored in the ESU when it is at maximum capacity, it then recharges and repeats the cycle. Meaning the thruster itself only pulses periodically (10–20 µs), ablating the solid propellant over time. The PPUs for ablative PPTs consist of three major components: 1. the ESU, 2. the high voltage spark igniter and 3. the flyback controller. Typically, the PPU converts low-voltage DC ( 5–28 V) to high-voltage (1–1.5 kV) for charging the thruster capacitors and an even higher voltage (8–10 kV) for the igniter [38]. The PPU printed circuit board (PCB) must be within the size of PC104, with the max form factor being 90 × 90 × 27 mm3 for cubesat applications. The igniter releases a very high voltage (10 kV) micro-discharge, which enables the main discharge of energy from the capacitor bank in the thruster head. For each micro-discharge of the igniter, stored energy in the capacitors is converted to an impulse bit and accelerated through the use of electric fields in the nozzle, as explained above. The igniter typically causes longevity and electromagnetic interference (EMI) issues in practice [15]. In Section 3, variations of a PPU topology that has received much attention in the literature of PPTs, flyback converters, are investigated. Flyback converters are common electronic topologies found in conjunction with PPT PPUs. Flyback topologies are selected for applications in PPTs, due to the galvanic isolation they provide. The modeling and design optimization of efficient flyback converters for use in PPTs, such as the fixed frequency (FF) approach, the critical conduction mode (CrCM) approach, and the variable frequency (VF) approach, are analyzed in Section 3. While the thruster head modeling describes the release of energy into the thruster head (discharge), the PPU modeling describes methods to prepare this energy for release (charging).

2. Thruster Head Modeling

In this study, experimental data are used to validate analytical voltage discharge curves. This section defines the Carlow–Stuttgart model developed for analyzing the voltage discharge curves on a coaxial thruster head after ignition. The model describes how the voltage and current changes as the plasma sheet moves from the surface of the propellant to the open end of the thruster. Throughout the years, many models have been developed for analyzing and deriving the theoretical performance characteristics of PPTs. Most prominent is the widely known “electromechanical slug model” developed by Jahn [33]. It assumes an oscillatory circuit with a uniform plasma sheet driven by the Lorentz force. However, newer models have been developed [13,39,40,41], with some leading to very efficient systems [42]; of which, PPTCUP has, to the best of the authors’ knowledge, developed the longest lifetime pulsed plasma thruster [43]. While most have focused on parallel plate geometries [13,41], the following will focus on low power (1–100 W) coaxial electrode geometries, as described by [39,44]. Coaxial PPTs are modeled as an electrical system interacting with a mechanical system, in much the same way as parallel plate PPTs, the differences arise in the dissimilar induced magnetic fields and plasma current densities produced by the devices. Coaxial designs are generally chosen for low-energy regimes (<20 J), as they yield higher performance [45]. High-energy designs (>20 J), on the other hand, should utilize parallel plate electrode geometries; noting that small flare angles of the electrodes, in this case, have been shown to improve the performance of the thruster [5], due to an increase in the inductance gradient of the thruster [13]. It is known that the thrust force in low-power coaxial PPTs is dominated by electrothermal propellant acceleration processes, while high-power parallel plate PPTs mostly utilize electromagnetic acceleration processes. One such low-power, hybrid coaxial thruster, which has been heavily ground tested and flew on its first in-space flight in 2022 onboard a Vega C rocket, is PETRUS [29]. The thruster head of PETRUS can be seen in Figure 2. PETRUS was originally presented in 2016 [46] but work on PPTs at the University of Stuttgart has been ongoing since the early 2000s. The model developed herein will use PETRUS data to verify its usage in predicting the theoretical performance characteristics of micro-PPTs and from there to derive potential PPU avenues worthy of further investigation.

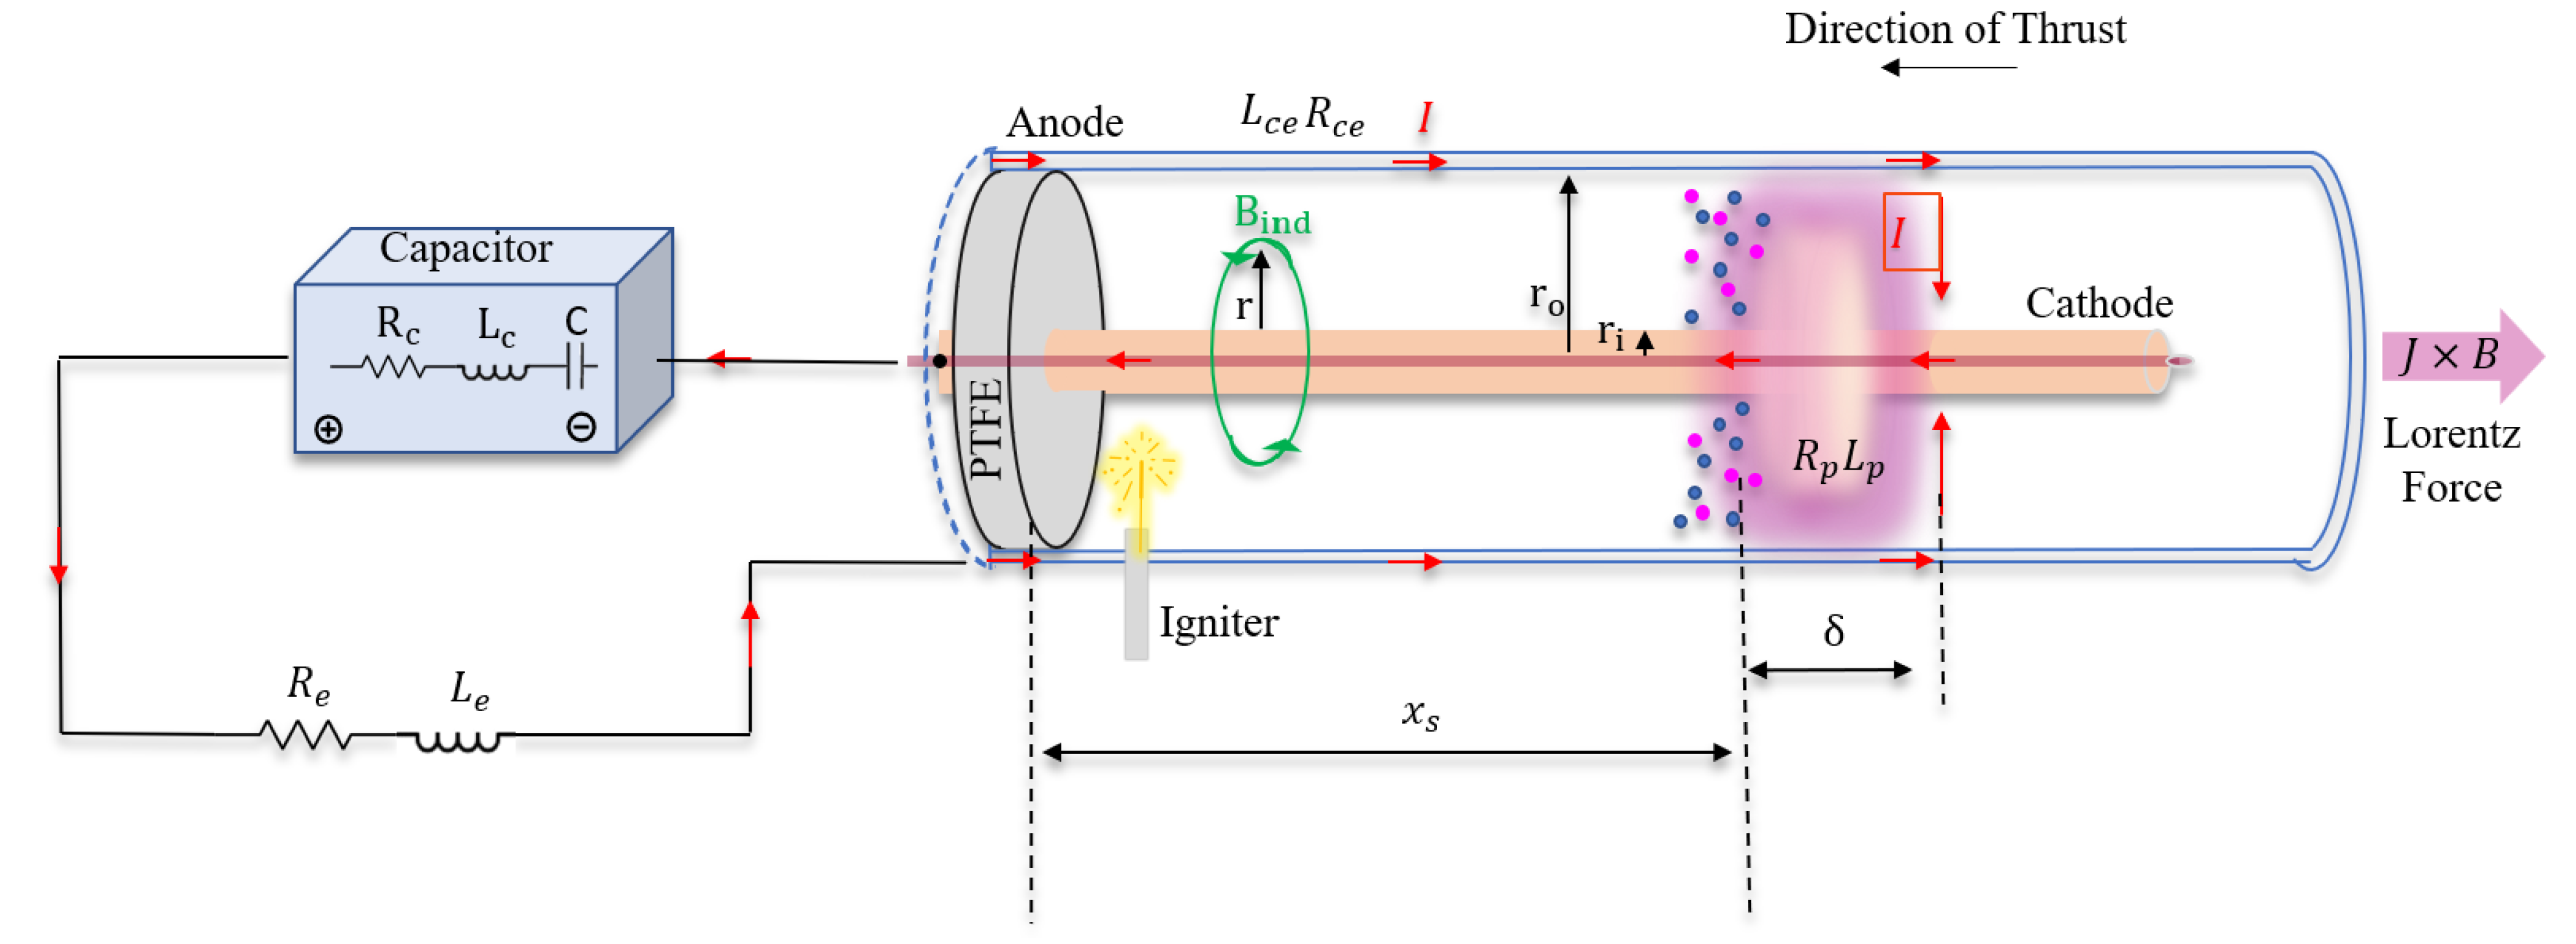
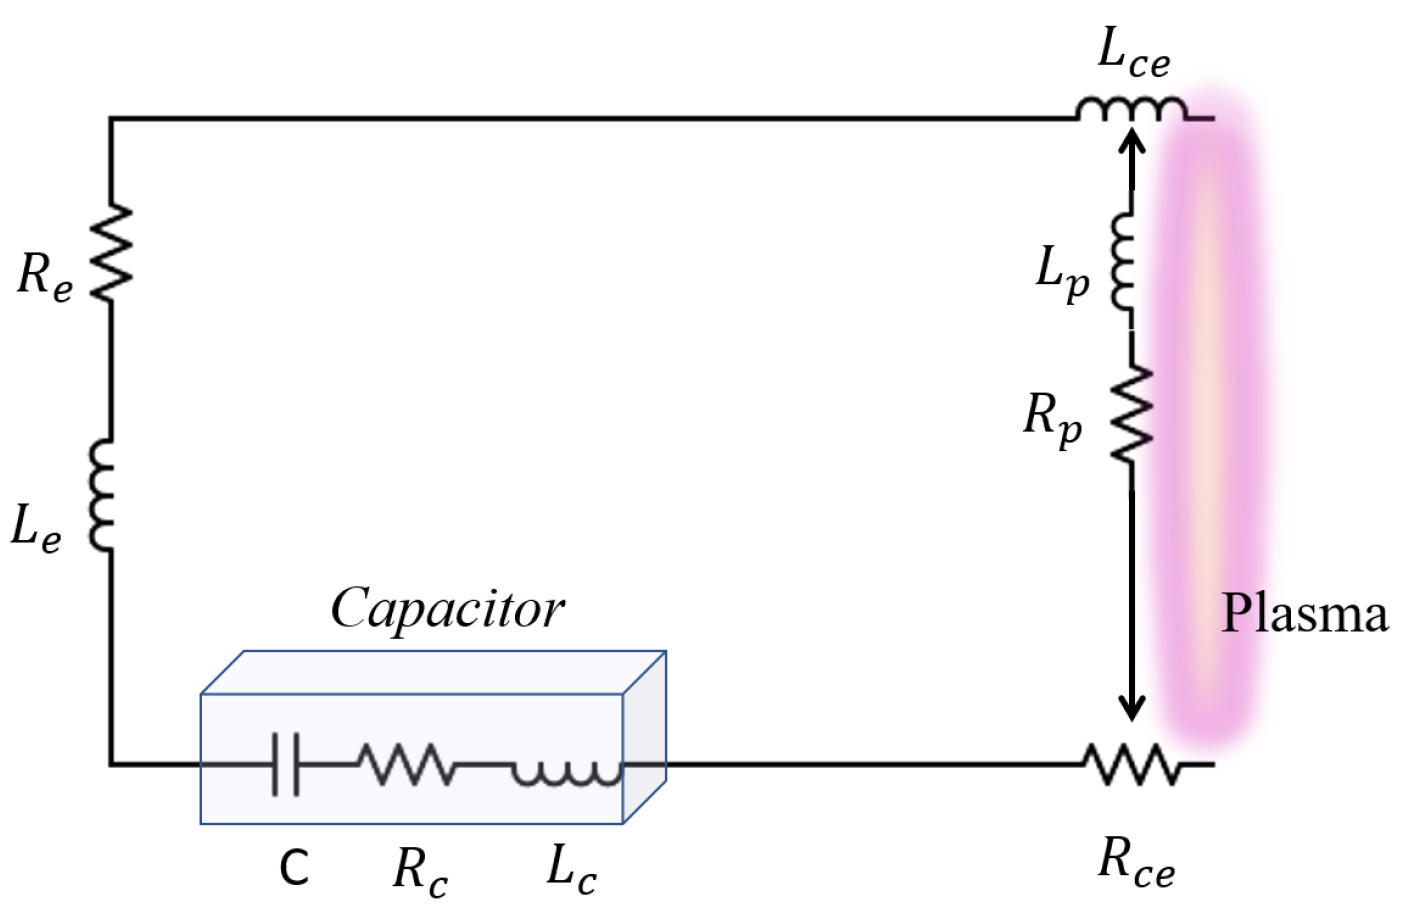
Coaxial Equivalent Circuit: Carlow–Stuttgart Model

To begin an explanation of the model, consider Figure 3, a capacitor C with inherent resistance and inductance R c and L c is charged to an initial voltage V o . This capacitor is attached to the anode and cathode of the coaxial thruster through wires/leads, with inherent resistance and inductance values R e and L e respectively. The electrodes have inner r i and outer r o radii specified for the rated energy of the thruster. Upon initiation of a spark, located at the back of the thruster, energy from the capacitor is released across the surface of the PTFE with current I. As the current travels from the inner electrode to the outer electrode, with the inherent inductance and resistance values of the coaxial electrodes themselves R c e and L c e separating a small portion of PTFE mass m 0 , it completes a self-magnetic field B i n d , which expands to a radius of r. The charged particles formed in the process are accelerated by this self-induced magnetic field in a current sheet plasma with a thickness δ , starting from the trailing edge of the propellant, the position of minimum inductance, outwards towards the exhaust, the position of maximum inductance, in increments of x s . The plasma that is produced also contains plasma resistance R p and plasma inductance L p . The acceleration of the plasma sheet due to the current density (J) interacting with the self-induced magnetic field (B) in the circuit is what provides the electromagnetic thrust force, J × B (Lorentz force), within a pulsed plasma propulsion system [39,44].
This process can be equated to an RLC equivalent circuit, as shown in Figure 4, and was presented by Jahn [33].
The circuit equation associated with this equivalent circuit explains the governing principles and relationships between the three main physical processes: the energy distributed by joule heating, the energy stored in the magnetic field, and the work done to accelerate the current sheet mass. Specifically, they are known as the rate of resistive heat generation:
I ( t ) R c + R c e + R e + R p = I ( t ) ( R T ) .
Here, I ( t ) is the change of current over time, R c is the internal resistance of the capacitor, R c e is the resistance of the coaxial electrodes, R e is the resistance of the wires and leads, and R p is the plasma resistance, which can be calculated using the formula from [44] as:
R p = 8.08 1 2 π T e 3 4 l n r o r i μ 0 l n 1.24 × 10 7 T e 3 n e 1 2 τ .
Here, T e is the electron temperature of the plasma, τ is the characteristic pulse time, n e is the electron density, and μ 0 is the permeability of free space. The summation of these resistance values can be equated to the total resistance, denoted R T .
The rate of change of energy stored in the magnetic fields is [44]:
d I ( t ) d t L c + L e + μ 0 4 π ln r o r i x s ( t ) + μ 0 δ 4 π ln r o r i = d I ( t ) d t ( L T ) .
The parameter L c is the internal inductance of the capacitor, L e is the inductance of the wires and leads, and the last two terms within the brackets represent the inductance due to the coaxial electrodes L c e and the plasma inductance L p , respectively. These last two terms change as the plasma sheet moves from the surface of the propellant towards the exhaust; hence, the x s term, which shows the variation of the inductance for these terms at each position of x s . The thickness of the plasma sheet δ and radii on inner r i and outer r o electrodes shapes how the inductance varies [44]. Together these terms equate to the total inductance L T .
Finally, the last process describes the rate of work performed on the moving plasma sheet:
μ 0 4 π ln r o r i d x s d t I ˙ ( t ) = m 0 x s .
Here, x s is the distance of the current sheet along the horizontal axis from the trailing edge of the propellant, and m 0 is the initial mass ablated at the instant of spark generation, which is assumed to be 0 during the initial condition.
These equations incorporate a resistance model, inductance model, and a magnetic field model. They sum algebraically through Kirchoffs voltage law to provide a circuit model equal to the change in voltage discharge over time as [39]:
V 0 1 C 0 t I ( t ) d t = I ( t ) ( R T ) + d I ( t ) d t ( L T ) + μ 0 4 π ln r i r o d x s d t I ˙ ( t ) .
Here, V 0 is the initial charge voltage that the PPU charges the capacitors to.
A full and up-to-date derivation of these models is better found in [13,39,41,44]. These equations form a second-order system of coupled nonlinear integro-differential equations. These equations were integrated using the ODE45 solver within MATLAB [47] to arrive at approximate solutions for the current I and the current sheet position x s , with all initial conditions set to 0:
x s ( 0 ) = 0 ; x s ˙ ( 0 ) = 0 ; 0 t = 0 I ( t ) d t = 0 ; I ( 0 ) = 0 ;
Here, x s ( 0 ) is the initial position of the plasma sheet, while x ˙ s ( 0 ) is the acceleration of x s . The first current term describes the change in current over time, while the second term describes the initial current. The model results were then compared against the experimental measurements of PETRUS discharge curves shown later in the results Section 4.
Additionally, using these models, it is possible to evaluate some performance characteristics of the thrusters, such as the impulse bit. The impulse bit is a key performance characteristic used to define mission capability scenarios for specific thrusters. It is used to determine which applications and missions the thruster may be utilized in. The impulse bit is defined as the impulse imparted to a spacecraft by a single pulse/discharge of the PPT. The minimum impulse bit reflects the level of precision associated with the propulsion system. This force is attributed to magnetic pressure forces and gas dynamic expansion forces. When obtaining the impulse bit, the magnetic and gas dynamic pressure forces are due to the plasma and gas expansion processes, respectively [34,38]. Guman [38] derived a theoretical calculation for this based on isentropic relations for the gas dynamic impulse bit, I b i t E T , and Lorentz force interactions with the current sheet for the plasma impulse bit, I b i t E M . This theoretical calculation has also been used in current models, which have correlated well with experimental findings [44], thereby validating the model for further use. The impulse bit of the neutral gas expansion is:
I b i t E T = 8 ( γ 1 ) γ 2 ( γ + 1 ) m g E g .
While the impulse bit of the plasma sheet is defined as:
I b i t E M = 0 t μ 0 4 π ln R o R i ( I ( t ) ) 2 d τ .
Here, m g is the mass of the entrained PTFE, E g is the energy used in the neutral gas flow process, and γ is the ratio of specific heats. Values for m g (9.5 µg), E g (1.65 J), and γ are taken from Guman [38], where three potential values for γ are provided based on empirical data, ranging between 1.18 and 1.4. While the model developed here focuses on the discharge of the capacitor bank and the processes which follow within the thruster head after the capacitor energy has been released, there is also a need to focus on the charging of the capacitor bank prior to discharge. This is controlled by the PPU and will now be discussed in detail.

3. Power Processing Unit Modeling (PPU)

In this analysis, various PPUs are investigated for capacitor charging, with the main metrics for improvement being efficiency, charge time, and size, to accommodate new advances in smallsat EP technologies and proposed systems. Improving the power conversion efficiency in the PPU can lead to increased input powers for the thruster head and an improved overall system efficiency and reliability. The purpose of the charging circuit within the PPU is to transfer energy from the power bus to the capacitor bank in an efficient (≥70%) and timely manner (≤1 s), with an extensive number of pulses (≥500,000). The charging circuit must charge the capacitor bank to the rated discharge energy of the thruster head before ignition. For PETRUS, this equates to 5 J. Specific voltage and capacitance values are selected to achieve this energy, with reference to Equation (9). Typically, this is achieved using voltages in the region of 1–1.6 kV and a capacitor bank of approximately 6 µF [30].
E = 1 2 C V 2
Charging the capacitor bank efficiently, reliably, and repetitively within a small form factor PPU design remains a challenging task. Capacitor charging circuits for PPTs require a large voltage conversion ratio (e.g., 5 V–1.6 kV), at low power levels (<100 W) and occurring within a timely manner (≤1 s). Charging time is an important factor, as longer charging intervals can result in untriggered discharges [46]. Additionally, the PPU should prevent high voltages from passing into the sensitive control electronics (via galvanic isolation) and reduce or prevent EMI disturbances. A large tradespace of possible power topologies may be considered to achieve the minimum target requirements, as listed in Table 2.
Using non-isolated converter topologies is unfavorable, as the instant release of capacitor energy into the thruster head can create large reverse voltages, which may cross over to sensitive electronic components and control circuits. For this reason, isolated topologies have been preferred [48], specifically flyback converter topologies [15,24,28,30,48]. Flyback converters are more efficient at lower powers (<50 W) [28,49,50]. Moreover, they have the advantage of galvanic isolation, variable voltage gain, simple design, smaller size, and lower costs. However, they are burdened by lower efficiencies in high-boost applications, as is the case for PPTs, higher conducted and radiated EMI, and larger interwinding capacitances.
The following considered topologies are variations of a boost flyback converter operating in discontinuous conduction mode (DCM) and/or boundary conduction mode (BCM), which is on the cusp of DCM and continuous conduction mode (CCM). A DCM flyback converter is more efficient at lower powers in comparison to a CCM, due to a reduced power switch (e.g., MOSFET - metal oxide silicon field effect transistor, such as the STB28NM50N), turn on losses, no rectifier reverse recovery loss, and through enabling a smaller transformer to be designed. Within these variations, different control regimes that alter the efficiency, size, reliability, and cost of the design are considered. Potential COTS components are then derived and analyzed, to show their potential usage. In its simplest form, a flyback converter in boost configuration can be equated to a circuit with a supply voltage, a power switch, and a coupled inductor with the desired turns ratio. In this configuration the maximum output voltage can be estimated by application of the volt–sec balance and capacitor charge balance theory as:
V o = V i n N p s × D 1 D .
Here, N p s denotes the primary to secondary turns ratio, N p t u r n s N s t u r n s , and D denotes the duty cycle of the power switch, which is the ratio of the ON time vs. the off time. When the switch is on, the current in the winding on the primary side ramps up linearly. D usually lies within the range 0–70%, as a rule of thumb for generic converter applications. Although for pulsed plasma thruster applications in smallsats, D would typically need to be higher than 70% to allow more time for the current to energize the inductance winding on the primary side and therefore charge the high-voltage capacitor more rapidly, having an excessively large transformer primary current comes with the drawback of an increased transformer size and reduced efficiency. In order to accommodate larger primary currents, the transformer would need to be continuously increased in size due to the larger wire cross-sections required to carry the high currents, while the time to charge would decrease. The optimum charge time is often in the range of ≤1 s, as mentioned above [30], which acts as a guide to finding a suitably small transformer that remains within PC104 and yet has sufficiently high currents on the primary winding inductor to allow for relatively fast capacitor charging. This can be achieved by using a slightly bigger transformer, or a smaller one with a higher duty cycle. Due to the constraints on size in smallsats, it is perhaps more beneficial to choose a smaller transformer with a higher duty cycle. Therefore, meeting the high-voltage, fast-charging, and size constraints in the design, whilst increasing efficiency. Moreover, the trade-offs between converter efficiency savings, space savings with a reduced size, and charging time against the broader systems on the smallsat, including the payload, largely depends on the mission scenario and budget. While the duty cycle may seem a trivial parameter, it largely determines the transformer size and, therefore, brings into question important system constraints e.g., the form factor (m3) and mass (kg). Different control approaches will now be considered, starting with the most basic converter approach of a fixed frequency flyback. Then a more advanced approach is considered: the critical conduction mode flyback (CrCM) and variable frequency discontinuous conduction mode (VF DCM) approaches, with different COTS solutions.

3.1. Fixed Frequency Discontinuous Conduction Mode (DCM) Flyback

When an input voltage ( V i n ) is applied to the primary winding of a flyback converter, the primary winding inductance current ramps up linearly in proportion to the input voltage at a rate of V i n L p , where L p denotes the primary winding inductance in H. In this initial state, the secondary side diode is reverse biased and does not allow current to flow. When the current in the primary winding reaches a set reference value, denoted as I l i m , a comparator switches high, to inform the controller to turn the gate drive signal low on the power switch (MOSFET), thus turning it off. This current limit I l i m is sensed using a current sense resistor [48]. By placing this current sense resistor on the drain of the power switch, primary side regulation (PSR) can be achieved [48]. PSR is a technique used to regulate the output voltage in a flyback converter, without the use of an optocoupler or a feedback sense winding. When the switch turns off, the secondary side winding current ramps down linearly, in proportion to the output voltage ( V 0 ), V 0 L s , where L s denotes the secondary winding inductance. As the transformer core demagnetizes, the secondary side diode begins conducting and charging the output capacitor, hence increasing the output voltage [15,51]. The converter is said to operate in DCM when the core is allowed to completely demagnetize during each switching cycle. Since the converter switches at a predefined peak current I l i m , this control method is called peak current mode control (PCMC) and can be seen in Figure 5. It has also been referred to as a current mode pulse width modulation (PWM) controlled flyback [51].
There is a high-frequency ringing seen in Figure 6, which is due to the resonance between the leakage inductance and the resonant capacitance C r , which is the sum of the transformer parasitic capacitance C t , the power switch capacitance C s , and the input capacitor C i n . Since the leakage is much smaller than the primary winding inductor, the ringing frequency is much higher. During the time from when the switch turns off until the core has completely demagnetized, there is a small dead time, where the diode and switch are not conducting.This is only allowed during DCM operation. During this dead time, a resonant ringing occurs across the power switch drain-source voltage ( V D S ), due to the resonance between the primary winding inductance L p and the resonant capacitance on the primary side, as shown in Figure 6. A converter in deep DCM has a larger dead time, due to allowing the oscillation across V D S to completely dampen until it reaches a steady state. One of the simplest methods of designing this type of converter is using a fixed frequency approach, where the time the switch remains on is equivalent to the average time it takes for the primary winding inductor to reach the current limit, I l i m . However, this is not always accurately achieved. Hence, this type of converter control method can have a very large ripple current on the secondary side, which would require large EMI filters; in addition, the losses on the power switch can be significant if switching occurs when the reflected voltage is high across the V D S of the power switch. This is also sometimes referred to as a hard-switched flyback, as the time when the switch turns on and off is constant and can occur during non-ideal times, stressing the components and reducing the efficiency and reliability. However, using a variable frequency to precisely switch the power switch on and off under specific conditions within the circuit can reduce these losses and stresses on the components. This is known as soft-switching and one method to achieve this is using a critical conduction mode (CrCM) flyback controller. Variable frequency flyback controllers reduce the switching losses associated with the power switch due to valley voltage switching (VVS). This in turn, helps to reduce EMI. As a consequence, the voltage ripple is decreased at the output.

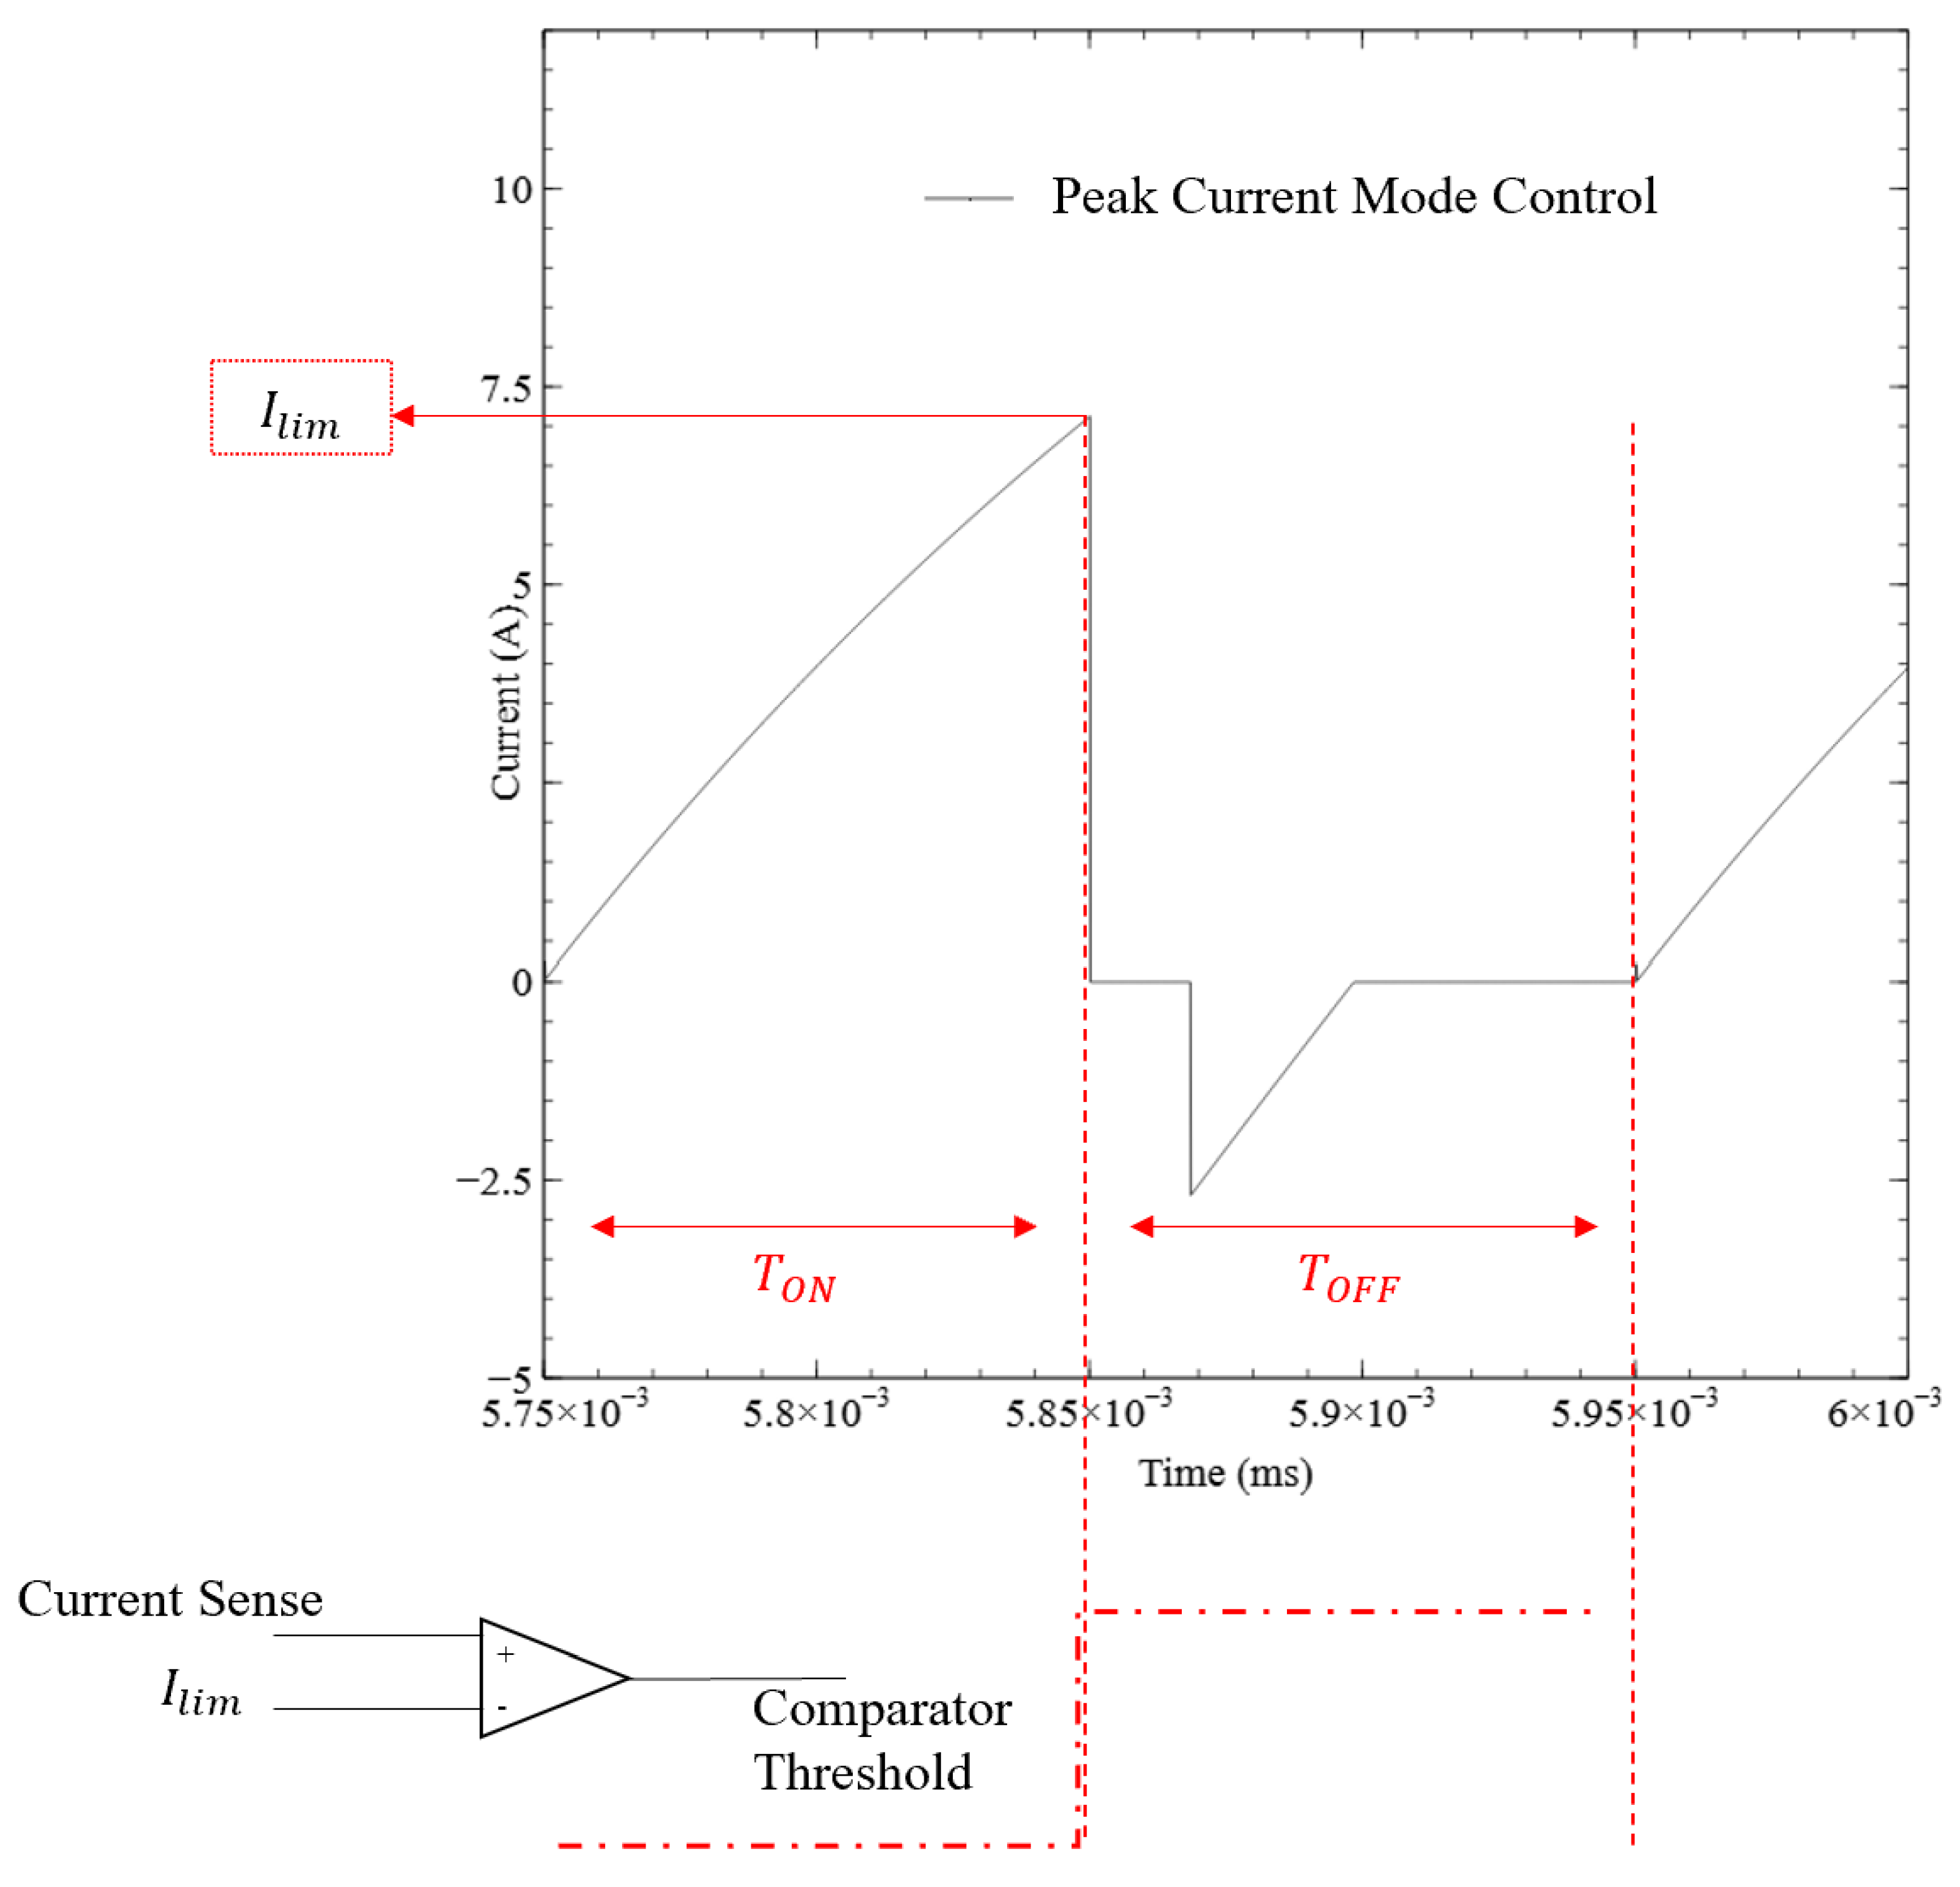
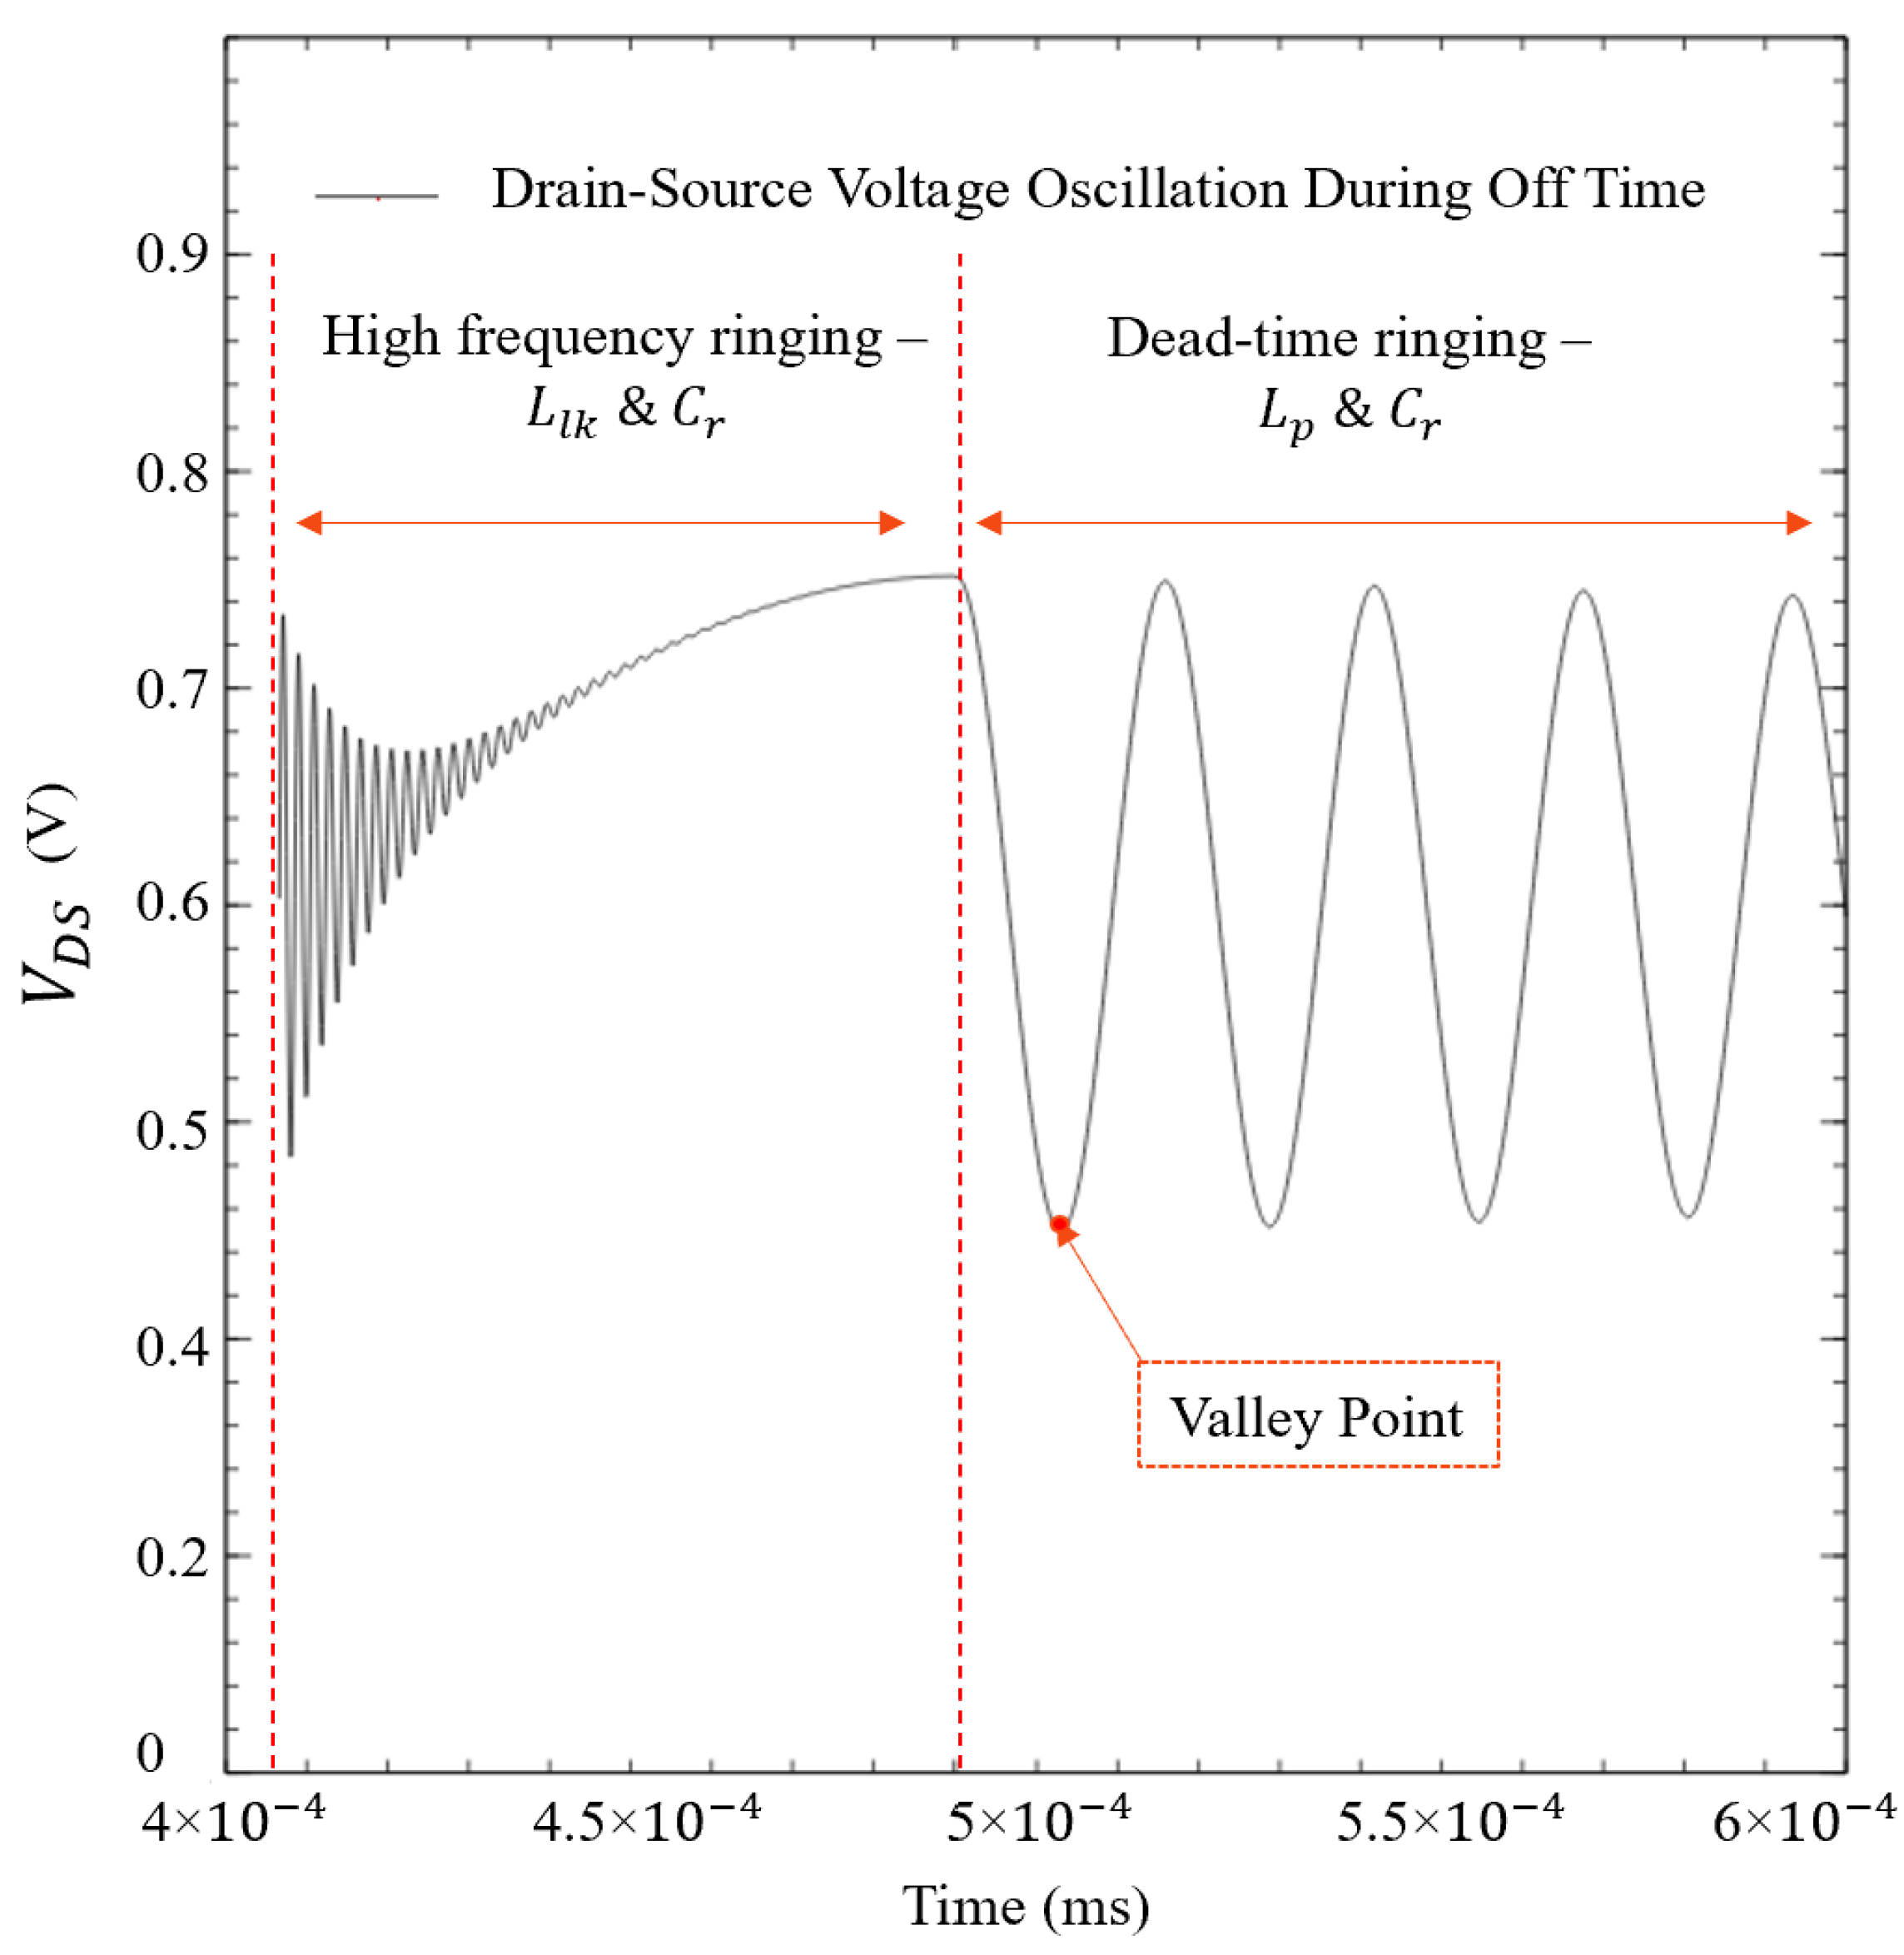
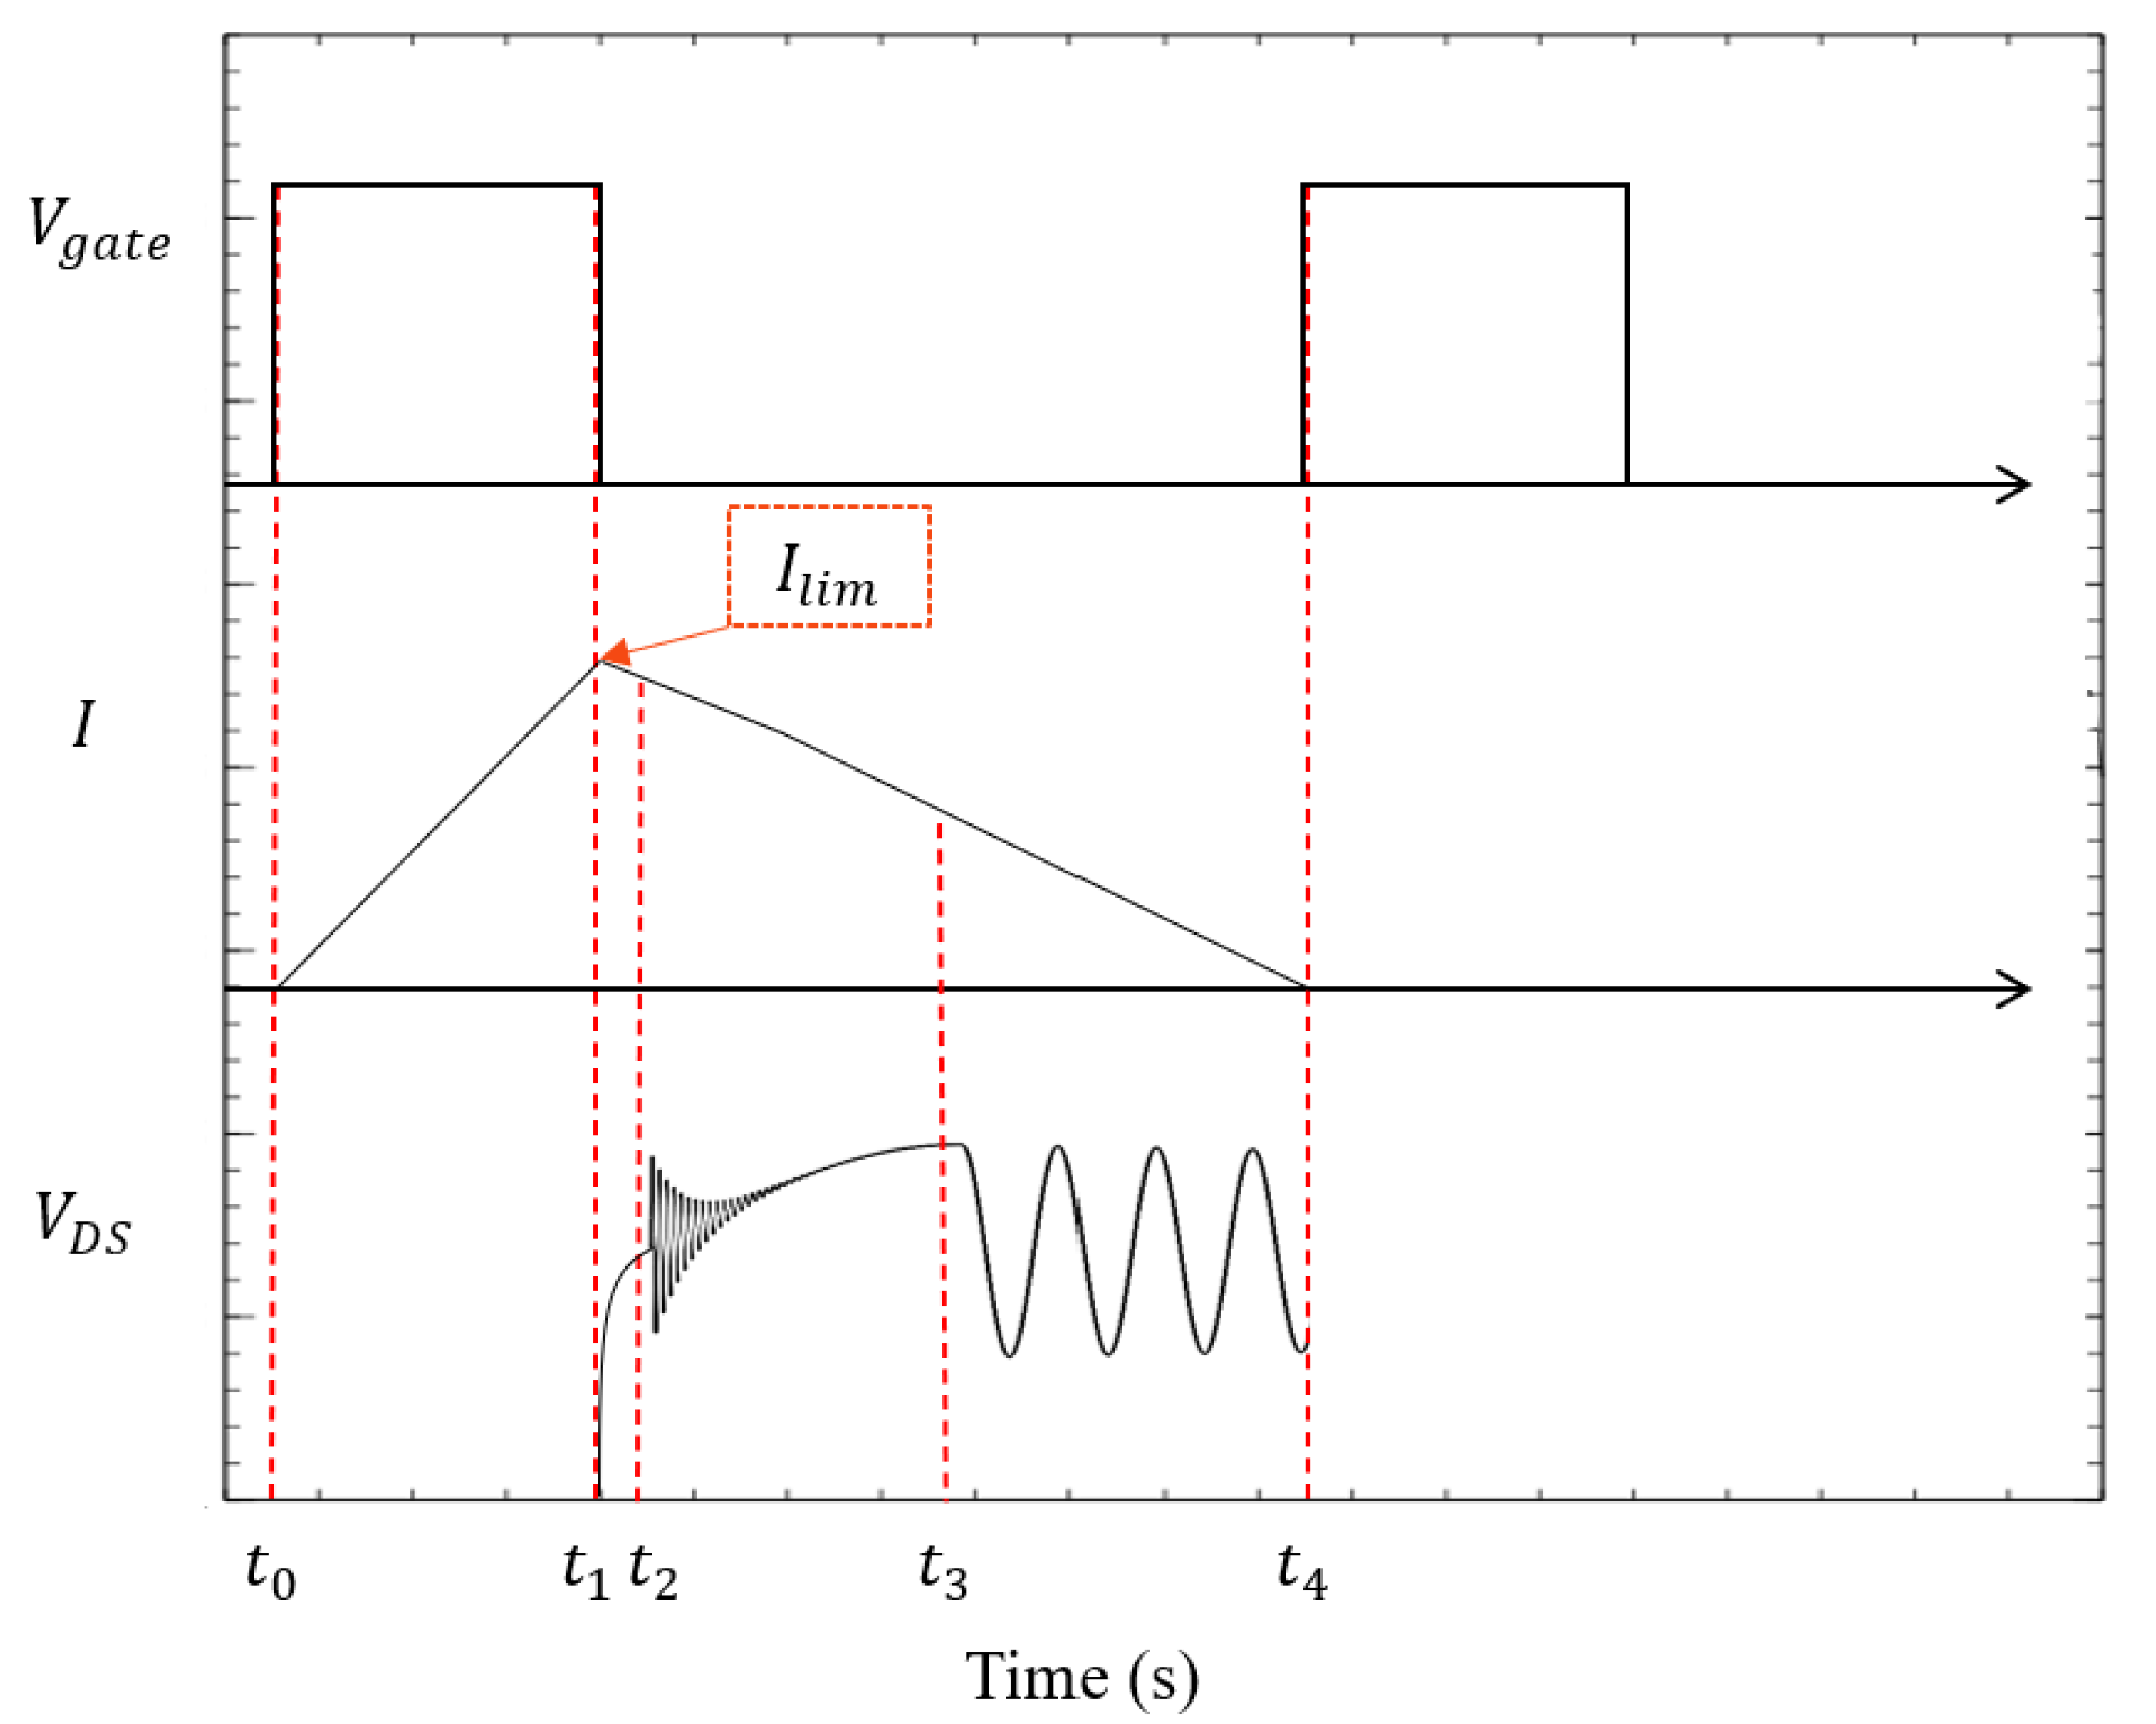
3.2. Critical Conduction Mode (CrCM) Flyback

CrCM flyback converters, also known as a quasi-resonant (QR) or transition-mode flybacks, have been shown to be particularly suited to PPTs, due to their low component count and higher efficiency in comparison to more traditional flyback topologies [15,48]. This type of converter switches on the first valley in the dead-time ringing period during every switching cycle; shown as the “valley point” in Figure 6. The CrCM flyback varies both the frequency and the peak current to maximize the power delivered during each switching cycle and to minimize the losses. In terms of capacitor charging, this means a higher frequency in the initial state and a lower frequency when the capacitor is reaching full charge. Due to this dynamic output load requirement, the circuit used as a capacitor charger does not always operate in CrCM mode. The circuit initially acts as a short circuit and then as an almost open circuit during the final charging cycle. In order to achieve reasonable thruster firing rates, a hybrid switching mode, as described by Kang [48], is required to reduce the charge time necessary for a pulse. This hybrid switching mode implements VVS in the first few capacitor charging cycles and later implements zero voltage switching (ZVS) for the remainder of the capacitor charging cycles. The CrCM model analyses the behavior of the circuit through four modes, distinguished by their time period and the inherent properties of the quasi resonance approach. The current profile and the oscillation on V D S during these modes is illustrated in Figure 7. The mathematical analyses of these modes are detailed in the following section. However, we briefly describe them here first, for the sake of clarity, prior to describing them in depth. In mode 1, the power switch, a power MOSFET (STB28NM50N by ST) in this case, S 1 is on and the input voltage is applied across the primary winding, charging the resonant capacitor denoted C r and energizing the primary winding inductances, L m and L l k , as shown in Figure 8. When the input current is equal to a predetermined current limit, I l i m , S 1 is open and turned off. Providing that the power switch turn off time is less than the time duration of mode 2, then a quasi resonance will occur between the resonant capacitance C r and the primary winding inductance L p . In this mode, the value of the primary side voltage remains less than the transformer gain ratio, thereby blocking the secondary side from charging the capacitor bank, once the output voltage is greater than the gain ratio, this mode ends and the third mode begins. In mode 3, the secondary side diode is conducting and the capacitor charging begins, due to the primary side voltage being greater than the transformer gain ratio. Once the energy from the primary side has been transferred fully to the capacitor, the charging stops and mode 4 begins. In mode 4, the secondary side diode is blocked and the output voltage is fed back to the controller. Specific conditions described below determine when to switch the power switch back on, to begin the next charging cycle. A feedback loop checks whether the output voltage is greater than the product of the transformer gain ratio by the input voltage; if so, ZVS is implemented, if not, the power switch is turned on at VVS. Using these modes, the output capacitor is charged incrementally over a number of cycles to the rated voltage of the capacitor bank.
The output voltage after each charging cycle, wherein the first charging cycle V o ( 1 ) = 0 is given by solving for V o in the second order equation below:
C r V i n 2 V o ( k ) m n a 2 + L p [ I l i m ( k ) ] 2 = C o ( V o 2 ( k ) V o 2 ( k 1 ) ) .
Here, C r shown in Figure 8 is an added resonant capacitor that acts as a snubber, V i n refers to the DC source voltage on the primary side of the transformer; V o is the output voltage; m is the number of secondary windings; n is the turns ratio, as described previously, a = L m L p . k is the charging cycle index, where after k charging cycles, C o , the output capacitance, is fully charged. Through this analysis, we can determine at which cycle the output voltage is sufficient to change from VVS to ZVS, by monitoring for the point when V o ( k ) n a V i n . This will determine the switch on time of the power switch.

3.2.1. Mode 1 t 0 to t 1

In mode 1 at time t 0 , switch S 1 is turned on and the input voltage V i n is applied to the transformer primary winding. The equivalent circuit is shown in Figure 8. The input current I i n rises linearly to the current limit I l i m in the magnetizing winding L m of the primary winding.
The initial input current I i n of the first charging cycle is zero; however, during ZVS operation, the ending current of the last charging cycle is carried through to mode 1, meaning that the initial current I i n will increase as the charging cycles progress. Mode 1 ends when the input current is equal to the charging current limit. The primary side voltage and current during mode 1 are given as:
V p k = a V i n .
I p k = I i n ( k ) + V i n L p ( t t 0 k ) .
Here, I i n is the input current supplied by the source voltage, L p is the primary side inductance, and V p is the primary side voltage.

3.2.2. Mode 2 ( t 1 to t 2 )

In mode 2, the power switch is turned off. Quasi resonance between the primary side inductance and resonant capacitance begins. During this mode the amplitude of the primary side voltage is less than V o ( k 1 ) / n . The equivalent circuit is shown in Figure 9. The mode 1 ending parameters will determine the initial conditions of mode 2, i.e., I p ( t 1 ) = I l i m , V p ( t 1 ) = a V i n .
The current I p and voltage V p of the primary side during mode 2 is given as:
V p k = a V i n c o s ( ω o 1 ( t t 1 k ) ] a Z r 1 I l i m ( k ) s i n ( ω o 1 ( t t 1 k ) ) .
I p k = I l i m ( k ) c o s ( ω o 1 ( t t 1 k ) ] + V i n Z r 1 s i n [ ω o 1 ( t t 1 k ) ) .
Here, ω o 1 is the natural frequency during mode 2, and Z r 1 is the characteristic impedance during mode 2, defined as:
ω o 1 = 1 L p C r .
Z r 1 = L p C r .

3.2.3. Mode 3 ( t 2 to t 3 )

Mode 3 begins when the current circulating in the primary winding becomes greater than or equal to V o ( k 1 ) / n . Allowing the secondary side diode D s to conduct and charging of the capacitor to begin. The equivalent circuit is shown in Figure 10. The resonant current between the primary side winding and n 2 C o contributes most of the capacitor charging once the leakage inductance L l k is significantly lower than the magnetizing inductance L m .
The primary side current and voltage stress on the capacitor during mode 3 are given by:
I p k = I t 2 ( k ) c o s ( ω o 2 ( t t 2 k ) ) + 1 Z r 2 ( V i n + V 0 ( k 1 ) n ) s i n ( ω o 2 ( t t 2 k ) .
V D S k ( t ) = V i n + v o k ( t ) n + L l k L m c o s ( ω o 2 ( t t 2 k ) + Z r 2 I t 2 ( k ) s i n ( ω o 2 ( t t 2 k ) .
Here, I t 2 is the current at the end of mode 2. The natural frequency during this mode ω o 2 and characteristic impedance Z r 2 of the first oscillation during mode 3 is given as:
ω o 2 = 1 L l k C r .
Z r 2 = L l k C r .

3.2.4. Mode 4 ( t 3 to t 4 )

Mode 4 begins after the energy in the magnetizing winding has been transferred to the load capacitor C o . The equivalent circuit of mode 4 is shown in Figure 11. The thruster will only fire after the final charging cycle has been concluded, when the capacitor is fully charged. When the circuit operates in valley voltage switching (VVS), the power switch is turned on at time t 4 ; when the primary winding voltage is less than the transformer gain ratio, V i n V o ( k ) / n a , the initial current for the next charging cycle will be zero under VVS. When the circuit operates with zero voltage switching (ZVS), the power switch is turned on at time t 4 , when the output voltage is greater than the gain ratio, V o ( k ) n a V i n .
The ending current during the ZVS operation will be passed to the next charging cycle and is given by:
I e n d Z V S = 1 n ω o 1 L m V o 2 ( k ) ( n a V i n ) 2 .
The hybrid switching CrCM approach, using VVS and ZVS, requires the use of a complex controller to apply the equations described above. Other variable frequency options exist that are readily available as COTS components.

3.3. Variable Frequency DCM Flyback: COTS Solutions

Using a variable frequency controller allows for switching the transistor back on at any valley of the dead-time ringing. Different valleys can lower the V D S voltage stress and reduce losses in the switch, improving the efficiency. A specialized controller is required to detect the valley switching and ensure the power switch (MOSFET) switches at a desired low valley point. The controller sets a compare threshold, to identify when the dead-time ringing occurs and to switch the power switch on during the target period, which is usually of the order of µs. By varying the frequency, the power switch can be turned on at different valleys, thereby delivering a different power level to the secondary side per cycle. In comparison to the CrCM approach, which always switches on the first valley. When the load changes, the frequency varies accordingly, to switch at a different valley. As the load demand on the output is decreased, i.e., when the capacitor is reaching its fully charged state, the frequency is also decreased, allowing a longer ON time and therefore a larger peak current in the primary winding. This means that as the capacitor charges, the frequency will initially be very high, therefore having a longer charging time, and as the capacitor becomes charged, the frequency will decrease, therefore reducing the charge time. This is due to the fact that, at the beginning of the charging process, the circuit acts as a short circuit, while it is an almost open circuit at the final charging stage [48]. Not many COTS options exist to perform this complex soft switching (variable flyback) for low-power and high-voltage boost applications. This work has identified two controllers as being suitable: The LM5156 is a wide input range, non-synchronous boost, flyback or a single-ended primary-inductance converter (SEPIC) controller that uses peak current mode control at varying frequencies. A circuit design using this controller for capacitor charging is shown in Figure 12. It also provides a dual random spread spectrum, to reduce the EMI over its wide frequency span from 100 kHz to 2.2 MHz. At light loads, as is the case when the capacitor bank is empty, the device offers a low operating current, cycle-by-cycle current limit, and pulse skipping, to improve efficiency. In order to perform primary side regulation (PSR) using the LM5156, a primary side auxilliary winding is added as a feedback winding for the FB pin, as shown in Figure 12. The maximum voltage on the FB pin is limited to 1 V; therefore, a resistor divider should be added to correlate the maximum output voltage required by the PPT head with 1 V on the FB pin. Another solution, is the COTS LT3751 charger. It is a proven method for capacitor charging in these applications [11,30]. This chip can charge any size of capacitor, has a built in power switch driver, and has an easily adjustable output voltage using a current sense resistor. It operates in boundary conduction mode and uses a fixed-peak current on the primary side. It is more likely to suffer from losses due to current switching. Additionally, it is not intended for designs with output voltages greater than 500 V, though it is capable of doing so, as shown by [30]. A design as seen in Figure 13 was investigated. Accordingly, along with the CrCM approach from Section 3.2, these two circuit approaches were also modeled and simulated using spice software, the results of which are presented in Section 4.

4. Results

4.1. Thruster Head Modeling

The analysis of the capacitor discharge profile, as shown in Figure 14, provides information on the rate of voltage and current variation during the pulse. This helps to determine the magnitude of the current and voltage reversal.
A full list of the parameters used is presented in Table 3. Parameters such as the plasma temperature and plasma density were derived from the experimental literature surrounding PETRUS. The plasma density value within the model for plasma resistance was taken from the experimental findings of [52] as 8 × 10 20 m−3. The plasma temperature was taken as 2 eV [8,53]. The remaining geometrical and electrical parameters, such as the inner and outer radii, thickness, length, voltage, and capacitance were taken from [46]. A characteristic pulse time of 2 μs was found to be most beneficial for the thrust efficiency [8] and is therefore utilized in this calculation. Taking into consideration the model discussed in Section 2, a comparison of it with PETRUS discharge curves is shown in Figure 15. As can be seen from the comparison, the developed model well predicted the discharge curve for initial oscillations. As the oscillations passed the time 4 × 10 6 µs the developed Carlow–Stuttgart model slightly over predicted the second voltage reversal in comparison with the experimental data.

4.2. PPU Modeling

The following method of analysis discretely shows the variations in the converter performance over its complete operation, i.e., from 0 V to 400 V with different input voltages of 5 V, 12 V, and 24 V. The results of the spice analysis are shown in Figure 16.
These results show the efficiency and charge time of one secondary winding at 400 V on the flyback transformer. The output capacitor C o on the secondary side is 1 μf. When the input voltage was at 5 V, as seen in Figure 16a,d, the CrCM method of capacitor charging showed a max efficiency of 83.5% at 200 V. Following this charge voltage, its efficiency drastically decreased to 62% at 400 V. This method of capacitor charging took 400 ms to reach the desired output voltage of 400 V for each secondary winding. The LT3751 approach remained in the 75–80% region, with a peak efficiency of 81% at 220 V. It culminated at an efficiency of 75% at 400 V. It reached the full voltage in 380 ms. The LM5156 approach had an efficiency of 91.8% at 12 V. It then decreased to an efficiency of 78% at 400 V. It took approximately 395 ms to reach this voltage. As the input voltage increased, the efficiency was seen to significantly increase, especially for 24 V. The charge time also decreased by a factor of 3%, from an initial input voltage of 5 V. The LM5156 approach showed significant efficiency with a 24 V input, with 86%. This was a 9% increase in comparison to its 5 V input.

5. Discussion

5.1. Thruster Head Modeling

The developed Carlow–Stuttgart coaxial equivalent circuit model compared well to experimental results of predicted voltage discharge reversals and characteristic pulse time oscillations. The secondary voltage reversal after time 4 × 10 6 µs overpredicted the voltage swing. This may have been due to variations in the vacuum chamber during discharge in comparison to the expected vacuum pressures within the model. The model also assumes that the current sheet is of a uniform density, which in practice is not necessarily the case. The values for plasma temperature, plasma resistance, and electron density are also assumed to be constant. Other sources of error can stem from the inaccuracy of experimental measurements and post-processing of the data. The simplifications and assumptions of the model being an RLC circuit produce an idealized value. This is believed to be what caused the error in the model in comparison to the experimental results. However, the range of actual values was reasonable for predicting the actual performance characteristics of a thruster head with various geometries. For example, the average error in the simulated results differed by ±4% until time 4 × 10 6 µs, where it then, on average, differed by ±11%. Taking this error into account, the simulated geometries and initial voltage levels of the capacitor banks can be theorized to a maximum error of only ±11%. This enables rapid prototyping of various coaxial thrusters, working towards an optimized solution. The developed model can then be used to predict variations in thruster head and initial discharge voltage.

5.2. PPU Modeling

Prior to this work, the authors envisaged that employing an advanced soft switched CrCM approach would result in a highly efficient PPU converter. However, this was found to not be the case, as the efficiency gains vs. complexity of the CrCM approach did not yield a higher performance overall. For a 5 V input, the peak PPU efficiency of 83.5% at only 200 V using the CrCM approach was good; however, when the charge voltage reached 400 V, this reduced to 62%; in comparison, the LM5156 approach at 400 V produced an 80% efficiency and is far simpler in terms of transformer secondary winding size and mass. This is a critical aspect of the design of the PPU controller coupled with the transformer for this application area of CubeSats. The CrCM approach offers higher efficiencies at lower input/output voltages; for example, with a total of 600 V on the output, using three secondary winding’s each of 200 V with just a 5 V input. However, when the voltage was increased to 400 V for each secondary winding, a total of 1200 V using three windings, the CrCM approach drastically reduced in efficiency. This could have been due to hard switching as the capacitor reached full charge, where the CrCM approach entered a continuous conduction mode (CCM). While the gains with soft switching are noticeable, they do not warrant the complexity of CrCM when compared with the readily available COTS components, e.g., LM5156, which can implement highly efficient and easily interfaced flyback solutions that are reliable. In addition, the control required for the CrCM topology requires a complex feedback loop to determine the ON time of the power switch and to ensure the demagnetization of the transformer core over an unconventional capacitor load, where it acts as a short circuit initially, and an almost open circuit at the end. Moreover, the physical implementation of the CrCM approach for a high-voltage capacitor charger is not a readily resolved solution, without a real-time dynamic feedback loop controller for such low-power, high-voltage applications. The design therefore becomes one of ASIC technology, which requires lengthy development time. An initial study using a TI F28004 Real-Time C2000 MCU proved capable; however, the power draw of the MCU itself was undesirable, being rated at 0.5 W for such a minor task. The F28004 MCU would be interesting for a complete systems level solution, whereby it controls, analyses, and monitors multiple systems and instruments onboard the smallsat. However, this is not an adequate use of the board for PPU design, taking into account its very broad functionality and large scale of performance and computation. Additionally, this is not a redundant solution, i.e., if the F28004 fails, the system stops functioning, thereby reducing reliability.
Interestingly, the efficiencies at the 400 V capacitor charge of the LT3751 and LM5156 approaches yielded a strong performance, at 75%, 76% and 81%, with the LM5156 approach at 78%, 79%, and 86% with 5 V, 12 V and 24 V at the input, respectively. In addition, the charge time for all approaches was sufficiently under 1 s for a 1 uF capacitor to 400 V. This would increase as the capacitance and voltage increases using multiple secondary windings. It is not uncommon to see losses in the range of 10–20%, some can even be as high as 30% [15,34,54] here. This is not typically the case for other forms of EP systems, such as ion or hall-effect thrusters at higher powers, which can have PPU efficiencies of 85% [55]. Moreover, outside of the space domain, it is not uncommon to see general switched-mode power supply (SMPS) topologies at low power (<50 W) with efficiencies in the range of 95% [56]. These significantly higher efficiencies are enabled through advanced superjunction (SJ) MOSFETs, as well as wide bandgap technologies, in terms of gallium nitride (GaN) and silicon carbide (SiC) switching devices. It was observed that the change in input voltage had a large impact on the efficiency for these types of converters. By lowering the required voltage conversion ratio through an increase in input voltage, the efficiency gains increased significantly. A clear trend was observed, where if the input voltage was increased from 5 V to 24 V, the efficiency increased by 6% for the LT3751 and by 8% for the LM5156 approach. This suggests that increasing from the 5 V bus to 24 V before performing the larger conversion to 1200 V offers a clear path toward higher efficiencies, so that depending on the CubeSat bus voltage available, a two-stage converter might be desirable. During this investigation, a wide array of COTS controller components were considered, in addition to the ones explored herein, which included UCC28600, LM5022, and TPS92314. The authors believe that these components could also offer viable alternative solutions. Moreover, it became evident early in this work that highly efficient low input voltage to high output voltage controllers and control regimes have received little attention, and thus a limited discourse exists in the literature. While a lot of COTS controllers and power devices are available, their application areas are more focused on consumer electronics and automotive applications, in terms of the reference designs and application notes. As cubesats become more widespread, many of their propulsion systems, PPTs, or other electric approaches, will require low input to high output voltage conversion controllers and COTS solutions. It would therefore be desirable to see more solutions and products that offer higher voltage conversion ratios at much lower power levels (e.g., less than 50 W) than the current high-voltage converters, at competitive efficiencies. This would enable more readily interfaced, highly efficient, reliable, and lower cost products to fuel the smallsat propulsion industry.

6. Conclusions

The results from the Carlow–Stuttgart model for the thruster head have shown that prediction of discharge curves of the voltage and current for the PETRUS 5 J for micro-thrusters with a coaxial geometry is possible to an 11% degree of error. Most equivalent circuit models in the literature have mainly focused on parallel plate PPTs, and those that focused on coaxial models were aimed at predicting plasma acceleration. There has been little research on models for coaxial low-power thrusters that estimate the performance characteristics and take into consideration neutral gas expansion forces. Furthermore, these results provide a strategic, targeted, and informed approach to PPU experimentation with PPTs. This paper has provided a method of narrowing the selection of PPUs for PPTs with defined characteristics, parameters, and performance criteria. This work serves as a focused background for PPU experimentation for PPTs, as well as validation of a new coaxial equivalent circuit model with experimental pulses for PETRUS 5 J. The results clearly highlighted which PPU topologies and approaches are expected to significantly aid in the improved efficiency of PPUs for PPTs; thereby, narrowing the broad potential list of converter topologies to a suitably tailored grouping of converters for experimentation. The developed equivalent circuit model offers a viable means of optimization for low-power coaxial PPT head prototypes. The significant parameters for the study of PPU topologies for PPTs have been defined, analyzed, and designed. They are the voltage conversion ratio, control implementation, and component selection for enhanced operation. This approach, developed with the use of SPICE software, paves the way for suitable experimentation of PPUs. The equivalent circuit model validated through experimentation will also guide the development of PPUs and enable faster prototyping for low-power coaxial micro-thrusters.
The findings of this paper suggest that the developed model discussed in the body of the text is useful for making analytical predictions of low-power coaxial micro-thrusters (namely PETRUS). The analysis of various PPU topologies strongly suggests that a variable frequency (VF) discontinuous conduction mode flyback converter operating under a dynamic control regime utilizing COTS solutions provides a more efficient approach at a systems level, in comparison to the other approaches analyzed in this study. The paper demonstrates that by adopting a PPU converter with a more dynamic control, the efficiency can be significantly improved; however, the voltage at the input is significant. We investigated three different input voltages of 5 V, 12 V and 24 V and achieved 86% for the latter using the VF LM5156 discontinuous conduction mode flyback converter approach. An improvement of 6%. This work establishes a valuable framework for experimentally validating the different approaches and methods investigated here. Future work will experimentally investigate SiC MOSFETs, as well as other advanced power switching technologies, such as super junction (SJ-MOSFETS) and gallium nitride (GaN) wide band gap (WBG) devices.

Author Contributions

Conceptualization, D.O., G.H. and D.F.K.; methodology, D.O. and D.F.K.; software, D.O. and D.F.K.; validation, D.O. and D.F.K.; formal analysis, D.O., G.H., P.M. and D.F.K.; investigation, D.O.; resources, D.O. and D.F.K.; data curation, D.O. and D.F.K.; writing—original draft preparation, D.O.; writing—review and editing, D.O., G.H., F.S., C.M., S.P.W., P.M. and D.F.K.; visualization, D.O.; supervision, G.H., S.P.W. and D.F.K.; project administration, D.F.K.; funding acquisition, D.O. and D.F.K. All authors have read and agreed to the published version of the manuscript.

Funding

This research was funded by the Irish Research Council, grant number GOIPG/2020/1566.

Data Availability Statement

The data that support the findings of this study are available from the corresponding author, [D.O.], upon reasonable request.

Acknowledgments

Thank you to Eoghan Chelmiah and Liam Dinkelman of SETU for valuable weekly suggestions on technical matters. Thank you to Pete Klupar and Kyran Grattan of the Breakthrough Initiatives for informal discussions on technical matters.

Conflicts of Interest

The authors declare no conflict of interest.

Abbreviations

The following abbreviations are used in this manuscript:
BCMBoundary Conduction Mode
BEOBeyond Earth Orbit
CCMContinuous Conduction Mode
COTSCommercial Off The Shelf
CrCMCritical Conduction Mode
CWVMCockroft-Walton Voltage Multiplier
DCDirect Current
DCMDiscontinuous Conduction Mode
EMIElectromagnetic Interference
EPElectric Propulsion
ESUEnergy Storage Unit
FBFeedback pin
FFFixed Frequency
GaNGallium Nitride
LEOLow Earth Orbit
MCUMicrocontroller
MOSFETMetal Oxide Semiconductor Field Effect Transistor
ODEOrdinary Differential Solver
PCMCPeak Current Mode Control
PETRUSPulsed Electrothermal Thruster for the University of Stuttgart
PPTPulsed Plasma Thruster
PPUPower Processing Unit
PSRPrimary Side Regulation
PTFEpolytetrafluoroethylene
PWMPulse Width Modulation
QRQuasi Resonant
RLCResistor, Inductor, Capacitor
SMPSSwitch Mode Power Supply
SiCSilicon Carbide
TITexas Instruments
UVLOUnder-Voltage Lockout
VVSValley Voltage Switching
VFVariable Frequency
WBGWide-Band Gap
ZVSZero Voltage Switching

References

  1. O’Reilly, D.; Herdrich, G.; Kavanagh, D.F. Electric Propulsion Methods for Small Satellites: A Review. Aerospace 2022, 8, 22. [Google Scholar] [CrossRef]
  2. Krejci, D.; Lozano, P. Space Propulsion Technology for Small Spacecraft. IEEE Xplore 2018, 106, 362–376. [Google Scholar] [CrossRef] [Green Version]
  3. Lev, D.; Myers, R.M.; Lemmer, K.M.; Kolbeck, J.; Koizumi, H.; Polzin, K. The technological and commercial expansion of electric propulsion. Acta Astronaut. 2019, 159, 213–227. [Google Scholar] [CrossRef]
  4. Kazeev, M.N.; Kozubskiy, K.N.; Popov, G.A. Pioneer of the First Space Electric Propulsion System Development and Space Tests. In Proceedings of the International Electric Propulsion Conference, Ann Arbor, MI, USA, 20–24 September 2009. [Google Scholar]
  5. Arrington, A.L.; Haag, W.T.; Meckel, J.N. A Performance Comparison of Pulsed Plasma Thruster Electrode Configurations. In Proceedings of the International Electric Propulsion Conference, Cleveland, OH, USA, 24–28 August 1997. [Google Scholar]
  6. Hansen, J.F.; Wendt, F. History and State of the Art in Commercial Electric Ship Propulsion, Integrated Power Systems, and Future Trends. Proc. IEEE 2015, 103, 2229–2242. [Google Scholar] [CrossRef]
  7. Shaw, P.V. Pulsed Plasma Thrusters for Small Satellites. Ph.D. Thesis, University of Surrey, Guildford, UK, 2011. [Google Scholar]
  8. Chan, Y.A.; Montag, C.; Herdrich, G. Review of Thermal Pulsed Plasma Thruster—Design, Characterization, and Application. In Proceedings of the International Electric Propulsion Conference, Kobe, Japan, 4–10 July 2015. [Google Scholar]
  9. Burton, R.L.; Turchi, P.J. Pulsed Plasma Thruster. J. Propuls. Power 1998, 14, 716–735. [Google Scholar] [CrossRef]
  10. Northway, P.E.; Aubuchon, C.A.; Mellema, H.P.; Winglee, R.M.; Johnson, I.K. Pulsed Plasma Thruster Gains in Specific Thrust for CubeSat Propulsion. In Proceedings of the 53rd AIAA/SAE/ASEE Joint Propulsion Conference, Atlanta, GA, USA, 10–12 July 2017. [Google Scholar] [CrossRef]
  11. Alarcon, J.R.C.; Örger, N.C.; Kim, S.; Vinh, T.Q.; Seng, L.W.; Duy Vu, B.T.; Cho, M. Moon Mission Lifetime Analysis of a 2U CubeSat Equipped with Pulsed Plasma Thrusters; The Aoba-VELOX IV Mission Case. In Proceedings of the 31st International Symposium on Space Technology and Science(ISTS), Dogomachi, Japan, 24–27 October 2017; Available online: https://www.issfd.org/ISSFD_2017/paper/ISTS-2017-d-073__ISSFD-2017-073.pdf (accessed on 21 February 2023).
  12. Ciaralli, S.; Coletti, M.; Gabriel, S.B. Performance and lifetime testing of a pulsed plasma thruster for Cubesat applications. Aerosp. Sci. Technol. 2015, 47, 291–298. [Google Scholar] [CrossRef]
  13. Scharlemann, C.; Krejci, D. Analytic Model for the Assessment of the Electrode Configuration of a µPPT. In Proceedings of the 45th AIAA/ASME/SAE/ASEE Joint Propulsion Conference & Exhibit, Denver, CO, USA, 2–5 August 2009; p. 5279. [Google Scholar]
  14. Shangmin, W.; Licheng, T.; Weiwei, F.; Tianping, Z.; Xinwei, C.; Changwen, C.; Xingda, L.; Jun, G.; Weidong, L. micro-PPT electro-propulsion system Development and First flight Application. In Proceedings of the 35th International Electric Propulsion Conference Georgia Institute of Technology, Atlanta, GA, USA, 8–12 October 2017; Available online: http://electricrocket.org/IEPC/IEPC_2017_179.pdf (accessed on 21 February 2023).
  15. Kang, B.; Low, K.S.; Soon, J.J.; Tran, Q.V. Single-Switch Quasi-Resonant DC–DC Converter for a Pulsed Plasma Thruster of Satellites. IEEE Trans. Power Electron. 2017, 32, 4503–4513. [Google Scholar] [CrossRef]
  16. Li, Y.H.; Royer, C. Effect of voltage on second-stage electrodes of dual-stage solid propellant pulsed plasma thruster. Vacuum 2019, 167, 103–112. [Google Scholar] [CrossRef]
  17. Nawaz, A.; Albertoni, R.; Auweter-Kurtz, M. Thrust efficiency optimization of the pulsed plasma thruster SIMP-LEX. Acta Astronaut. 2010, 67, 440–448. [Google Scholar] [CrossRef]
  18. Kim, V.; Popov, G.; Arkhipov, B.; Murashko, V.; Gorshkov, O.; Koroteyev, A.; Garkusha, V.; Semenkin, A.; Tverdokhlebov, S. Electric propulsion activity in Russia. In Proceedings of the 27th International Electric Propulsion Conference, Pasadena, CA, USA, 15–19 October 2001. [Google Scholar]
  19. Cassady, R.J.; Hoskins, W.A.; Campbell, M.; Rayburn, C. A micro pulsed plasma thruster (PPT) for the “Dawgstar” spacecraft. In Proceedings of the IEEE Aerospace Conference, Big Sky, MT, USA, 18–25 March 2000; Volume 4, pp. 7–14. [Google Scholar] [CrossRef]
  20. Vondra, R.J. The MIT Lincoln Laboratory Pulsed Plasma Thruster; Massachusetts Inst of Tech Lexington Lincoln Lab, Defense Technical Information Center: Fort Belvoir, VA, USA, 1976. [Google Scholar]
  21. Rezaeiha, A.; Anbarloui, M.; Farshchi, M. Design, development and operation of a laboratory pulsed plasma thruster for the first time in west Asia. Trans. Jpn. Soc. Aeronaut. Space Sci. 2011, 9, 45–50. [Google Scholar] [CrossRef] [Green Version]
  22. An, S.M.; Wu, H.J.; Feng, X.Z.; Liu, W.X. Space flight test of electric thruster system MDT-2A. J. Spacecr. Rocket. 1984, 21, 593. [Google Scholar] [CrossRef]
  23. Ebert, W.; Kowal, S.; Sloan, R. Operational Nova spacecraft teflon pulsed plasma thruster system. In Proceedings of the 25th Joint Propulsion Conference, Monterey, CA, USA, 10–12 July 1989; p. 2497. [Google Scholar]
  24. Rayburn, C.; Campbell, M.; Hoskins, W.; Cassady, R. Development of a micro pulsed plasma thruster for the Dawgstar nanosatellite. In Proceedings of the 36th AIAA/ASME/SAE/ASEE Joint Propulsion Conference and Exhibit, Las Vegas, NV, USA, 24–28 July 2020; American Institute of Aeronautics and Astronautics: Reston, VA, USA, 2020. [Google Scholar]
  25. Zakrzwski, C.; Benson, S.; Sanneman, P.; Hoskins, A. On-orbit testing of the EO-1 pulsed plasma thruster. In Proceedings of the 38th AIAA/ASME/SAE/ASEE Joint Propulsion Conference & Exhibit, Indianapolis, India, 7–10 July 2002; p. 3973. [Google Scholar] [CrossRef]
  26. Simon, D.; Land, B. Instrumentation development for micro pulsed plasma thruster experiments. In Proceedings of the 41st AIAA/ASME/SAE/ASEE Joint Propulsion Conference & Exhibit, Tucson, AZ, USA, 10–13 July 2005; p. 4264. [Google Scholar] [CrossRef]
  27. Schönherr, T.; Komurasaki, K.; Kawashima, R.; Arakawa, Y.; Herdrich, G. Effect of Capacitance on Discharge Behavior of Pulsed Plasma Thruster. J. IAPS 2010, 18, 23–28. [Google Scholar]
  28. Shin, G.H.; Shin, G.S.; Nam, M.R.; Kang, K.I.; Lim, J.T. High Voltage DC-DC Converter of Pulsed Plasma Thruster for Science and Technology Satellite-2 (STSAT-2). In Proceedings of the 2005 International Conference on Power Electronics and Drives Systems, Kuala Lumpur, Malaysia, 28 November–1 December 2005; pp. 926–931. [Google Scholar] [CrossRef]
  29. Schäfer, F.; Montag, C.; Herdrich, G.; Laufer, R.; Santoni, F.; Piergentili, F.; Marzioli, P.; Amadio, D.; Frezza, L.; Dannenmayer, K.; et al. Flight results of the PETRUS pulsed plasma thruster on the 3u CubeSat GreenCube. In Proceedings of the 73rd International Astronautical Congress (IAC), Paris, France, 18–22 September 2022. [Google Scholar]
  30. Montag, C.; Herdrich, G.; Gonzalez Del Amo, J.; Bauer, P.; Feyhl, D. PETRUS 2.0 PPT and its CubeSat-size PPU: Testing and Characterization. In Proceedings of the International Electric Propulsion Conference, Vienna, Austria, 15–20 September 2019. [Google Scholar]
  31. Patel, A.; Frederick, R.A. Overview of Small Satellite Micro-Propulsion Devices, Ground Test Capabilities, and Performance Measurement Techniques. In Proceedings of the 53rd AIAA/SAE/ASEE Joint Propulsion Conference, Atlanta, GA, USA, 10–12 July 2017; p. 4886. [Google Scholar] [CrossRef]
  32. Uezu, J.; Iio, J.; Kamishima, Y.; Takegahara, H.; Wakizono, T.; Sugiki, M. Study on pulsed plasma thruster configuration to expand impulse bit range. In Proceedings of the 29th International Electric Propulsion Conference, Princeton, NJ, USA, 31 October–4 November 2005; Volume 234, pp. 1–12. [Google Scholar]
  33. Jahn, R.G. Physics of Electric Propulsion, 1st ed.; McGraw-Hill Inc.: New York, NY, USA, 1968; Chapter 9. [Google Scholar]
  34. Burton, R.; Wilson, M.; Bushman, S. Energy balance and efficiency of the pulsed plasma thruster. In Proceedings of the 34th AIAA/ASME/SAE/ASEE Joint Propulsion Conference and Exhibit, Cleveland, OH, USA, 13–15 July 1998; p. 3808. [Google Scholar]
  35. Texas Instruments. TMS320F28004x Real-Time Microcontrollers Datasheet; Version January 2023; SPRS945G; Texas Instruments: Dallas, TX, USA, 2023. [Google Scholar]
  36. Texas Instruments. LM5156x 2.2-MHz Wide VIN 65-V Non-Synchronous Boost/SEPIC/Flyback Controller with Dual Random Spread Spectrum; Version January 2021; SNVSBI6; Texas Instruments: Dallas, TX, USA, 2021. [Google Scholar]
  37. Linear Technologies Inc. High Voltage Capacitor Charger Controller with Regulation Datasheet; Version REV D 2017; LT 1217; Linear Technologies Inc.: Milpitas, CA, USA, 2017. [Google Scholar]
  38. Guman, W.J.; Peko, P.E. Solid-propellant pulsed plasma microthruster studies. J. Spacecr. Rocket. 1968, 5, 732–733. [Google Scholar] [CrossRef]
  39. Laperriere, D. Electromechanical Modelling and Open-Loop Control of Parallel-Plate Pulsed Plasma Microthrusters with Applied Magnetic Fields. Worcester Polytechnic Institute. 2005. Available online: https://digital.wpi.edu/concern/etds/n870zq908?locale=en (accessed on 2 February 2023).
  40. Coletti, M.; Guarducci, F.; Gabriel, S.B. A micro PPT for Cubesat application: Design and preliminary experimental results. Acta Astronaut. 2011, 69, 200–208. [Google Scholar] [CrossRef]
  41. Shaw, P.V.; Lappas, V.J. Mathematical Modelling of High Efficiency Pulsed Plasma Thrusters for Microsatellites. In Proceedings of the American Institute of Aeronautics and Astronautics 57th International Astronautical Congress, Valencia, Spain, 2–6 October 2006. [Google Scholar]
  42. Krejci, D.; Seifert, B.; Scharlemann, C. Endurance testing of a pulsed plasma thruster for nanosatellites. Acta Astronaut. 2013, 91, 187–193. [Google Scholar] [CrossRef]
  43. Ciaralli, S.; Coletti, M.; Gabriel, S.B. Results of the qualification test campaign of a Pulsed Plasma Thruster for Cubesat Propulsion (PPTCUP). Acta Astronaut. 2016, 121, 314–322. [Google Scholar] [CrossRef]
  44. Li, H.; Wu, Z.; Sun, G.; Zhu, K.; Huang, T.; Liu, X.; Yeong, W.; Ling, L.; Wang, N. A model for macro-performances applied to low power coaxial pulsed plasma thrusters. Acta Astronaut. 2020, 170, 154–162. [Google Scholar] [CrossRef]
  45. Ziemer, J.K.; Choueiri, E.Y.; Birx, D. Comparing the performance of co-axial and parallel-plate gas-fed PPTs. In Proceedings of the 26th International Electric Propulsion Conference, Kitakyushu, Japan, 17–21 October 1999; IEPC 99-209. Available online: https://alfven.princeton.edu/publications/pdf/ziemer-iepc-1999-209.pdf (accessed on 22 December 2022).
  46. Montag, C.; Burghaus, H.; Herdrich, G.; Schönherr, T. Development of a New Pulsed Plasma Thruster and a Brief Introduction of a Planned Test Facility. In Proceedings of the 67th International Astronautical Congress-IAC-16-C4.4.13.x35105, Guadalajara, Mexico, 26–30 September 2016. [Google Scholar]
  47. Senan, N.A.F. A Brief Introduction to Using ode45 in MATLAB; University of California at Berkeley: Berkeley, CA, USA, 2007. [Google Scholar]
  48. Kang, B.; Low, K.S.; Ng, K.J. Capacitor Charging by Quasi-Resonant Approach for a Pulsed Plasma Thruster in Nano-Satellite. IEEE Trans. Plasma Sci. 2020, 48, 1271–1278. [Google Scholar] [CrossRef]
  49. Tseng, K.C.; Chen, J.Z.; Lin, J.T.; Huang, C.C.; Yen, T.H. High step-up interleaved forward-flyback boost converter with three-winding coupled inductors. IEEE Trans. Power Electron. 2014, 30, 4696–4703. [Google Scholar] [CrossRef]
  50. Hwu, K.I.; Jiang, W.Z. Isolated step-up converter based on flyback converter and charge pumps. IET Power Electron. 2014, 7, 2250–2257. [Google Scholar] [CrossRef]
  51. Erickson, R.W.; Maksimovic, D. Fundamentals of Power Electronics; Springer Science & Business Media: Berlin/Heidelberg, Germany, 2007. [Google Scholar]
  52. Li, Y.H.; Palagiri, S.; Chang, P.; Montag, C.; Herdrich, G. Plasma Behavior in a Solid-Fed Pulsed Plasma Thruster. J. Aeronaut. Astronaut. Aviat. 2019, 51, 31–42. [Google Scholar] [CrossRef]
  53. Keidar, M.; Boyd, I.D.; Antonsen, E.; Spanjers, G.G. Electromagnetic Effects in the Near Field Plume Exhaust of a Micro-Pulsed-Plasma Thruster. J. Propuls. Power 2004, 20, 961–969. [Google Scholar] [CrossRef] [Green Version]
  54. Promislow, C.; Little, J. Operation and Performance of a Power Processing Unit for Inductive Pulsed Plasma Thrusters Operating at High Repetition Rates. IEEE Trans. Plasma Sci. 2022, 50, 3065–3076. [Google Scholar] [CrossRef]
  55. Baddipadiga, B.P.; Strathman, S.; Ferdowsi, M.; Kimball, J.W. A High-Voltage-Gain DC-DC Converter for Powering a Multi-mode Monopropellant-Electrospray Propulsion System in Satellites. In Proceedings of the 2018 IEEE Applied Power Electronics Conference and Exposition (APEC), San Antonio, TX, USA, 4–8 March 2018; pp. 1561–1565. [Google Scholar] [CrossRef]
  56. Quentin, N.; Perrin, R.; Martin, C.; Joubert, C.; Grimaud, L.; Burgos, R.; Boroyevich, D. A Large Input Voltage Range 1 MHz Full Converter with 95% Peak Efficiency for Aircraft Applications. In Proceedings of the PCIM Europe 2016, International Exhibition and Conference for Power Electronics, Intelligent Motion, Renewable Energy and Energy Management, Nuremberg, Germany, 10–12 May 2016; pp. 1–8. [Google Scholar]
Figure 1. Block diagram that outlines the proposed modeling and experimental approaches. The thruster head is first equated to an RLC (resistor, inductor, capacitor) circuit based on its physical properties, radius, length, materials, and energy level. Three different PPU approaches are investigated. A fixed frequency (FF) approach, a critical conduction mode approach (CrCM) using an F28004 microcontroller from Texas Instruments (TI) [35]. Finally, two variable frequency approaches are analyzed using a TIs LM5156 chip [36] and linear technologies LT3751 chip [37]. The PPU connects to the thruster head, to provide a high-voltage discharge current that ablates the PTFE and creates the plasma sheet, as explained above.
Aerospace 10 00540 g001
Figure 2. PETRUS—pulsed electrothermal thruster for the University of Stuttgart. On the left PETRUS 2.0, a 5 J flared coaxial PPT with its anode and cathode visible at the end of the thruster [46]. The prototype to the right is a scaled-up 34 J version, this improved its form factor (volume) by reducing the distances between the capacitor banks and is shown here with the thruster head connected on top.
Aerospace 10 00540 g002
Figure 3. Carlow–Stuttgart coaxial PPT Model. As described in the text, each parameter above is taken into account in this model, in order to accurately predict voltage and current changes in the circuit. The plasma is colored a light pink. The inner cylinder is colored in a beige, which represents the cathode, while the outer cylinder, represented by two blue lines, is the anode. The positive end of the capacitor is connected to the anode. When the igniter initiates a spark, current is then allowed to flow through the plasma from the anode to the cathode. The plasma is seen moving from the propellant, polytetrafluoroethylene (PTFE), towards the open end of the thruster.
Aerospace 10 00540 g003
Figure 4. This diagram represents the equivalent circuit model (ECM) for the capacitor bank and the thruster head connected together.
Aerospace 10 00540 g004
Figure 5. Peak current mode control on the primary winding inductor; when the current limit is reached, a comparator switches an output signal high, which drops the gate signal low, turning the switch off.
Aerospace 10 00540 g005
Figure 6. Oscillations in the drain source voltage ( V D S ) during off time. L l k refers to the leakage inductance and C r is the resonant capacitance, while L p is the primary winding inductance.
Aerospace 10 00540 g006
Figure 7. This figure describes the changes in current and V D S oscillations during turn on and turn off times of the power switch.
Aerospace 10 00540 g007
Figure 8. Mode 1 ( t 0 to t 1 ). The power switch denoted S1 is a MOSFET, STB28NM50N produced by ST. The box connected to the switch represents the CrCM controller, and the coaxial device connected in parallel to the output capacitor represents the coaxial thruster head.
Aerospace 10 00540 g008
Figure 9. Mode 2 ( t 1 to t 2 ).
Aerospace 10 00540 g009
Figure 10. Mode 3 ( t 2 to t 3 ).
Aerospace 10 00540 g010
Figure 11. Mode 4 ( t 3 to t 4 ).
Aerospace 10 00540 g011
Figure 12. The LM5156 controller used to charge a capacitor bank C o . The input voltage range can be determined by a resistor divider to the under-voltage lockout (UVLO) pin. Again, the power switch denoted S 1 is a power MOSFET, part STB28NM50N, produced by ST. The device has a max input of 42 V and min of 5 V. Within the red boxes the soft start capacitor can be seen and is used to slowly start switching and prevent hard switching losses at start up. Additionally, primary side regulation is also achieved using an auxiliary winding of the transformer. A current sense resistor on the drain of the power switch is used to regulate the max current into the primary winding of the transformer. A snubber circuit is used to reduce leakage inductance and improve reliability.
Aerospace 10 00540 g012
Figure 13. The LT3751 used as a capacitor charger. The LT3751 has previously been used for capacitor charging of PPTs [11,29]. Again, the power switch denoted S 1 is a power MOSFET, part STB28NM50N, produced by ST. Similar to the Figure 12, the red boxes show the current sense resistor, the voltage input range resistors and the snubber circuit. The low-level voltage input range is determined by UVLO1, and the high-level is determined by UVLO2 pins. Placing the feedback (FB) pin to ground operates this controller as a capacitor charger.
Aerospace 10 00540 g013
Figure 14. A typical discharge profile with key parameters that are useful for evaluation purposes labeled. For example, the characteristic pulse time helps to determine the acceleration of the plasma sheet. The voltage reversal on the capacitor bank occurs after the initial discharge has occurred, and if too large, it can cause a “crowbar discharge”, as described earlier in the text.
Aerospace 10 00540 g014
Figure 15. A comparison of the developed Carlow–Stuttgart model in red with the PETRUS experimental data in black [30]. It can be observed that after time 4 × 10 6 µs, there is a larger error compared to the initial discharge curve.
Aerospace 10 00540 g015
Figure 16. The different PPU efficiencies and charging times for the various input voltages, where (a,d) correspond to 5 V, (b,e) to 12 V, and (c,f) to 24 V. Moreover, the different charging techniques previously discussed are shown: a variable frequency (VF) using the LT3751, denoted VF: LT3751 in black, and LM5156 denoted VF: LM5156 in green and CrCM in red. As the input voltage increases, it can be observed that the efficiency also increases for all of the methods of capacitor charging. The time decreases as the input voltage increases.
Aerospace 10 00540 g016
Table 1. A list of pulsed plasma thrusters.
PPTESU, JIsp, sThrust Efficiency %
Add Simplex [17]68270030
Busek MPACS [1]2.258278.4
Zond 2 [4,18]504108
LES-6 [19]1.853002
SMS [19]8.44503.7
LES 8/9 [19]2010007.4
MIT Lab [20]206006.6
Japan Lab [21]30.44233.2
MDT-2A [22]42802
NOVA-1  [23]205405.3
Millipound [20]750121017
Primex NASA Breadboard [24]2011369.8
Mighty-Sat [19]4011509.8
EO-1 min [25]8.56787.6
Micro APPT-Series [26]3.8–8.41140–180014–40
SIMP-LEX [27]68180012
STSAT-2 [28]4.28002.3
VELOX-3 [11]2.25700–15008
PETRUS 1J [29]17247.8
PETRUS 5J [30]58528.9
IL-PPT-3 Lab [31]7.56005
Dawgstar [19]5.234839
PPT-B20 [32]3.389607.9
Clyde Space [12]25905
UW [10]18.1120022.5
Table 2. Typical target requirements for a capacitor charger for a small PPT.
ParameterRequirement
Input Voltage, V i n 5–24
Output Power, W≤20
Max Switching FrequencyVariable
Output Voltage, V 0 1–1.6 kV
CostLow
PPU Efficiency>70%
SizeSmall (PC104)
EMI CompatibilitySpace Grade
Safety RequirementsHigh Voltage
Charge Time (upper limit)<1 s
Table 3. Values used for the Carlow–Stuttgart model, which is an equivalent circuit for the PPT head.
VariableValue
Initial Voltage V 0 , V 1600
Capacitance, μF1–6
Ablation mass, µg9.5
Ion Plasma Density, m−3 8 × 10 20
Plasma Temperature, eV2
Inner Radius, mm3
Outer Radius, mm12
Length, mm50
Pulse time, μs2
Circuit Inductance, nH130
Circuit Resistance, mΩ100
Disclaimer/Publisher’s Note: The statements, opinions and data contained in all publications are solely those of the individual author(s) and contributor(s) and not of MDPI and/or the editor(s). MDPI and/or the editor(s) disclaim responsibility for any injury to people or property resulting from any ideas, methods, instructions or products referred to in the content.

