1. Introduction
In the last few years, for a fast and reliable point-to-point connection or intercity flight and in order to solve the runway congestion problem, the runway-independent aircraft concept has become increasingly prominent in civil aviation. Moreover, the market prospects predict an increasing demand for disc-rotor technologies in the civil field: business flights, air medical, search and rescue applications, and others.
Multirotors are gaining great importance in the layout of innovative mobility: until now, unmanned aerial vehicles (UAVs) and, in general, electric aerial vehicles have mostly been used for surveillance, system maintenance, monitoring, and recreational purposes. The possibility of extending multirotor technologies to human and cargo transportation in the urban environment has led to a revolution in the way we view the third dimension. This possibility will presumably represent a new disruptive airborne technology [
1]. The Vertical Flight Society (VFS), the world’s leading non-profit organization working to advance vertical flight, has recently announced [
2] that the number of electric vertical takeoff and landing (eVTOL) aircraft concepts being tracked in its World eVTOL Aircraft Directory has reached 600 designs from nearly 350 companies worldwide. In this framework, several companies are developing electrical vertical take-off aircraft (eVTOL) that are equipped with different propeller configurations.
A multirotor is a rotorcraft with more than two lift-generating rotors. Unlike single helicopters, which use complex variable pitch rotors whose pitch varies as the blade rotates for flight stability and control, multirotors often use fixed-pitch blades. Control of vehicle motion is achieved by varying the relative speed of each rotor to change the thrust and torque produced by each [
3,
4,
5,
6].
Due to its inherently good performance, the coaxial propeller configuration has been used for many years for fixed-wing aircraft [
7]. The coaxial propellers’ main goal should be to increase efficiency, which leads to a power-saving triggered by the possibility of decreasing the rotational induction associated with the motion of the propeller [
8,
9,
10,
11,
12]. This technology has been widely implemented and adapted for rotor-based aircraft such as helicopters and more recently for drones and, in general, UAVs [
13,
14]. The employment of counter-rotating propellers was recently evaluated for an octocopter drone application in [
15]. Additionally, the possibility to use partial overlapping propellers has been studied [
16]. In general, the problem of the coaxial or (partial) overlapping propellers is their noise. In the last few years, the prediction of propeller acoustics has become increasingly important because of the more and more stringent aircraft noise requirements. However, aeroacoustic simulations historically have relatively simple flow field models and approximations. Because of that, several works have been developed recently to both predict propellers’ noise [
17,
18,
19] and enhance their design [
20]. A common issue with these methods is their validation. A few experimental data are available in the literature for these applications. This work is also intended to provide an experimental database for future methods development and validation.
Over the past few years, several unmanned aerial vehicles have been oriented to an increasing spectrum of end-users thanks to the possibility of having smaller, lighter, and quieter systems capable of operating in highly congested areas without compromising on the hovering, take-off, and landing abilities.
The main scope of this work consists of the analysis of both thrust and noise performances of a scaled model of counter-rotating coaxial propellers as the distance between the propellers varies. The two propellers’ performance parameters taken into account are the thrust (measured in kg) and the noise level (measured as A-weight equivalent continuous sound level
). The thrust is able to define the lifting ability of the configuration, while the
has been selected to estimate the environmental impact of the configuration [
21,
22,
23,
24].
The tests were carried out on two different configurations: both propellers were tested in isolated conditions to provide a reference as well as in a coaxial counter-rotating flow to perform the test of actual interest. The experimentally obtained thrust has been also compared with numerical results with satisfactory agreement.
2. The Experimental Setup: From Concept to Implementation
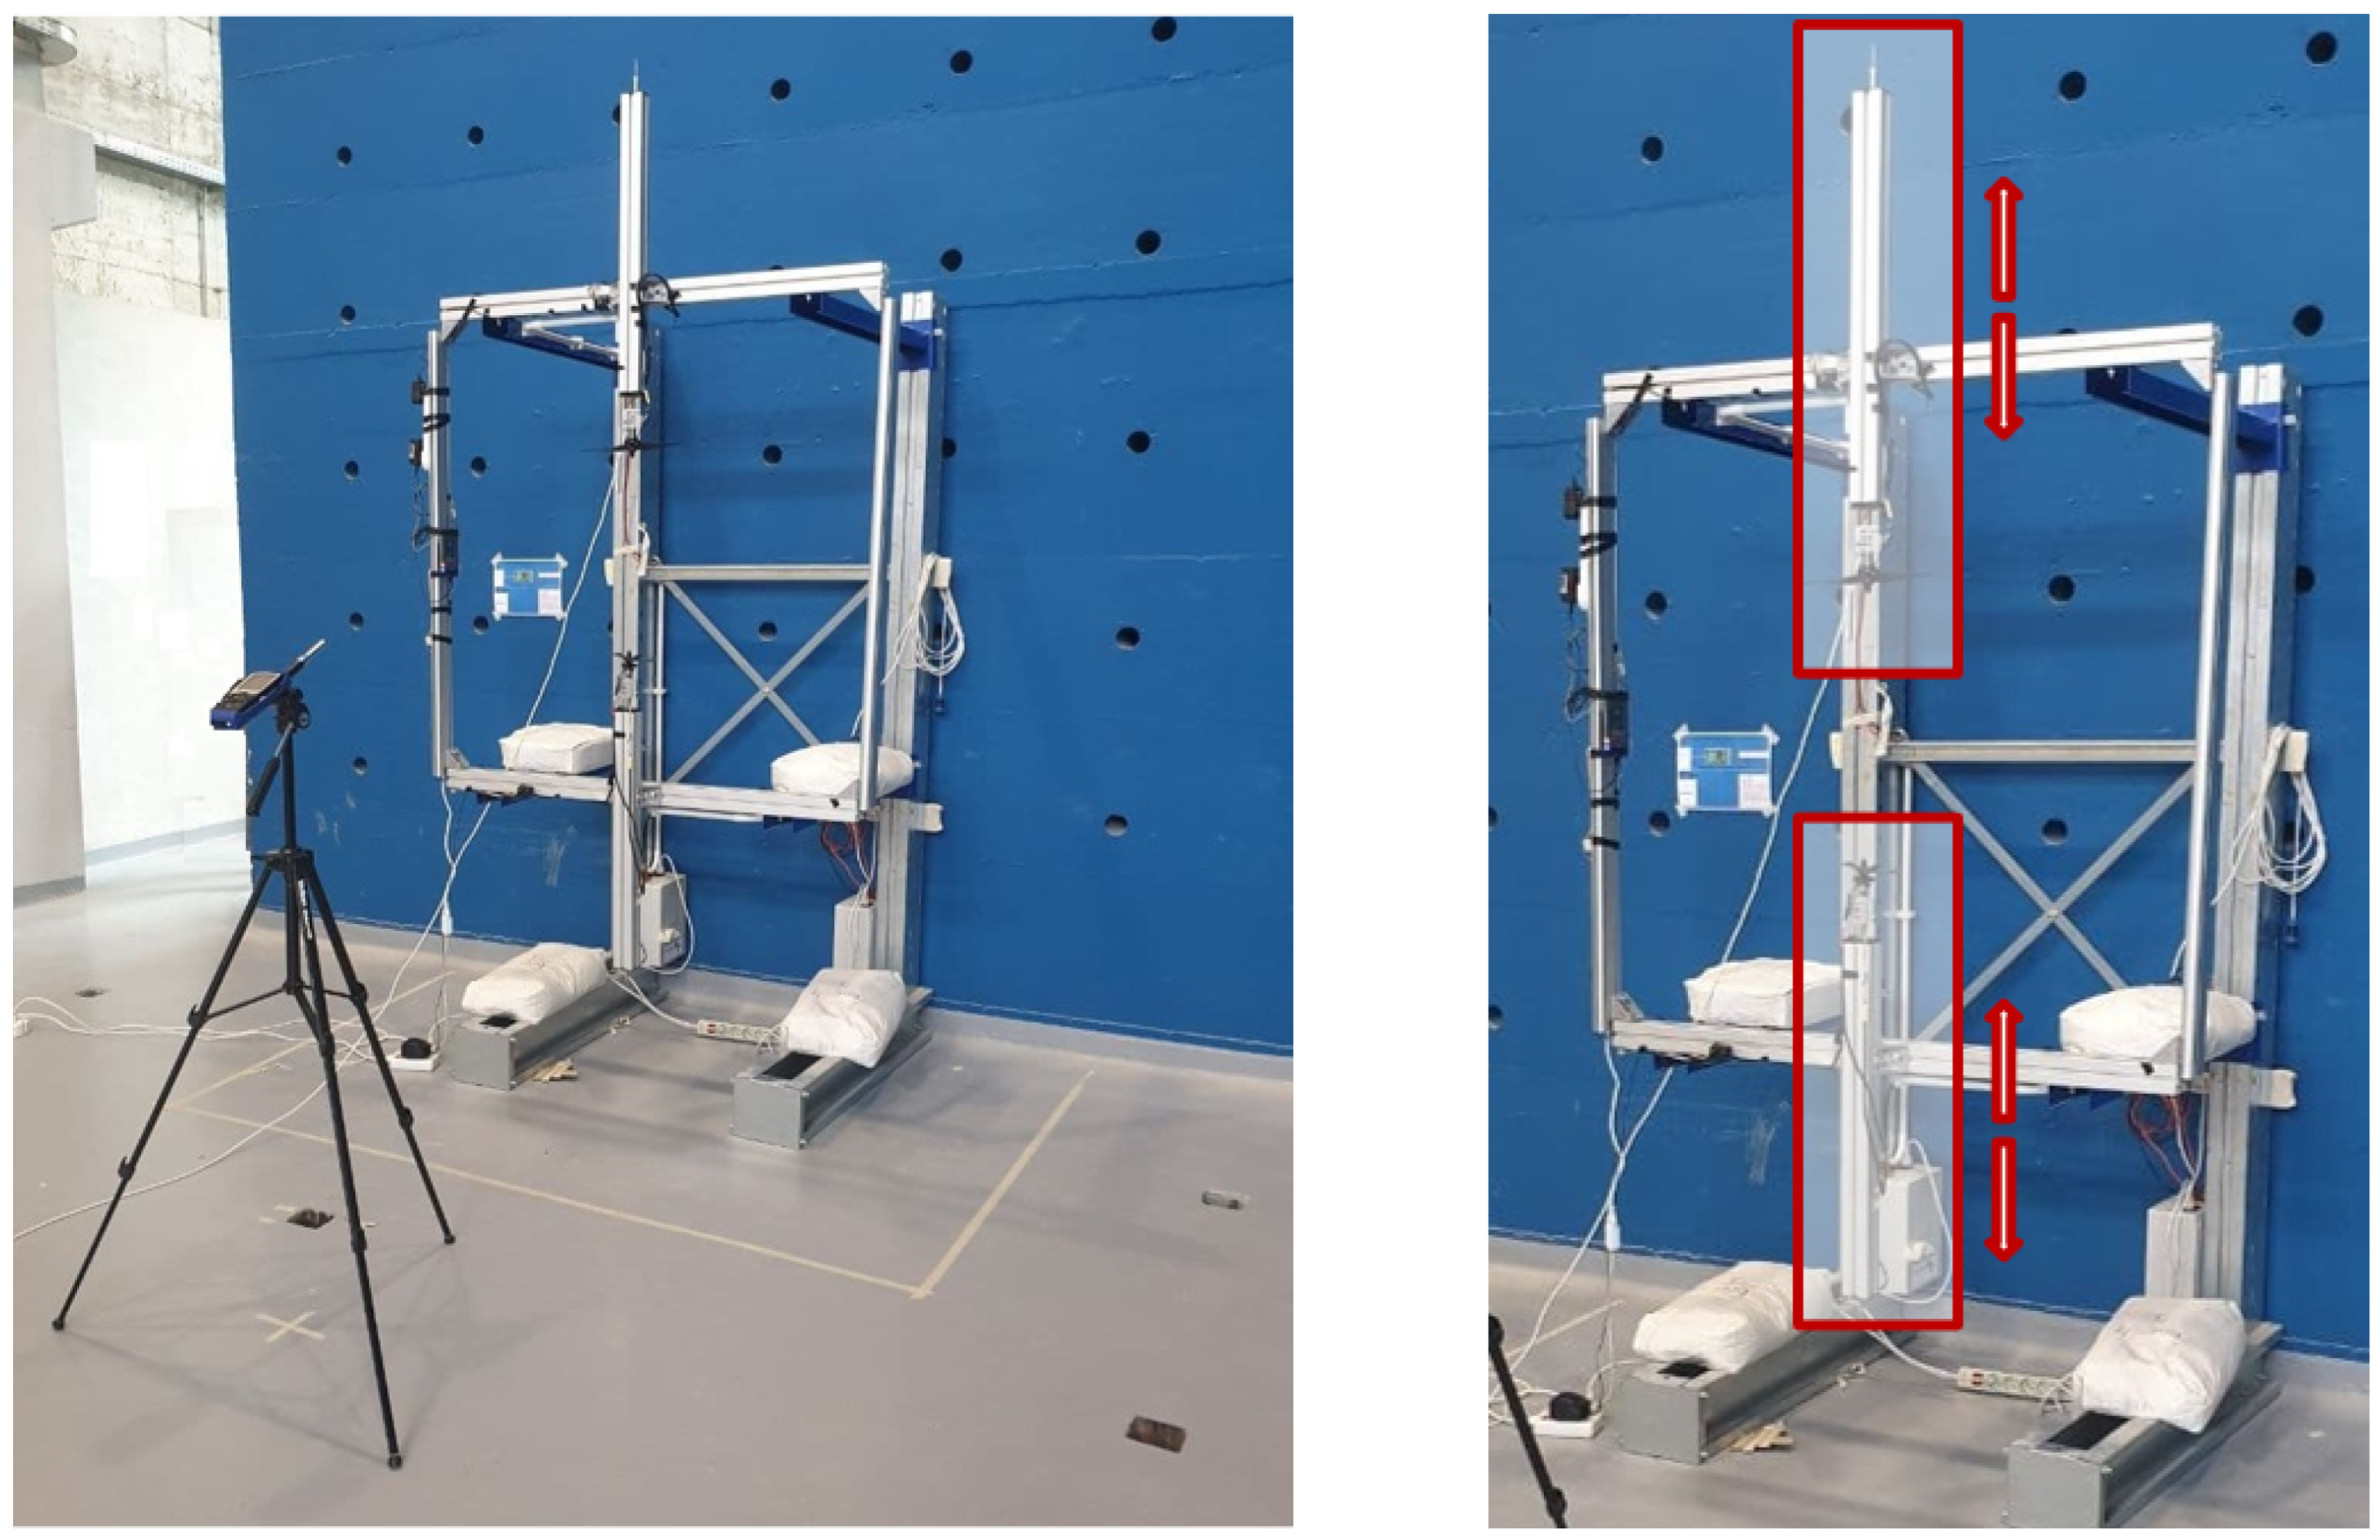
A dedicated test facility was designed based on the possibility of both changing the distance between the two propellers as well as evaluating their optimum position with respect to the ground. The structure was designed to place all the necessary electronics for the load cell acquisition system, the angular velocity controller, and the power supply for the two independent lines. An overview of the experimental setup is shown in
Figure 1.
In more detail, the testing facility was designed by adapting a metallic shelving unit with cantilever supports stabilized by the weight of the horizontal shelves. Employing some angular support, a vertical component, perpendicular to the ground, allows the propeller axial motion and centering. The position of the cantilever rack can be modified by selecting one of the multiple positions available on the structural external components: by applying this logic, it is possible to tune the distance between the propeller in both a coarse and precise way by varying, respectively, the position of the cantilever component and the position of the axial arm. The support structure consists of a cantilever rack, comprised of 4 single-side columns, 4800 mm arms, and accessories like caps and pins. Two vertical rods are intended to support the engines, the load cells, and the propellers. In particular, a couple of aluminum L-shaped rods 60 × 60 mm with a groove of 10, type B, 1300 mm long, and a couple of aluminum L-shaped rods 60 × 60 mm with a groove of 10, type B, 750 mm long were used.
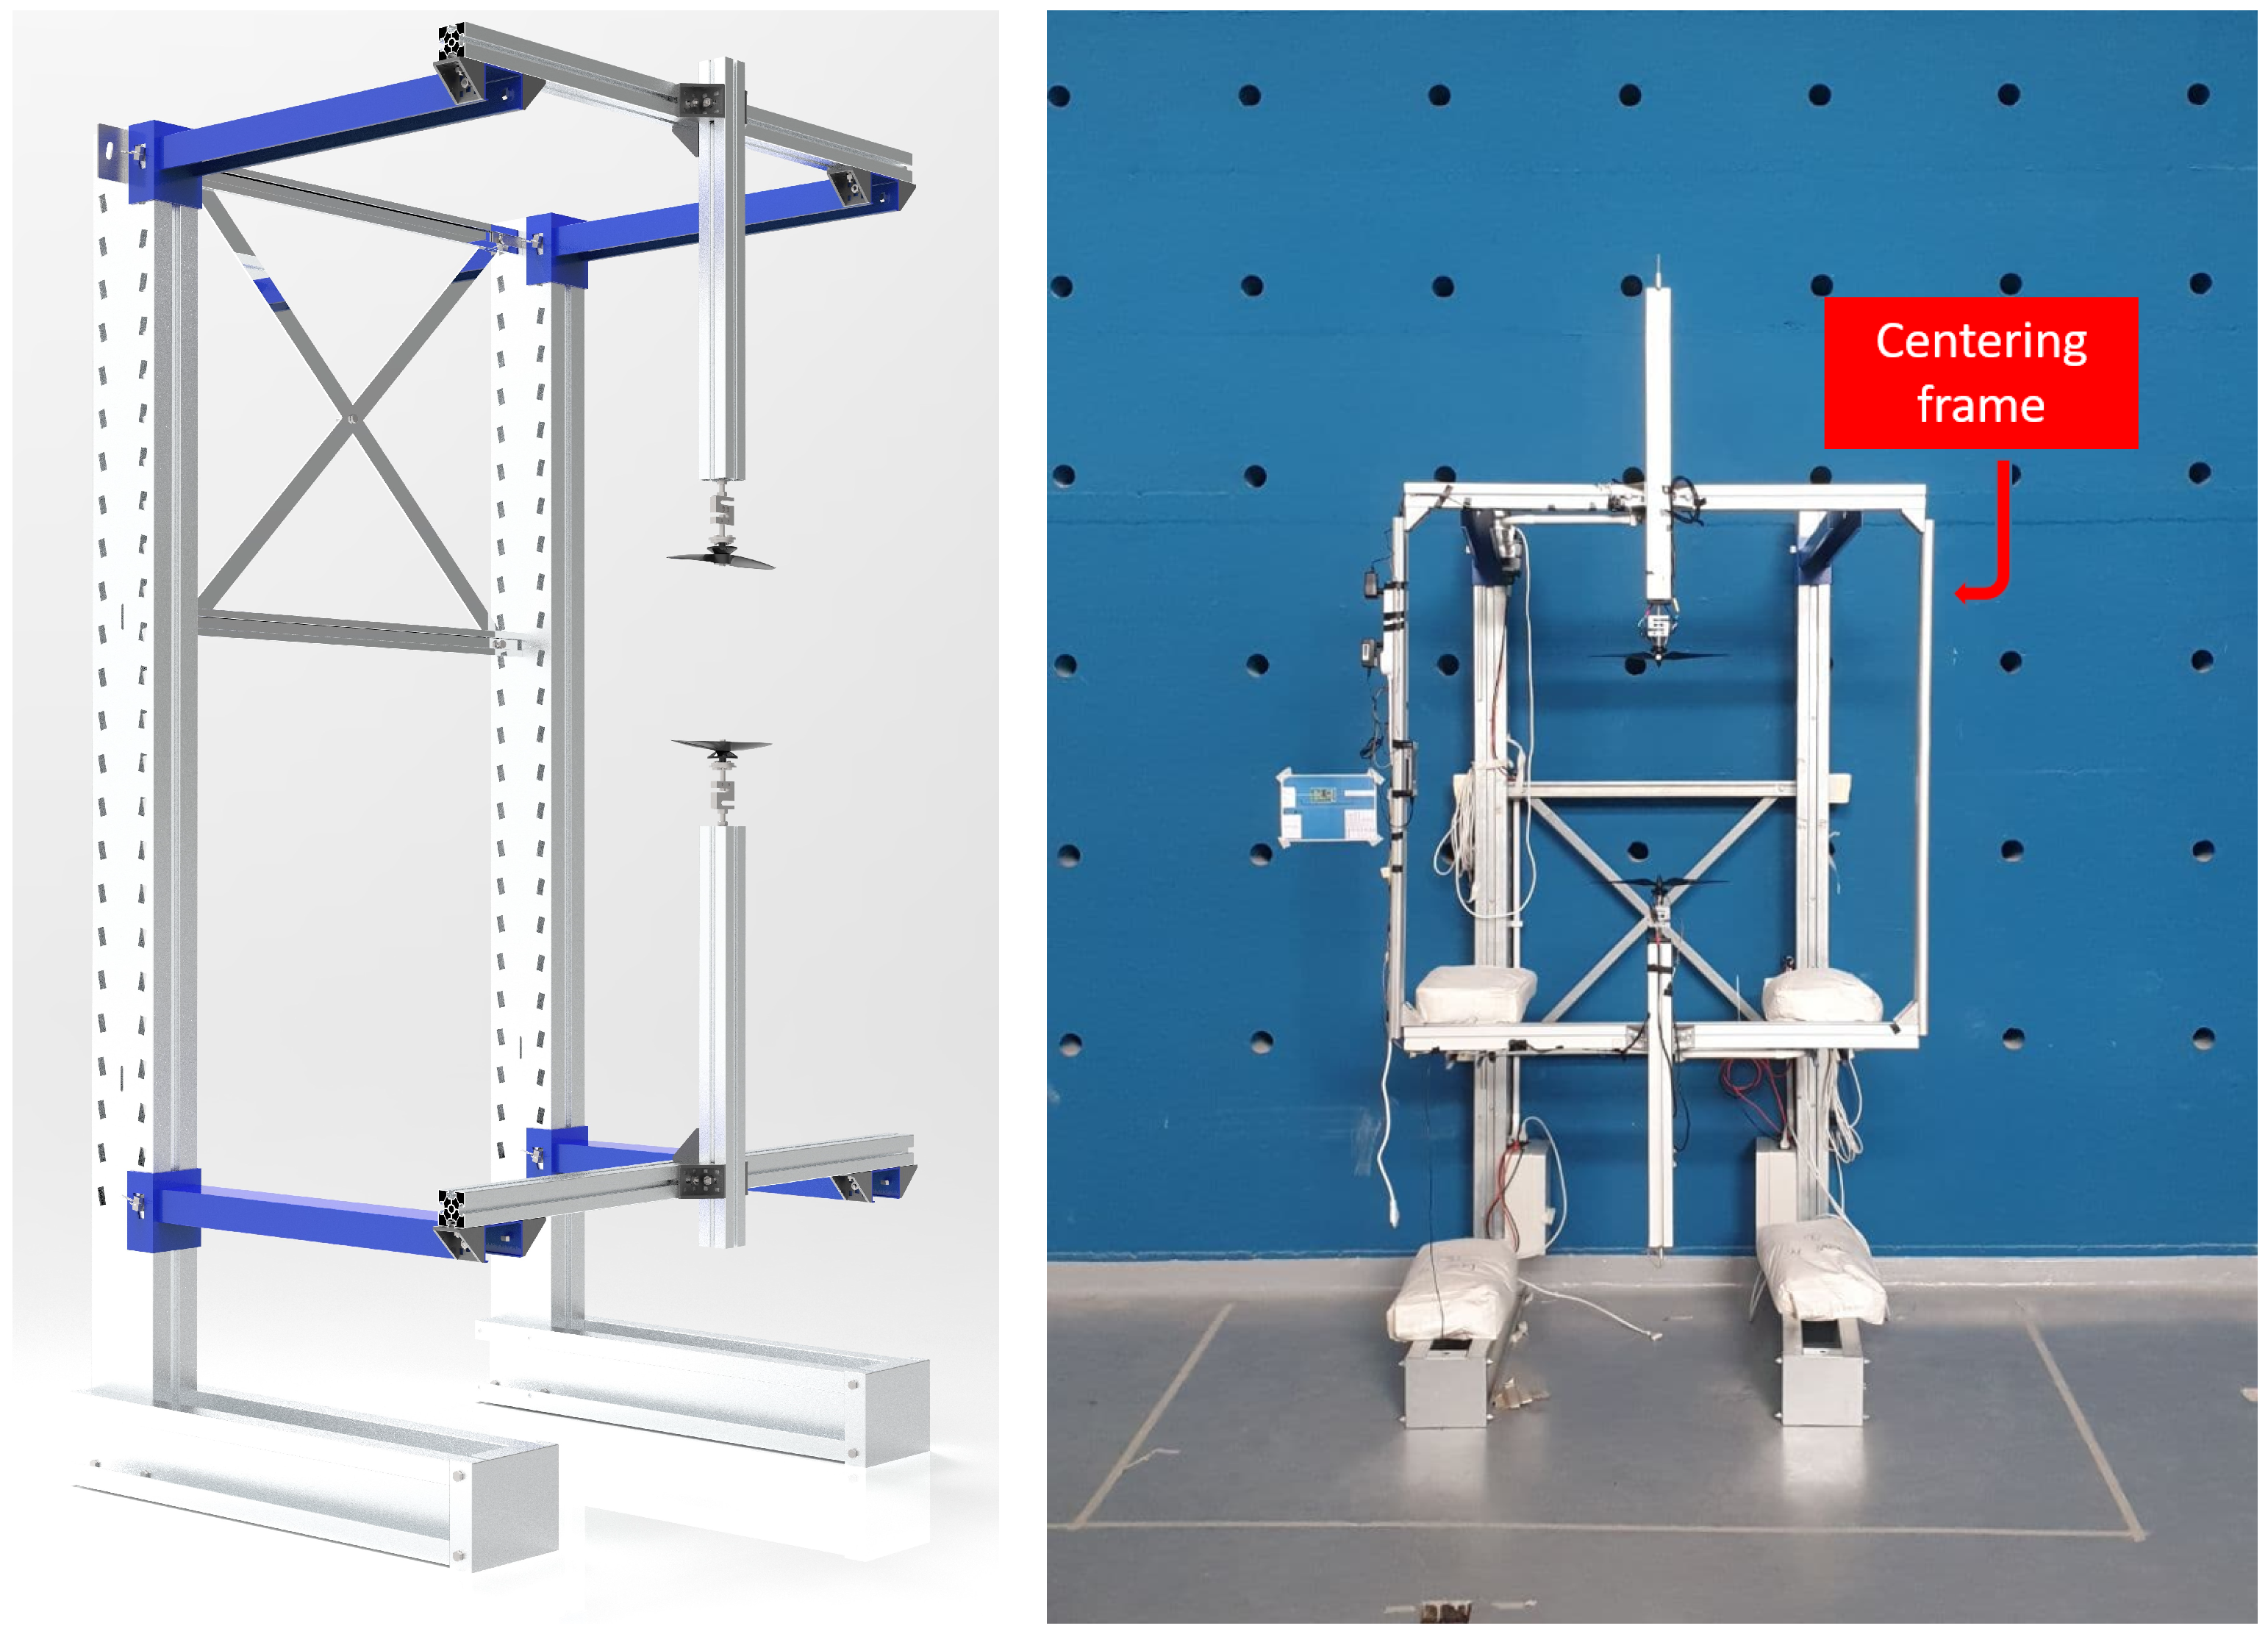
It is important to note that the blue arms are allowed to slide vertically to reach an appropriate distance from the ground and a proper spacing between the two propellers. By changing the position of the cantilever arms, a coarse trim can be performed. The correct placing of the arm is guaranteed by means of a rigid pin secured with a split pin. The overall structure, able to provide a coarse position trimming of the propellers, is shown in
Figure 2. For a more accurate separation, two horizontal supports were positioned on the cantilever arms and secured to the horizontal supports with two angular connecting staffs.
Figure 2 shows the rig in its final theoretical configuration.
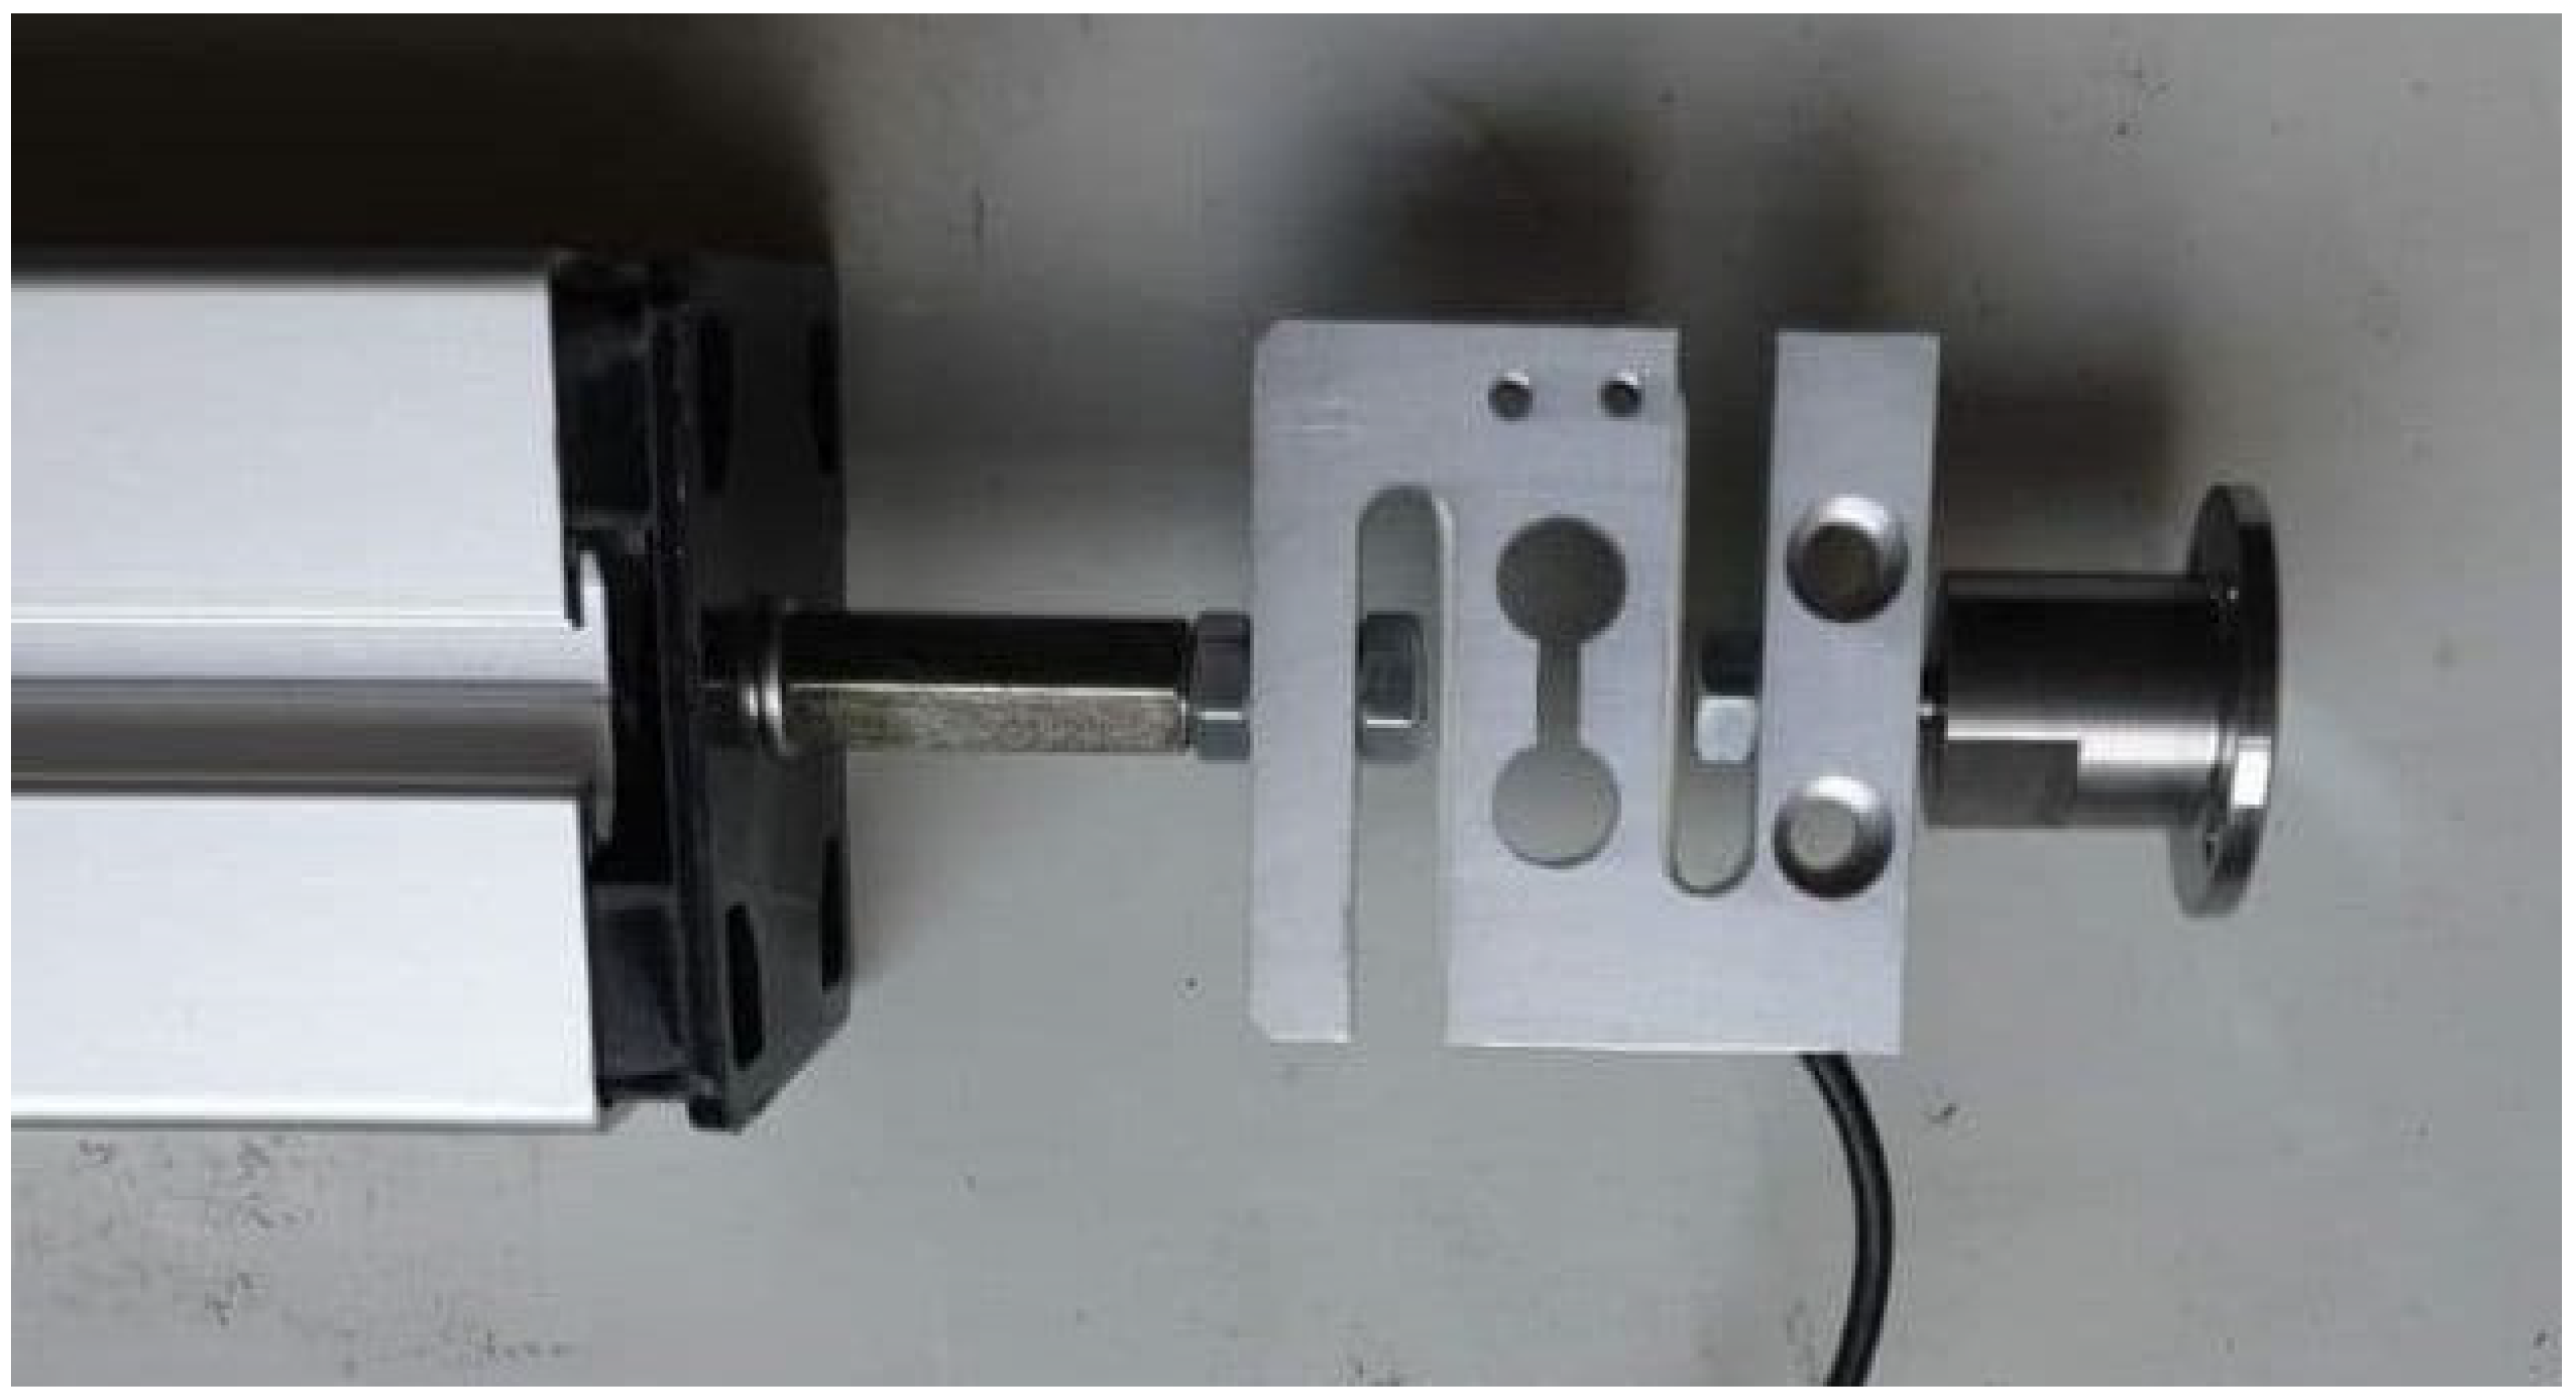
Another set of two additional components was added to secure axial centering of the propellers. The most critical component of the system is represented by the vertical movable arm that has been realized by integrating the grooved component with a 50 kg traction and compression load cell and a metallic interface directly connected with the electric motor. The load cells were centered by means of a 3D printed component in which an M6 threaded rod was adjusted.
The above-mentioned configuration provides a good centering of the threaded rod, which is screwed into the M6 load cell threaded hole. The metallic component shown on the right side of
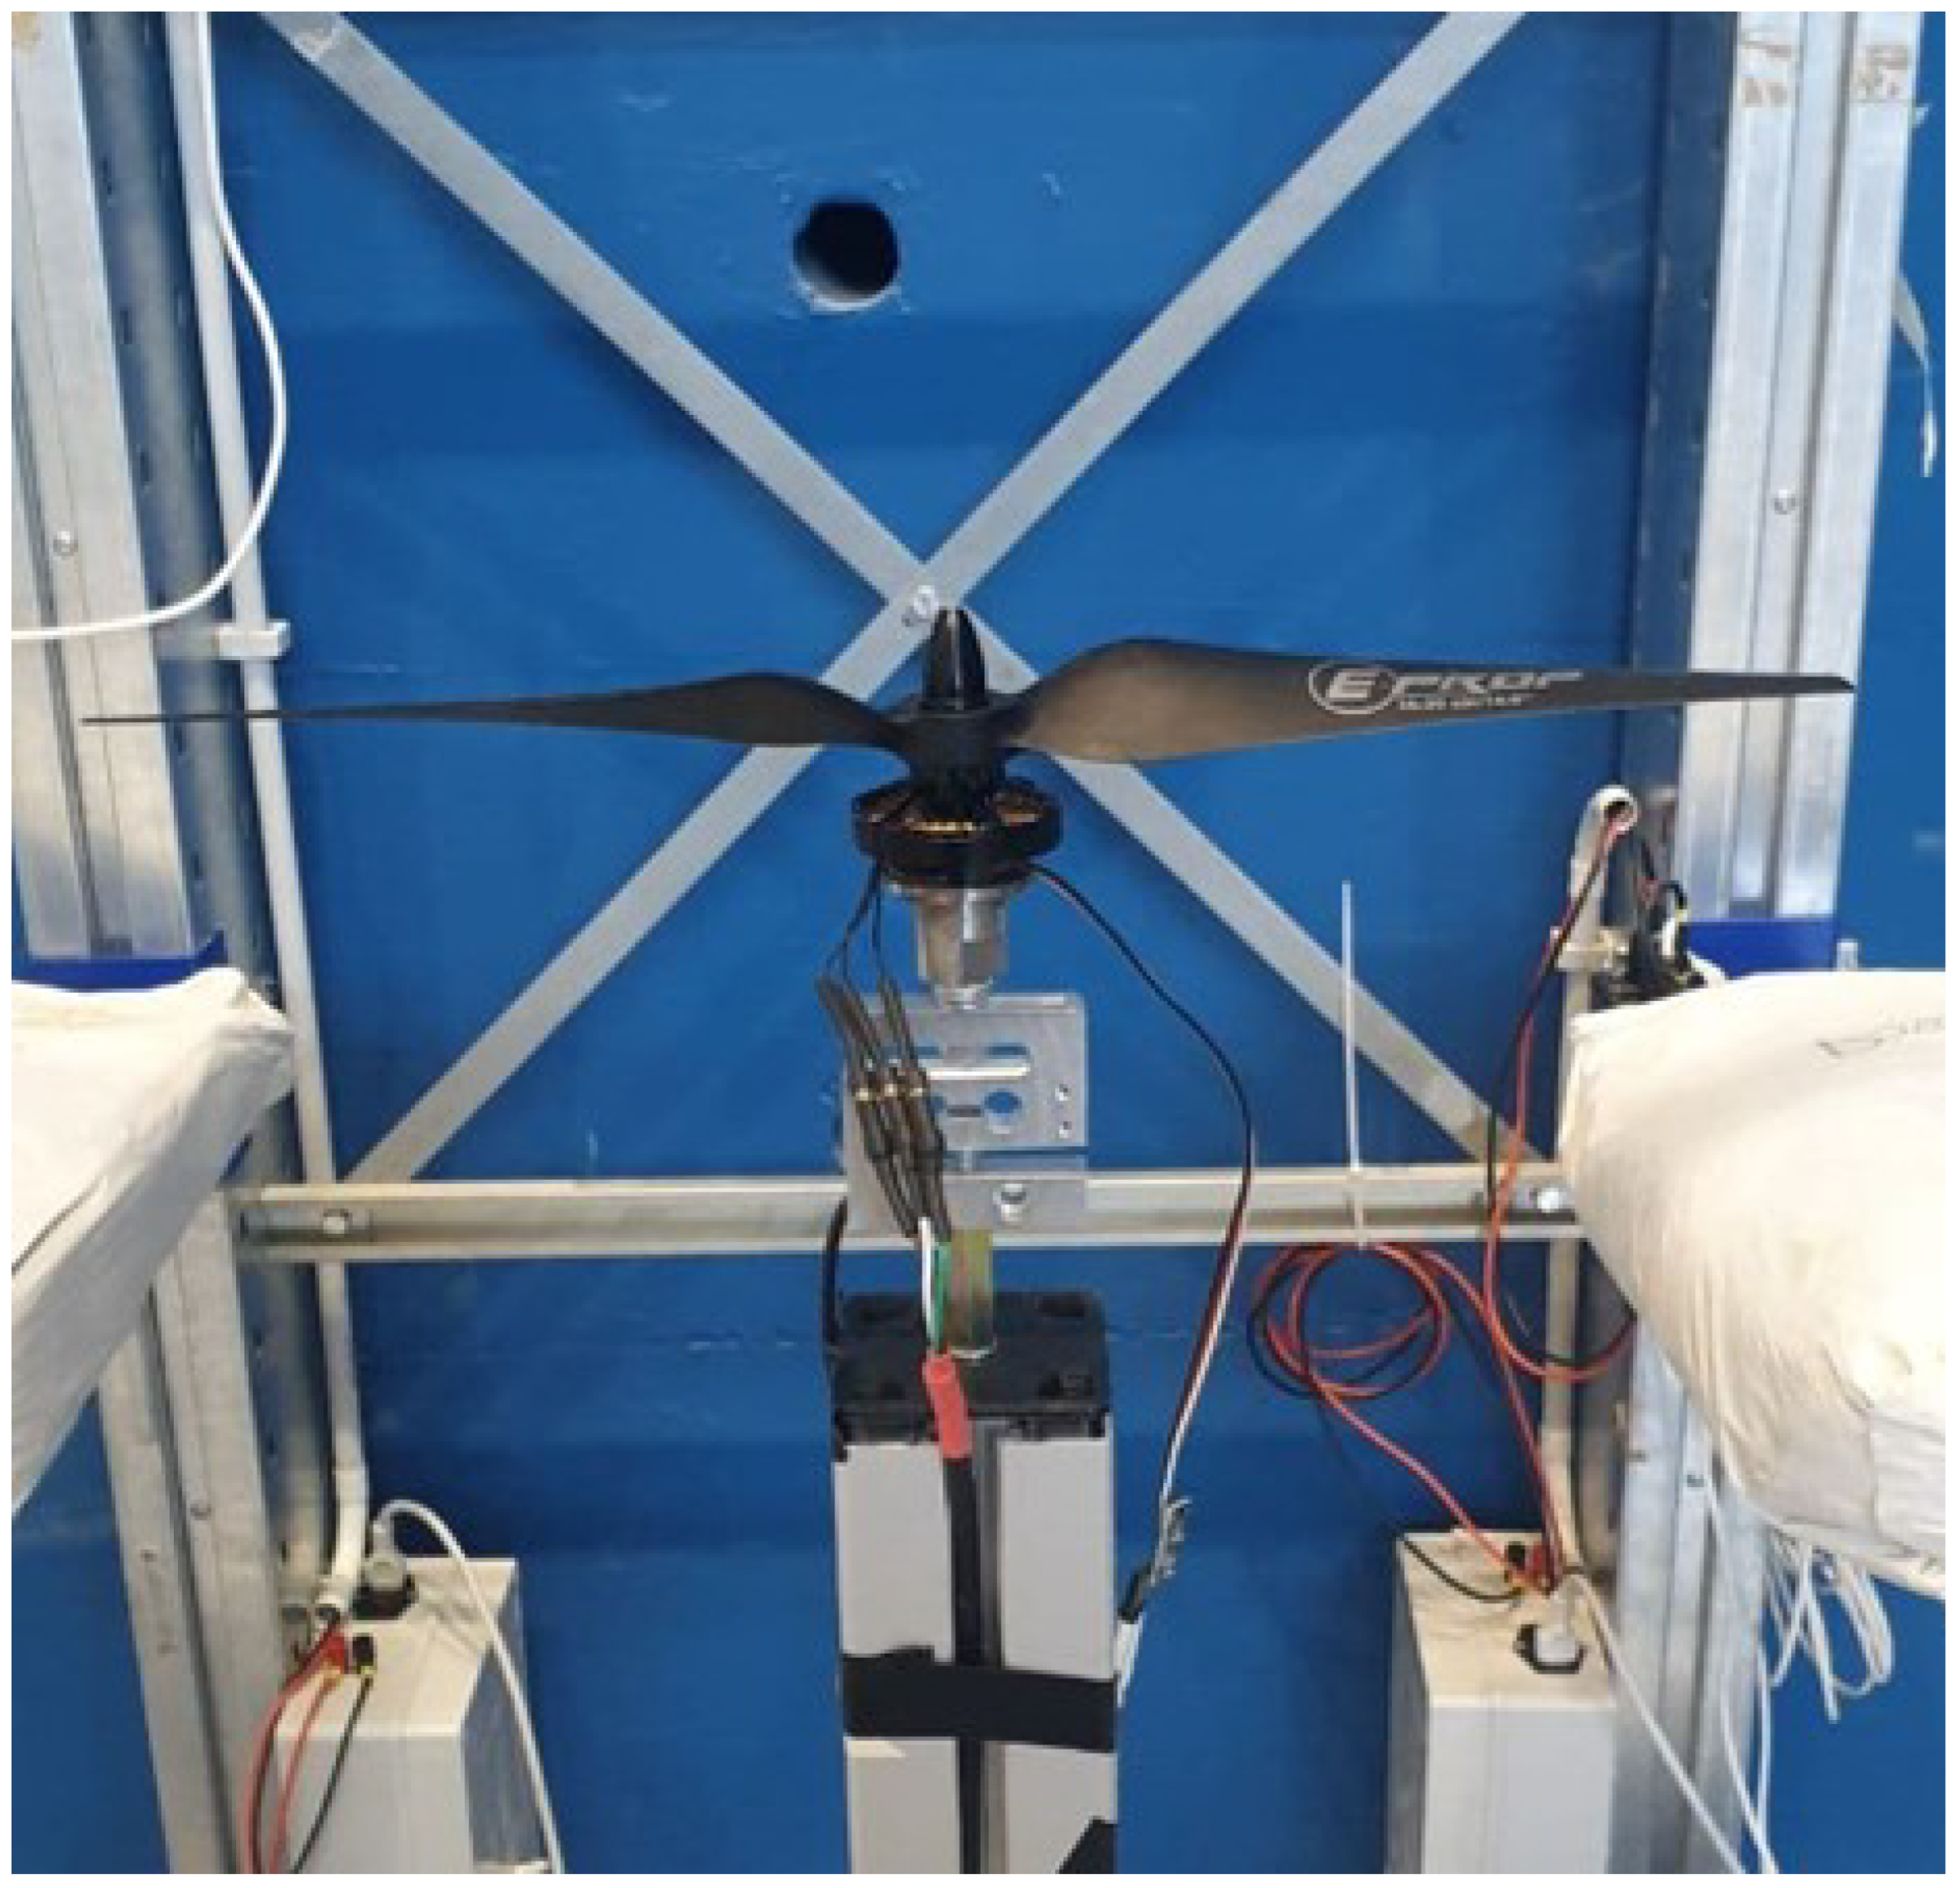
Figure 3 is the electric motor support, whose threaded stem was designed to be coupled directly to the load cell. Also, the overall vertical arm assembly is shown. A brushless motor rigidly mounted on the T-motor support completes the test facility shown in
Figure 4.
The whole system does, therefore, consist of all the mechanical components listed previously as well as a brushless motor that is mounted rigidly on the T-motor support. An essential part of the experimental setup is represented by the electronic system. It is important to note that several different sub-systems are integrated to control the propellers, allow the propellers’ angular speed modification, measure the thrust generated by the propellers, and evaluate the noise produced by the whole system. To better characterize the electronics, every single component is described separately with its software and hardware implications.
2.1. The Propeller Angular Velocity Control System
One of the main purposes of experimental testing is the evaluation of the thrust of the propellers as a function of the angular velocity of the propellers themselves. To perform this task, an rpm control system has been developed to provide a good level of control for the two independent lines. The main scope of the control system includes the supply of the T-motors, the regulation of their angular velocity concerning the target value provided with the handheld controller, and the visualization of both the target value and the actual one.
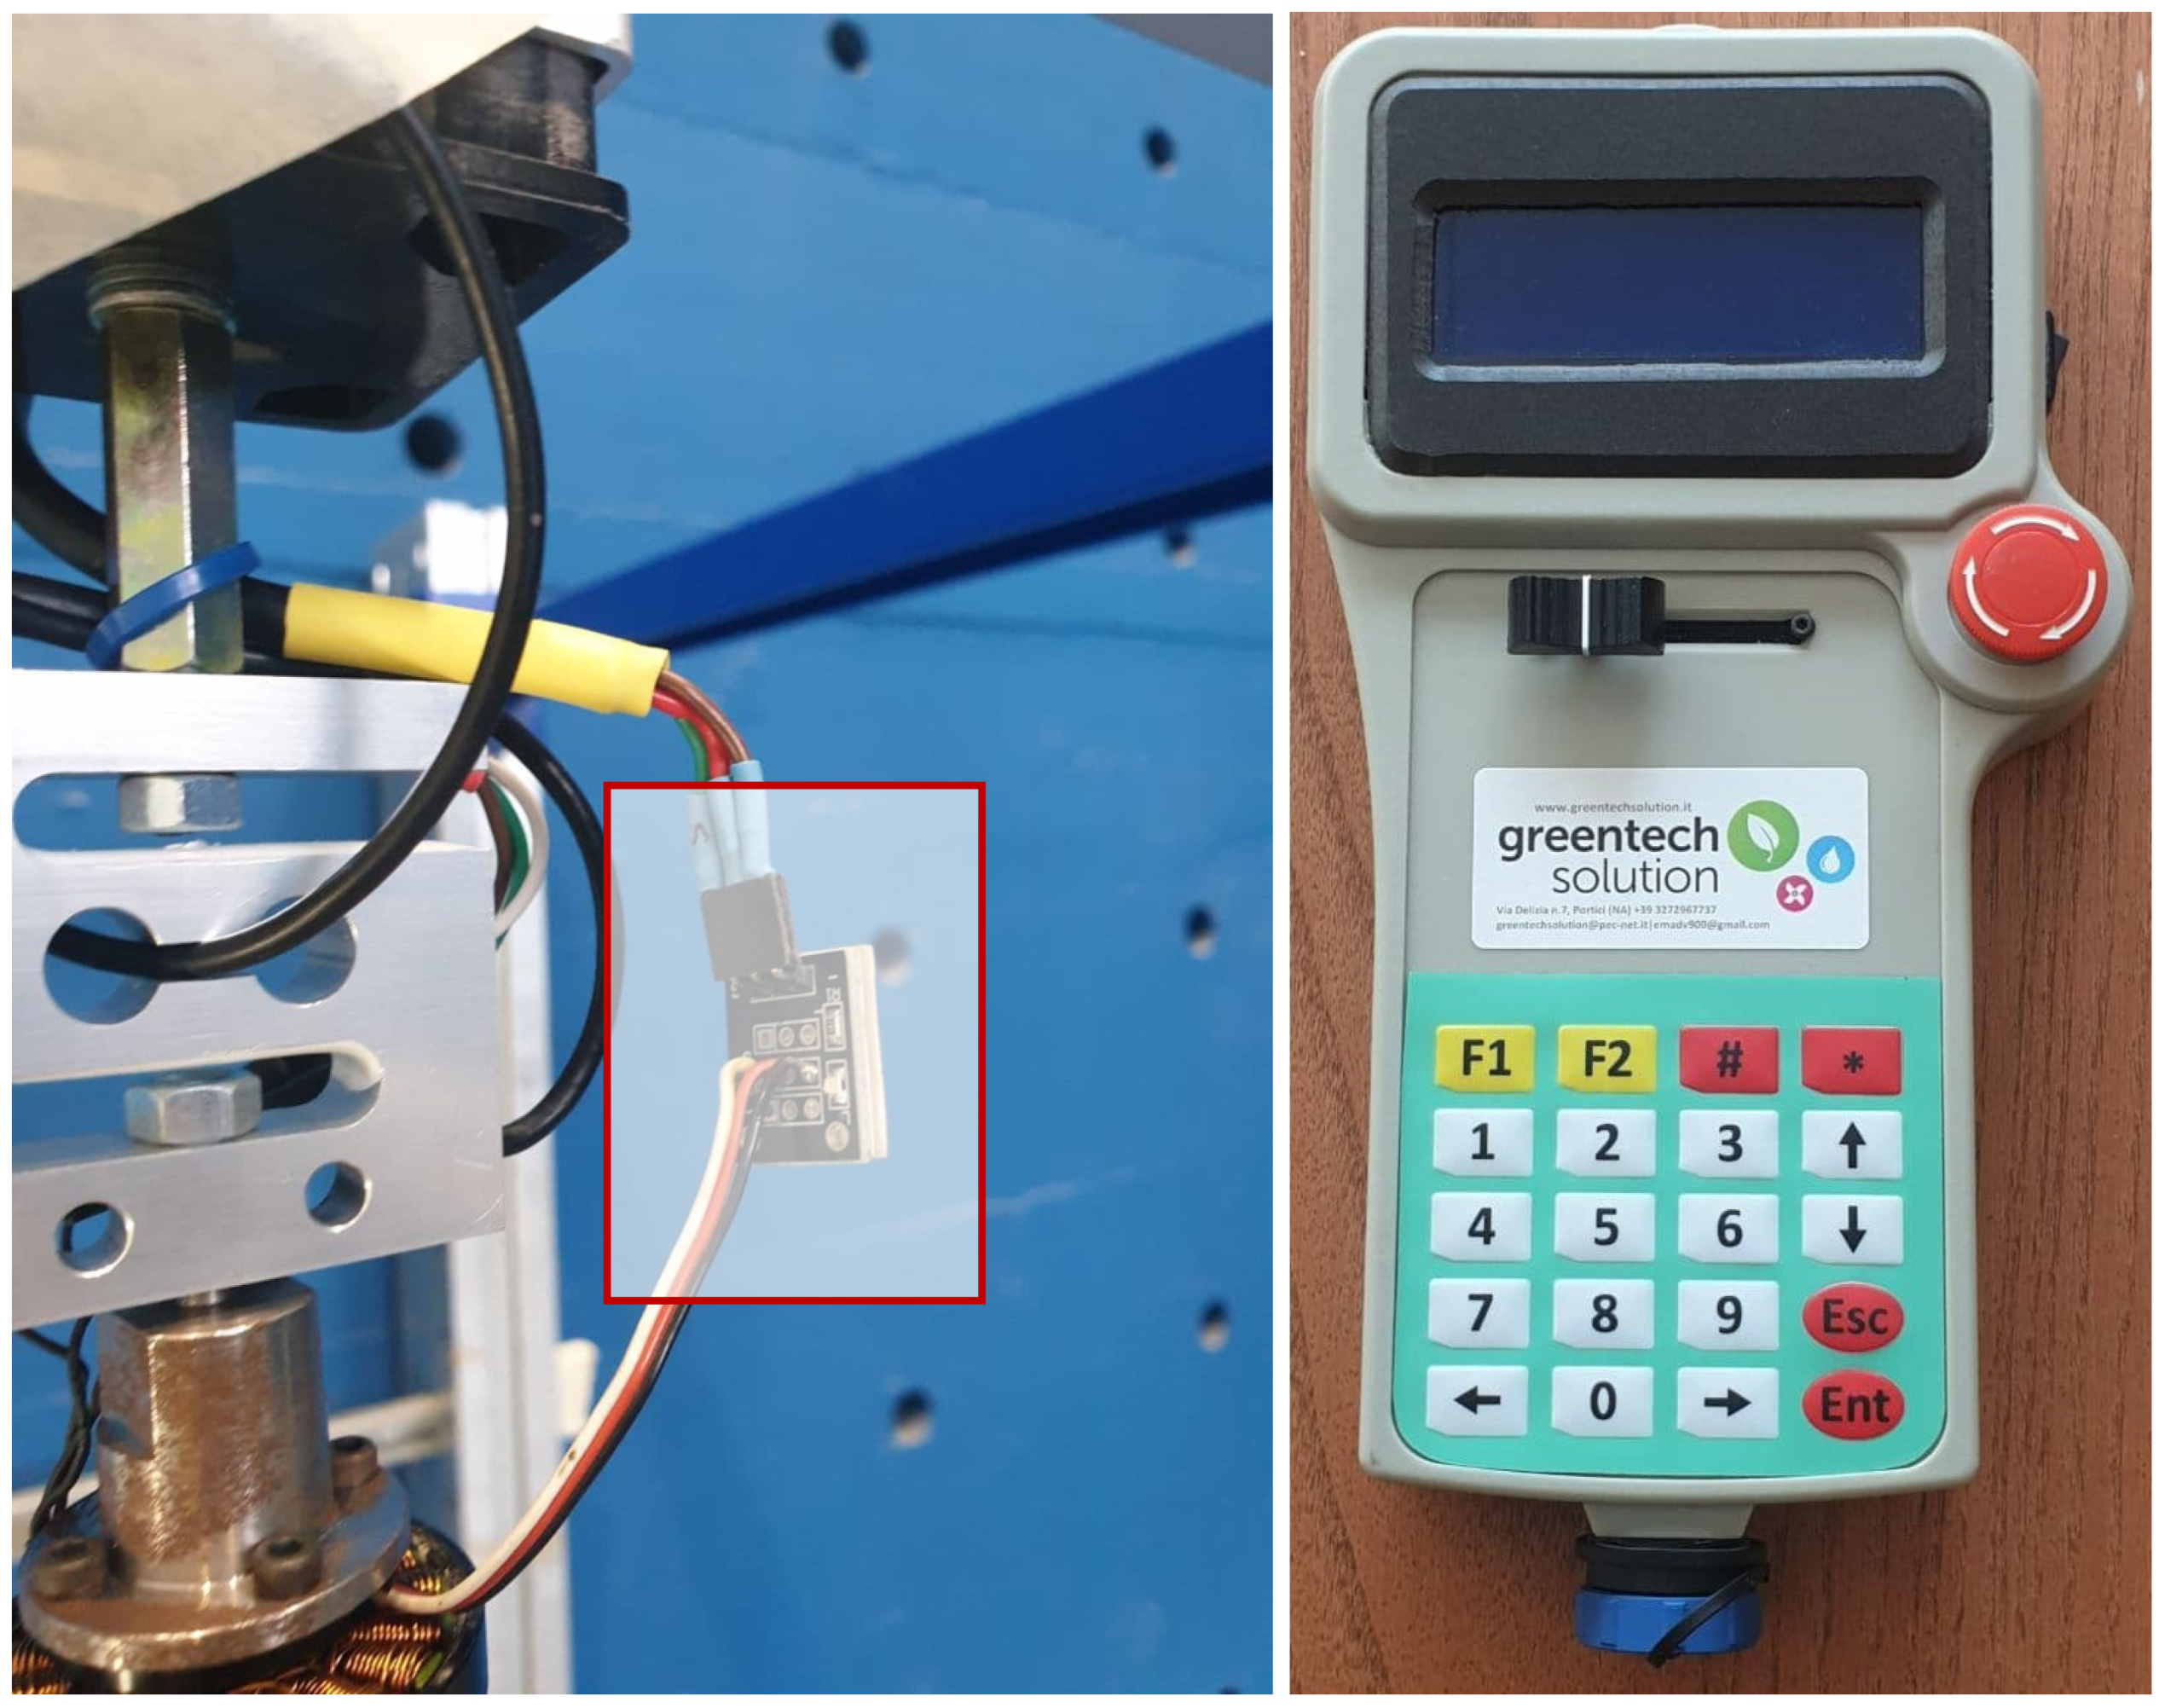
The control system implements a closed-ring logic to the rotational speed of the two propellers: two independent generators of a pulse wave modulation (PWM) signal that is later fed to the two electronic speed controllers (ESC). The ESC regulates the power supply to the motors and, as a consequence, the angular velocity of the motor itself. The actual value of the angular velocity is measured with a magnetic Hall sensor; the difference between the programmed rpm value and the actual value is then calculated by a correction controller that imposes an acceleration/deceleration up to the stabilization of the angular velocity. The
Figure 5 shows the sensor and control system.
Two 400 kV Specs brushless T-motors were deployed to provide the propellers’ motion. This kind of motor is particularly indicated for drone application since it provides good thrust without compromising on its weight (53 g). This motor, specific for 15–18 propellers, it has an internal resistance of 452 mΩ and a maximum continuous power of 216 W [
25].
2.2. The Load Cell Acquisition System
The load cell acquisition system was designed to operate with National Instruments (NI) products: LabVIEW software and NI myRIO-1900 were deployed as, respectively, the programming environment and the hardware. The myRIO board was connected to the load cell, which provides an analog signal within a range of mV.
The 50 kg bidirectional load cell consists of an aluminum s-shaped load cell; it is designed to work with both traction and compression loads. The supply tension is in the range of 9–12 V, and its nominal sensitivity is 2.0 ± 0.1 mV/V. The cell is reported to be particularly indicated for suspended loads. Due to the operating range, a signal digitizer was necessary: the HX711 board, supplied with an external source, was used [
26]. This precision 24-bit analog-to-digital converter, designed for weighing scales and widely used in industrial applications, features two differential input channels and an active low noise PGA with a selectable gain of 32, 64, and 128. Since the operating supply voltage range is 2.6–5.5 V, it can be easily fed via the myRIO-1900 output port. This component interfaces directly with the myRIO-1900 and provides both data and clock measurement [
27].
The load cell acquisition system was also developed in its software part. The programming environment choice is LabVIEW. The interface with the digitizer was originally intended for Arduino applications, and the myRIO and a control panel were employed for easy management of data acquisition.
3. Test Results
The performances of the two propellers were experimentally evaluated in the case of isolated and coupled functioning. Additionally, their noise characterization was performed. The investigation was conducted at different angular speeds. The current section summarizes the results of the thrust and noise characteristics for both the isolated and coupled conditions.
3.1. Isolated Propeller and T-Motor Characterization
Before proceeding with the two-propeller system, an isolated propeller thrust characterization was performed by considering just one active propeller at a time. The obtained results were used to implement an XROTOR numerical model.
The noise characterization was conducted in two different experimental conditions: T-motor and T-motor + propeller run at the same angular velocity. Both tests have been conducted by measuring the thrust generated by the propeller over a 30 s period starting from the reach of the steady state. Note that, from the controller logic point of view, the steady state condition was reached when the actual velocity of the propeller corresponded with the target velocity ± 60 rpm. This condition was named the governor lock-ok condition.
3.1.1. Single Propeller Thrust Evaluation
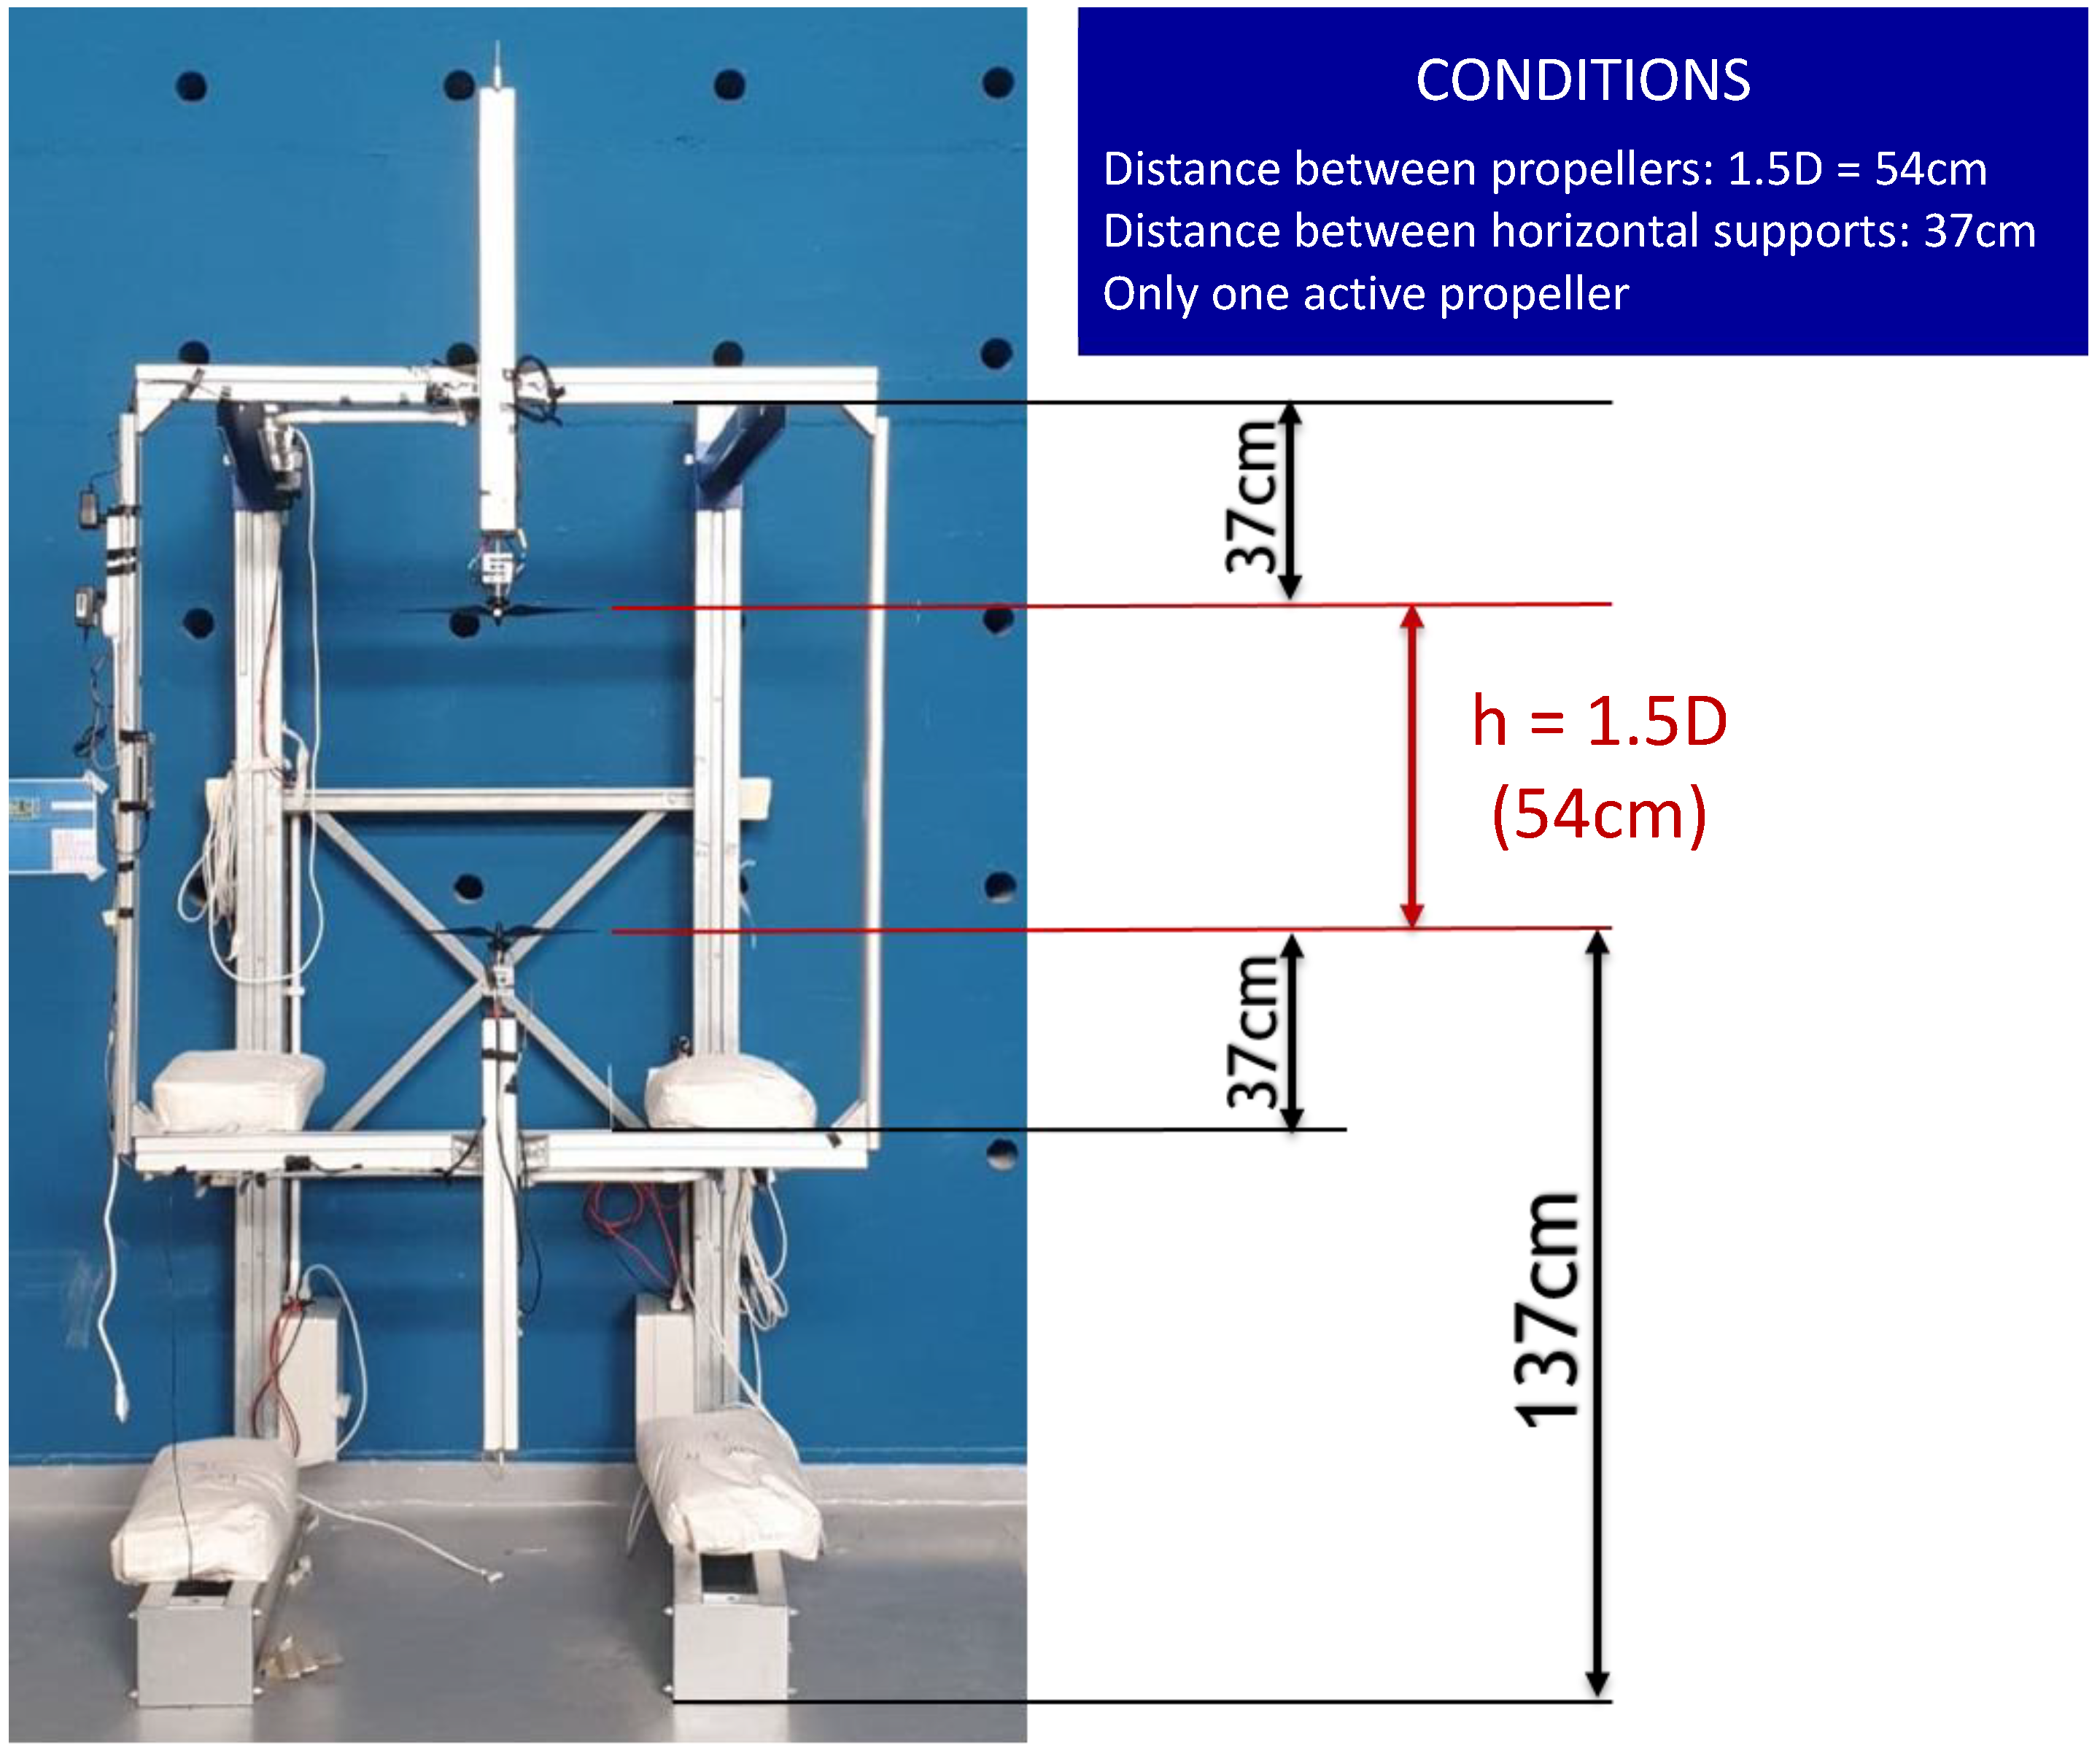
The diameter of the propeller is
. The test facility was arranged to place the propellers at a 1.5D distance from each other and a 1D distance from the supporting horizontal arm. The test setup for the isolated propeller condition is shown in
Figure 6. The isolated propeller hypothesis was fulfilled by considering only one active propeller at a time.
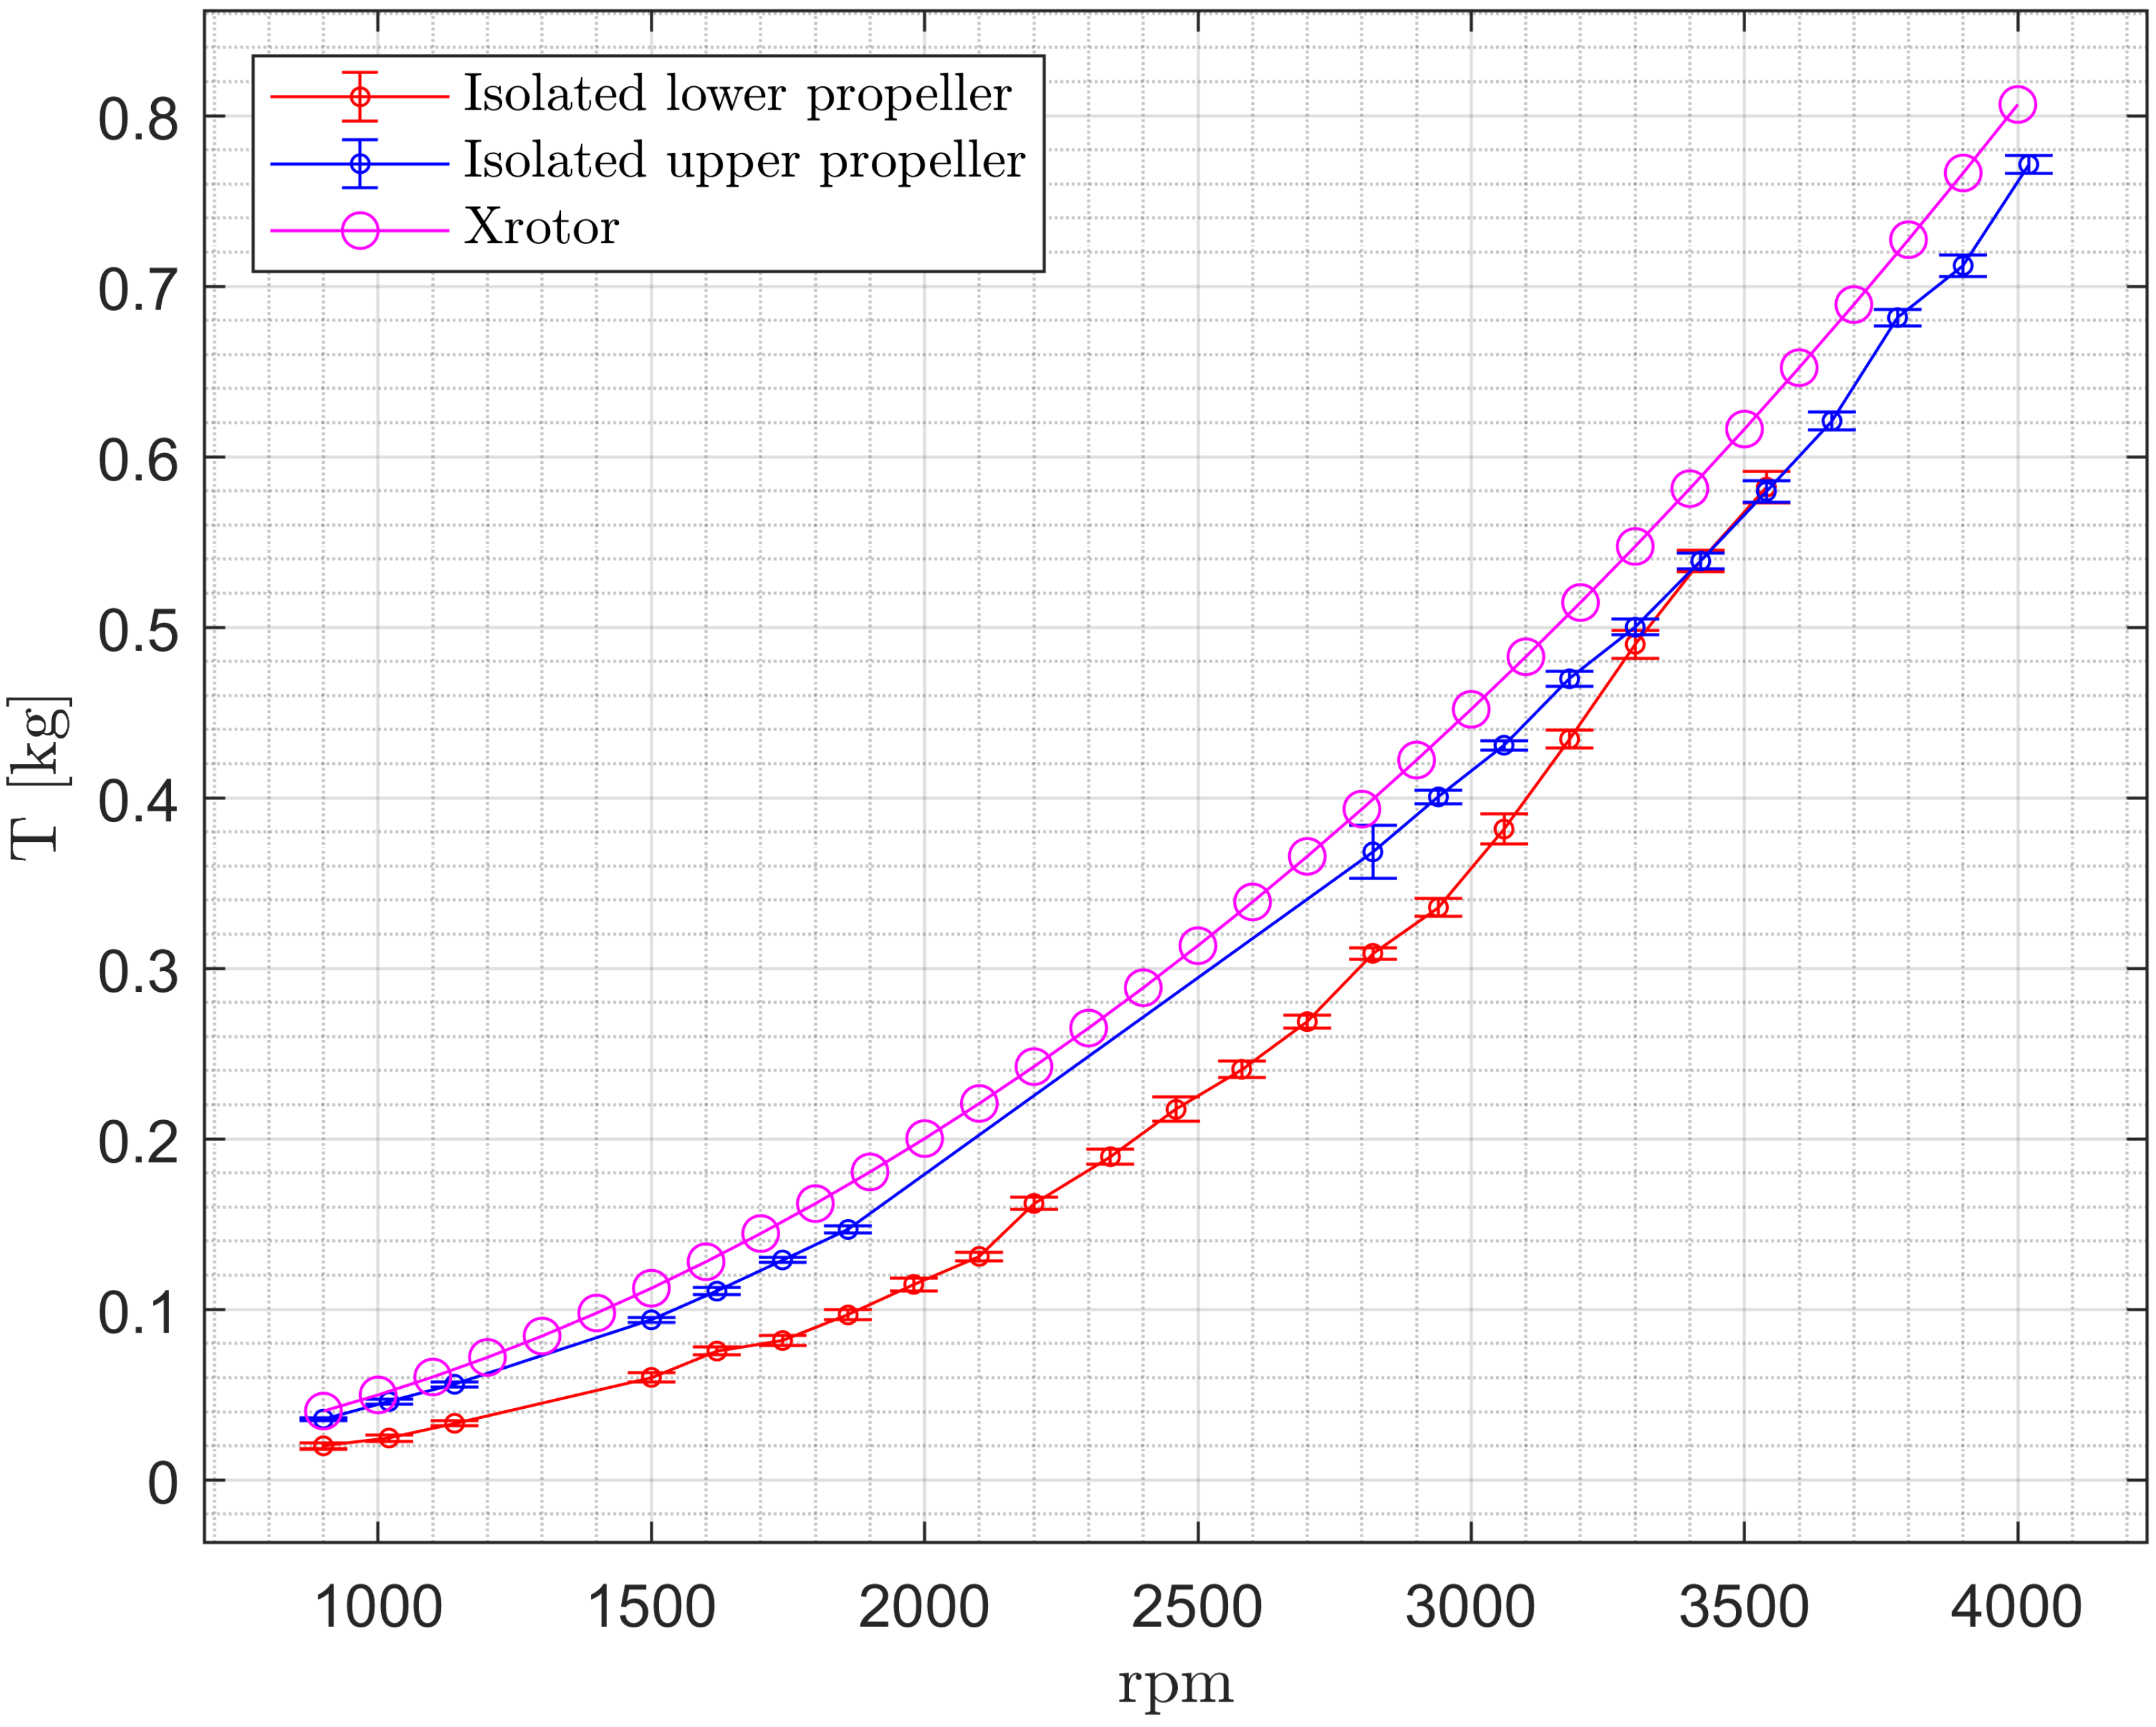
A simple procedure for the acquisition was set to ensure the appropriate repeatability of the testing campaign. Each acquisition was carried out for 30 s from the lock-ok condition (steady state). To highlight the experimental characteristics of the data set and to provide a comparison with XROTOR numerical results, an error bar diagram was chosen.
A lot of information can be derived from the chart in
Figure 7: at low rpm, the isolated lower propeller’s curve and the isolated upper propeller’s curve exhibit slightly different performances in terms of mean thrust value. This behavior may be attributable to aerodynamic reasons. The two propellers are supposed to be identical from an aerodynamic and geometric point of view. The difference lies in the opposed arrangement of the two propellers. In the case of the upper propeller, the support is located at the top of the propeller, and its wake is free from obstacles. In the case of the lower propeller, the pillar is located at the bottom of the disk, resulting in a disturbance of the wake region. An ulterior motivation is due to the partial ground effect on the upper propeller caused by the lower one. The distance between the two propellers is small enoigh to generate the ground effect [
28,
29,
30,
31]. For some angular velocities, the lower propeller also rotated due to the swirl effect caused by the wake of the upper one [
32]. This caused a parachute effect similar to the one characterizing helicopters during the autorotation phase [
33,
34,
35]. In this condition, the generated ground effect is even larger.
It can also be highlighted that no measurement was possible in a range between 1020–1500 rpm for both the propellers due to a first resonance of the supporting vertical arm; another more serious resonance was detected in the 1900–2820 rpm range for the upper propeller. This issue is caused by a transversal motion of the centering frame that is triggered by the compression load generated due to the upper propeller’s motion. In correspondence with this resonance, a rotational motion of the threaded connecting bar leads to a torque applied on the load cell. The load cell’s motion determines a modification of the electronic configuration of the load cell-digitizer interface, which results in a zero reference loss. To avoid such an issue, it has been decided to perform the testing up to 1900 rpm, disconnect the system, check for possible non-compliance in the zero-reference value, and restart the test. The second resonance range has been avoided, accelerating the system straight from 0 up to a 2820 rpm angular velocity: this method has shown good results since a quality control performed on the zero value and the reference value once the testing was interrupted has proven to be in accordance with the pre- and post-resonance thrust values.
3.1.2. Single Propeller Noise Characterization
The system was characterized from an acoustic point of view to understand the contribution of both the propeller and the T-motor and to highlight the frequency content for different values of the angular velocity. The
parameter, which has been measured by means of an NTi Audio XL2 sound level meter [
36], is shown in
Figure 8,
Figure 9,
Figure 10,
Figure 11,
Figure 12,
Figure 13,
Figure 14 and
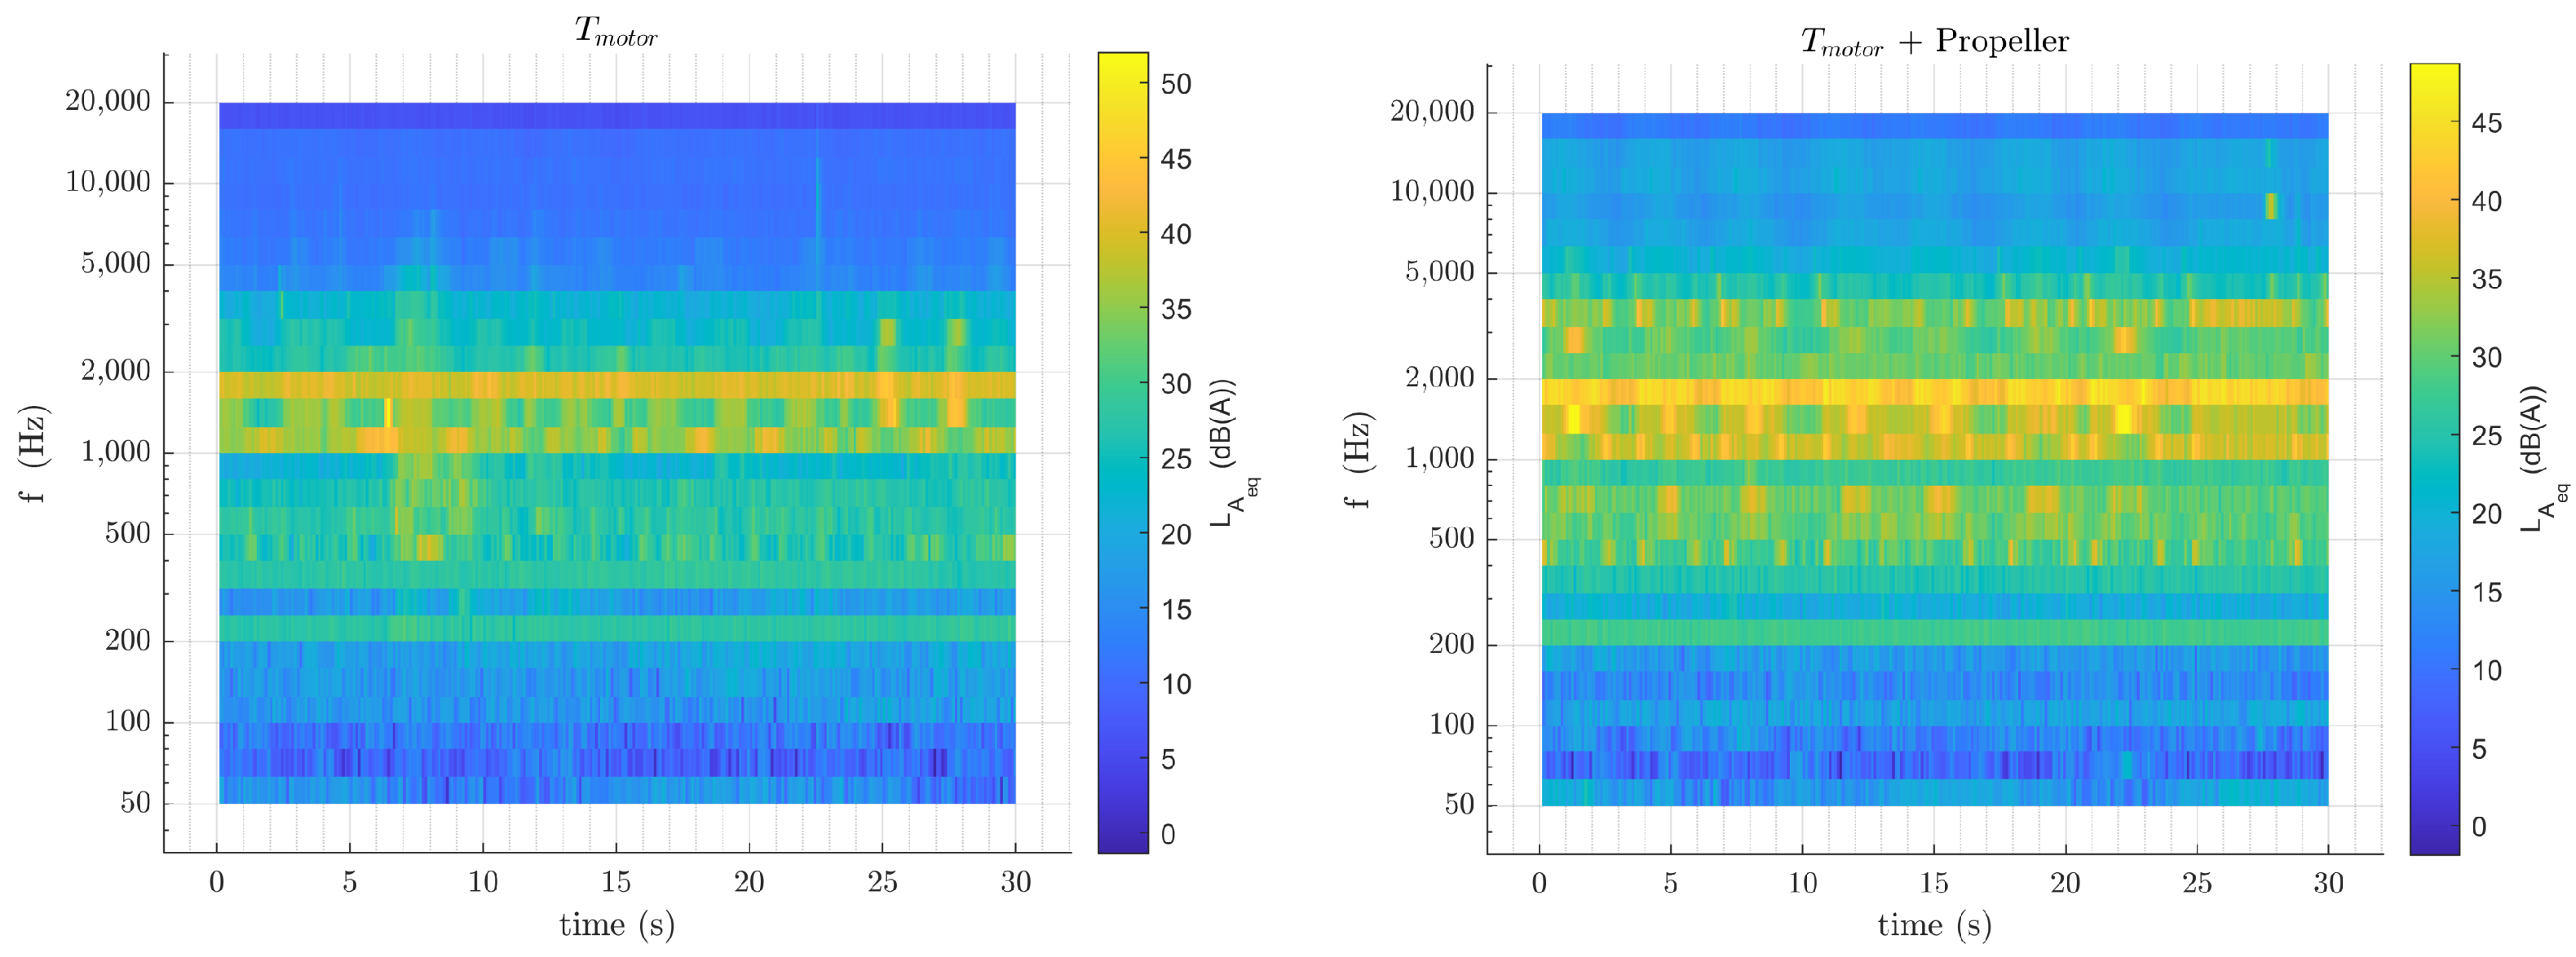
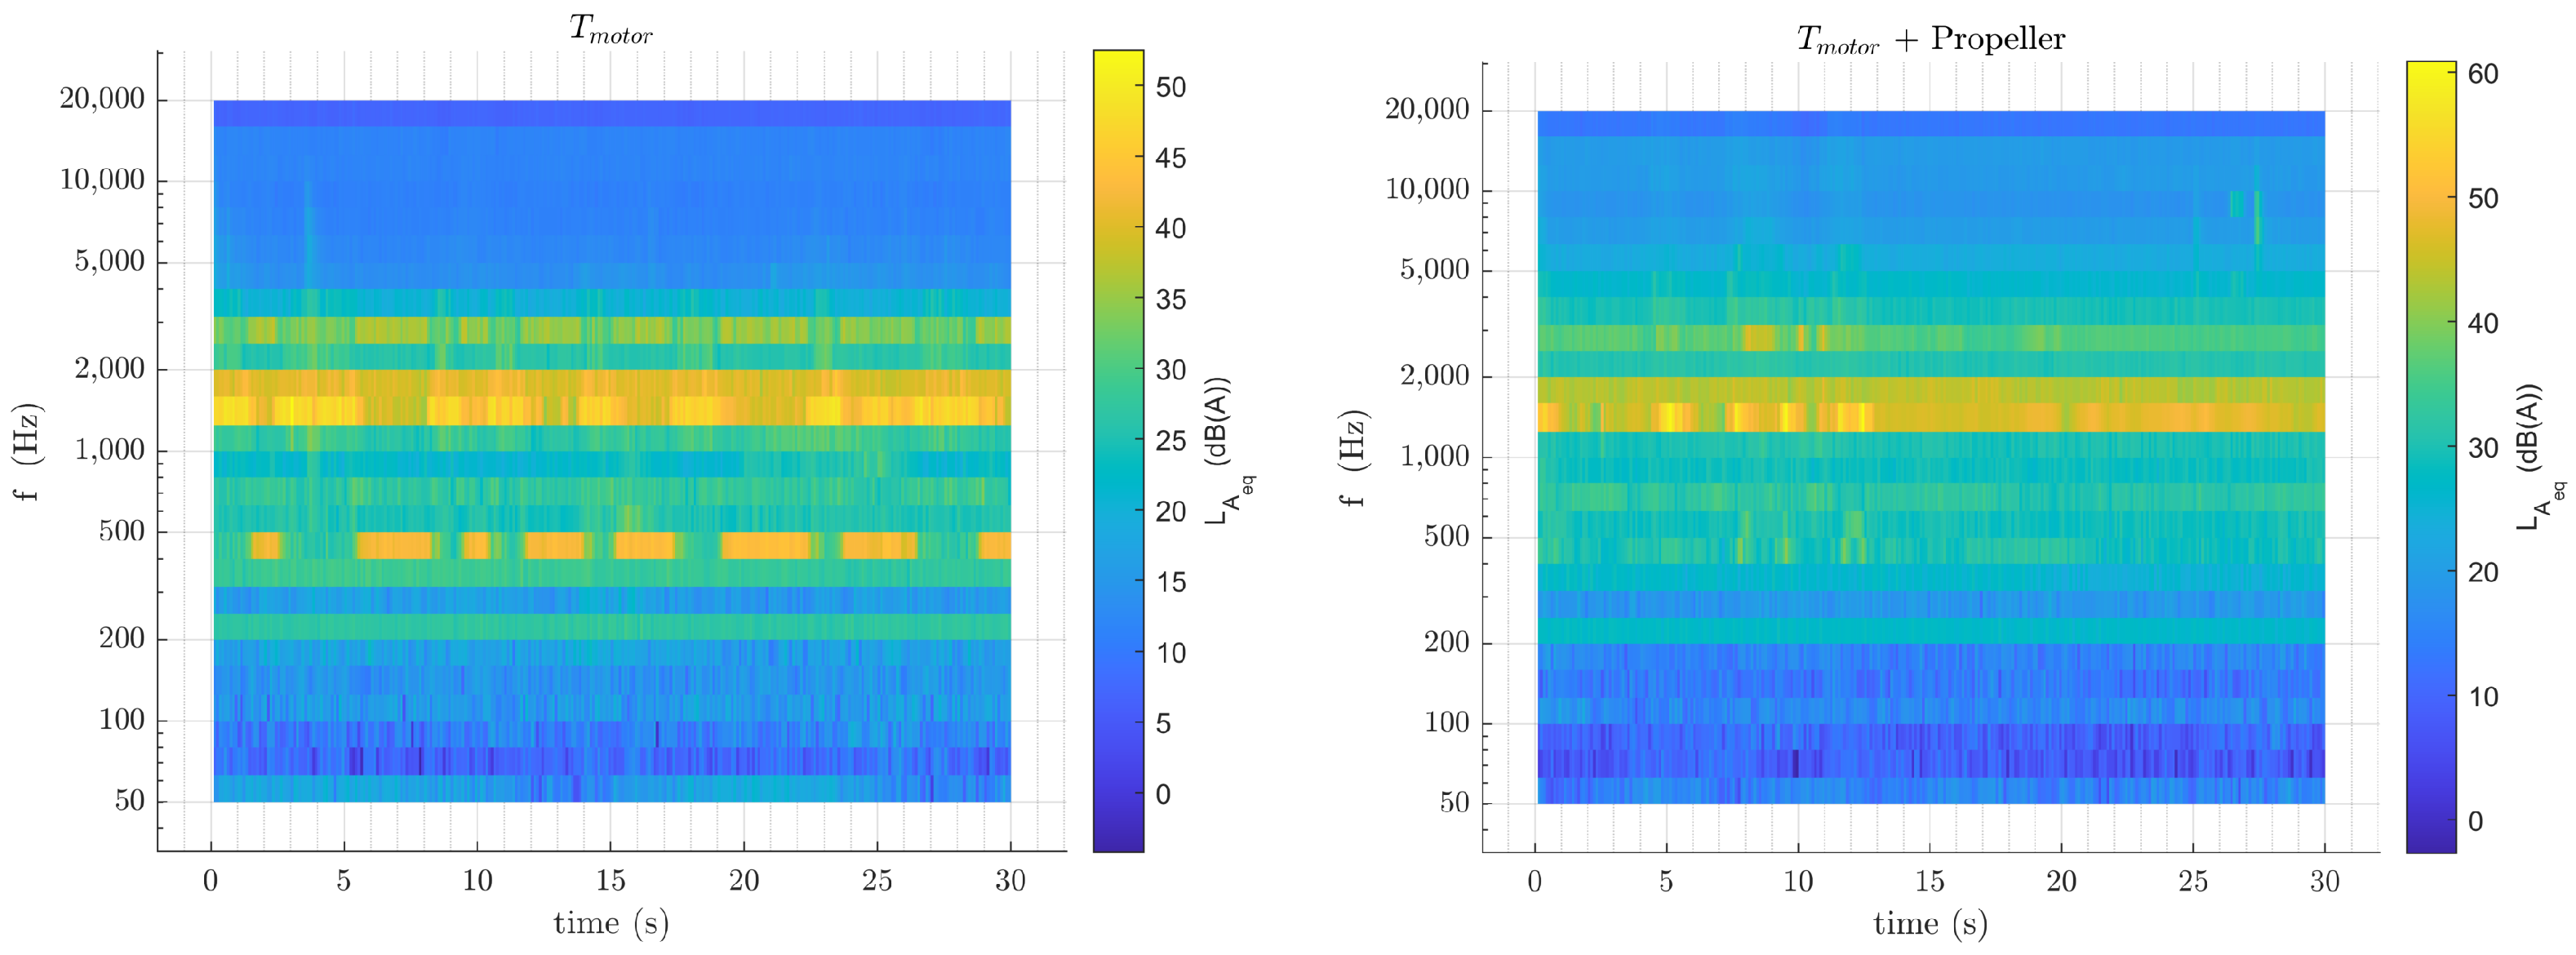
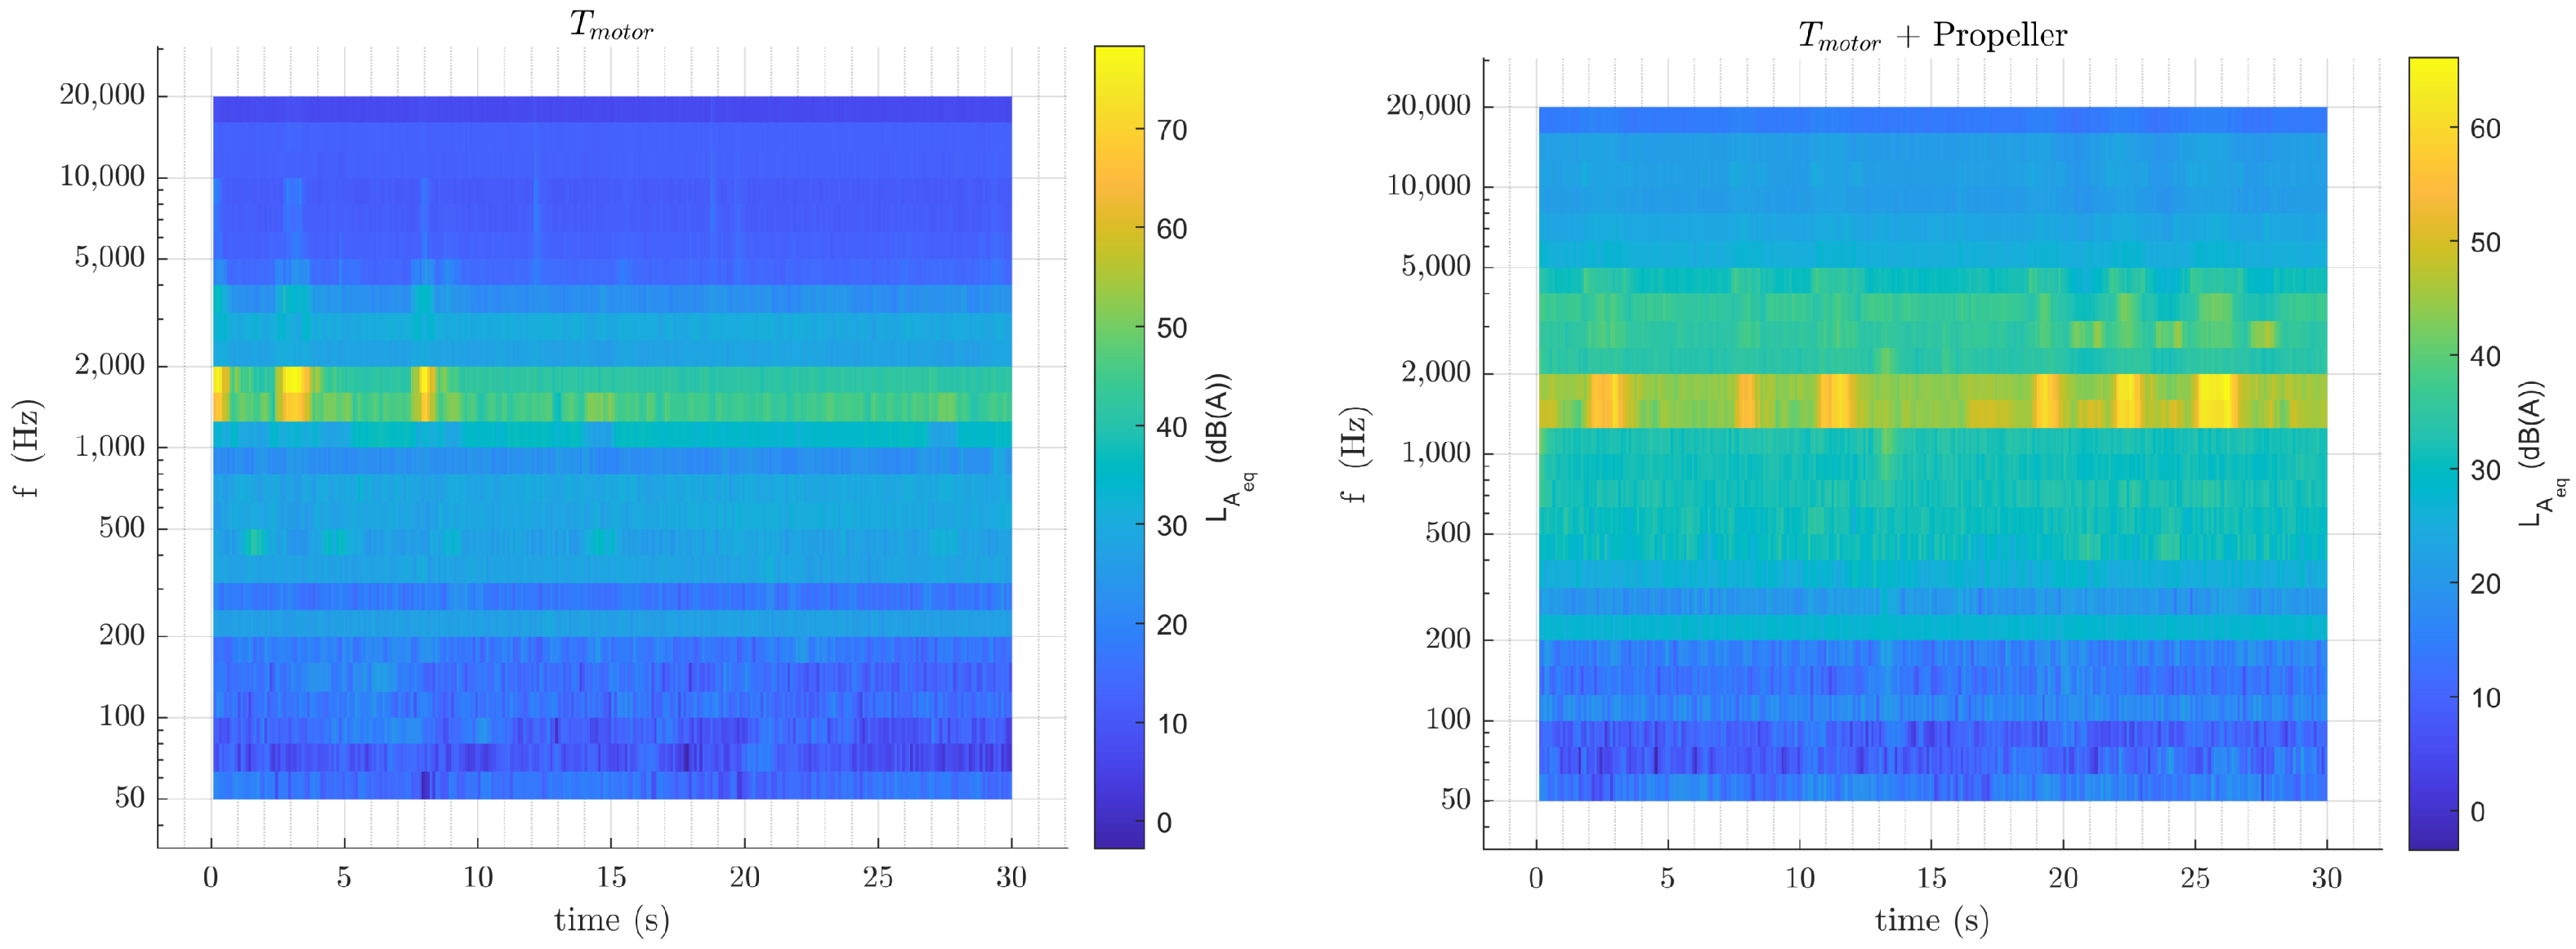
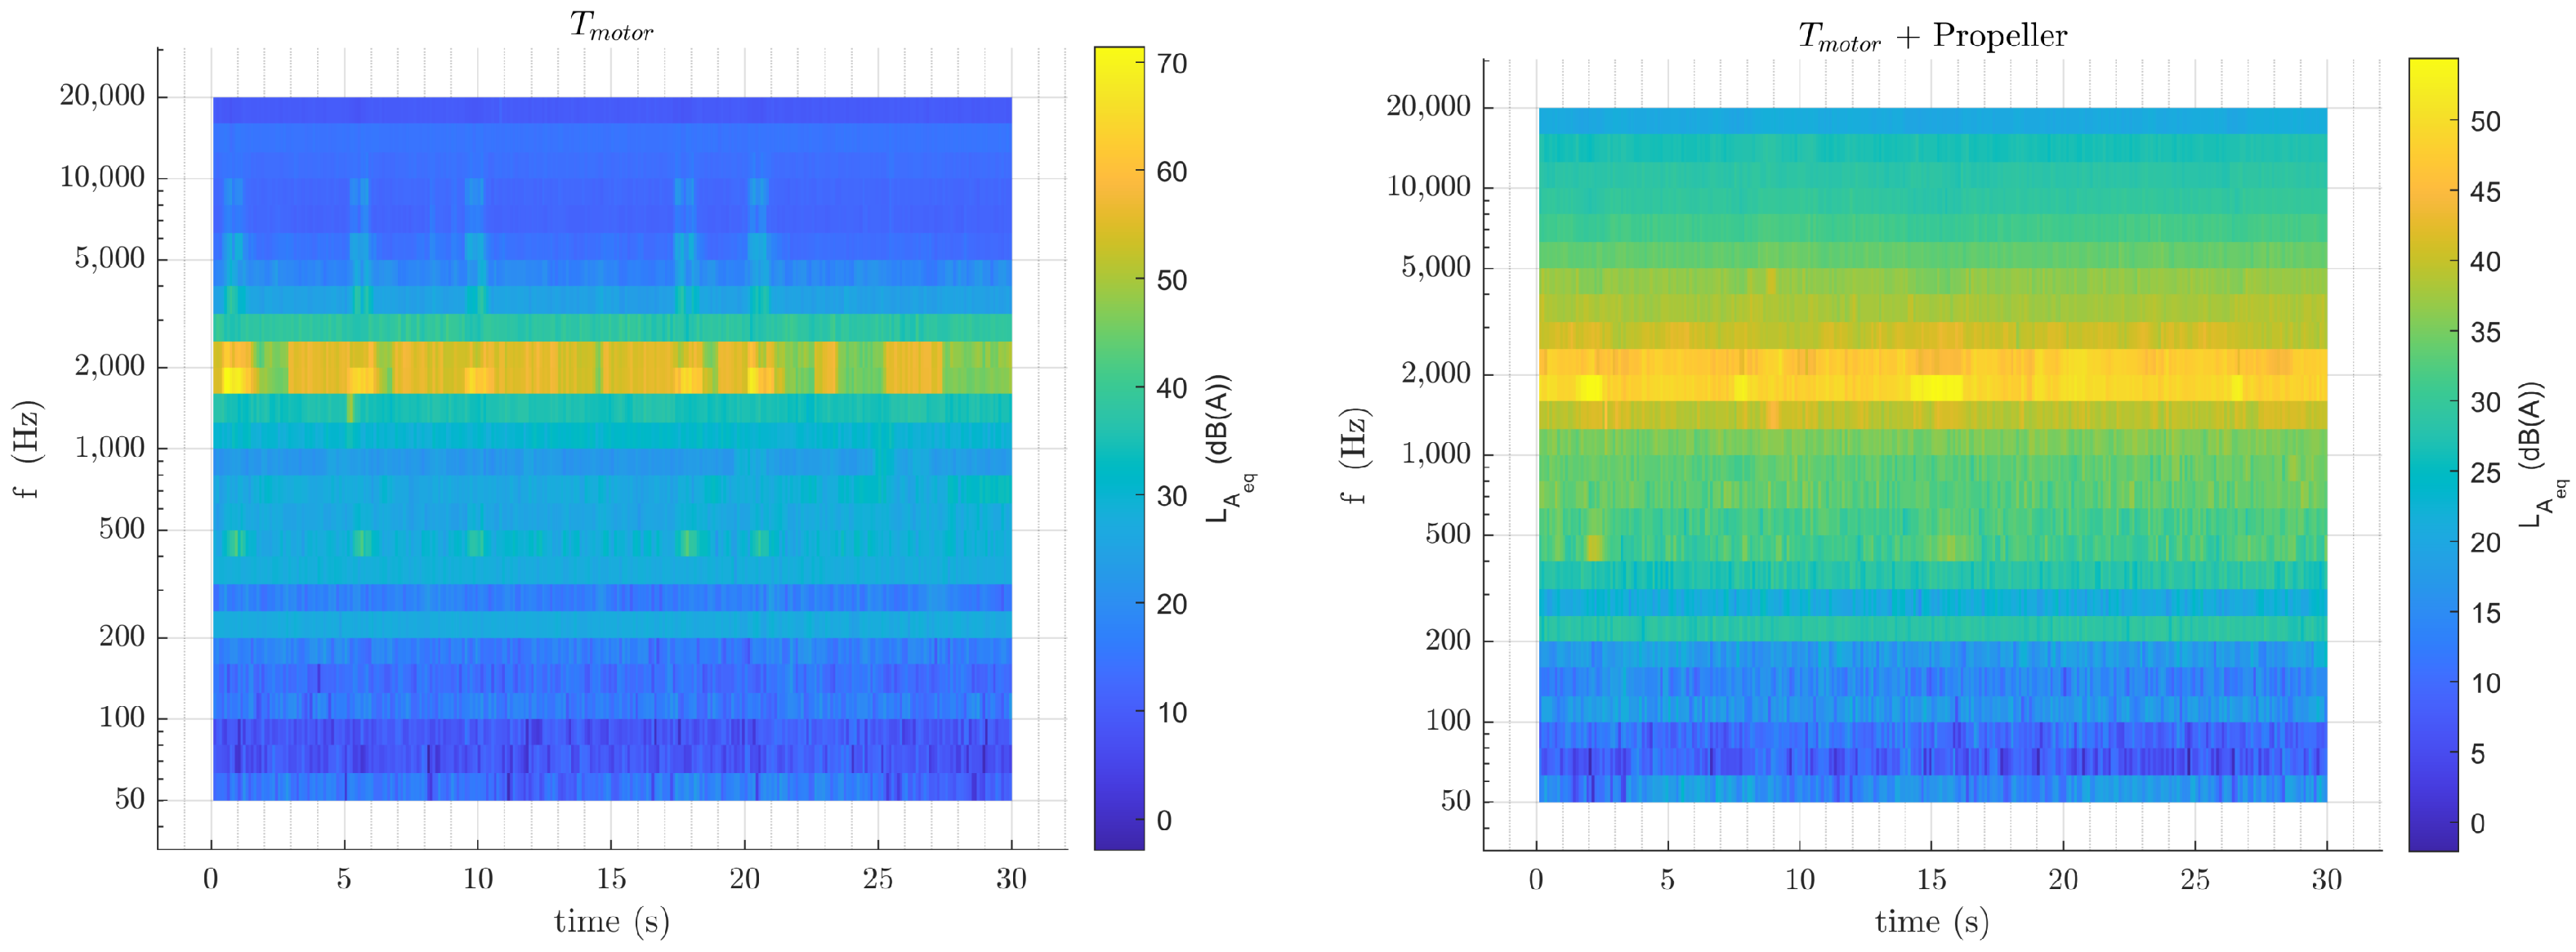
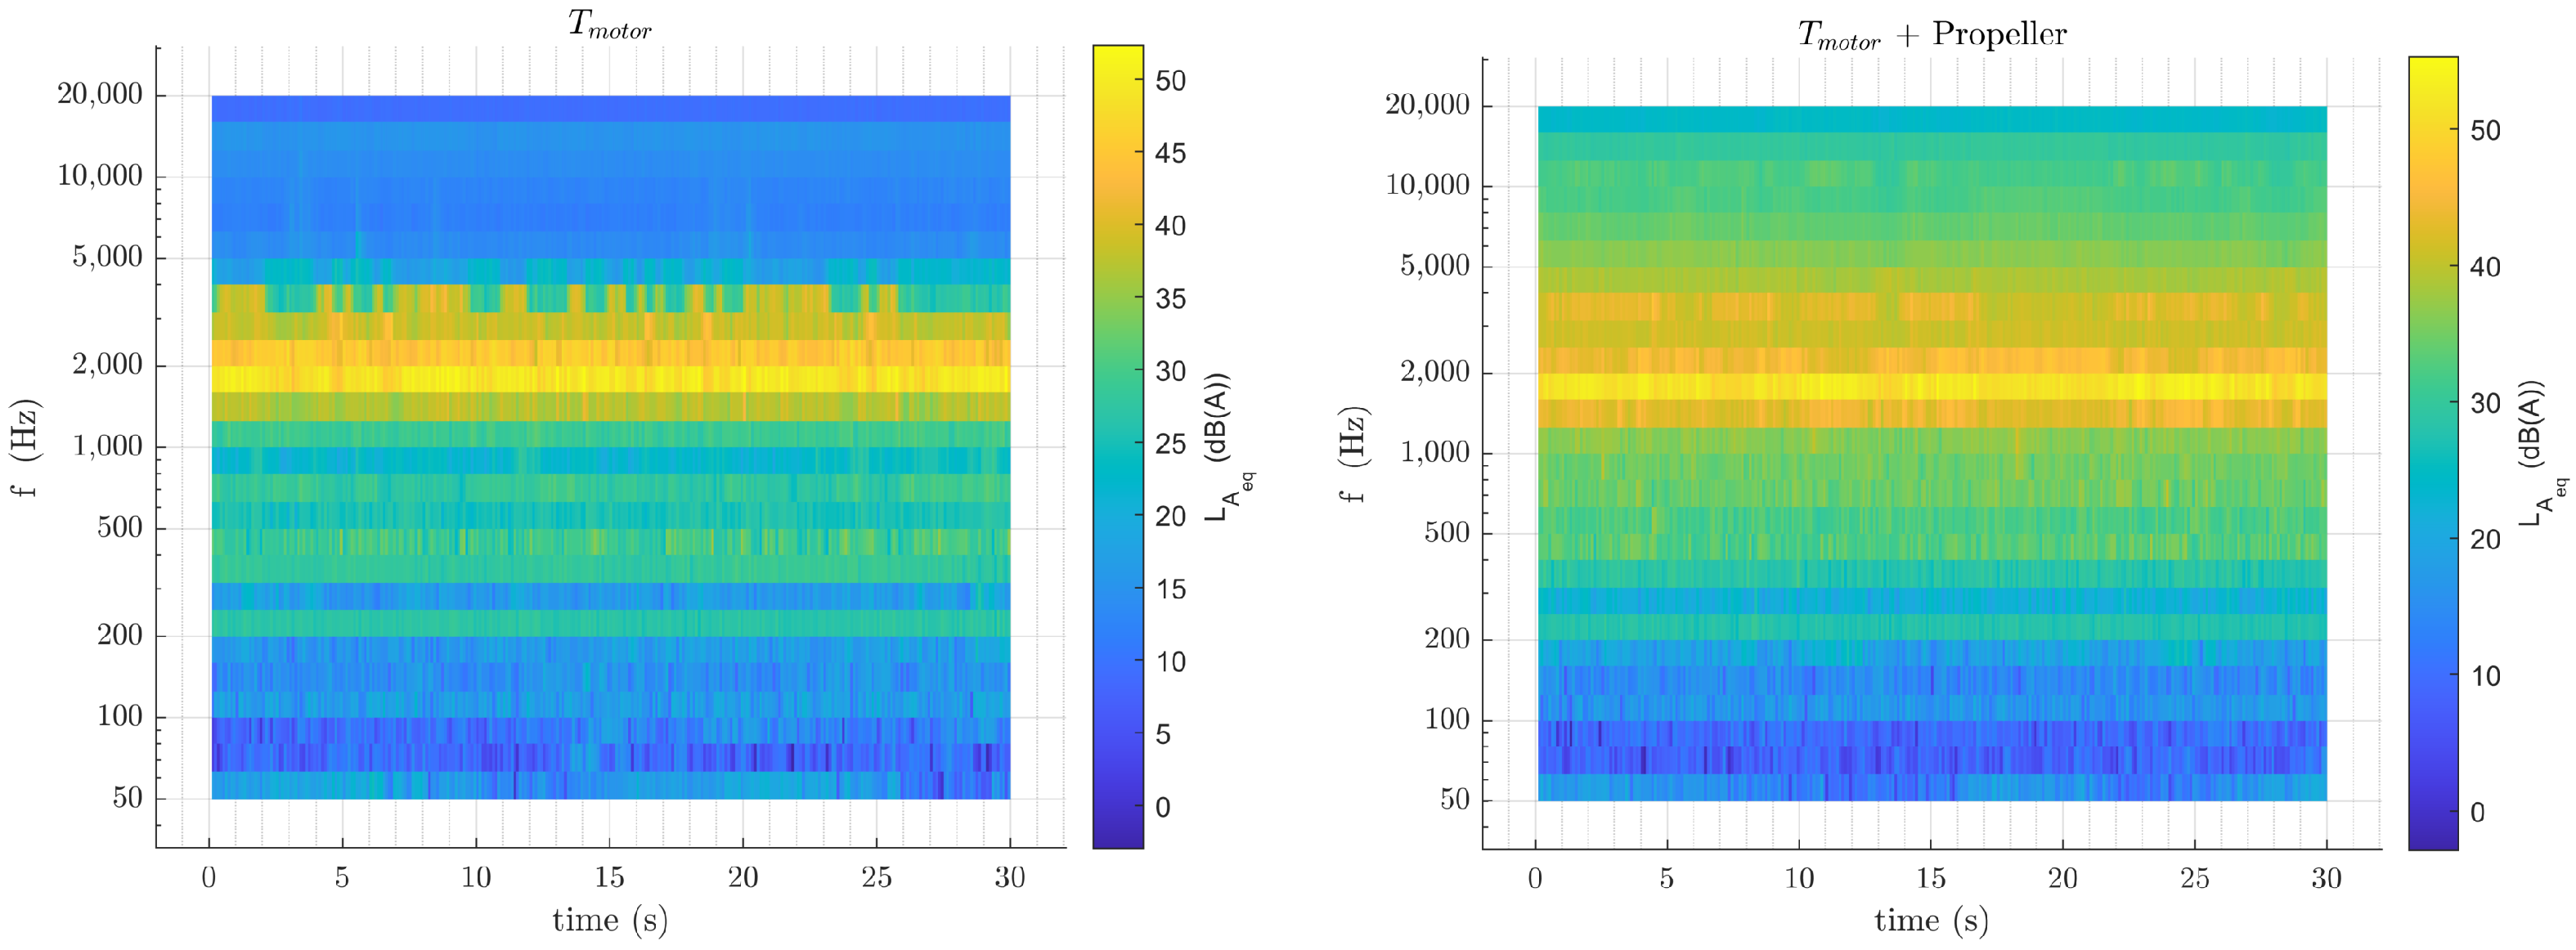
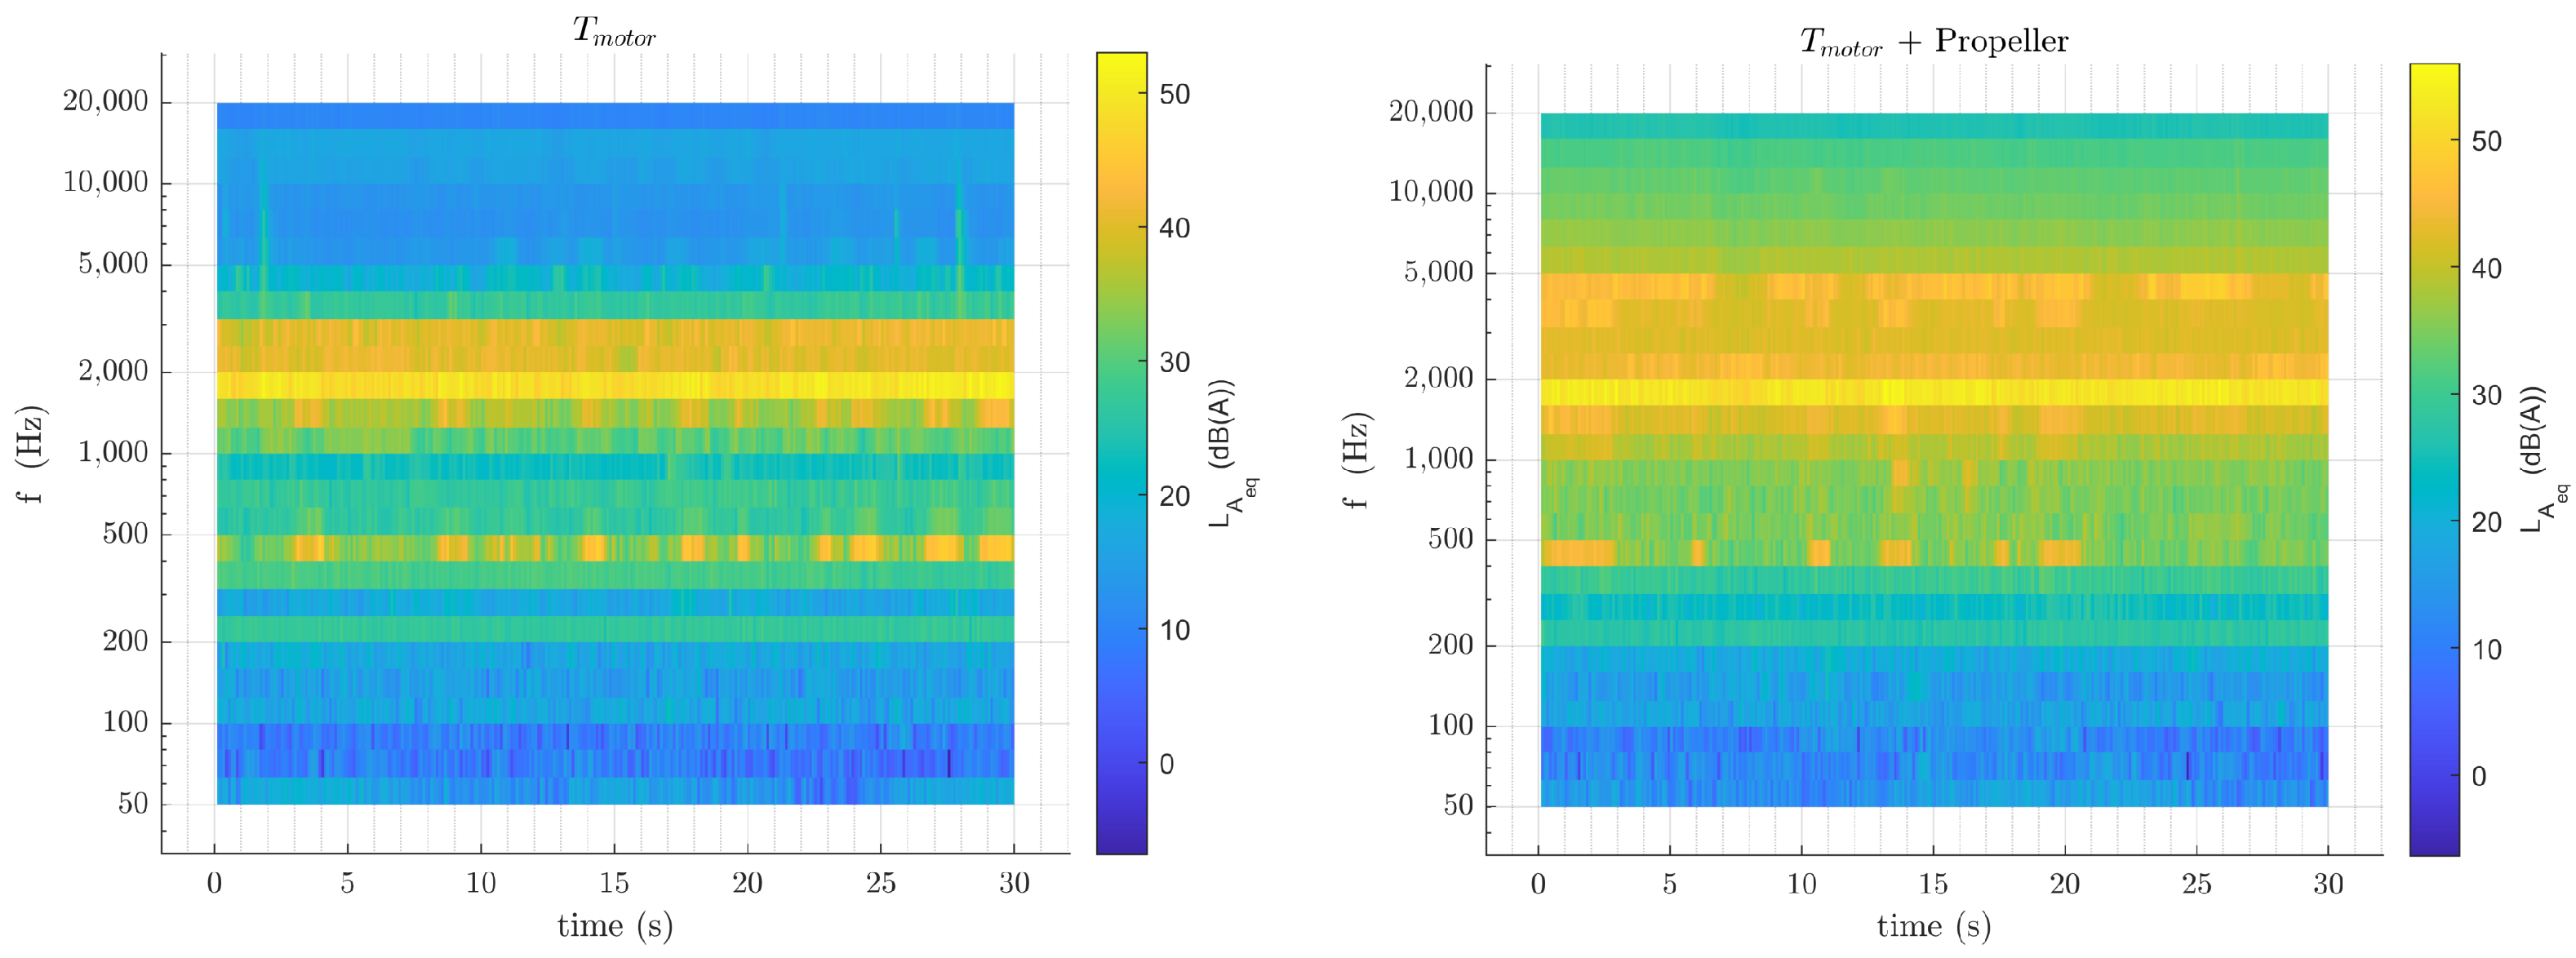
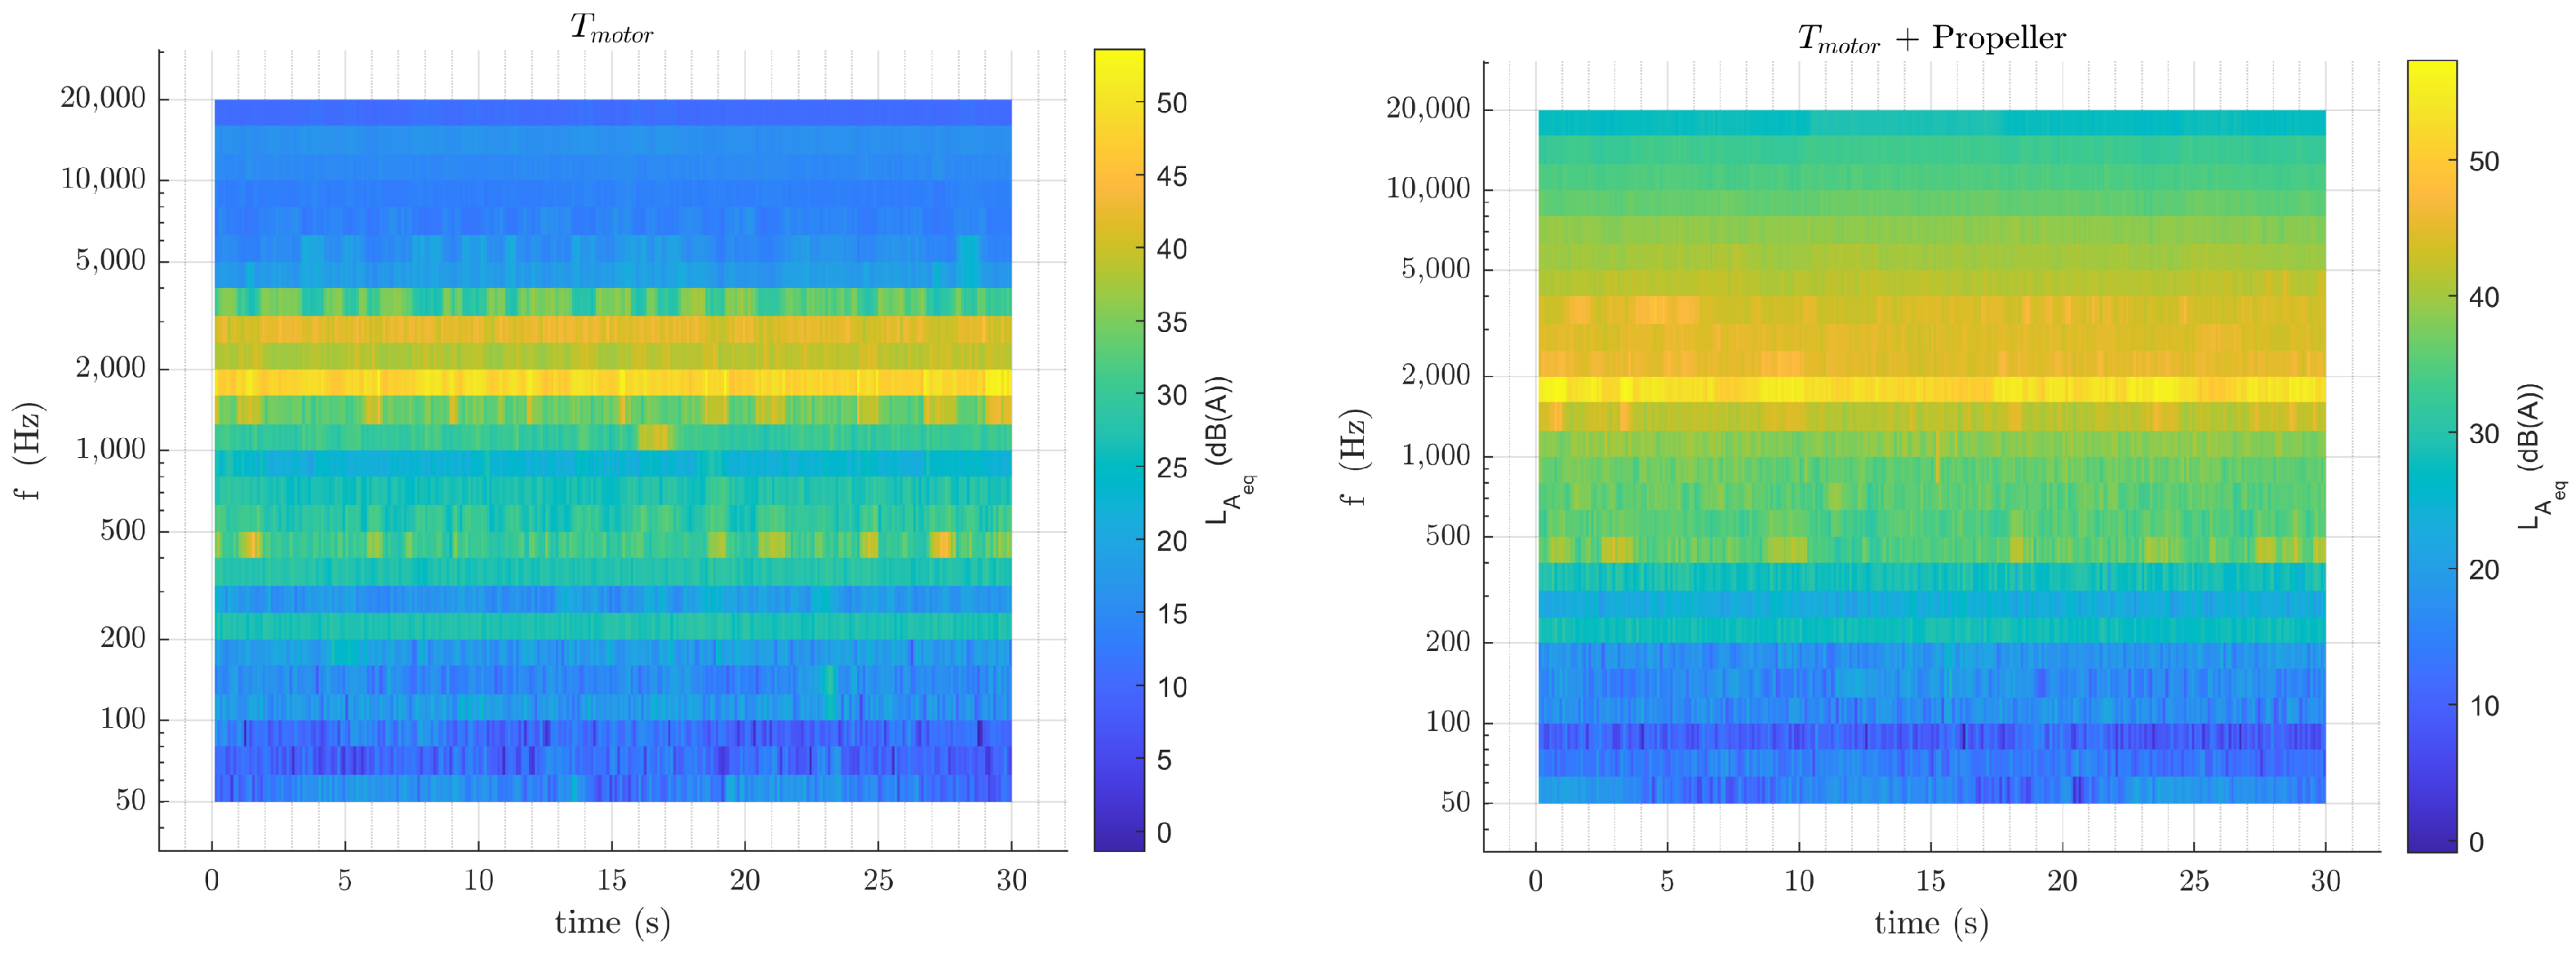
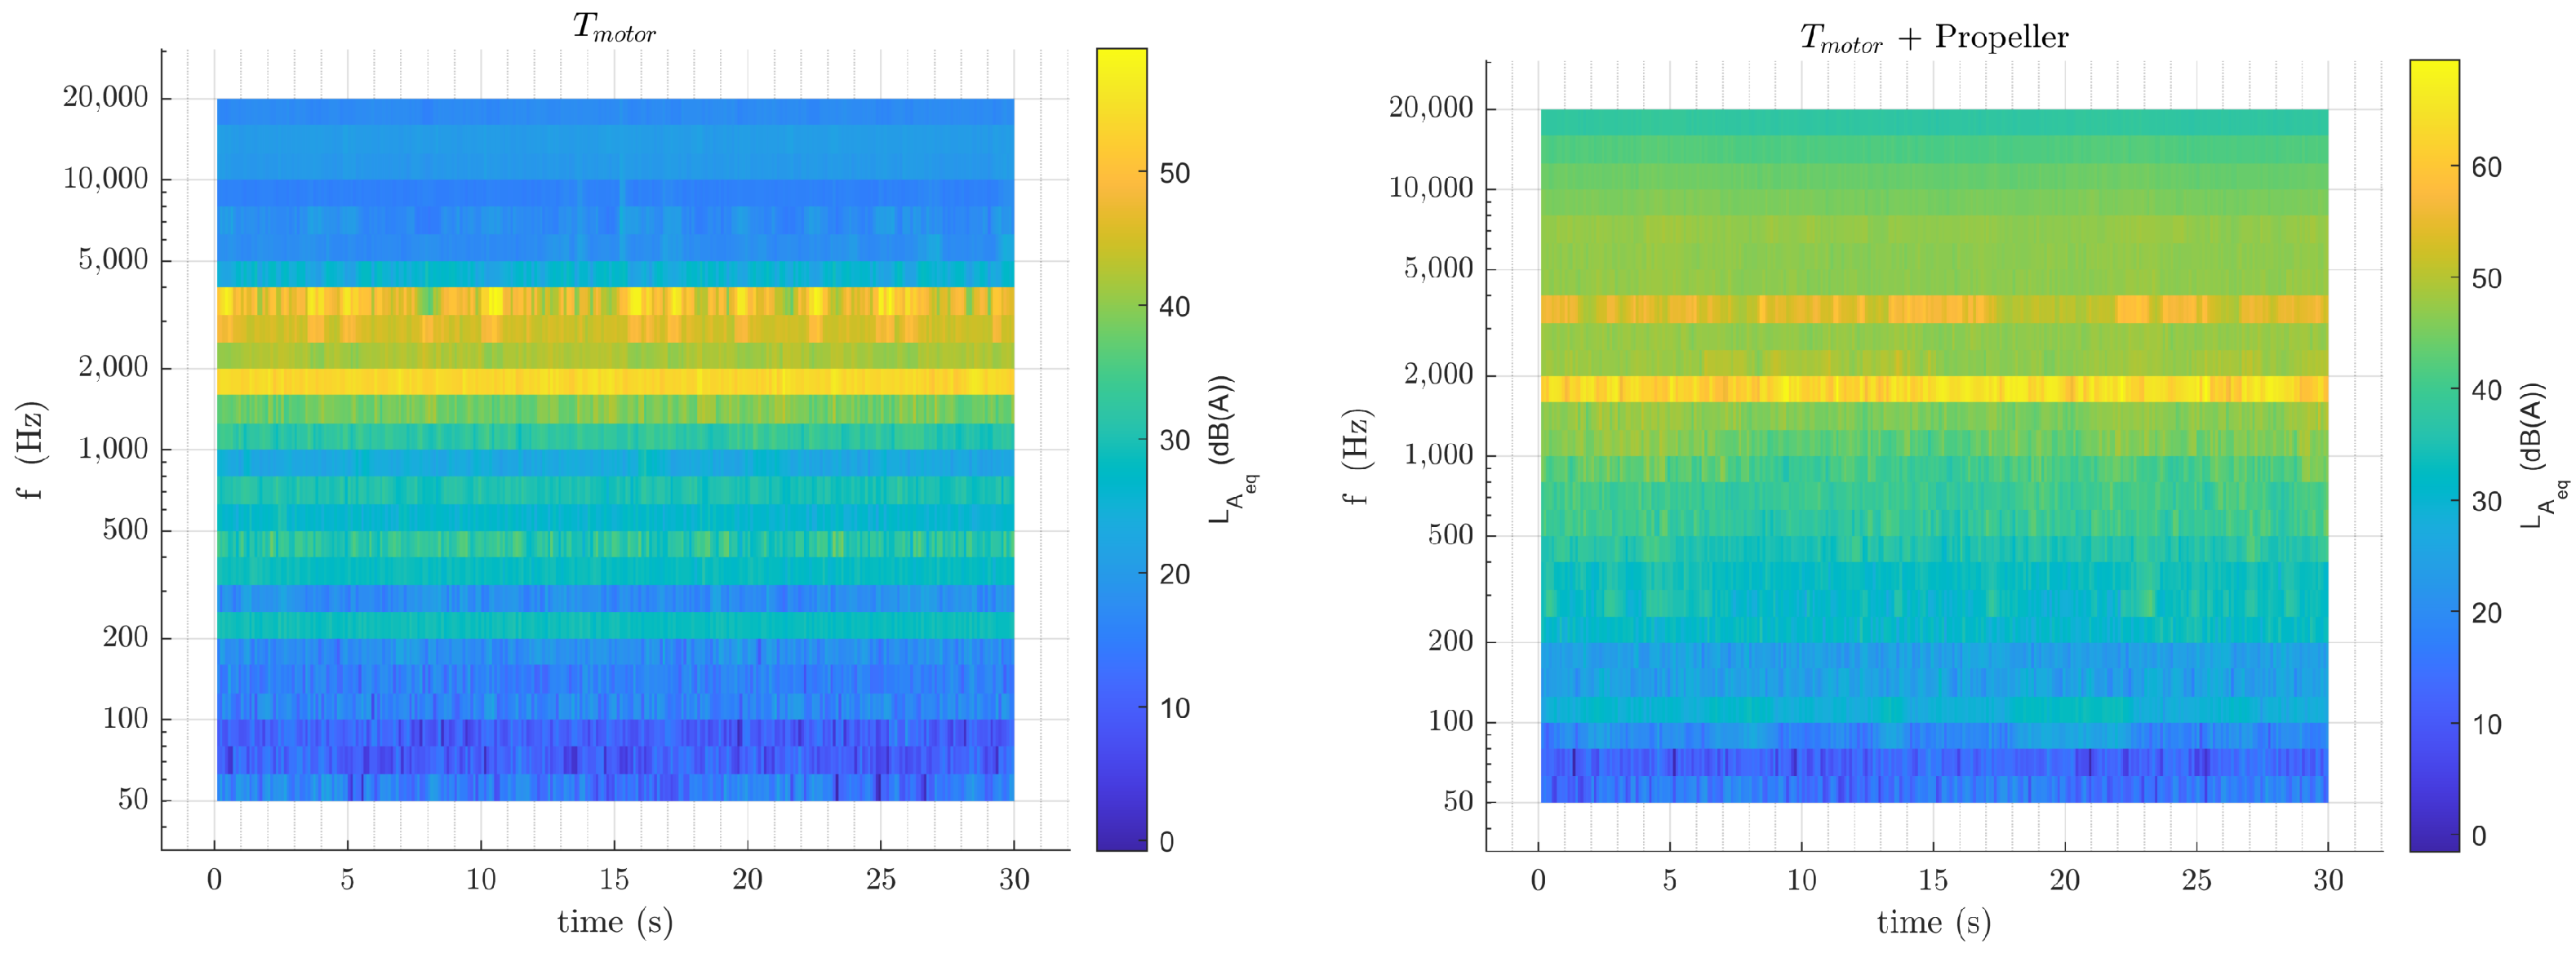
Figure 15. Two configurations have been tested: T-motor (motor running without the propeller) and T-motor + propeller. The microphone was positioned 1.5 m away from the propeller’s hub into their rotation plane, perpendicular to the ground. The sampling frequency was set at 51 kHz, while the timestep (integration time) of the equivalent level was set at 100 ms.
By observing the charts of the
vs. time for both propeller and T-motor + propeller configurations, it is possible to see that the
measured by the T-motor + propeller configuration is not always prevalent in the
generated by the T-motor itself. From
Figure 9, high peak oscillations are able to be seen: this results in distinct tones. It is also possible to emphasize that, at a lower rpm regime, higher periodic oscillation occurs: those are determined by the angular velocity control system, which has been reported to be activated with higher frequency.
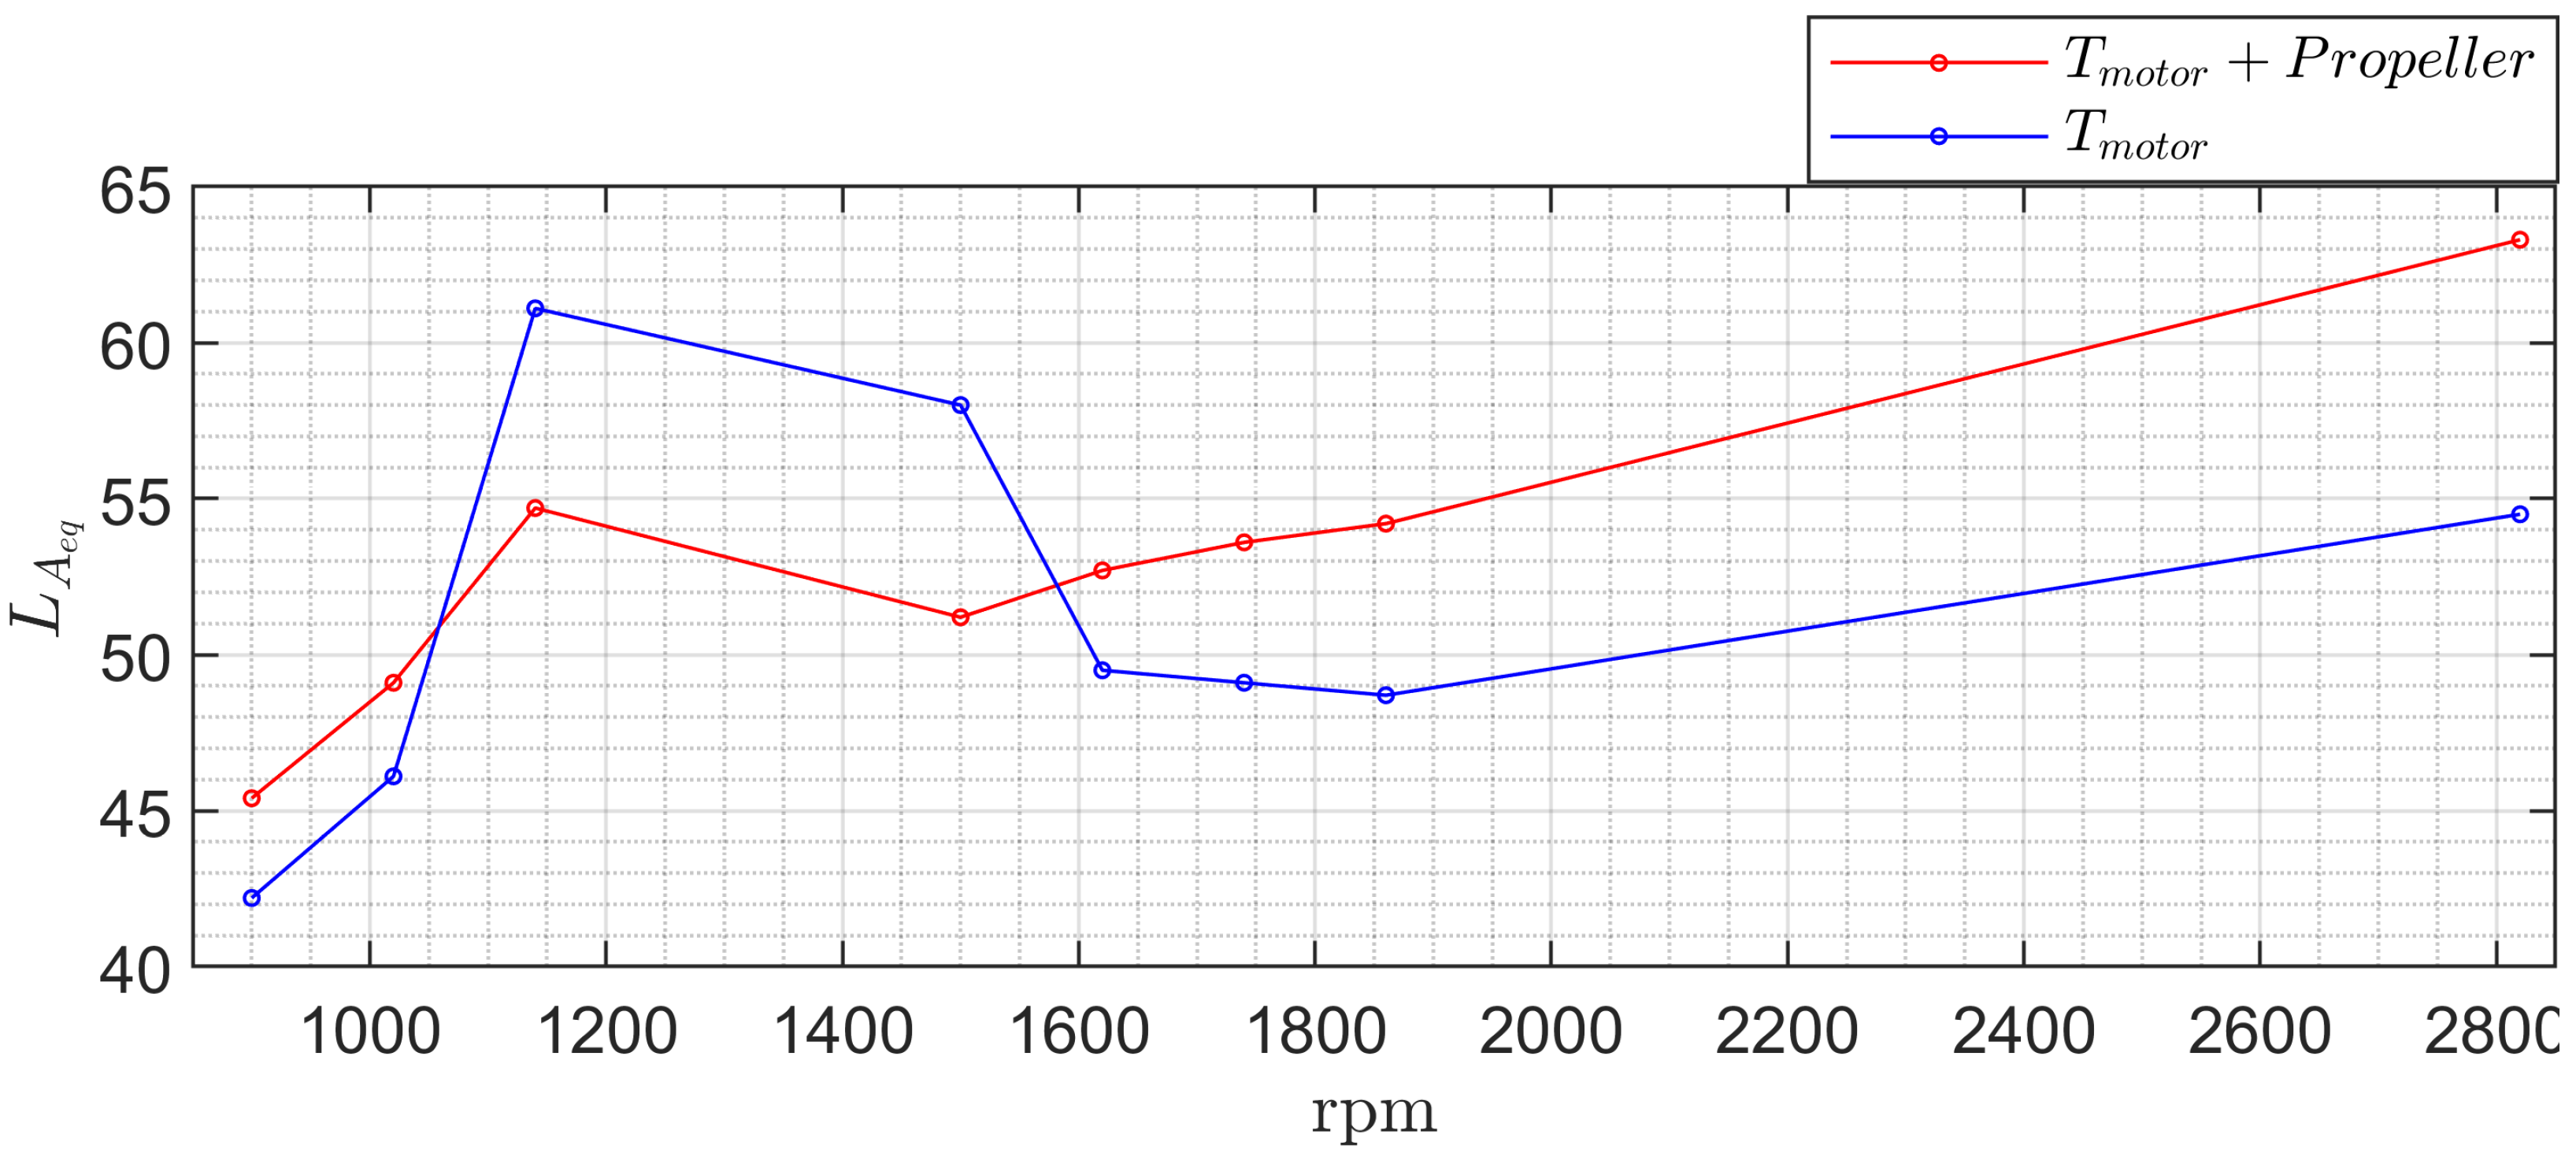
The test has shown that the T-motor + propeller configuration is prevalent, in terms of
, over the T-motor configuration. In
Figure 16, it is possible to see that, in the corresponding angular velocity of 1140 and 1500 rpm, this trend is not fulfilled, and the T-motor configuration shows a higher noise level due to distinct tones appearing in the third octave band of center 1000, 1250, and 1600 Hz. In correspondence with an angular velocity of 2820 rpm, an 8 dB(A) difference in the
can be highlighted. The same difference becomes 6 dB(A) in the case of the aforementioned 1140 and 1500 rpm conditions, which can be stated as critical in terms of motor functioning.
3.2. Counter Rotating Propellers Performance Evaluation
A sensitivity analysis was carried out by considering different relative positions between the two propellers and measuring the thrust and the noise corresponding to multiple angular velocity values. Three distances between the propellers, h, have been considered:
3.2.1. Thrust Comparative Analysis
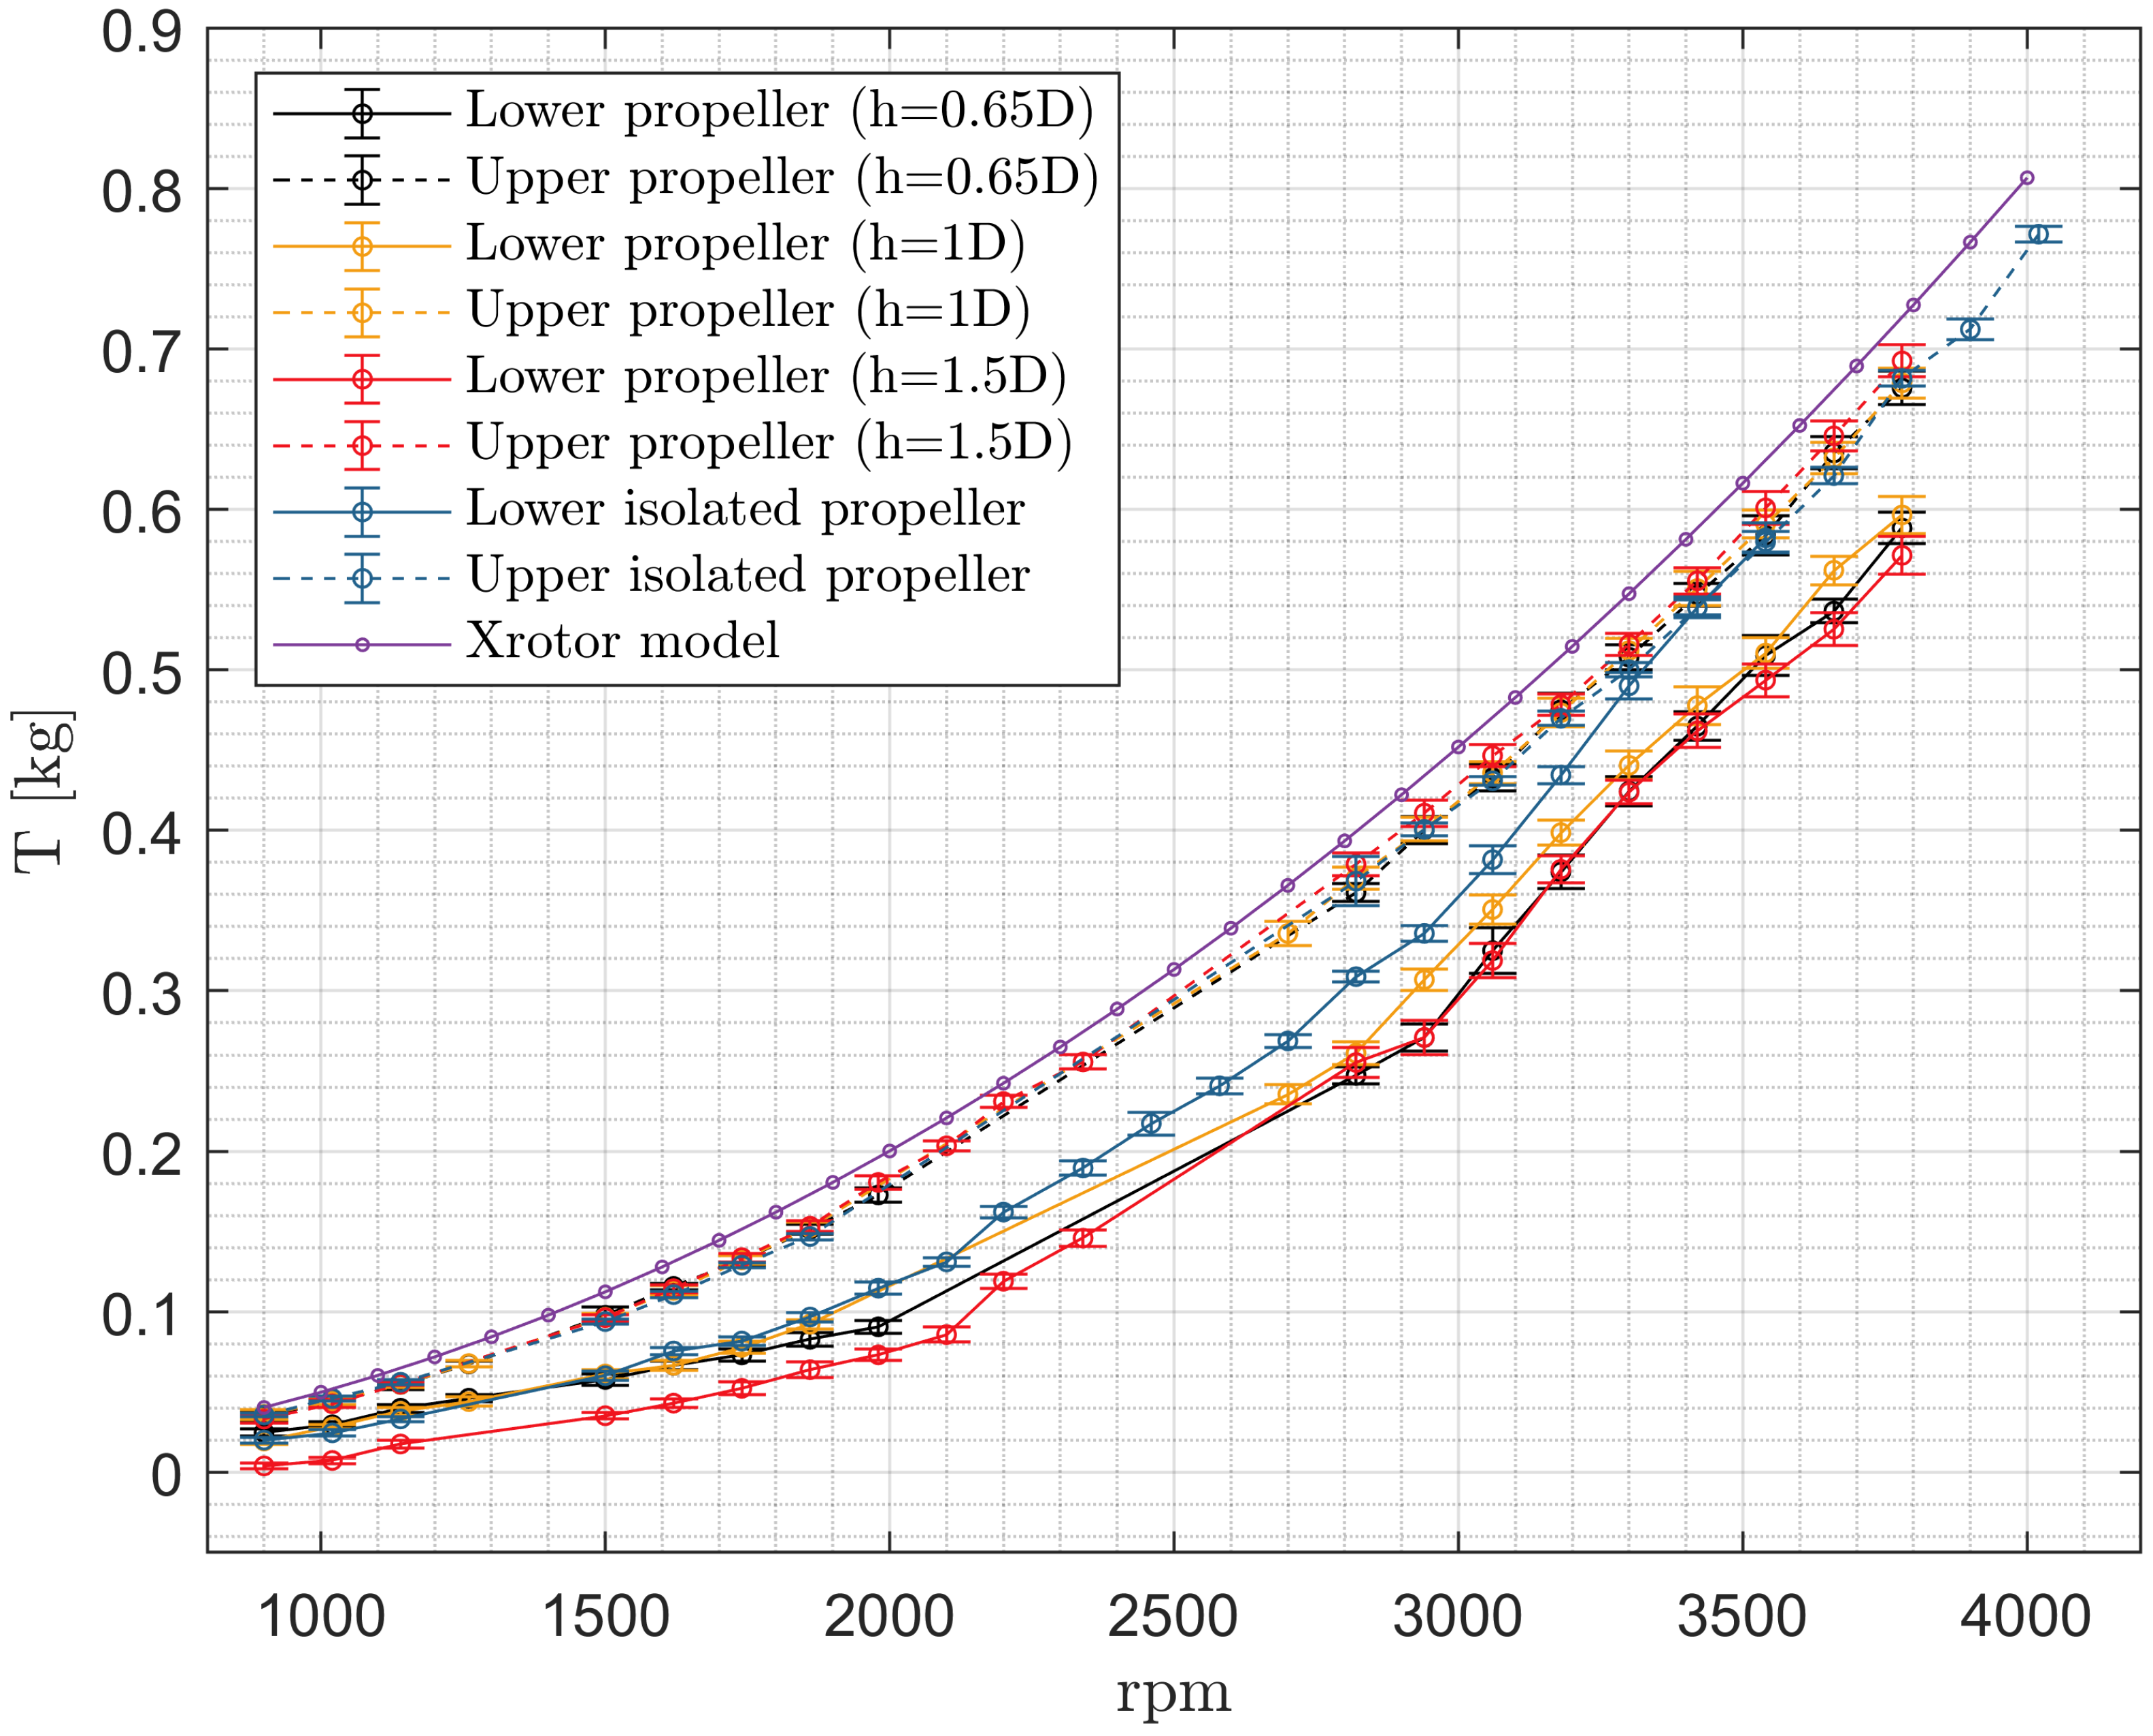
The comparative thrust analysis brings some interesting considerations concerning both the upper and the lower propeller and their behavior when decreasing distance.
The standard deviation associated with the dataset at the specific angular velocity has been reported not to be sensitive to the distance between the two propellers. It is possible to note that the standard deviation is always contained in the 5% of the rated output range defined by the cell manufacturer. This eventuality shows an overall good behavior of the load cell acquisition system, which is not affected by the changing of the position of the electric components. The thrust performance of the upper propeller is not highly affected by the distance parameter. This might be justified by the fact that, due to the test configuration, it still operates upstream but is not heavily influenced by inducted velocity generated by the lower propeller.
Looking at
Figure 17, it is possible to highlight that upper propellers’ characteristic curves show a good agreement with the numerical model, which is reported to be slightly oversized concerning the isolated upper propeller (0.010 kg at 3780 rpm).
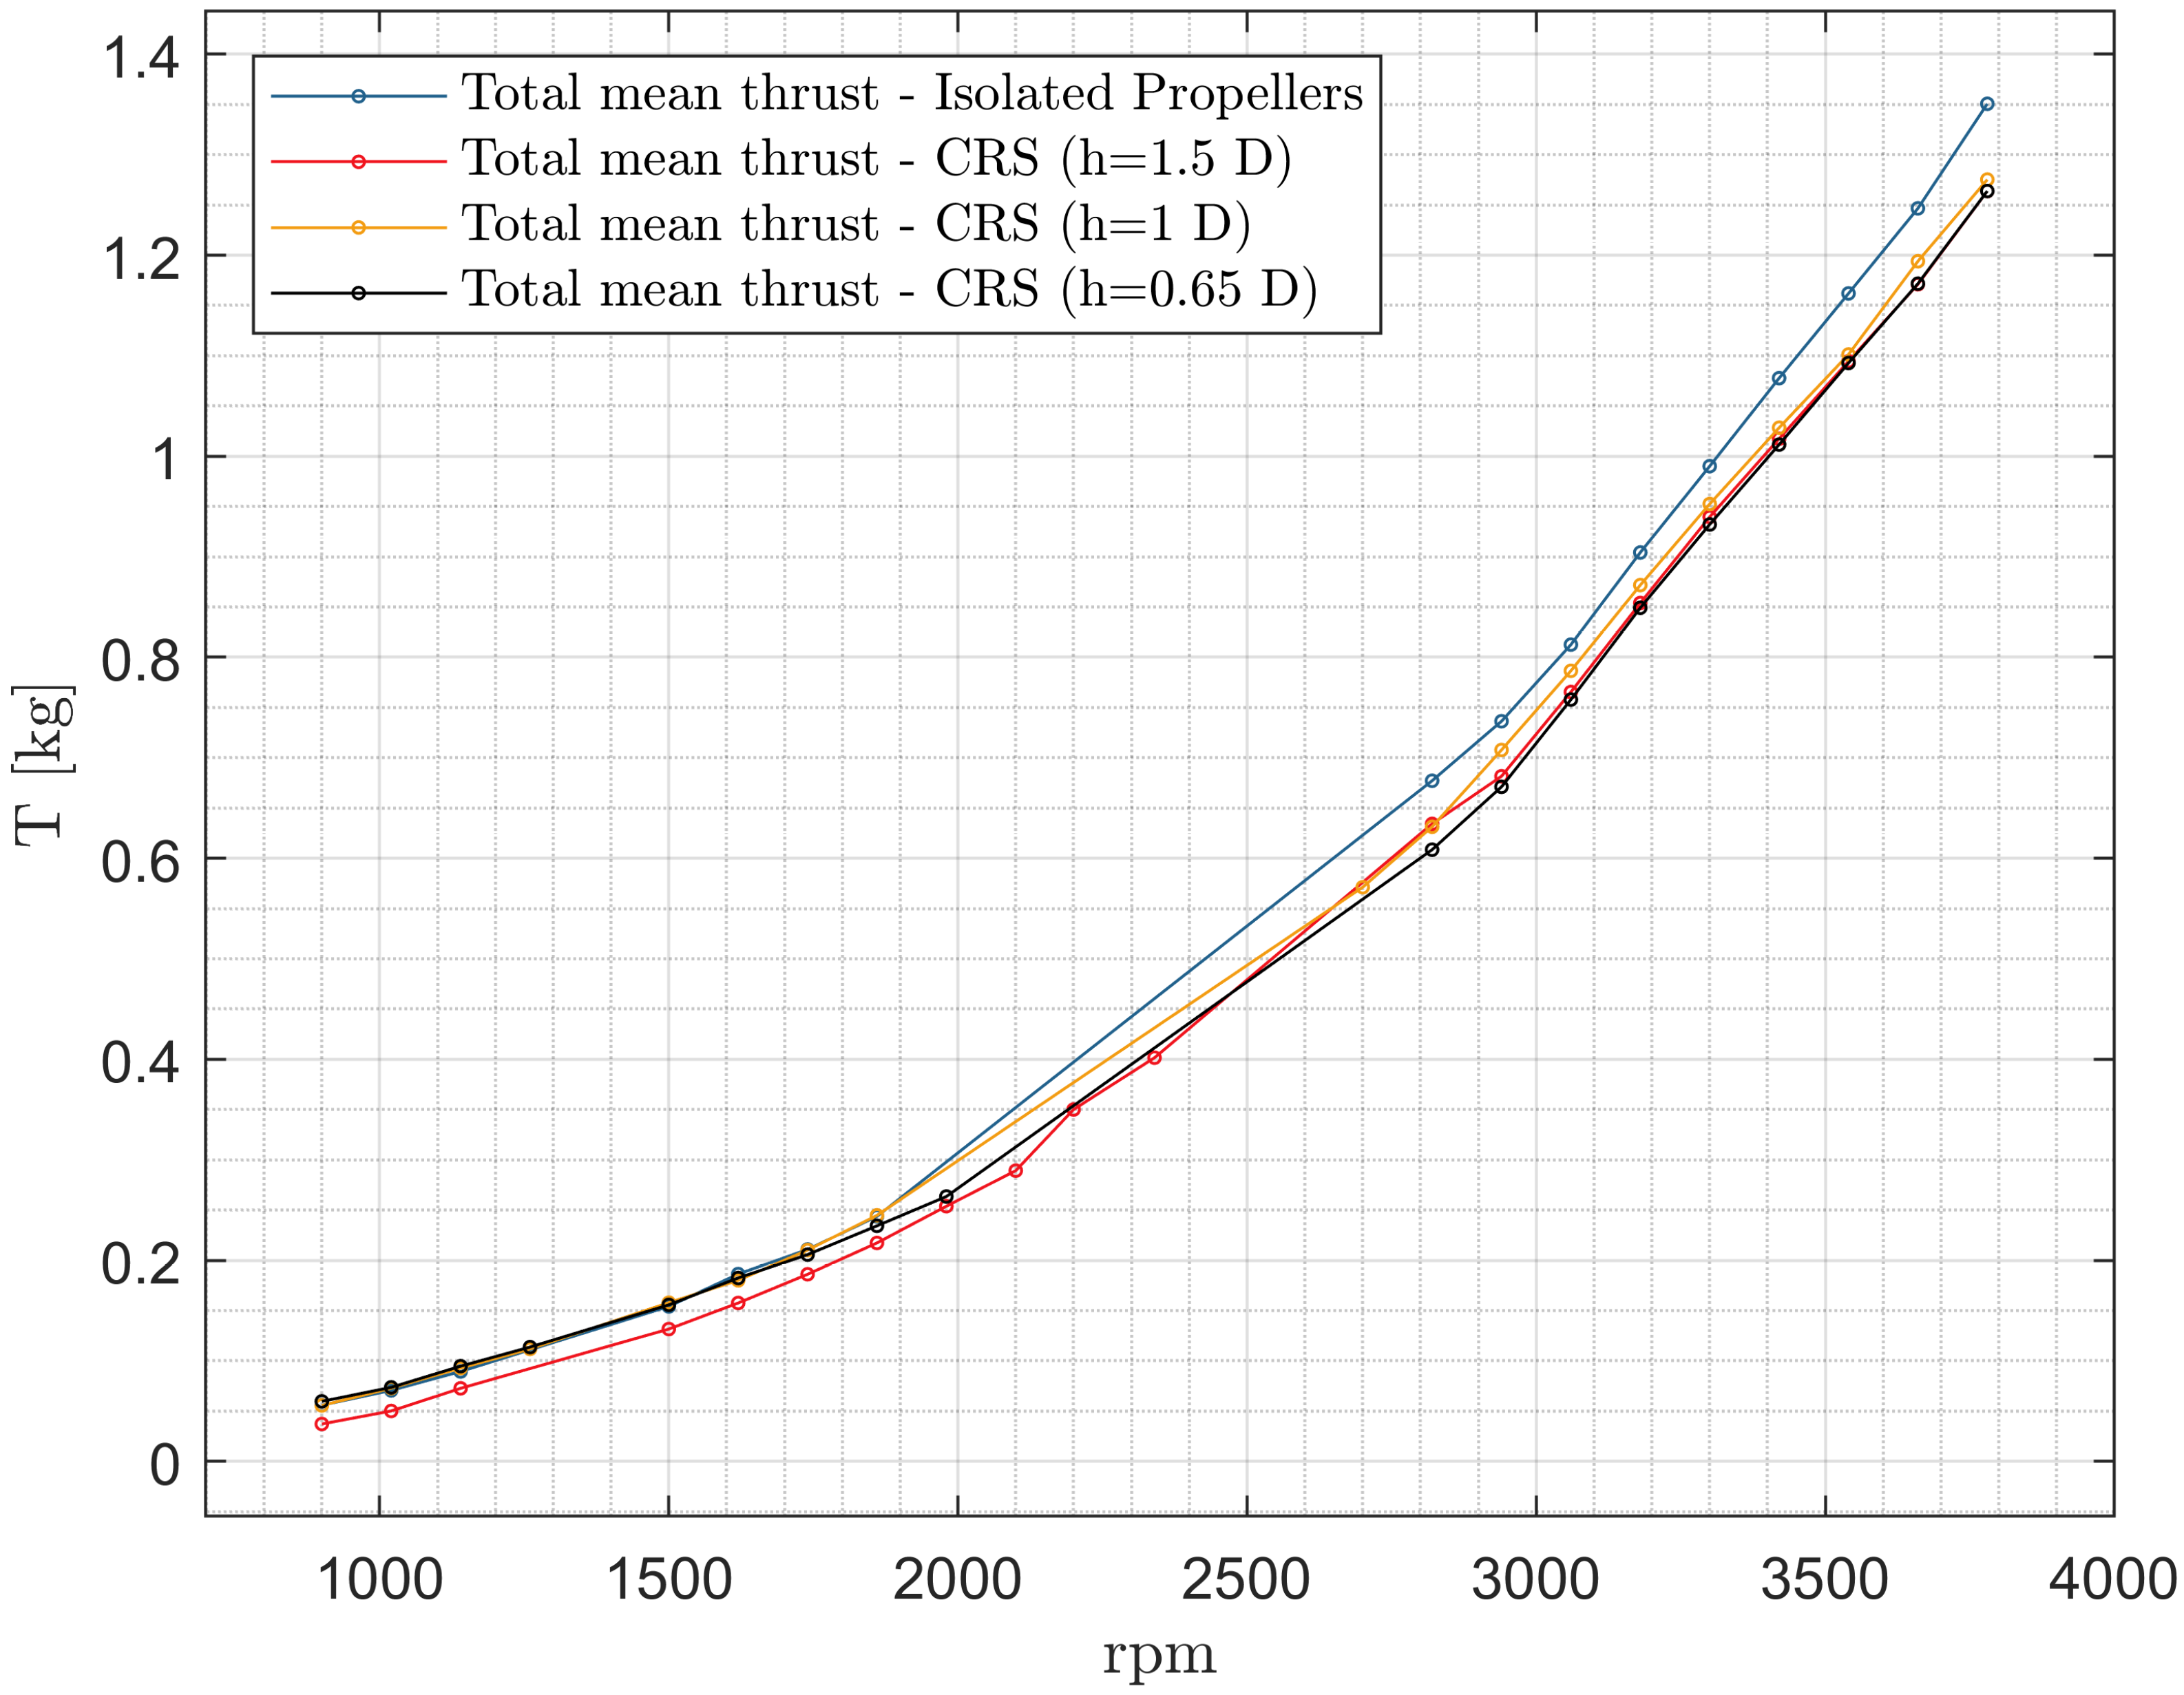
The lower propeller shows some interesting results: the thrust of the isolated lower propeller is always larger than the one of the three test conditions A, B, and C. The thrust performance of the lower propeller is influenced negatively from this aspect since the lower rotor is operating in part in the slipstream of the upper rotor. The upper rotor is experiencing an additional induced flow velocity due to its location in the induced inflow velocity field of the lower rotor, while the lower rotor works instead in the contracted wake of the upper propeller [
37]. As a result, the overall thrust produced by the pressure difference is reduced (
Figure 18). From the viewpoint of the pressure interaction, therefore, the two propellers should be located as far apart as possible [
38].
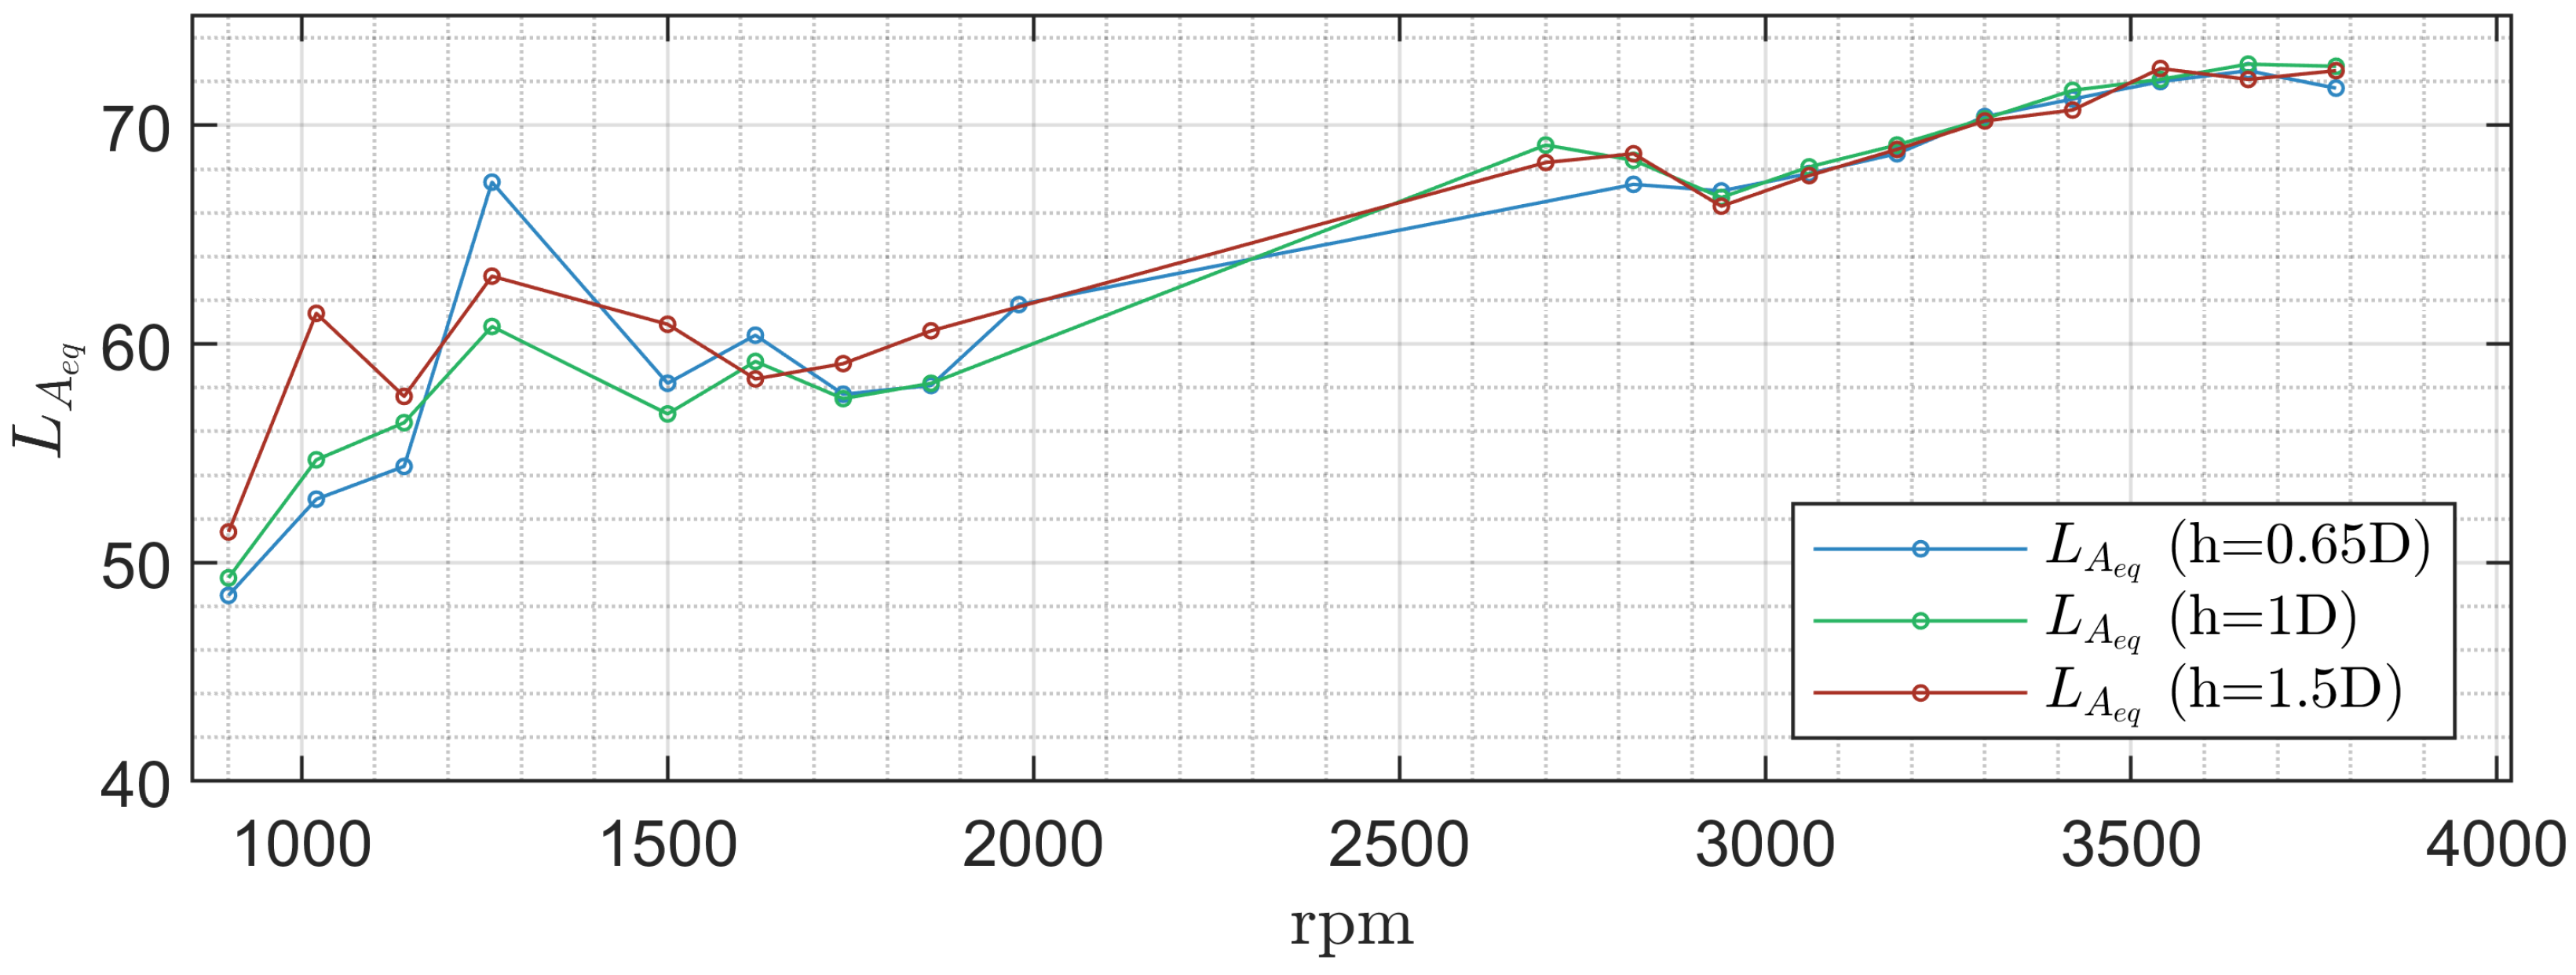
3.2.2. Noise Comparative Analysis
By means of a comparative analysis of the noise results (
Figure 19), it is possible to note two separated regions: for angular velocities lower than 1500 rpm, the noise level is predominantly associated with a motor contribution while, in the other cases, the T-motor + propeller configuration is predominant. In the T-motor + propeller prevalence region, the
grows with the angular velocity.
In the lower rpm region, there occurs a higher variability of the
not attributable to the distance between the propellers but rather to some motor or rig-related occurrences at 1260 rpm. This consideration is triggered by the T-motor prevalence in that angular velocity range. From a structural point of view, for an angular velocity of 1260 rpm, a minor structure resonance occurs so that the measured noise is generated from the mechanical components and not from the motor itself. For angular velocities higher than 2820 rpm, the
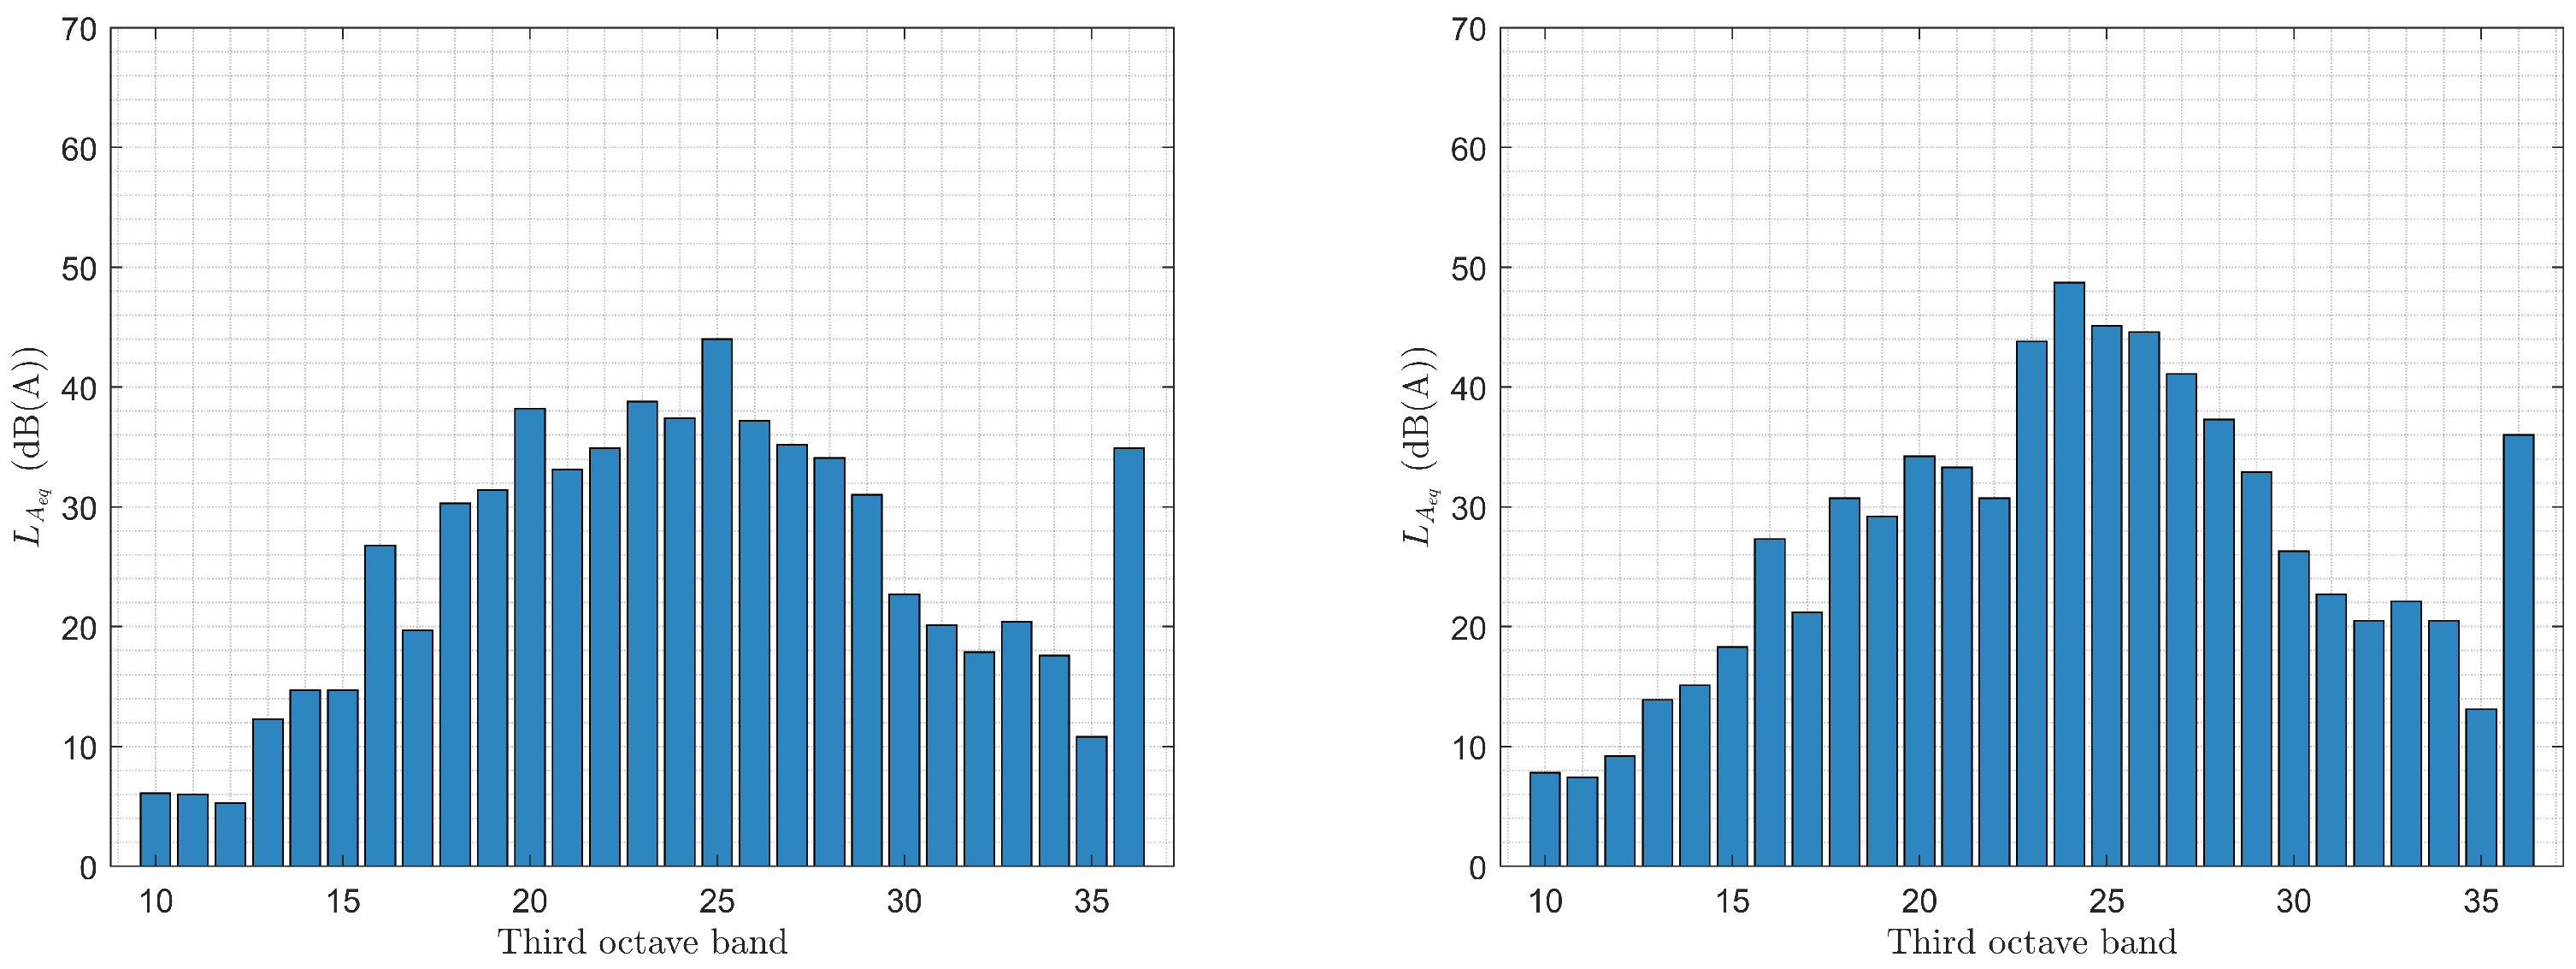
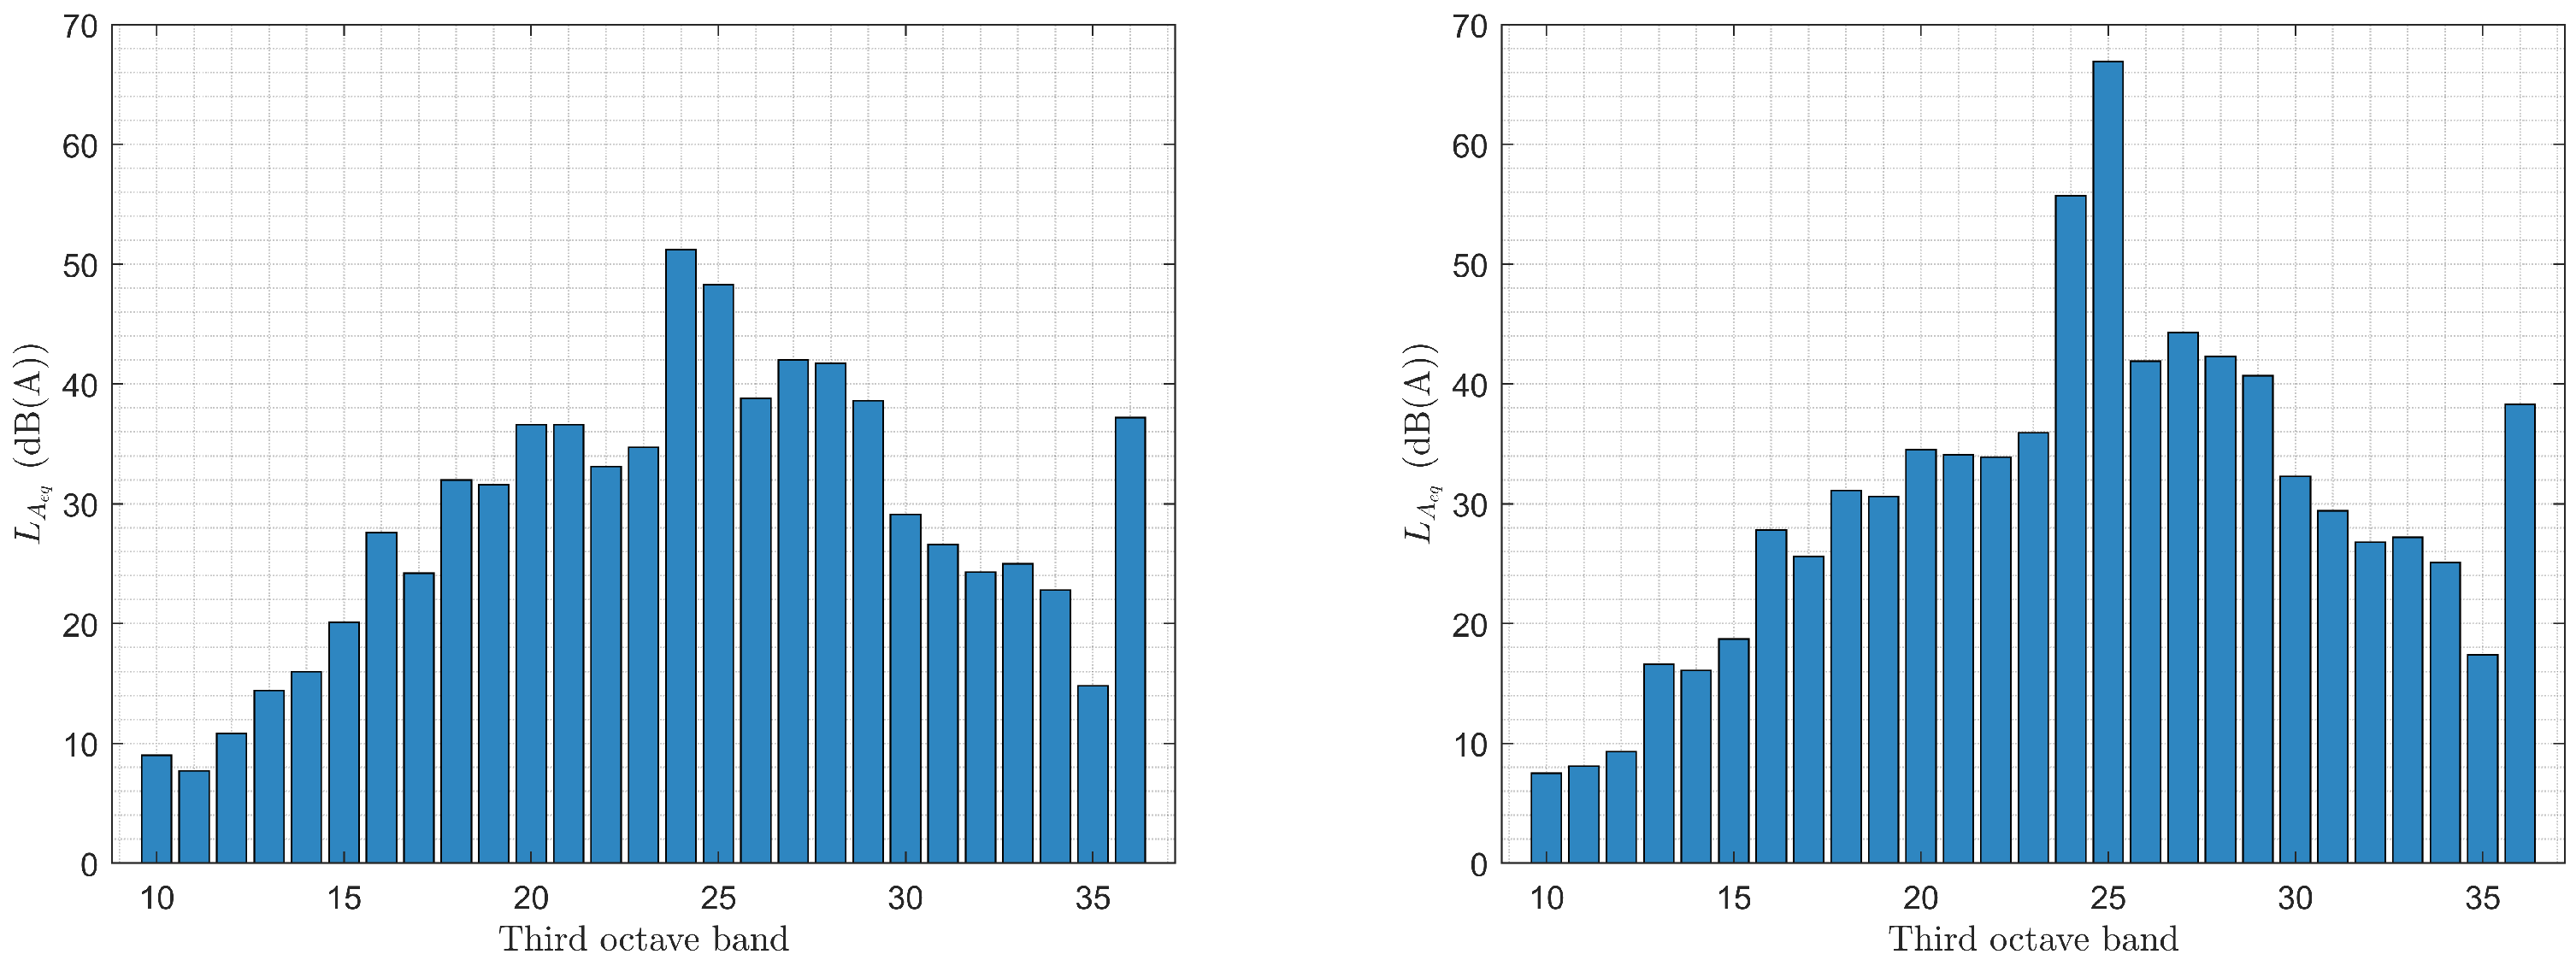
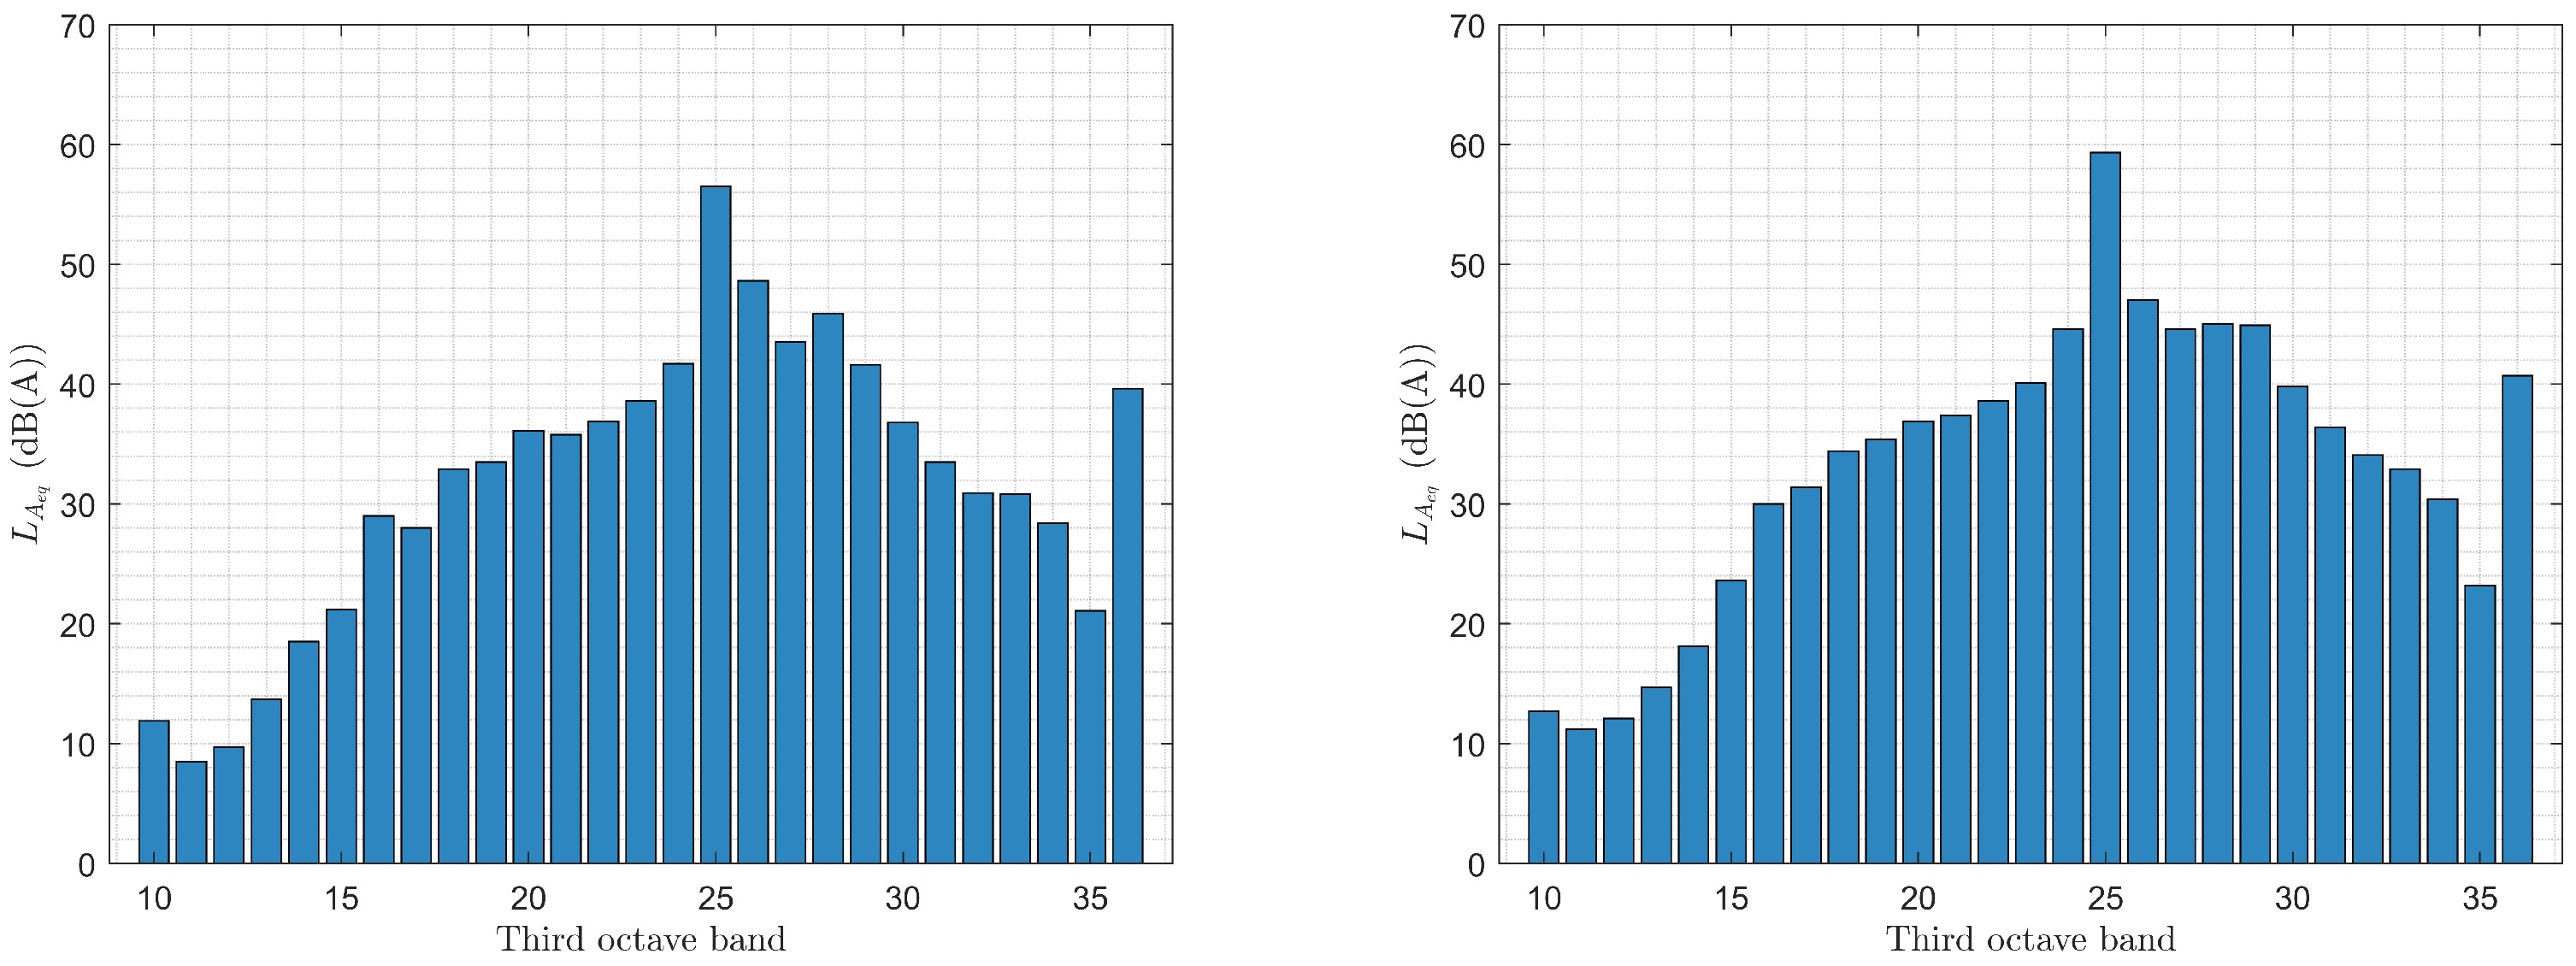
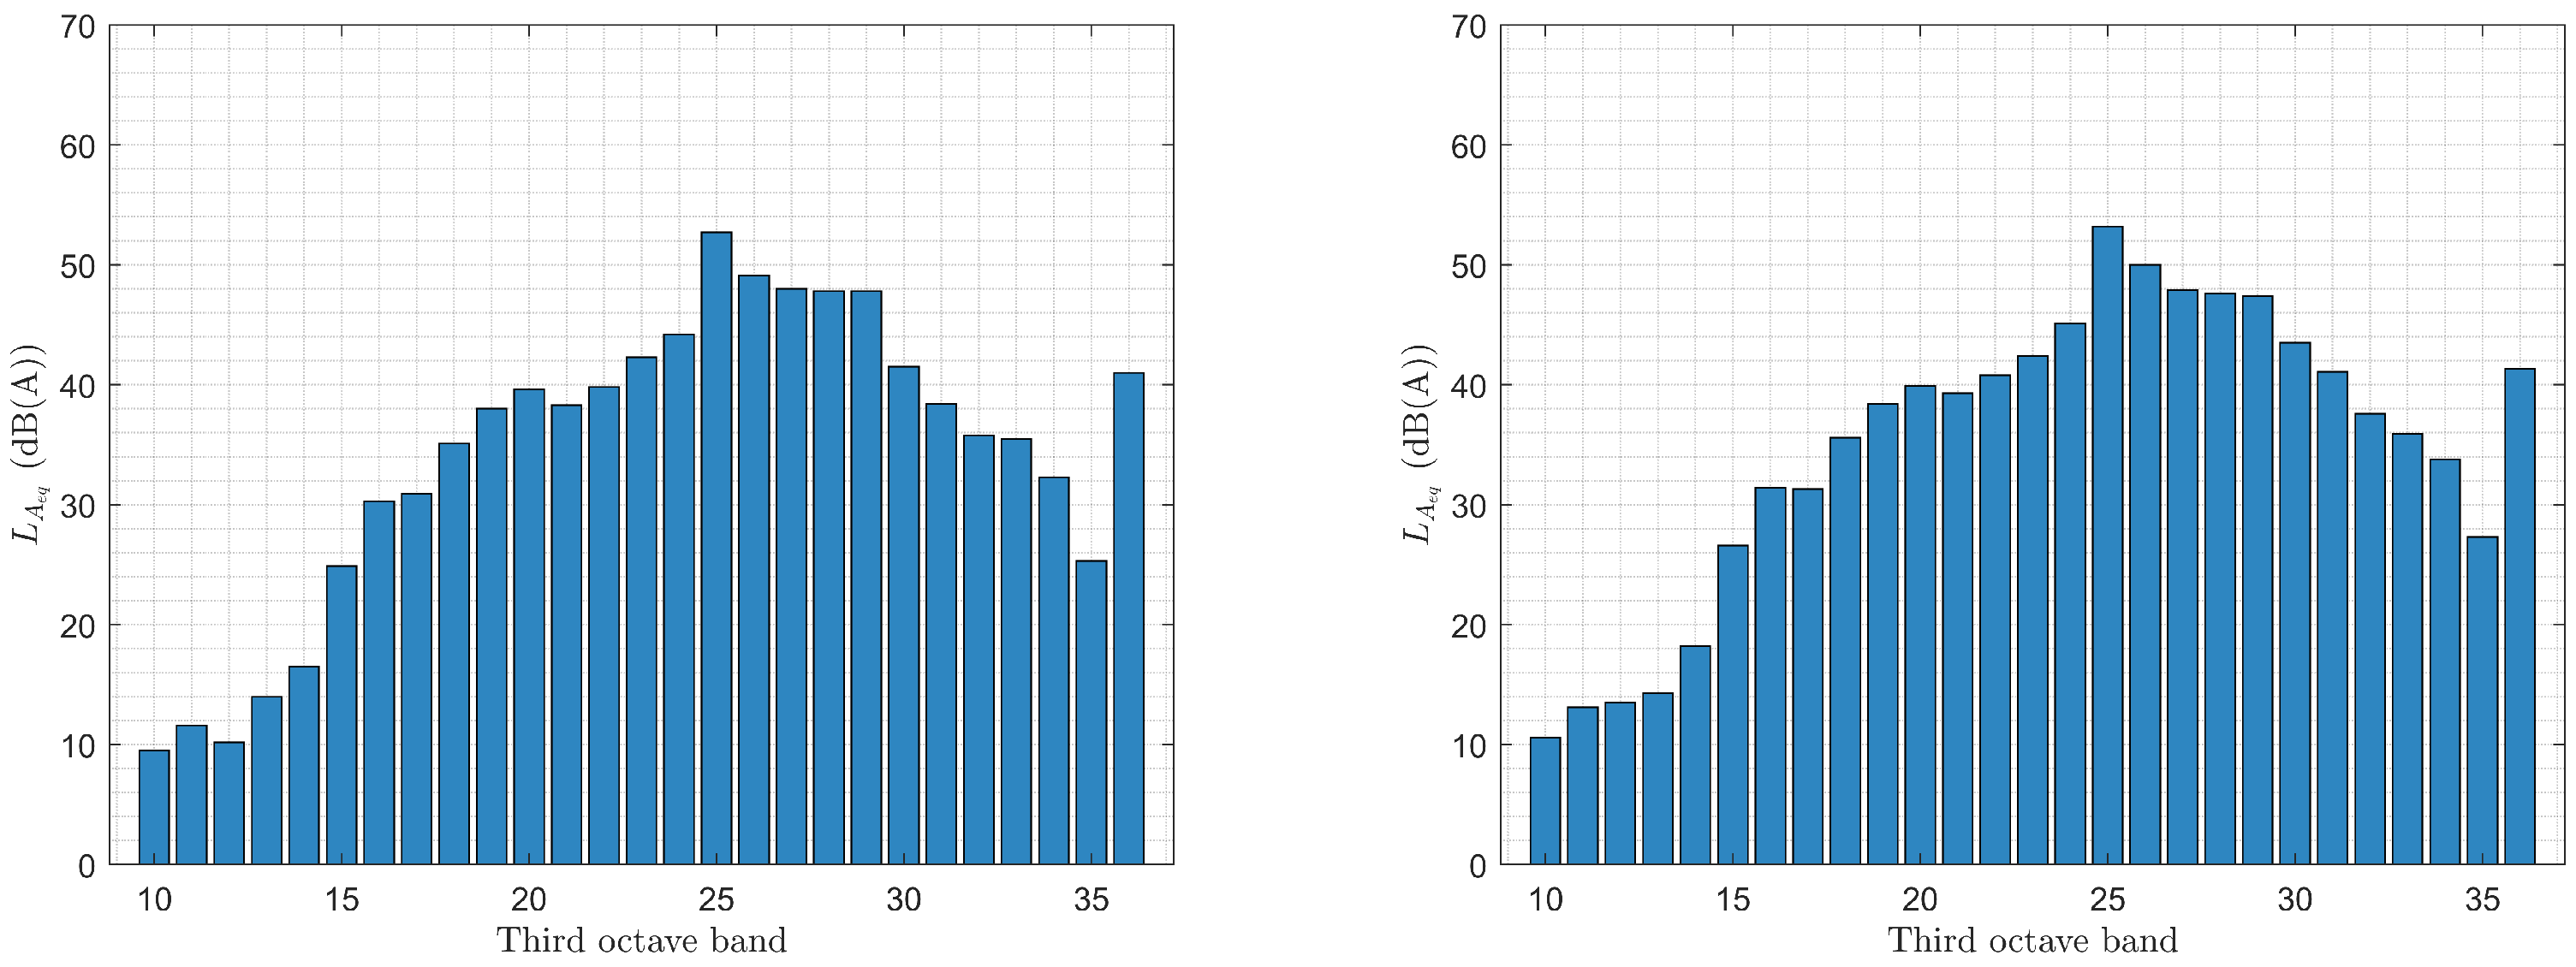
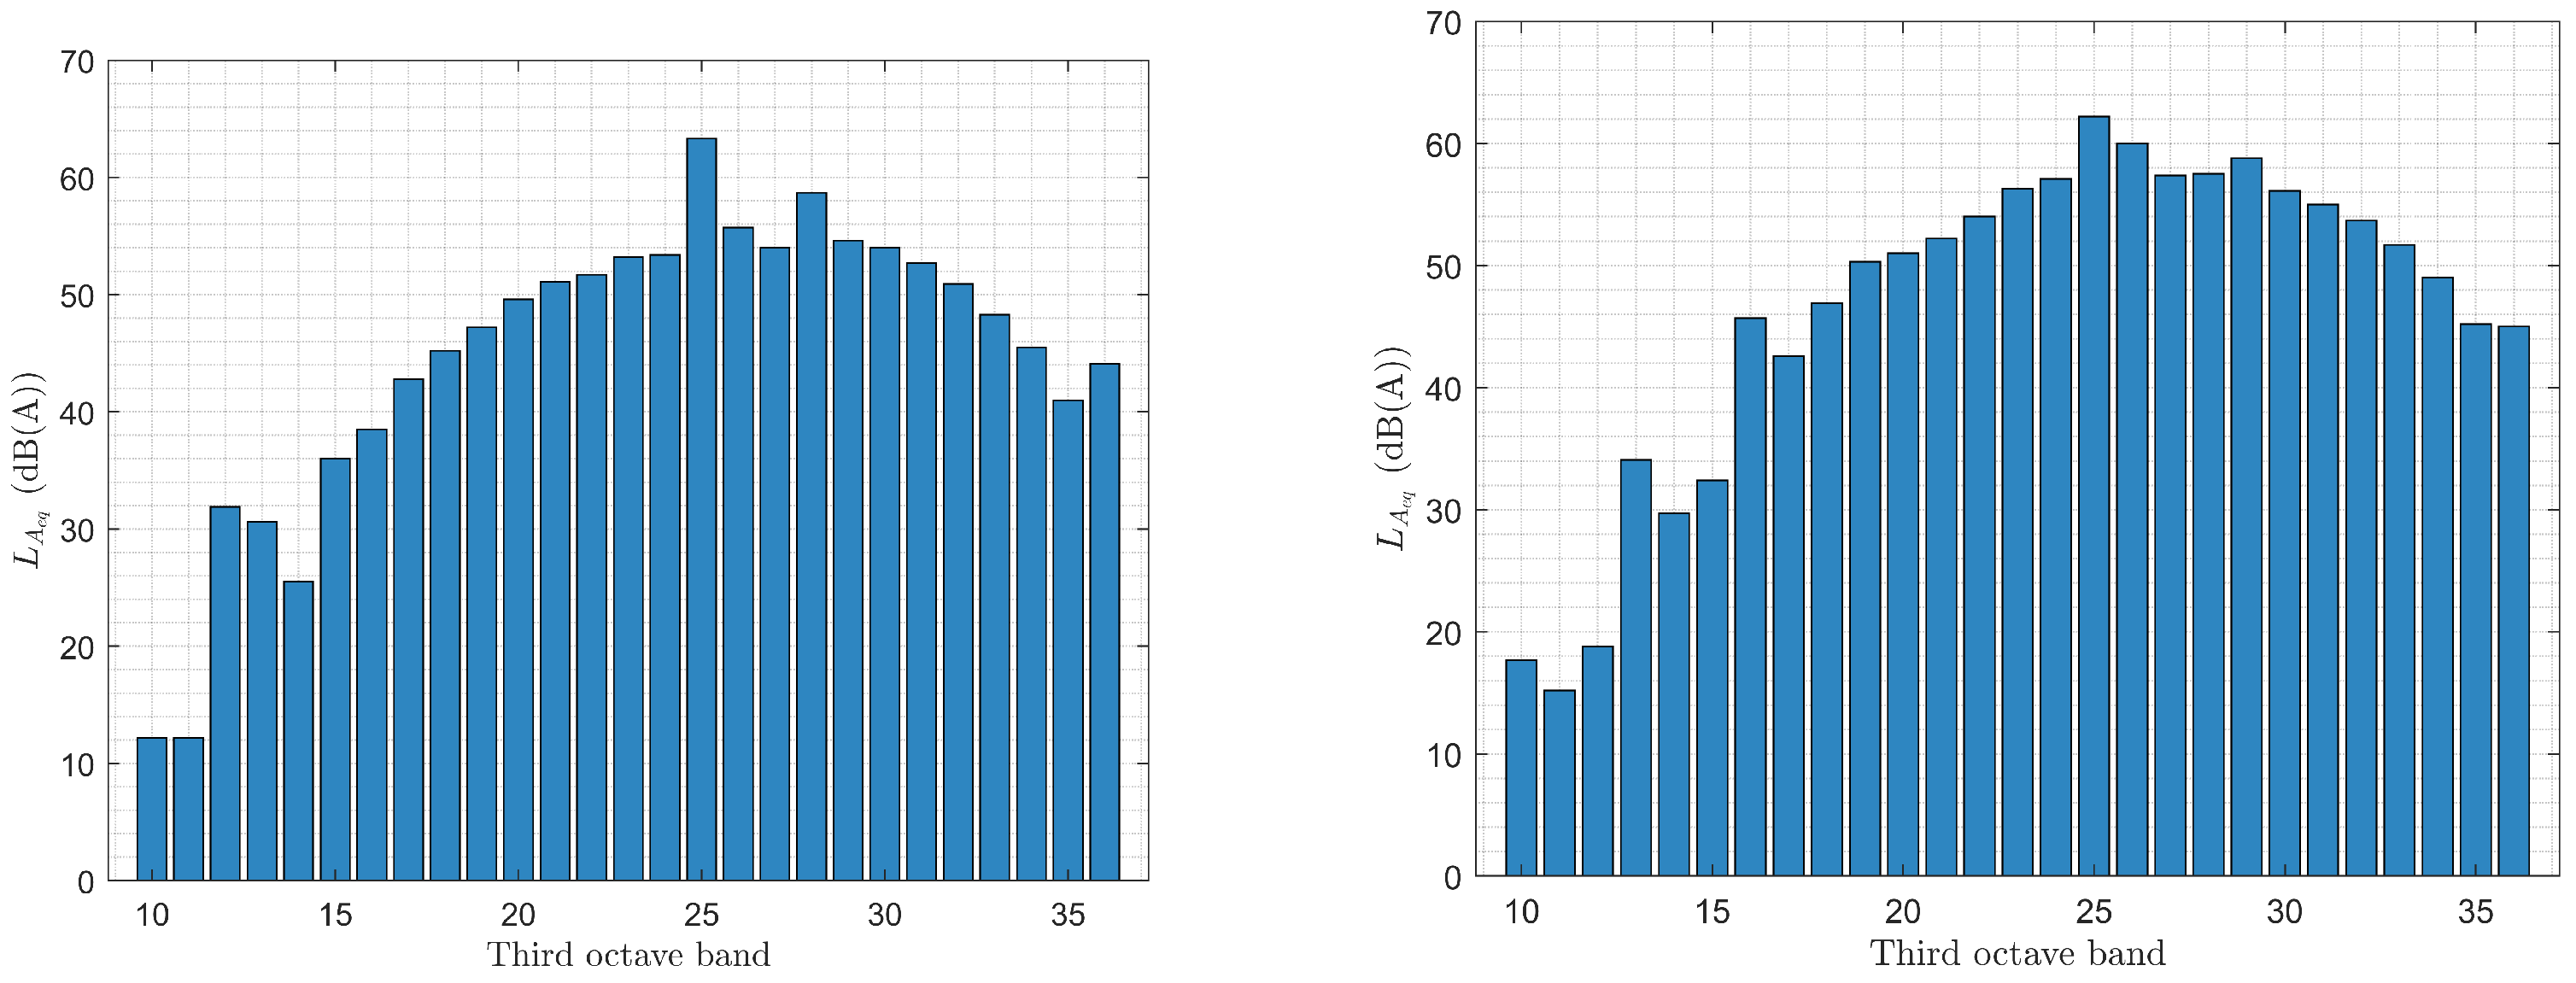
is almost constant with respect to the distance between the propellers. This aspect can be highlighted considering the frequency spectra of test condition C (
Figure 20,
Figure 21,
Figure 22,
Figure 23 and
Figure 24).
4. Conclusions and Remarks
This work was aimed at the design, manufacturing, and testing of a new test facility for coaxial counter-rotating propellers for multirotor applications. This facility has been used to prove that the distance between the two propellers is a sensitive parameter concerning both the thrust and the acoustic performances. Noise characterization of both the T-motor and the T-motor + propeller configuration was carried out: at an angular velocity of 1140 and 1500 rpm, the T-motor configuration shows a higher noise level due to distinct tones appearing in the third octave band of centerbands 1000, 1250, and 1600 Hz; for the other tested velocities, the T-motor + propeller exhibited higher noise. From a thrust point of view, the isolated propeller analysis shown inferior performances of the lower line concerning the angular velocity range between 900–3480 rpm. Further analysis on the complete counter-rotating system showed that the thrust produced by the single propellers, for different values of the inter-axis distance, is lower than the thrust produced by the same propellers when run in isolated conditions. The total mean thrust showed no relevant variation for the three mentioned distance conditions (1.5D, 1D, and 0.65D). The showed higher variability at lower rpm regimes while, at angular velocities higher than 2820 rpm, it was identical concerning the three distance conditions. Finally, as the angular velocity increases, the noise becomes more distributed in frequency.
Future development of this work will address the employment of an ammeter to observe the reduction in the torque motor’s exertion when the two propellers work together. As a consequence, an improvement in the efficiency should be observed.
Author Contributions
Conceptualization, N.R. and F.M.; methodology, F.M. and T.P.; software, N.R and T.P.; validation, F.M., M.G. and T.P.; formal analysis, N.R., A.D.M. and G.M.G.; investigation, N.R., A.D.M. and G.M.G.; resources, F.M.; data curation, N.R.; writing—original draft preparation, N.R., A.D.M. and G.M.G.; review and editing, M.G., T.P. and F.M.; supervision, F.M., T.P. and M.G. All authors have read and agreed to the published version of the manuscript.
Funding
This research received no external funding.
Acknowledgments
Grateful thanks to the Italian company Vertical Aircraft for Innovative Mobility Srl (VAIM) for the donations and materials received for experimental campaigns.
Conflicts of Interest
The authors declare no conflict of interest.
References
- National Academies of Sciences, Engineering and Medicine. Advancing Aerial Mobility: A National Blueprint; National Academies Press: Washington, DC, USA, 2020. [Google Scholar] [CrossRef]
- Sheehan, V. Vertical Flight Society Electric VTOL Directory Hits 600 Concepts; The Vertical Flight Society: Fairfax, VA, USA, 2022. [Google Scholar]
- Rashad, R.; Goerres, J.; Aarts, R.; Engelen, J.B.C.; Stramigioli, S. Fully Actuated Multirotor UAVs: A Literature Review; IEEE Robotics & Automation Magazine, Institute of Electrical and Electronics Engineers Inc.: New York, NY, USA, 2020. [Google Scholar] [CrossRef]
- Coluccia, A.; Parisi, G.; Fascista, A. Detection and Classification of Multirotor Drones in Radar Sensor Networks: A Review. Sensors 2020, 20, 4172. [Google Scholar] [CrossRef]
- Withrow-Maser, S.; Malpica, C.; Nagami, K. Multirotor Configuration Trades Informed by Handling Qualities for Urban Air Mobility Application; NASA Ames Research Center: Mountain View, CA, USA, 2020.
- Mahony, R.; Kumar, V.; Corke, P. Multirotor Aerial Vehicles: Modeling, Estimation, and Control of Quadrotor; IEEE Robotics and Automation magazine, Institute of Electrical and Electronics Engineers Inc.: New York, NY, USA, 2012. [Google Scholar] [CrossRef]
- Prior, S.D. Reviewing and Investigating the Use of Co-Axial Rotor Systems in Small UAVs; Autonomous Systems Laboratory, Department of Product Design and Engineering, School of Engineering and Information Sciences, Middlesex University, Trent Park Campus: London, UK, 2010. [Google Scholar] [CrossRef]
- Cédric, M.S. Optimizing a Coaxial Propulsion System to a Quadcopter; Dept. Engenharia Mecânica, Instituto Superior Técnico: Lisboa, Portugal, 2014. [Google Scholar]
- McCormick, B.W. Aerodynamics of V/STOL Flight; Academic Press, Inc.: Cambridge, MA, USA; Publishing House: New York, NY, USA, 1967; p. 337. [Google Scholar]
- Stepniewski, W.Z.; Keys, C.N. Blade Element Theory, In Rotary-Wing Aerodynamics; Dover Publications, Inc.: Mineola, NY, USA, 1984. [Google Scholar]
- Wald, Q.R. The Aerodynamics of Propellers; Progress in Aerospace Sciences; Elsevier: Amsterdam, The Netherlands, 2006. [Google Scholar] [CrossRef]
- Theodorsen, T. Theory of Propellers; McGraw-Hill: New York, NY, USA, 1948. [Google Scholar]
- Branlard, E. Wind Turbine Aerodynamics and Vorticity-Based Methods; Research Topics in Wind Energy; Springer: New York, NY, USA, 2017; Volume 7. [Google Scholar]
- Leishman, J.G. Principles of Helicopter Aerodynamics, 2nd ed.; Cambridge University Press: Cambridge, UK, 2006; ISBN 978-0-521-85860-1. [Google Scholar]
- Manetti, E. CFD Analysis, Experimental Validation and Optimization of an Octocopter Drone with Counter-Rotating Propellers. Aerotec. Missili Spaz. 2023, 102, 17–27. [Google Scholar] [CrossRef]
- Manetti, E. An Experimental and Numerical Study of the Aerodynamic Interaction between Tandem Overlapping Propellers. Aerotec. Missili Spaz. 2023, 102, 77–89. [Google Scholar] [CrossRef]
- Kotwicz Herniczek, M.T.; Feszty, D.; Meslioui, S.A.; Park, J.; Nitzsche, F. Evaluation of acoustic frequency methods for the prediction of propeller noise. AIAA J. 2019, 57, 2465–2478. [Google Scholar] [CrossRef]
- Hambrey, J.; Kotwicz Herniczek, M.T.; Feszty, D.; Meslioui, S.A.; Park, J. Comparison of three popular methods for the prediction of high speed propeller noise. In Proceedings of the 23rd AIAA/CEAS Aeroacoustics Conference, Denver, CO, USA, 5–9 June 2017. [Google Scholar] [CrossRef]
- Hambrey, J.; Feszty, D.; Meslioui, S.A.; Park, J. Acoustic Prediction of High Speed Propeller Noise Using URANS and a Ffowcs Williams-Hawkings Solver. In Proceedings of the 35th AIAA Applied Aerodynamics Conference, Denver, CO, USA, 5–9 June 2017. [Google Scholar]
- Xue, D.; Yan, Q.; Li, Z.; Wei, K. Multidisciplinary Optimization Design of Low-Noise PropellersMultidisciplinary Optimization Design of Low-Noise Propellers. Aerospace 2023, 10, 254. [Google Scholar] [CrossRef]
- Holmes, J.B.; Durham, M.H.; Tarry, S.E. Small aircraft transportation system concept and technologies. J. Aircraft. 2004, 41, 26–35. [Google Scholar] [CrossRef]
- Ffowcs Williams, J.E.; Hall, L.H. Aerodynamic Sound Generation by Turbulent Flow in the Vicinity of a Scattering Half Plane. J. Fluid Mech. 1970, 40, 657–670. [Google Scholar] [CrossRef]
- Sinibaldi, G.; Marino, L. Experimental Analysis on the Noise of Propellers for Small UAV; Department of Mechanical and Aerospace Engineering, University of Rome La Sapienza: Roma, Italy, 2013. [Google Scholar] [CrossRef]
- Suzuki, Y.; Takeshima, H. Equal-loudness-level contours for pure tones. J. Acoust. Soc. Am. 2004, 116, 918–933. [Google Scholar] [CrossRef]
- T-Motor. T-Motor Antigravity 4004 KV300—2PCS/SET. Available online: https://robocraft.co.in/product/t-motor-antigravity-4004-kv300-2pcs-set (accessed on 2 May 2021).
- Picotronik. Serie ABB(70). Available online: https://www.picotronik.it/wp-content/uploads/2016/08/ABB_7000.pdf (accessed on 9 May 2021).
- AVIA-Semiconductor, 24-Bit Analog-to-Digital Converter. Available online: https://cdn.sparkfun.com/datasheets/Sensors/ForceFlex/hx711_english.pdf (accessed on 2 May 2021).
- Bramwell, A.R.S. Helicopter Dynamics; Butterworth-Heinemann Ltd: Portsmouth, UK, 1976. [Google Scholar]
- Gessow, A.; Myers, G.C. Aerodynamics of the Helicopter; The Macmillan Company: New York, NY, USA, 1952. [Google Scholar]
- Johnson, W. Helicopter Theory; Dover Publications; Princeton University Press: Princeton, NJ, USA, 1984. [Google Scholar]
- Leishman, J.G. Principles of Helicopter Aerodynamics; Cambridge Aerospace Series; Cambridg University Press: Cambridge, UK, 2000. [Google Scholar]
- Capone, A.; Di Felice, F.; Pereira, F.A. On the Flow Field Induced by Two Counter-Rotating Propellers at Varying Load Conditions; Ocean Engineering: Orlando, FL, USA, 2021; Volume 221. [Google Scholar] [CrossRef]
- Lugt, H.J. Autorotation. Annu. Rev. Fluid Mech. 1983, 15, 123–147. [Google Scholar] [CrossRef]
- Houston, S.S.; Brown, R.E. Rotor-wake modeling for simulation of helicopter flight mechanics in autorotation. J. Aircr. 2003, 40, 938–945. [Google Scholar] [CrossRef]
- Houston, S.S. Modeling and Analysis of Helicopter Flight Mechanics in Autorotation. J. Aircr. 2003, 40, 675–682. [Google Scholar] [CrossRef]
- NTi Audio. Available online: https://www.nti-audio.com/Portals/0/data/en/XL2-Specifications.pdf (accessed on 12 May 2021).
- Thiele, M.; Obster, M.; Hornung, M. Aerodynamic Modeling of Coaxial Counter-Rotating UAV Propellers. In Proceedings of the 8th Biennial Autonomous VTOL Technical Meeting, Mesa, AZ, USA, 28 January–1 February 2019. [Google Scholar]
- Min, K.-S.; Chang, B.-J.; Seo, H.-W. Study on the Contra-Rotating Propeller System Design and Full-Scale Performance Prediction Method; Hyundai Heavy Industries, Co. Ltd.: Ulsan, Republic of Korea, 2009. [Google Scholar] [CrossRef]
Figure 1.
An overview of the experimental setup.
Figure 1.
An overview of the experimental setup.
Figure 2.
Rig final theoretical configuration: CAD model (left) and construction (right).
Figure 2.
Rig final theoretical configuration: CAD model (left) and construction (right).
Figure 3.
Vertical arm assembly, from the left: arm-load cell interface, load cell, T-motor support.
Figure 3.
Vertical arm assembly, from the left: arm-load cell interface, load cell, T-motor support.
Figure 4.
Complete vertical arm configuration.
Figure 4.
Complete vertical arm configuration.
Figure 5.
Magnetic Hall effect sensor (left) and handheld computer (right).
Figure 5.
Magnetic Hall effect sensor (left) and handheld computer (right).
Figure 6.
Experimental setup for the isolated propeller condition.
Figure 6.
Experimental setup for the isolated propeller condition.
Figure 7.
Thrust variation varying rpm for the isolated propellers.
Figure 7.
Thrust variation varying rpm for the isolated propellers.
Figure 8.
spectrogram at 900 rpm: T-motor (left), T-motor + propeller (right).
Figure 8.
spectrogram at 900 rpm: T-motor (left), T-motor + propeller (right).
Figure 9.
spectrogram at 1020 rpm: T-motor (left), T-motor + propeller (right).
Figure 9.
spectrogram at 1020 rpm: T-motor (left), T-motor + propeller (right).
Figure 10.
spectrogram at 1140 rpm: T-motor (left), T-motor + propeller (right).
Figure 10.
spectrogram at 1140 rpm: T-motor (left), T-motor + propeller (right).
Figure 11.
spectrogram at 1500 rpm: T-motor (left), T-motor + propeller (right).
Figure 11.
spectrogram at 1500 rpm: T-motor (left), T-motor + propeller (right).
Figure 12.
spectrogram at 1620 rpm: T-motor (left), T-motor + propeller (right).
Figure 12.
spectrogram at 1620 rpm: T-motor (left), T-motor + propeller (right).
Figure 13.
spectrogram at 1740 rpm: T-motor (left), T-motor + propeller (right).
Figure 13.
spectrogram at 1740 rpm: T-motor (left), T-motor + propeller (right).
Figure 14.
spectrogram at 1860 rpm: T-motor (left), T-motor + propeller (right).
Figure 14.
spectrogram at 1860 rpm: T-motor (left), T-motor + propeller (right).
Figure 15.
spectrogram at 2820 rpm: T-motor (left), T-motor + propeller (right).
Figure 15.
spectrogram at 2820 rpm: T-motor (left), T-motor + propeller (right).
Figure 16.
varying rpm. Isolated propeller noise characterization.
Figure 16.
varying rpm. Isolated propeller noise characterization.
Figure 17.
Thrust varying rpm for test conditions A, B, and C and isolated propellers.
Figure 17.
Thrust varying rpm for test conditions A, B, and C and isolated propellers.
Figure 18.
Total mean thrust varying rpm for test conditions A, B, and C and isolated propellers.
Figure 18.
Total mean thrust varying rpm for test conditions A, B, and C and isolated propellers.
Figure 19.
varying rpm for test conditions A, B, and C.
Figure 19.
varying rpm for test conditions A, B, and C.
Figure 20.
in third octave band in test condition C, 900 rpm (left) and 1020 rpm (right).
Figure 20.
in third octave band in test condition C, 900 rpm (left) and 1020 rpm (right).
Figure 21.
in third octave band in test condition C, 1140 rpm (left) and 1260 rpm (right).
Figure 21.
in third octave band in test condition C, 1140 rpm (left) and 1260 rpm (right).
Figure 22.
in third octave band in test condition C, 1500 rpm (left) and 1620 rpm (right).
Figure 22.
in third octave band in test condition C, 1500 rpm (left) and 1620 rpm (right).
Figure 23.
in third octave band in test condition C, 1740 rpm (left) and 1860 rpm (right).
Figure 23.
in third octave band in test condition C, 1740 rpm (left) and 1860 rpm (right).
Figure 24.
in third octave band in test condition C, 2700 rpm (left) and 3180 rpm (right).
Figure 24.
in third octave band in test condition C, 2700 rpm (left) and 3180 rpm (right).
| Disclaimer/Publisher’s Note: The statements, opinions and data contained in all publications are solely those of the individual author(s) and contributor(s) and not of MDPI and/or the editor(s). MDPI and/or the editor(s) disclaim responsibility for any injury to people or property resulting from any ideas, methods, instructions or products referred to in the content. |
© 2023 by the authors. Licensee MDPI, Basel, Switzerland. This article is an open access article distributed under the terms and conditions of the Creative Commons Attribution (CC BY) license (https://creativecommons.org/licenses/by/4.0/).

 ,
, 


