1. Introduction
Compared to post hoc incidence investigation, proactive risk management has attracted significantly more attention from airlines than ever before [
1]. The Federal Aviation Administration (FAA) has called on airlines to play a more proactive role in managing risks by developing protocols to address them [
2]. Proactive risk management is a forward-thinking method that focuses on anticipating risks to prevent damage, instead of simply reacting to risks. One effective method utilized in proactive risk management is flight data-based flight safety management. Fortunately, in routine FOQA (Flight Operation Quality Assurance) projects, a large number of flight data are collected [
3], providing ample data for flight data-based flight safety management. For example, to prevent safety incidents caused by a decline in driving skills, pilots are trained based on accident, routine flight, and training data, which is known as EBT (Evidence-Based Training). Although the ED (Exceedance Detection) used in commercial airlines can detect abnormal flights (which are known as exceedances), when the variables exceed the SME (Subject Matter Expert)-defined limitations, it is hard to identify potential risks.
Various data science techniques such as machine learning have been employed to identify potential risks in aviation. Most of these techniques rely on the theory of anomaly detection. However, these methods have a fundamental limitation: they assume that abnormal data instances should be significantly fewer in number than normal data instances. This assumption leads to difficulties in detecting group-scale precursors [
4], which consist of a larger number of flights with similar potential risks. Moreover, data-driven methods often adopt hyperparameter adjustment criteria based on anomaly detection rates, making it challenging to explain risky flight conditions.
Recently, there has been a growing interest in identifying precursors that could lead to abnormal flight conditions. Precursor mining is regarded as a weakly-supervised learning problem that can estimate the likelihood of a safety incident occurring and determine when precursors are likely to appear. Deep learning tools, such as DT-MIL (Deep Temporal Multiple Instance Learning) [
5] and IM-DoPE (Intelligent Methodology for the Discovery of Precursors of Adverse Events), ref. [
6] have shown remarkable performance in identifying precursors in individual flight time series. However, the issue of group-scale precursors that have similar potential risks has yet to be fully explored. Unlike the precursors studied in individual flights or novelty detection, the group-scale precursor mining problem aims to identify and explain patterns that exhibit potential risks consisting of multiple flights.
We propose a novel method for identifying potential risks in routine commercial aircraft using group-scale precursors. The precursors in the approach phase are the focus of this research. They are considered to be induced by factors such as manipulation habits and training, resulting in the degradation of nominal flight conditions. Unlike traditional anomaly detection, these precursors are not represented as outliers but as groups of flights exhibiting similar characteristics. By focusing on these high-risk flight scenarios, we can develop a more targeted method for detecting and addressing potential safety events, thus contributing to improved flight safety and reducing potential risks.
As a powerful technique for knowledge discovery, machine learning techniques have shown great performance in extracting valuable information from large complex accident datasets in aviation safety [
7] such as anomaly detection from flight data [
8,
9], human factor discovery from safety incident reports [
10,
11], and go-around flight detection from ADS-B data [
12]. The research that is most relevant to discovering and explaining safety incidents based on flight data is summarized below.
Anomaly detection tools are commonly used to identify potential risks in aviation due to the substantial number of nominal flights relative to the number of fatal accidents. Typically, these tools establish classifiers based on an assumption of unbalanced data to identify potential risks. For example, OC-SVM (One Class-Support Vector Machine), which utilizes multiple kernel functions as the measurement to evaluate the abnormal behaviors described through continuous and discrete variables, has been adopted to identify abnormal operations [
13]. Another typical example is the IMS (Inductive Monitoring System) [
14], in which a flight is assigned to the nearest cluster and given the same label as the cluster. Clustering shows remarkable performance in aviation anomaly detection due to its natural grouping ability and the need for unlabeled data [
15,
16,
17]. Density segmentation-based clustering has been used to detect different areas and flight data in sparse areas were defined as anomalies [
18]. Further, to evaluate the anomaly degree of each outlier, the LOP (Local Outlier Probability) has been applied to obtain the outlier scores [
19]. Researchers have also attempted to develop nominal behavior classifiers using deep learning technologies. Thanks to their powerful feature-capturing ability, deep temporal neural networks have performed well in detecting adverse events [
5]. For instance, an AE (Auto-Encoder) and a CVAE (Convolutional Variation Auto-Encoder) have been utilized to discover adverse events by reconstructing flights in a lower-dimensional space [
8,
20,
21]. However, restricted by the need for a large amount of training data, these methods did not perform well in discovering potential risks. It is evident that general anomaly detection tools struggle to identify group-scale precursors because of the fundamental data assumption of anomaly detection and the unexplainable results obtained from non-domain-related hyperparameter adjustment criteria.
Empirically setting hyperparameters can result in incomplete information and results that are difficult to understand. In practice, adjusting the hyperparameters according to anomaly detection rates of 1%, 3%, and 5% is common [
18,
19,
22,
23], as the precursors lack a clear definition. This strategy is practical because the clustering results are sensitive to hyperparameters. However, the results obtained with these detection rates are unreliable because the clusters and outliers are adjusted empirically. For example, when the anomaly detection rate is increased, a flight that was originally identified as normal might be considered an anomalous flight. This change is hard to explain from a flight safety perspective. Furthermore, focusing only on outliers will overlook clusters with similar risks such as flights within a cluster exhibiting specific deviations in energy states. In addition, utilizing these detection rates overlooks important safety information because the data distribution and domain knowledge are not considered, and the strategy may fail when the data are not substantial. To address these limitations, specific methods have been utilized to obtain natural clustering results to guide the adjustment of hyperparameters. In [
24], a Bayesian Information Criterion (BIC) was used to determine the number of components in a Gaussian Mixture Model (GMM), and the DBSCAN method was then utilized to merge similar flights. The hyperparameters of DBSCAN were set according to the GMM test results. However, using such hyperparameter adjustment criteria lacks domain guidance, leading to hard-to-explain clusters and outliers in the analysis.
Moreover, efforts have been made to emphasize the precursors so they can be detected. To achieve this, specific methods, such as PCA (Principal Component Analysis), t-SNE (t-Distributed Stochastic Neighbor Embedding), and AE [
18,
21,
25], have been used to extract the features of high-dimensional flight data to highlight the differences between nominal and abnormal flights. Nevertheless, these techniques generated unexplainable features, leading to results that were difficult to comprehend. Methods combining flight theories have been used to characterize anomaly flights to address this issue. For example, the energy-related coefficients derived from additional performance models [
4] have been applied to explore flight performance during approach. Moreover, statistical methods, such as the mean and variance of key flight variables, have been widely used to identify potential risks [
26,
27].
Enhancing the dissimilarity between nominal and precursory flights is another way to highlight the precursors. Euclidean distance has been widely used in the aviation industry to measure the similarity between flights [
14]. Additionally, to describe the distance between heterogeneous flight data, nLCS (Longest Common Subsequence) [
28] and VAR (Vector Autoregression) [
29] models have been applied to measure the discrete variables and continuous variables, respectively. However, using traditional similarity measurements to identify small clusters was challenging because the “data background” was not considered, resulting in a weak ability to distinguish clusters with similar densities [
30]. To address this issue, Mahalanobis distance was used to measure the dissimilarity in [
31], taking into account the data background. Considering the data background, the distance between two flights increases when they are in a high-density area and decreases when they are in a low-density area [
32]. Such data-independent measurements are useful for identifying flights with group-scale precursors.
Catalyst Mass Clustering Analysis (CMCA) is proposed to discover the group-scale precursors. The main contributions of this paper are as follows: (1) A clustering method is developed to capture the group-scale precursors. (2) A domain-knowledge-based hyperparameter adjustment criterion is proposed to find clusters with different performances during approach. (3) Labels for majority-unlabeled flight group-scale precursors are generated from minority-labeled flight data.
Exploring group-scale precursors can assist domain experts in characterizing the abnormal behavior of flights while also providing targeted training suggestions for different types of pilots, making the proposed method valuable for stakeholders. The rest of the paper is organized as follows.
Section 2 outlines the steps involved in CMCA. Then, in
Section 3, the experimental results are compared, and in
Section 4, the method’s performance is discussed. Finally, our method’s key benefits and main innovations are summarized in the conclusion.
2. Methodology
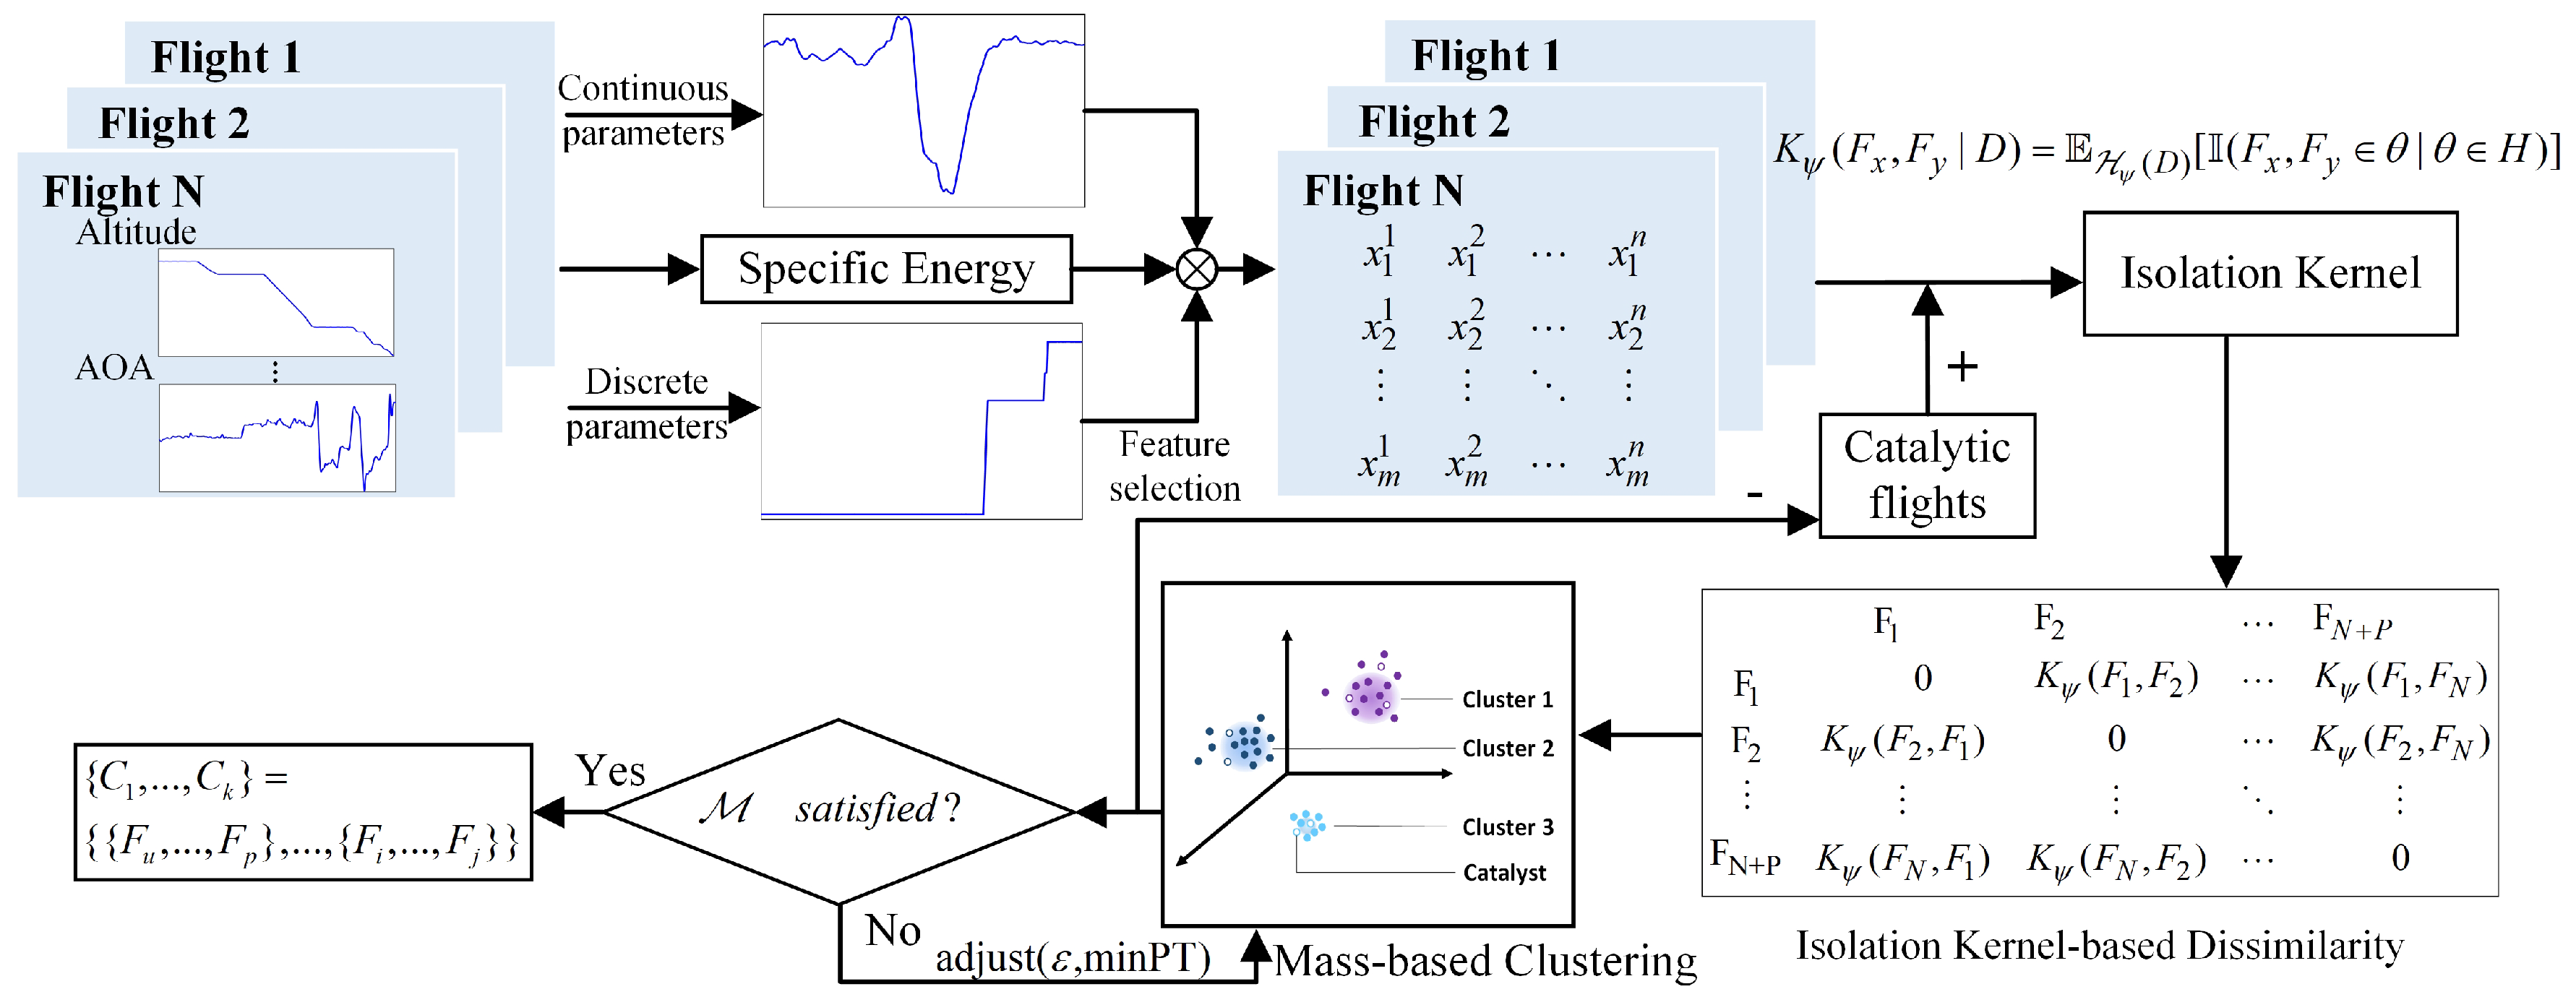
The process of performing CMCA is shown in
Figure 1. First, the continuous and discrete flight variables are selected using various methods based on the energy analysis. Second, the dissimilarity matrix is obtained by calculating the isolation dissimilarity of
N flights and
P catalysts. Then, the mass-based clustering is implemented, in which the hyperparameters are adjusted until the optimization goal
is satisfied and the labeled group-scale precursors can be acquired.
2.1. Energy-Based Feature Selection
Before implementing the clustering algorithm, it is necessary to eliminate redundant variables because they can not only seriously affect the performance of machine learning algorithms but also result in the failure of similarity measurements due to dimension explosion. The flight variables that are available in the data can be divided into three categories: data related to the performance of the aircraft such as the aircraft’s weight and ground speed; environmental data such as the atmospheric temperature; and attitude configuration data such as the angle of attack and Euler angles.
The variables are selected based on the energy change because the energy variation is closely linked to flight safety during approach. Continuous variables describing the aircraft’s state such as the altitude and speed can be extracted through their correlations with energy changes. Discrete variables contain practical safety information about pilots’ maneuvers; however, the correlation between the discrete control variables and energy is not significant in mathematical terms. For example, changing the flaps from 0 to 5 degrees will increase the aircraft drag, leading to slower airspeed and higher energy consumption. Correlations such as the Pearson index between energy and variables such as the flap angle may not be significant because the flap angle is just a step signal. However, according to the mechanism analysis, the change of flaps is very important for the energy state. As a result, various methods have been proposed to select continuous and discrete variables separately.
The process of continuous variable selection is shown in Algorithm 1. The complete set
contains all the continuous variables. The set
represents the features selected by the algorithm. In step 1, set
S extracts one element once from
, not returning it until all the variables closely related to energy are obtained. Every time a new variable
is upgraded, the energy
is derived, as shown in Equation (
1)
| Algorithm 1: Continuous feature selection |
 |
In the equation,
V represents the airspeed,
H denotes the altitude, and
g represents the acceleration of gravity. In this research, we adopted the Maximal Information Coefficient (MIC)
, which can capture both linear and nonlinear associations.
is derived from Equation (
2).
where
represents the correlation coefficient of
and
represents the joint probability of variables
.
Once all the elements in the complete set have been processed, Step 2 is augmented to remove features with high collinearity in S. First, the new set is constructed using a randomly chosen element from S. Then, the correlation coefficients between elements f and set are calculated as . Next, the element f with the weakest correlation is merged into until all elements in S are traversed.
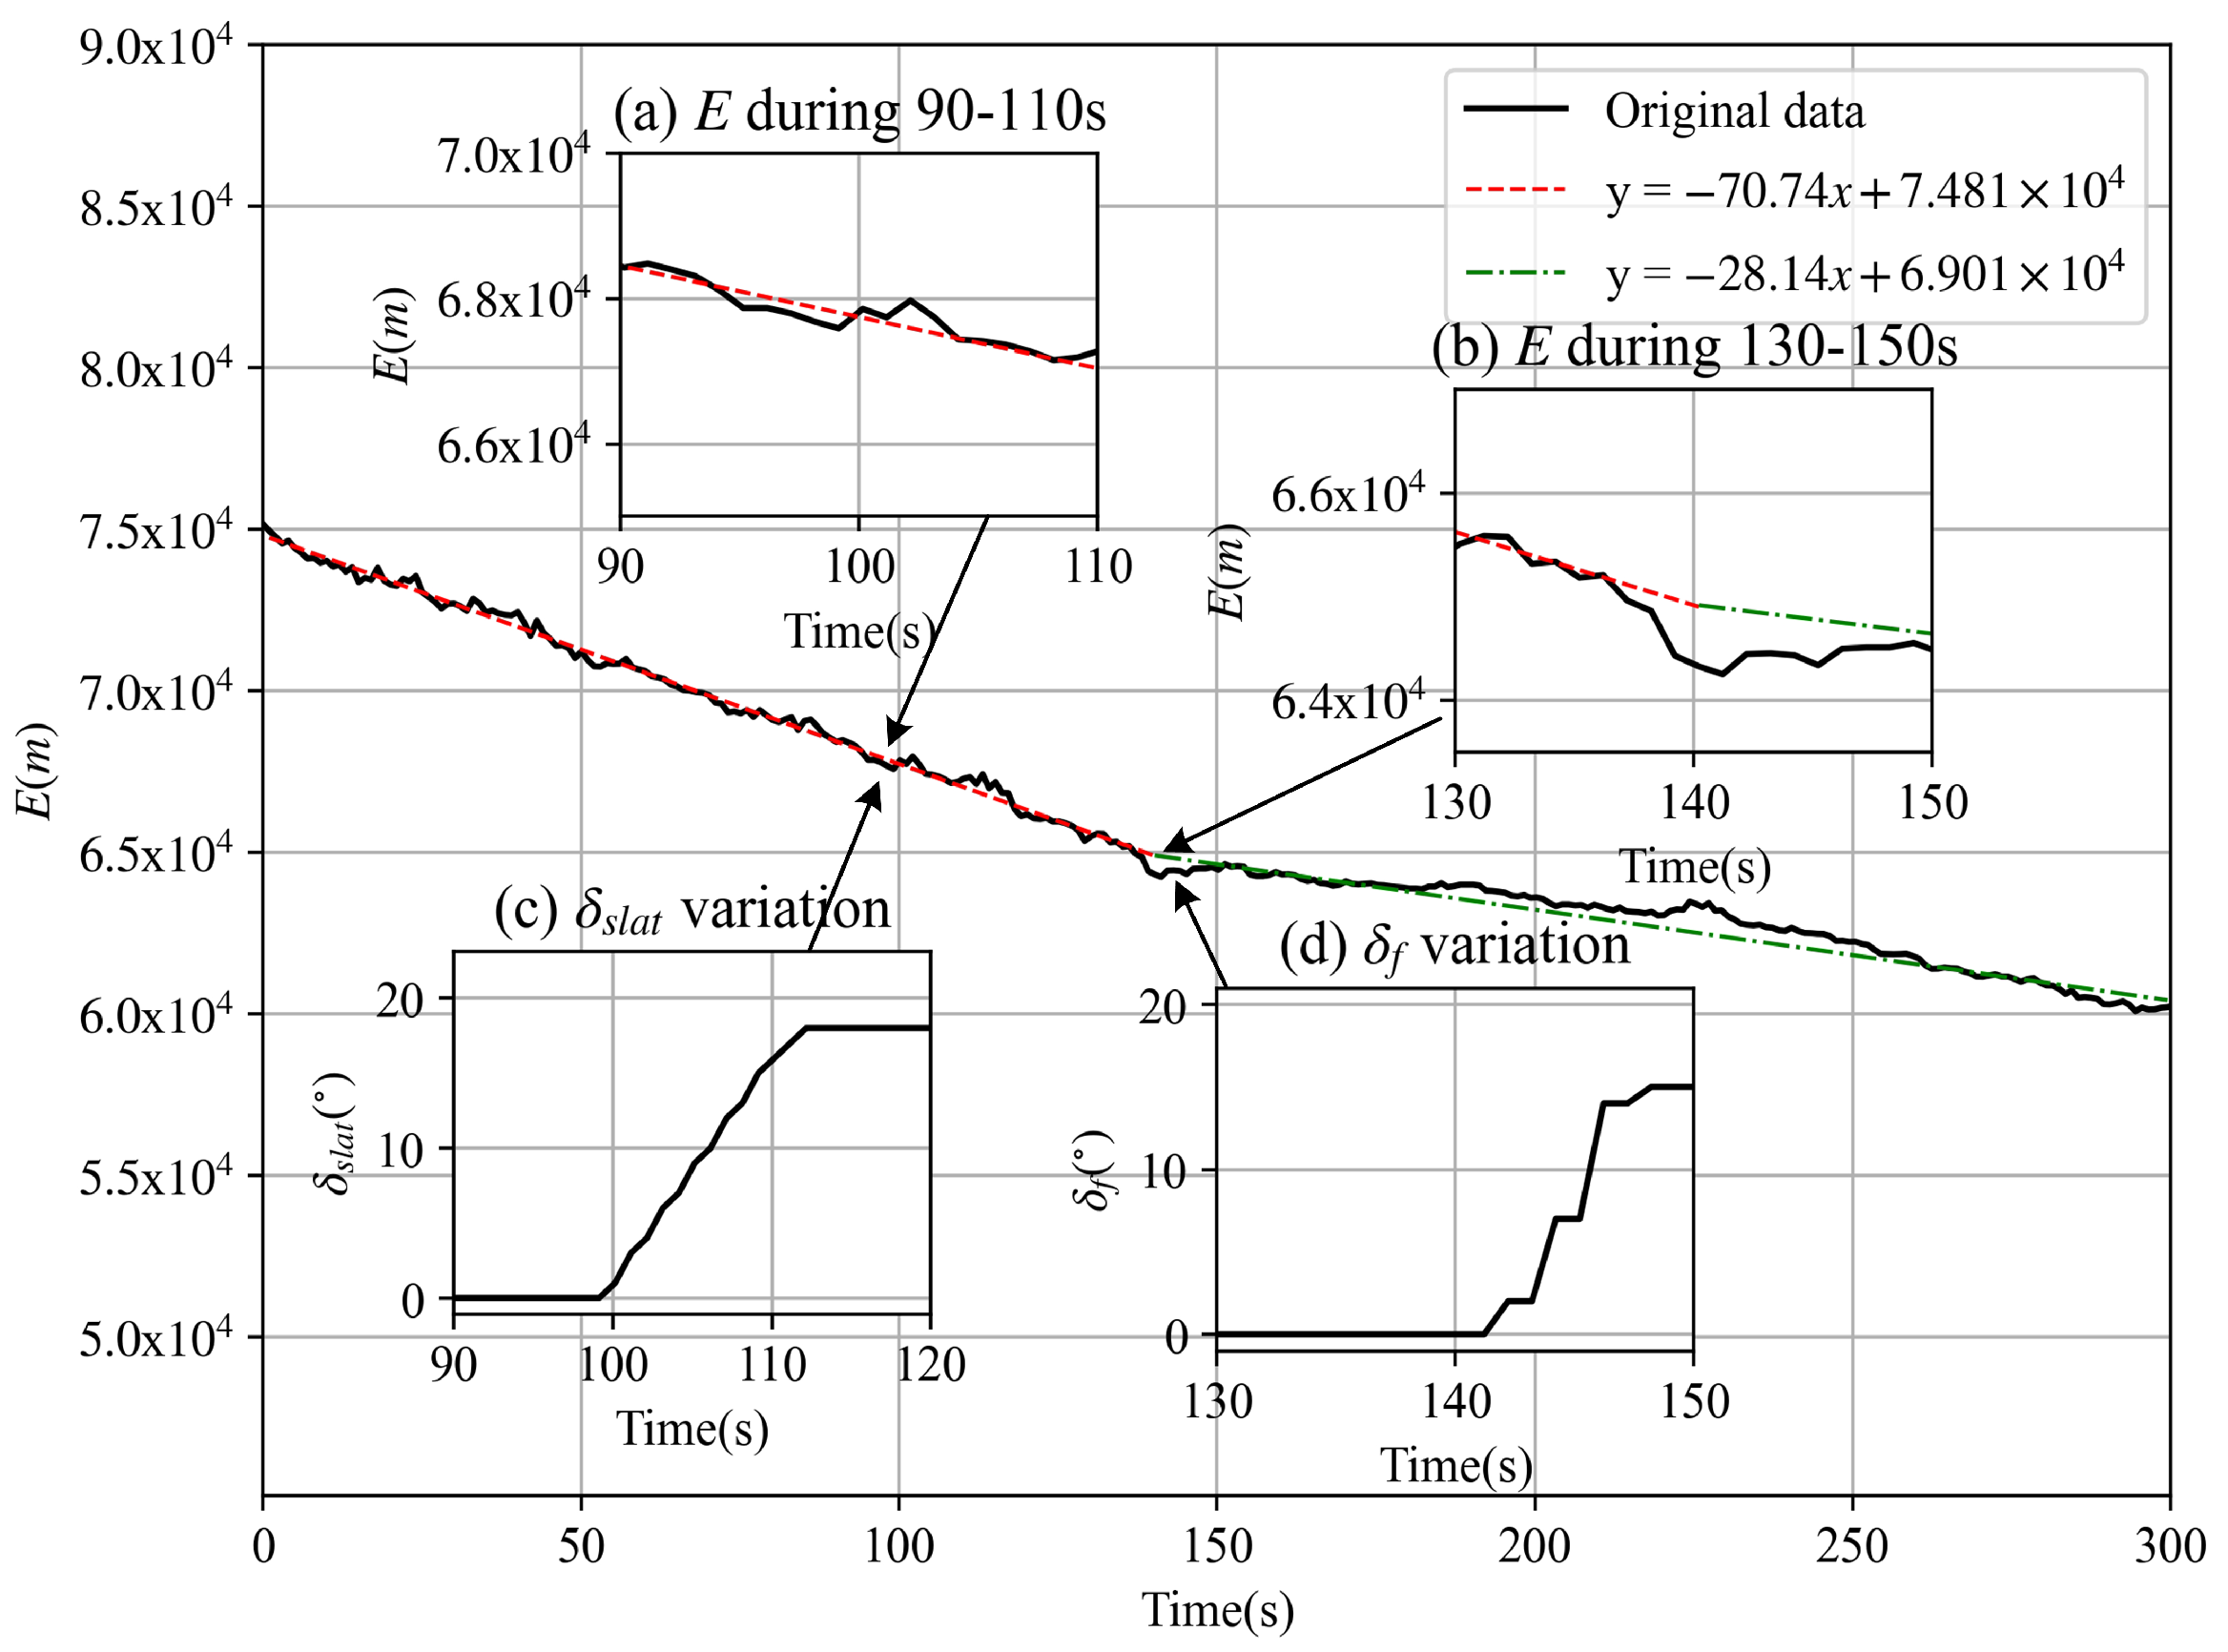
Focusing on the variations rather than the values is more effective in capturing discrete features. However, the algorithm used for continuous variables cannot be applied to discrete variables such as the flap position because the correlation between these variables and energy is insignificant. Discrete variable changes are recorded as step signals, representing a flight state switch. Therefore, the variables whose own changes can affect the decreased speed of aircraft energy are considered significant during approach. Energy leaps induced by the variables are sought within two seconds of the step change to detect their influence.
An example of discrete variable selection is depicted in
Figure 2, where the variation in the specific total energy during the 300 s flight is presented.
Figure 2a,b show the energy response in more detail during the 90–110 s and 130–150 s intervals. The black line represents the total specific energy, and the red and green dotted lines depict the fitted lines based on data from the 0–140 s and 140–300 s periods, respectively. At 140 s, the flap angle changed from 0 degrees to 15 degrees, as shown in
Figure 2d, followed by a decrease in the energy-reducing rate. Additionally, the influence of the slat angle, which changed at about 100 s, as shown in
Figure 2c, was almost negligible in energy.
2.2. Catalyst Mass Cluster Analysis
Given a flight dataset
comprising
n flight records
F, the catalyst clustering approach involves designing a metric
to improve the clustering quality from an energy management perspective. The metric is also used to measure the clustering quality. The more significant the differences between clusters, the higher the quality of clustering. To accurately distinguish flights with different energy performances during the approach phase,
is constructed based on the specific total energy, as described in detail in
Section 2.3. Therefore, the objective of Catalyst Mass-based Clustering is to satisfy
by identifying a set of clusters
, where
.
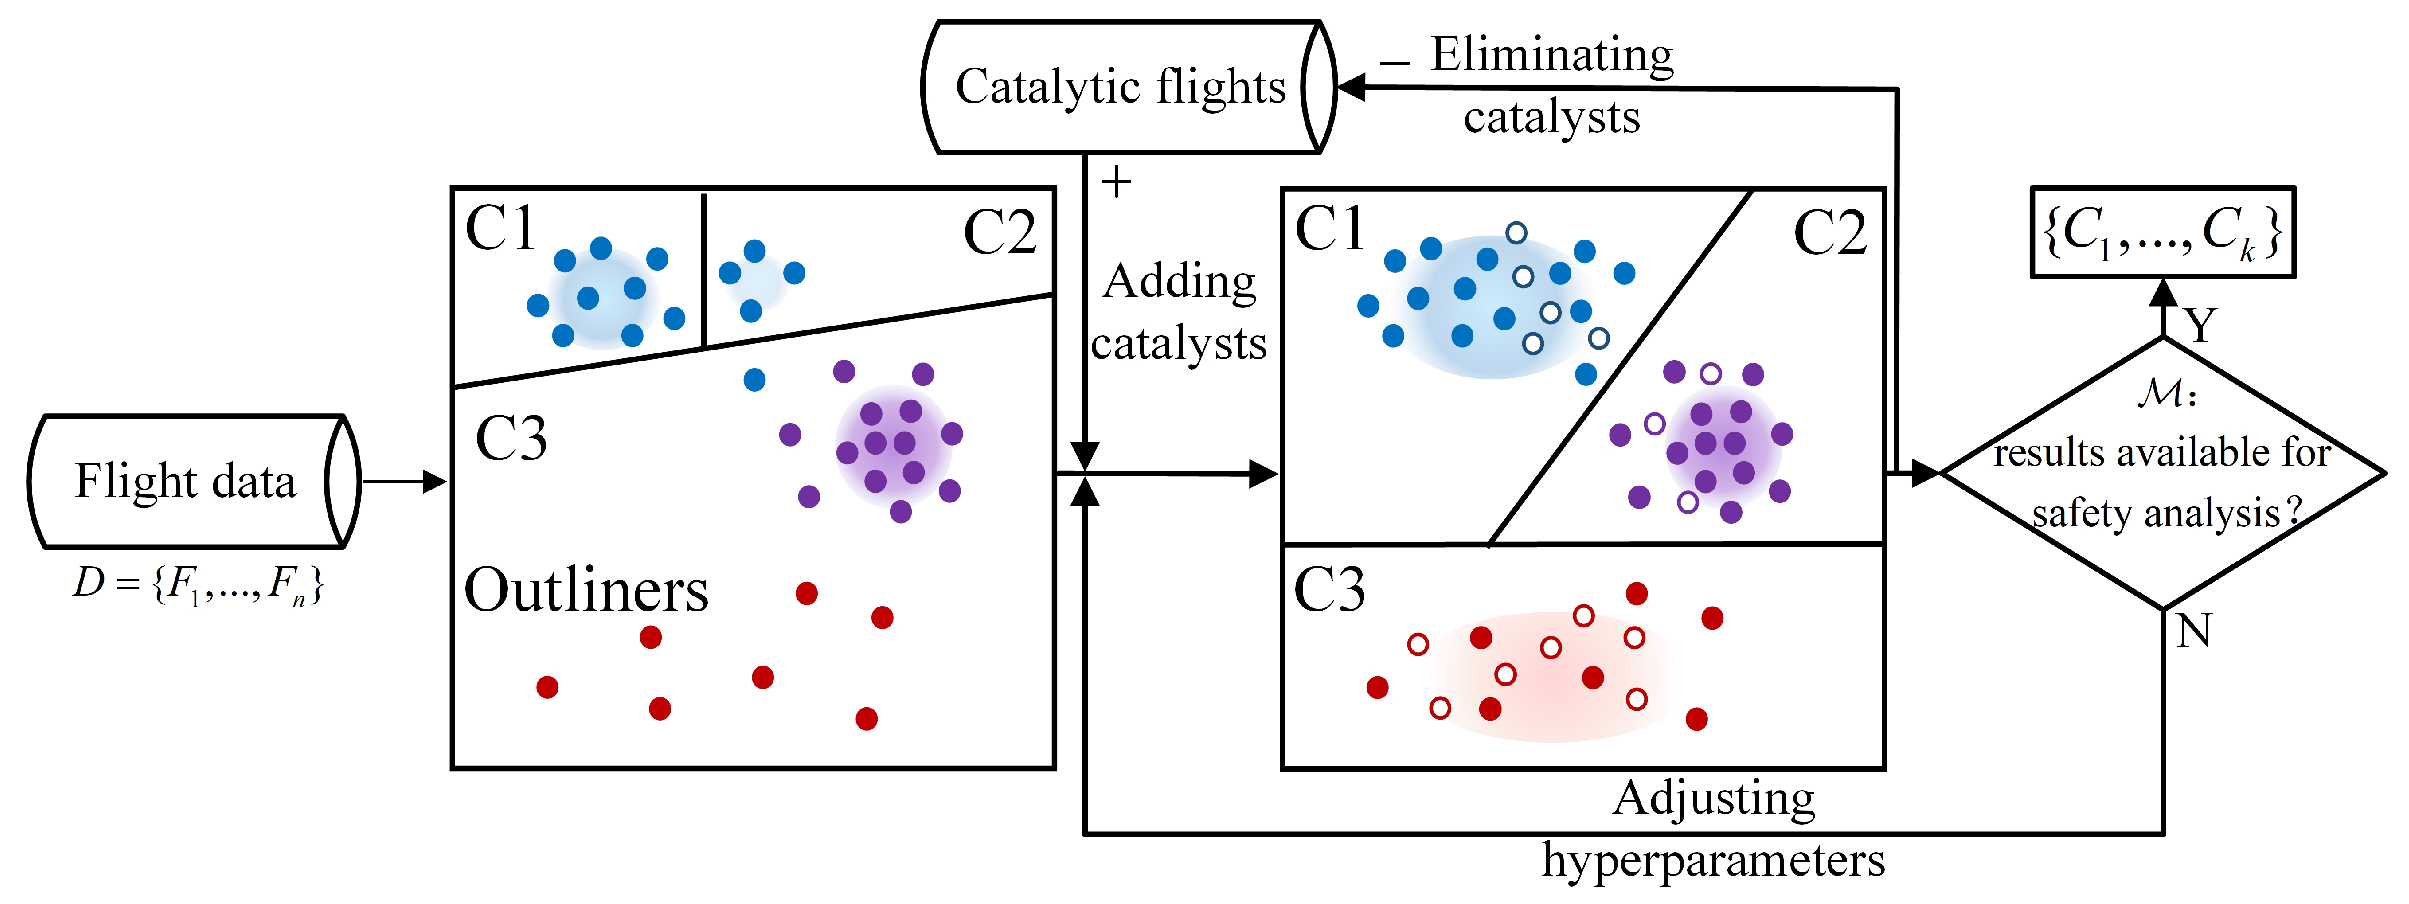
In
Figure 3, we illustrate the differences between the general and catalyst clustering methods. Solid dots of the same color represent the same class data, whereas hollow dots represent the catalysts. Under general clustering, the same dataset
C1 and
C2 was misclassified into two distinct categories, and some blue dots were mistakenly grouped into
C3. Furthermore, the red dots were identified as outliers due to their sparse data distribution. In contrast, in catalyst mass clustering, the density of data within the outlier group is increased through the introduction of catalysts. The scattered similar points can then be aggregated, enhancing the clustering quality. Finally, the catalysts are removed to produce the final clustering results. Further, the hyperparameters are adjusted according to optimization goal
, which means that all the clusters are significantly different and can be used for further safety analysis.
In this study, the labeled flight data identified by Exceedance Detection are regarded as the catalysts. They provide the label information of the clustering results and improve local densities [
33]. In addition, the isolation kernel is used to measure the dissimilarity because it has been proven to be minimally affected by the dimensions.
2.3. Composite Entropy-Energy Dissipation Index
Improper energy management during approach can increase the risk of safety incidents. To differentiate flights with varying levels of performance during approach, we constructed a composite entropy-energy dissipation index for the approach phase, which is denoted as
. The index is defined as follows:
where
is used to determine whether the energy-reducing velocity is centered around the typical values observed across most flights and
quantifies the stability of the energy variation.
can be acquired from Equation (
4)
The
component of the composite entropy-energy dissipation index during approach refers to the energy-reducing velocity. This is defined as the difference between the specific total energy at 10 nm away from the runway
and the energy at 1000 ft above touchdown
. To assess the deviation of
from the typical values observed across most flights, z-score centralization is utilized. We also calculate
from Equation (
5), which represents the stability of the energy variation
To reduce the overreaction to minor energy fluctuations, we decompose the energy-reducing acceleration into several states using the SAX (Symbolic Aggregate Approximation) representation. In this method, each state is assigned a probability based on the SAX representation.
Once the evaluation index has been constructed, the optimization issue regarding
mentioned in
Section 2.2 is defined by
where
is the indicator function,
denotes the results of the significance test, and
T represents the threshold of passing the test. This optimization aims to find clustering results where all clusters exhibit significant differences in approaching energy management levels, which reflect distinct approaching performance characteristics.
2.4. Isolation Kernel-Based Dissimilarity
The isolation kernel is utilized in this research as it can mitigate the issue of distance concentration that has affected some traditional methods. Moreover, as a data-dependent measurement, the Isolation Kernel-Based Dissimilarity enhances the distance between different flights, which is vital in identifying group-scale precursors.
In addition, the isolation kernel can transform density-based clustering into mass-based clustering, which can help to overcome some of the limitations of density-based clustering in distinguishing clusters with similar densities [
30,
34]. The Isolation Kernel-Based Dissimilarity function
is defined as follows:
where
represents the expectation. The Isolation Kernel-Based Dissimilarity between two flights
and
, denoted as
, is defined as the probability that
and
belong to the same isolating area
. Here, a specific isolating area
is defined as a subset of
, and
represents
different partitions of the set
D.
To utilize the isolation kernel for measuring the dissimilarity between flights, we start by selecting
random elements from the dataset
D to construct a set of center points
, as shown in Algorithm 2. This operation splits the dataset into two parts,
Z and
. Then, every element
is assigned to the hypersphere space
corresponding to
by identifying the nearest center point
. This assigns each element to a specific hypersphere based on the center point it is closest to. Elements that are in the same hypersphere are assigned a distance of 1, whereas elements that are not in the same hypersphere are assigned a distance of 0. Then, a distance matrix
is obtained in Step 10 in Algorithm 2. By repeating Steps 3–9 for
t times,
t distance matrices are obtained. Finally, the Isolation Kernel-Based Dissimilarity matrix
is calculated by taking the mathematical expectation of the distance matrices.
| Algorithm 2: Isolation Kernel-Based Dissimilarity |
 |
This measure provides an objective way to compare the dissimilarity between different flights, which is vital for detecting adverse events. Isolation Kernel-Based Dissimilarity is robust because it is a mathematical expectation-based ensemble algorithm.
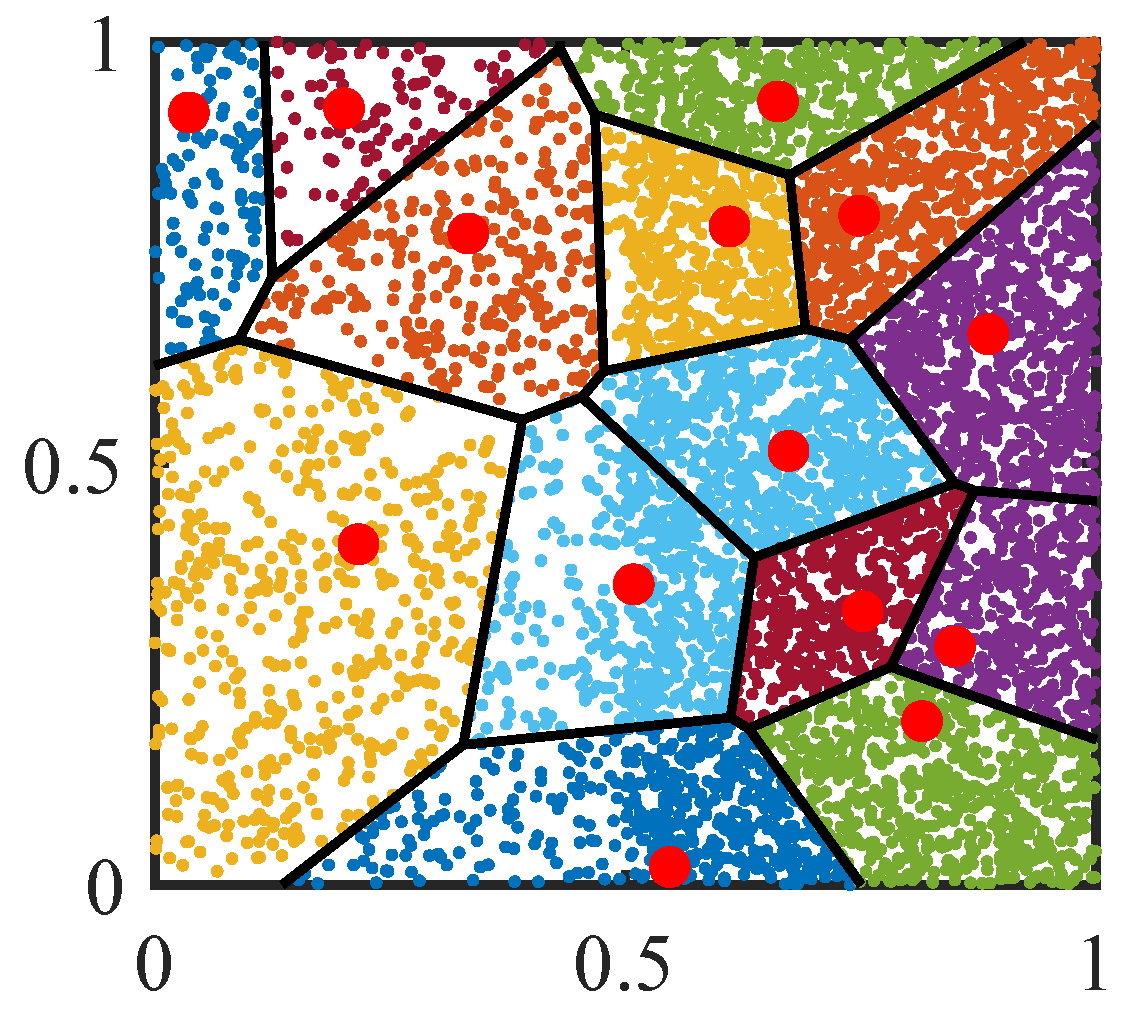
Furthermore, the data background is considered in the
spaces partition step using Voronoi-based nearest neighbor partition [
35], thereby enhancing the dissimilarity between nominal and abnormal flights. As shown in
Figure A1, the partitions on the left are sparser, whereas the data density on the right is significantly higher than on the left. The different partitions increase the dissimilarity between two flights in high-density areas and decrease the dissimilarity in low-density areas, making the Isolation Kernel-Based Dissimilarity a data-dependent measure.
After the distance matrix
is obtained, DBSCAN is performed, which is known for its superior performance in automatically determining the number of clusters and identifying irregular clusters. The DBSCAN algorithm involves the calculation of a density function that measures the density around each sample, denoted as
. The expression for this density function, calculated as Equation (
8), is given by
where the function
denotes the norm of the vector
. Here,
is the threshold of density, and
represents the cardinality of a set. The value of the density function for flight
is the number of flights within a neighborhood of
in the data space
D that lie within the threshold
.
By using data-dependent dissimilarity, the mass-based clustering method can improve the accuracy of identifying clusters with varying densities [
36]. The mass function that forms the core of the clustering process is obtained by transforming Equation (
9), as shown below:
where
is the IKD (Isolation Kernel-Based Dissimilarity) between
and
, and
is the preset threshold of mass.
3. Experiments
To assess the performance of CMCA, data from 3604 flights that used the same approach mode for landing on a single runway were collected. A total of 31 flights with high energy and 22 with low energy in approach labeled by Exceedance Detection were used as catalytic flights. The flights were routine flights operated by an airline in China that followed the same approach pattern, which reduced the potential for confounding factors to affect the results. The experiments were conducted using Python 3.9, and the scikit-learn==1.0.2, numpy==1.20.3, and pandas==1.5.0 modules were utilized. The experiments were carried out on an HP workstation with 16 GB of RAM and an i7-9700 CPU @ 3.00 GHz.
3.1. Preprocessing
To extract the feature vector, the sampling rates were first standardized to 1 Hz. Then, the flight data were processed using z-score normalization. By sampling every 0.25 nm starting from a distance of 10 nm away from the runway, feature vector
was formed according to Equation (
10).
where
represents the value of the
ith variable at distance
j.
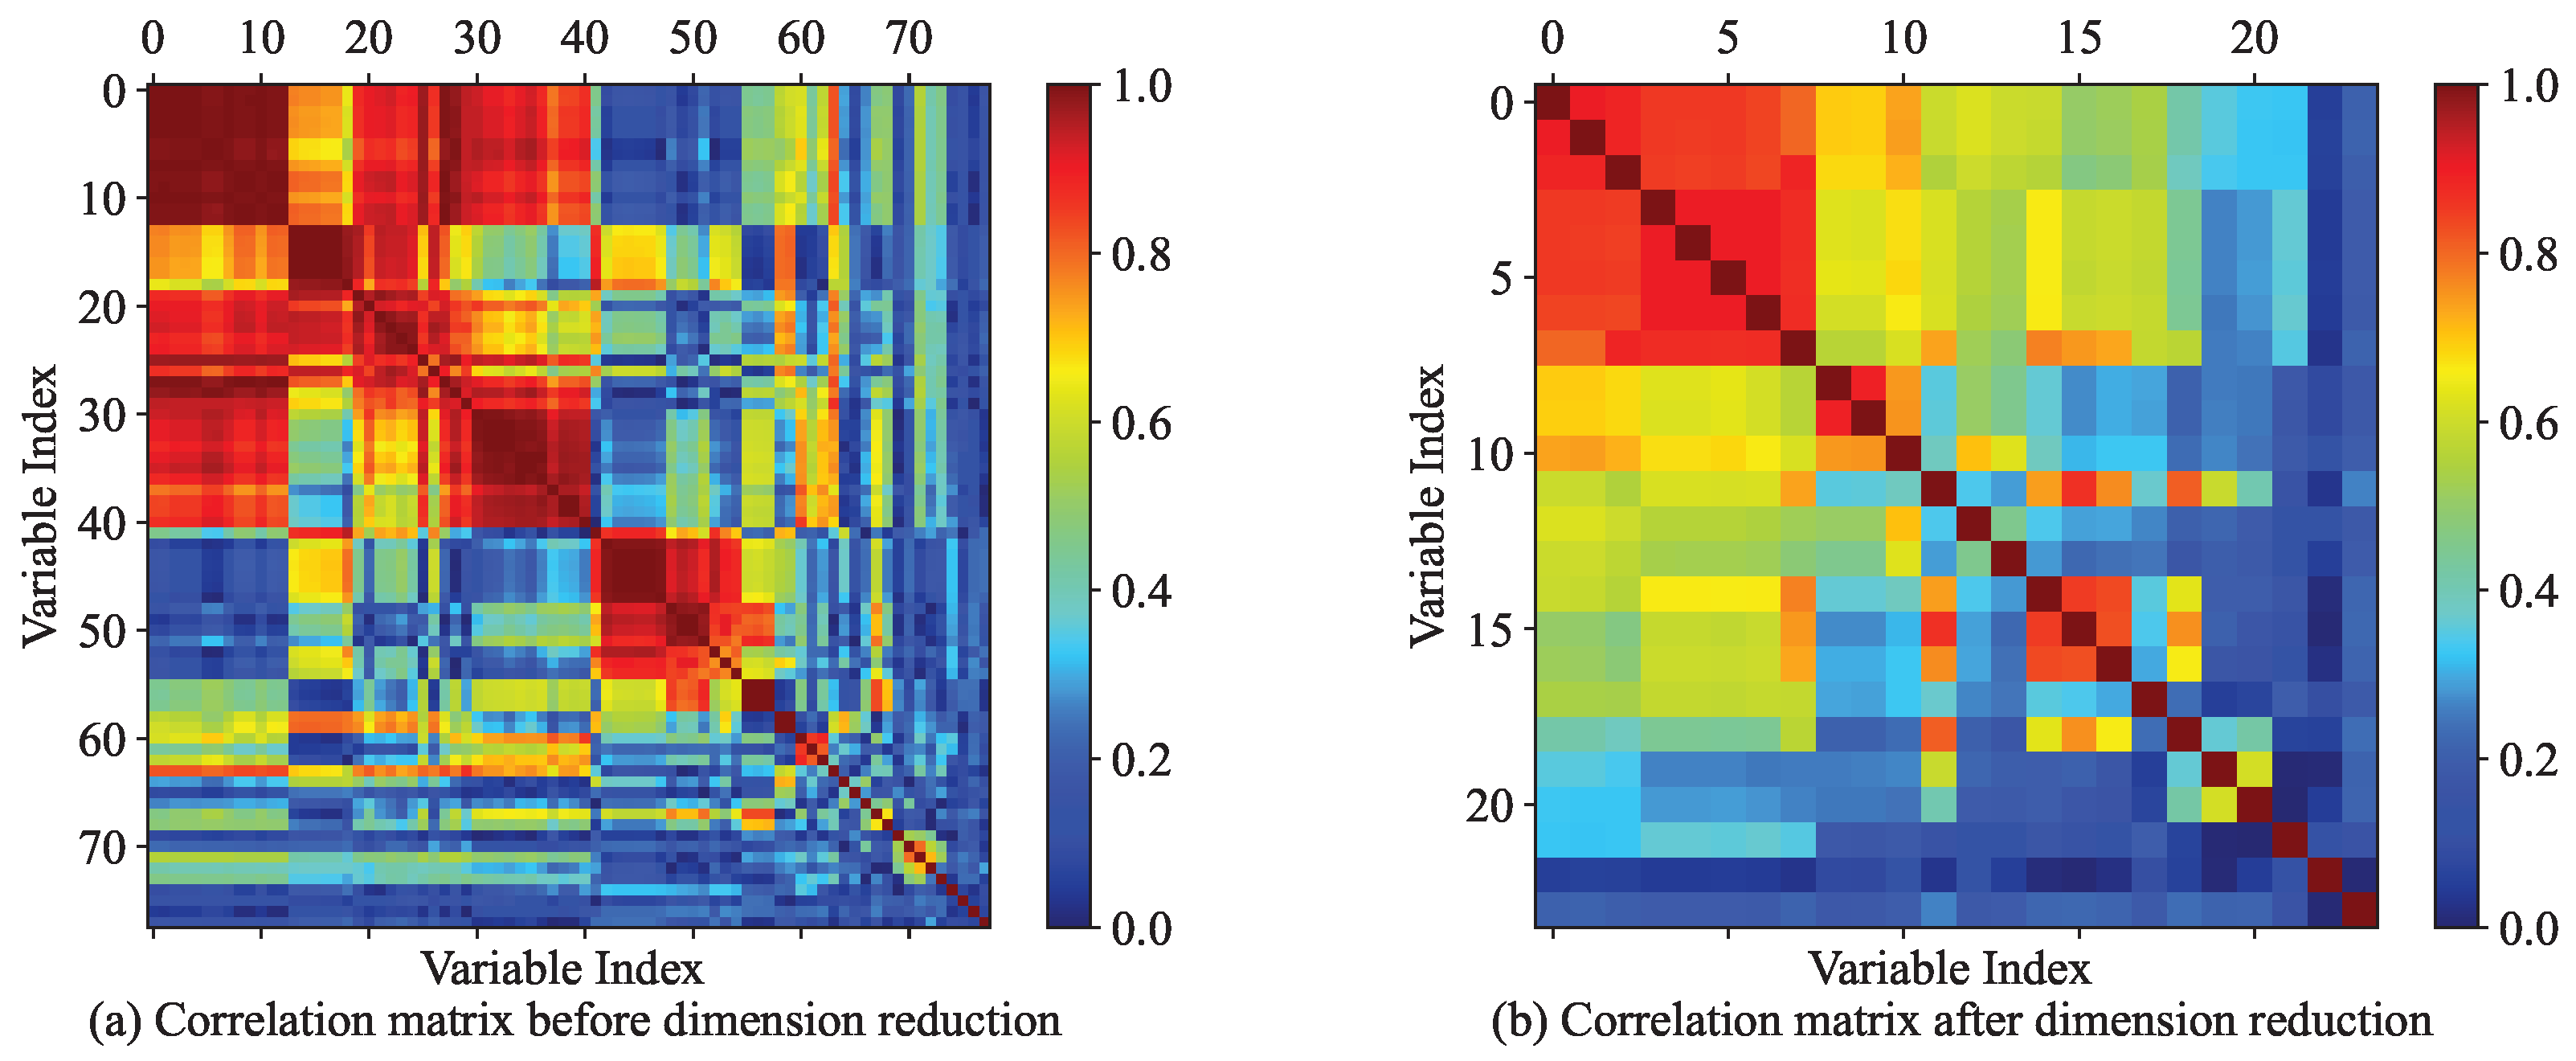
Algorithm 1 and the discrete parameter selection method described in
Section 2.1 were applied to select the most relevant variables first. As a result, 23 continuous and 4 discrete features were extracted from an original number of 78 variables recorded in the flight data. As shown in
Figure 4a, there was high collinearity among the 78 variables, with the axis representing the parameter index ranging from 0 to 77. However, after decorrelation, significant improvements were observed, as shown in
Figure 4b, where the axis represents the new variable index ranging from 0 to 22.
3.2. Selection of Catalytic Flights
For the purposes of identifying potential safety events, 31 high-energy approaching flights and 22 low-energy approaching flights were selected as representative examples of high-risk flight conditions. High-energy flights pose a greater risk of speed exceedances and other dangerous mishaps, whereas low-energy flights can seriously impact the aircraft’s maneuverability, making it more difficult to recover from potential accidents. The catalyst flights were selected according to the FOQA monitoring standards from CAAC (Civil Aviation Administration of China). We focused on the airspeed at around 1000 ft above touchdown . When , a flight is regarded as having a low-energy approach, and when , it is regarded as having a high-energy approach, where represents the final approach speed.
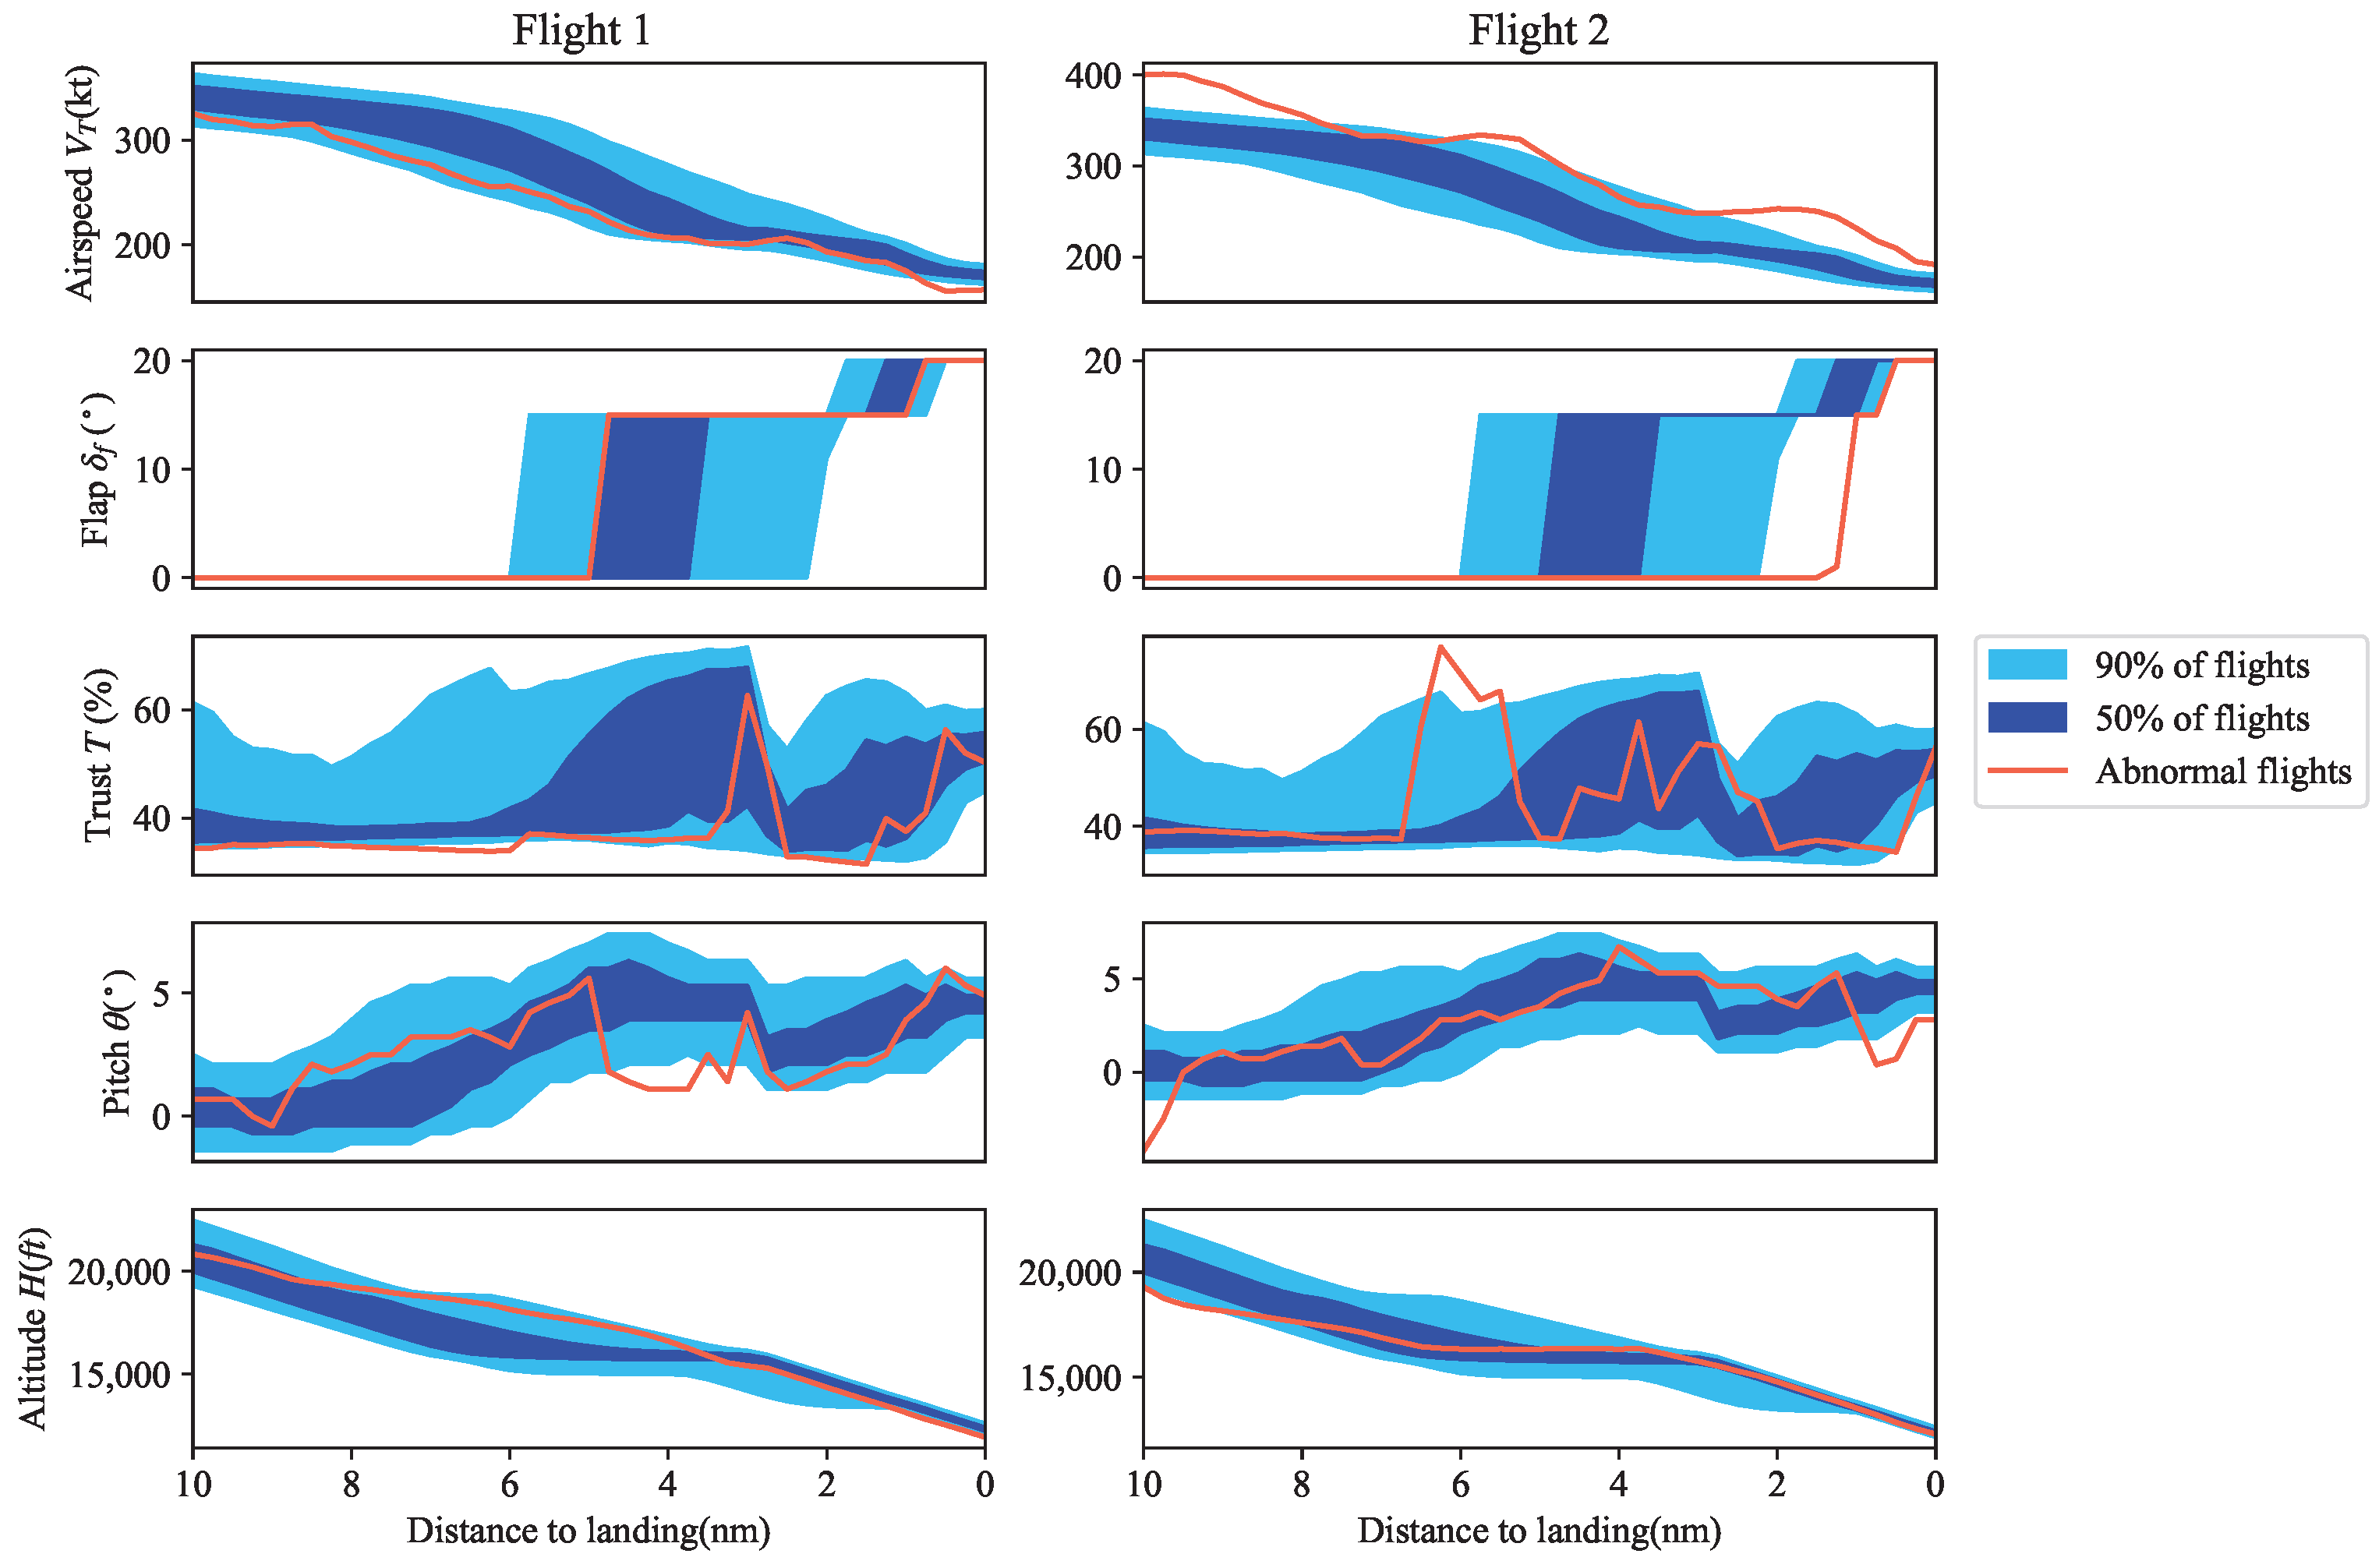
Figure 5 shows the results of our analysis for two catalytic flights used as representative examples of high-risk flight scenarios. For both cases, the light-blue areas represent 50% of all flights, whereas the dark-blue areas represent 90% of all flights.
For Flight 1, it can be observed that certain parameters deviated from nominal flight conditions, which resulted in a lower speed at 1000 ft above touchdown (shown on the right-hand side of the horizontal axis). This deviation from typical flight conditions could potentially indicate an issue with the aircraft’s power, altitude, or other critical parameters. In contrast, Flight 2 exhibited significant deviations from typical flight conditions, with the parameters exceeding the boundaries of 90% of all flights. Specifically, improper operation of the thrust, flap, and pitch angle occurred around 2 nm from the runway, causing a high-energy approach and a typical high-risk event.
3.3. on Different Flights
To evaluate the effectiveness of our proposed
metric in distinguishing between different flights during approach, four flights were analyzed, and the results are presented in
Figure 6.
Figure 6a shows the specific total energy and
Figure 6b shows the differential value of the acceleration of energy
.
The distribution of the
values for each flight is illustrated in
Figure 6. In general, most flights with stable and well-managed energy exhibited relatively lower
values, whereas higher
values indicated poorer approaching performance. Among the four analyzed flights,
exhibited the highest level of stability but the lowest energy consumption, resulting in the lowest
value of 1.008. In contrast,
and
both experienced noticeable vibrations and exhibited a moderate rate of energy dissipation, leading to moderate
values of 5.011 and 4.296, respectively.
showed the most pronounced fluctuations and a significant energy dissipation, resulting in the highest
value among the four flights. These findings suggest that
can serve as a useful tool for identifying flights with poor approaching performance and supporting early intervention to address potential safety events.
Overall, our proposed metric is a valuable new tool for characterizing the stability of the approach and has wide-ranging implications for improving flight safety and enhancing the effectiveness of safety interventions.
3.4. Comparative Experiments
In this section, the performance of CMCA in discovering adverse events is verified through comparative experiments. The following algorithms commonly used in the aviation industry are used as the baselines:
(1) Algorithm 1 (IKD K-means): As one of the most widely used partition-based clustering algorithms, K-means groups similar objects into one cluster by minimizing the distance between samples. IKD (Isolation Kernel-Based Dissimilarity) is used to replace the Euclidian distance, and the elbow curve determines the number of clusters. By applying IKD to the task of event detection in flight data, we aim to evaluate its effectiveness in identifying patterns of behavior that may indicate group-scale precursors.
(2) Algorithm 2 (GMM): The Gaussian Mixture Model uses probability values to express the affiliation between a sample and clusters. The GMM is particularly effective in identifying clusters that exhibit different variances and covariances, making it well-suited for identifying complex relationships among flight data variables. In the GMM, each sample point is assigned a probabilistic affiliation with clusters based on the posterior probability of the sample’s membership in each cluster. The number of clusters is determined using the Bayesian Information Criterion (BIC).
(3) Algorithm 3 (DBSCAN): DBSCAN is a popular clustering algorithm that is widely used in aviation research to detect potential safety events [
18]. It works by identifying regions of high density in the data using a user-defined radius (eps
) and a minimum number of points required to form a cluster (min_samples
). Data points that are not part of any cluster are considered noise points. In our experiment, we use the Euclidean distance measure to test the performance of the Isolation Kernel-Based Dissimilarity (IKD) technique in identifying potential adverse events. We also analyze the sensitivity of the algorithm to
and
to better understand the process of identifying group-scale precursors.
To determine the number of clusters for Algorithms 1 and 2, the elbow method and BIC were utilized. For Algorithm 3, the radius and the minimum sample number were selected based on a 5% anomaly detection rate. In addition, the hyperparameters of CMCA were determined with the optimization goal .
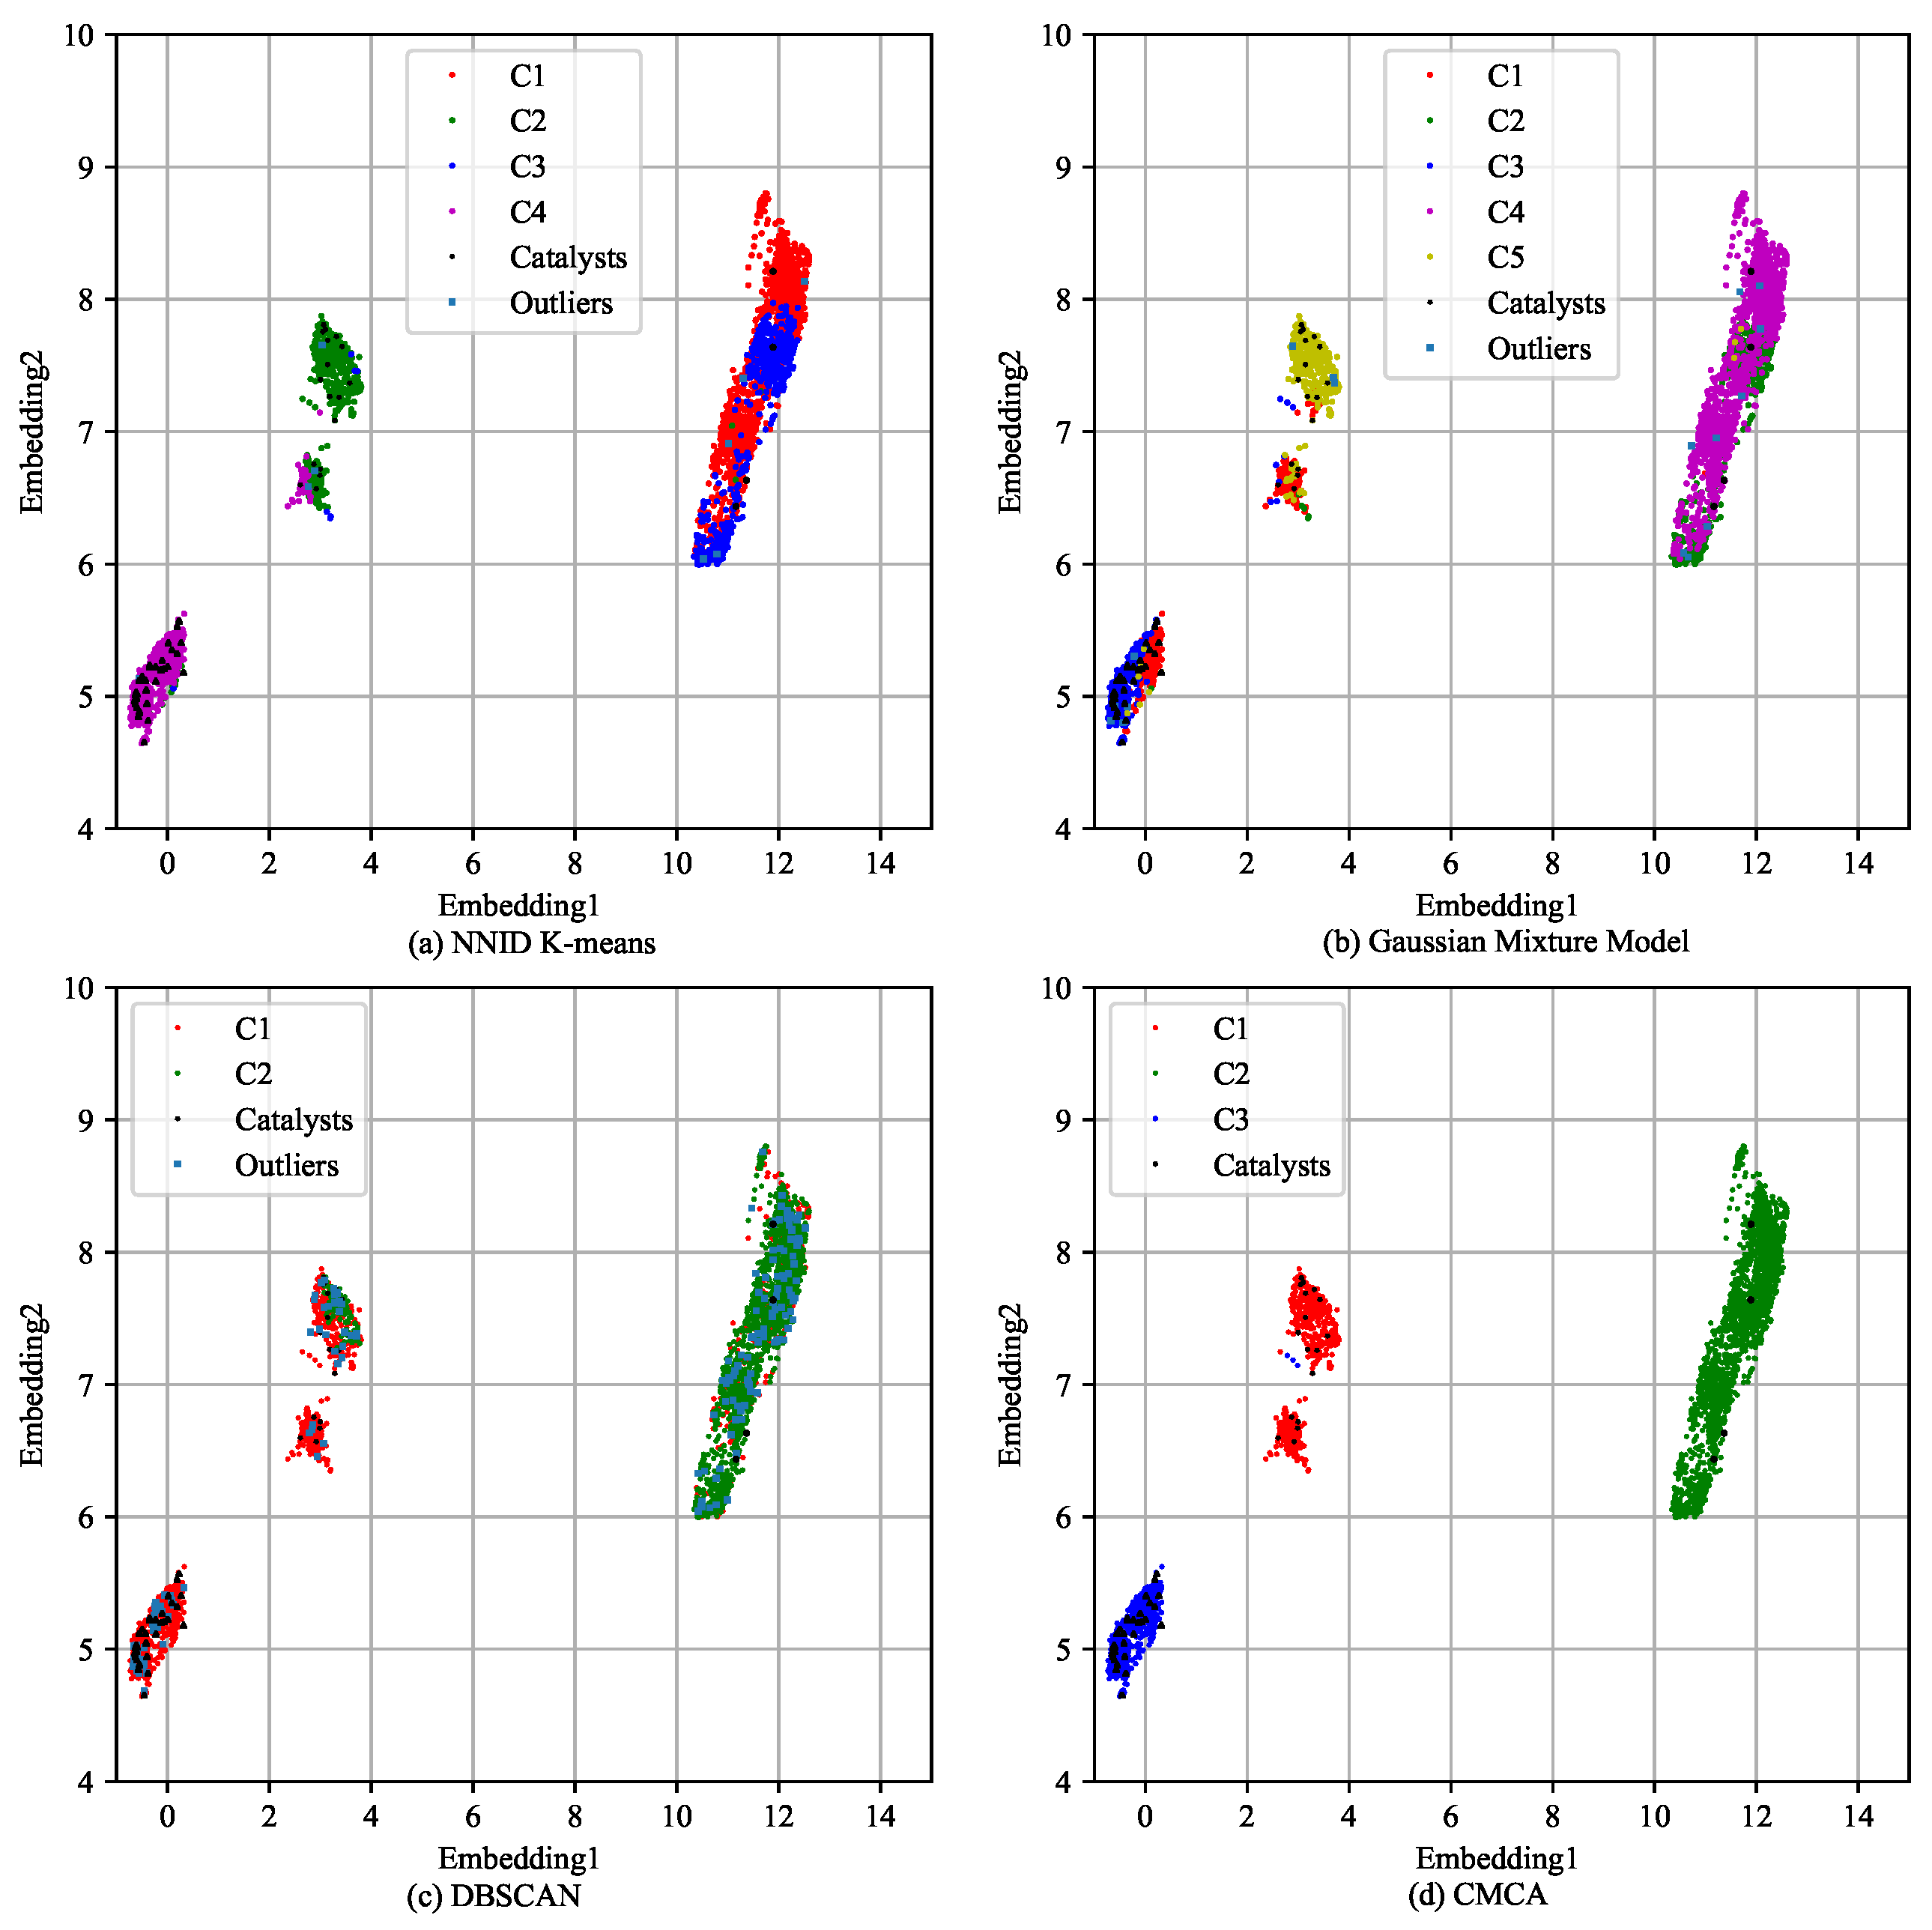
The clustering results of the baseline algorithms and CMCA are presented in
Figure 7. Specifically, we reduced the high-dimensional flight data to two dimensions (named Embedding1 and Embedding2) using t-SNE for better presentation while preserving as many of the pairwise similarities between the data points as possible. The axes correspond to the values of the two features extracted through t-SNE.
The different clusters are indicated by different colored dots and the black pentagons indicate the catalyst flights.
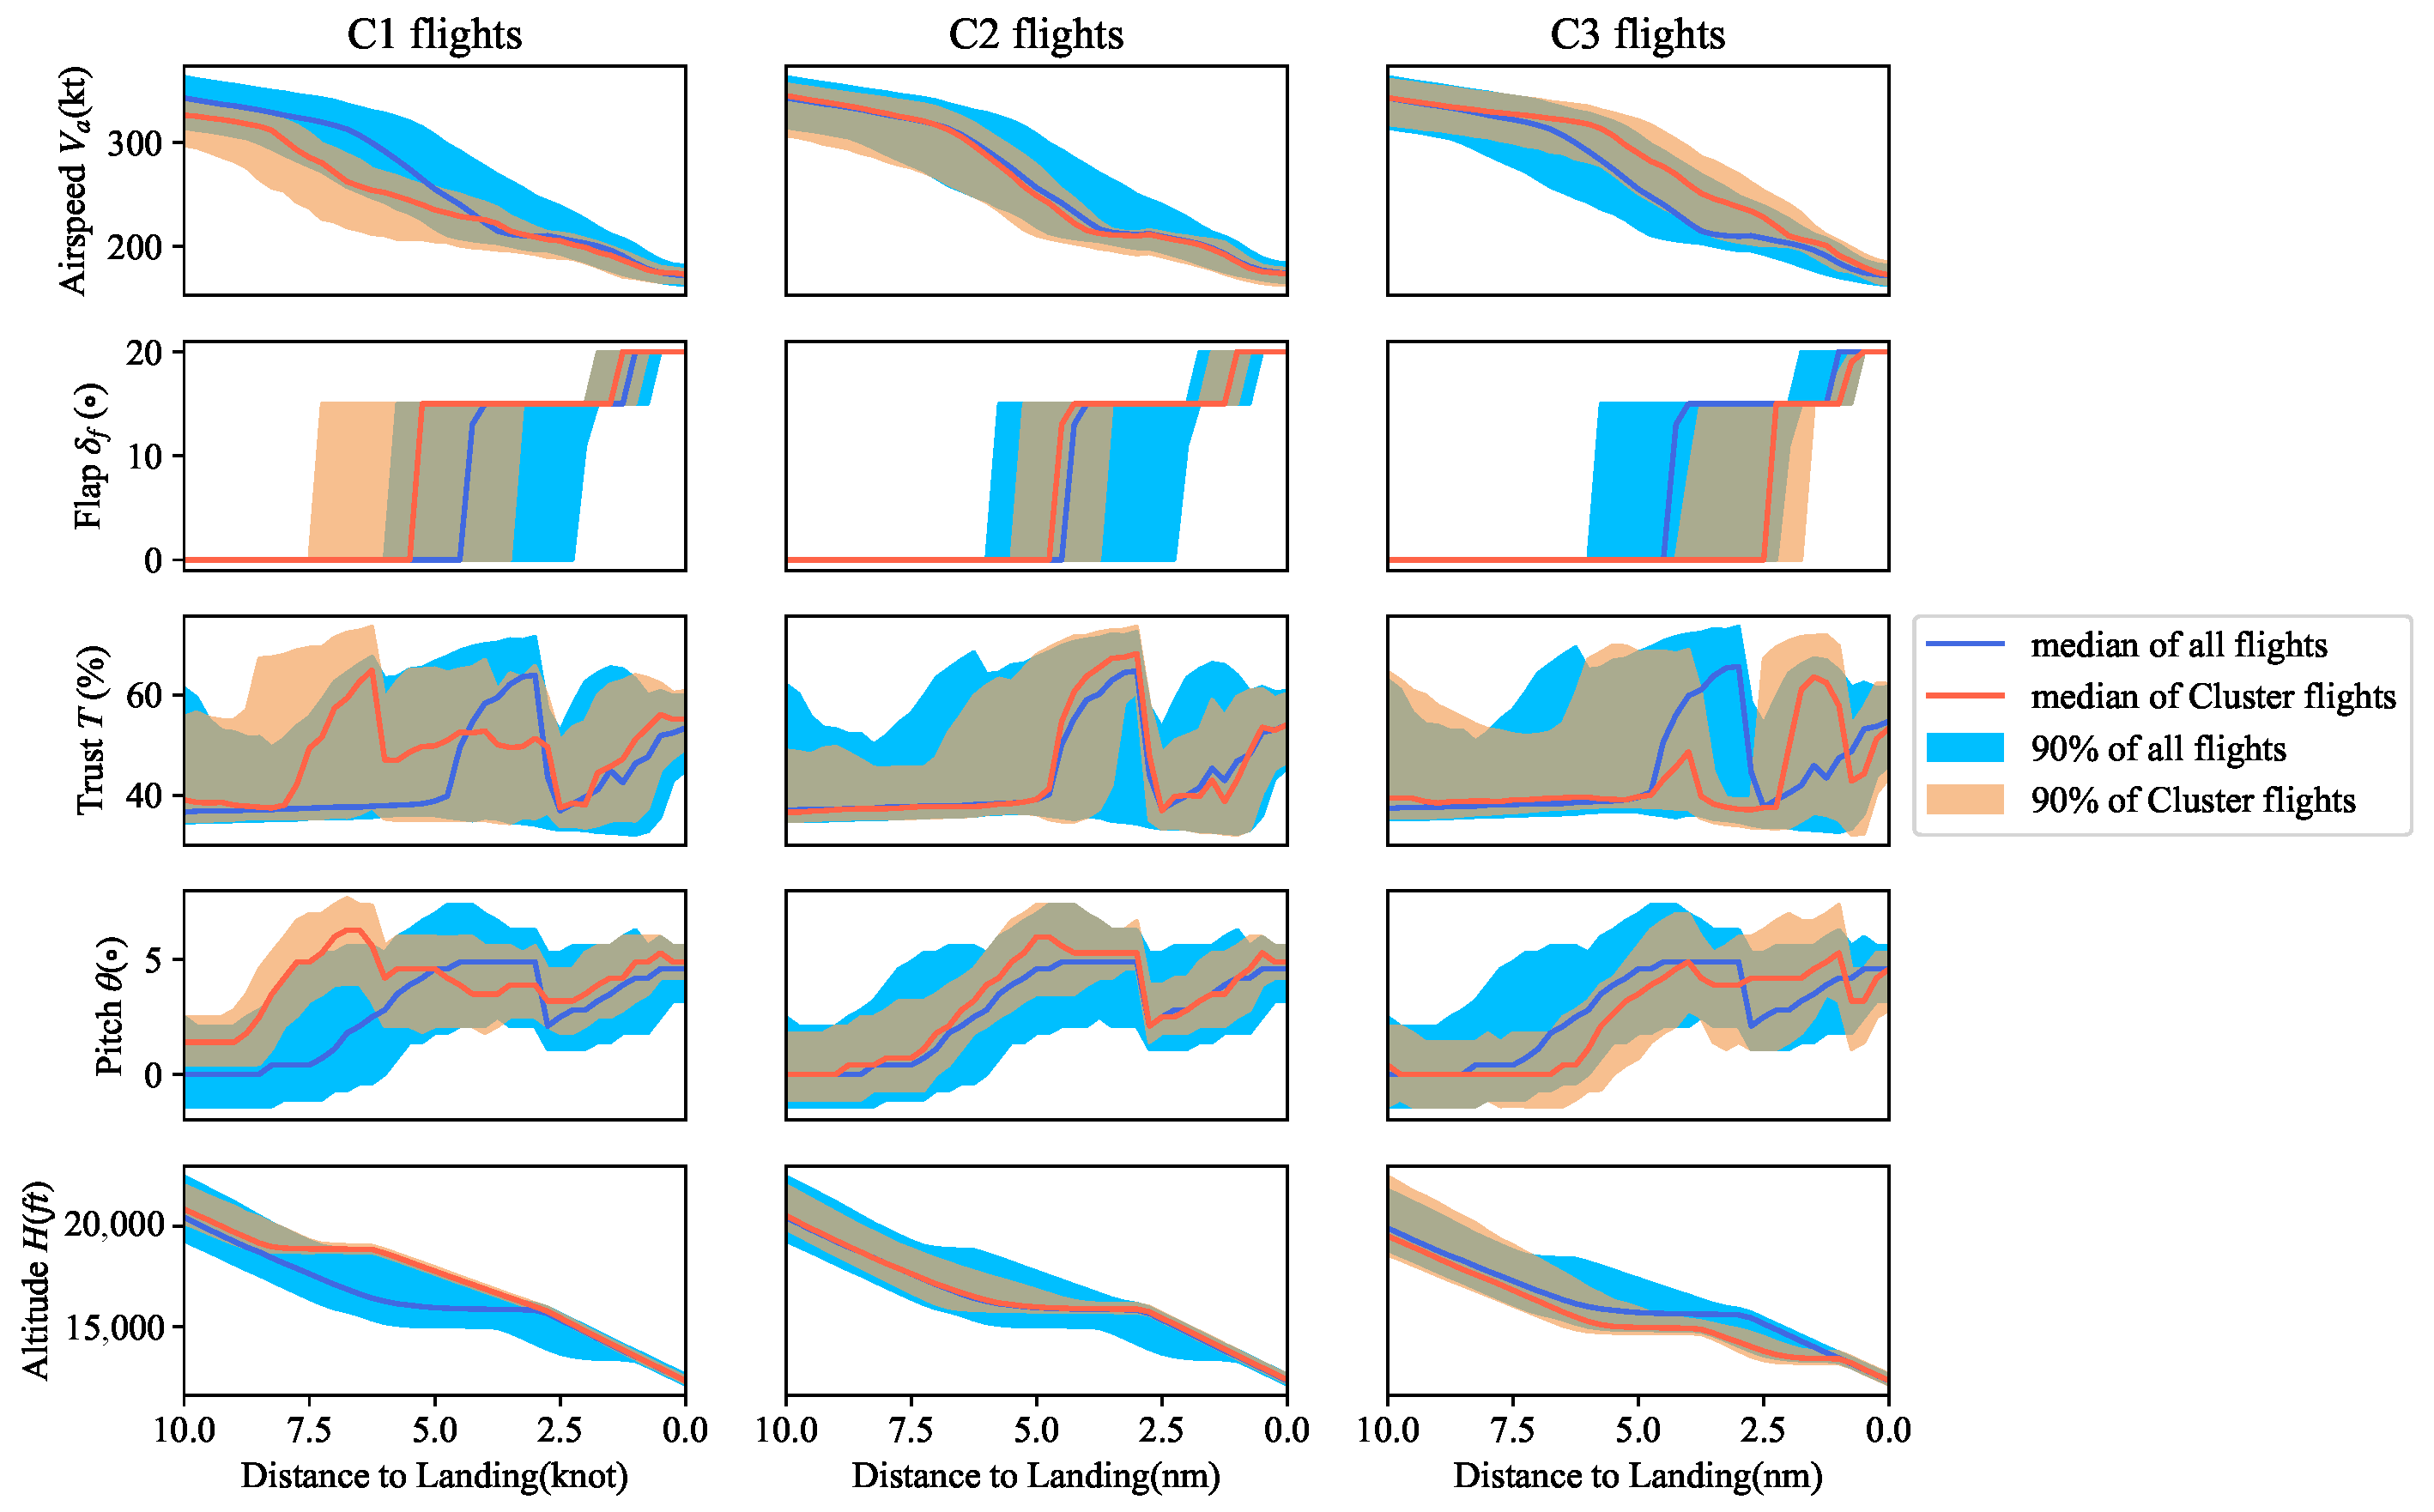
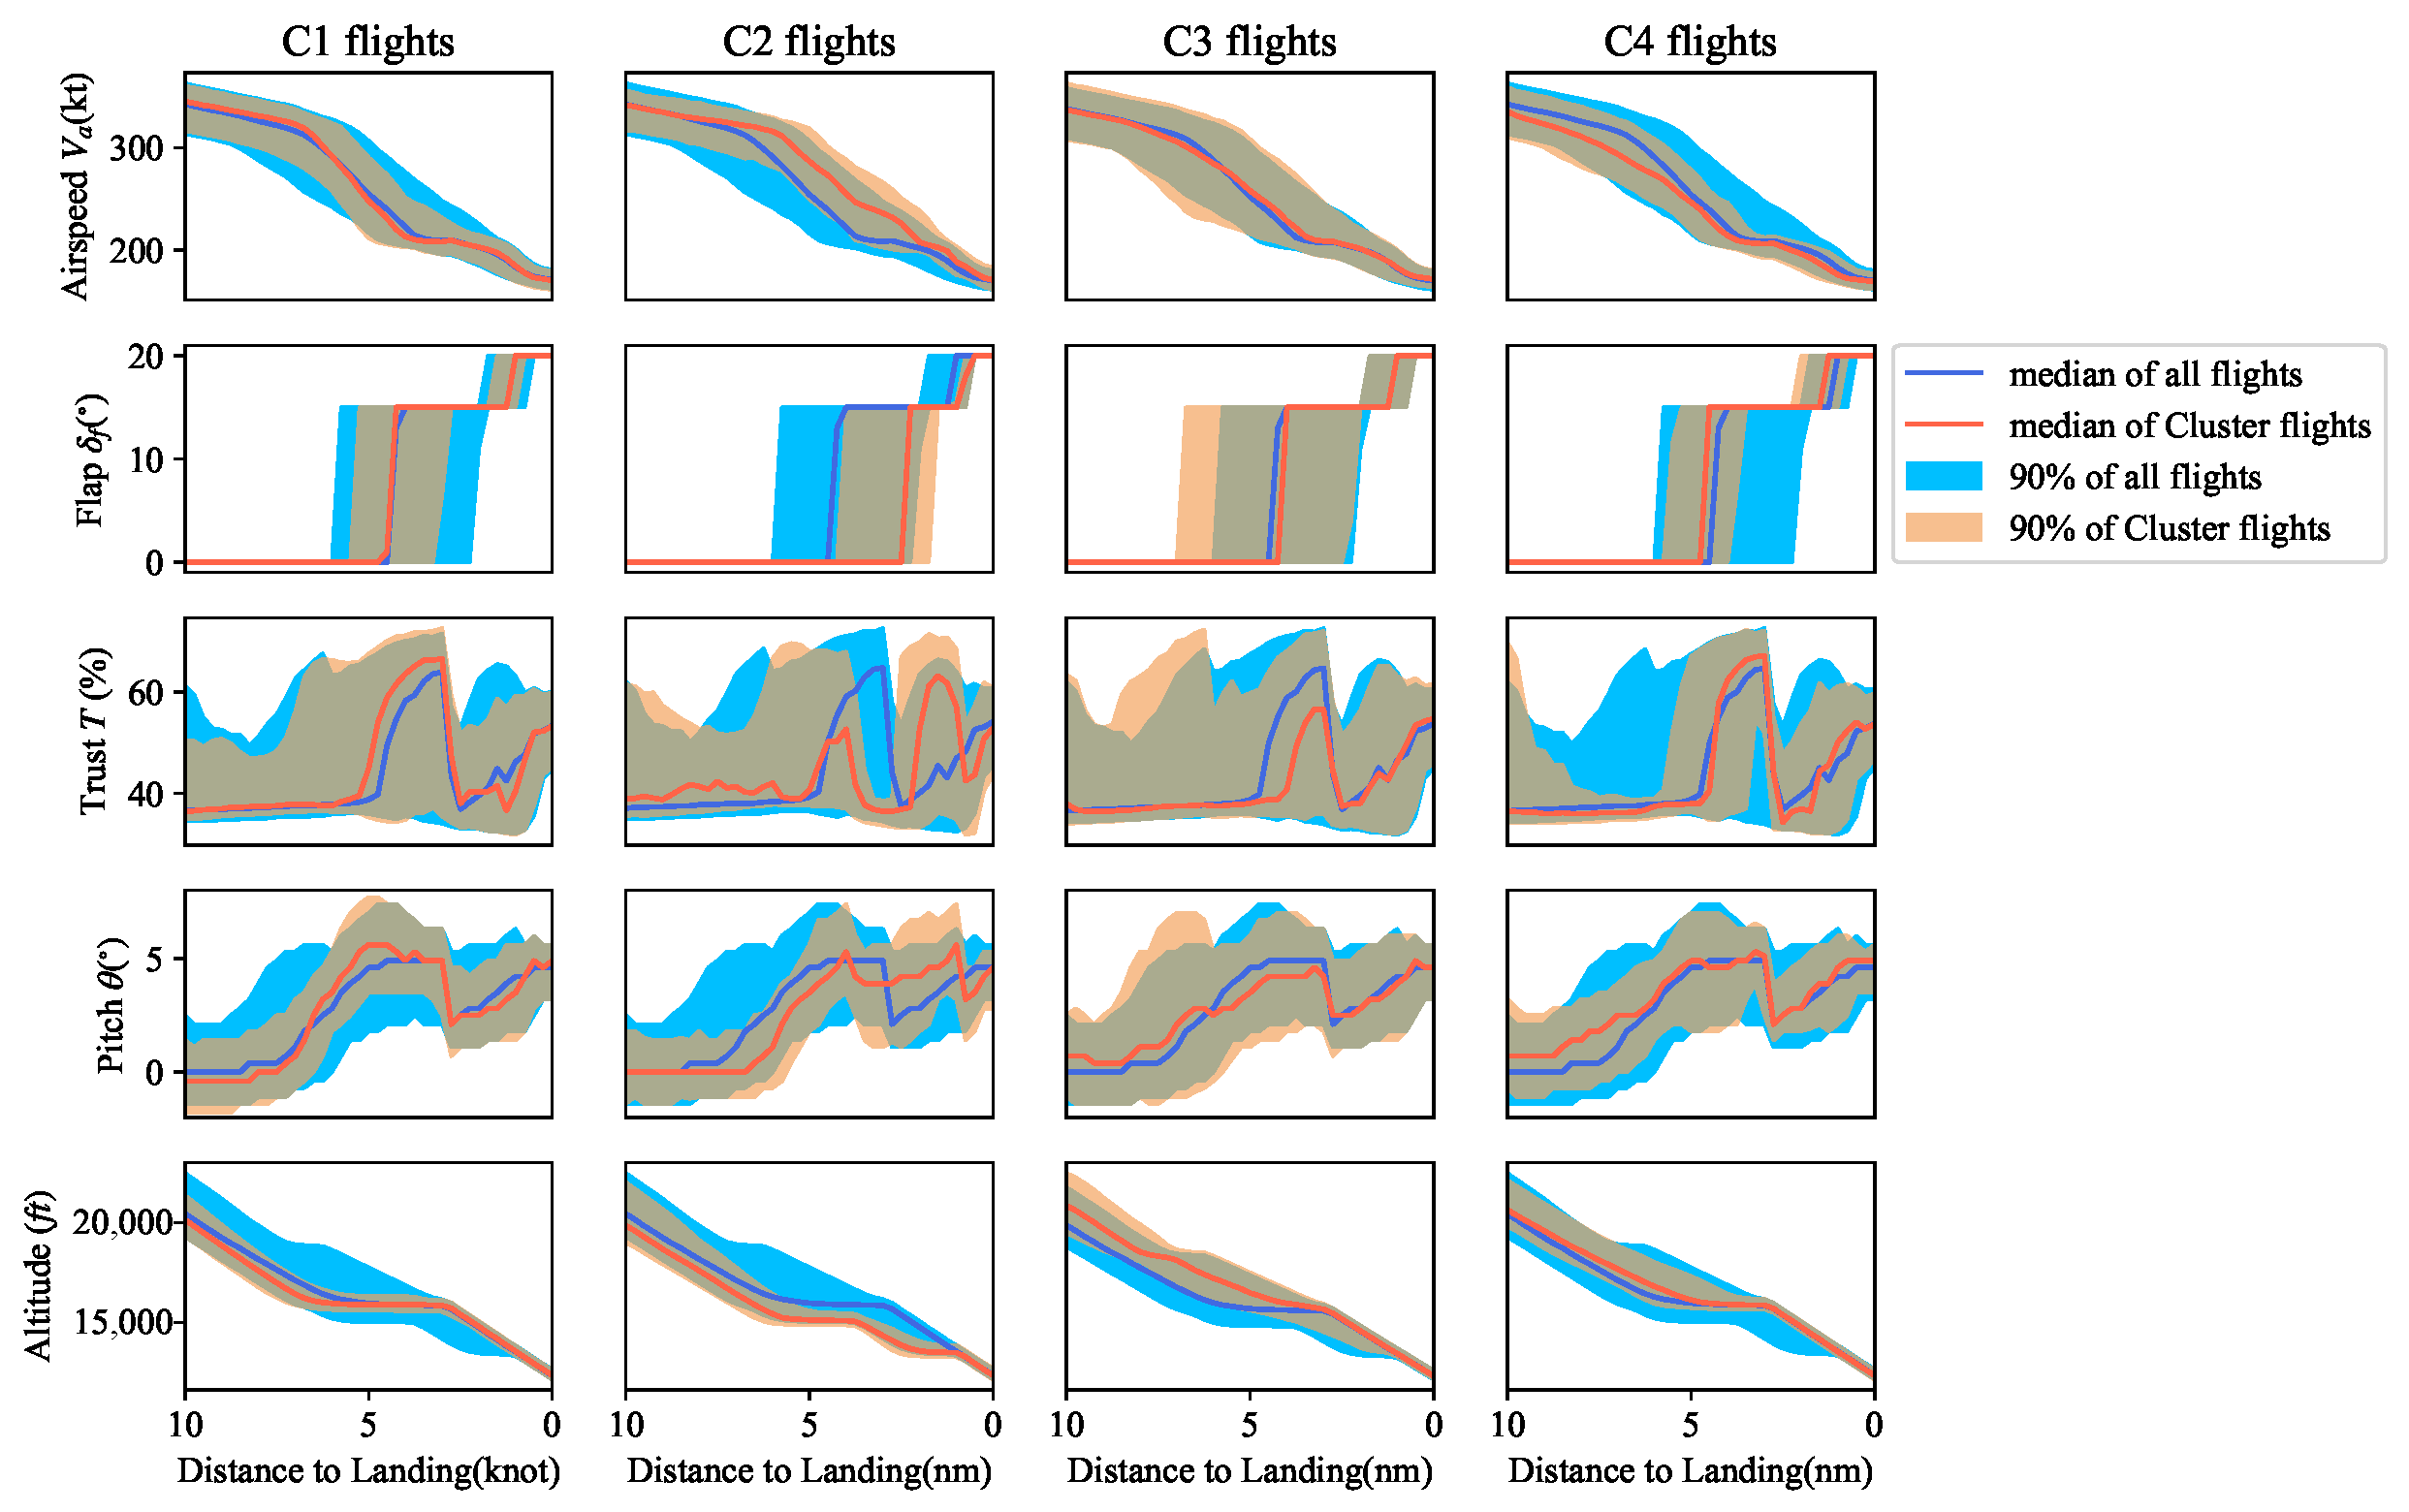
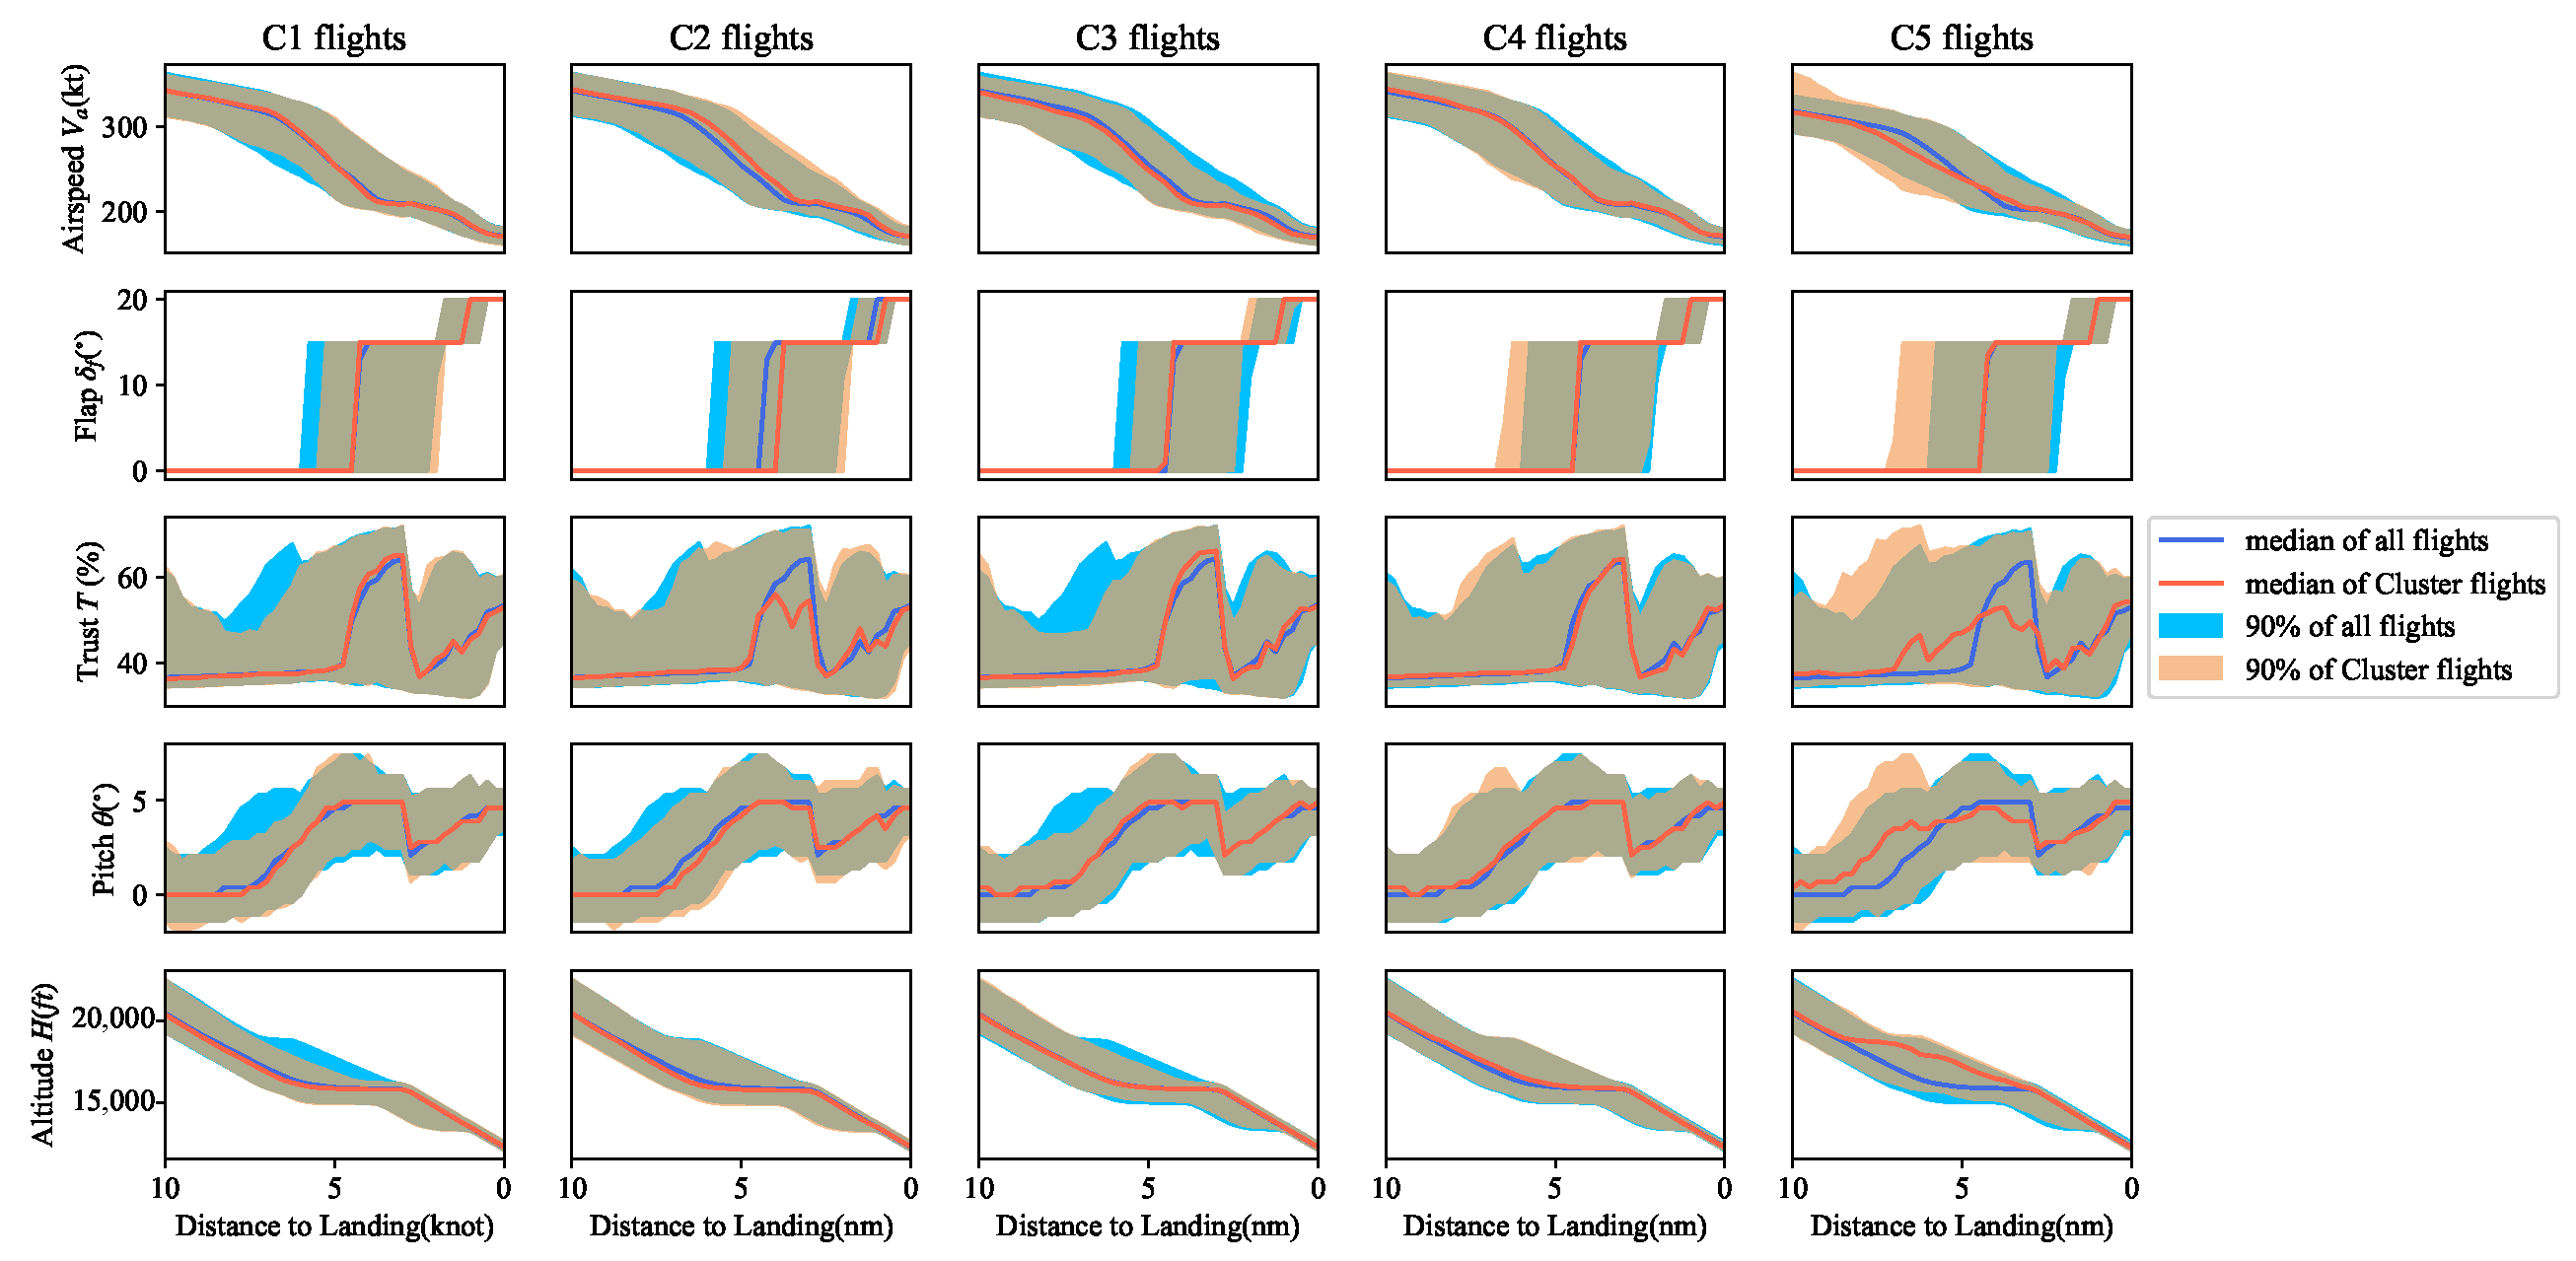
Figure 7a–d correspond to the clustering results obtained using Algorithms 1–3 and CMCA. As shown in
Figure 7, Algorithms 1 and 2 produced 4 and 5 clusters, respectively, but the cluster boundaries shown in
Figure 7a,b are fuzzy and difficult to interpret. In addition, Algorithm 3 identified two clusters,
C1 marked in red and
C2 marked in green, that were less clearly separated, whereas CMCA detected three distinct clusters with obvious boundaries.
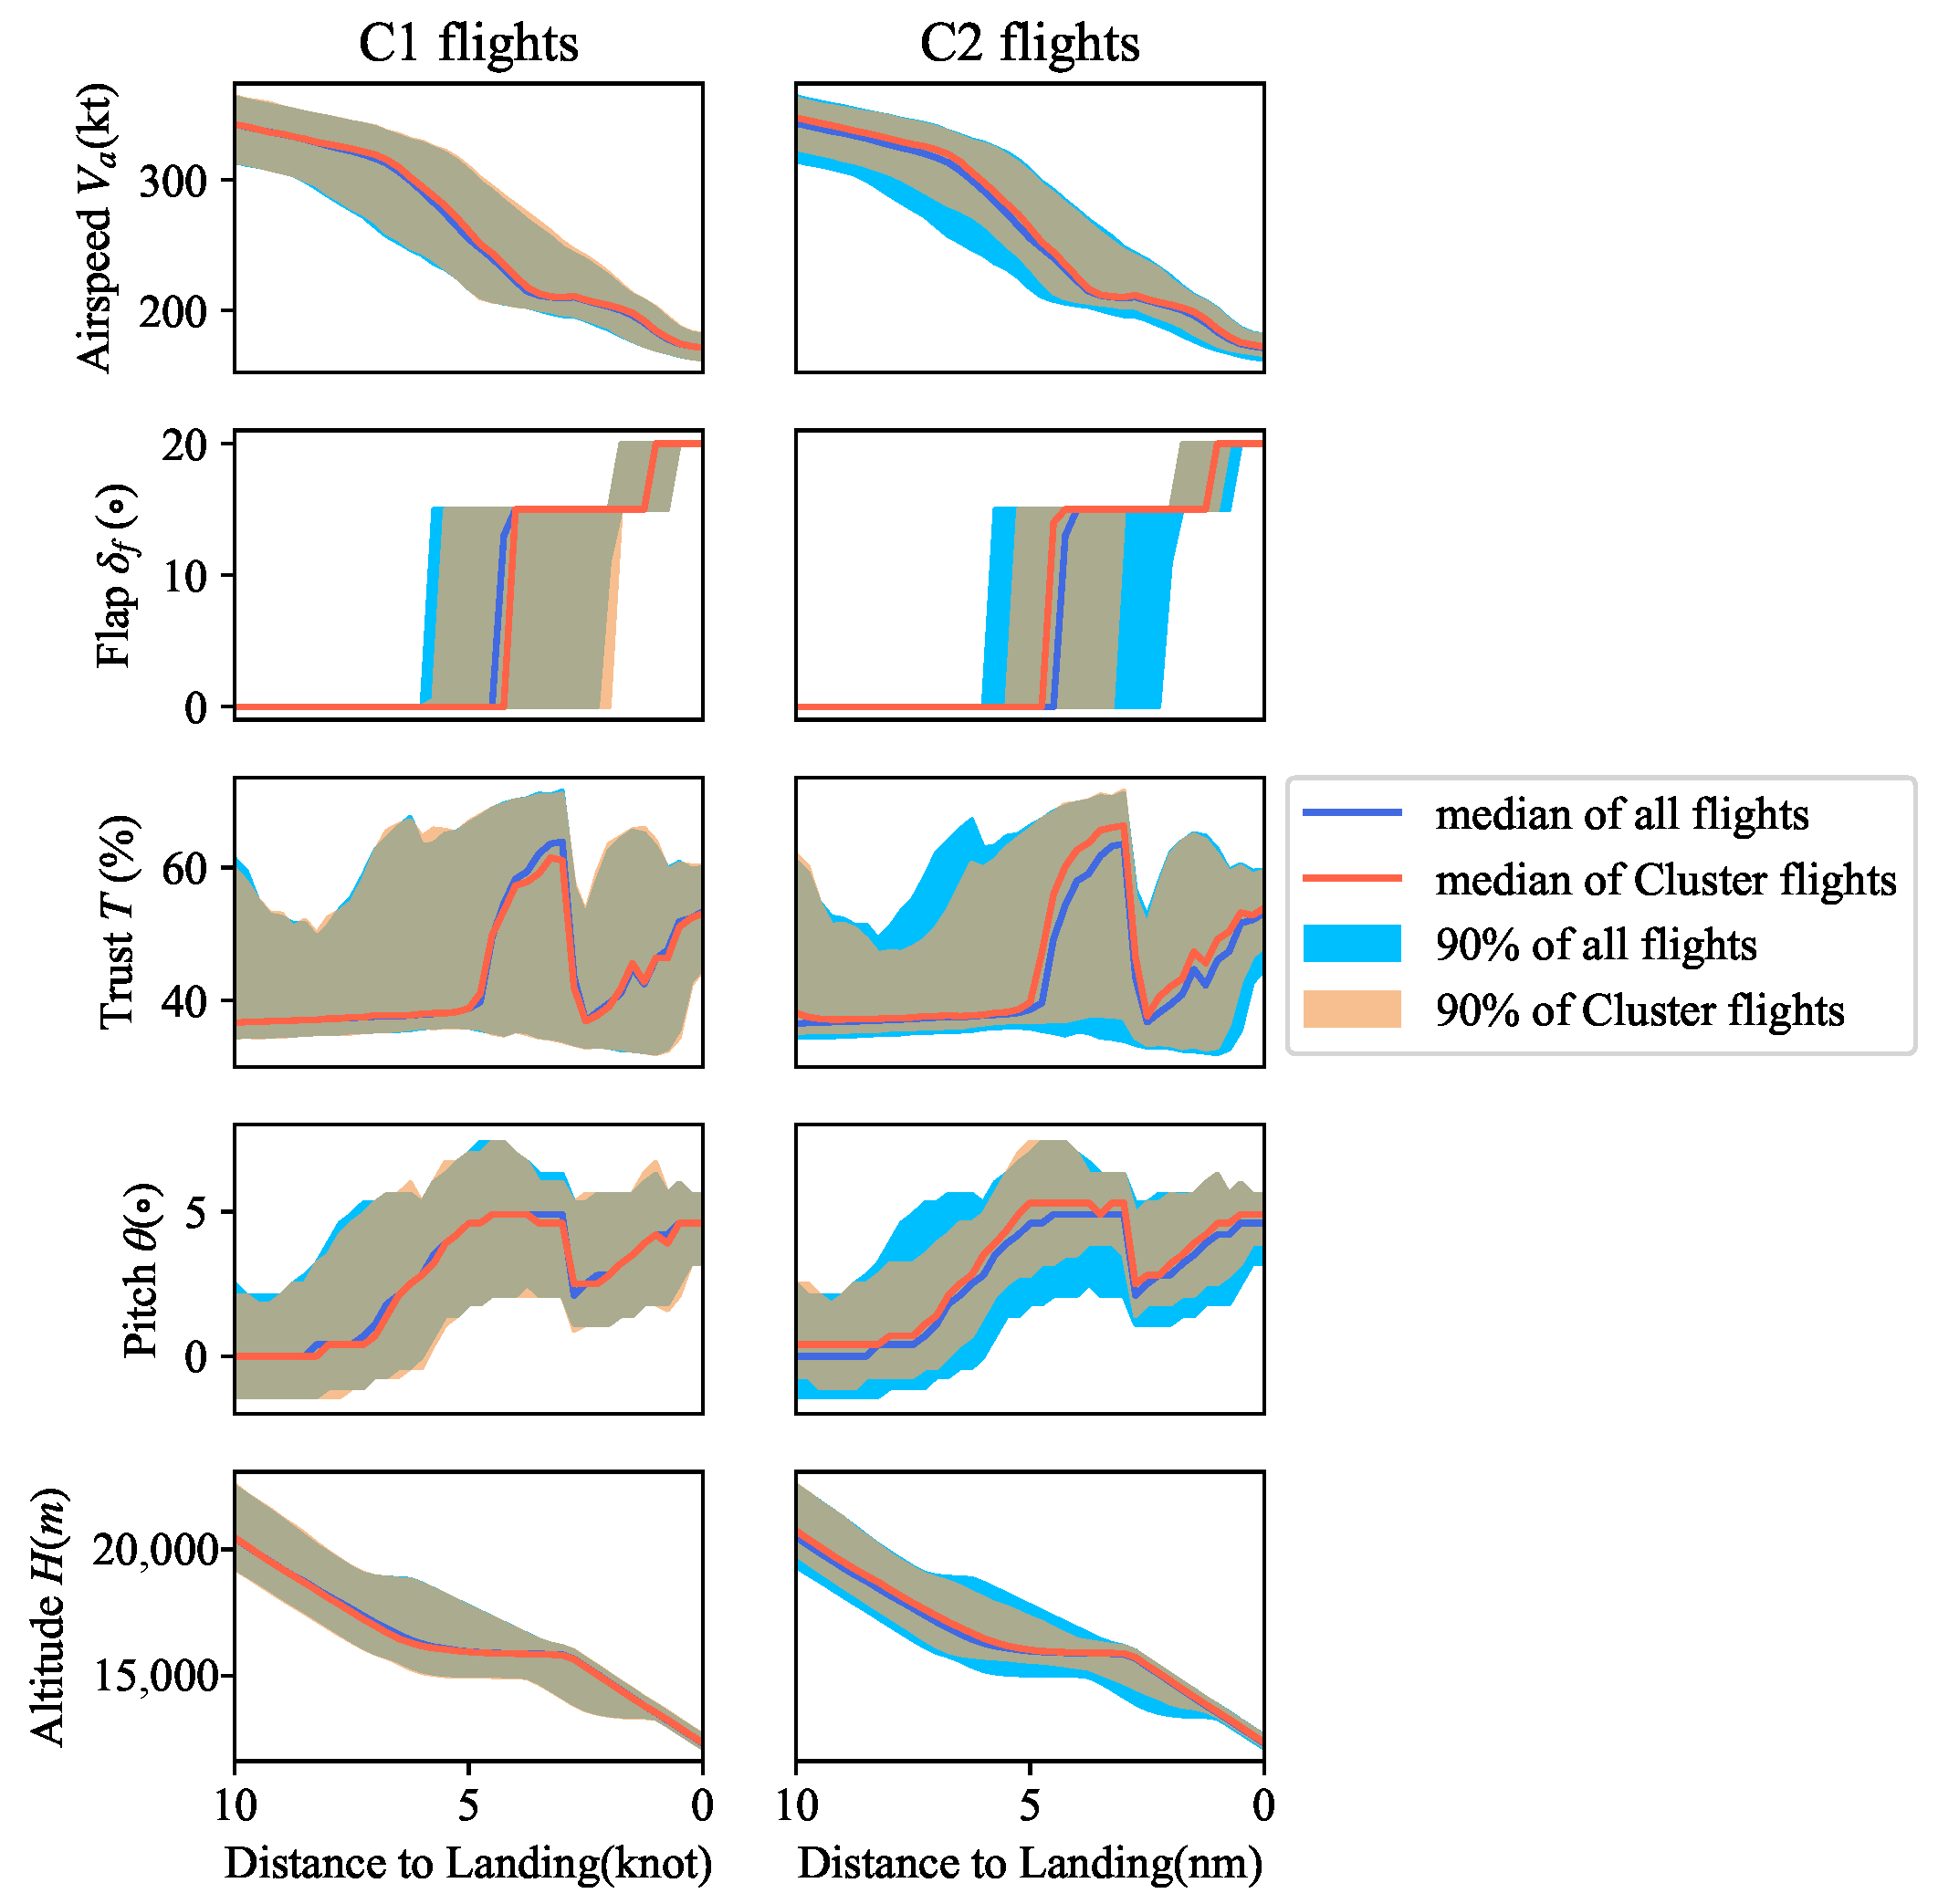
By leveraging the catalyst flights, the labels of the catalysts were propagated to the unlabeled flights within their respective clusters. Flights in C1 were labeled as precursors of low-energy approaches, whereas flights in C3 were labeled as precursors of high-energy approaches. The results were further confirmed by comparing the average specific total energy values of C1 and C3, which were, respectively, 5.83% lower and 10.93% higher than those of C2 at 1000 ft above touchdown.
Of particular interest is that most of the low-energy catalytic flights were clustered in
C1 and most of the high-energy catalytic flights were clustered in
C3, as shown in
Figure 7d. Specifically, 17 flights classified as having low-energy approaches were assigned to
C1 and 32 flights classified as having high-energy approaches were assigned to
C3. These findings highlight the potential of CMCA for detecting and predicting safety events in flight data and showcase its potential impact on aviation safety research and practice. It is worth mentioning that by incorporating the characteristics of other flight stages, selecting the appropriate features, and constructing an applicable
, this method can be easily extended to other flight phases.
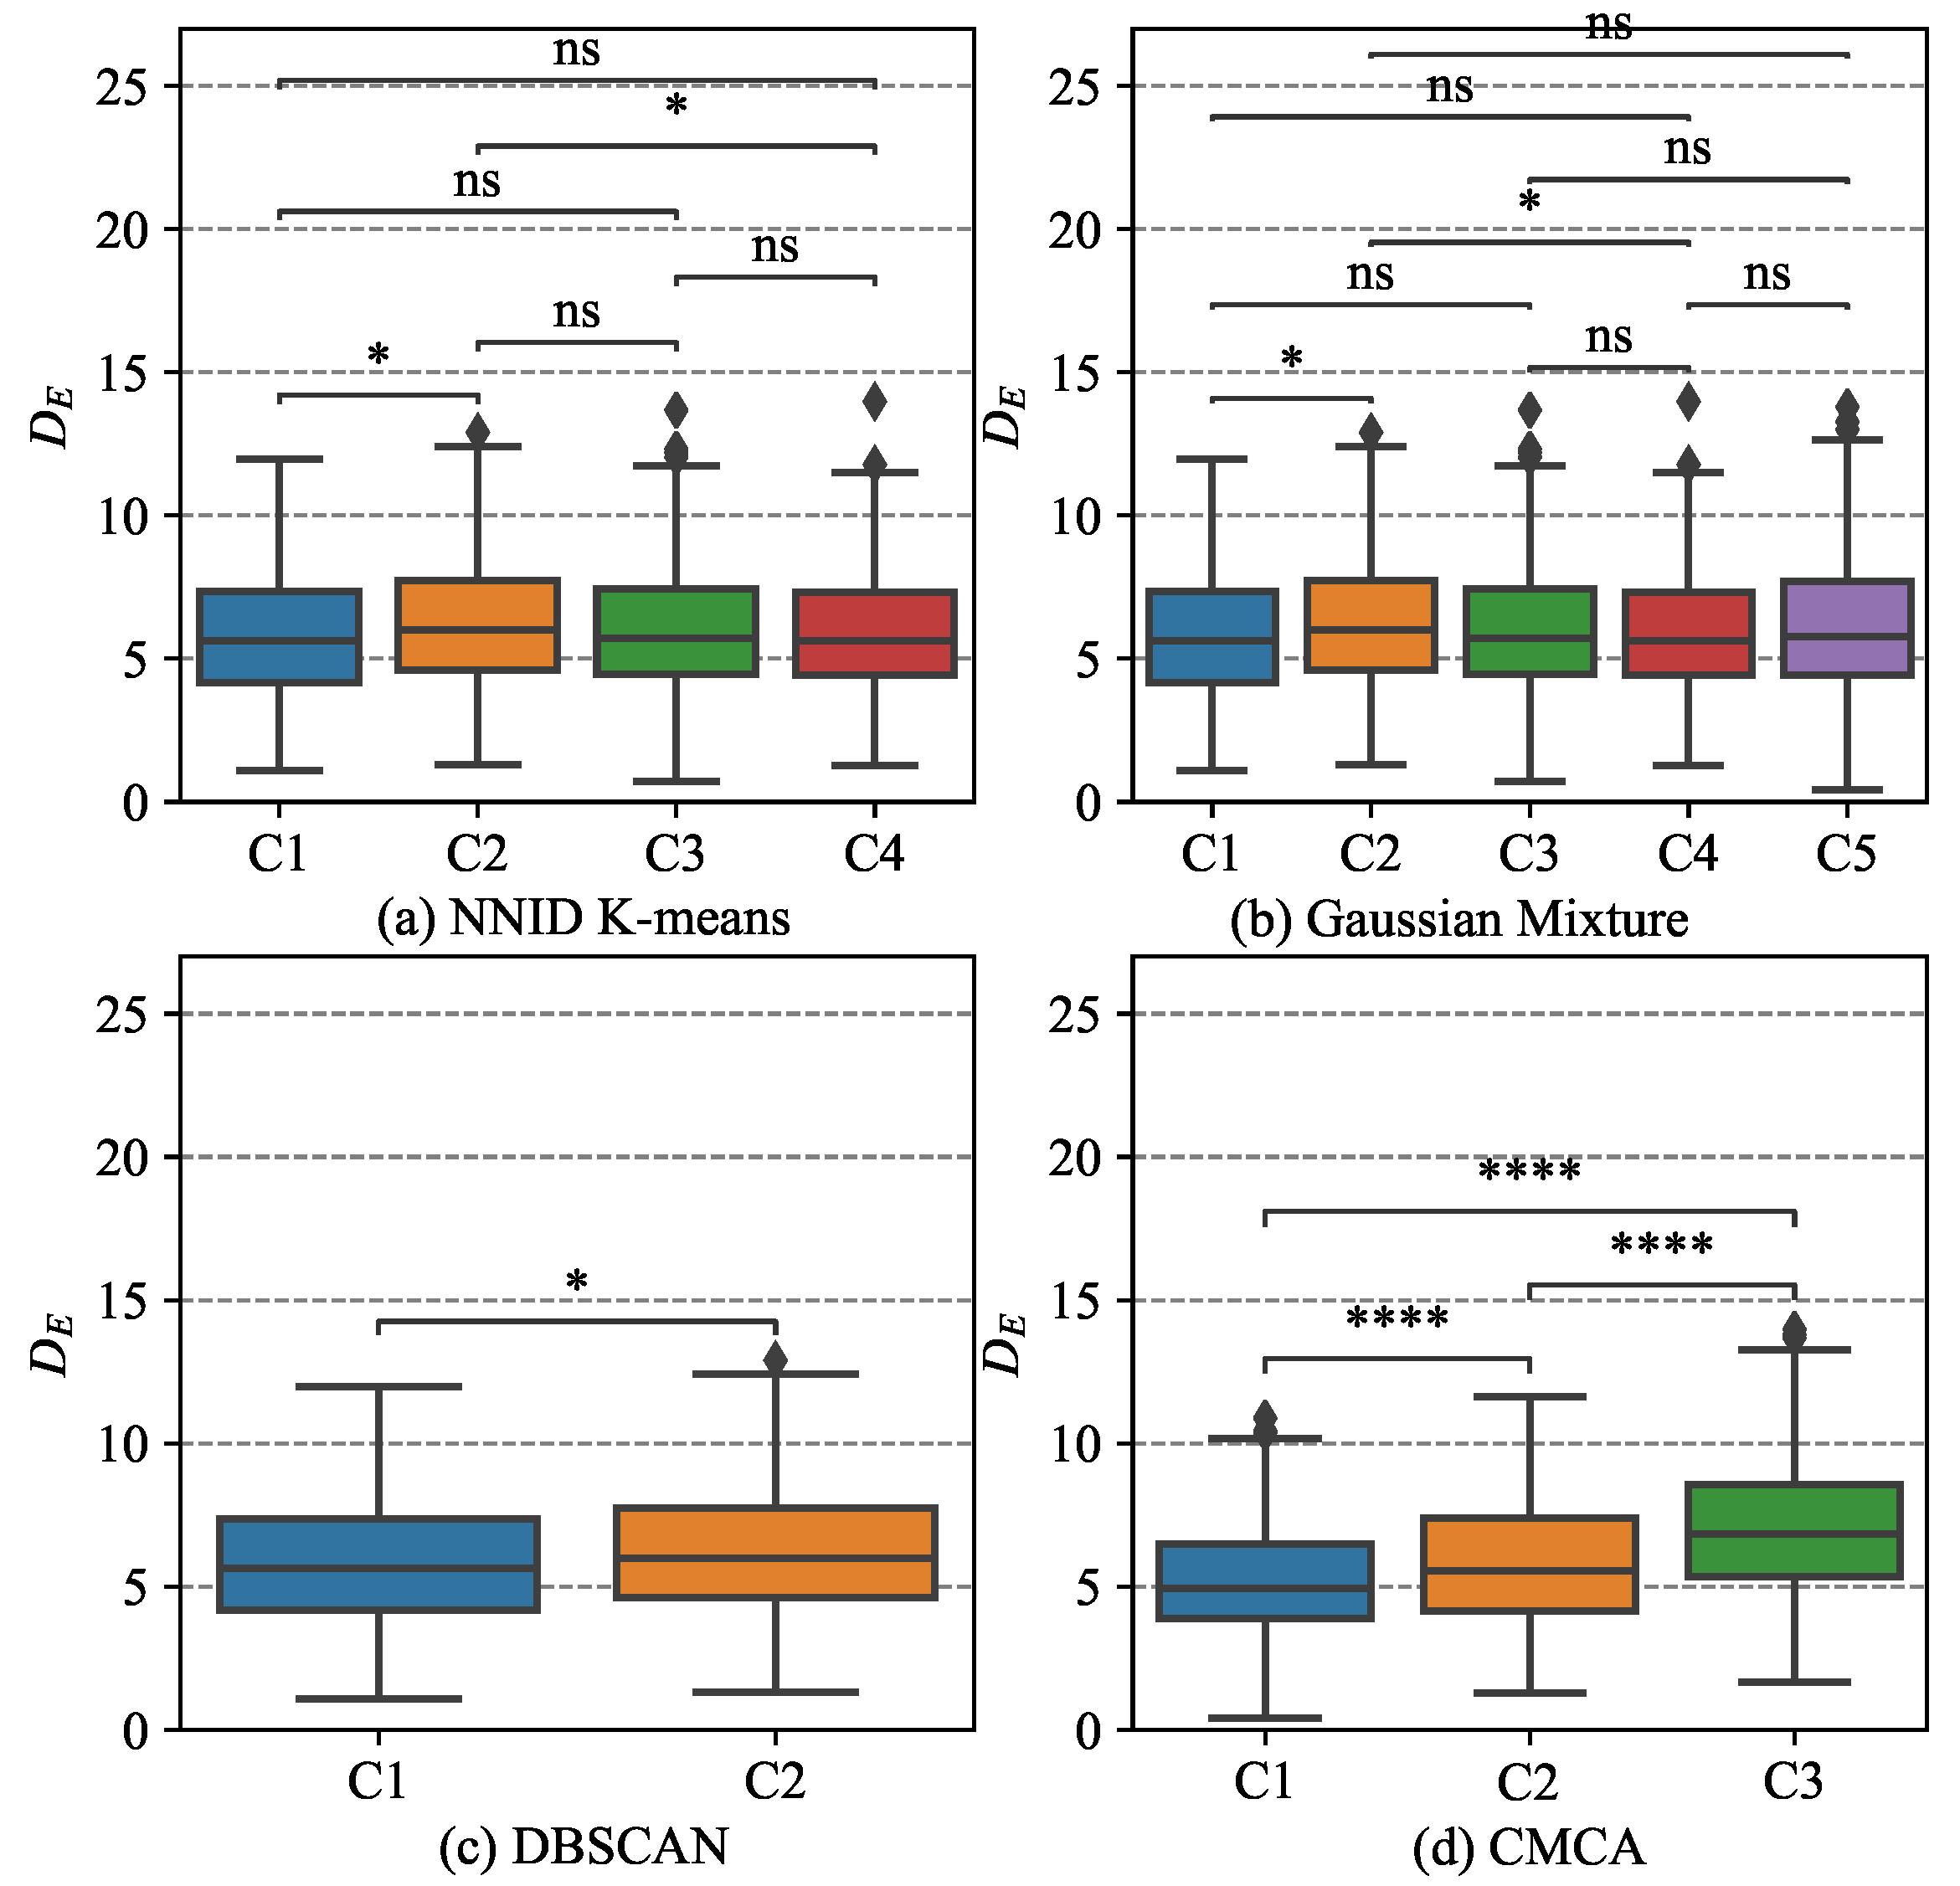
To better validate the clustering quality of CMCA, a statistical analysis of the
of each cluster was carried out. The statistical results of the algorithms mentioned above are shown in
Figure 8.
As shown in
Figure 8, the results reveal that the three clusters identified by CMCA exhibited significant differences (
p < 0.00) in terms of
, indicating that they may correspond to different levels of performance during approach. As for the other methods, it is evident from
Figure 8a that only the indices between
C1 and
C2, and
C2 and
C4 demonstrated significant differences (
p < 0.05) in performance during approach according to further non-parametric Mann–Whitney testing. This implies that other clusters could not be distinguished based on performance during approach. Similarly, only the differences between
C1 and
C2 and
C2 and
C4 were remarkable, which can be seen in
Figure 8b. As seen in
Figure 8c, although the two clusters in Algorithm 3 differed, the substantial data imbalance between
C1 (3357) and
C2 (101) significantly influenced the test results. These findings suggest that CMCA can provide reliable insights into the safety implications of different flight states and can be a valuable tool for identifying group-scale precursor issues.
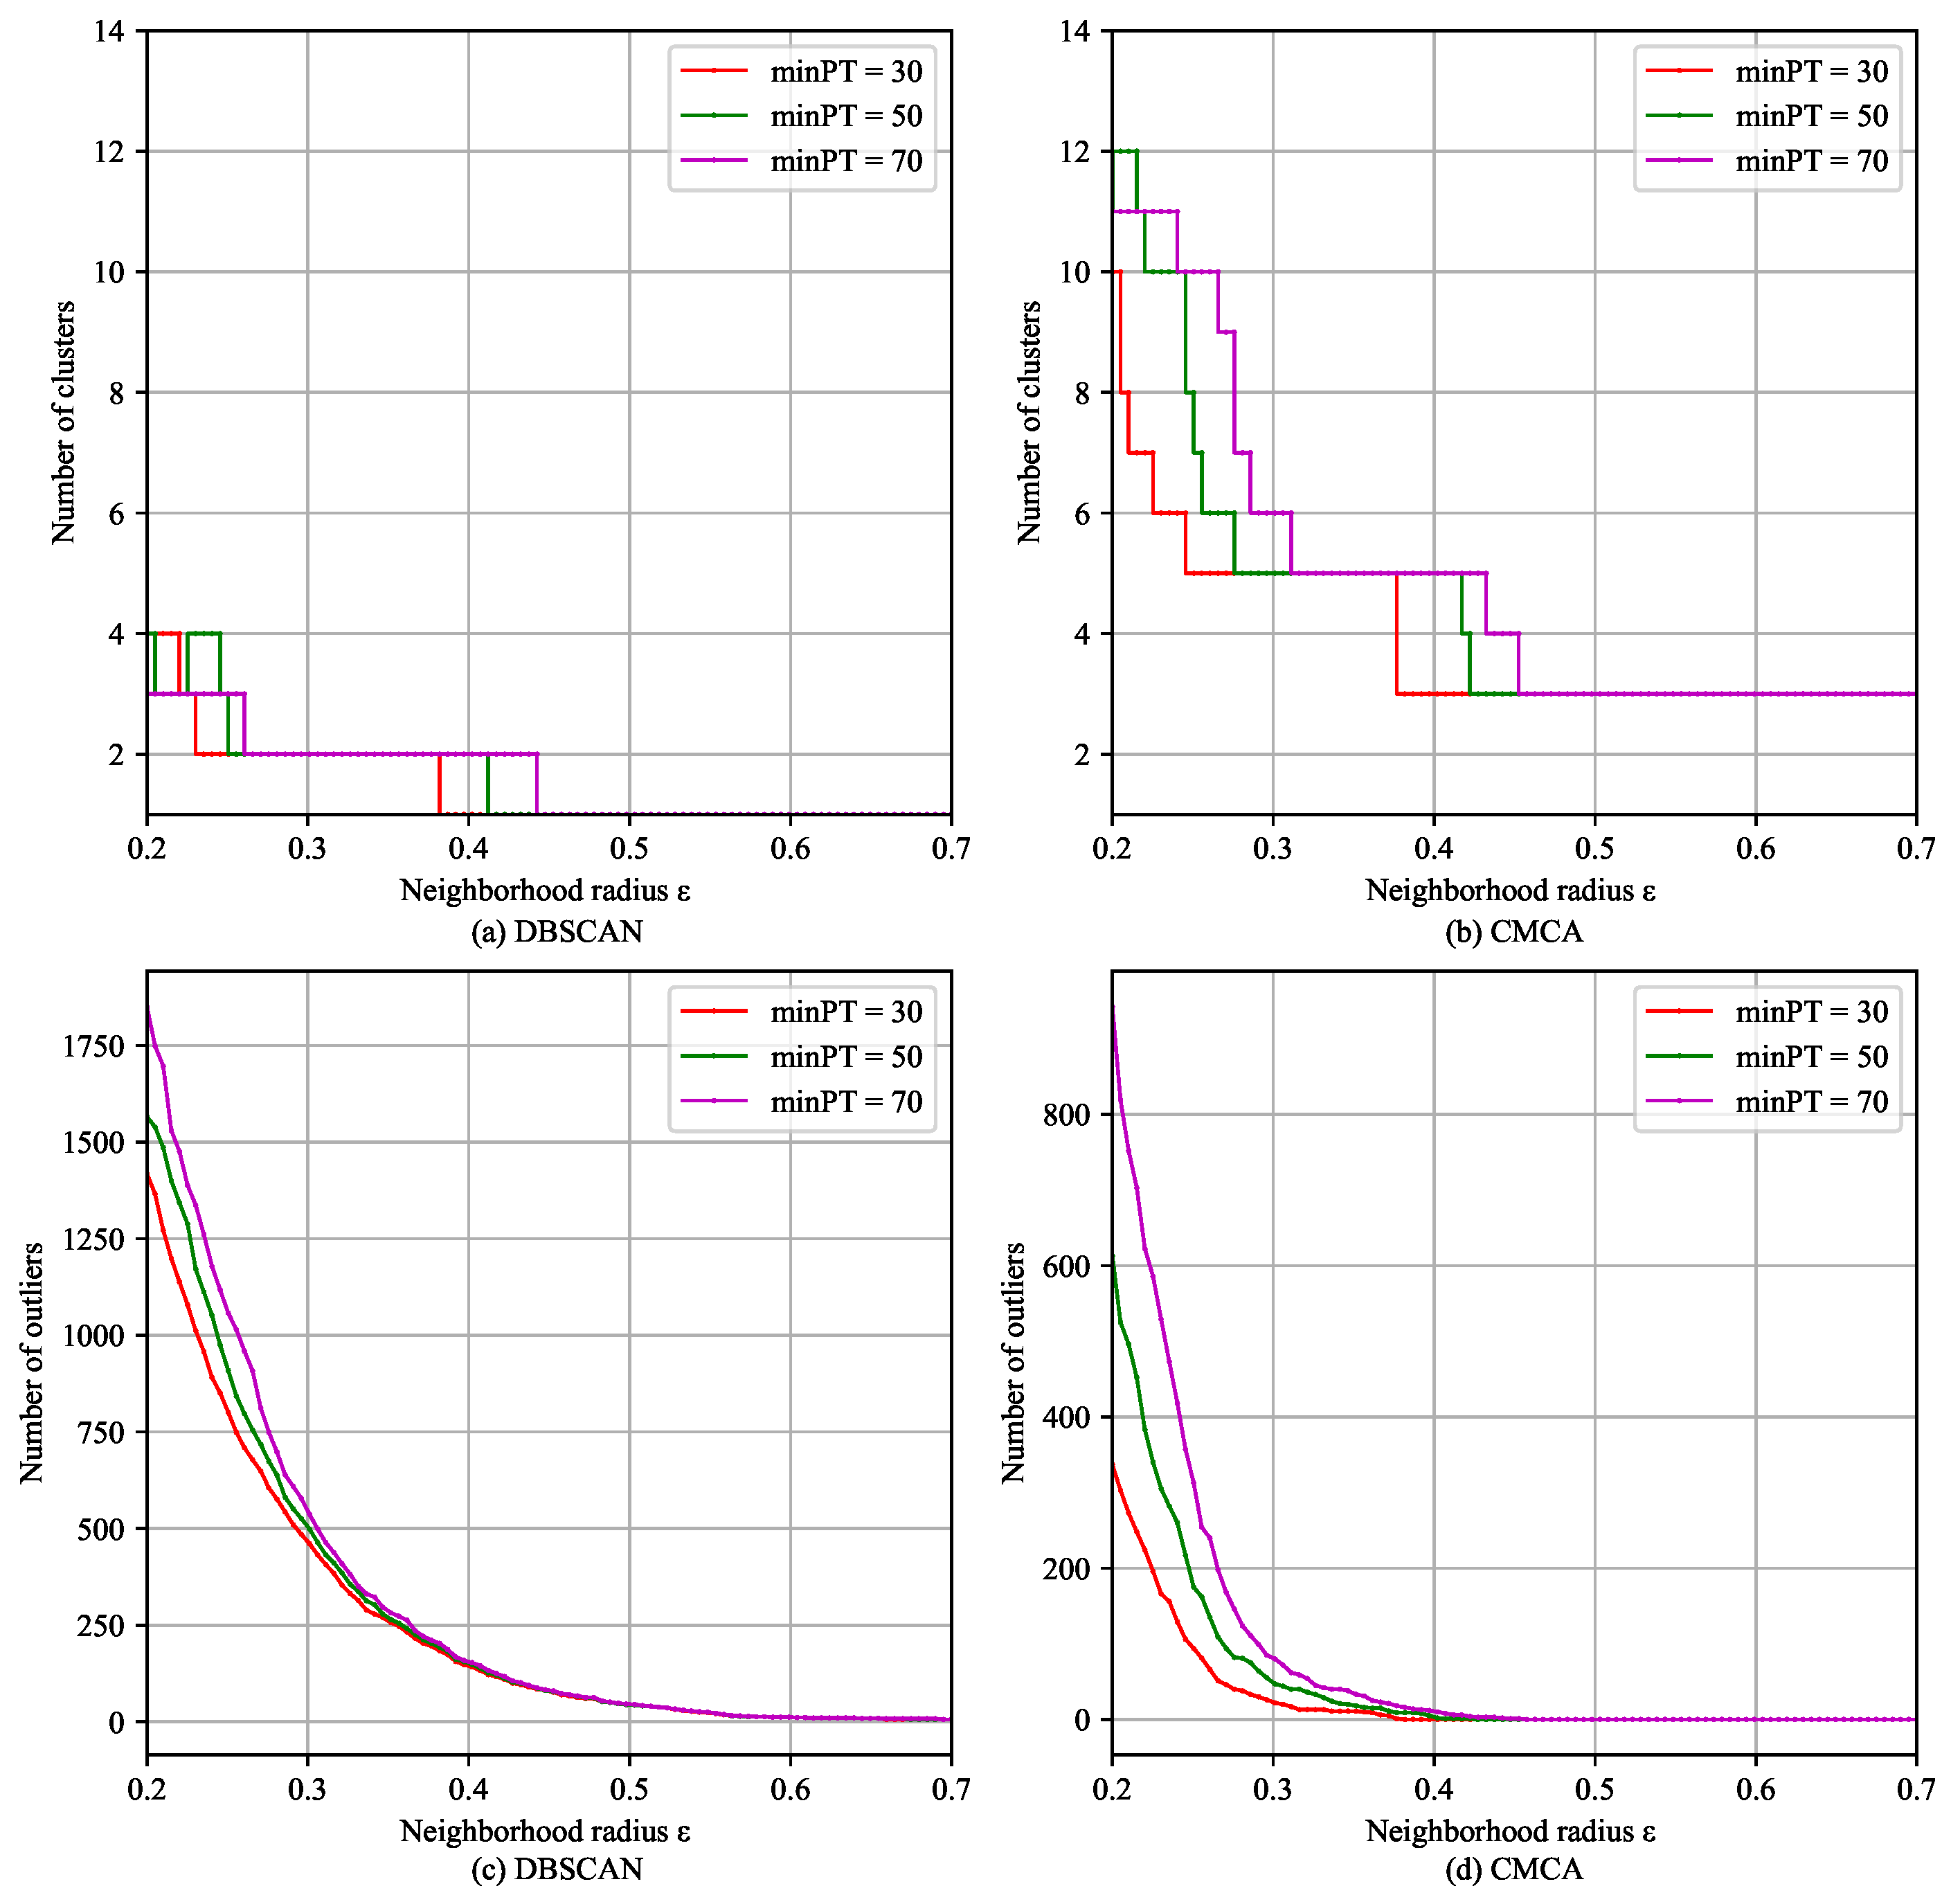
To further analyze the influence of the hyperparameters, a sensitivity analysis of Algorithm 3 and CMCA was carried out, and the results are shown in
Figure 9, where the horizontal axis represents the value of
and the vertical axis represents the number of clusters corresponding to a certain
and
. The number of flights in the top four clusters and the outliers are shown in
Table 1.
It can be observed in
Figure 9 and
Table 1 that adjusting
had little effect on the number of outliers and clusters identified by Algorithm 3 and CMCA. As
gradually increased, both methods identified fewer clusters and detected fewer outliers. The main difference was that Algorithm 3 could identify up to 4 clusters and CMCA could identify up to 12 clusters. When the number of clusters was stable, the number of outliers continued to vary for Algorithm 3, whereas for CMCA, both the number of clusters and outliers tended to stabilize when
was around 0.4. Furthermore, CMCA outperformed the other methods in identifying smaller clusters, likely due to the unique sensitivity of the number of clusters identified by Isolation Kernel Dissimilarity to
.


