Abstract
Single shear or single lap joints are the most prevalent type of adhesive joints used in advanced engineering applications, where they are exposed to fatigue loadings in their services. Although their mechanical performances under static loading have been investigated extensively, the studies related to the fatigue performances were limited. For that purpose, single lap joints’ (SLJs) reaction to fatigue tensile loading was studied by varying the adherend thickness (3 mm to 6 mm) and fatigue load (3250 N to 1500 N). ABAQUS/Standard was used to create its advanced FE model. To represent the progressive damage in the adhesive layer, the fatigue damage model via the Paris Law, which links the rate of the crack expansion to the strain energy release rate (SERR), was integrated into the cohesive zone model with bi-linear traction–separation characteristics. The model was written in a UMAT subroutine. The developed model was validated using experimental data from the literature. The crack initiation cycle (Ni), the failure cycle (Nf), the fatigue load limit, the strain energy release rate, the crack propagation rate, and variation of stress components with their dependency to design parameters were investigated in depth. It was found that the service life of the SLJs with thicker adherends was more responsive to the amount of stress applied. When exposed to lesser loads, the SLJs’ life span changed more noticeably.
1. Introduction and Motivation
Advanced engineering applications are increasingly using bonded joints as an alternative to more conventional methods including fastening, riveting, bolting and welding [1]. Uniform stress distribution along the width, a reduced amount of stress concentrations, lower structural weight as well as better fatigue and damping characteristics are among the advantages of the bonded joints. The complexities related to their productions such as surface preparation, manufacturing and curing conditions as well as the extreme environmental conditions are some of the challenges in this field. An increasing amount of research on these bonding types enabled bonded joints to become stronger than the parent materials’ greater ductility, peel and shear strengths till failure.
The most common kind of adhesive joints utilized in airplane applications are single shear or single lap joints. Even though these joint types are the weakest, they are chosen due to their ease of fabrication and inspection. They are frequently employed in wing ribs and wing spars to wing skin joints, and fuselage frames to fuselage skins [2]. Different components of the airplane structure, including the lap joints, are exposed to static loads, but mainly fatigue loadings in their services as a result of repeated flight cycles and frequent use. The dynamic loadings with regular or irregular cyclic loads are also due to environmental effects. For the former loading, many studies were performed in the literature [3,4,5]. However, few studies were dedicated for the fatigue loading [6]. Among them, Khoromishad et al. [7] developed a progressive fatigue damage model based on a bilinear traction-separation cohesive zone model for a SLJ. The numerical predictions were consistent with the experimental fatigue response in terms of the life of the SLJ, damage progress and back-face strains. A similar study was performed by Ibrahım et al. [8], where the damage surface concept served as a foundation for the fatigue damage degradation. Quaresimin and Ricotta [9] described the phases of fracture propagation and nucleation that made up the joint lifetime, where the generalized stress intensity factor (SIF) technique was used to model the former one and by incorporating a power law with a Paris-like relationship between the strain energy release rate (SERR) and the rate of crack expansion for the latter. Shahani and Pourhosseini [10] conducted an experimental and numerical analysis of the effect of adherent thickness on the fatigue performance of adhesively bonded thin aluminum single lap joints (SLJ). According to this work, when the adhesive layer thickness increased, the fatigue limit also increased and the likelihood of an adhesive layer failure increased. Experimental research by Sahin and Akpinar [11] examined the impact of adherend thickness on the fatigue strength of adhesively bonded SLJ. Because of the adherend’s flexural rigidity and the formed bending moment in the joint, it was discovered that the fatigue load applied to the SLJ, resulting in infinite life cycles to increase for thicker adherends. In another study, Katnam et al. [12] created a fatigue damage model with a bi-linear traction–separation response based on a cohesive zone model for a tapered single lap joint using an effective strain-based method. This study looked into how the load ratio affected the way the adhesively bonded joint failed. Li et al. [13] used experimental and numerical methods to study the fatigue properties of steel- and carbon-fiber-reinforced plastic laminated SLJs subjected to vibration loads. More studies about traction–separation laws and SLJs can be found elsewhere [14,15,16,17].
Understanding its failure mechanisms in terms of damage initiation, progression, as well as the failure sequence of the joint constituents are vital for the development of reliable joint designs. In particular, the crack initiation (Ni) and the failure cycles (Nf), the fatigue load limit, the crack propagation rate, strain energy release rate and failure modes with their dependency to design parameters need to be clarified. However, in the above studies, these points were not investigated systematically. This research offers a numerical analysis to assess the fatigue performance of an adhesively bonded SLJ made of AA2024-T3 aluminum alloy adherends and DP460 structural adhesive and subjected to tensile loading for various adherend thicknesses and fatigue loads. The cohesive zone elements were used in simulations to discretize the adhesive layer. Based on damage mechanics, the rate of fatigue damage was determined, where the damage builds up due to cyclic material weakening. The Paris Law, which links the SERR to the rate of crack formation, was used to calculate the life spent in the propagation phase. To do this, a user-defined UMAT function was employed. The behavior of the adherends was modeled using an elasto-plastic material model. The developed model was validated using experimental data from the literature.
The structure of this work is as follows: The developed FE model is described in Section 2, where a short description of the cohesive zone modeling theory is provided. The results and discussion of the performed parametric analysis are presented in Section 3 after the validation of the numerical model via the experimental data. Section 4 of the paper contains concluding remarks.
2. Numerical Modelling
The FE modelling was used to simulate an adhesively bonded SLJ of aluminum adherends subjected to tensile fatigue loading (Figure 1). ABAQUS/Standard was used to run 2D simulations [18].
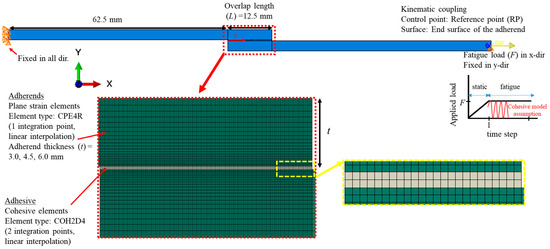
Figure 1.
Specifications of the 2D FE model of the SLJ under fatigue tensile loading.
The adherends were represented by 4-node plane strain elements (CPE4R). To examine the increasing degradation in the adhesive layer, using a bilinear traction separation description, four-noded cohesive elements (COH2D4) were employed. A mesh convergency study was performed based on the number of failure cycles and the von-Mises stress value at the left end element of the adhesive layer upon 3.0 kN static tensile load was applied. Three different element sizes along the overlap length in the adhesive layer, 0.10 mm, 0.050 mm and 0.025 mm, were considered. It was noticed that the change in the mentioned stress was 9.4% and 3.1% when the mesh was changed from coarsest mesh into the intermediate size mesh and then intermediate into the finest mesh. As a result, an average element size of 0.050 mm was used in the adhesive layer (see Figure 1). This mesh size also predicted the number of failure cycles with almost the same accuracy that the finest mesh predicted (their difference was also less than 4.0%). On the other hand, a finer mesh with a single bias ratio of 2 (in the direction of the connecting region) was used to discretize the adherend material. Overall, 500 and 6940 elements were created in the model for the modelling of the adhesive layer and the adherends, respectively. Using the built-in kinematic coupling in Abaqus, the left side of the SLJ was fixed in all degrees of freedom, while the right side was only allowed to move in the x-direction.
The adherends followed the elastic fully plastic constitutive equations, readily accessible in Abaqus. Following the research in [19], the fatigue damage model was applied to the adhesive layer, where the bi-linear traction–separation response deteriorated. It was implemented in two steps. The peak fatigue load was applied within a static step followed by the cyclic loading in the second step. The constitutive equations employed in these steps were explained in the next.
The displacement jump λ was defined in terms of the separation in (Mode 1) and (Mode 2) in the bi-linear traction–separation law as follows:
The Macauley operator was used for to ignore negative values. The relationship between and is given by
For each displacement jump for an individual mode, the starting values were required and calculated as follows:
The onset displacement jump () and critical displacement jump () were calculated as follows:
Here, . equals to , proposed by Turon et al. [20]. n represents the material constant used in Benzeggagh–Kenane criterion [21]. is calculated by
To ascertain if the displacement jump was significant enough to damage the adhesive layer, a damage threshold was considered. It was calculated at the present and following increments as follows:
Here, was calculated by:
Turon et al.’s [22] fatigue damage model was adapted here. In the fatigue analysis, the load was kept unchanged after it reached a maximum value in the previous static step.
The following equations were used by the fatigue damage model to relate to :
where was the ratio representing the number of elements in the cohesive zone. The study of Turon et al. [22] suggested the following for :
When the Equations (7) and (8) were combined together, the following was obtained:
was calculated for the mixed mode as [23]. Using the Benzegaggh–Kenane Criterion, was determined as . The mixed-mode interlaminar strength was calculated as . equaled to E due to isotropy of the aluminum adherends. The crack growth rate was defined as with = , where accounted for the ratio of the minimum and maximum loads during the fatigue loading. The following form is required for the crack to expand steadily: , i.e., if the strain energy release rate was more than , the crack development rate would become unstable; while if it was less than , the crack could not propagate. is calculated as follows:
A cycle jump strategy was followed in the calculations to cut down on lengthy calculations due to the big number of cycles following the study of Van Paepegem and Degrieck [24]. The damage variable at time step was calculated using:
influenced the accuracy of the results and was obtained as
Here, , the maximum damage increase, was selected to be 0.005, where such a smaller value resulted in more precise results [25]. Ultimately, the total damage was equal to the summation of static and fatigue damages, . With regard to the invoking of different failure modes, a cohesive zone length and a mode-dependent penalty stiffness were calculated following the study of Turon et al. [26]
All the above constitutive equation were accommodated in the computations using a UMAT subroutine [27]. The constants added to Abaqus to simulate the behavior of adherends and the adhesive layer are listed in Table 1.

Table 1.
The material constants for the adherends and adhesive layer used in numerical analyses [11].
3. Result and Discussion
In this section, the numerical model was first validated using experiments from the literature. The impact of the adherend thickness on the progression of damage in the adhesive layer was then thoroughly examined.
The numerically obtained number of cycles to failure from the SLJs depending on the amount of load applied (ranging from 3250 N to 1500 N with 250 N decrement) as well as the corresponding stresses applied (ranging from 43.33 MPa to 13.33 MPa) for different adherend thicknesses (3 mm, 4.5 mm and 6 mm) were shown in Figure 2a,b, respectively. Table 2 demonstrates the respective number of failure cycles. The experimental values taken from Ref. [11] were also presented in both figures. They were for 3 mm and 6 mm adherend thicknesses with 3000 N and 2500 N loads with the corresponding stresses applied. Overall, a judiciously good agreement of the experiments and simulations was achieved. Only, for the thicker adherends subjected to 2500 N load, the experimentally obtained failure cycles, ranging from 117,059 to 198,275, were less than the numerically predicted one, 386,850 cycles.
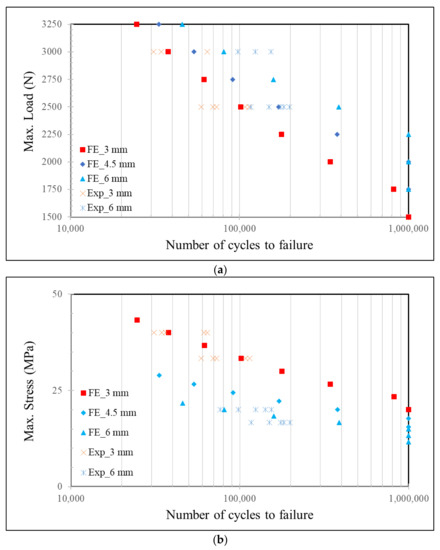
Figure 2.
Experimentally and numerically obtained Nf from the SLJs for various adherend thicknesses when exposed to different loadings (a) and stresses (b).
Table 2.
Life to damage initiation (Ni) and number of cycles to failure (Nf) with their ratios (Ni/Nf) for the SLJs with various adherend thicknesses when exposed to different loadings and stresses.
It was observed that for the identical fatigue load applied, the SLJs of 3 mm adherends failed at earlier cycles when compared to those of 4.5 mm and 6.0 mm. For instance, for the fatigue load of 3250 N, they were 24,610, 33,396 and 45,953 cycles for adherend thicknesses of 3.0 mm, 4.5 mm and 6.0 mm, respectively, while for 2500 N, the SLJs failed at 101,870, 171,160 and 386,850 cycles, respectively (Table 2). Obviously, the life of SLJs lasted longer when the applied load was reduced. Here, the failure cycle of SLJ of 3 mm increased almost 4.13 times when the load was decreased from 3250 N to 2500 N, whereas it was 8.41 times for that of 6 mm. It was concluded that the SLJs of thicker adherends were more sensitive to the amount of load applied in terms of its service life when compared to those of thinner ones.
The influence of change in the applied load level on the life span of the SLJ was also investigated. When the applied load was decreased by 7.69% from 3250 N to 3000 N, the life of SLJ with 3.0 mm increased by 53.8% from 37,857 to 24,610 cycles. On the other hand, for a decrease in the loading by 12.5% from 2000 N to 1750 N, a more than 100% increase in the number of failure cycles was noticed. This revealed that the life span of the SLJs changed more dramatically when subjected to a lower amount of load.
In the above, the life of SLJs of thicker adherends was found to be longer than those of thinner ones for an identical fatigue load applied. In fact, a more fair comparison could be made when the amount of load per cross-sectional area of the adherend, i.e., the stress applied, was considered as a reference. Here, numbers of failure cycles for different SLJ configurations were compared for the identical applied stress value of 20.00 MPa. They were found to be 1,000,000 (i.e., no failure), 378,670 and 80,748 cycles for the adherend thicknesses of 3.0 mm, 4.5 mm and 6.0 mm, respectively. From that respect, the fatigue performance of the SLJ of 3.0 mm adherend was more enhanced than that of 6.0 mm with an infinite life.
The fatigue load limit was also compared for the SLJs with different configurations. The fatigue load limitations were observed to be 1500 N, 2000 N, and 2250 N, respectively, for the adherend thicknesses of 3.0 mm, 4.5 mm, and 6.0 mm, when a fatigue life greater than 106 cycles was used as the run-out. On the other hand, the corresponding fatigue stress limits were 20 MPa, 17.77 MPa and 15.0 MPa, respectively. It was noticed that an increase in the adherend thickness led to a rise in the fatigue load limit [11,28], whereas a decrease in the fatigue stress limit.
Figure 3 presents the distribution of the damage variable on the adhesive layer upon the static loading applied and at different fatigue cycles, namely Nf/4, 2 Nf/4 and Nf for 3.0 mm adherend thickness and 3250 N fatigue load. As the stresses reached their peaks at the both ends of the adhesive layer upon the static loading applied at the beginning, the damage started in these regions (see Figure 3). Over the course of fatigue loading, the damage started to propagate, i.e., the crack began to spread evenly from the edges of the adhesive layer towards its center. After a certain number of failure cycles, all parts of the adhesive layer were damaged (Figure 3).
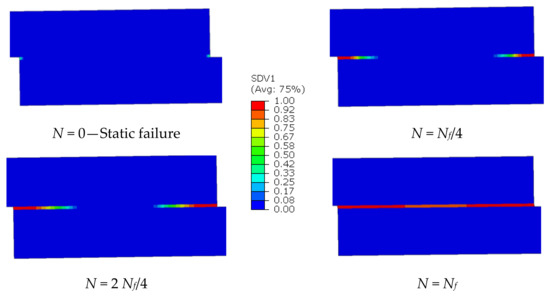
Figure 3.
The damage distribution in the adhesive layer along the overlap length at static loading and different fatigue cycles for 3.0 mm adherend thickness (F = 3250 N).
The assessment of a crack initiation is critical and one of the important parameters needs to be considered for a reliable design of a SLJ. Table 2 presents the number of cycles with damage initiation (Ni) in the adhesive layer. Additionally, their ratios against Nf, i.e., Ni/Nf, were also provided for all the configurations simulated. It was important to mention that the number of cycles at which the damage reached a minimum of 90% at one or both ends of the adhesive layer was used to define the life to crack initiation. It was observed that Ni/Nf decreased with a decrease in the load applied to the SLJ irrespective of the thickness of the adhesive layer. It was concluded that for higher loads, the onset of damage on the adhesive layer considering the failure cycles occurred at a later stage. When the fatigue load was reduced, the crack initiation in the adhesive layer took place at earlier stage.
Another vital parameter to evaluate the efficiency of the SLJs is the crack growth rate, da/dN during the fatigue loading. The crack propagation rate vs. number of cycles were compared for different SLJ configurations in Figure 4. It was observed that the crack propagation rate was not significant at the first cycles since the fatigue damage at the tips of the adhesive layer did not saturate yet, but the damage was still accumulating. After few hundreds of cycles, the crack growth rate started increasing and reached its maximum value steadily followed by a sudden jump at the final stage of the failure. Excluding the unsteady final crack growth regime, the maximum da/dN values were 2.7 × 10⁻⁴, 1.8 × 10⁻⁴ and 1.3 × 10⁻⁴ mm/cycle for 3 mm adherend thickness when subjected to load values of 3250 N, 3000 N and 2750 N, respectively. The respective values were 6.3 × 10⁻⁵, 3.7 × 10⁻⁵ and 2.3 × 10⁻⁵ mm/cycle for 6 mm adherend thickness. Firstly, it was noticed that da/dN became larger for smaller adherend thicknesses. Secondly, the change in da/dN with a change in the applied load to the SLJ was affected by the adherend thickness. For instance, the crack growth rate increased 2.08 times when the load was increased from 2750 N to 3250 N for t = 3.0 mm, while this ratio corresponded to 2.74 for t = 6.0 mm. This result revealed that the sensitivity of the crack expansion rate to the applied tensile loading was more prominent for the SLJ with thicker adherends.
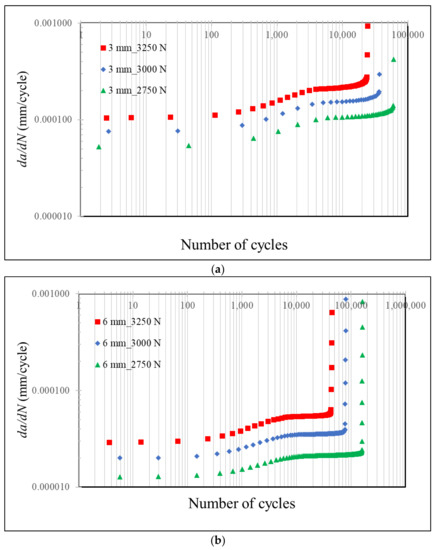
Figure 4.
da/dN vs. number of cycles for the SLJ exposed to 2750 N, 3000 N and 3250 N loads for adherend thicknesses of 3.0 mm (a) and 6.0 mm (b).
Figure 5 compares the da/dN with respect to the strain energy release rate (SERR) for various loadings and adherend thicknesses. da/dN vs. SERR was described using the Paris Law in the constitutive equations, where C and m were identical for the configurations studied here. Thus, all the numerically obtained data fell well on the identical curve. It should be emphasized that these constants were obtained as a result of exhaustive calibration efforts, where the predicted failure cycles of SLJs with 3.0 mm and 6.0 mm adherend thicknesses exposed to fatigue loads of 3000 N and 2500 N were matched with those obtained experimentally (see Figure 2).
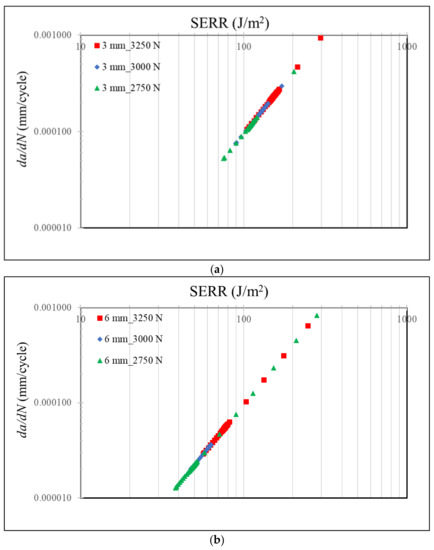
Figure 5.
da/dN vs. SERR for the SLJ exposed to 2750 N, 3000 N and 3250 N loads for adherend thicknesses of 3.0 mm (a) and 6.0 mm (b).
It was noticed that both da/dN and SERR became larger for higher fatigue loads (see Figure 5). It is important to underline that the points denoting the larger values in the plots for both parameters represented the unsteady final crack growth regime. The maximum SERR values were compared for all the relevant configurations excluding the final instable regime. They were 165.7, 138.4, and 116.4 J/m2 when the SLJ was subjected to load values of 3250 N, 3000 N and 2750 N for t equal to 3 mm, respectively. The corresponding values were 82.2, 63.8 and 50.2 J/m2 for t equal to 6 mm. It was observed that they were more than twice as large for t = 3.0 mm in comparison to those of t = 6.0 mm for the identical loading. As the SLJs of thinner adherends were exposed to higher load densities compared to those of thicker ones, more energy was released for them.
In the next section, the effect of adherend thickness and fatigue load applied on the failure mechanisms of the SLJ was investigated. For that purpose, distributions of peel and shear stresses were evaluated. Figure 6 presents the distributions of and throughout the overlap length in the adhesive layer with 3.0 mm and 6.0 mm adherend thicknesses subjected to a 2750 N fatigue load at different loading cycles, namely, just after the static loading, Nf/4, 2 Nf/4 and 3 Nf/4. When the values were checked just after the static loading, they started becoming smaller at the ends of the overlap length for t = 3 mm due to the damage in shear mode, while this was yet to start for 6 mm. On the other hand, the values were maximum at the tips of the adhesive layer. From this, it was concluded that shear failures were pronounced—rather than the peeling effects—in the damage of the adhesive layer for the static loading applied. When the distributions of and were compared for t = 3 mm and 6 mm, it was noticed that they were much larger at the end of the overlap length rather than its center for the former thickness, while they were more homogenous with less stress gradients for the latter one. It was concluded that the load was shared more equally by the material points along the overlap length for larger thicknesses of the adherends. When the fatigue loading was applied, the damage increased at both tips of the adhesive layer and finally the complete damage was reached. Then, the elements there could not carry any loading and both stress components became zero. When the portion of completely damaged elements were compared for an increasing number of cycles from Nf/4 to 3 Nf/4, they were increasing. For instance, for 3 Nf/4, while almost 24% (x/L = 0.12) of the overlap region was damaged for t = 3 mm, it was around 16% for t = 6 mm. For this loading cycle, the maximum stress was reached when x/L = 0.25 and 0.20 for t = 3 mm and 6 mm, respectively. In other words, 50% of the adhesive layer was not damaged yet for the first thickness and 60% for the second one. It was noted that a lower portion of the adhesive layer was subjected to the damage for thicker adherends for the identical fatigue loading period.
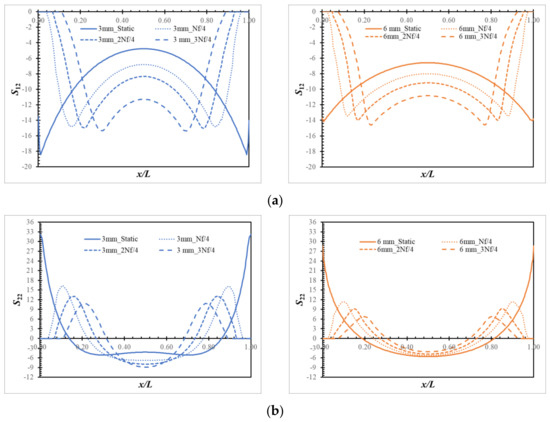
Figure 6.
Plot of stress components S12 (a) and S22 (b) (in MPa) along the overlap length for the SLJs exposed to 2750 N load for adherend thicknesses of 3.0 mm (left) and 6.0 mm (right).
4. Concluding Remarks
This study looked into how the fatigue damage evolved in the SLJ’s adhesive layer during a tensile test. Its advanced FE model was created for this purpose and tested against the experimental data from the literature. The fatigue damage model, which was then used to predict the behavior of the adhesive layer, was incorporated in the cohesive zone model. From this study, the succeeding conclusions were achieved:
- The SLJs with thicker adherends were observed to be more sensitive to the amount of load applied in terms of its service life.
- The life span of the SLJs changed more dramatically when subjected to a lower amount of load.
- A smaller thickness of the adherend in SLJ resulted in a decrease in the fatigue load limit, but led to an increase in the fatigue stress limit.
- When the fatigue load was increased, the crack initiation in the adhesive layer took place at a later stage when considering the failure cycle, i.e., an increased Ni/Nf with a shorter crack propagation duration was noticed.
- The crack propagation rate was not significant while the fatigue damage was still accumulating along the overlap length. Afterwards, it started increasing and reached its maximum gradually followed by a sudden jump at the final unsteady stage of the failure. The change in the crack propagation rate with a change in the amount of tensile loading applied was less for the SLJ with thinner adherends.
- It was noted that a larger share of the adhesive layer was damaged for thinner adherends for the identical fatigue loading period.
Author Contributions
Conceptualization, M.D. and S.A.; methodology, M.D. and F.A.; software, A.Z.; validation, M.D.; investigation, M.D., F.A. and S.A.; writing—original draft, M.D.; writing—review and editing, M.D., F.A., A.Z. and S.A.; supervision, M.D. All authors have read and agreed to the published version of the manuscript.
Funding
The APC was funded by the American University of the Middle East, Kuwait.
Data Availability Statement
Not applicable.
Conflicts of Interest
The authors declare no conflict of interest.
Nomenclature
| crack length | |
| crack expansion rate | |
| local mixed-mode ratio | |
| C | constant in Paris law |
| CZ | cohesive zone |
| , | fatigue damage variables at time step and , respectively |
| , | static damage at the present and next incements, respectively |
| total damage | |
| Young’s Modulus | |
| mixed-mode Young’s Modulus | |
| FE | finite-element |
| mixed-mode fracture toughness | |
| area under the traction separation curve | |
| critical strain energy release rate for the opening mode | |
| critical strain energy release rate for the shear mode | |
| threshold value for the strain energy release rate | |
| interface stiffness for the opening mode | |
| mode dependent penalty stiffness | |
| penalty stiffness for the shear mode | |
| m | constant in Paris law |
| length of the cohesive zone | |
| length of the damaged area | |
| size of the finite element | |
| Ni | crack initiation cycle |
| Nf | failure cycle |
| n | material constant used in Benzeggagh-Kenane criterion |
| R | load ratio |
| SERR | strain energy release rate |
| SLJ | single lap joint |
| UMAT | user material available in Abaqus |
| λ | displacement jump |
| onset displacement jump | |
| critical displacement jump | |
| maximum displacement jump | |
| fatigue damage evolution variable | |
| expansion rate of the length of the damaged area | |
| skipped number of cycles | |
| selected maximum damage increase in the computations | |
| separation in Mode 1 (opening mode) | |
| separation in Mode 2 (shear mode) | |
| yield strength | |
| interfacial strength for the opening mode | |
| interfacial strength for the shear mode | |
| mixed-mode interlaminar strength | |
| Poisson’s ratio | |
| Macauley operator |
References
- Sioutis, I.; Tserpes, K. A Literature Review on Crack Arrest Features for Composite Materials and Composite Joints with a Focus on Aerospace Applications. Aerospace 2023, 10, 137. [Google Scholar] [CrossRef]
- Chowdhury, N.; WK, C.; Wang, J.; Chang, P. Static and fatigue testing thin riveted, bonded and hybrid carbon fiber double lap joints used in aircraft structures. Compos. Struct. 2015, 121, 315–323. [Google Scholar] [CrossRef]
- Adams, R.D. Strength Predictions for Lap Joints, Especially with Composite Adherends. A Review. J. Adhes. 1989, 30, 219–242. [Google Scholar] [CrossRef]
- Kadioglu, F.; Demiral, M. Failure behaviour of the single lap joints of angle-plied composites under three point bending tests. J. Adhes. Sci. Technol. 2020, 34, 531–548. [Google Scholar] [CrossRef]
- Zhao, B.; Lu, Z.-H. A Two-Dimensional Approach of Single-Lap Adhesive Bonded Joints. Mech. Adv. Mater. Struct. 2009, 16, 130–159. [Google Scholar] [CrossRef]
- Abdel Wahab, M. Fatigue in Adhesively Bonded Joints: A Review. ISRN Mater. Sci. 2012, 746308. [Google Scholar] [CrossRef]
- Khoramishad, H.; Crocombe, A.D.; Katnam, K.B.; Ashcroft, I.A. Predicting fatigue damage in adhesively bonded joints using a cohesive zone model. Int. J. Fatigue 2010, 32, 1146–1158. [Google Scholar] [CrossRef]
- Ibrahim, G.R.; Albarbar, A.; Brethee, K.F. Progressive failure mechanism of laminated composites under fatigue loading. J. Compos. Mater. 2020, 55, 137–144. [Google Scholar] [CrossRef]
- Quaresimin, M.; Ricotta, M. Life prediction of bonded joints in composite materials. Int. J. Fatigue 2006, 28, 1166–1176. [Google Scholar] [CrossRef]
- Shahani, A.R.; Pourhosseini, S.M. The effect of adherent thickness on fatigue life of adhesively bonded joints. Fatigue Fract. Eng. Mater. Struct. 2019, 42, 561–571. [Google Scholar] [CrossRef]
- Sahin, R.; Akpınar, S. The effects of adherend thickness on the fatigue strength of adhesively bonded single-lap joints. Int. J. Adhes. Adhes. 2021, 107, 102845. [Google Scholar] [CrossRef]
- Katnam, K.B.; Crocombe, A.D.; Khoramishad, H.; Ashcroft, I.A. Load Ratio Effect on the Fatigue Behaviour of Adhesively Bonded Joints: An Enhanced Damage Model. J. Adhes. 2010, 86, 257–272. [Google Scholar] [CrossRef]
- Li, W.; Zhou, S.; Shi, Z.; Wang, X.; Hu, P. Experimental and numerical analysis on fatigue durability of single-lap joints under vibration loads. J. Adhes. 2017, 93, 187–203. [Google Scholar] [CrossRef]
- Ghabezi, P.; Farahani, M. Trapezoidal traction–separation laws in mode II fracture in nano-composite and nano-adhesive joints. J. Reinf. Plast. Compos. 2018, 37, 780–794. [Google Scholar] [CrossRef]
- Sam-Daliri, O.; Faller, L.M.; Farahani, M.; Roshanghias, A.; Araee, A.; Baniassadi, M.; Oberlercher, H.; Zangl, H. Impedance analysis for condition monitoring of single lap CNT-epoxy adhesive joint. Int. J. Adhes. Adhes. 2019, 88, 59–65. [Google Scholar] [CrossRef]
- Ramalho, L.D.; Campilho, R.D.; Belinha, J.A.O.; da Silva, L.F. Static strength prediction of adhesive joints: A review. Int. J. Adhes. Adhes. 2020, 96, 102451. [Google Scholar] [CrossRef]
- Rocha, R.J.B.; Campilho, R.D.S.G. Evaluation of different modelling conditions in the cohesive zone analysis of single-lap bonded joints. J. Adhes. 2018, 94, 562–582. [Google Scholar] [CrossRef]
- Systemes, D. Abaqus 6.14 Documentation; Simulia Co.: Providence, RI, USA, 2014. [Google Scholar]
- Belnoue, J.H.; Giannis, S.; Dawson, M.; Hallett, S.R. Cohesive/adhesive failure interaction in ductile adhesive joints Part II: Quasi-static and fatigue analysis of double lap-joint specimens subjected to through-thickness compressive loading. Int. J. Adhes. Adhes. 2016, 68, 369–378. [Google Scholar] [CrossRef]
- Turon, A.; Camanho, P.; Costa, J.; Dávila, C. A damage model for the simulation of delamination in advanced composites under variable-mode loading. Mech. Mater. 2006, 38, 1072–1089. [Google Scholar] [CrossRef]
- Benzeggagh, M.L.; Kenane, M. Measurement of mixed-mode delamination fracture toughness of unidirectional glass/epoxy composites with mixed-mode bending apparatus. Compos. Sci. Technol. 1996, 56, 439–449. [Google Scholar] [CrossRef]
- Turon, A.; Camanho, P.; Costa, J.; Dávila, C. Simulation of delamination in composites under high-cycle fatigue. Compos. Part A Appl. Sci. Manuf. 2007, 38, 2270–2282. [Google Scholar] [CrossRef]
- Smeets, E. Development of a Fatigue Analysis Tool Using Cohesive Zone Modelling for Composite Specimens. Master’s Thesis, Delft University of Technology, Delft, The Netherlands, 2019. [Google Scholar]
- Van Paepegem, W.; Degrieck, J. Fatigue degradation modelling of plain woven glass/epoxy composites. Compos. Part A Appl. Sci. Manuf. 2001, 32, 1433–1441. [Google Scholar] [CrossRef]
- Demiral, M.; Mamedov, A. Fatigue Performance of a Step-Lap Joint under Tensile Load: A Numerical Study. Polymers 2023, 15, 1949. [Google Scholar] [CrossRef] [PubMed]
- Turon, A.; González, E.; Sarrado, C.; Guillamet, G.; Maimí, P. Accurate simulation of delamination under mixed-mode loading using a cohesive model with a mode-dependent penalty stiffness. Compos. Struct. 2018, 184, 506–511. [Google Scholar] [CrossRef]
- Demiral, M.; Abbassi, F.; Muhammad, R.; Akpinar, S. Service Life Modelling of Single Lap Joint Subjected to Cyclic Bending Load. Aerospace 2023, 10, 8. [Google Scholar] [CrossRef]
- Azari, S.; Papini, M.; Spelt, J.K. Effect of adhesive thickness on fatigue and fracture of toughened epoxy joints—Part I: Experiments. Eng. Fract. Mech. 2011, 78, 153–162. [Google Scholar] [CrossRef]
Disclaimer/Publisher’s Note: The statements, opinions and data contained in all publications are solely those of the individual author(s) and contributor(s) and not of MDPI and/or the editor(s). MDPI and/or the editor(s) disclaim responsibility for any injury to people or property resulting from any ideas, methods, instructions or products referred to in the content. |
© 2023 by the authors. Licensee MDPI, Basel, Switzerland. This article is an open access article distributed under the terms and conditions of the Creative Commons Attribution (CC BY) license (https://creativecommons.org/licenses/by/4.0/).