Article

Exploring Delay Propagation Causality in Various Airport Networks with Attention-Weighted Recurrent Graph Convolution Method

1
College of Civil Aviation, Nanjing University of Aeronautics and Astronautics, Jiangjun Road No. 29, Nanjing 211106, China
2
State Key Laboratory of Air Traffic Management System and Technology, Nanjing 210007, China
3
College of General Aviation and Flight, Nanjing University of Aeronautics and Astronautics, Jiangjun Road No. 29, Nanjing 211106, China
*
Author to whom correspondence should be addressed.
Aerospace 2023, 10(5), 453; https://doi.org/10.3390/aerospace10050453
Submission received: 6 April 2023 / Revised: 8 May 2023 / Accepted: 12 May 2023 / Published: 15 May 2023

Abstract

:
Exploring the delay causality between airports and comparing the delay propagation patterns across different airport networks is critical to better understand delay propagation mechanisms and provide effective delay mitigation strategies. A novel attention-based recurrent graph convolutional neural network is proposed to identify the hidden delay causality relationship among airports in three different airport networks of China. The selected three airport networks show great heterogeneities in topological characteristics, such as average intensity, modularity and eigenvector centrality. The modeling results indicate that the identified delay causality networks of three airport networks are greatly varied in terms of complexity, delay propagation distance and efficiency. Moreover, the delay state of each airport is categorized into three levels, and the delay state transition of the three networks is explored. The results indicate that delay state transition in the North China Control Area exhibits an obvious bidirectional transition form that mainly propagates between the large-degree airports and small-degree airports, while severe delays of some hub airports account for a relatively large proportion in the other two networks. The results of this study could better reveal the delay propagation mechanism among airports and help airport operators develop effective strategies to alleviate flight delays and improve airport operation efficiency.

1. Introduction

Over the past few decades, the rapid development of the civil aviation industry has greatly promoted air transportation demand and imbalance between airspace and traffic flow, resulting in serious flight delays and traffic congestion within the air traffic network [1,2]. The air transportation system is essentially a large-scale complex network and is usually involved with complicated interconnectivities and great heterogeneities so that a local flight delay will propagate to other airports and even induce large-scale flight delays in the air transportation network [3]. Airport flight delays are caused by many uncertain factors, such as adverse weather, late passengers and additional maintenance duration [4], and usually exhibit different characteristics across various air traffic networks, making the delay propagation mechanism complex and heterogeneous [5,6]. Thus, exploring the delay propagation characteristics across various airport networks is important and challenging, which could help airport operators develop effective flight management strategies to alleviate flight delays and improve airport operation efficiency.
To date, many researchers have developed numerous methods to explore the airport delay propagation mechanism, including the Approximate Network Delay (AND) model, epidemic process-based model and graph-based model. For example, Malone proposed the classical Approximate Network Delay (AND) model to analyze the delay propagation between three typical airports [7]. Then, Pyrgiotis et al. refined the AND model to investigate the complex delay propagation patterns and mitigation strategies within an extensive airport network [8]. Baspinar and Koyunce attempted to develop a Susceptible–Infected–Recovered (SIR) model to simulate the delay propagation process of airport networks under the spread of infectious disease [9]. Li et al. proposed an integrated airport-based Susceptible–Infected–Recovered–Susceptible (ASIRS) epidemic model to simulate the delay propagation in airport networks from a network-level perspective [10]. Barrat et al. modeled the airport network as a graph, with an airport as the node and a flight as the link, then investigated the delay propagation mechanism from the topological analysis of graph characteristics [11]. Zeng et al. further applied the complex network theory to explore the delay characteristics and propagation strength in the study of airport networks [12].
More recently, to fully reveal the network-level delay propagation characteristics, some researchers have started to discover the hidden delay causality relationship between each airport pair and develop the delay causality network according to the identified causality links. The characteristic analysis of a delay causality network can reveal the potential delay propagation directions and infection paths, which could intuitively illustrate the delay correlations between two airports and provide suggestions for airport operators to reallocate the time slots and adjust the buffer time for delay mitigation. The critical component for developing a delay causality network is to determine the delay causality relationship between airports, which mainly fall under three types of approach: the Granger causality test, information entropy-based method and data-driven method. Runge et al. used the Granger causality test to explore the delay causality links between airports and examine the characteristics of a delay causality network [13]. Since the Granger causality test only determines the linear delay causality dependencies between two airports, Zhang et al. applied Transfer Entropy to identify the delay causal links between two airports and quantitatively measure the relevant causality probability [14]. To further capture the nonstationary time series feature in the delay sequential data of each airport in the network, Tan et al. developed an attention-based deep convolution neural network (CNN) for mining airport delay propagation causality [15]. The result indicates that each airport in China is affected by an average of six airports, and airports with small delays are more likely to be affected by other airports.
Although the data-driven method has been applied in dynamic and nonlinear delay causality link identification, the widely used deep learning framework mainly depends on a CNN-based approach, which is skilled at learning embedded patterns from Euclidean structured data, such as image, video and grip-based maps [16,17]. However, the delay time of airports in airport networks is time series sequential data distributed over the topology graph, which is essentially non-Euclidean structured data, making the performance of CNN-based models very poor [18]. Moreover, the temporal dependencies between delays in various time steps are also prominent and should be incorporated into the analysis model. In addition, different airport networks show different network topological characteristics and geographical economics, leading to great heterogeneities in delay propagation patterns and delay state transitions.
To fill the above research gaps, this study develops a novel attention-based recurrent graph convolutional neural network (ARGC-Net) for identifying the delay causality relationships and exploring the delay propagation mechanism in various airport networks. The developed ARGC model employs an end-to-end deep learning framework, which integrates a Spatial Block and a Temporal Block. The Spatial Block employs a graph convolution network (GCN) and attention mechanism to fully capture the spatial dependencies and causality linkage of each airport pair. Compared with a CNN, the GCN can generalize the convolution on the input of airport network delay time series, better characterize the delay state of the entire airport network and uncover the hidden heterogeneous pairwise correlations of flight delays between airports. The Temporal Block employs Long Short-Term Memory (LSTM) to capture the temporal dependencies among time steps. The primary contributions of this study can be summarized as follows:
  • The proposed ARGC-Net can uncover both the spatial and temporal dependencies in delay time across different airports simultaneously, and the embedded attention mechanism can indicate the delay causality links between any two airports.
  • The developed model shows great transferability when applied to different airport networks. Additionally, the delay propagation networks can be automatically built through testing from the identified attention scores.
  • The delay propagation mechanism of three airport networks with various topological characteristics are compared based on the complex network theory.
  • The airport delays are grouped into three states, and the delay state transition network is developed and compared in three different ATC areas.
The rest of the paper is organized as follows. Section 2 discusses the structure of the developed ARGC-Net; describes the methodology of the graph convolutional neural network, long short-term memory neural network, the attention mechanism and explains how to identify the causality relationships from the attention scores and t-test. Section 3 introduces the data source and data processing. Section 4 presents the characteristics of the airport network in each region, discusses the predictive performance of the proposed model, compares the topological characteristics in each delay causality network, and analyses the delay state transition in each network. Finally, conclusions are drawn in Section 5.

2. Methodology

2.1. Problem Formulation

The primary objective of the delay causality analysis is to identify the embedded delay influence relationship between airports and understand the impact of delay occurred in one airport that may cause delays in another airport. For example, the delay causality between two airports is established when the delay in the former airport leads to the delay in the latter airport, and accordingly the delay state of the latter airport will change with the change in delay state of the former airport. In this condition, the former airport is considered to have a causal effect on the latter airport. In some previous studies, delay causality between airports is built when the delay information of one specific airport contributes to the delay explanation of another airport after some predefined time steps [19,20,21].
Figure 1 illustrates four types of delay causality between airports: No Causation, Direct Causation, Indirect Causation, and Both Direct and Indirect Causation. No Causation means the delay at airport A will not affect airport B (See Figure 1a), while Direct Causation (See Figure 1b) means the delay at airport A directly propagates to airport B without intermediary airports. Figure 1c depicts Indirect Causation between airport A and airport B with an intermediate, airport C; note that there may be multiple indirect causal paths between the two airports. Moreover, both Direct Causation and Indirect Causation may simultaneously exist between airport A and airport B, as shown in Figure 1d. Thus, the Direct Causation involves only two airports, whereas the Indirect Causation may involve three or more airports. In this study, only Direct Causation is considered in the causality analysis mainly because the direct causality links between airports result in the ATC local authority better understanding the delay propagation process.
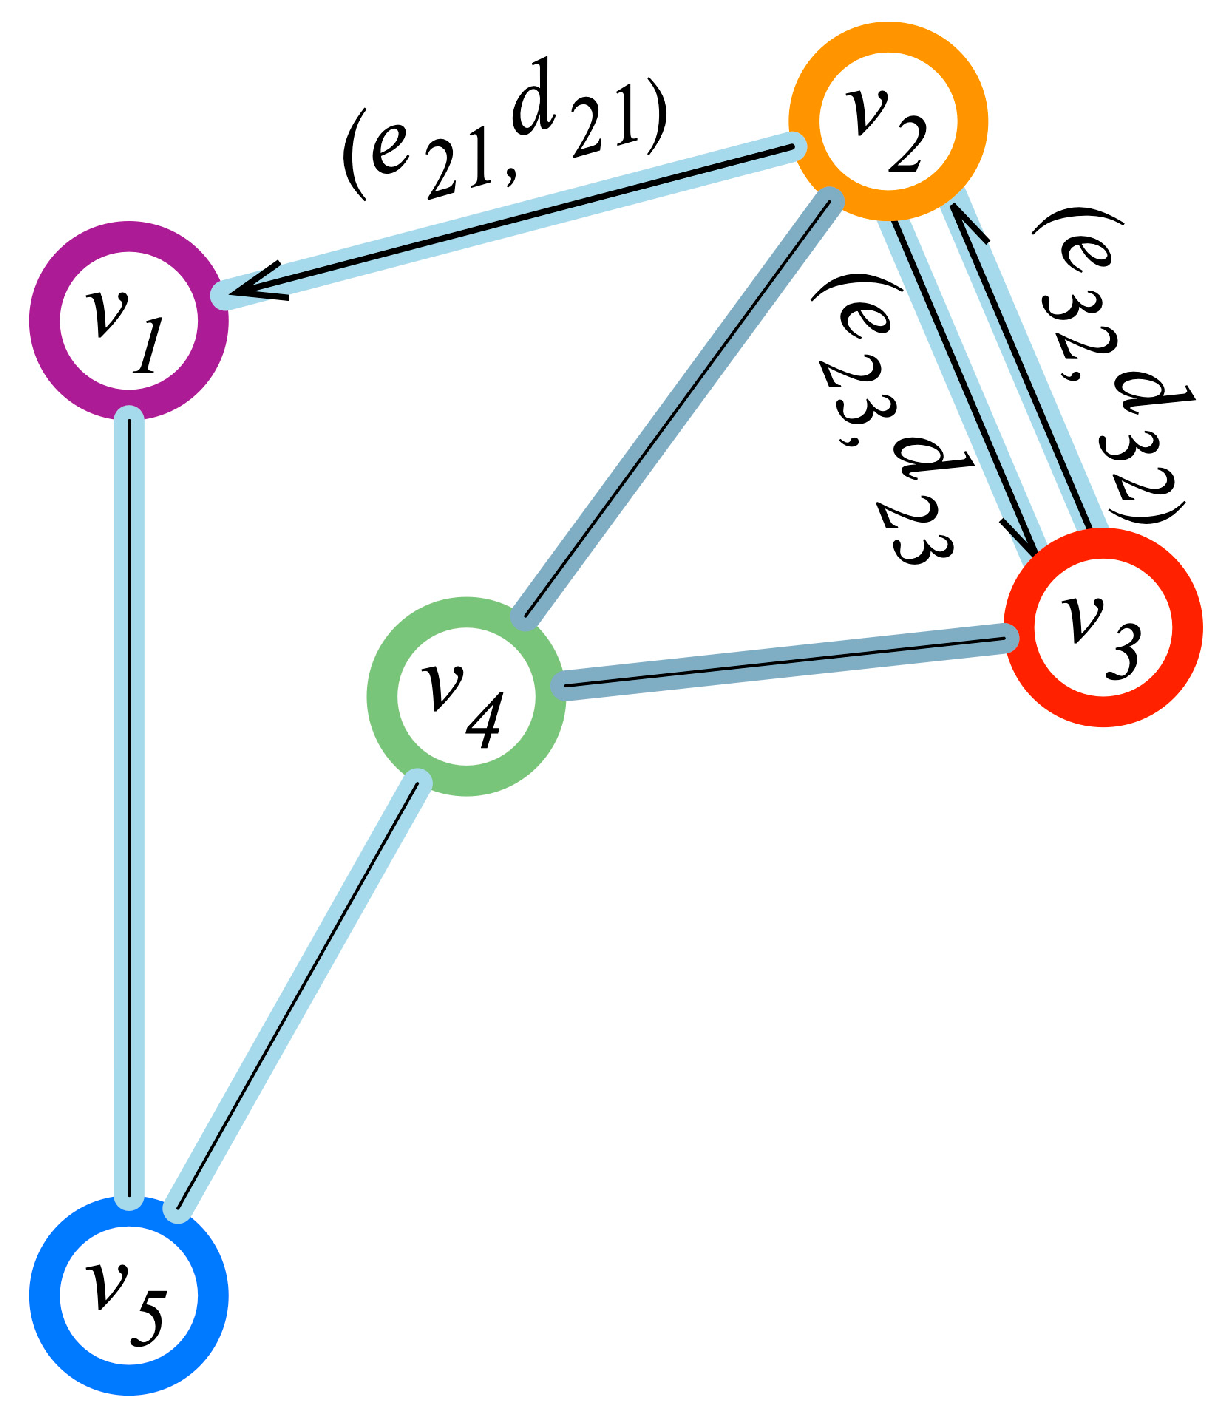
Furthermore, a weighted directed graph, also named as the Delay Causality Network (DCN), is utilized to represent the delay propagation process and is based on all the identified direct causality links within the entire airport network. For example, a delay network that consists of N airports is denoted as G = (V, E, D), where V = {vi}i = 1:N indicates the set of airports in the study network, and vi represents the feature vector of airport i; E = {eij}i,j = 1:N represents the edges set; if the delay in airport i directly causes the delay in airport j, the airport i has an edge pointing to j, and eij= 1; otherwise, eij = 0. D = {dij}i,j = 1:N represents the weight set of edges, where dij indicates the degree of delay in airport i that affects airport j. Figure 2 shows an example of the delay propagation network, where the arrows denote the direction of delay propagation.

2.2. The Framework of Proposed ARGC Model

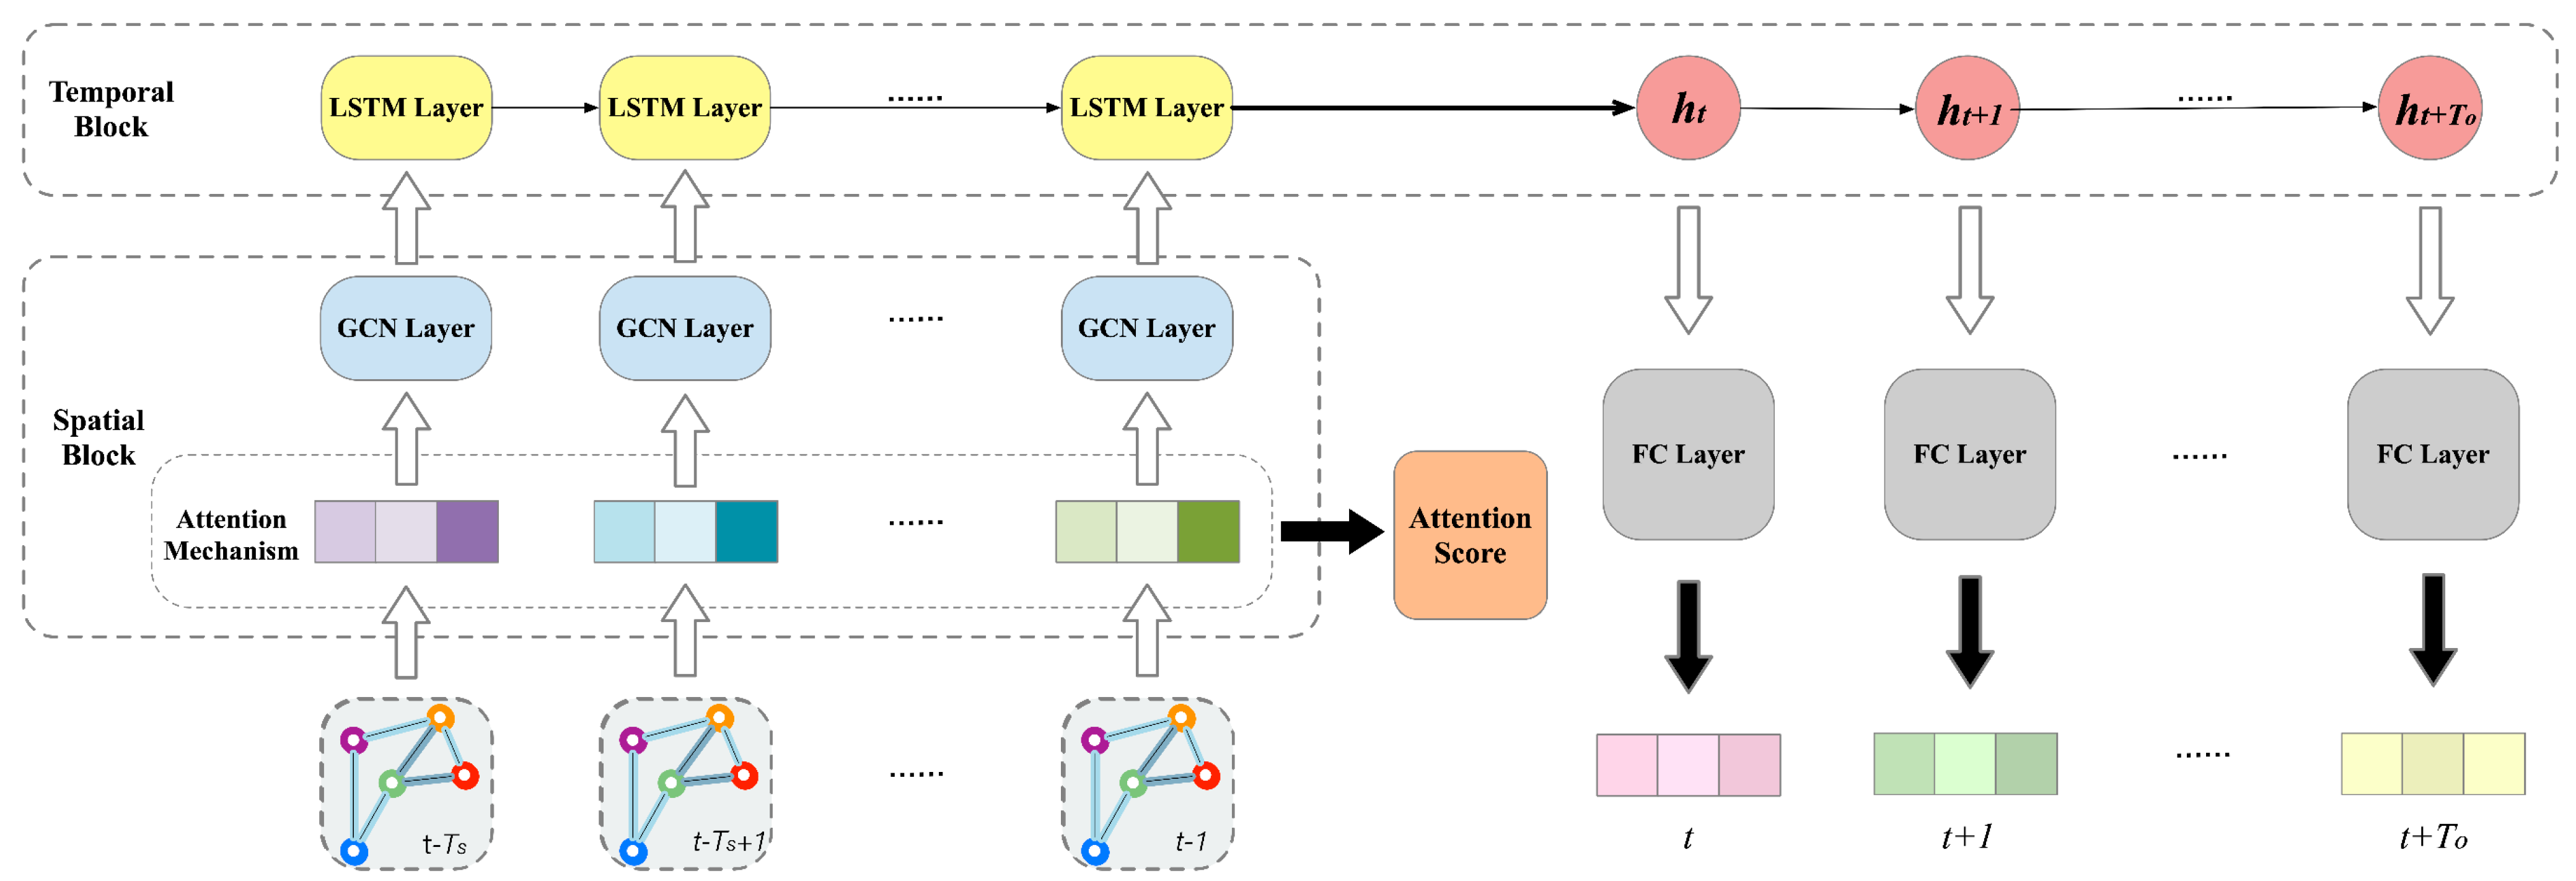
In this study, a novel attention-based recurrent graph convolutional neural network (ARGC-Net) is developed for delay causality relationship identification in the airport network. Figure 3 illustrates the structure of the developed model, which integrates a Spatial Block and a Temporal Block into an end-to-end deep learning architecture. More specifically, the input of the model is a series of network-shaped delay time data from airports. Then, the spatial block employs a graph convolution network (GCN) to fully capture the spatial dependencies among airports in the input network, and the attention mechanism is utilized to capture the causality linkage of each airport pair in the form of computed attention scores. In addition, a Temporal Block employs Long Short-Term Memory (LSTM) to capture the temporal dependencies among different time steps of the delay sequences. Finally, multiple fully connected (FC) layers are further utilized to generate the predicted delay output (See Figure 3). Each component of the developed model will be detailed and explained as follows.

2.3. Graph Convolutional Network

The graph convolutional network (GCN) is a deep learning framework for modeling data on irregular or non-Euclidean domains [21,22,23], and has achieved greater performance than traditional CNN architecture in the fields of citation network analysis [24], flight delay prediction [25] and metro ridership forecasting [18]. Previously, two types of GCNs have been widely explored, including spatial-based GCNs that utilize local graph convolutions to extract feature information from adjacent nodes [26], and spectral-based GCNs that transform an original graph signal into a parameterized Fourier domain [27]. A spectral-based GCN performs with high efficiency and with the input dataset having same size; thus, this study employs the spectral-based approach to develop a basic GCN to process regular delay time data [28].
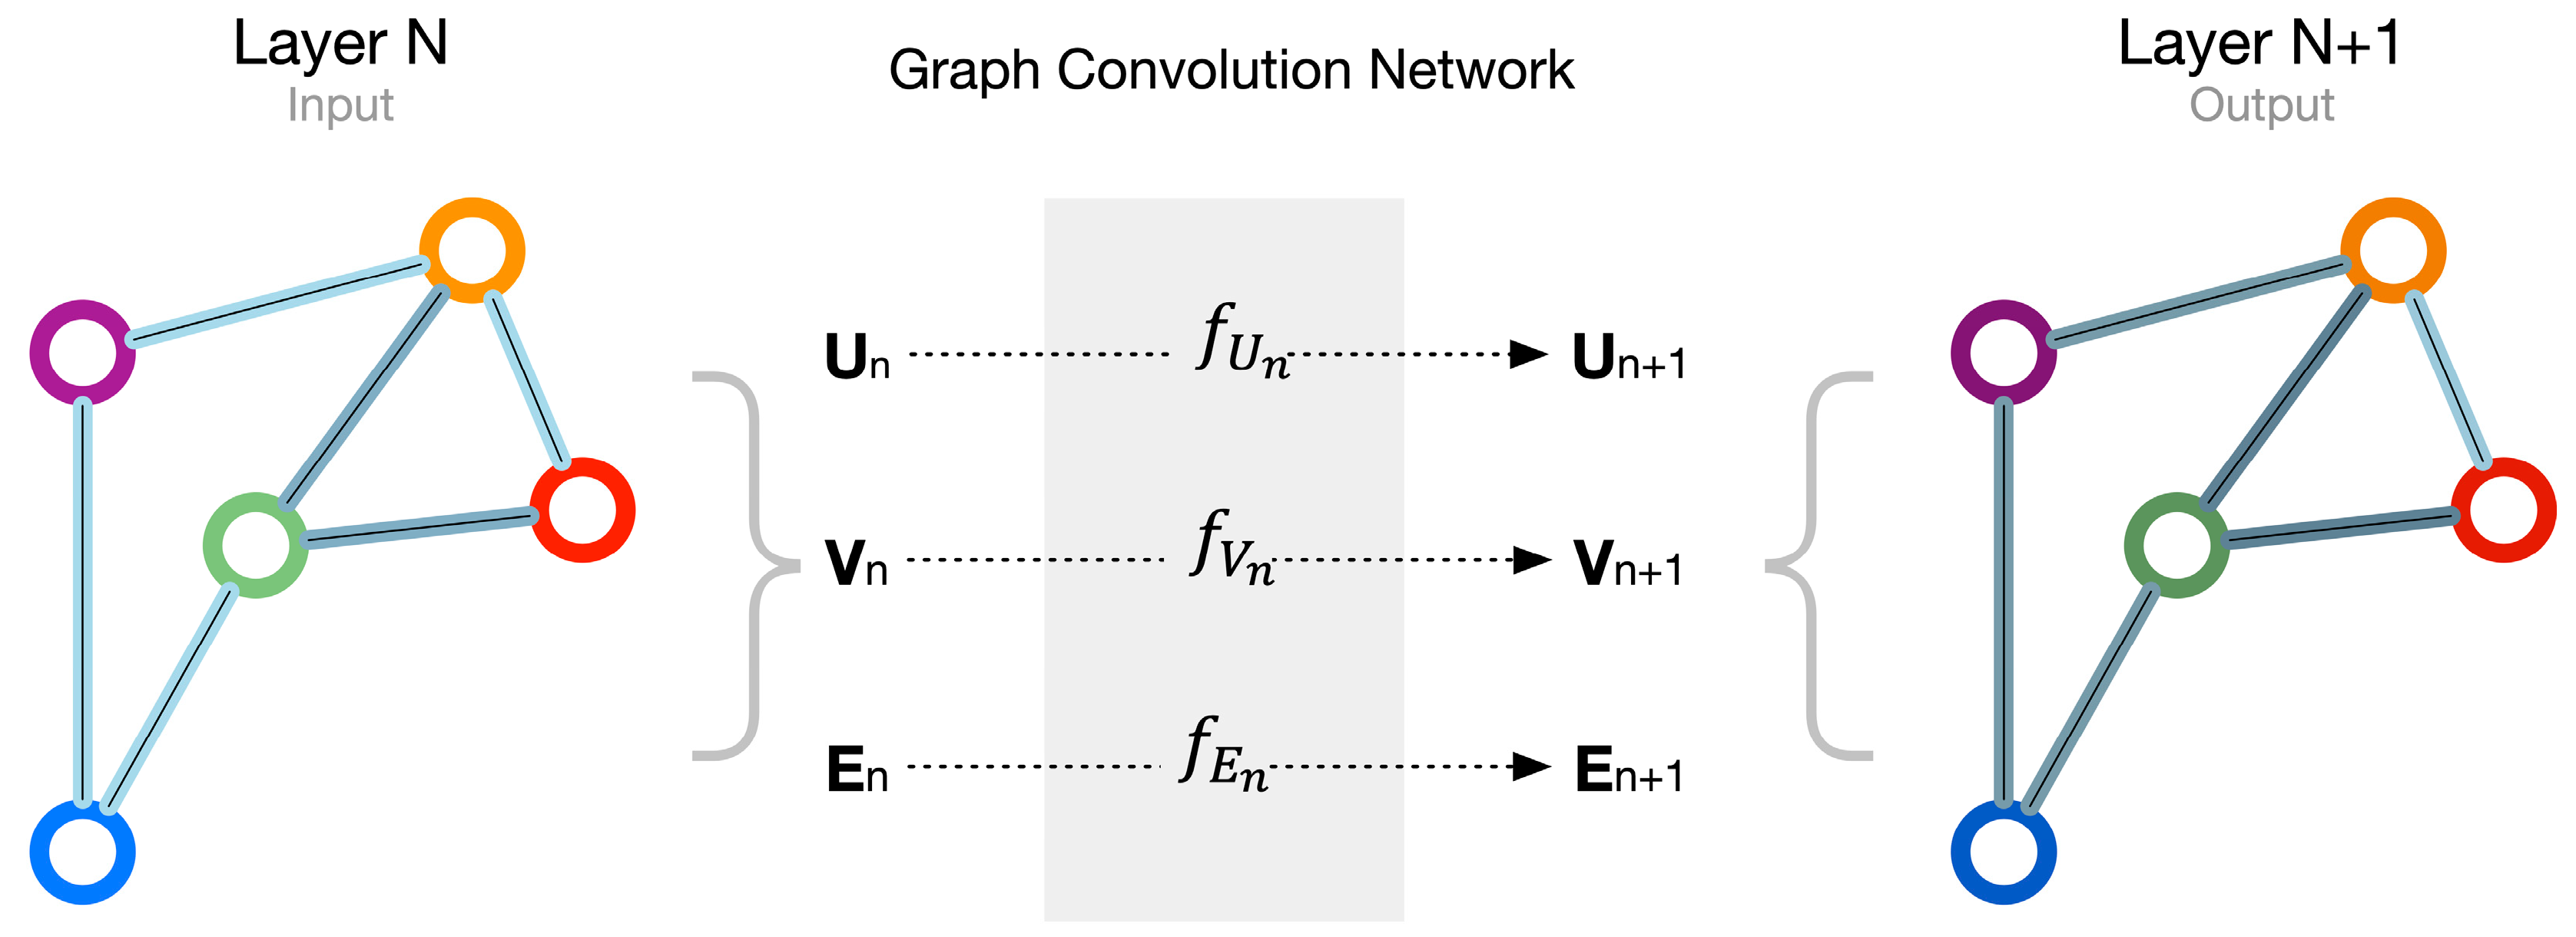
In this study, for each input time step, the delay time of airports can be viewed as a graph G = (V, E, A), where V is airports set; E represents the set of edges that connect each pair of airports and A N × N indicates the adjacency matrix (See Figure 4). Then, a normalized graph Laplacian matrix is defined as follows:
L = I N D 1 / 2 A D 1 / 2
where IN represents the identity matrix and D N × N indicates a diagonal degree matrix with D i i = j A i j .
L is a symmetric positive semidefinite matrix, which can be further broken down as:
L = U Λ U T
where U = [u0, u1, …, uN−1] and Λ = diag ([λ0, λ1, …, λN−1]]); λ0, λ1, …, λN−1 indicates the eigenvalues of L, and u0, u1, …, uN−1 indicates the relevant set of orthonormal eigenvectors.
Accordingly, a spectral convolution on the graph is defined as follows:
g θ x = U g θ U T x
where g θ indicates the function of the eigenvalues of L. To improve the computation efficiency of the eigen decomposition operation on largescale graphs, Defferrard et al. suggested a form of Chebyshev polynomial expansion (up to Kth order) to approximate the operation of g θ [21], such as:
g θ Λ k = 0 K θ k Λ T
Accordingly, the spectral convolutional of a signal × with filter g θ can be further written as:
g θ x k = 0 K θ k L T x
Furthermore, Kipf and Welling further simplified the spectral filter to a first-order Chebyshev polynomial to avoid the potential overfitting issue on graphs with wide node distribution and further improve the computation efficiency of the spectral convolution operation [24], which has the following form:
g θ x θ D 1 2 A D 1 2 x
Therefore, the GCN layers propagate from the input to the output in the following ways:
H l + 1 = σ D 1 2 A D 1 2 H l W l
where Hl+1 and Hl represent the outputs of the lth and l + 1st hidden layer; σ · represents the activation function. Wl represents the trainable weight matrix in the lth graph convolution hidden layer. Note that the dimensions of the tensors in Equation (7) are: A N × N , H l N × I , W l I × O and H l + 1 N × O ; where N, I, O indicate the number of nodes, input features and output features, respectively.

2.4. Attention Mechanism

The output of the basic GCN is usually encoded into a fixed-size context vector through allocating equal weights to all the airports in the network, which neglects the varied contributions of other airports for the predicted airport and may lead to a poor prediction performance and inaccurate causality relationship identification. Recently, Bahdanau et al. proposed the concept of the attention mechanism, which aims to allocate varying attention weights to each node in networks during the learning process [29]. In this study, the attention mechanism is embedded into the GCN layer to capture the influence of delay in connected source airports i on target airports j. For any target airport, the input vector is X = {xij}i = 1:N at time t, where xij = {xijT}T = t-timestep:t represents the delay time of airport i, which is connecting with airport j, in a time range of t-timestep to t. The metrics V are used to extract delay information in each airport, and the metrics Q and metrics K are used to exchange delay information between different airport [30]; these metrics are calculated based on Equation (8):
Q = X W Q K = X W K V = X W V
where WQ, WK and WV are the trainable weight metrics. Additionally, the attention score Z0 of each connected airport is obtained using Equation (9):
Z 0 = σ Q K T d k V
where σ · is the activation function and dk is the dimensions of metrics K, which ensure a steady gradient decent during training. The final outputs of the delay time in the target airport are computed as follows:
Z = Z 0 W 0
where W0 is the trainable weight metrics. The computation process of the attention mechanism is shown in Figure 5.

2.5. Long Short-Term Memory Neural Network

The Spatial Block fully captures the spatial dependencies of the delay times among various airports in the network. However, the delay times of airports also exhibit significant temporal correlations between historical and future time steps. To address this issue, a Recurrent Neural Network (RNN) has been employed in the deep learning architecture to capture the temporal dependencies in various fields of traffic flow prediction, crash risk prediction and traffic speed prediction [17,31]. However, the traditional RNN usually suffers from the problem of gradient vanishing or gradient exploding when the prediction time steps become larger, resulting in the occurrence of an enhanced RNN-based architecture, named the Long Short-Term Memory Neural Network (LSTM) [32].
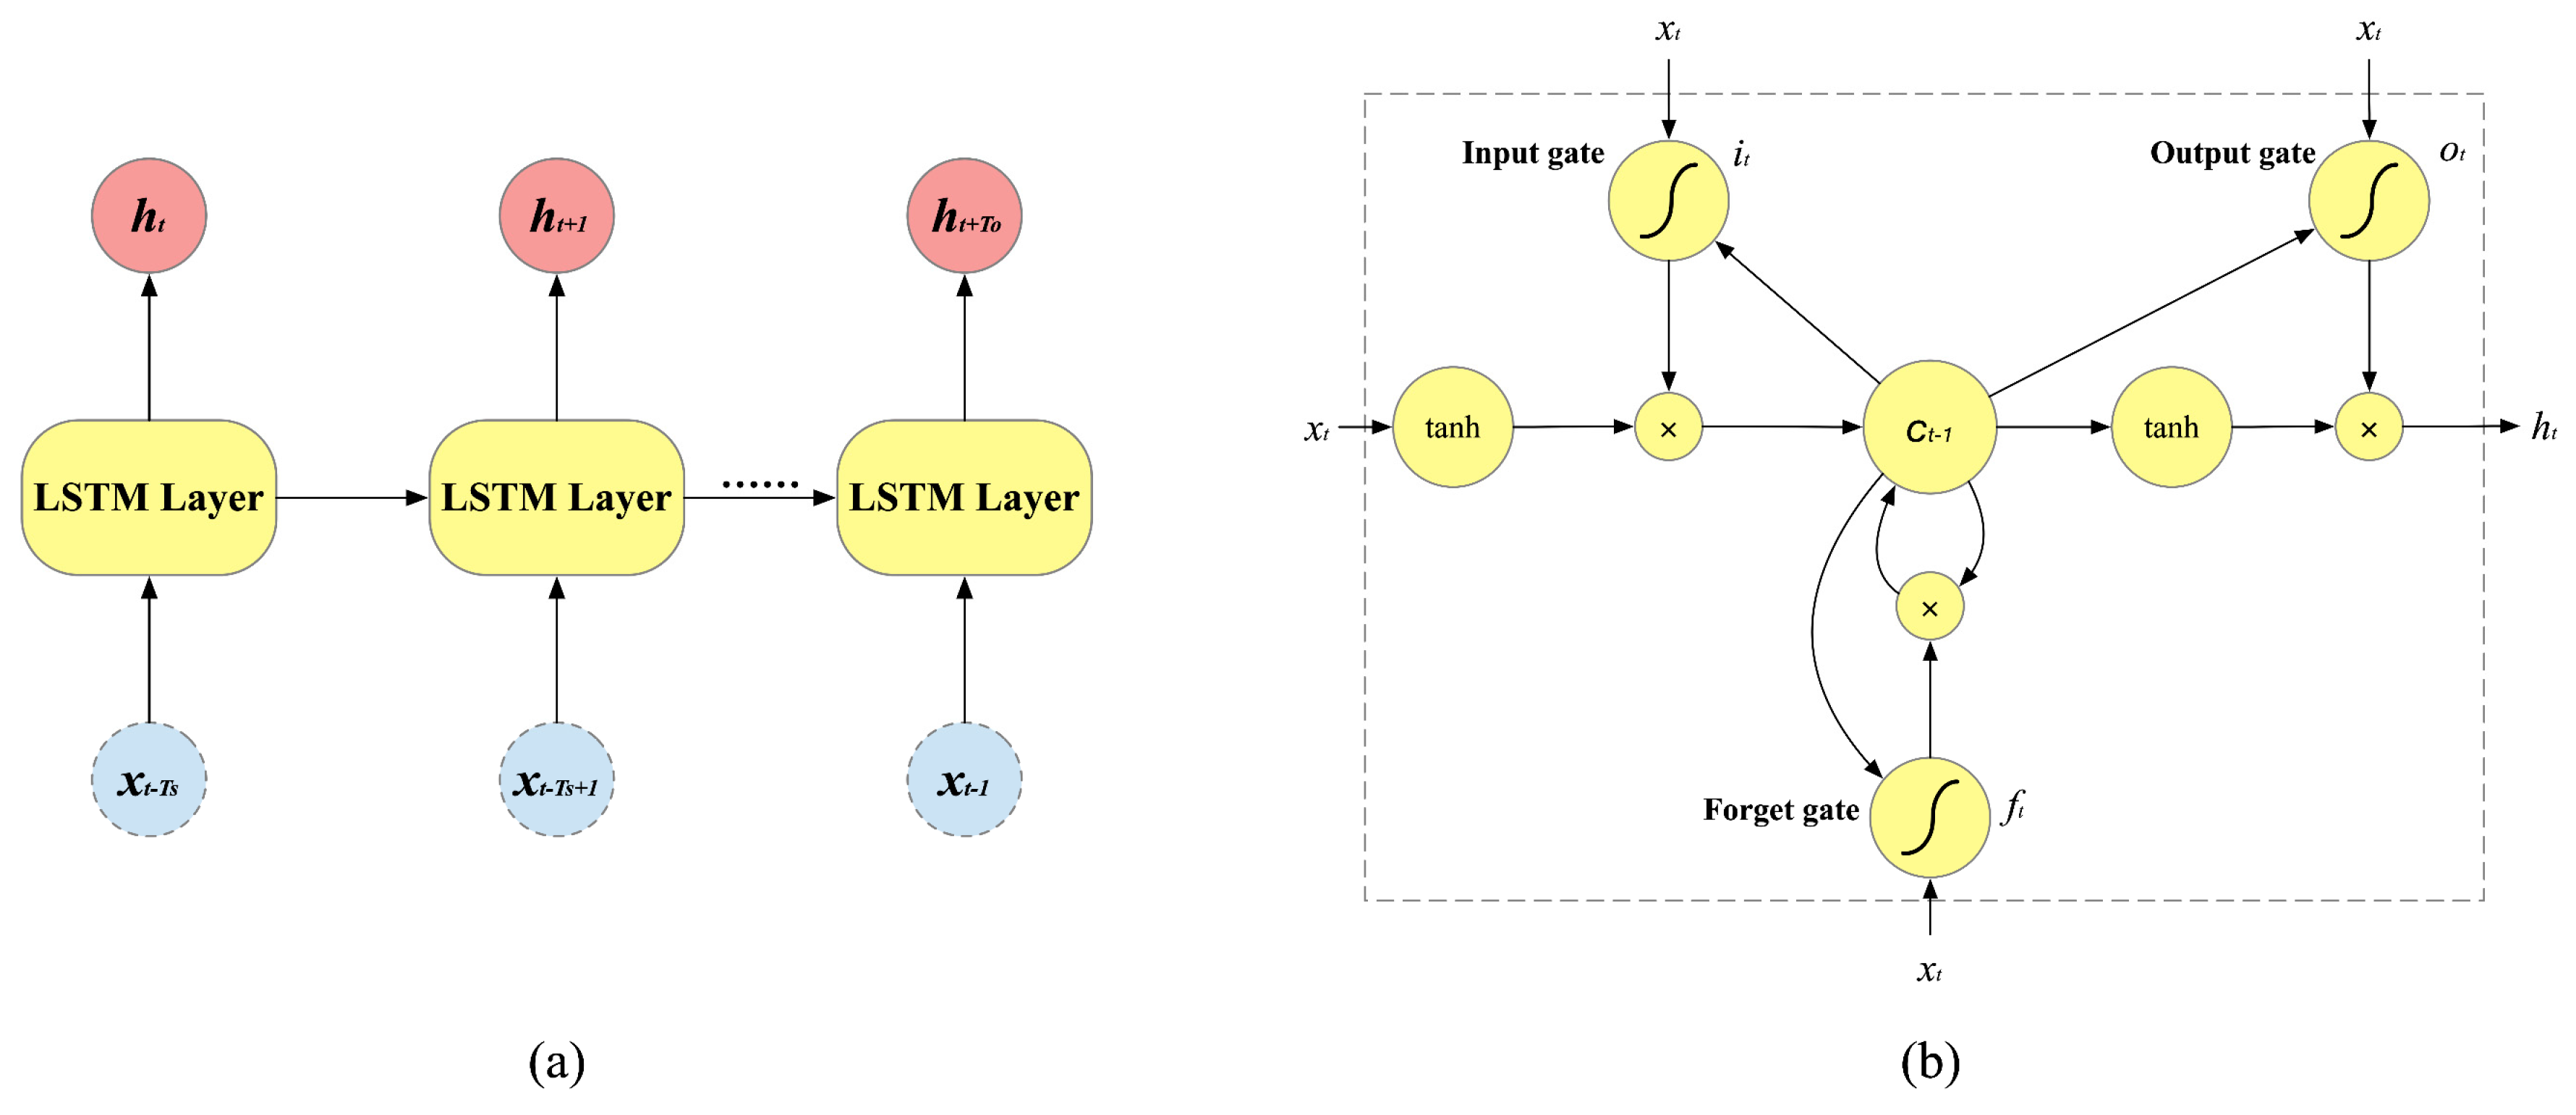
Figure 6a illustrates the structure of the LSTM neural network; the time steps of the input dataset and output dataset are Tstep and Toutput_step, respectively. In the LSTM neural network, the input vector X = {Xt-Tstep, Xt-Tstep+1, …, Xt−1} represents the preprocessing information of airports, where Xt−1 represents the preprocessing information at time t − 1. The LSTM contains three gates, the input gate, forget gate and output gate, which are used to decide whether to add or remove historical information to a cell state (See Figure 6b). For each time step, the three gates will be iteratively calculated using Equations (11)–(15):
i t = σ W x i x t + W h i h t 1 + W c i c t 1 + b i
f t = σ W x f x t + W h f h t 1 + W c f c t 1 + b f
c t = f t c t 1 + i t t a n h W x c x t + W h c h t 1 + b c
o t = σ W x o x t + W h o h t 1 + W c o c t + b o
h t = o t t a n h c t
where Wxi indicates the weight matrix between the input variables and the output of the input gate, and bi indicates the bias of input gate. Similarly, Whi, Wci, Wxf, Whf, Wcf, Wxc, Whc, Wxo, Who and Wco indicate the weights matrices which conduct a linear transformation from the vector of the first subscript to the second subscript, while bf, bc and bo indicate the associated biases. indicates the Hadamard product, which calculates the element-wise products of two vectors, matrices, or tensors with the same dimensions. σ (∙) and tanh (∙) are the two commonly used nonlinear active functions [33].

2.6. Objective Function

The objective of the developed ARGC model is to minimize the mean squared error between the predicted delay time and real delay time of the target airport. The objective function is given as follows:
m i n W , b i t Y t i X t i 2 2 + α Y t i 2 2
where Yjt and Xjt in the first term represent the estimated delay time of airport j at time step t and its ground truth, respectively. W, b indicates all the trainable weights and biases in the whole model architecture. The second term represents the L2-norm regularization term, which is utilized to avoid the potential overfitting problem during the training process. α indicates the regularization rate, which is greater than zero. The whole process of the training algorithm of the developed ARGC model is given as Algorithm 1:
Algorithm 1 ARGC training algorithm
Input: Airports number iV,
Historical delay time of all airports in the network {xi}, iV,
Time steps of input dataset Tstep,
Time steps of output dataset Toutput_step,
Delay time graph G = (V, E, A)
Output: Delay time of airports,
ARGC model with attention scores of the well-trained parameters
// Prepare the training dataset
  Initialize a null set: Ɗ = Ø;
  for time interval t (1 ≤ tT) do
    Obtain the historical delay time of all airports at each previous Tstep:
    Xinput = {xijt-Tstep, …, xijt−1, xijt}, iV
    Obtain the historical delay time of all airports at each predicted time step:
    Xoutput = {xijt+1, xijt+2, …, xijt+Toutput_step}, iV
    Put the training sample into the dataset: (Xinput, Xoutput) → Ɗ;
  end for
// Training ARGC model
  Initialize the hidden status, all weights and bias parameters;
  Concatenate the graphs at Tstep: [A1, A2, , ATstep] → A;
  for n = 0 → number of epochs do
    Randomly select a batch of sample Ɗb from Ɗ as input, where b = 1, 2, …, B;
    Obtain the output through hidden GCN layers, followed by Equations (1)–(7);
    Obtain the attention score through Spatial Block, followed by Equations (8)–(10);
    Flatten the output into a latent vector;
    Obtain the output of LSTM by passing the flattened vector through Temporal Block, followed by Equations (11)–(15);
    Estimate the predicted delay time for each output time step: Yjt= σ (WFC • LSTM +bFC);
    Optimize W, b by minimizing the loss function defined in Equation (16);
  end for

2.7. True Causality Relationship Test

From the developed ARGC model, the impact of the source-connected airports on the target airport can be evaluated using the attention score values in the final trained model. To further determine the true direct causal relationship from the output attention scores, this study proposes a two-step method. In the first step, a filter threshold of attention weights w0 should be defined. However, no specific rules are built for setting this threshold value. If the threshold value w0 is set too small, more invalid links will be selected as causal links, improving the complexity of the delay propagation network. If the threshold value w0 is set too large, some critical causal relationships will be missed in the delay propagation network. Previous studies usually subjectively determine the value of w0 when the number of identified causal links will not significantly change, and this study follows the same method [15].
In the second step, for any filtered candidate causality xi → xj, the order of the delay time series of airport i will be shuffled and then input into the trained model. If the delay time prediction error of airport j is significantly changed, the identified causal effect between airport i and j can be considered as a robust and true causality relationship. A t-test is accordingly used to evaluate the significance of difference between the original delay time series and shuffled delay time series [34], assuming the model output of the original delay time series is Do = {D1, D2, D3, …, DN}, and the model output of the shuffled delay time series is Ds = {D1, D2, D3, …, DN}. The t-value is calculated as follows:
t = X ¯ 1 X ¯ 2 ( n 1 1 ) S 1 2 + ( n 2 1 ) S 2 2 n 1 + n 2 2 1 n 1 + 1 n 2
where S12 and S22 are the variance of Do and Ds; X ¯ 1 and X ¯ 2 are the average value of Do and Ds; and n1 = n2 = n are the size of Do and Ds. Then, the critical value z is obtained based on the freedom degree n − 1 and the significance level σ . If t > z, the t-value falls in the rejection domain, meaning the difference between Do and Ds is significantly larger, and the connected airports have a true effect on the target airport.

3. Data Source

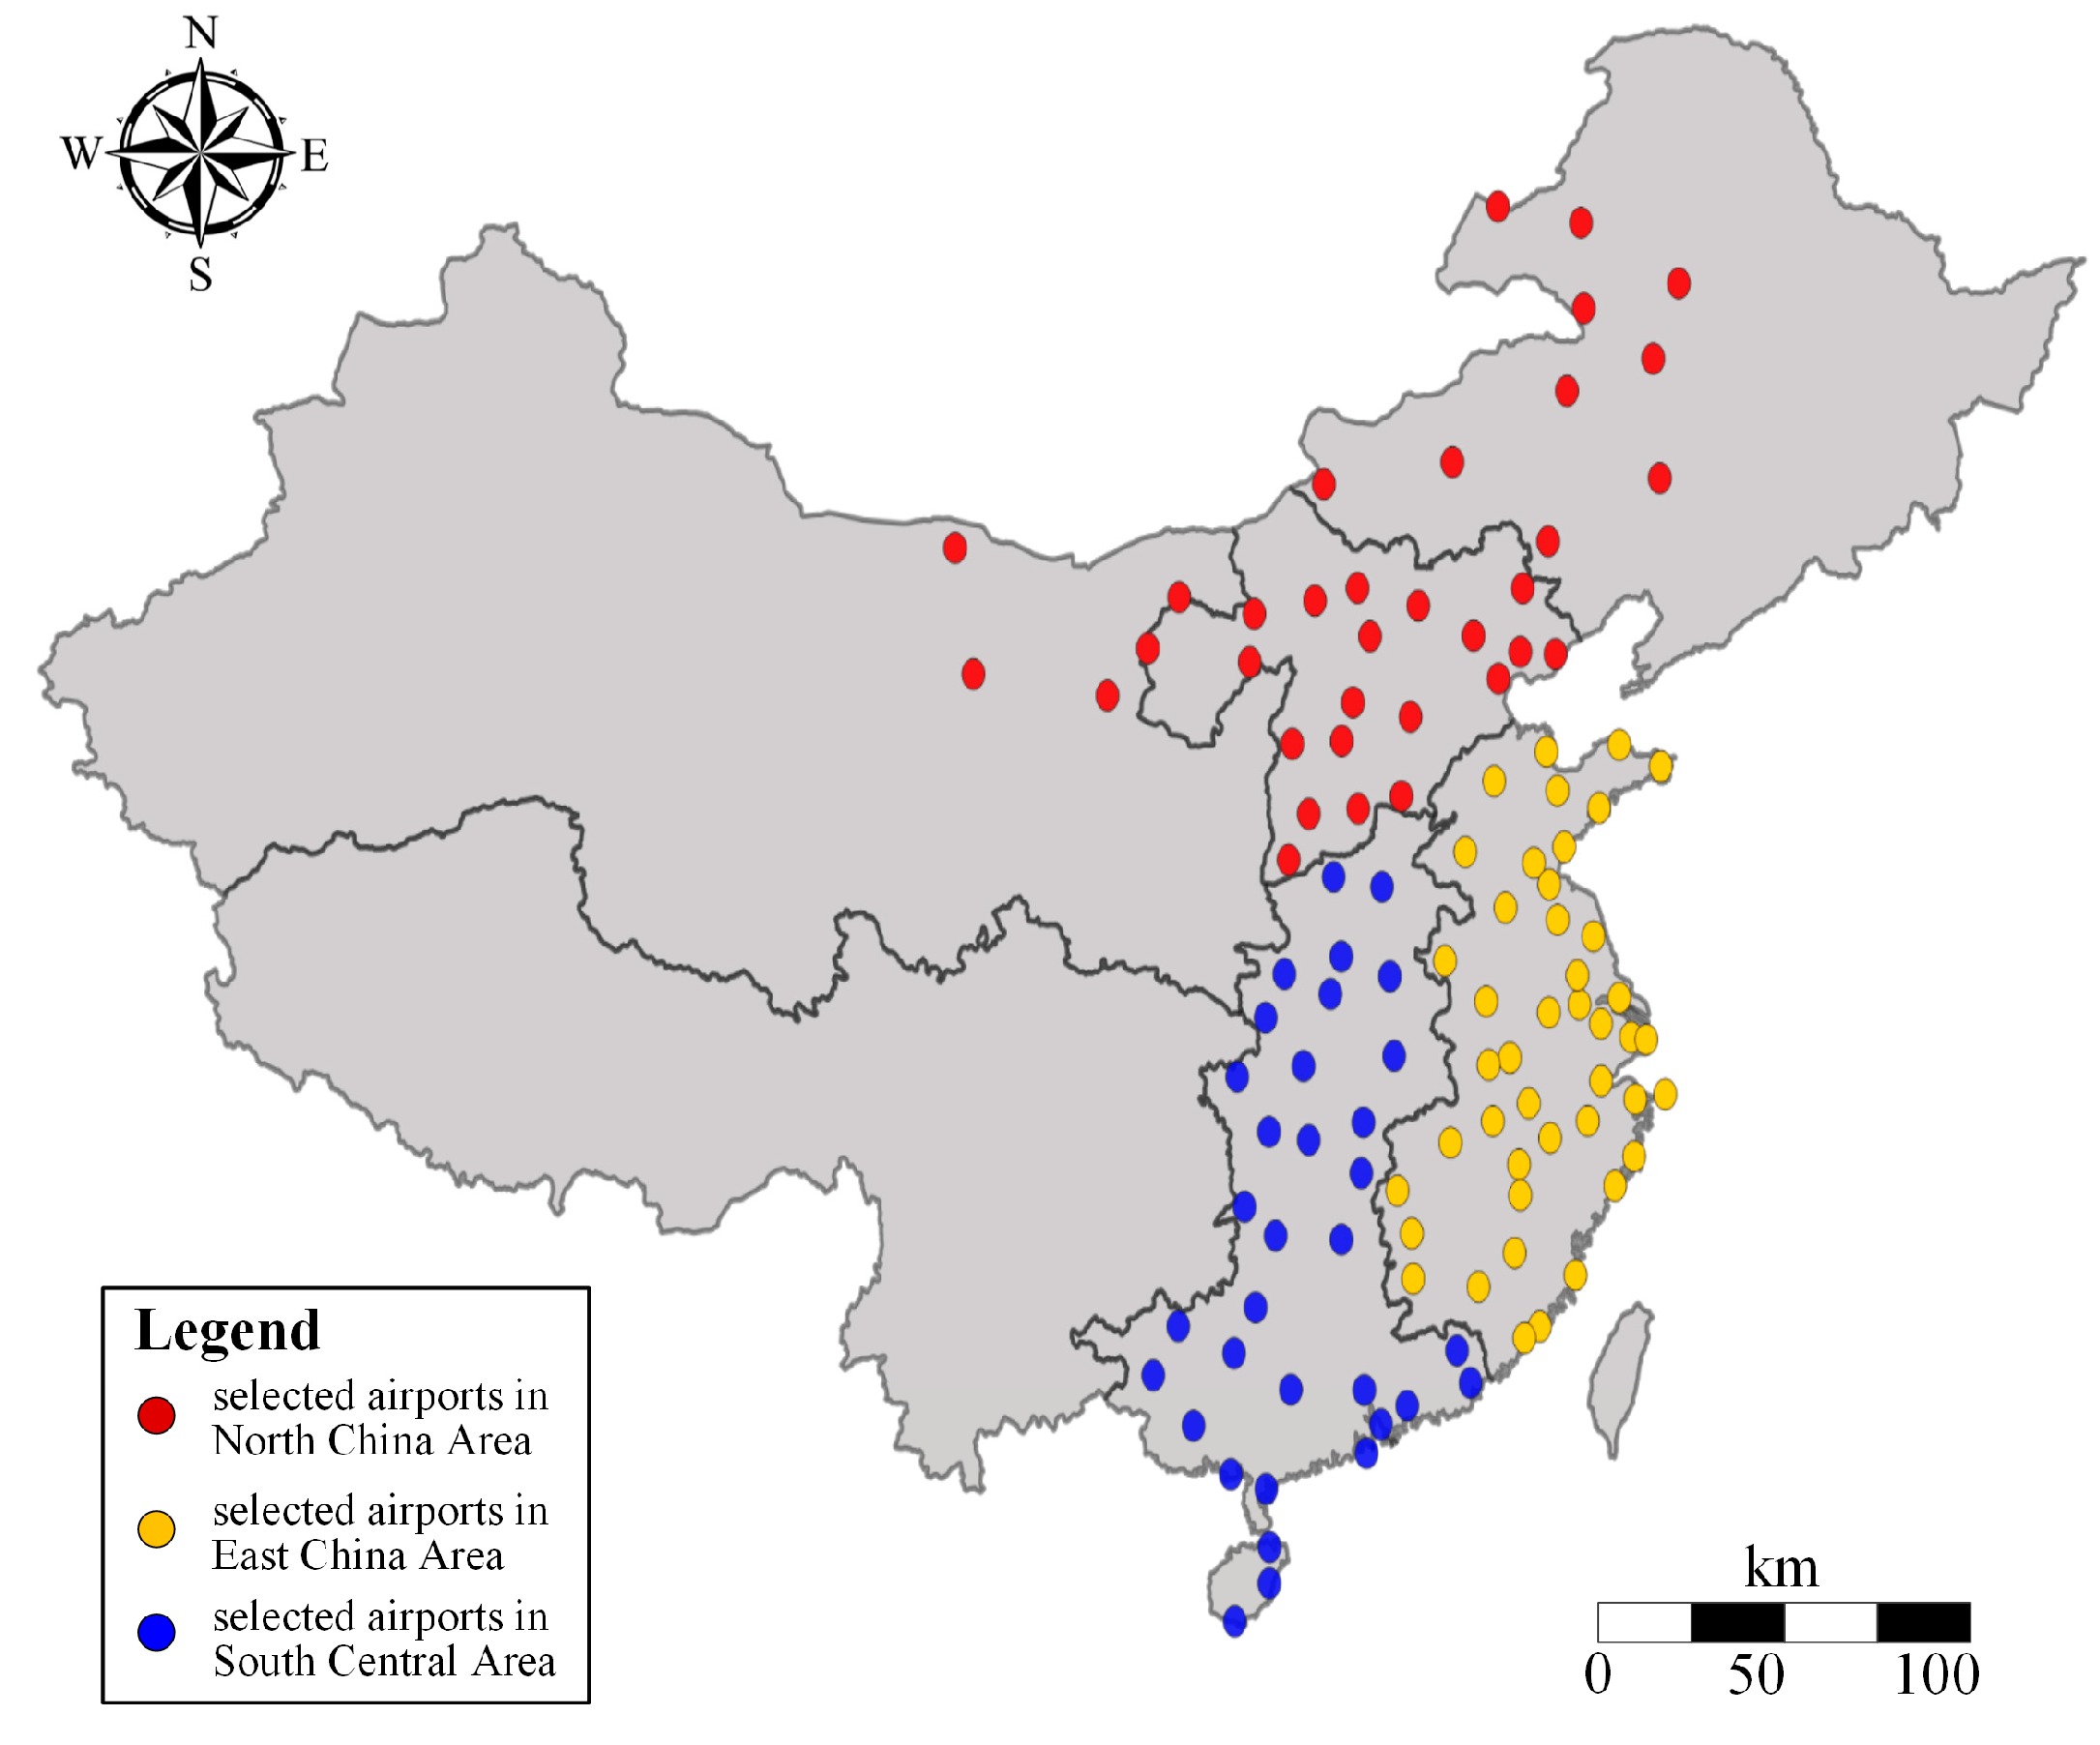
This study uses the data collected from Civil Aviation Administration of China (CAAC) to illustrate the procedure for delay propagation network analysis with the developed ARGC model. To explore the differences in the delay propagation mechanism across different airport networks, this study selects three typical airport networks in the North China Control Area, East China Control Area and Central and South Control Area, respectively. Figure 7 illustrates the spatial distribution of the three selected airport networks. The three selected airport networks show great diversities in their traffic flow patterns, regional economic levels and weather characteristics, which can better reveal the differences in the delay propagation mechanism among different ATC areas and validate the spatial transferability of our proposed ARGC model.
The selected flight operation data for model development cover three complete months from 1 July to 30 September 2019, which mainly covers the demand peak of air transportation in China. Each flight trip record contains the following information: Flight Callsign, Departure Airport, Arrival Airport, Estimate Departure Time, Actual Departure Time, etc. Then, the Flight Delay Time could be calculated based on the difference between the Estimate Departure Time and Actual Departure Time. Notably, in this study, the delay time is recorded as 0 min once the flight Actual Departure Time is earlier than the Estimate Departure Time, and cancelled flights are removed from the database since no delay propagation is caused by them. The delay duration is aggregated into one hour to calculate the Average Delay Time for each time step.
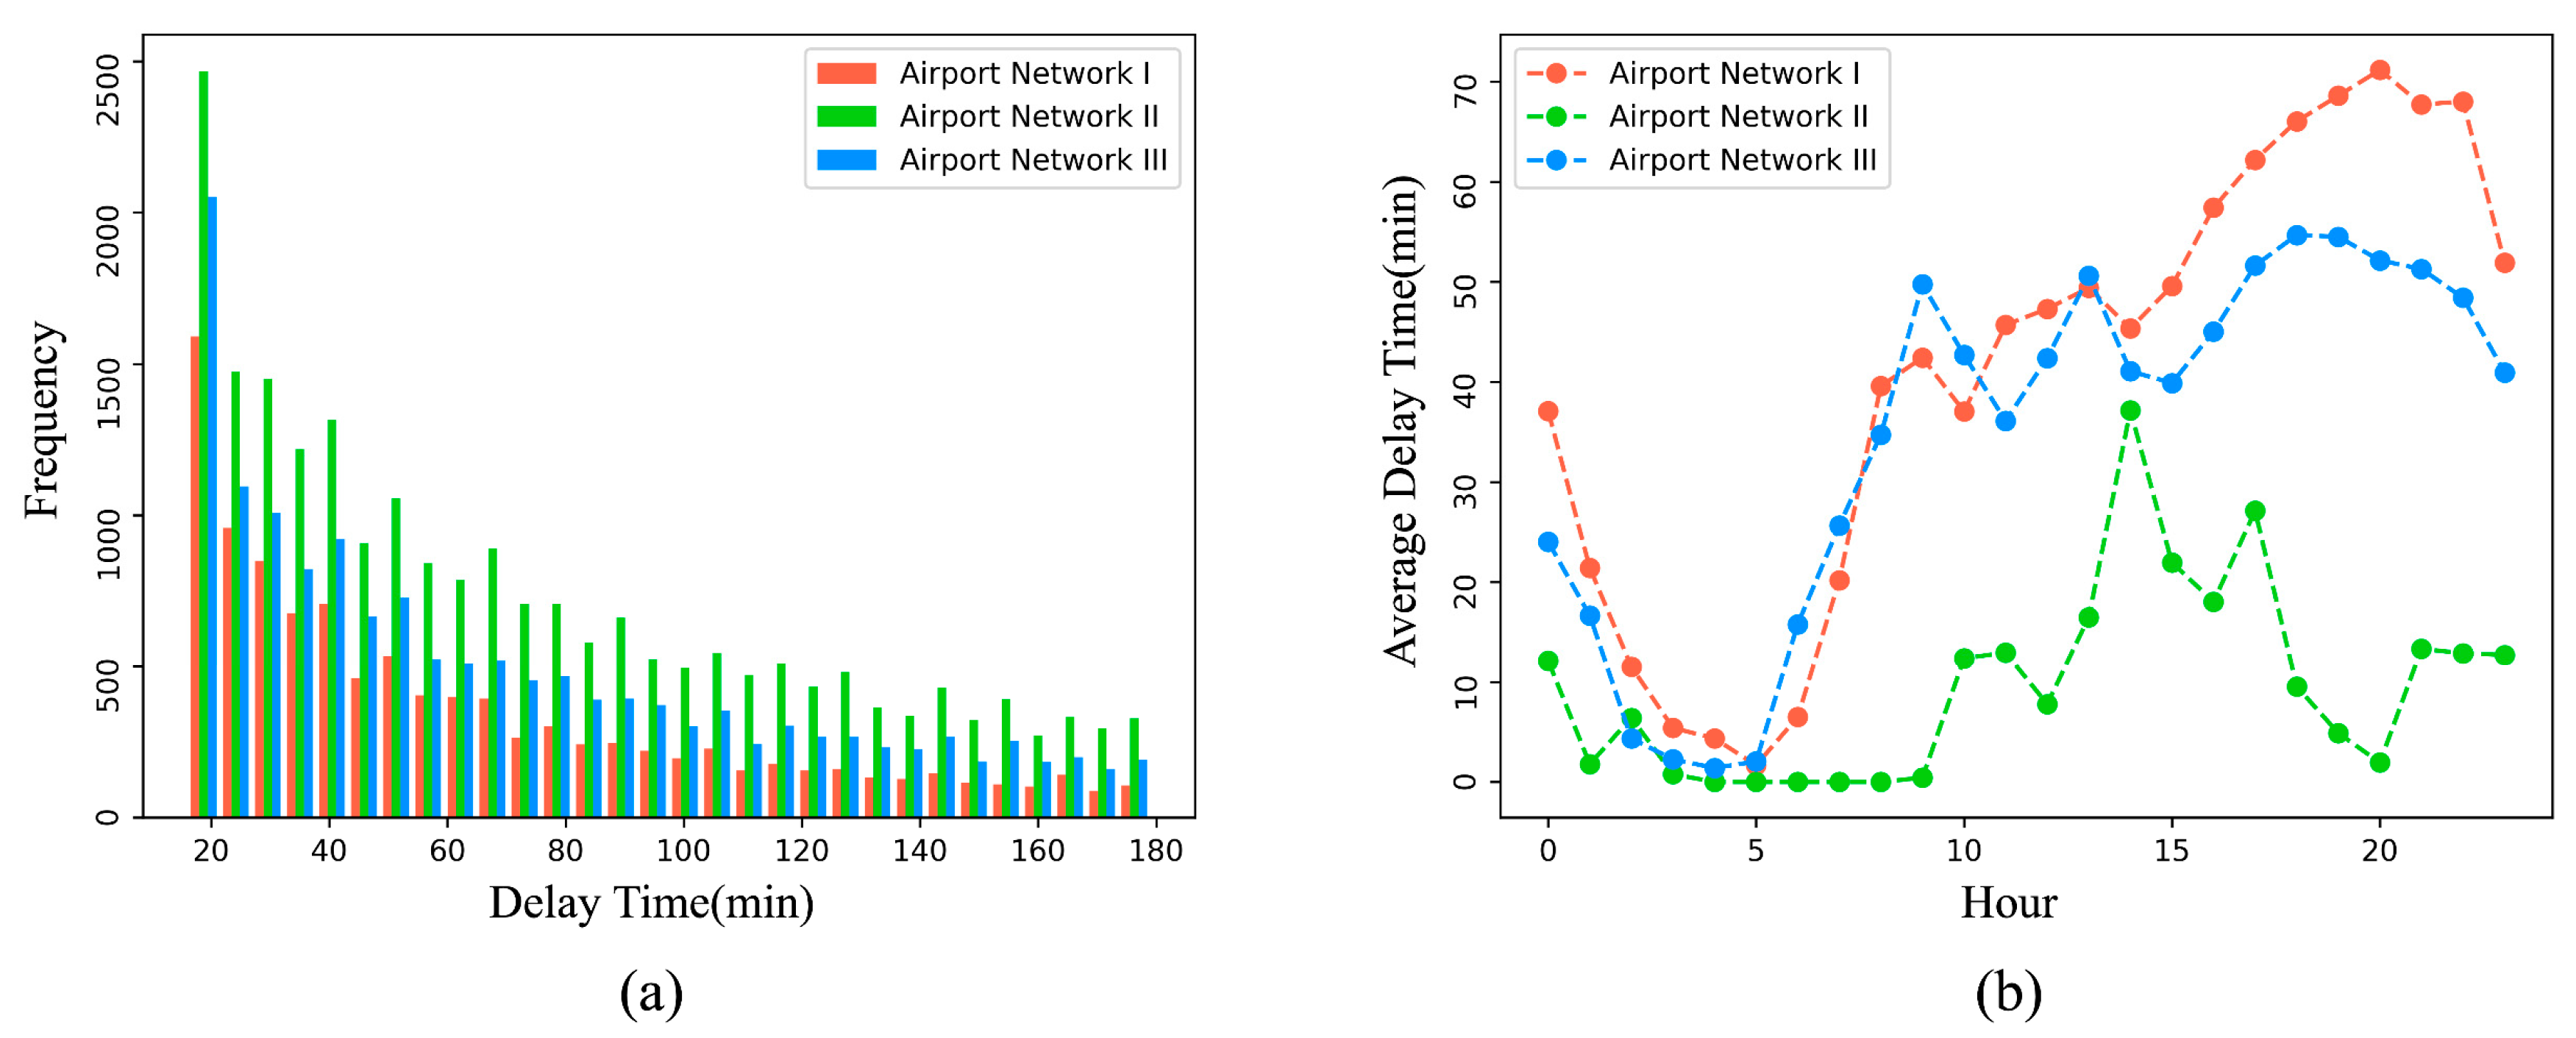
Figure 8a depicts the frequency distribution of the delay times in the three selected airport networks, where airport network I, airport network II and airport network III represent the airport networks in the North China Control Area, East China Control Area and Central and South Control Area, respectively. It can be found that airport network II shows a relatively larger frequency than the other two airport networks, and the delay times of most airports are less than 60 min. Figure 8b further illustrates the temporal distribution of the average daily delay time in the three networks. It indicates that different types of airport networks exhibit quite different delay patterns. Specifically, the delay pattern of the airport network in the North China Control Area is similar to that of the airport network in Central and South Control Area, which both exhibit a morning peak and an evening peak. The delay pattern of the airport network in the East China Control Area fluctuates more and shows an obvious peak around 2pm. Moreover, the late-night delay times are also very large in the airport networks in the North China Control Area and Central and South Control Area but drop significantly in the airport network in the East China Control Area. Furthermore, the airport network in the East China Control Area has a relatively larger number of flights but exhibits a lower average delay time, which indicates that the flights operate with higher efficiency in this network. The different patterns of delay times in the three airport networks created great challenges for the developed causality relationship identification model.

4. Results of Data Analysis

4.1. Characteristics of Airport Network in Each Region

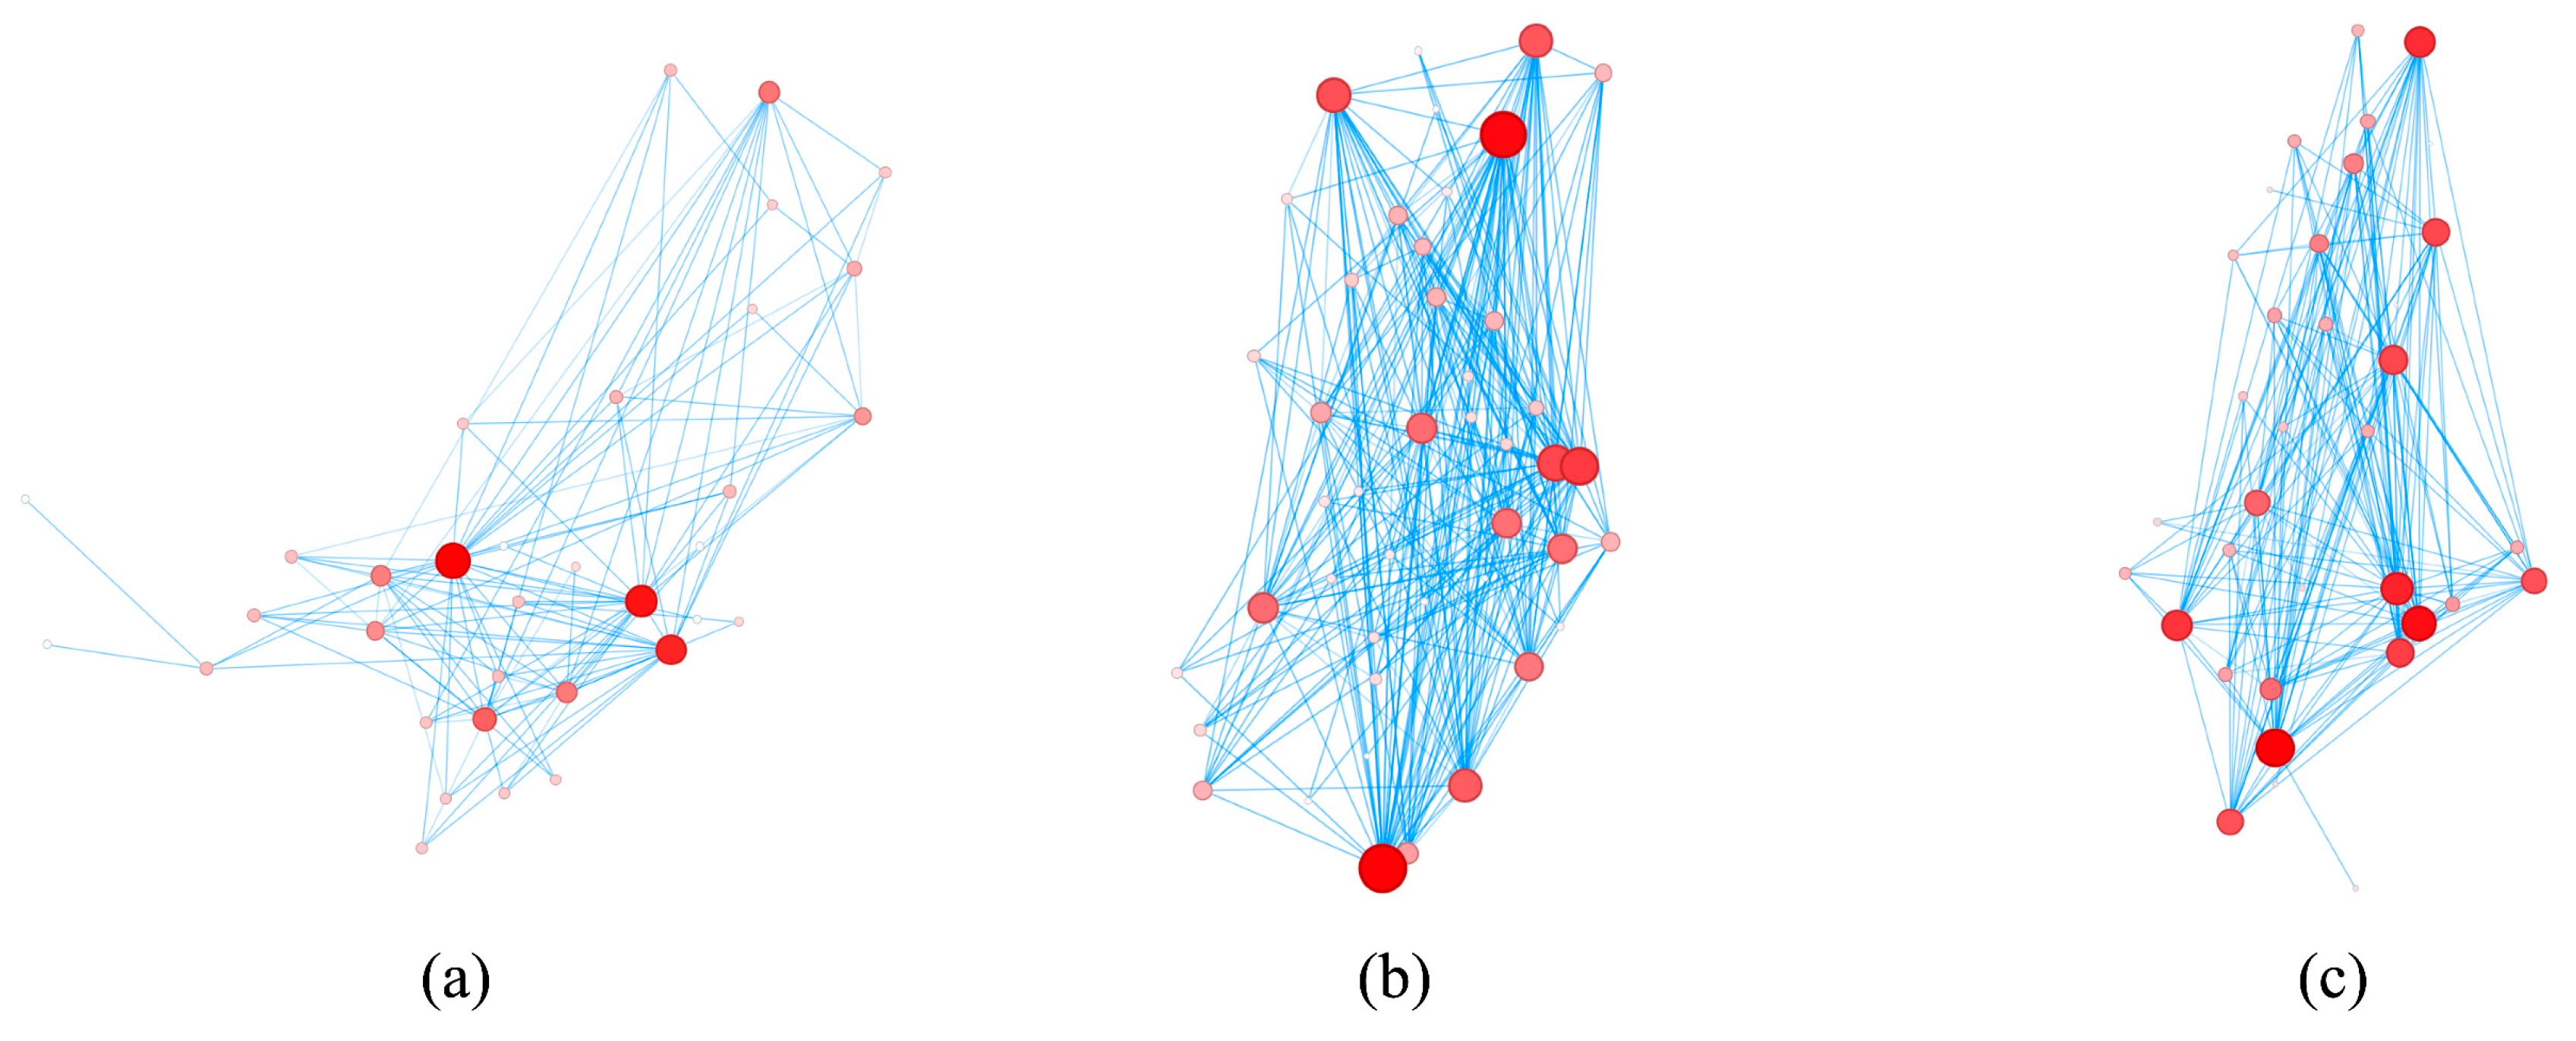
In this study, three airport networks located in different air traffic control areas of China are selected. Figure 9 depicts the airline connections in the local regions of three selected airport networks. A total of 34 airports are selected in the North China Control Area (see Figure 9a), while 44 airports and 35 airports are selected in the East China Control Area (see Figure 9b) and the Central and South Control Area (see Figure 9c), respectively. The size of each node is proportional to the degree of each airport, and the thickness of each edge is proportional to the air traffic flow between the two airports. Table 1 shows the results of some critical topological characteristics of the three selected airport networks.
From Table 1, it can be seen that airport network II exhibits the largest values for degree and edge due to the large traffic of the East China area. The Average Degree and Average Intensity indicators can partially reflect the complexity of the airport network. Compared with the other two airport networks, the traffic flows of the airport network in the North China Control Area mainly concentrate in several hub airports, such as ZBAA and ZBTJ. In addition, the Density and Modularity indicators are also selected to evaluate the connectivity of the airport network. The density of the three airport networks is generally similar. The Modularity indicator measures the degree to which the components of a large airport network may be separated and recombined. In general, airport networks with a high modularity value show dense connectivity between airports within the same community and sparse connectivity between airports within different communities. It can be observed that airport network I can be divided into three sub-communities with higher modularity values than the other two airport networks, which indicates that the delays are more likely to be dispersed among three sub-regions of this airport network.
The Average Clustering Coefficient indicator evaluates the local connection characteristics of the airport networks and is measured by the degree to which nodes in a graph tend to cluster together. More specifically, the local clustering coefficient for an airport is given by a proportion of the number of links between the airport within its neighborhoods divided by the number of links that could possibly exist between them. For example, the local coefficients of airport A in the network of Figure 10a–c are 1, 2/3 and 1/3, respectively. Then, the Average Clustering Coefficient of a specific airport network is defined by the average of the local clustering coefficients for all airports in the network. The Average Clustering Coefficient indicator quantifies how close the airport and its neighbor airports are with a complete graph, and is commonly employed in previous studies to determine whether a graph is a small-world network [35]. Accordingly, if the delays are generated in hub airports that are usually involved with a high local clustering coefficient value, then a high probability of a cascading effect of delay propagation across the whole airport network may exist. From Table 1, the delays generated by the hub airports in airport network II are more likely to cause severe effects on the whole network, rather than just other networks.
Moreover, the Average Path Length indicator is selected to represent the average distance between any pair of airports in the selected network. To normalize the distance metrics in different airport networks, the Path Length of the closest node is set to 1. As is shown in Table 1, airport network I exhibits a larger value for average path length than the other two airport networks, which indicates that air traffic delays will take more time to propagate across the entire network. In addition, the Eigenvector Centrality indicator is further employed to evaluate the diversity of airport importance in the network. The airport’s importance mainly depends on its node degree value. The higher the Eigenvector Centrality is, the higher the variance of airport importance in the network will be. Since airports with higher importance are more likely to propagate the delay to the airports with lower importance, airport networks I and II with higher values of Eigenvector Centrality may generate more delay propagation.
Figure 11 overviews the characteristics of the airport networks with the proposed eight indicators in the form of a radar chart. In general, the comparative analysis results of the selected airport characteristic indicators reveal that different airport networks show great diversities in their topological patterns, which will greatly affect how delay generation and propagation arises. For example, the airport network in the North China Control Area may have more delay propagation duration and localization. The airport network in the East China Control Area is involved with more complex network structures and more serious delay cascading effects. Thus, constructing a delay prorogation network for each airport network could provide insightful suggestions to each ATC local administration for understanding the delay causes and developing more targeted countermeasures to reduce air traffic delays.

4.2. Causality Analysis Using the Proposed ARGC Model

In this study, the ARGC model is developed for exploring the causality relationship between the delays of airports in the study network. The model consists of one GCN layer for spatial feature extraction, one LSTM layer for temporal feature extraction and one FC layer for model output. Prior to training, a series of hyper-parameters needs to be set. Note that the developed ARGC model is conducted on each airport in the network successively to fully explore the causal relationships between any airport pair. Thus, to reduce the computational burden, the models of the same airport network are designed to share the same hyper-parameters. A grid search method is employed to determine the optimal value of each hyper-parameter, and the results of optimal hyper-parameters for each airport network are shown in Table 2.
During the training process, the mean squared error (MSE) is used as the loss metric for optimization. All of the input dataset is processed through Z-score normalization before model training. A Dropout Layer and Early Stopping Mechanism are also employed to avoid the issue of model overfitting [36]. The proposed model is implemented with the deep learning libraries of TensorFlow, Keras and TF_geometric [37]. All the experiments are conducted using Python 3.8.13 on a computing environment consisting of the MacOS Ventura 13.1 system, 16 GB RAM and Apple M1 Pro Silicon.
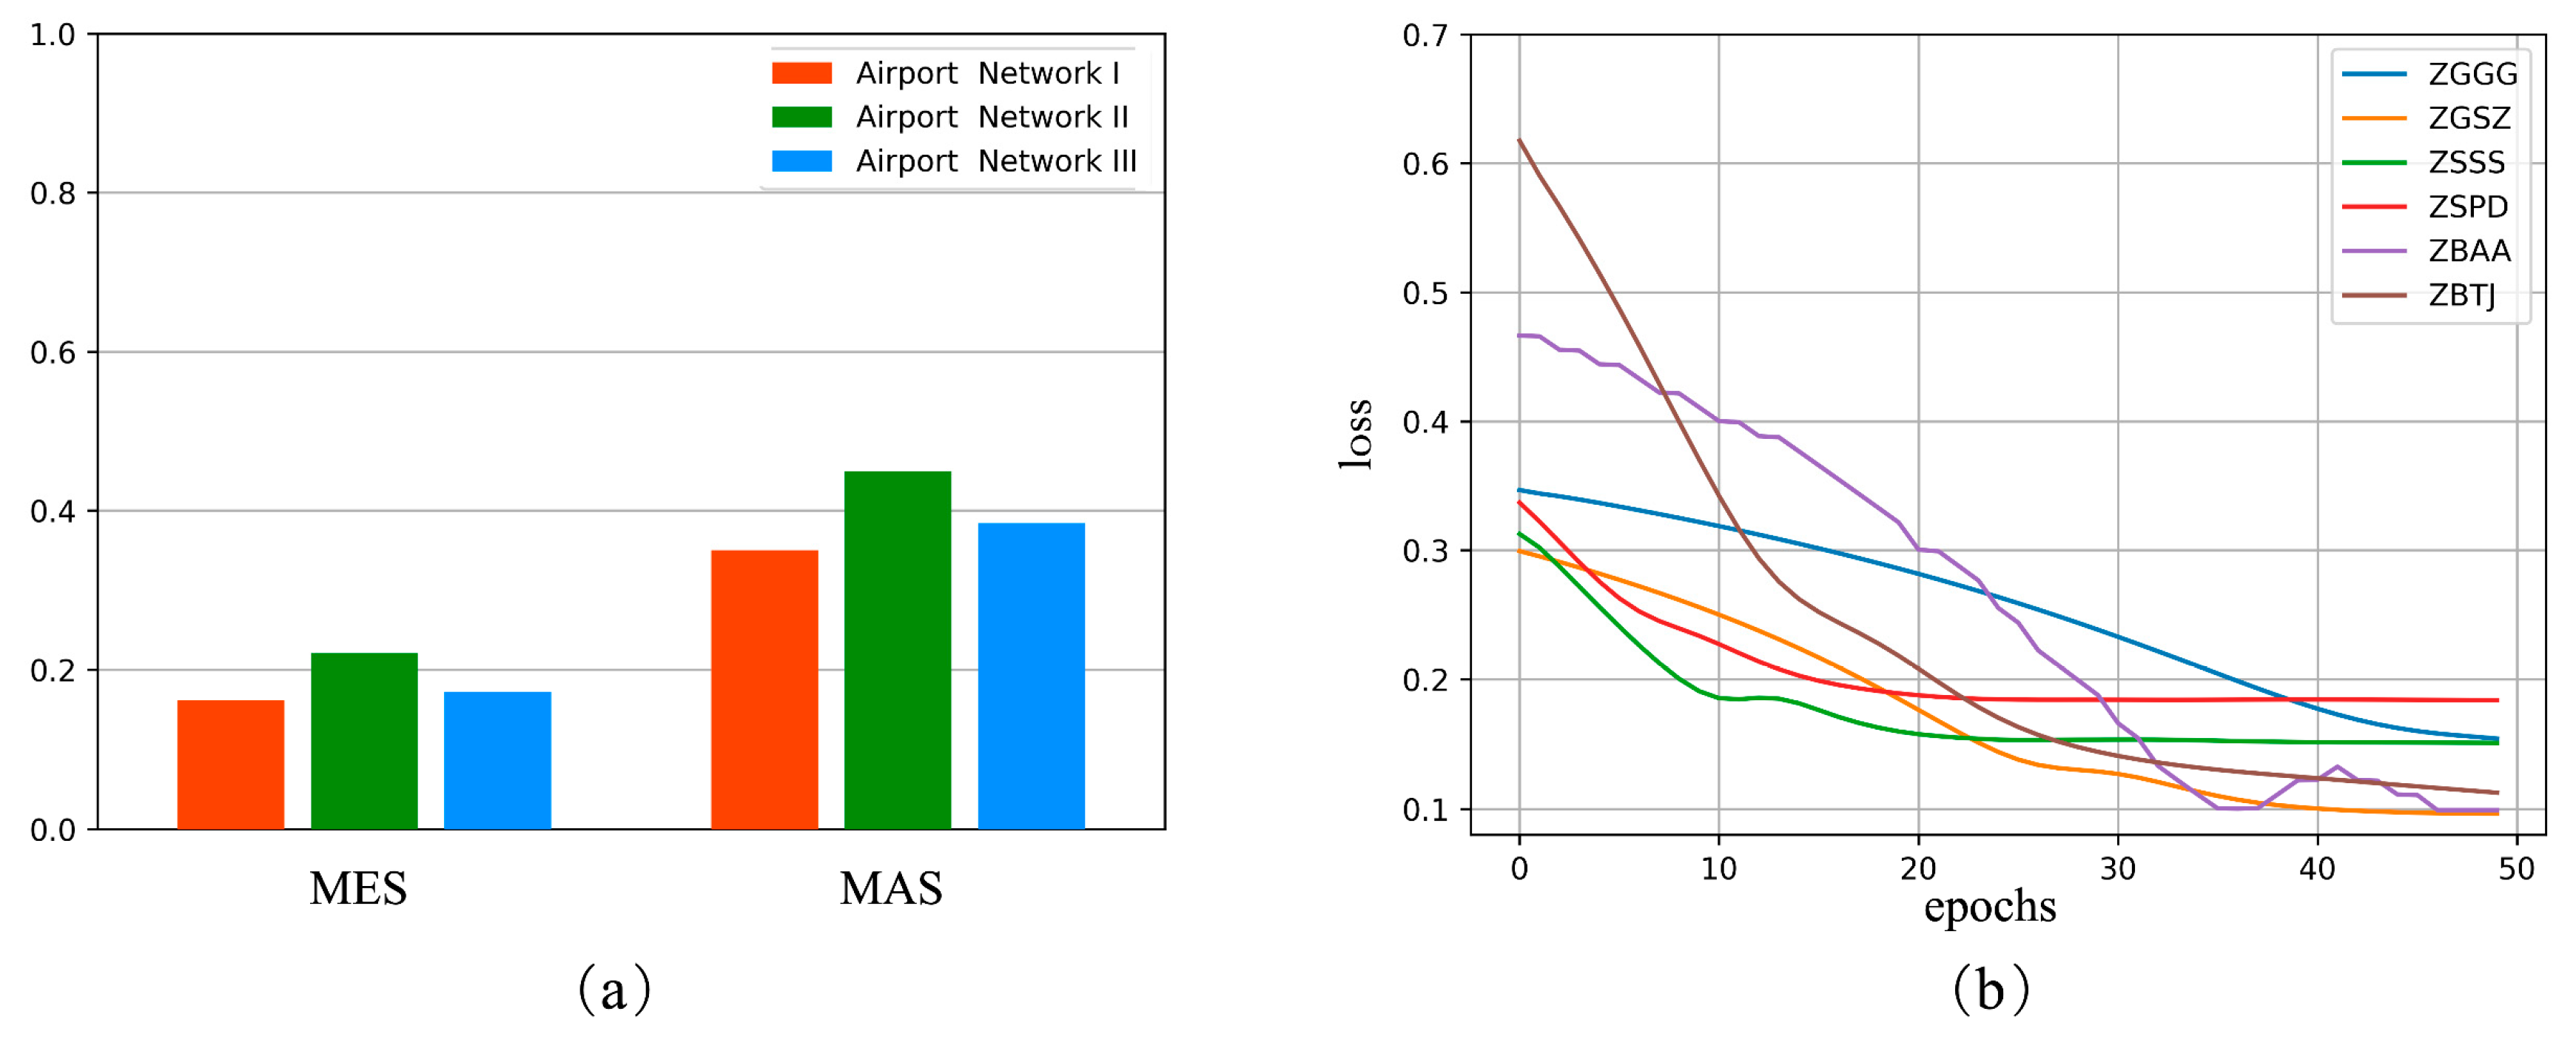
The average prediction performance of the proposed ARGC models for each airport network is shown in Figure 12a. It can be observed that the developed model exhibits the lowest performance on airport network II in terms of highest RMSE and MAE values, which is potentially due to the relatively large throughput of the airports in this network. Moreover, Figure 12b further depicts the loss functions during the training process for some typical airports in the three selected networks. The developed model achieves decent prediction performance for each of the six typical airports after nearly 50 training epochs, and the ZGSZ, ZBTJ and ZBAA airports show a relatively high prediction accuracy.
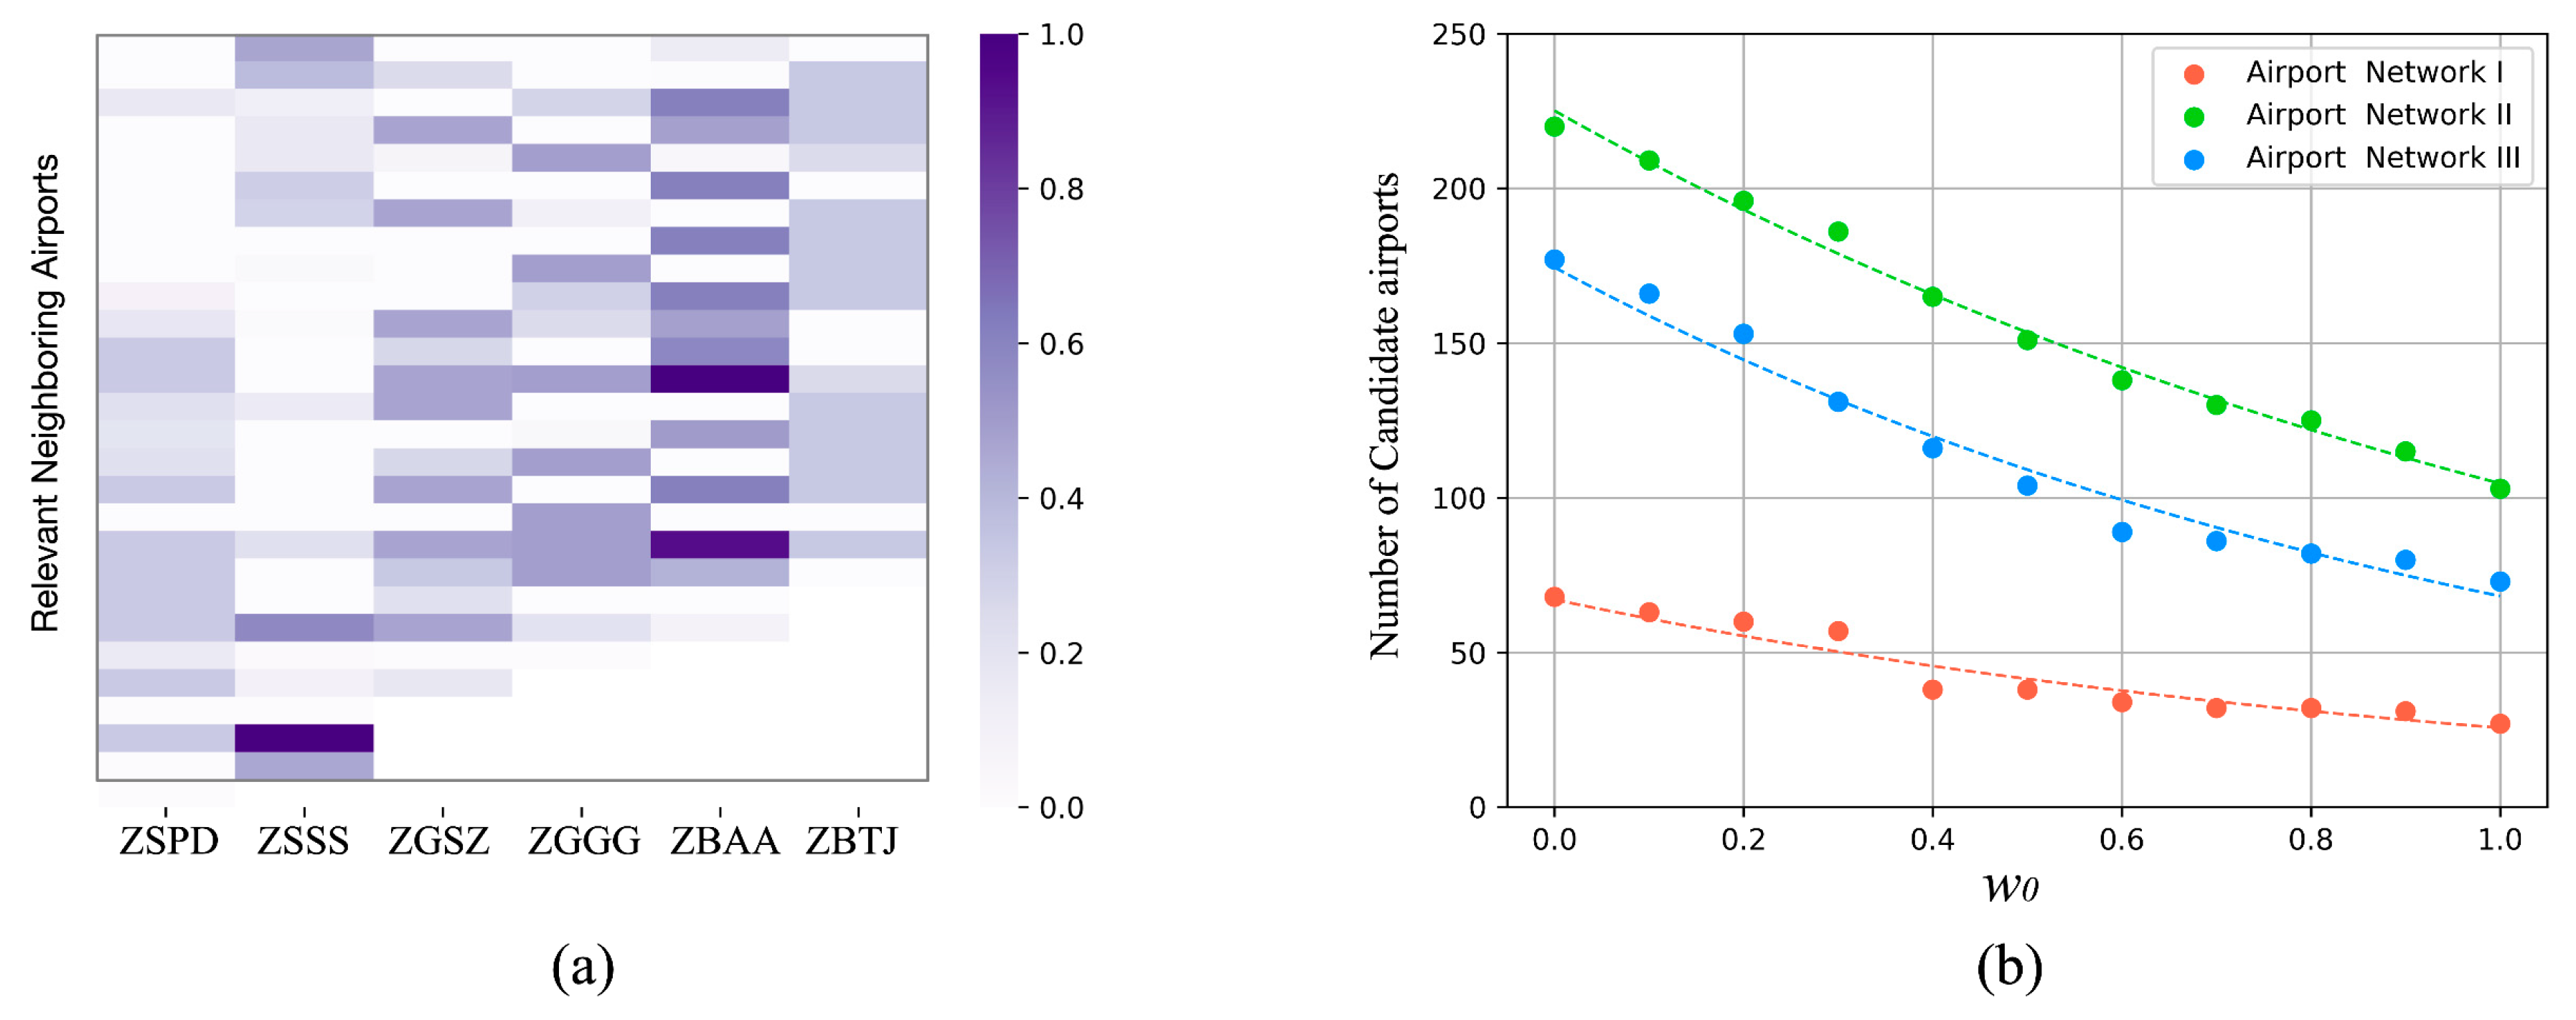
Figure 13a shows the attention score generated by the models of the selected six typical airports. The result generally indicates that the delay causality relationship between the selected typical airports and their neighboring airports are quite different, which represents that the delay propagation impact varies by different airports. Figure 13b further depicts the relationship between the attention score threshold value w0 and the related number of identified causal links. In general, if the threshold value w0 is set too small, more invalid links will be selected as causal links. If the threshold value w0 is set too large, some critical causal relationships will be missed. Previous studies usually subjectively determine the value of w0 when the number of identified causal links will not significantly change. This study follows the same method, and the final threshold values w0 of each airport network are set as 0.3, 0.3 and 0.2, respectively. Table 3 shows the result of the t-test. It can be observed from the attention score that a relatively high proportion of identified causal links has been kept in airport network I after the test.

4.3. Topological Analysis of the Delay Causality Network

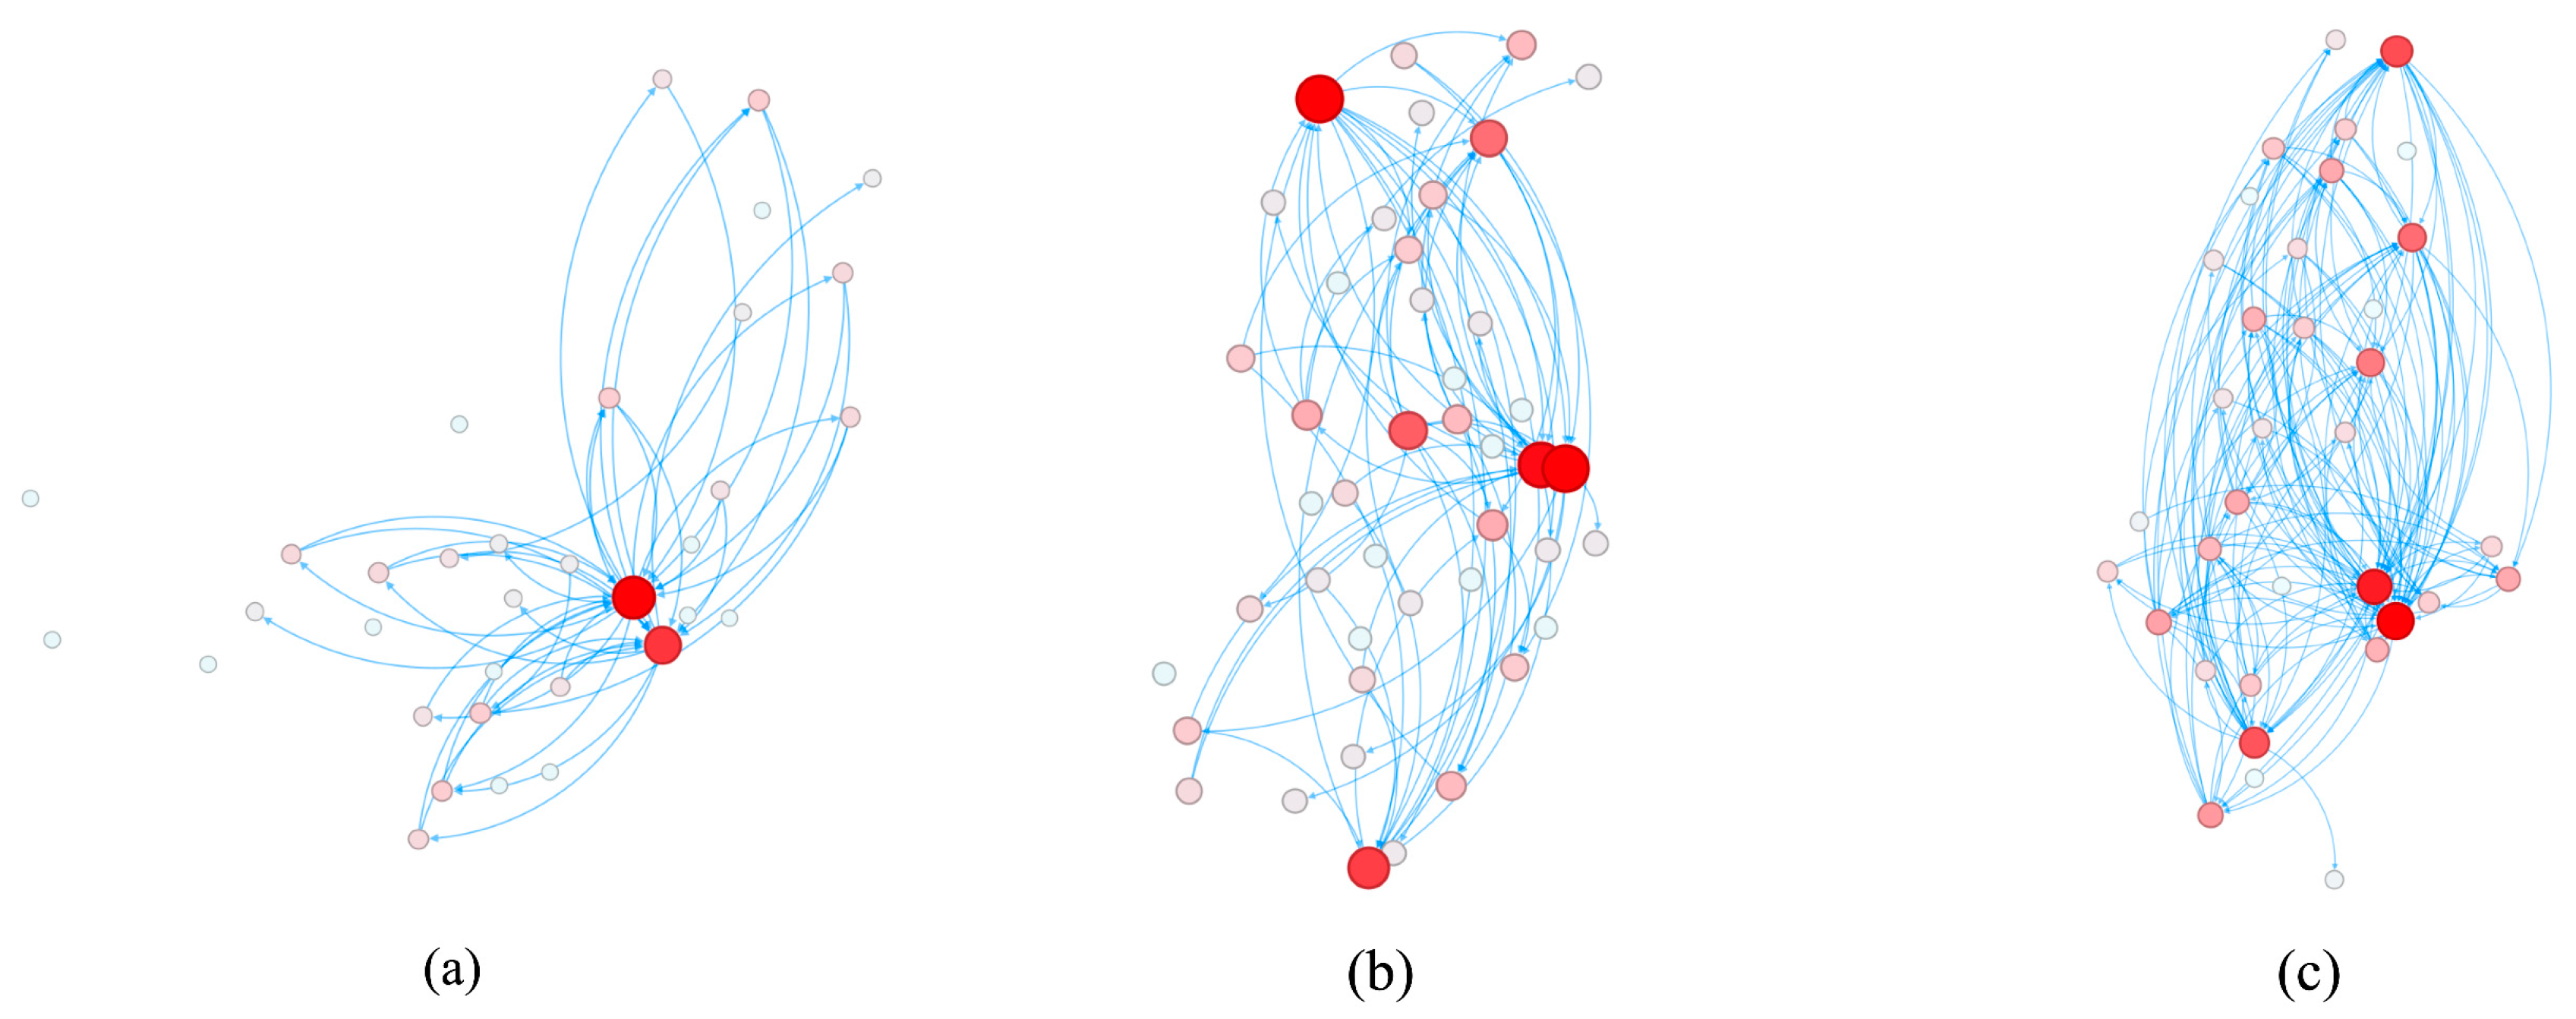
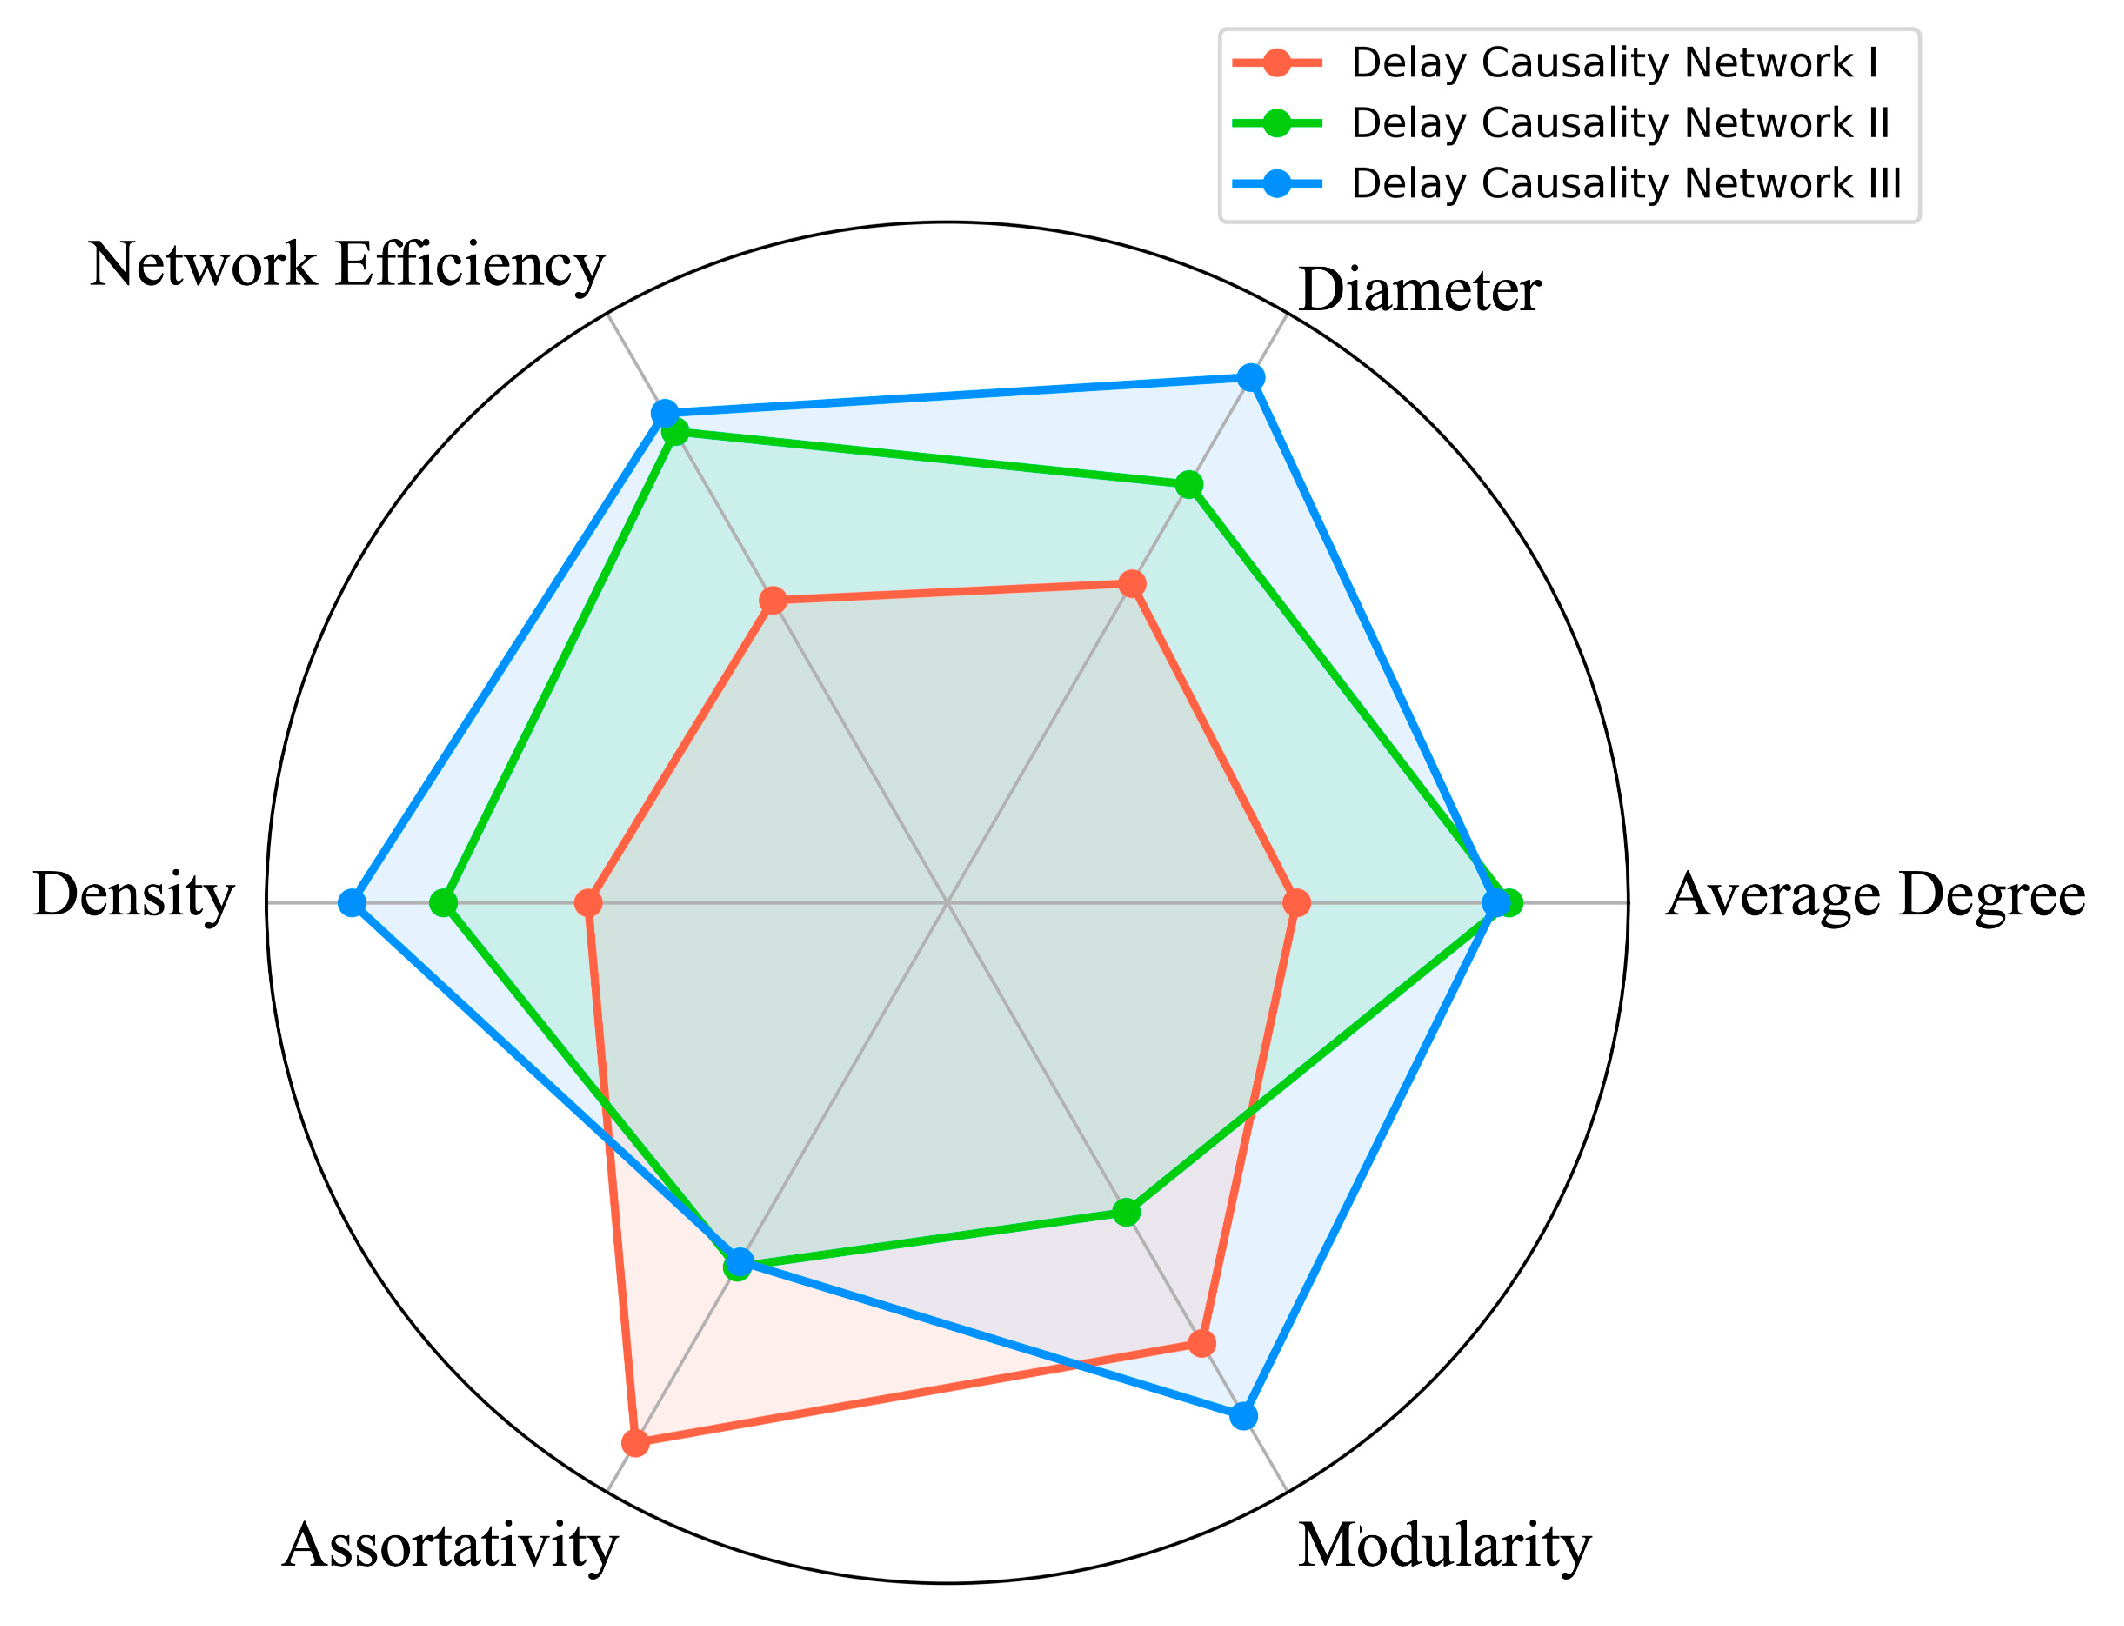
On the basis of the final identified causal links, the DCNs are developed for each airport network, respectively. Figure 14 illustrates the DCNs, and the three DCNs exhibit quite different topological structures intuitively. Many previous studies usually employ Complex Network Metrics to explore the topological characteristics of DCNs, including network indicators such as Diameter, Network Efficiency, Density, Assortativity and Modularity [12]. The indicators of the DCNs are presented in Table 4 and Figure 15 for topological analysis and airport network comparison.
The Average Degree value of the DCN indicates the average number of potentially infected airports caused by the source airport. From Figure 15, DCN II and DCN III are involved with 4.681 and 4.515 infected airports on average, which are higher than DCN I. This indicates that delays occurred in airports of the East China Control Area and Central and South Control Area are more likely to generate intense effects. Moreover, DCN III shows the largest Diameter value, indicating that air traffic delays in the Central and South Control Area will propagate farther and accordingly may cause a more far-reaching impact to the airport network. In Table 4, the Density indicates the centrality and complexity of a network. DCN I shows a relatively low Density, which represents that the delay propagation mechanism of the North China Control Area is less complicated than that of the other two areas. The Network Efficiency indicator further explores the delay propagation efficiency. The higher the value, the more accessible and faster the delay will propagate. It can be seen that the East China Control Area and Central and South Control Area are involved with higher delay propagation efficiencies that are mainly due to the fact that the average path length in these two areas is shorter.
The Modularity indicator is used to indicate the degree of the network that could be divided into sub-parts. The airports belonging to the same sub-regions tend to exhibit similar delay propagation characteristics. From Table 4, DCN I and DCN III have a higher Modularity value, which indicates that the North China Control Area and Central and South Control Area are involved with more diverse sub-regions and inconsistent delay propagation patterns, leading to great challenges for local ATC authorities in developing effective policies and flow control strategies for relieving air traffic delays. The Assortativity indicator is used to measure the correlation between nodes in a network. In this study, the Assortativity in all three DCNs is found to be negative, indicating that airports with high degrees of connectivity are more likely to propagate delays to airports with lower degrees of connectivity. Notably, the absolute value of Assortativity in DCN I is higher than that of other two networks, which suggests that in the North China Control Area, airports with a large number of airlines are more likely to transfer delays to airports with a small number of airlines.
In summary, the comparative analysis of three DCNs based on Complex Network Metrics reveals quite different topological characteristics and delay propagation features in different ATC areas. Specifically, the delay propagated in the The orth China Control Area is involved with a specific delay propagation direction. Delays in East China Control Area and Central South Control Area are more complex but propagate with higher efficiency. The results again validate the fact that different ATC areas exhibit different delay propagation patterns, and the comparative analysis provides insightful suggestions for local ATC authorities to develop more targeted strategies for reducing air traffic delays.

4.4. Delay State Transition Analysis

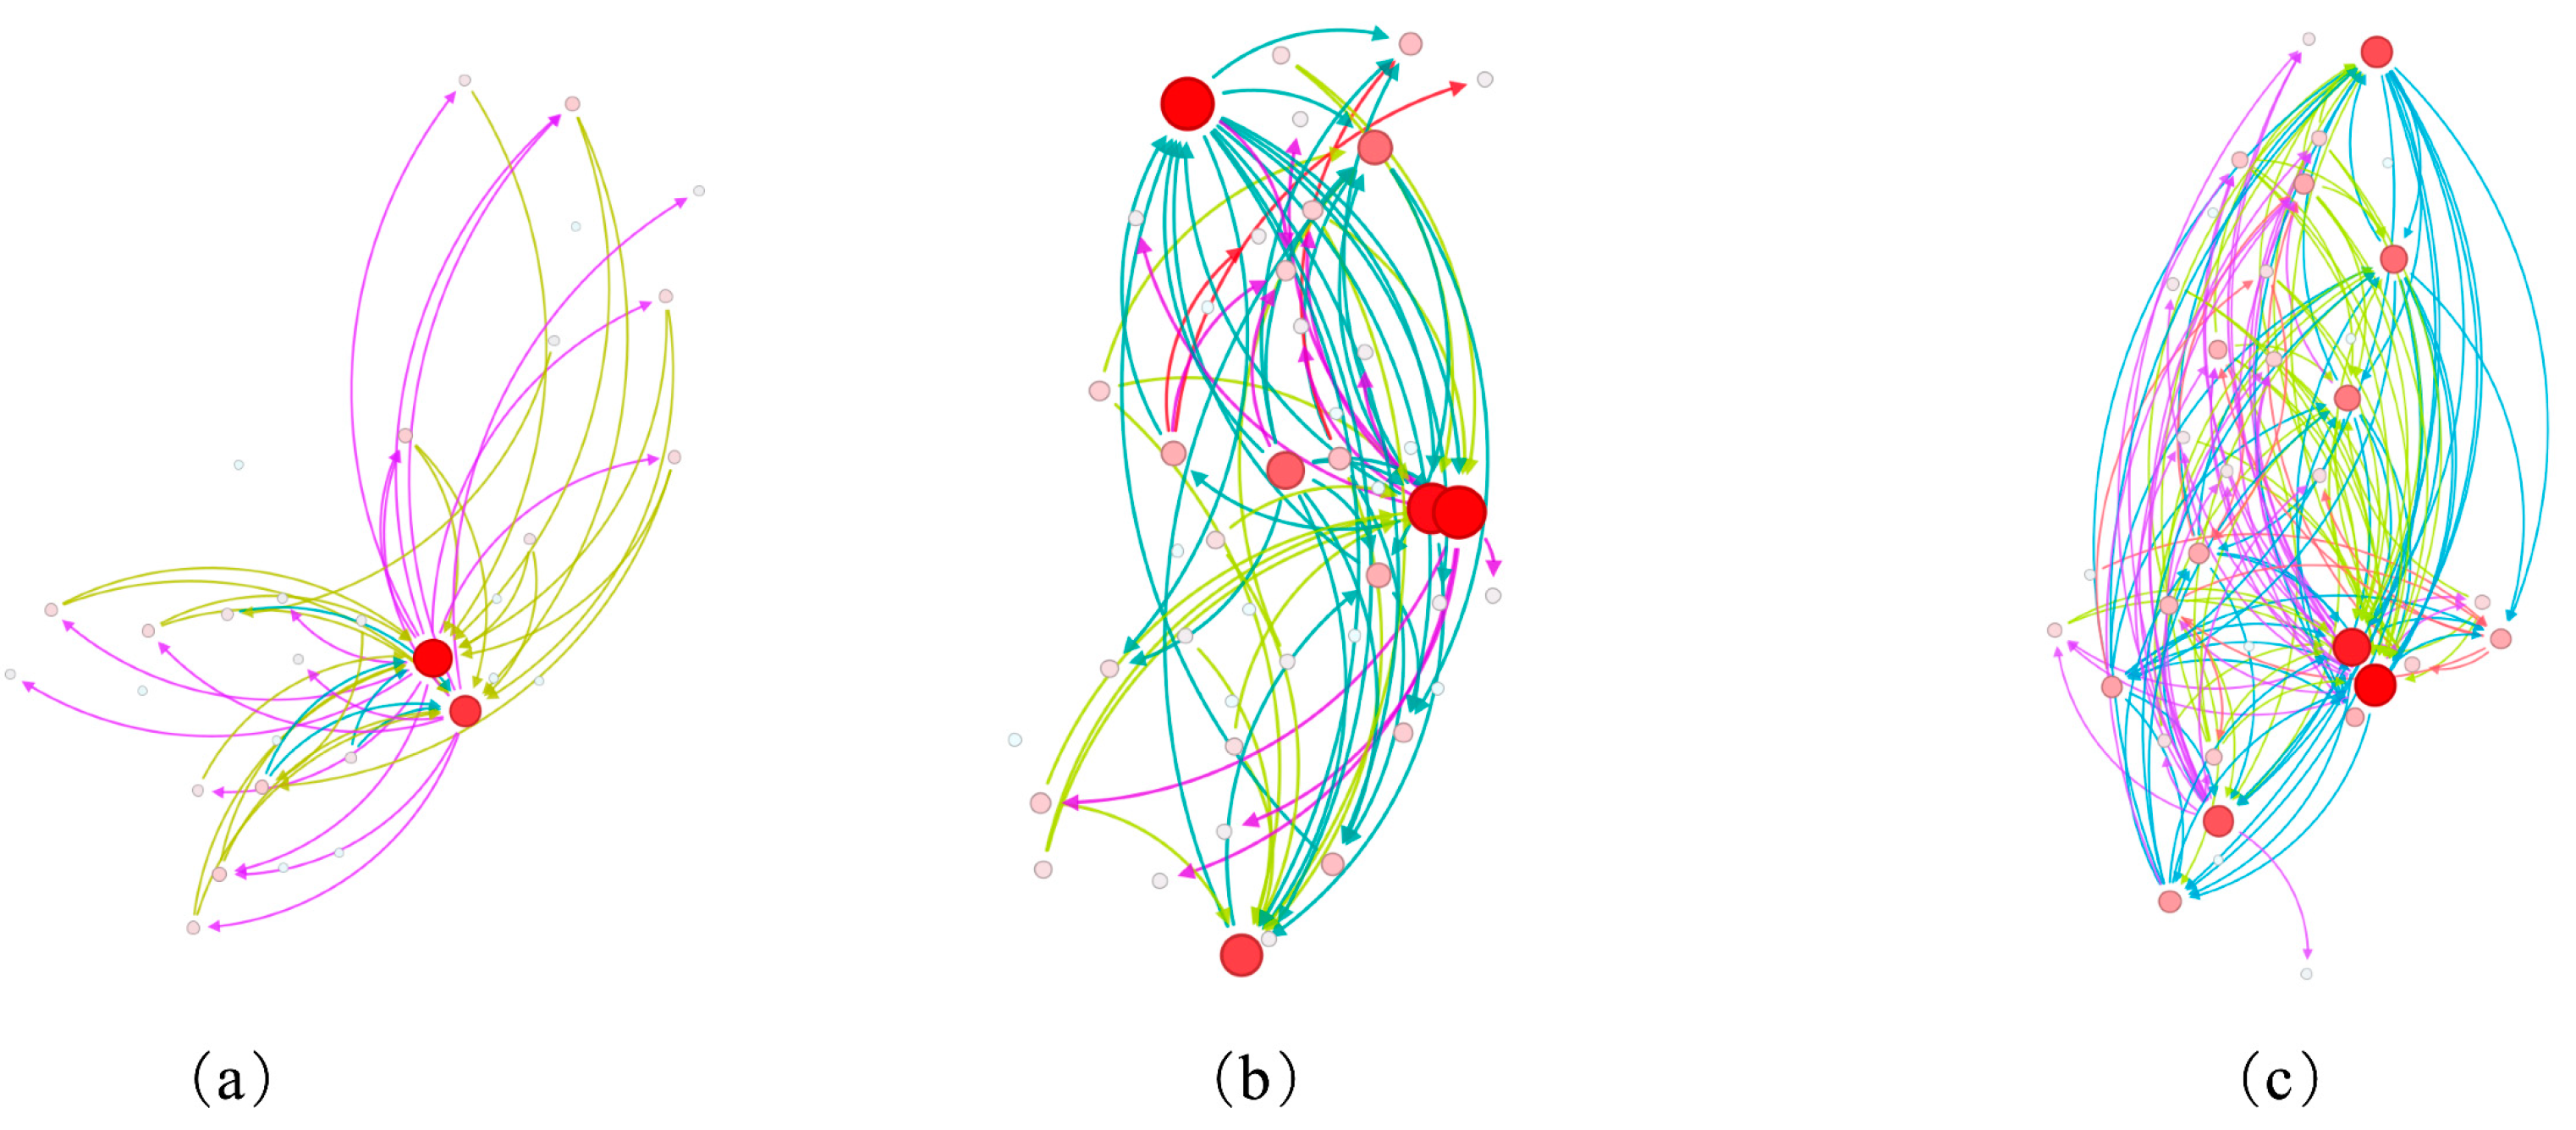
Based on the above analysis, the delay causality relationship between airport pairs in each network can be identified. However, the severity of delay causality is still unclear. For example, a normal delay in airport A might cause a serious delay in airport B. Thus, in this section, the delay state transition in each identified causality link will be further explored. Followed by the definition by the Federal Aviation Administration (FAA), the delay times are categorized into three levels, including Delay Level I (delay time less than 15 min), Delay Level II (delay time between 15 min and 30 min) and Delay Level III (delay time more than 30 min). Note that the delay propagation time window between each causality link is mainly determined by the flight time between the related airport pairs [38]. Accordingly, the delay state transition from airport A to airport B in each time step t is denoted as the delay level at time t of airport A to the delay level of airport B after the flight time window between the two airports. Aggregated by all the time steps, the delay causality link between the two airports can be represented as a mixture of various delay state transitions. As is shown in Figure 16, the delay causality from ZBAA to ZBAL can be further indicated as a mixture of nine possible delay state transitions. To make an easy and intuitive visualization, only the delay state transition that accounts for the largest proportion (Delay Level III → Delay Level I) is plotted.
Figure 17 visualizes the delay state transitions of the three DCNs. In general, the delay state transitions are quite different in the three airport networks. The delay state transition of the airport network in the North China Control Area is mainly related with the ZBAA and ZBTJ airports and mainly manifests in two types of transitions: Delay Level III → Delay Level I and Delay Level I → Delay Level III. The delay state transition in DCN I exhibits an obvious bidirectional transition form which indicates that the delays mainly propagate between the large-degree airports and small-degree airports. The results indicates that delays in the airport network in North China Control Area propagate locally in such a way that serious air traffic delays generated from hub airports cannot be effectively absorbed and relieved during the propagation process. Compared with airport network I, the other two networks show more complex and diverse delay state transition. Specifically, most of the delay state transitions in the airport network in the East China Control Area are related with the airports of ZSPD, ZSSS and ZSAM, and the transition of Delay Level III → Delay Level III accounts for a relatively large proportion, indicating that severe delays in some hub airports, e.g., those caused by some adverse weather, seem difficult to reduce and tend to also cause severe delays in their neighboring airports within the East China region. The delay state transitions in the airport network in the Central and South Control Area are more evenly distributed. Each type of delay state transition accounts for a similar proportion. For some hub airports, such as ZGGG, ZGSZ and ZJHK, Delay Level III → Delay Level I is a prominent transition; while for some airports, such as ZHHH and ZHCC, Delay Level III → Delay Level III is a prominent transition. The evenly distributed delay state transitions in the airport network in the Central and South Control Area provide great challenges for local ATC authority in developing some unified and generic air traffic flow management strategy for reducing airport network delays.

5. Conclusions

The primary objective of this study was to explore the delay causality between airports and compare the delay propagation patterns across various airport networks. Three complete months of flight operation data ranging from 1 July to 30 September 2019 were collected from CAAC to illustrate the procedure. An attention-based recurrent graph convolutional neural network (ARGC-Net) was proposed to identify the delay causalities between airports in three typical airport networks of China. The learned attention score values identified a causal relationship between different airports and the t-test-validated true delay causality, then the causality links among airports in each network were obtained, and were accordingly used to develop the delay causality networks. Some critical indicators were selected to compare the topological characteristics of different obtained DCNs; in general, the analysis results of the selected delay characteristics indicators revealed that different airport networks showed great diversities in their delay propagation patterns. Furthermore, the delay state of each airport was categorized into three levels, and the delay state transition of the three networks was explored. The results indicate that the delay state transition in the airport network in the North China Control Area exhibits an obvious bidirectional transition form that mainly propagates between the large-degree airports and small-degree airports, while severe delays of some hub airports account for a relatively large proportion in the East China Control Area and Central and South Control Area.
The results of this study have provided a new perspective for ATC to understand traffic delays in air transportation systems. The findings reveal that different ATC areas exhibit quite different delay propagation patterns, and the comparative analysis of different airport networks could help local ATC authorities to develop more effective and targeted strategies to reduce air traffic delays and improve airport operation efficiency. However, several limitations of this study should be further explored. First, this study only considered limited factors that may cause the delays between different airports, but other factors may also affect the delay propagation, such as adverse weather and controller intervention. Second, only some typical network topological indicators have been introduced to evaluate the topological characteristics of networks in this study. Third, the attention mechanism is an embedded block in the developed deep learning architecture, and the attention score is a trainable weighted metric and updated during each training step in this study. Thus, it is hard to obtain a functional model in explainable mathematical form based on the learned weights and transition function.
Future studies could focus on incorporating more contributing factors into the delay propagation causality. For example, the adverse weather conditions in hub airports have great influence on delays in the whole network, a fact which could be incorporated into the delay causality identification model. More detailed and comprehensive network topological indicators could reveal the complex characteristics of networks; further studies could introduce more network topological indicators to explore the relationship between topological structures of airport network and the related delay propagation patterns, which could provide insightful suggestions for route planning and new airport localization. In addition, the attention score in this study is an unexplainable training weighted metric; further work could focus on how to make this trainable weight explainable through some mathematical functions.

Author Contributions

Conceptualization, J.K. and J.B.; data curation, J.K., S.Y. and J.B.; writing—original draft preparation, J.K. and S.Y.; methodology, J.K. and X.S.; investigation, Z.Y. All authors have read and agreed to the published version of the manuscript.

Funding

This research was supported by National Natural Science Foundation of China (52002179, 52172328), State Key Laboratory of Air Traffic Management System and Technology (SKLATM202107), the Science and Technology Project of Jiangsu Province (BZ2020001), and Nanjing Municipal Science and Technology Innovation Project for Overseas Scholars (No. 1007-YQR21045).

Data Availability Statement

Data will be made available on request.

Conflicts of Interest

The authors declare no conflict of interest.

References

  1. Vlachos, I.; Lin, Z. Drivers of airline loyalty: Evidence from the business travelers in China. Transp. Res. Part E Logis. Transp. Rev. 2014, 71, 1–17. [Google Scholar] [CrossRef]
  2. Total Delay Impact Study: A Comprehensive Assessment of the Costs and Impacts of Flight Delay in the United States. Available online: https://rosap.ntl.bts.gov/view/dot/6234 (accessed on 30 March 2023).
  3. Li, D.; Jiang, Y.; Kang, R.; Shlomo, H. Spatial correlation analysis of cascading failures: Congestions and blackouts. Sci. Rep. 2014, 4, 5381. [Google Scholar]
  4. Deshpande, V.; Arıkan, M. The impact of airline flight schedules on flight delays. Manuf. Serv. Oper. Manag. 2012, 14, 423–440. [Google Scholar] [CrossRef]
  5. Jetzki, M. The Propagation of Air Transport Delays in Europe. Master’s Thesis, RWTH Aachen University, Aachen, Germany, 2009. [Google Scholar]
  6. Kafle, N.; Zou, B. Modeling flight delay propagation: A new analytical-econometric approach. Transp. Res. Part B Methodol. 2016, 93, 520–542. [Google Scholar] [CrossRef]
  7. Malone, K.M. Dynamic Queueing Systems: Behavior and Approximations for Individual Queues and for Networks. Ph.D. Thesis, Massachusetts Institute of Technology, Cambridge, MA, USA, 1995. [Google Scholar]
  8. Pyrgiotis, N.; Malone, K.M.; Odoni, A. Modelling delay propagation within an airport network. Transp. Res. Part C Emerg. Technol. 2013, 27, 60–75. [Google Scholar] [CrossRef]
  9. Baspinar, B.; Koyuncu, E. A data-driven air transportation delay propagation model using epidemic process models. Int. J. Aerosp. Eng. 2016, 2016, 4836260. [Google Scholar] [CrossRef]
  10. Li, S.; Xie, D.; Zhang, X.; Zhang, Z.; Bai, W. Data-driven modeling of systemic air traffic delay propagation: An epidemic model approach. J. Adv. Transp. 2020, 2020, 8816615. [Google Scholar] [CrossRef]
  11. Barrat, A.; Barthelemy, M.; Pastor-Satorras, R.; Vespignani, A. The architecture of complex weighted networks. Proc. Natl. Acad. Sci. USA 2004, 101, 3747–3752. [Google Scholar] [CrossRef]
  12. Zeng, L.; Wang, B.; Wang, T.; Wang, Z. Research on delay propagation mechanism of air traffic control system based on causal inference. Transp. Res. Part C Emerg. Technol. 2022, 138, 103622. [Google Scholar] [CrossRef]
  13. Runge, J.; Bathiany, S.; Bollt, E.; Camps-Valls, G.; Coumou, D.; Deyle, E.; Glymour, C.; Kretschmer, M.; Mahecha, M.D.; Muñoz-Marí, J.; et al. Inferring causation from time series in Earth system sciences. Nat. Commun. 2019, 10, 2553. [Google Scholar] [CrossRef]
  14. Zhang, M.; Zhou, X.; Zhang, Y.; Sun, L.; Dun, M.; Du, W. Propagation index on airport delays. Transp. Res. Rec. 2019, 2673, 536–543. [Google Scholar] [CrossRef]
  15. Tan, X.; Liu, Y.; Liu, D.; Zhu, D.; Zeng, W.; Wang, H. An Attention-Based Deep Convolution Network for Mining Airport Delay Propagation Causality. Appl. Sci. 2022, 12, 10433. [Google Scholar] [CrossRef]
  16. Lin, L.; He, Z.; Peeta, S. Predicting station-level hourly demand in a large-scale bike-sharing network: A graph convolutional neural network approach. Transp. Res. Part C Emerg. Technol. 2018, 97, 258–276. [Google Scholar] [CrossRef]
  17. Bao, J.; Liu, P.; Ukkusuri, S.V. A spatiotemporal deep learning approach for citywide short-term crash risk prediction with multi-source data. Accid. Anal. Prev. 2019, 122, 239–254. [Google Scholar] [CrossRef] [PubMed]
  18. Bao, J.; Kang, J.; Yang, Z.; Chen, X. Forecasting network-wide multi-step metro ridership with an attention-weighted multi-view graph to sequence learning approach. Expert Syst. Appl. 2022, 210, 118475. [Google Scholar] [CrossRef]
  19. Zanin, M.; Belkoura, S.; Zhu, Y. Network analysis of Chinese air transport delay propagation. Chin. J. Aeronaut. 2017, 30, 491–499. [Google Scholar] [CrossRef]
  20. Du, W.; Zhang, M.; Zhang, Y.; Cao, X.; Zhang, J. Delay causality network in air transport systems. Transp. Res. Part E Logist. Transp. Rev. 2018, 118, 466–476. [Google Scholar] [CrossRef]
  21. Defferrard, M.; Bresson, X.; Vandergheynst, P. Convolutional neural networks on graphs with fast localized spectral filtering. In Proceedings of the Advances in Neural Information Processing Systems, Barcelona, Spain, 5–10 December 2016. [Google Scholar]
  22. He, Y.; Li, L.; Zhu, X.; Tsui, K.L. Multi-Graph Convolutional-Recurrent Neural Network (MGC-RNN) for Short-Term Forecasting of Transit Passenger Flow. In Proceedings of the IEEE Transactions on Intelligent Transportation Systems, Blacksburg, VA, USA, 8–12 October 2022. [Google Scholar]
  23. Lee, K.; Rhee, W. DDP-GCN: Multi-graph convolutional network for spatiotemporal traffic forecasting. Transp. Res. Part C Emerg. Technol. 2022, 134, 103466. [Google Scholar] [CrossRef]
  24. Kipf, T.N.; Welling, M. Semi-supervised classification with graph convolutional networks. arXiv 2017, arXiv:1609.02907. [Google Scholar]
  25. Bao, J.; Yang, Z.; Zeng, W. Graph to sequence learning with attention mechanism for network-wide multi-step-ahead flight delay prediction. Transp. Res. Part C Emerg. Technol. 2021, 130, 103323. [Google Scholar] [CrossRef]
  26. Bruna, J.; Zaremba, W.; Szlam, A.; LeCun, Y. Spectral networks and locally connected networks on graphs. arXiv 2013, arXiv:1312.6203. [Google Scholar]
  27. Micheli, A. Neural network for graphs: A contextual constructive approach. IEEE Trans. Neural Netw. 2009, 20, 498–511. [Google Scholar] [CrossRef]
  28. Wu, Z.; Pan, S.; Chen, F.; Long, G.; Zhang, C.; Yu, P.S. A comprehensive survey on graph neural networks. IEEE Trans. Neural Netw. Learn. Syst. 2020, 32, 4–24. [Google Scholar] [CrossRef]
  29. Bahdanau, D.; Cho, K.; Bengio, Y. Neural machine translation by jointly learning to align and translate. arXiv 2014, arXiv:1409.0473. [Google Scholar]
  30. Vaswani, A.; Shazeer, N.; Parmar, N.; Uszkoreit, J.; Jones, L.; Gomez, A.N.; Kaiser, L. Attention is all you need. In Proceedings of the Advances in Neural Information Processing Systems, Long Beach, CA, USA, 4–9 December 2017. [Google Scholar]
  31. Ma, X.; Tao, Z.; Wang, Y.; Yu, H.; Wang, Y. Long short-term memory neural network for traffic speed prediction using remote microwave sensor data. Transp. Res. Part C Emerg. Technol. 2015, 54, 187–197. [Google Scholar] [CrossRef]
  32. Hochreiter, S.; Schmidhuber, J. Long short-term memory. Neural Comput. 1997, 9, 1735–1780. [Google Scholar] [CrossRef]
  33. Schuster, M.; Paliwal, K.K. Bidirectional recurrent neural networks. IEEE Trans. Signal Process. 1997, 45, 2673–2681. [Google Scholar] [CrossRef]
  34. Boneau, C.A. The effects of violations of assumptions underlying the t test. Psychol. Bull. 1960, 57, 49. [Google Scholar] [CrossRef]
  35. Watts, D.J.; Strogatz, S.H. Collective dynamics of ‘small-world’networks. Nature 1998, 393, 440–442. [Google Scholar] [CrossRef]
  36. Sarle, W.S. Stopped training and other remedies for overfitting. Comput. Sci. Stat. 1996, 352–360. [Google Scholar]
  37. Hu, J.; Qian, S.; Fang, Q.; Wang, Y.; Zhao, Q.; Zhang, H. Efficient graph deep learning in tensorflow with tf_geometric. In Proceedings of the 29th ACM International Conference on Multimedia, Ottawa, ON, Canada, 28 October–3 November 2021. [Google Scholar]
  38. Li, Q.; Jing, R. Characterization of delay propagation in the air traffic network. J. Air Transp. Manag. 2021, 94, 102075. [Google Scholar] [CrossRef]
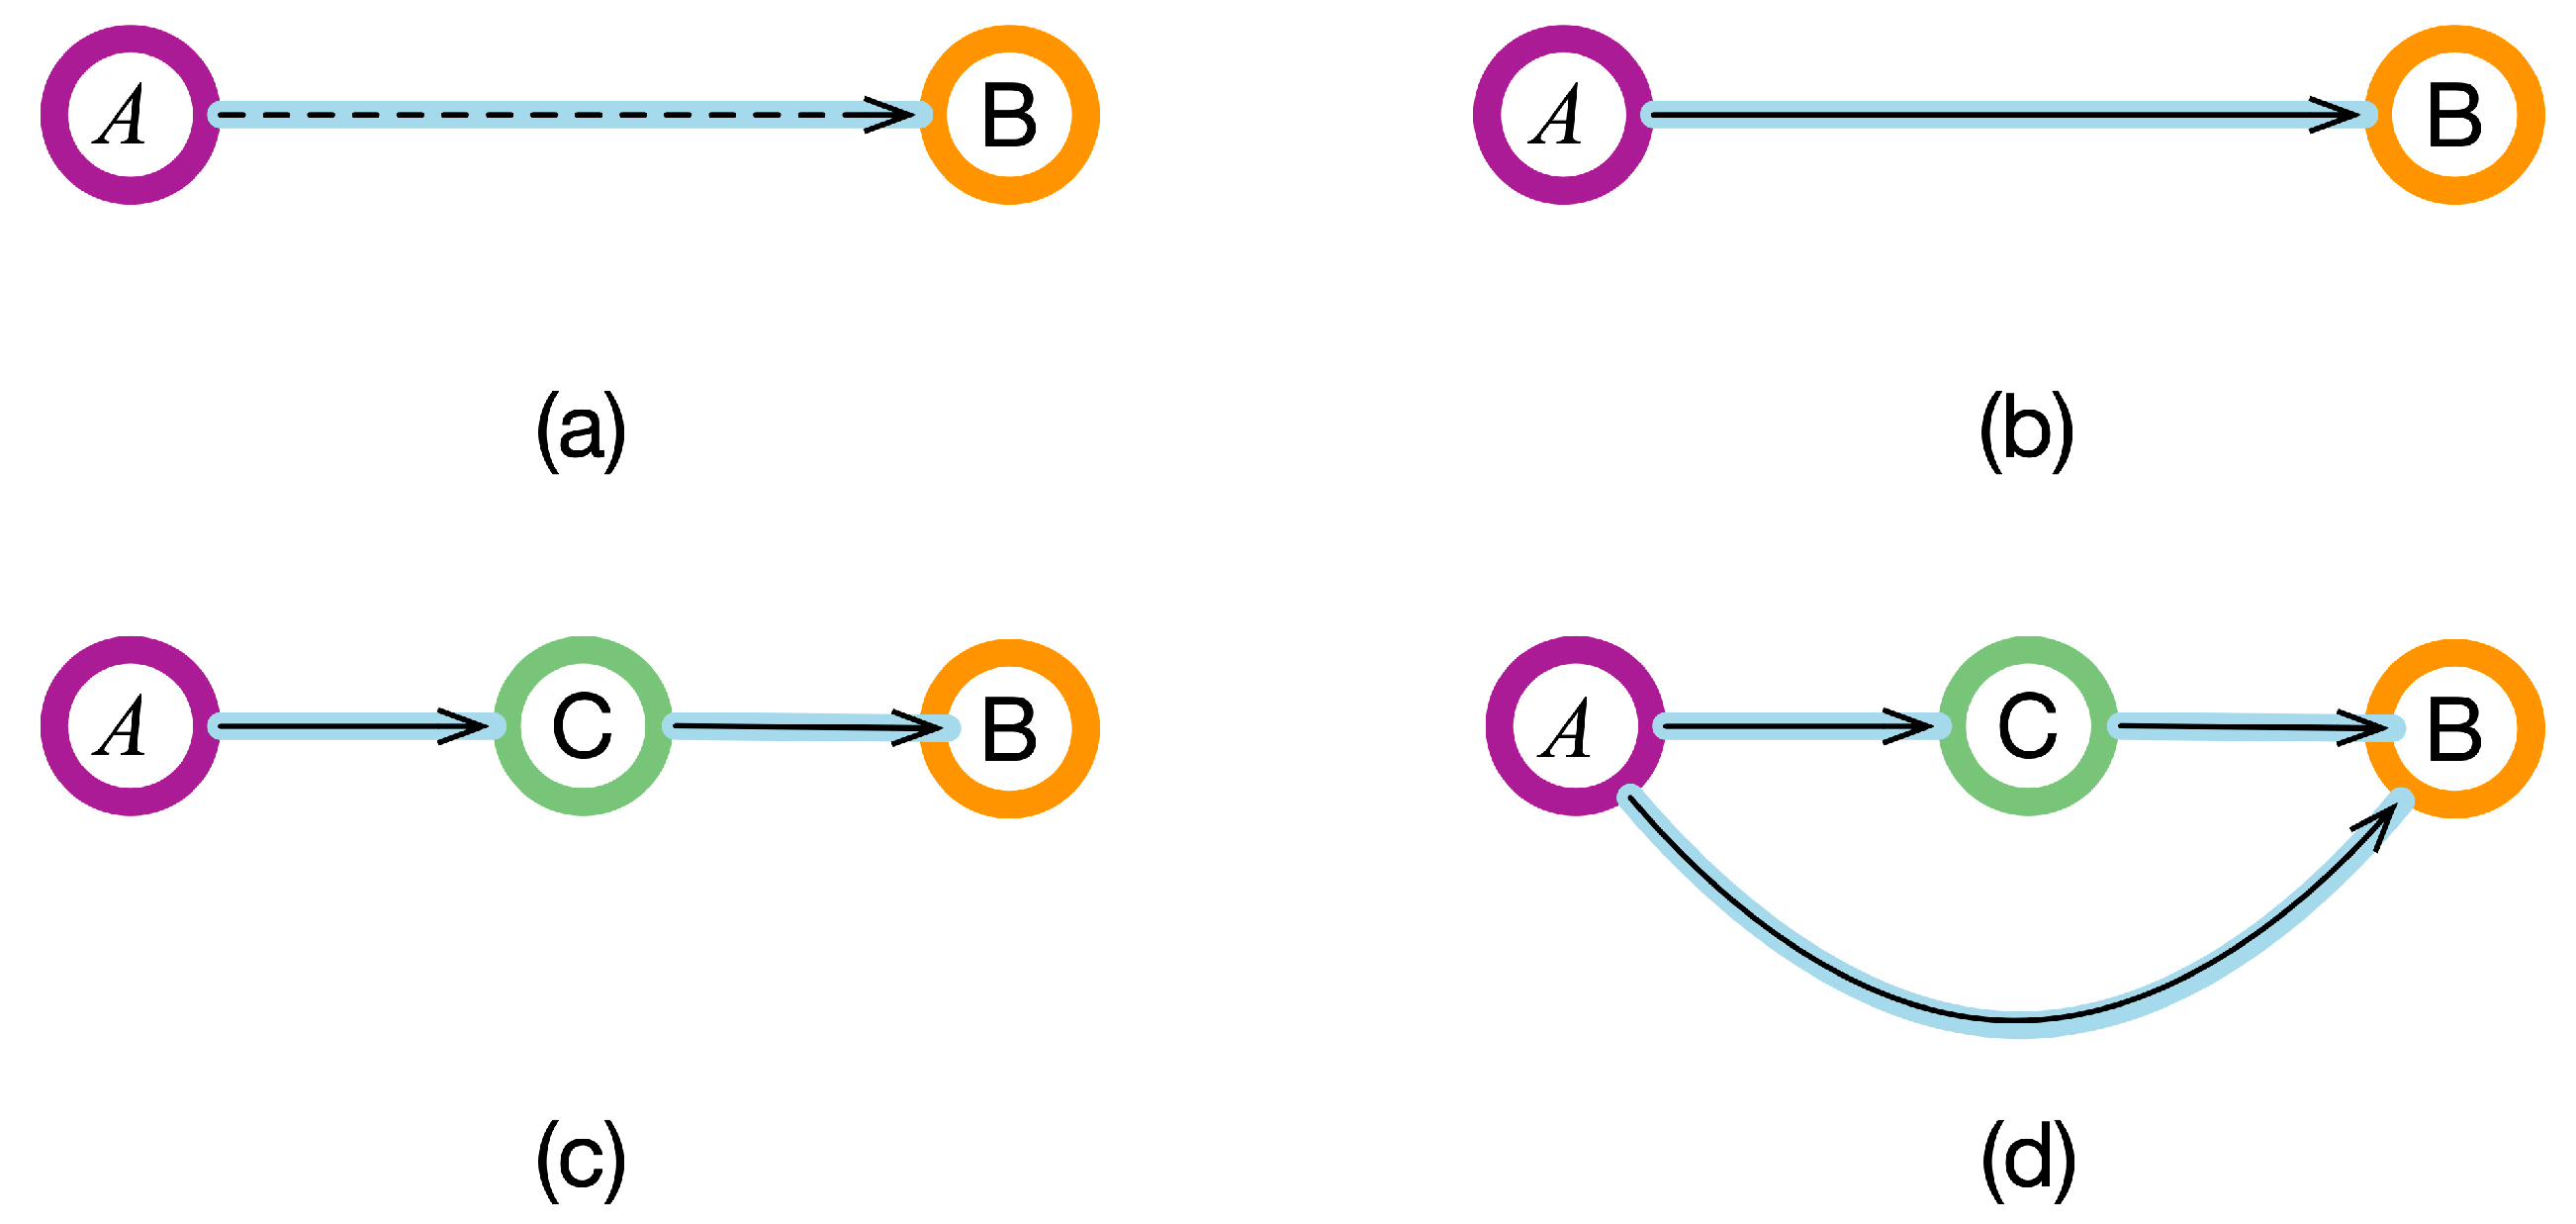
Figure 1. Delay propagation causality between airports. (a) No Causation; (b) Direct Causation; (c) Indirect Causation; (d) Both Direct Causation and Indirect Causation.
Aerospace 10 00453 g001
Figure 2. Direct Causation network of delay propagation.
Aerospace 10 00453 g002
Figure 3. The structure of the developed model.
Aerospace 10 00453 g003
Figure 4. The information processed using the GCN.
Aerospace 10 00453 g004
Figure 5. Illustration of attention mechanism.
Aerospace 10 00453 g005
Figure 6. Illustration of LSTM architecture. (a) The structure of LSTM; (b) Three gates in LSTM.
Aerospace 10 00453 g006
Figure 7. The spatial distribution of the three selected airport networks.
Aerospace 10 00453 g007
Figure 8. The characteristics of delay times in different networks. (a) The frequency distribution of delay time; (b)the temporal distribution of the average daily delay time.
Aerospace 10 00453 g008
Figure 9. Illustration of the three selected airport networks located in different ATC areas. (a) Airport network I; (b) airport network II; (c) airport network III.
Aerospace 10 00453 g009
Figure 10. Illustration of the Clustering Coefficient indicator. (a) the local coefficients are equal to 1; (b) the local coefficients are equal to 2/3; (c) the local coefficients are equal to 1/3.
Aerospace 10 00453 g010
Figure 11. Relative degree of each indicator for the airport network.
Aerospace 10 00453 g011
Figure 12. The performance of the ARGC model. (a) The average prediction performance of model; (b) the prediction loss in typical airports.
Aerospace 10 00453 g012
Figure 13. Causal links identified from the attention score matrix. (a) Visualization of attention weight matrix in the trained ARGC model; (b) the threshold value w0 vs the number of causal links.
Aerospace 10 00453 g013
Figure 14. Three delay causality networks. (a) DCN I; (b) DCN II; (c) DCN III.
Aerospace 10 00453 g014
Figure 15. Relative degree of each indicator for the delay causality network.
Aerospace 10 00453 g015
Figure 16. The propagated delays from ZBAA to ZBAL.
Aerospace 10 00453 g016
Figure 17. (a) Delay state transition in DCN I; (b) delay state transition in DCN II; (c) delay state transition in DCN III.
Aerospace 10 00453 g017
Table 1. The topological characteristics of the three selected airport networks.
IndicatorsAirport Network IAirport Network IIAirport Network IIIMeanSTD
Degree344435397.071
Edge213497354354.667142.001
Average Degree6.26511.29510.1449.2352.635
Average Intensity18.27729.00631.46326.2497.012
Density0.190.2630.2970.250.055
Number of Communities34541
Modularity0.1990.1170.110.1420.049
Average Clustering Coefficient0.570.690.6160.6250.061
Average Path Length2.0591.8071.7591.8750.161
Eigenvector Centrality4.482 × 10−63.179 × 10−61.225 × 10−62.962 × 10−61.639 × 10−6
Table 2. The main hyper-parameters of the model.
Hyper-ParameterDescriptionHyper-Parameters in Airport Network IHyper-Parameters in Airport Network IIHyper-Parameters in Airport Network III
TstepThe time steps of input dataset544
Toutput_stepThe time steps of output dataset111
HGCNThe number of hidden units in each GCN layer111
activationGCNThe activation function of the GCN cellReluReluRelu
HLSTMThe number of hidden units in each LSTM layer888
activationLSTMThe activation function of the LSTM cellReluReluRelu
HFCThe number of hidden units in each fully connected layer111
ActivationFCThe activation function of the FC cellReluReluRelu
OptimizerImplemented optimizer during the training processAdamAdamAdam
α Learning rate0.0050.010.01
BBatch size161616
dThe dropout rate0.050.10.05
Table 3. Changed number of candidate airports.
Airport NetworkOriginal Candidate NumberCandidate Number after Attention Score SelectionCandidate Number after t-test * Selection
Airport Network I221 57   74.2 % 44   22.8 %
Airport Network II510 186   63.5 % 70   62.3 %
Airport Network III362 153   57.7 % 61   60.1 %
* The significance level of the t-test is 0.05.
Table 4. Results of Complex Network Metrics.
IndicatorsDelay Causality Network IDelay Causality Network IIDelay Causality Network IIIMeanSTD
Node344433374.966
Edge53886568.66714.522
Average Degree1.8534.6814.5153.6831.295
Diameter (KM)1137.511479.2531849.6691488.81290.816
Network Efficiency1.025 × 10−42.341 × 10−42.483 × 10−41.949 × 10−46.564 × 10−5
Density0.0560.1080.1410.1010.034
Assortativity−0.065−0.033−0.032−0.0430.015
Modularity0.0230.0050.0330.020.014
Disclaimer/Publisher’s Note: The statements, opinions and data contained in all publications are solely those of the individual author(s) and contributor(s) and not of MDPI and/or the editor(s). MDPI and/or the editor(s) disclaim responsibility for any injury to people or property resulting from any ideas, methods, instructions or products referred to in the content.