Abstract
The infrared detector is adopted to track and recognize targets, including missiles and airplanes. These targets are usually far from the detector. The pixel size is less than when the image has pixels. They are regarded as the IR small targets. Because of the complex space environment, the high-brightness clouds and noise have a bad effect on the real small target detection. We need to focus on the tracking and detection of a small target in IR images in the intricate background. This article utilizes the Laplacian of Gaussian (LOG) filter and an improved local contrast method to reduce the impact of the high-light corner and strip. Compared with traditional space filtering, frequency domain technology, or the single local contrast method, we can greatly improve the signal clutter ratio gain (SCRG) and background suppression factor (BSF) in the real complex background in IR image processing. Under the same false alarm rate, our method achieves a better detection rate.
1. Introduction
Recently, a passive infrared detector (PID) has been widely used in target detection. They produce IR image sequences that include multi-dimensional information in space and frequency domains [1]. So far, with the rapid construction of international space early-warning systems, the detection and recognition of IR small target technology has developed quickly. It makes the tracking and detection of small space targets an important and difficult problem. The infrared detector could sense hot radiation. The inhomogeneous thermal control and incomplete correction result in different radiation gradients on the target surface, which create much noise [2]. Meanwhile, the space background is complex. IR images are easily affected by the sun. The target lacks a clear texture, and the local contrast is obscure. Traditional detection relies on the template in a specific environment, which is less robust for IR target detection under the intricate background. IR small target detection is one of the more difficult topics. It doesn’t form the standard detection flowchart. IR small target detection focuses on strengthening targets and suppressing the background. The basic principle is to utilize the inherent character of all components in IR images. And they use the appointed space and time domain filters to realize the target enhancement and background suppression. The IR target is less than 9 × 9 pixels in the image with 256 × 256 pixels. We usually adopt the detect before track (DBT) if the SCR is relatively higher [3]. DBT is a detection framework that first identifies single-frame targets and then identifies target trajectories according to multi-frame images. Otherwise, we could use tracking before detection (TBD). DBT includes space- and frequency-domain filtering. The space filtering mainly contains the max mean filter, max median filter, tophat filter, etc. The local contrast methods utilize different sensing in the human visual system (HVS). The facet model, the infrared patch-image (IPI) model, and machine learning are adopted in DBT [4]. The frequency-domain filter algorithm contains the wavelet transform, fast Fourier transform, etc. [5]. If the signal-to-clutter ratio (SCR) is lower, the target is submerged in the background. It has a bad effect on the detection result. So the frequency-domain filtering is adapted to the higher SCR.
Space filtering has a strong real-time characteristic. It is widely used in IR detection engineering programs. However, it is mostly dependent on the template and the lack of robustness under the complex background [6]. Researchers proposed a local contrast method (LCM) based on the local measurement of IR small target detection [7], which could increase the detection rate in a lower local contrast environment. However, it has also strengthened the high-brightness noise and increased the false alarm (FA). So researchers use the improved LCM (ILCM) to solve the high FA. It utterly depends on the key parameter of the sliding windows and performs worse under complex backgrounds [8]. The article [9] uses the DOG filter before the LCM, which is more robust in a complex background with high-brightness noise. It overcomes the disadvantages of no directionality in DOG filtering and the poor real-time pixel-wise calculation of the LCM algorithm. However, it needs to preprocess before detection and couldn’t adapt to the variable background. The author [10] utilized the multi-scale relative local contrast measure (RLCM). It could enhance real IR targets and suppress all types of interferences simultaneously. The imprecise approximation leads to false alarms and missed detections. The article [11] proposes the multi-patch contrast measure (MPCM), which performs well with mildly fluctuating environments with less running time. It has poor detection rates and robustness against complex backgrounds. The article [12] adopts the high-boost-based multi-scale LCM (HBMLCM) method in IR small target detection. It improves the detection effect without complete prior knowledge. Unfortunately, it is time-consuming. A difference of Gaussian (DOG) filter is adopted before detection [13,14]. They use DoG filters to compute saliency map. Then the real target could be attained by a control mechanism of winner-take-all (WTA) competition and inhibition-of-return (IOR) with a satisfying detection effect. The author used local homogeneity and inhomogeneity with different scales, which can improve the SCRG and detection rate [15]. However, they couldn’t realize real-time detection. The author in [16] put the multi-direction deviation to use for weak and dim IR target detection, which can improve the SCR to a certain extent. However, it doesn’t achieve the balance of enhancing the target and suppressing highlight background edges. The article [17] proposes an infrared weak and small target detection method based on saliency scale space. They combine the saliency and scale space in IR small target detection. It is adaptable to the complex space background and improves the detection rate. However, the computation is much more complex and is unable to obtain better timeliness. The multidirectional derivative-based weighted contrast measure(MDWCM) uses a facet model to achieve multidirectional derivative subbands [18]. They capture the derivative properties of the target, which enhances the robustness of detection. J. Han has created the multi-scale tri-layer local contrast measure(TTLCM) [19]. The tri-layer filtering window consists of a core layer, a reserve layer, and a surrounding layer. The method could enhance the true target purposefully before local contrast calculations. However, significant background noise was present in saliency maps with a dramatically changing environment.
In this paper, we propose a deep fusion of the LOG filter and LCM in a complex background with many highlight corners and strips. The spatial domain filtering and the improved multi-scale local contrast method are fused at the pixel level twice to further enhance the local contrast of the target. For different complex environmental backgrounds, it can effectively suppress the background and improve the SCRG of the target simultaneously. On the edges and corners of the highlighted background, our method has a better suppression effect. Compared with traditional space-filter methods and some LCM methods, it achieves a higher detection rate under a same false alarm rate.
2. Materials and Methods
The widely used DBT diagram is described in Figure 1. Firstly, the original single IR frame is preprocessed using the preprocessing algorithm. It could enhance the target and suppress the background. Secondly, we need to use adaptable threshold segmentation. Lastly, we could track the IR image sequences and confirm the real targets. Above all, the conventional flowchart of the DBT is realized with these steps.

Figure 1.
The standard DBT flowchart in IR small target detection.
2.1. IR Image Space Model and Character Analyze
IR sensors can attain images with small targets in the IR target detection system. Every single-frame is formed by the background, white gaussian noise, and the small target. The math expression is described by Equation (1) [20].
represents the gray of the whole IR image. is the small target. stands for the background. However, the is the noise. Under the typical background of clouds and buildings, the small target displays highlight character. The bulky clouds show the large area with highlight spots and buildings that are relatively highly correlated with each other. The small target is irrelevant to the background. It is singular with high frequency. Because of the further distance between the detector and the target, the target could seem similar to an expansion of the spot target. The target model can be displayed as Equation (2) [21].
The background includes a large, bulky cloud and buildings. They are highlighted areas and have a high correlation. They occupy the low frequency of the IR image and show violent changes at the edge of the IR image. At the same time, the IR system is uniform in energy. The background demonstrates short-term stationarity and long-term instability. The noise is not correlated with the surrounding pixels and occupies the high-frequency band. They have been recognized as white Gaussian noise with a 0 mean and 1 standard deviation. The target, background, and noise demonstrate different contrast levels. The target shows the discontinuity in the local area. The target is consistent in the local area. However, the noise is utterly different in the local area. The background is also consistent. Within the size of the local area, the local contrast between the target and background is totally different. The algorithm is constructed under the normal DBT procedure. The diagram is described in Figure 2. The algorithm in this paper comprehensively considers the background contour and edge; we carry out LOG on a single-frame image under complex background. Through multi-scale local block anisotropy analysis of small targets, we finally fused the two types of LCM detection effects to identify small infrared targets.

Figure 2.
Multi-scale local contrast fusion detection based on LOG.
2.2. Local Contrast Setting Based on LOG Saliency Map
The Laplace operator does not smooth the image, so it is very sensitive to noise. LOG first performs Gaussian smoothing on the image, and then convolutions with the Laplacian operator. The definition is described as (3).
It can be seen from the 3D mesh image that LOG is similar to a straw hat. The edge of the image or object is obtained by detecting the zero-crossing of the filtering results, and the high-frequency band detection of the image is realized. For infrared small target detection, a multi-scale LOG operator sets an image template of typical size, which is suitable for filtering detection of multiple targets of different sizes. It is robust under the complex circumstances. After LOG filtering, the targets, highlighted edges, and corners are obtained. Local contrast can further suppress the background edge and enhance the target.
The mean value of cell elements in the central area of MPCM is , and the mean value of cell elements in the four directions around the central area is respectively . We design the LCM between the center cell as . The center cell gray is replaced by . The window sliding to the target area can enhance the brightness of the target. If sliding to the background area, the method suppresses the background intensity. When the target scale is not clear, a multi-scale feature map can obtain the maximum response with multi-scale. After the saliency feature map is obtained by preprocessing, the local enhanced contrast is calculated. Through designing a variety of scales, it has better robustness against a variety of different types of non-cooperative small targets, and it also plays a better role in suppressing Gaussian noise that only occupies a single pixel. Multi-scale contrast is expressed as the max value across all scales. This strategy has a good inhibitory effect on the bright background edge. However, it has a poor effect on the background corner. The target is in the red box, and the highlight strips and corners are in blue boxes through Figure 3. MPCM based on LOG effectively removes the highlight strips but still retains the corners.

Figure 3.
Detection results for LOG-MPCM in image .
2.3. Local Contrast Setting Based on LOG Saliency Map
Inspired by MPCM, we define a new local contrast as (4). Then we compute the multi-scale local contrast as (5).
is computed by (6). is the surrounding background in ith direction. For each direction, is computed by (7).
stands for the gray value of all elements in the target area. is the median value in the target area. is the gray value of all elements in the background area. Furthermore, is the median value in the background area. The mean value of the local corner area is almost the same as the median operation result. The surrounding area of the corner has greater brightness. It results in a smaller contrast in one or two directions, which can weaken the corner points. At the same time, it can also play a good role in suppressing the edge of the highlighted strip, while the median operation of the target and its surroundings is not affected and the local contrast remains unchanged. The target is in the red box. The highlight strips and corners are in blue boxes in Figure 4. As you see, the improved LCM based on LOG effectively removed highlight corners.

Figure 4.
Detection results for LOG-ILCM in image .
2.4. Fusion Method Based on Pixels
Combining two contrast results, the Hadamard product operation completes the pixel-level image fusion. Furthermore the image is normalized based on the non-uniform contrast in the local block. The median contrast could further enhance the target and suppress the bright background edges and local points of convergence with a lower false alarm rate. The final fusion result is . The 3D image of the fusion shows that the result accurately locates the small target, allowing for a higher detection rate under the same false alarm rate with threshold segmentation. As shown in Figure 5, bright buildings and strip backgrounds exist. After using the non-consistent contrast based on local blocks, the target and corner points are enhanced. The strip area and edge intensity decrease. Simultaneously, we calculate the local contrast of the image based on the median operation, and the bright corners of the building background are greatly reduced. After pixel-level fusion, we obtain the saliency map. The continuous highlight background is removed, as are the highlighted corners and stripes. The target enhancement and background suppression effects are significant. As you see, the improved LCM based on LOG effectively removed highlight corners. The fusion algorithm includes the following steps:

Figure 5.
Multi-scale local contrast fusion detection based on LOG in image .
- Adaptive LOG filtering is applied to the input image to remove the flat background and preserve the edges, corners of the bright background and the target;
- Update the local contrast of the pre-processed image based on intra-block inconsistency: ;
- Multi-scale local contrast update based on median for pre-processed image: ;
- Fusion of contrast calculation results to extract the target ;
- Using adaptive threshold detection, the target position can be obtained.
2.5. Evaluation
The most common detection evaluation metrics include SCRG, BSF, and the ROC curve, which are quantitative indices based on the subject standard. The SCRG is shown in Equation (8). It is defined by the SCR of the output image and the SCR of the original input image [2].
S is the mean difference between the whole image and the small target. C is the standard deviation of the whole image. and stand for the parameters of input images and output ones. BSF is defined by the standard deviation ratio of input images and output. It is shown in (9).
The ROC curve is composed of the detection rate and the false alarm rate. The detection rate is defined as the ratio of the number of real targets’ pixels detected to the number of targets’ pixels in frame sequences, as shown in (10).
TP is the real targets’ pixels. FP is the false detection pixels.
The false alarm rate is defined as the ratio of the number of targets’ pixels with false detection to the total number of targets’ pixels [22], as shown in (11).
Under complex clouds and building backgrounds, the target SCRG, BSF, and ROC curves are used to evaluate the image processing effect. The larger SCRG and BSF indicate better target enhancement and background suppression effects. The larger the area between the ROC curve and the abscissa, the better the detection rate that can be obtained under the same false alarm rate.
3. Results
The simulation uses MATLAB R2016a software and runs on a personal computer with an Intel Core i7 CPU and 16 GB RAM. The NUDT-SIRST1 dataset is a public IR image sequence for simulation analysis. The pixel size of the test images is 256 × 256, and each image contains highlighted buildings, background stripes, corners, etc. The test images include 1 to 3 targets. Some targets are submerged in the background, with poor contrast. The background of some targets is bright, which exceeds the target brightness. The characteristics of the test images are depicted in Table 1.

Table 1.
Features of image sequences.
The standard deviation of the multi-scale LOG operator could be set as , , , . The patch size used for multi-scale contrast is . The comparison of the max-mean filter, Tophat, MLCM [7], RLCM [10], MPCM [11], LMPCM [14], MDWCM [18], TTLCM [19] and our method is shown in Figure 6 for the image . The 3D mesh results of all methods are displayed in Figure 7 for the image . The detection results and 3D mesh results of image are in Figure 8 and Figure 9. Figure 10 and Figure 11 are for image . Figure 12 and Figure 13 are for image . Figure 14 and Figure 15 are for image . Figure 16 and Figure 17 are for image . Figure 18 and Figure 19 are for image . Figure 20 and Figure 21 are for image .
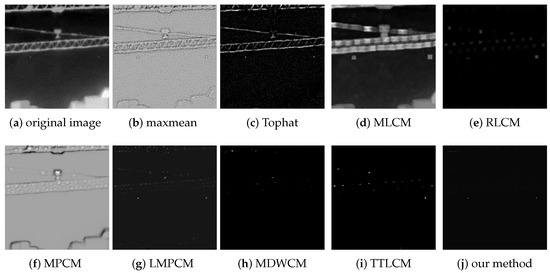
Figure 6.
Detection results comparison for different methods in image .
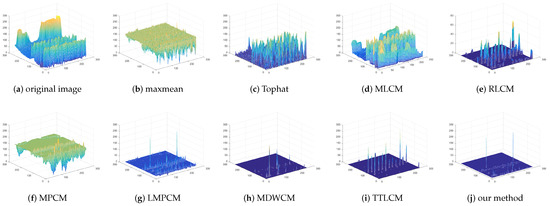
Figure 7.
3D mesh comparison for different methods in image .
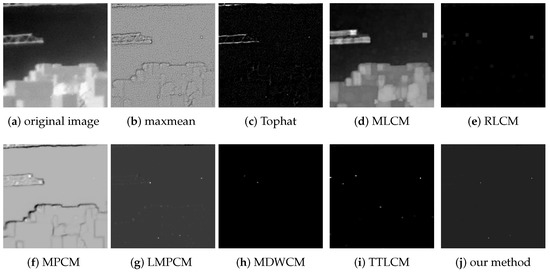
Figure 8.
Detection results comparison for different methods in image .
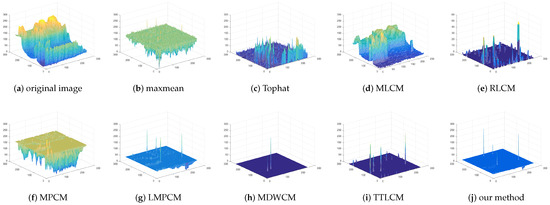
Figure 9.
3D mesh results for different methods in image .
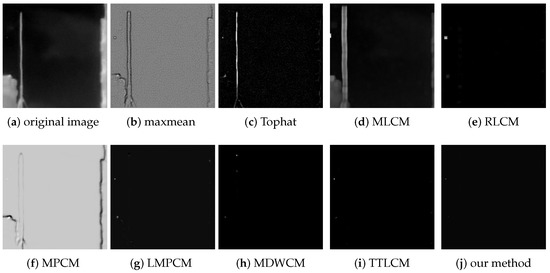
Figure 10.
Detection results comparison for different methods in image .
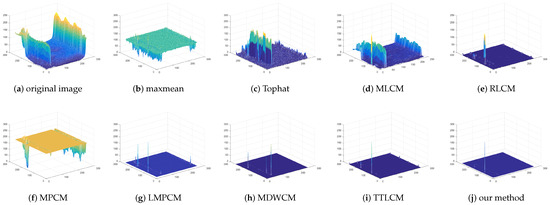
Figure 11.
3D mesh results for different methods in image .
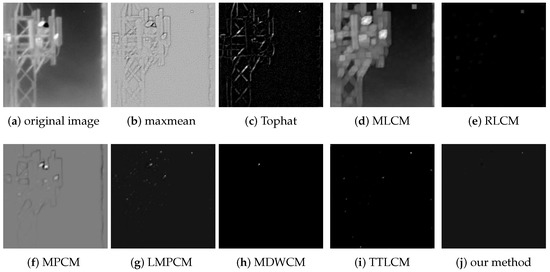
Figure 12.
Detection results comparison for different methods in image .
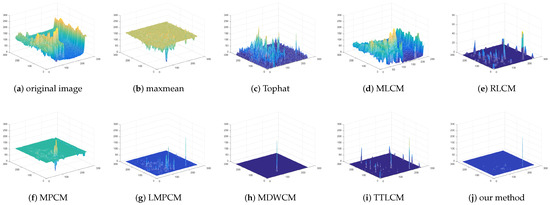
Figure 13.
3D mesh results for different methods in image .
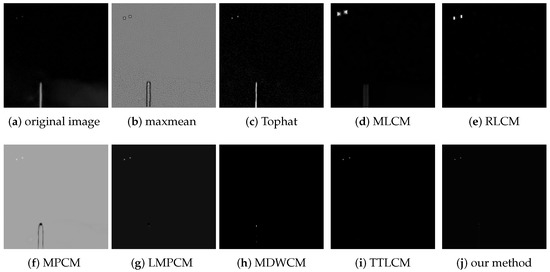
Figure 14.
Detection results comparison for different methods in image .
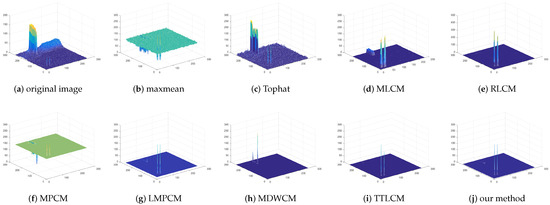
Figure 15.
3D mesh results for different methods in image .
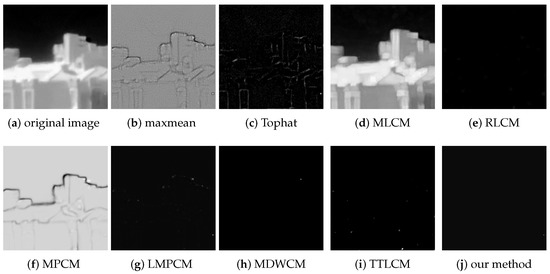
Figure 16.
Detection results comparison for different methods in image .
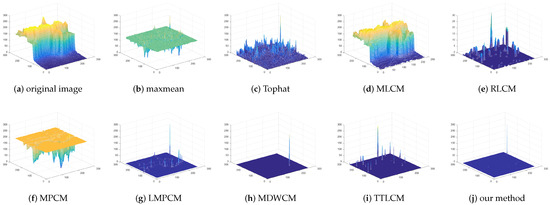
Figure 17.
3D mesh results for different methods in image .
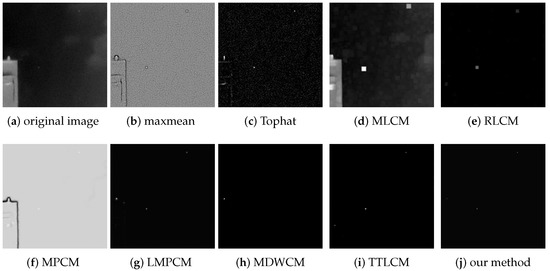
Figure 18.
Detection results comparison for different methods in image .
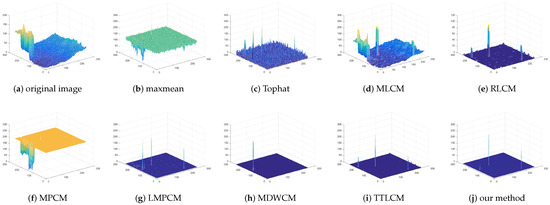
Figure 19.
3D mesh results for different methods in image .
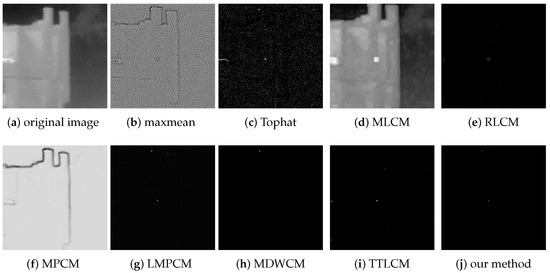
Figure 20.
Detection results comparison for different methods in image .
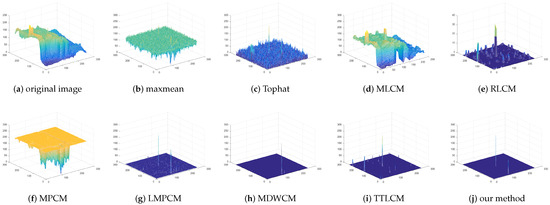
Figure 21.
3D mesh results for different methods in image .
The image comparison results show that the algorithm in this paper suppresses almost all backgrounds and removes most of the highlighted corners and strip edges. Compared with other commonly used methods, our method has a stable suppression effect through the 3D mesh results.
The max-mean filter, Tophat, MLCM, RLCM, MPCM, LMPCM, MDWCM, TTLCM, and our method are used to compare the objective evaluation effect under the complex background image sequences. The SCRG and BSF of the test images are shown in Table 2.

Table 2.
Comparison results of SCRG and BSF with different detection methods.
The simulation results show that by fusing the local contrast enhancement algorithm based on LOG, the SCRG of the complex background image frame sequence is greatly improved compared with the single space filtering or local contrast algorithm. The background of the actual infrared image sequence is effectively suppressed, which is more adaptable to the complex background.
Lastly, we finish the and calculations for the above image sequences and complete the ROC curve. The ROC curve is shown below in Figure 22. According to the results, the algorithm proposed in this paper can obtain a higher detection rate with a lower false alarm rate under complex circumstances.
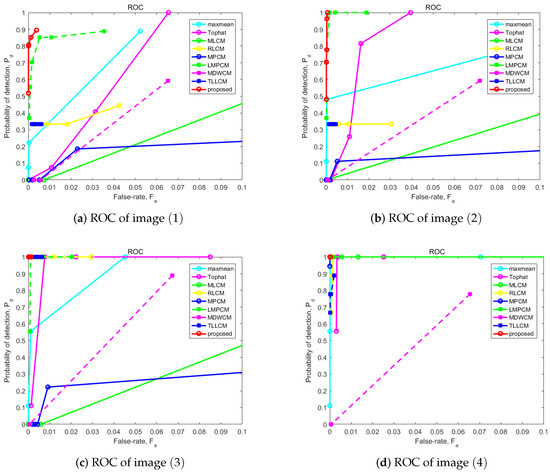
Figure 22.
ROC results for different methods in image sequences.
4. Discussion
We removed the bright strips and corners of the complex background through the fusion algorithm, which effectively suppressed the cluttered background. The algorithm adopts the pixel-level fusion method, which has high computational complexity and may miss some non-bright corners. Further improvements can be made to the problem.
5. Conclusions
It can be seen from the above test results that the background with a strong correlation can be filtered by using the LOG filtering method. Through the intra-block consistency comparison of local areas with different scales, small infrared targets, background edges, corners, and Gaussian white noise could be further distinguished. Through LOG filtering and local contrast double-layer pixel level fusion, the SCRG and BSF can be greatly improved. Meanwhile, we achieve the best detection rate with the same false alarm rate.
Author Contributions
Conceptualization, Z.Z. (Zhencai Zhu) and J.C.; methodology, J.C.; software, J.C. and L.Q.; validation, J.C., L.Q. and L.D.; formal analysis, Z.Z. (Zhenzhen Zheng); investigation, J.C.; resources, L.Q.; data curation, L.D.; writing—original draft preparation, J.C.; writing—review and editing, J.C.; visualization, J.C.; supervision, Z.Z. (Zhencai Zhu); project administration, Z.Z. (Zhencai Zhu); funding acquisition, H.H. All authors have read and agreed to the published version of the manuscript.
Funding
The paper is supported by the project of Military Commission Science and Technology Commission. The program is the Real-time detection technology based on little and dim space group targets. It is an important project which is devoting to searching the dim and small target in space. The project contract is NO.2020-JCJQ-ZD-052-00. It is also supported by Youth Innovation Promition Association of the Chinese Academy of Sciences under Grant 2022296.
Institutional Review Board Statement
Not applicable.
Data Availability Statement
The data sets are received from public IR image sequences. It contains 1327 pieces of training data and verification data. They are representative and covering complex background.
Acknowledgments
We get test data from public data sets.
Conflicts of Interest
We declare that we have no financial and personal relationships with other people or organizations that can inappropriately influence our work, there is no professional or other personal interest of any nature or kind in any product, service and/or company that could be construed as influencing the position presented in, or the review of, the manuscript entitled ‘Multi-scale Local Contrast Fusion Based on LOG in Infrared Small Target Detection’.
Abbreviations
The following abbreviations are used in this manuscript:
| BSF | background supression factor |
| DOG | deffrence of gaussians |
| DBT | Detect Before Track |
| FA | False Alarm |
| HVS | human visual system |
| HBMLCM | high-boost-based multi-scale LCM |
| IPI | Infrared Patch-Image |
| IR | infrared |
| ILCM | improved LCM |
| IOR | inhibition-of-return |
| LCM | local contrast method |
| LOG | Laplacian of gaussian |
| MLCM | multi-scale local contrast method |
| MPCM | Multi-scale patch-based contrast measure |
| MDWCM | Multidirectional Derivative-Based Weighted Contrast Measure |
| PID | passive infrared detector |
| ROC | receiver operating characteristic curves |
| RLCM | Multiscale Relative Local Contrast Measure |
| SCRG | signal to clutter rate gain |
| TBD | Track Before Detect |
| TTLCM | Tri-Layer local contrast method |
| WTA | winner-take-all |
References
- Ji, Q. The Research on Dim Small Target Detection in Infrared Image Sequences. Ph.D. Thesis, Harbin Engineering University, Harbin, China, 2007. [Google Scholar]
- Xu, J. Research on the Detection of Small and Dim Targets in Infrared Images. Ph.D. Thesis, Xidian University, Xi’an, China, 2008. [Google Scholar]
- Liu, Y. Research on IR Small Target Detection and Tracking Based on Attention MeChanism. Ph.D. Thesis, Harbin Engineering University, Harbin, China, 2009. [Google Scholar]
- Wang, D. Research on Infrared Weak Small Targets Detection and Tracking Technology under Complex Backgrounds. Ph.D. Thesis, Xidian University, Xi’an, China, 2010. [Google Scholar]
- Lin, Z. Research on Weak Target Track-Before-Detect Technologies for Space-Based Infrared Image. Ph.D. Thesis, National University of Defense Technology, Changsha, China, 2012. [Google Scholar]
- Jia, L. Infrared Image Background Suppression Based on Multiscale Generalized Fuzzy Operator. Semicond. Optoelectron. 2019, 401, 88–92. [Google Scholar]
- Chen, C.P.; Li, H.; Wei, Y.; Xia, T.; Tang, Y.Y. A Local Contrast Method for Small Infrared Target Detection. IEEE Trans. Geosci. Remote Sens. 2014, 521, 574–581. [Google Scholar] [CrossRef]
- Han, J.; Ma, Y.; Zhou, B.; Fan, F.; Liang, K.; Fang, Y. A robust infrared small target detection algorithm based on human visual system. IEEE Trans. Geosci. Remote Sens. Lett. 2014, 11, 2168–2172. [Google Scholar]
- Qin, Y.; Li, B. Effective infrared small target detection utilizing a novel local contrast method. IEEE Trans. Geosci. Remote Sens. Lett. 2016, 13, 1890–1894. [Google Scholar] [CrossRef]
- Han, J.; Liang, K.; Zhou, B.; Zhu, X.; Zhao, J.; Zhao, L. Infrared small target detection utilizing the multiscale relative local contrast measure. IEEE Geosci. Remote Sens. Lett. 2018, 15, 612–616. [Google Scholar] [CrossRef]
- Wei, Y.; You, X.; Li, H. Multiscale patch-based contrast measure for small target detection. Pattern Recognit. 2016, 58, 216–226. [Google Scholar] [CrossRef]
- Shi, Y.; Wei, Y.; Yao, H.; Pan, D.; Xiao, G. High boost based mutiscale local contrast measure for infrared small target detection. IEEE Geosci. Remote Sens. Lett. 2017, 99, 33–37. [Google Scholar]
- Wang, X.; Lv, G.; Xu, L. Infrared dim target detection based on visual attention. Infrared Phys. Technol. 2012, 55, 513–520. [Google Scholar] [CrossRef]
- Shao, X.; Fan, H.; Lu, G.; Xu, J. An improved infrared dim and small target detection algorithm based on the contrast mechanism of human visual system. Infrared Phys. Technol. 2012, 55, 403–408. [Google Scholar] [CrossRef]
- Nie, J.; Qu, S.; Wei, Y.; Zhang, L.; Deng, L. An infrared small target detection method based on multiscale local homogeneity measure. Infrared Phys. Technol. 2018, 90, 186–194. [Google Scholar] [CrossRef]
- Yu, X.W. Infrared small target detection method based on derivatives in different directions. Infrared Technol. 2012, 34, 351–355. [Google Scholar]
- Guan, X.; Peng, Z.; Huang, S.; Chen, Y. Gaussian Scale-Space Enhanced Local Contrast Measure for Small Infrared Target Detection. IEEE Geosci. Remote Sens. Lett. 2019, 17, 327–331. [Google Scholar] [CrossRef]
- Lu, R.; Yang, X.; Li, W.; Fan, J.; Li, D.; Jing, X. Robust Infrared Small Target Detection via Multidirectional Derivative-Based Weighted Contrast Measure. IEEE Geosci. Remote Sens. Lett. 2020, 19, 1–5. [Google Scholar] [CrossRef]
- Han, J.; Moradi, S.; Faramarzi, I.; Liu, C.; Zhang, H.; Zhao, Q. A Local Contrast Method for Infrared Small-Target Detection Utilizing a Tri-Layer Window. IEEE Geosci. Remote Sens. Lett. 2020, 17, 1822–1826. [Google Scholar] [CrossRef]
- Zhang, Z.C.; Meng, Q.H. Feature Analysis of Infrared Objects. Laser Infrared 1999, 29, 166–168. [Google Scholar]
- Kim, S.; Yang, Y.; Lee, J.; Park, Y. Small target detection utilizing robust methods of the human visual system for IRST. Waves 2009, 30, 994–1011. [Google Scholar] [CrossRef]
- Du, P.; Hamdulla, A. Infrared small target detection using homogeneity-weighted local contrast measure. IEEE Geosci. Remote Sens. Lett. 2019, 17, 514–518. [Google Scholar] [CrossRef]
Disclaimer/Publisher’s Note: The statements, opinions and data contained in all publications are solely those of the individual author(s) and contributor(s) and not of MDPI and/or the editor(s). MDPI and/or the editor(s) disclaim responsibility for any injury to people or property resulting from any ideas, methods, instructions or products referred to in the content. |
© 2023 by the authors. Licensee MDPI, Basel, Switzerland. This article is an open access article distributed under the terms and conditions of the Creative Commons Attribution (CC BY) license (https://creativecommons.org/licenses/by/4.0/).