Abstract
Generally, airplane upsets in flight are considered a precursor to loss of control in flight (LOC-I) accidents, and unfortunately LOC-I is classified as the leading cause of fatal accidents. To further explore the risk factors, causal relationships, and coupling mechanism of airplane upsets, this study proposed a risk analysis model integrating the Interpretative Structural Modeling (ISM) and Bayesian Network (BN). Seventeen key risk factors leading to airplane upsets were identified through the analysis of typical accident cases and the literature. The ISM approach was used to construct the multi-level interpretative structural model of airplane upsets, which could reveal the causal relationship among various risk factors and risk propagation paths. Then, taking 286 accident/incident investigation data as training samples, a data-driven BN model was established using machine learning for dependency intensity assessment and inference analysis. The results reveal that the interaction among risk factors of fatal accidents caused by airplane upsets is more significant than that of non-fatal accidents/incidents. Risk factors such as pilot-induced oscillations/airplane-pilot coupling and non-adherence to Standard Operating Procedures (SOPs)/neglect of cross-validation have a significant effect on airplane upsets in flight among seventeen risk factors. Moreover, this study also identifies the most likely set of risk factors that lead to fatal accidents caused by airplane upsets. The research results have an important theoretical significance and application value for preventing airplane upsets risk.
1. Introduction
An airplane upset was previously defined as a flight condition where the pitch of the airplane exceeded +25/−10 degrees or a bank angle exceeded ±45 degrees or the airplane flew within the aforementioned parameters but at inappropriate airspeeds [1]. However, the civil aviation industry considers this definition flawed because an aircraft’s controllability is related to its altitude. For example, an airplane may be controllable at low altitudes even with a bank angle of 30 degrees but may cause an accident at high altitudes [2]. As a result, the International Civil Aviation Organization (ICAO) has revised the definition of the airplane upset as follows: an unexpected airplane state with the characteristics of unintentional divergences from parameters normally experienced during operations, which may involve pitch and/or bank angle divergences as well as inappropriate airspeeds for the conditions [3]. An upset can even be considered to exist whenever an airplane is diverging from the pilot’s expectations [4]. In case of an airplane upset, the airplane may return to its normal flight state through natural airplane reaction to accelerations, automatic flight system response, or pilot intervention. If protective measures are not implemented positively and correctly, deviations from the normal flight state will become larger and may lead to LOC-I, causing a catastrophic accident [5]. ICAO and International Air Transport Association (IATA) also believe that an airplane upset will gradually evolve into three outcomes: recovery to a normal state, causing new errors, or leading to a LOC-I accident [3,6].
As a serious consequence of airplane upsets, LOC-I has been identified as one of the three high-risk accident categories in global commercial aviation and is even considered the most important cause of fatal accidents [7,8]. According to statistics from Boeing, there were 36 fatal flight accidents in commercial aviation worldwide between 2012 and 2021, resulting in 1738 deaths. Of these accidents, nine were caused by LOC-I and resulted in 757 deaths, accounting for approximately 43.6% of the total mortality rate [9]. IATA has statistically analyzed 777 flight accidents and selected the top 6 accident types based on severity, as shown in Figure 1 [8]. The results show that although LOC-I accidents account for only about 8% of commercial aircraft accidents; they have the highest fatality rate with 94% involving the deaths of passengers or crew members. This makes LOC-I a typical “low probability-high risk” accident type [10]. ICAO believes that although LOC-I accidents are uncommon, they often cause catastrophic consequences, with few survivors. Therefore, ICAO lists the prevention of LOC-I as one of its top safety priorities [1]. In fact, the vast majority of LOC-I accidents are caused by airplane upsets [11]. Therefore, it is very important to study the risk of airplane upsets and explore the risk evolution mechanism for improving flight safety.
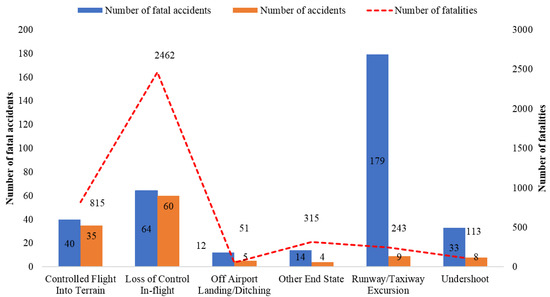
Figure 1.
Statistics of the top six fatal accident Categories [8].
The primary objectives of this study are as follows. Firstly, the key risk factors leading to airplane upsets are identified through the analysis of typical accidents and the literature. Secondly, a multi-level interpretative structural model of risk factors leading to airplane upsets is constructed using ISM theory to explore the interactions and causal relationships between various risk factors. Finally, a data-driven BN model is established using 286 commercial transportation aviation and general aviation accident/incident reports as sample data. BN parameters are obtained through machine learning to comprehensively analyze the risk evolution mechanism and coupling effect of risk factors leading to airplane upsets.
2. Literature Review
The civil aviation safety system is complex with risk factors involving employees, all kinds of equipment, the working environment, and the organization [12,13]. The civil aviation industry has reached a consensus that civil aviation accidents are often not caused by a single factor but by defects at various levels of the system in most cases [14,15]. Similarly, the risk factors leading to airplane upsets are complex and changeable. These risk factors interact with each other to form a nonlinear risk dynamic evolution process. Risks may spread simultaneously at multiple nodes of the system and if not intervened promptly may lead to an increasingly large deviation from the desired airplane state over time.
A study of historical accidents has found a variety of causes of airplane upsets, involving mechanical failures, icing, wakes, improper responses, spatial disorientation, and stalls [16]. Hyunseong Lee et al. [5] identify three main factors leading to airplane upsets: airborne equipment failures or design defects (33.3%), icing (21.4%), and inappropriate crew response (14.3%). A statistical report from the National Aeronautics and Space Administration (NASA) shows that pilots losing airplane state awareness (ASA) is closely related to auto flight confusion, invalid source data/loss of air data, distraction/attention allocation, inappropriate control actions, lack of external visual references, and ineffective crew resource management (CRM) [17]. ICAO believes that there are numerous reasons why upsets occur and summarizes them into three categories: environmentally induced, systems-induced, and pilot-induced [3]. The above studies have focused on active risk factors that cause airplane upsets but rarely involve the latent risk factors of management.
Since most LOC-I accidents result from airplane upsets, we have also analyzed the risk factors leading to LOC-I. IATA analyzed data on 64 LOC-I accidents from 2009 to 2018, which resulted in 2462 fatalities. The research results showed that in many cases the triggering factors of LOC-I accidents were the external environment, predominantly meteorological factors. However, pilots’ performance deficiencies often worsen the situation, making it difficult to recover until it was too late. In addition, insufficient training, inadequate safety management systems, and aircraft design defects were also considered potential threats that could lead to LOC-I accidents [10]. Jack Smith et al. [18] analyzed 46 general aviation LOC-I accidents in the UK from 2018 to 2019 based on the precursor sequence analysis model. The results showed that most non-fatal accidents were caused by inappropriate crew response after upsets, insufficient energy management, or improper procedures; fatal accidents were more likely to be irreparable due to dangerous mental or physical conditions or incorrect understanding of the situation, and more than half of the fatal accidents involved decision errors and skill errors.
Due to the severity of the consequences, some organizations and aircraft manufacturers had developed a series of measures and training strategies for airplane upset prevention and recovery [1,3,4,6], aimed at helping flight crews identify and avoid airplane upsets, taking appropriate and timely measures to prevent further divergence, and using airplane maneuvering techniques to recover from airplane upsets.
In summary, the existing research on airplane upsets mainly focused on two aspects: the identification of risk factors and preventive measures. Most studies conducted static and qualitative analysis through statistical historical accidents, but few studies involved the coupling mechanism of causal factors and the dynamic evolution of risks, which might lead to a lack of targeted and prioritized preventive measures. To explore the inherent correlation and coupling effects of airplane upset risk factors, this paper proposed a hybrid model integrating ISM and BN to achieve static analysis and dynamic prediction, which could provide theoretical guidance for airplane upset risk management.
3. Methodology
3.1. Framework of Methodology
To further clarify the evolution mechanism of airplane upsets, the key risk factors are identified based on the analysis of typical accident cases and the relevant literature. Then, the ISM and BN models are combined to construct a comprehensive risk assessment framework. The ISM model is mainly used to determine the interaction between risk factors and the path of risk transmission. The BN model can quantitatively analyze the interaction intensity of various risk factors and conduct a comprehensive risk assessment. The process diagram of the methodology is illustrated in Figure 2.
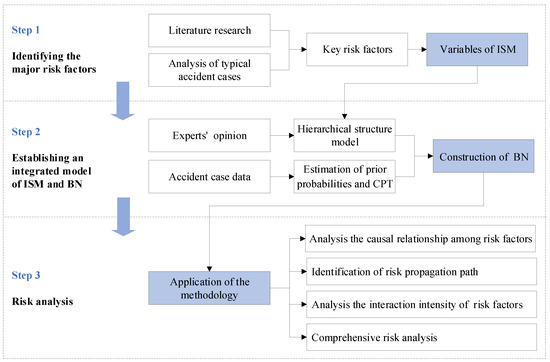
Figure 2.
The process diagram of the methodology.
3.2. Method Introduction
3.2.1. Interpretative Structural Modeling (ISM)
Interpretative structural modeling (ISM) is a structured modeling technology for system analysis proposed by Professor Warfield in 1974 [19]. Its basic idea is to decompose a complex system into several subsystems (elements), explore the causal relationship and correlation between various factors with the help of experts’ practical experience and knowledge, and finally, transform the complex system into a multi-level hierarchical relationship model through Boolean logic operations. The biggest advantage of ISM is to transform fuzzy concepts and views into hierarchical topology with good structural relations without losing system functions. The causal hierarchy and correlation of complex system factors can be clearly understood through the hierarchy diagram. Therefore, ISM is more suitable for system analysis with many factors, complex relationships, and fuzzy structure and has become a widely used analysis method in modern system engineering [20,21].
The calculation steps of ISM are as follows [22,23]:
Step 1: Identify the set of factors that affect the system. Usually, these variables can be identified from existing literature or through exploratory research.
Step 2: Determine the adjacency matrix A. For complex systems, there are usually two kinds of relationships between variables: direct influence or indirect influence. The knowledge and experience of experts are usually used to judge whether there is a direct correlation between variables. For aij, if variable Si has an impact on variable Sj, aij = 1; if not, aij = 0. When i = j, aij = aji = 0. Then, the adjacency matrix A can express the relationship between n variables of the system by using 1 and 0, as shown in Equation (1).
Step 3: Determine the reachability matrix M. The reachability matrix M refers to the degree to which different variables in a digraph can reach each other through a certain length of the path. The adjacency matrix A and the identity matrix E are carried out matrix power operation until Equation (2) is satisfied; then, the reachable matrix M can be calculated, as shown in Equation (3). In the reachability matrix M, the variable with the value “1” indicates that there is a path from one variable to another; that is, one variable has a direct impact on another variable. The variable with the value “0” indicates that there is no path from that variable to another, and there is no direct relationship between them. The identity matrix E can be presented in Equation (4).
Step 4: Divide the hierarchy of variables.
The hierarchical division of variables is the basis for establishing a multi-level structure model [24]. Based on the reachability matrix M, the reachability set R(Si) (the set of all variables that can be reached from Si), the antecedent set A(Si) (the set of all variables that can reach Si), and the common set C(Si) can be obtained, which can be expressed as Equations (5)–(7).
Then, the same variables in the reachability set R(Si) and the common set C(Si) are found and used as the first level of the ISM. After deleting the rows and columns of all variables of the first level from the reachability matrix M, a new reachability matrix M’ is formed. By repeating the above steps, all variables at each level can be found.
Step 5: Establish a multi-level hierarchical structure model. A multi-level hierarchical structure model can be obtained by layering the variables according to the hierarchical order and then connecting the interaction relationship between the variables with the directed vector line [25].
3.2.2. Bayesian Network (BN)
A Bayesian Network, also known as belief network, is a directed acyclic graph (DAG) model that combines probability theory and graph theory, which is considered a powerful method in the field of uncertainty reasoning. The distinct advantage of a Bayesian Network is its strong ability in uncertainty reasoning, representing the correlation of nodes and updating probabilities [26,27,28,29], so it has been widely used in the field of risk assessment [30,31,32].
A Bayesian Network is composed of nodes, the directed edges connecting these nodes, and the strength of dependencies between nodes, where the nodes represent variables, the directed edges represent the direct causal relationship between link nodes, and the Conditional Probability Tables (CPTs) assigned to nodes specifies the degree of interaction between link nodes [33,34]. A typical Bayesian Network structure is shown in Figure 3, where node A and node B are root nodes and also the parent nodes of node C, node E is the child node of node C, and node D is the leaf node.
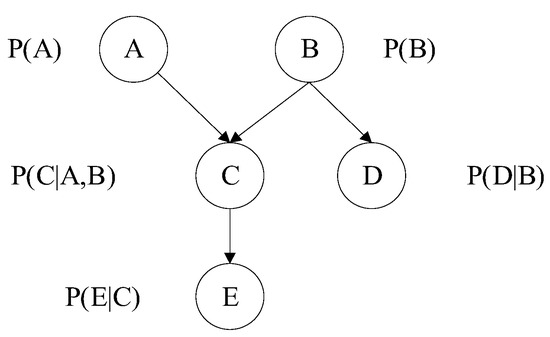
Figure 3.
Typical Bayesian Network diagram.
Each BN can be represented by N = {(V, E), P}, where “V” is a set of nodes (X1, X2, X3, …, Xn), “E” represents a set of the directed edges, and “P” represents the joint probability of the network. “P” can be expressed in Equation (8).
After obtaining new information (also known as evidence) through investigation, statistical analysis, or other methods, the BN needs to update and revise the prior probabilities of nodes to obtain more realistic probabilities [35].
where P(Ai) and P(B) represent the prior probabilities of occurring for Ai and B, respectively; P(Ai|B) represents the probability of Ai given B; P(B|Ai) is the probability of B given Ai.
3.2.3. Converting ISM Model to BN Structure
To convert an ISM model into a BN structure, the following rules need to be met [36]: (1) nodes transformation. The corresponding variables in ISM model are converted into BN nodes. (2) Structure transformation: the hierarchical structure of each variable in ISM model is converted into BN structure. (3) Directional edges transformation: the causal relationship between variables in ISM model is converted into BN directional edges.
4. Application of the Methodology
4.1. Identifying Key Risk Factors
Airplane upsets are the result of the nonlinear and dynamic evolution of risk under the interaction of various risk factors [14]. To ensure the reliability and accuracy of the study, we mainly adopt two methods to extract the main risk factors that lead to airplane upsets: (1) by sorting and analyzing the research literature in Section 2, the risk factors were preliminarily extracted; (2) retrospective analysis and classification analysis were carried out on the 72 investigation reports of typical accidents or incidents in 2000–2020 (40 commercial transport aviation investigation reports and 32 general aviation investigation reports) caused by airplane upsets. Finally, seventeen key risk factors were identified, involving flight crew, aircraft equipment, flight environment, and organization management, as shown in Table 1.

Table 1.
Key risk factors leading to airplane upsets.
4.2. Construction of ISM
The interaction among various risk factors that lead to airplane upsets is relatively complex, and the direct correlation among the factors is different. To accurately judge the interaction between various risk factors in Table 1, 10 experts in the field of civil aviation safety management were invited to score according to Equation (1), including 4 senior flight captains, 4 civil aviation safety management experts, and 2 scholars in the field of aviation human factors engineering. If experts believed that variable Si has a direct impact on variable Sj, the score would be 1; otherwise, it would be 0. Based on the scoring results of 10 experts, if 8 or more experts scored 1, the final result was 1; otherwise, it was 0. Finally, the adjacency matrix A could be obtained, as shown in Table 2.

Table 2.
The adjacency matrix A.
The reachability matrix M could be obtained by matrix power operation of the adjacency matrix A and the identity matrix E according to Equation (2), as shown in Table 3.

Table 3.
The reachability matrix M.
According to step 4 in Section 3.2.1, all risk factors were selected and classified in turn, and the results are shown in Table 4.

Table 4.
Risk factor hierarchy results.
According to Table 3 and Table 4, a multi-level interpretative structural model of risk factors leading to airplane upsets could be drawn, as shown in Figure 4.
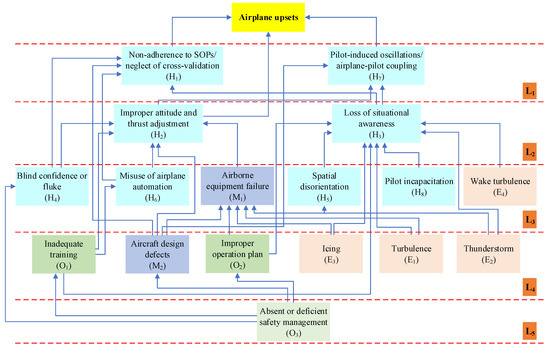
Figure 4.
The multi-level interpretative structural model of risk factors leading to airplane upsets.
4.3. Construction of BN
4.3.1. Determination of BN Topology and Node States
The multi-level interpretive structure model in Figure 4 was mapped into BN structure by Netica 6.0 (NORSYS software corp., Vancouver, BC, Canada), as shown in Figure 5. Node T represented the event of an airplane upset.
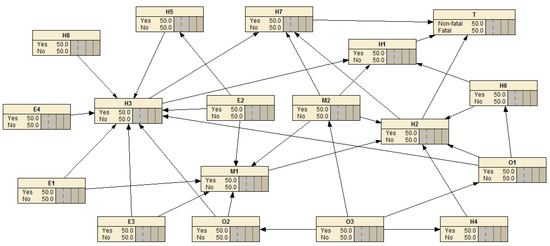
Figure 5.
BN structural model of risk factors leading to airplane upsets.
For simplification, the states of node T were set as “non-fatal” and “fatal”, and the states of other nodes were set as yes/no based on the characteristic of the nodes.
4.3.2. Determination of BN Parameters
The determination of Bayesian Network parameters is the basis for quantifying the causal relationship and dependency relationship between things, including the prior probability of nodes and the conditional probability table of non-root nodes [42]. There are usually two methods to determine the parameters of Bayesian Network: (1) BN parameters are estimated by experts in the field based on knowledge and experience, and the results are subjective [43]; (2) in the case of obvious conditional dependence of causality, BN parameters can be obtained from training sample data by machine learning, which has the advantage of small deviations [44]. Because we had obtained dependencies among risk factors leading to airplane upsets by ISM model, a second method was used to determine the BN parameters to ensure the accuracy of the results.
Obtaining BN parameters based on the machine learning method has strict requirements for training sample data. We selected 286 accidents/incidents caused by aircraft upsets from the accident database from 1995 to 2023 as training samples, involving 169 commercial transport aviation accidents/incidents and 117 general aviation accidents/incidents. Similarly, these accident reports were extracted from the aviation accident database of the National Transportation Safety Board (NTSB), the Aviation Safety Network, SKYbrary, and the Aviation Safety Information System of China. Among them, 240 accidents/incidents were used as training samples for BN model parameter learning. Another 46 accidents/incidents were used as validation samples for the prediction accuracy of the model. For some accident reports with missing information, we used the EM (Expectation-Maximization) algorithm to quantify BN parameters, which could effectively deal with missing data and hidden variables in the training samples. The training sample data were structured and imported into Netica software to obtain the learning results of BN parameters, as shown in Figure 6.
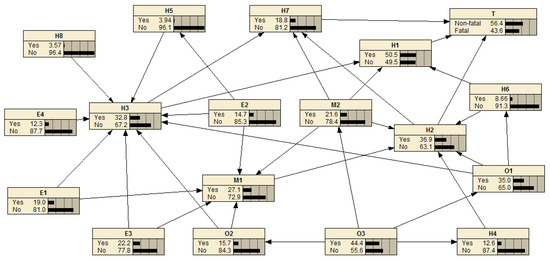
Figure 6.
Learning results of BN parameters.
At the same time, the CPTs of non-root nodes could also be obtained by learning the training sample data. An example of CPT of node T was shown in Figure 7.

Figure 7.
The CPT of node T.
4.3.3. Model Verification
To further verify the accuracy of the training model, the data of 46 accidents/incidents were input into the Netica software as validation samples. Then, the output results were compared with the actual rate of the 46 accidents/incidents. The verification results were mainly judged according to the error rate of the model. The error rate of the model was calculated by the following formula [45]:
where refers to the total number of samples whose predicted values are inconsistent with the actual accidents/incidents; refers to the total number of samples whose predicted values are consistent with the actual accidents/incidents.
The output results were shown in Table 5. The calculation results showed that the error rate was 8.7%, indicating that the prediction results of the BN model had certain accuracy, which was basically consistent with the actual situation.

Table 5.
The results of model verification.
5. Results and Discussion
5.1. Analysis of Multi-Level Interpretative Structural Model
The multi-level interpretative structural model of airplane upsets provides a visualization of the interaction and interdependence among various risk factors, as shown in Figure 4. The structural model is divided into five levels and can guide management priorities and preventive measures. The risk factors in L1 are considered to be the direct factors leading to airplane upsets, including non-adherence to SOPs/neglect of cross-validation (H1) and pilot-induced oscillations/airplane-pilot coupling (H7). These two factors are also recognized as the most direct and perceptible risk factors that lead to airplane upsets. L2, L3, and L4 are in the middle position, including 14 risk factors, which are indirect factors. Such factors are mainly reflected in the high coupling effect of various risk factors of “human-machine-environment-organization”. They play a connecting role in the whole process and are the necessary conditions for airplane upsets and need to be paid attention to. Absent or deficient safety management (O3) is divided into L5, which is the deep factor leading to airplane upsets. In other words, absent or deficient safety management (O3) ultimately leads to airplane upsets through influencing indirect and direct factors, so it is often considered the deepest and most fundamental (but often overlooked) risk factor and should also be given the highest management priority. In addition, some exogenous variables, such as turbulence (E1), thunderstorms (E2), icing (E3), and wake turbulence (E4), are not pointed to by other risk factors according to Figure 4, indicating that they are less affected by other risk factors. However, it does not mean that these risk factors are not important. In fact, meteorological risks will lead to aircraft failure, wing pollution, and large deviation in airspeed, altitude, or attitude, which will seriously affect aircraft performance and the flight crew’s situational awareness. Since the flight crew cannot change the environment, meteorological risks should be closely monitored, and effective response measures should be taken promptly.
The multi-level interpretative structural model can also reflect the main risk transmission paths (accident chains) of the interaction among the risk factors that lead to airplane upsets, such as O3 → H4 → H1 → airplane upsets. This transmission path can be explained as follows: due to insufficient safety supervision of airlines, some violations of the flight crew cannot be corrected in time. Over time, these violations are rationalized by some pilots, leading to their weak safety awareness [41]. When these pilots face some emergencies, they tend to have a bad psychological state (such as blind confidence and flawed mindset) and will not strictly follow the SOP procedures and cross-check the instrument status of the aircraft [15,46], which may eventually lead to an airplane upset. The diversity of risk transmission paths reveals the complexity of the coupling among risk factors. Managers need to take targeted precautions against these transmission paths, weaken the positive role of each path, and prevent the further evolution of risks.
5.2. Analysis of BN Model
5.2.1. Inference Analysis
The inference analysis of BN includes causal reasoning (the result is derived from the causes) and diagnostic reasoning (when the result is known, find out the possibility of various causes) [45]. This study mainly uses BN’s bottom-up diagnostic reasoning ability. To this end, we set the values of the two states of node T (non-fatal and fatal) to 100%, respectively, to obtain the posterior probability of each node in the two scenarios, as shown in Figure 8.
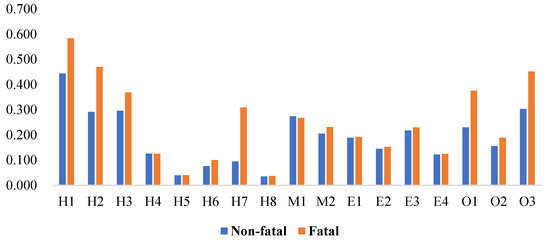
Figure 8.
The posterior probability of each node in two states of node T.
It can be seen from Figure 7 that the posterior probability of each node T with the “fatal” state is basically greater than that of node T with the “non-fatal” state, which shows that the interaction of various risk factors resulting in the fatal accidents caused by airplane upsets is more significant. At the same time, we can also infer the probability of failure of each node based on the posterior probability.
5.2.2. Sensitivity Analysis
The sensitivity analysis of the Bayesian Network is used to quantify the change of output probability of the target node due to local parameter changes and to identify sensitive nodes in the model [47]. The Netica software measures the sensitivity of nodes by calculating the mutual information, the percent, and the variance of belief as indicators. The larger the value, the more sensitive the node is. To identify the most sensitive risk factors of node T, the T node is set as the target node in the Netica software, and the calculation results are shown in Table 6.

Table 6.
Results of the sensitivity analysis.
According to Table 6, it can be seen that pilot-induced oscillations/airplane-pilot coupling (H7), improper attitude and thrust adjustment (H2), non-adherence to SOPs/neglect of cross-validation (H1), loss of situational awareness (H3), and inadequate training (O1) are the top five sensitive risk factors for node T. When the values of these five nodes are set to “Yes = 100%” in the Netica software, the result shows that the probability value of node T with the “fatal” state has increased from 43.6% to 70%, as shown in Figure 9. The result of sensitivity analysis shows that strengthening the training of flight crew’s technical skills (ability to control the aircraft) and non-technical skills (situational awareness) and improving the level of flight crew’s safety awareness (adherence to SOPs/cross-validation) have significant effects on preventing airplane upsets.
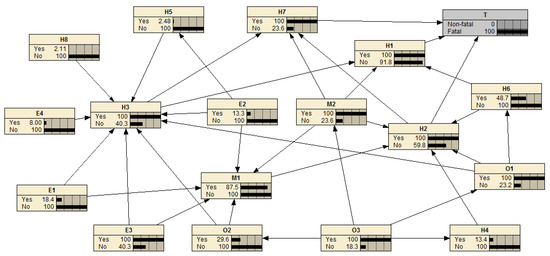
Figure 9.
Sensitivity analysis results.
5.2.3. Most Probable Explanation
A Bayesian Network can be used as the most probable explanation (MPE) function in the Netica software to identify the risk factor set that is most likely to lead to a specific result [48,49]. To identify the risk factor set that is most likely to lead to airplane upset fatalities, the “fatal” state of node T was set to 100%, and then the “Most Probable Explanation” function in Netica software was used to obtain the results. The results show that the most likely risk factor set is {O3, O1, M2, E3, H1, H2, H3, H7} when an airplane upset fatality occurs, as shown in Figure 10. This conclusion is highly consistent with the current scientific understanding of airplane upset accidents. Therefore, BN’s reverse reasoning ability can provide a scientific basis for the risk management of airplane upsets.
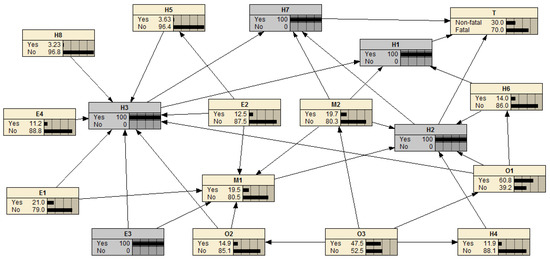
Figure 10.
The results of MPE.
5.3. Managerial Implications
With the findings, this paper identifies the causal relationships and interaction mechanisms that cause airplane upsets, and the effects of various risk factors are complex and nonlinear, which can serve as a useful reference. To implement targeted training and prevent airplane upsets, the following suggestions are provided.
(1) Compared to meteorological and equipment factors, human factors have a greater impact on the evolution of airplane upsets. Therefore, the flight crew must constantly strengthen their safety awareness and implement active and effective monitoring during flight. As can be seen from Figure 4 and Figure 8, non-adherence to SOPs/neglect of cross-validation is an important cause of airplane upsets. The blind confidence and fluke mentality of the flight crew can easily lead to operational behaviors that deviate from regulations and procedures, and it is necessary to eliminate these negative psychological states. Active and effective monitoring refers to monitoring the external environment, the airplane’s current energy state, the flight performance of other crew members, and flight path trajectory. This can enable crew members to improve situational awareness, predict future aircraft states, promptly detect deviations, and take proactive corrective measures. In short, the flight crew should establish a belief that everyone will make mistakes, even pilots with considerable experience and training, and should maintain vigilance at all times during the flight.
(2) Airlines should develop a comprehensive and standardized evidence-based training (EBT) program for airplane upsets so that the crew members can master upset recovery technologies, including technical skills (energy management of airplanes), non-technical skills (situational awareness and threat and error management), and emergency management capabilities. Once an airplane upset occurs, the flight crew can correctly assess the airplane’s energy state, arrest any flight path deviation, and recover to a stabilized flight path before an extreme upset ever occurs. Using the certified FSTD (Flight Simulation Training Device) for airplane upsets training is an effective method. Various high-fidelity scenarios can be simulated on the simulator devices, such as adverse weather, spiral dive, stall, mechanical failure, etc., to improve the flight crew’s capabilities of upset prevention and recovery. Airlines should make full use of pilots’ daily flight and training data, establish a data-driven early warning mechanism for airplane upsets, find out the ability defects of pilots in time, and provide relevant references for flight training.
(3) Organizational deficiencies are often considered the greatest potential threat to civil aviation safety. Although the risk factors that lead to airplane upsets involve the flight crew, meteorological environment, and equipment, these risk factors are more or less related to deficiencies in organizational management. Airlines should establish the concept of system safety, strengthen supervision, improve the construction of the supervision system, and cultivate an excellent safety culture.
(4) Airborne equipment failure and aircraft design defects are also important risk factors that cannot be ignored, especially aircraft design defects, which can make it difficult for the flight crew to understand and handle emergencies. Therefore, in addition to strengthening regulation, future technology-based solutions are needed, such as automatic energy management systems and improved airplane health monitoring systems.
6. Conclusions
Numerous risk factors lead to airplane upsets, including active risk factors (equipment failure, operation errors, or meteorological factors), as well as latent risk factors (management defects). This study proposes an integrated model based on ISM-BN to identify the key risk factors that lead to airplane upsets and explore the causal relationship and interaction mechanism. This method cannot only systematically and comprehensively analyze the mechanism of airplane upsets but also provide targeted and prioritized preventive measures for airplane upsets risk management. The primary conclusions and contributions are as follows.
(1) Based on the analysis of typical accident cases and the literature, seventeen key risk factors leading to airplane upsets have been identified, involving flight crew, equipment, meteorology, and organization.
(2) The multi-level interpretative structural model of airplane upsets is constructed by using ISM model, which can provide a visualization of the interaction and interdependence among various risk factors. Non-adherence to SOPs/neglect of cross-validation (H1) and pilot-induced oscillations/airplane-pilot coupling (H7) is recognized as one of the most direct and perceptible risk factors, and absent or deficient safety management (O3) is considered the deepest and most fundamental (but often overlooked) risk factor. In addition, the multi-level interpretative structural model can also reflect the multiple risk transmission paths (accident chains), revealing the complexity of the airplane upsets mechanism.
(3) Taking 286 commercial transport aviation and general aviation accident/incident reports as sample data, BN parameters are obtained by machine learning, and a data-driven BN model is established. BN’s powerful reasoning ability is used to conduct an in-depth analysis of the mechanism of airplane upsets, including inference analysis, sensitivity analysis, and MPE analysis. The results show that the interaction among risk factors of fatal accidents caused by airplane upsets is more significant than that of non-fatal accidents/incidents. Among them, pilot-induced oscillations/airplane-pilot coupling (H7), improper attitude and thrust adjustment (H2), non-adherence to SOPs/neglect of cross-validation (H1), loss of situational awareness (H3), and inadequate training (O1) are listed as the top five most sensitive risk factors. The MPE analysis results show that the most likely risk factor set leading to an airplane upset fatality is absent or deficient safety management (O3), inadequate training (O1), aircraft design defects (M2), icing (E3), non-adherence to SOPs/neglect of cross-validation (H1), improper attitude and thrust adjustment (H2), loss of situational awareness (H3), and pilot-induced oscillations/airplane-pilot coupling (H7).
The ISM-BN method is feasible and effective in analyzing the mechanism of airplane upsets, and the research can be used as an important theoretical basis for formulating the risk management strategy for airplane upsets. However, this study still has some limitations. For the accidents/incidents caused by airplane upsets, we only roughly divided the node states into fatal and non-fatal and did not strictly divide them according to the severity level. This is because BN is a probabilistic model, which requires more extensive basic data to improve the reliability for a more detailed classification of node states. Similarly, the machine learning algorithm also needs a larger sample size to obtain high-precision BN parameters. Although our sample data range has been expanded to 1995–2023, the total number of accidents reported is still limited. Therefore, further research is needed in the following areas: (1) more accident investigation reports should be collected as a supplement to improve the accuracy of BN model; (2) the accidents/incidents caused by aircraft upsets will be divided into commercial transport aviation and general aviation, and more detailed statistical analysis will be carried out according to the severity; (3) new training protocols will be developed based on the above research to prevent airplane upsets and LOC-I.
Author Contributions
Conceptualization, methodology, N.L. and B.M.; software, validation, formal analysis, N.L.; investigation, resources, data curation, B.M.; writing—original draft preparation, N.L.; writing—review and editing, B.M.; visualization, N.L.; supervision, project administration, funding acquisition, B.M. All authors have read and agreed to the published version of the manuscript.
Funding
This research was funded by the 2023 Henan Province key R&D and Promotion Special Project (Grant No. 232102240101).
Institutional Review Board Statement
Not applicable.
Informed Consent Statement
Not applicable.
Data Availability Statement
Data are contained within the article.
Conflicts of Interest
The authors declare no conflict of interest.
References
- ICAO. Doc 10011, AN/506, Manual on Aeroplane Upset Prevention and Recovery Training; International Civil Aviation Organization: Montreal, QC, Canada, 2014; Available online: https://www.icao.int/APAC/RASG/eDocs/Doc10011%20-%20Manual%20on%20Aeroplane%20Upset%20Prevention%20And%20Recovery%20Training.pdf#search=Manual%20on%20Aeroplane%20Upset%20Prevention%20and%20Recovery%20Training (accessed on 23 January 2022).
- Lambregts, A.; Nesemeier, G.; Newman, R.; Wilborn, J. Airplane upsets: Old problem, new issues. In Proceedings of the AIAA Modeling and Simulation Technologies Conference and Exhibit, Honolulu, HI, USA, 18–21 August 2008. [Google Scholar]
- ICAO. Airplane Upset Prevention and Recovery Training Aid (AUPRTA); International Civil Aviation Organization: Montreal, QC, Canada, 2017; Available online: https://www.icao.int/safety/LOCI/AUPRTA/index.html (accessed on 23 January 2022).
- CAAC. Training Guidance Materials for Airplane Upsets Prevention and Recovery of Transport Category Airplanes; Civil Aviation Administration of China: Beijing, China, 2018. Available online: http://www.caac.gov.cn/XXGK/XXGK/GFXWJ/201811/P020181127320988031769.pdf (accessed on 23 January 2022).
- Lee, H.; Lim, H.J.; Chattopadhyay, A. Data-driven system health monitoring technique using autoencoder for the safety management of commercial aircraft. Neural Comput. Appl. 2021, 33, 3235–3250. [Google Scholar] [CrossRef]
- IATA. Guidance Material and Best Practices for the Implementation of Upset Prevention and Recovery Training; International Air Transport Association: Montreal, QC, Canada, 2018; Available online: https://www.iata.org/contentassets/b6eb2adc248c484192101edd1ed36015/gmbp_uprt.pdf (accessed on 23 January 2022).
- Kelly, D.; Efthymiou, M. An analysis of human factors in fifty controlled flight into terrain aviation accidents from 2007 to 2017. J. Saf. Res. 2019, 69, 155–165. [Google Scholar] [CrossRef] [PubMed]
- IATA. Loss of Control In-Flight Accident Analysis Report; International Air Transport Association: Montreal, QC, Canada, 2019; Available online: https://www.iata.org/contentassets/b6eb2adc248c484192101edd1ed36015/loc-i_2019.pdf (accessed on 25 January 2022).
- The Boeing Company. Statistical Summary of Commercial Jet Airplane Accidents: Worldwide Operations 1959–2021; The Boeing Company: Chicago, IL, USA, 2022. [Google Scholar]
- Serrano-Mira, L.; Pérez Maroto, M.; Ayra, E.S.; Pérez-Castán, J.A.; Liang-Cheng, S.Z.Y.; Gordo Arias, V.; Pérez-Sanz, L. Identification and Quantification of Contributing Factors to the Criticality of Aircraft Loss of Separation. Aerospace 2022, 9, 513. [Google Scholar] [CrossRef]
- Yildiz, A.; Akcal, M.U.; Hostas, B.; Ure, N.K. Switching control architecture with parametric optimization for aircraft upset recovery. J. Guid. Control Dynam. 2019, 42, 2055–2068. [Google Scholar] [CrossRef]
- Boyd, D.D.; Scharf, M.; Cross, D. A comparison of general aviation accidents involving airline pilots and instrument-rated private pilots. J. Saf. Res. 2021, 76, 127–134. [Google Scholar] [CrossRef]
- Ji, M.; Yang, C.; Li, Y.; Xu, Q.; He, R. The influence of trait mindfulness on incident involvement among Chinese airline pilots: The role of risk perception and flight experience. J. Saf. Res. 2018, 66, 161–168. [Google Scholar] [CrossRef] [PubMed]
- Meng, B.; Lu, N. A hybrid model integrating HFACS and BN for analyzing human factors in CFIT accidents. Aerospace 2022, 9, 711. [Google Scholar] [CrossRef]
- Shappell, S.A.; Wiegmann, D.A. Applying Reason: The human factors analysis and classification system (HFACS). Hum. Factors Aerosp. Saf. 2001, 1, 59–86. [Google Scholar]
- Crider, D.A. Upset recovery training: Lessons from accidents and incidents. Aeronaut. J. 2010, 114, 629–636. [Google Scholar] [CrossRef]
- Mumaw, R.J.; Billman, D.; Feary, M. Factors That Influenced Airplane State Awareness Accidents and Incidents. In CAST SE-210 Output 2; National Aeronautics and Space Administration: Washington, DC, USA, 2019. [Google Scholar]
- Smith, J.; Bromfield, M.A. General Aviation Loss of Control in Flight Accidents: Causal and Contributory Factors. J. Air Transp. 2022, 30, 137–153. [Google Scholar] [CrossRef]
- Warfield, J.N. Toward interpretation of complex structural models. IEEE Trans. Syst. Man Cybern. Part B (Cybern.) 1974, 4, 405–417. [Google Scholar] [CrossRef]
- Attri, R.; Dev, N.; Sharma, V. Interpretive structural modelling (ISM) approach: An overview. Res. J. Manag. Sci. 2013, 2319, 1171. [Google Scholar]
- Liu, P.; Li, Q.; Bian, J.; Song, L.; Xiahou, X. Using interpretative structural modeling to identify critical success factors for safety management in subway construction: A China study. Int. J. Environ. Res. Public Health 2018, 15, 1359. [Google Scholar] [CrossRef] [PubMed]
- Han, Y.; Zhu, Q.; Geng, Z.; Xu, Y. Energy and carbon emissions analysis and prediction of complex petrochemical systems based on an improved extreme learning machine integrated interpretative structural model. Appl. Therm. Eng. 2017, 115, 280–291. [Google Scholar] [CrossRef]
- Kaswan, M.S.; Rathi, R. Analysis and modeling the enablers of green lean six sigma implementation using interpretive structural modeling. J. Clean. Prod. 2019, 231, 1182–1191. [Google Scholar] [CrossRef]
- Qin, M.; Wang, X.; Du, Y. Factors affecting marine ranching risk in China and their hierarchical relationships based on DEMATEL, ISM, and BN. Aquaculture 2022, 549, 737802. [Google Scholar] [CrossRef]
- Meng, B.; Lu, N.; Lin, C.; Zhang, Y.; Si, Q.; Zhang, J. Study on the influencing factors of the flight crew’s TSA based on DEMATEL–ISM method. Cogn. Technol. Work 2022, 24, 275–289. [Google Scholar] [CrossRef]
- Li, M.; Wang, H.; Wang, D.; Shao, Z.; He, S. Risk assessment of gas explosion in coal mines based on fuzzy AHP and bayesian network. Process Saf. Environ. 2020, 135, 207–218. [Google Scholar] [CrossRef]
- Hossain, N.U.I.; El Amrani, S.; Jaradat, R.; Marufuzzaman, M.; Buchanan, R.; Rinaudo, C.; Hamilton, M. Modeling and assessing interdependencies between critical infrastructures using Bayesian network: A case study of inland waterway port and surrounding supply chain network. Reliab. Eng. Syst. Saf. 2020, 198, 106898. [Google Scholar] [CrossRef]
- Chen, G.; Ge, Z. Robust Bayesian networks for low-quality data modeling and process monitoring applications. Control Eng. Pract. 2020, 97, 104344. [Google Scholar] [CrossRef]
- Khakzad, N.; Khan, F.; Amyotte, P. Safety analysis in process facilities: Comparison of fault tree and Bayesian network approaches. Reliab. Eng. Syst. Saf. 2011, 96, 925–932. [Google Scholar] [CrossRef]
- Mirzaei Aliabadi, M.; Aghaei, H.; Kalatpour, O.; Soltanian, A.R.; Nikravesh, A. Analysis of human and organizational factors that influence mining accidents based on Bayesian network. Int. J. Occup. Saf. Ergo. 2020, 26, 670–677. [Google Scholar] [CrossRef]
- Zhang, X.; Mahadevan, S. Bayesian network modeling of accident investigation reports for aviation safety assessment. Reliab. Eng. Syst. Saf. 2021, 209, 107371. [Google Scholar] [CrossRef]
- Uğurlu, F.; Yıldız, S.; Boran, M.; Uğurlu, Ö.; Wang, J. Analysis of fishing vessel accidents with Bayesian network and Chi-square methods. Ocean Eng. 2020, 198, 106956. [Google Scholar] [CrossRef]
- Kaikkonen, L.; Parviainen, T.; Rahikainen, M.; Uusitalo, L.; Lehikoinen, A. Bayesian networks in environmental risk assessment: A review. Integr. Environ. Assess. 2021, 17, 62–78. [Google Scholar] [CrossRef] [PubMed]
- Delucchi, M.; Spinner, G.R.; Scutari, M.; Bijlenga, P.; Morel, S.; Friedrich, C.M.; Furrer, R.; Hirsch, S. Bayesian network analysis reveals the interplay of intracranial aneurysm rupture risk factors. Comput. Biol. Med. 2022, 147, 105740. [Google Scholar] [CrossRef] [PubMed]
- Yucesan, M.; Muhammet, G.; Guneri, A.F. A Bayesian network-based approach for failure analysis in weapon industry. J. Therm. Eng. 2021, 7, 222–229. [Google Scholar] [CrossRef]
- Zhang, Y.; Li, M.; Wang, B.; Yuan, J.; Tong, R. Developing a taxonomy and a dependency assessment model of performance influencing factors for intelligent coal mines. Process Saf. Environ. 2022, 168, 150–165. [Google Scholar] [CrossRef]
- Iii, R.; Miller, M.E. Spatial Disorientation Mishap Trends in the U.S. Air Force 1993–2013. Aviat. Space Envir. Md. 2014, 85, 919–924. [Google Scholar]
- Sanchez, J.; Rogers, W.A.; Fisk, A.D.; Rovira, E. Understanding reliance on automation: Effects of error type, error distribution, age and experience. Theor. Issues Ergon. Sci. 2014, 15, 134–160. [Google Scholar] [CrossRef]
- Dejohn, C.A.; Mills, W.D.; Hathaway, W.; Larcher, J. Cardiac inflight incapacitations of u.s. airline pilots: 1995–2015. Aerosp. Med. Hum. Perf. 2018, 89, 837–841. [Google Scholar] [CrossRef] [PubMed]
- Szczepaniak, P.; Jastrzębski, G.; Sibilski, K.; Bartosiewicz, A. The Study of Aircraft Accidents Causes by Computer Simulations. Aerospace 2020, 7, 41. [Google Scholar] [CrossRef]
- Wiegmann, D.A.; Shappell, S.A. A Human Error Approach to Aviation Accident Analysis: The Human Factors Analysis and Classification System; Routledge: London, UK, 2017; pp. 84–96. [Google Scholar]
- Marcot, B.G.; Penman, T.D. Advances in Bayesian network modelling: Integration of modelling technologies. Environ. Model. Softw. 2019, 111, 386–393. [Google Scholar] [CrossRef]
- Harris, A.J.; Hahn, U.; Madsen, J.K.; Hsu, A.S. The appeal to expert opinion: Quantitative support for a Bayesian network approach. Cognitive Sci. 2016, 40, 1496–1533. [Google Scholar] [CrossRef]
- Niculescu, R.S.; Mitchell, T.M.; Rao, R.B.; Bennett, K.P.; Parrado-Hernández, E. Bayesian network learning with parameter constraints. J. Mach. Learn. Res. 2006, 7, 1357–1383. [Google Scholar]
- Li, J.; Wu, Q.; Wang, C.C.; Du, H.; Sun, J. Triggering factors of construction waste reduction behavior: Evidence from contractors in Wuhan, China. J. Clean. Prod. 2022, 337, 130396. [Google Scholar] [CrossRef]
- Wang, H.; Pan, T.; Si, H.; Li, Y.; Jiang, N. Research on influencing factor selection of pilot’s intention. Int. J. Aerosp. Eng. 2020, 2020, 1–13. [Google Scholar] [CrossRef]
- Li, M.; Wang, D.; Shan, H. Risk assessment of mine ignition sources using fuzzy Bayesian network. Process Saf. Environ. 2019, 125, 297–306. [Google Scholar] [CrossRef]
- Zou, X.; Yue, W.L. A bayesian network approach to causation analysis of road accidents using netica. J. Adv. Transport. 2017, 2017. [Google Scholar] [CrossRef]
- Ahmad, F.; Tang, X.-W.; Qiu, J.-N.; Wróblewski, P.; Ahmad, M.; Jamil, I. Prediction of slope stability using Tree Augmented Naive-Bayes classifier: Modeling and performance evaluation. Math. Biosci. Eng. 2022, 19, 4526–4546. [Google Scholar] [CrossRef]
Disclaimer/Publisher’s Note: The statements, opinions and data contained in all publications are solely those of the individual author(s) and contributor(s) and not of MDPI and/or the editor(s). MDPI and/or the editor(s) disclaim responsibility for any injury to people or property resulting from any ideas, methods, instructions or products referred to in the content. |
© 2023 by the authors. Licensee MDPI, Basel, Switzerland. This article is an open access article distributed under the terms and conditions of the Creative Commons Attribution (CC BY) license (https://creativecommons.org/licenses/by/4.0/).