
Aerodynamic Effects of a Wing Surface Heat Exchanger


Abstract
1. Introduction
- Uniform heating of the whole airfoil surface and heating of local surface patches;
- The Reynolds number Rec, Mach number Ma, and angle of attack variation representing different flight conditions;
- Symmetric (NACA 0012) and asymmetric (modified NACA 4501X) airfoils with different thickness-to-chord ratios ;
- A 3D unswept wing with and without the effect of propeller slipstream in cruise, taxi and, take-off conditions.
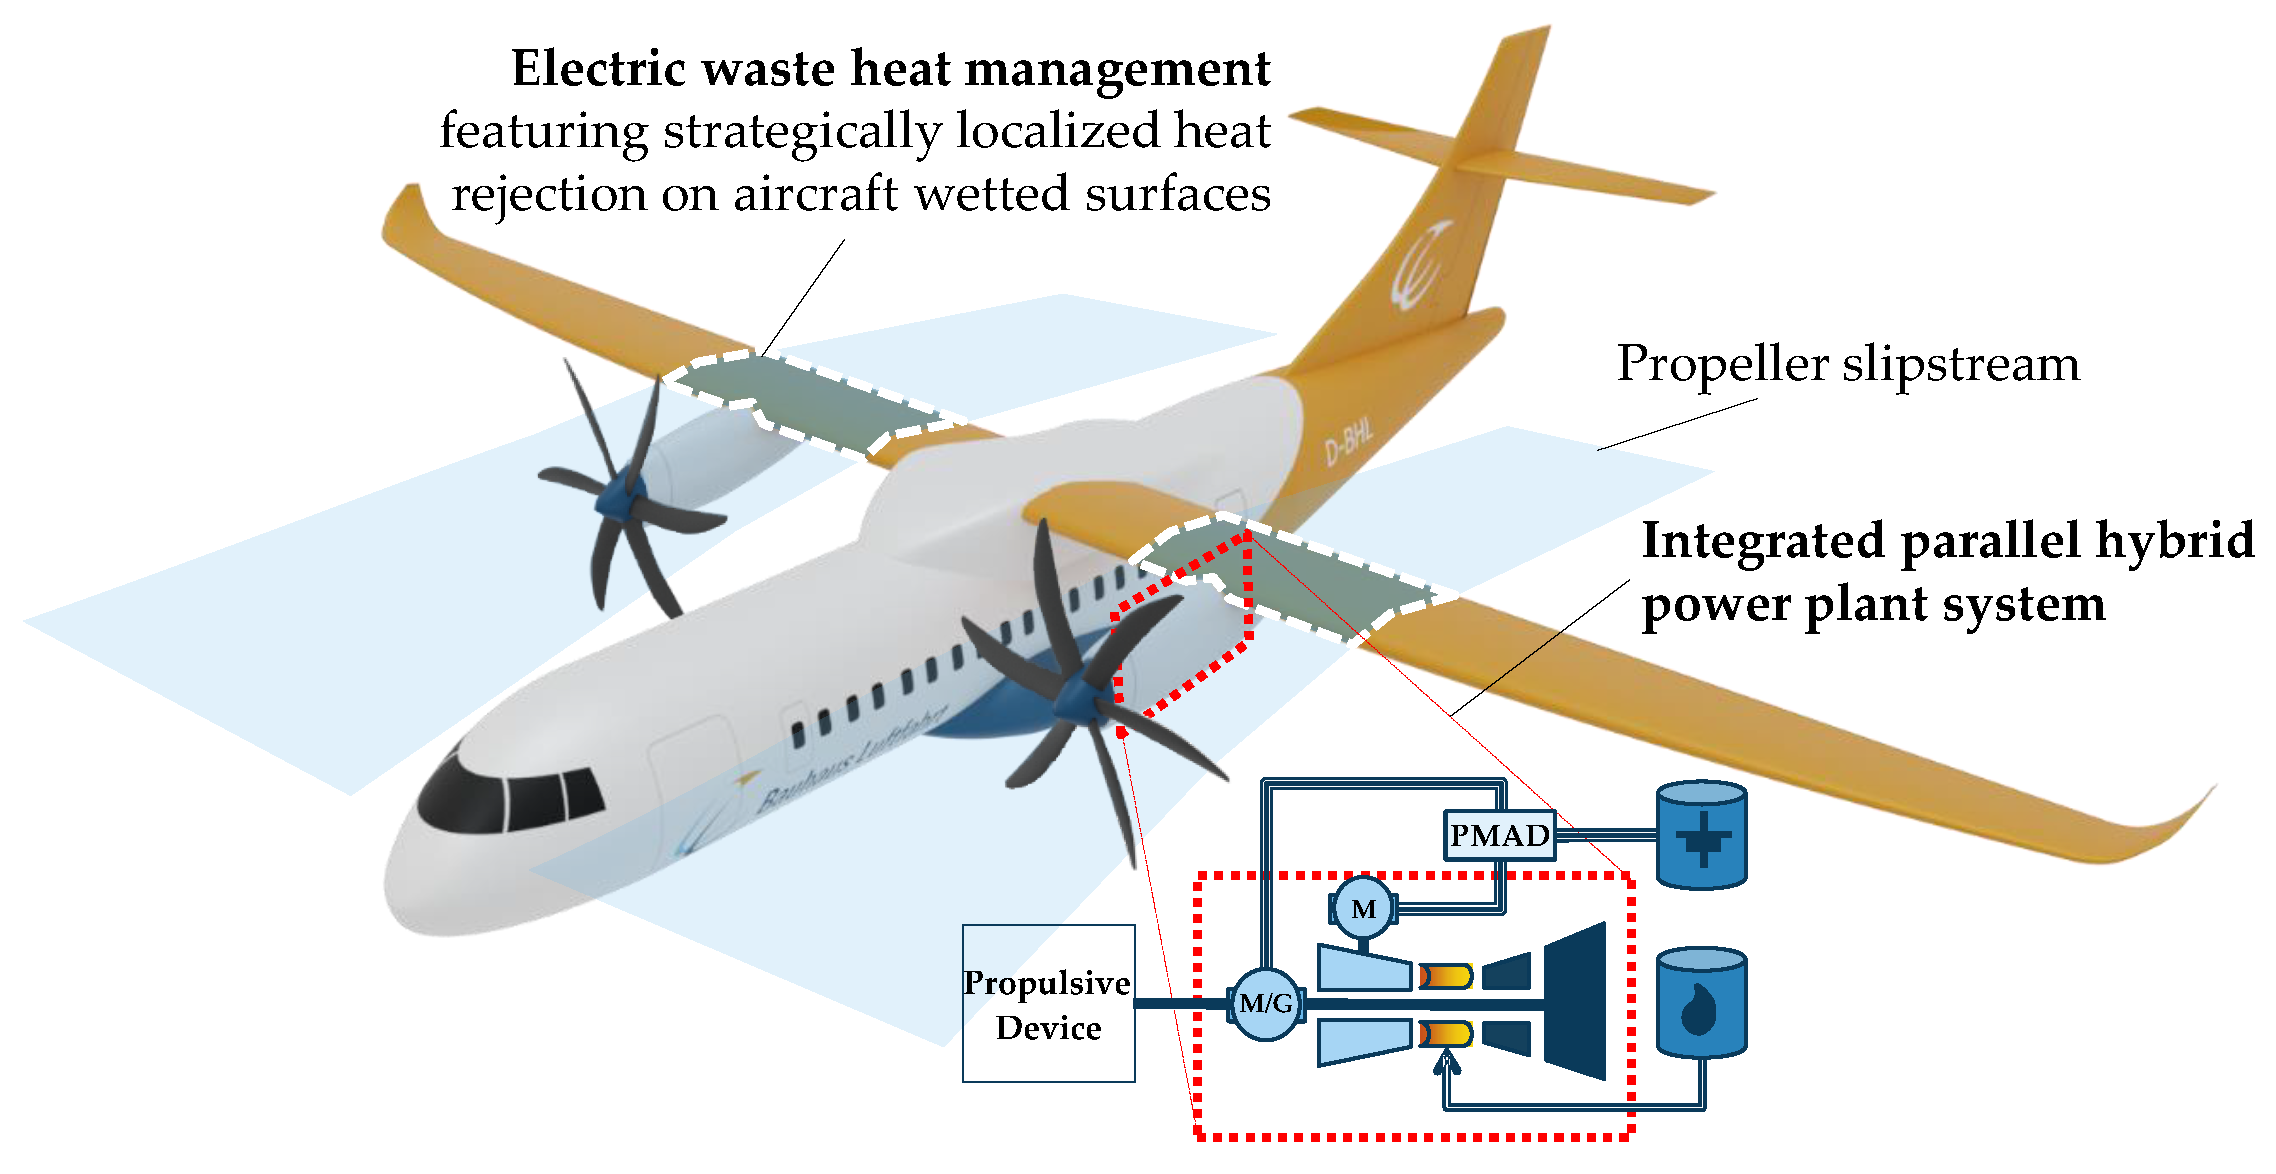
2. Hybrid Electric Regional Aircraft with Wing Surface Heat Exchanger
2.1. Aircraft Configuration and Thermal Management Concept
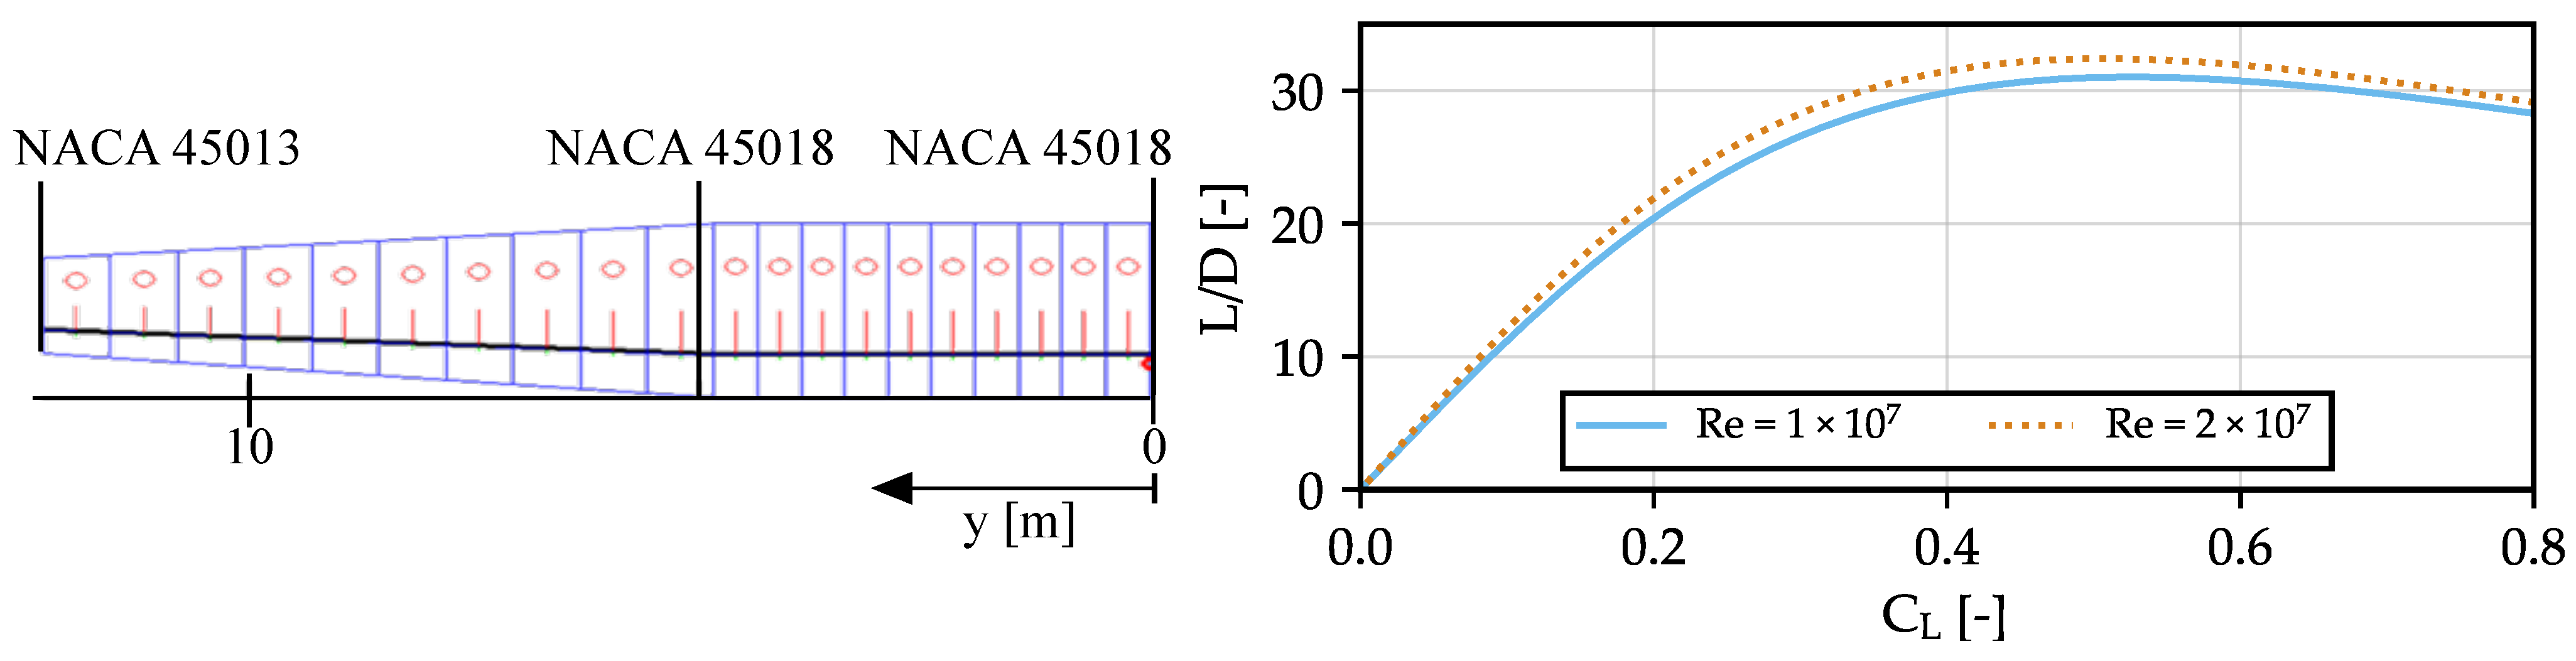
2.2. Airfoil Selection
3. Heat Transfer Effects on Aerodynamics
3.1. Convective Heat Transfer
3.2. Consequences on Aerodynamics
4. Simulation Setup
4.1. Numerical Solvers
4.1.1. SU2
4.1.2. OpenFOAM
4.2. Validation
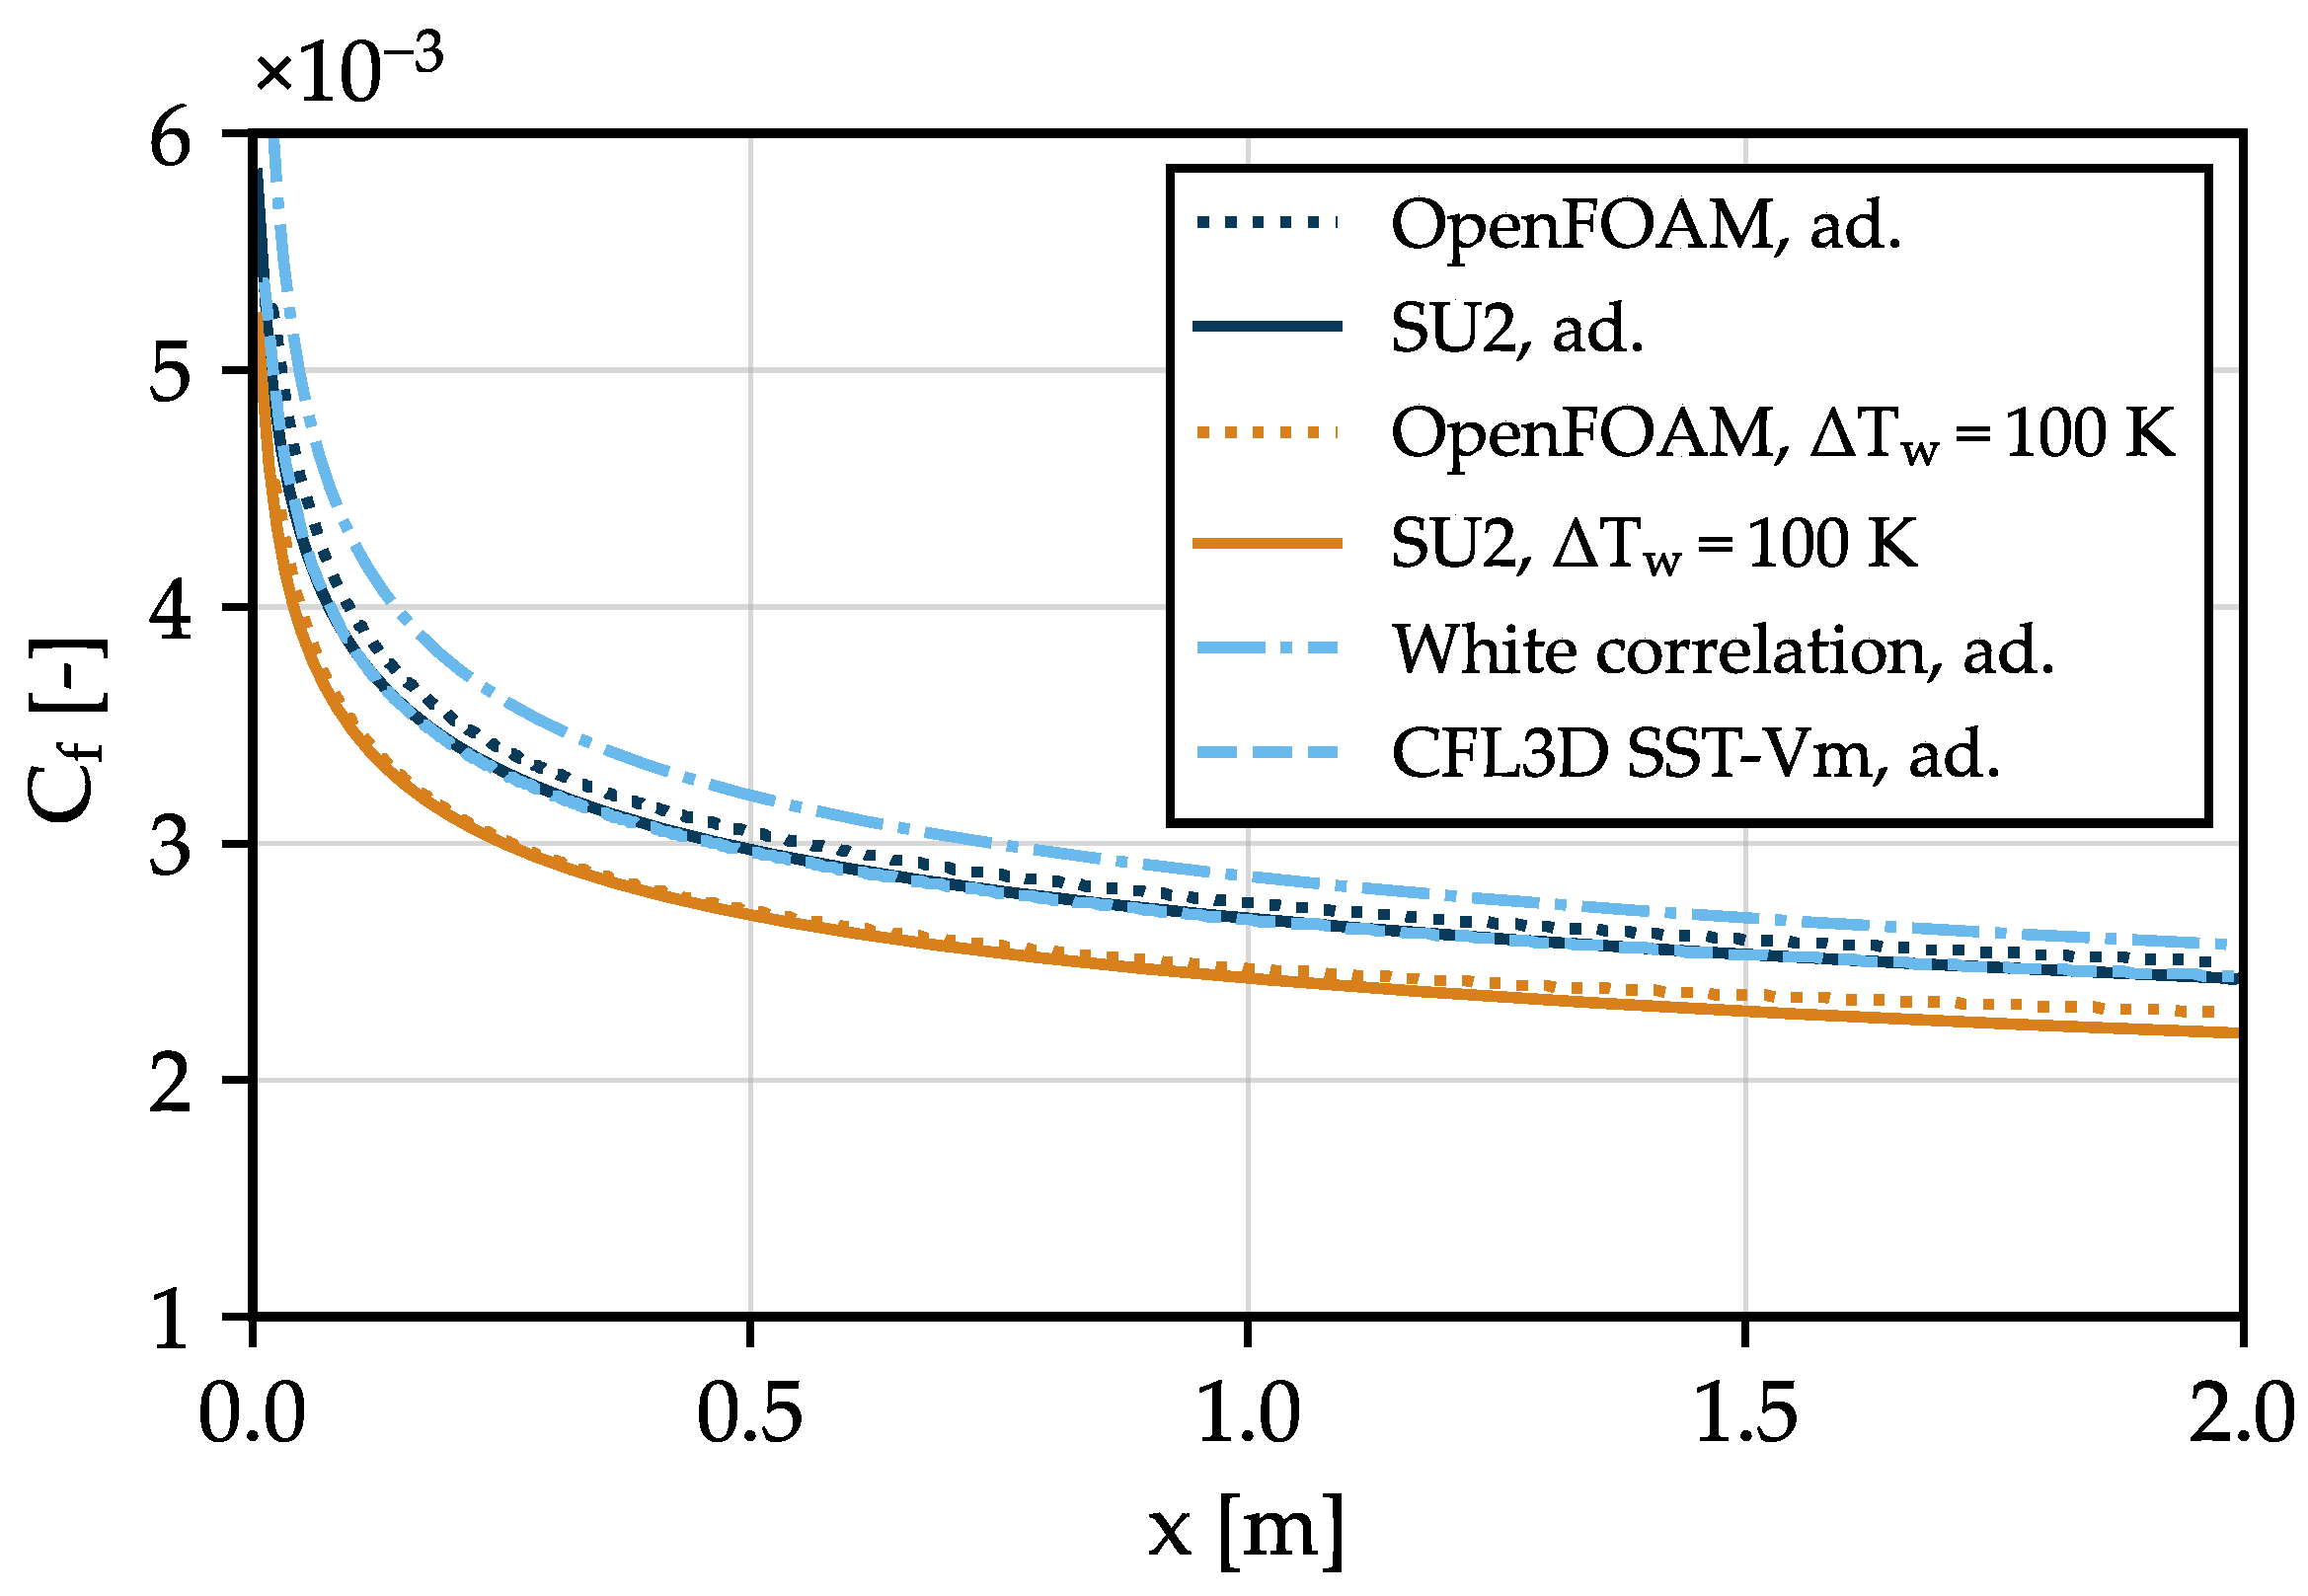
4.2.1. Flat Plate
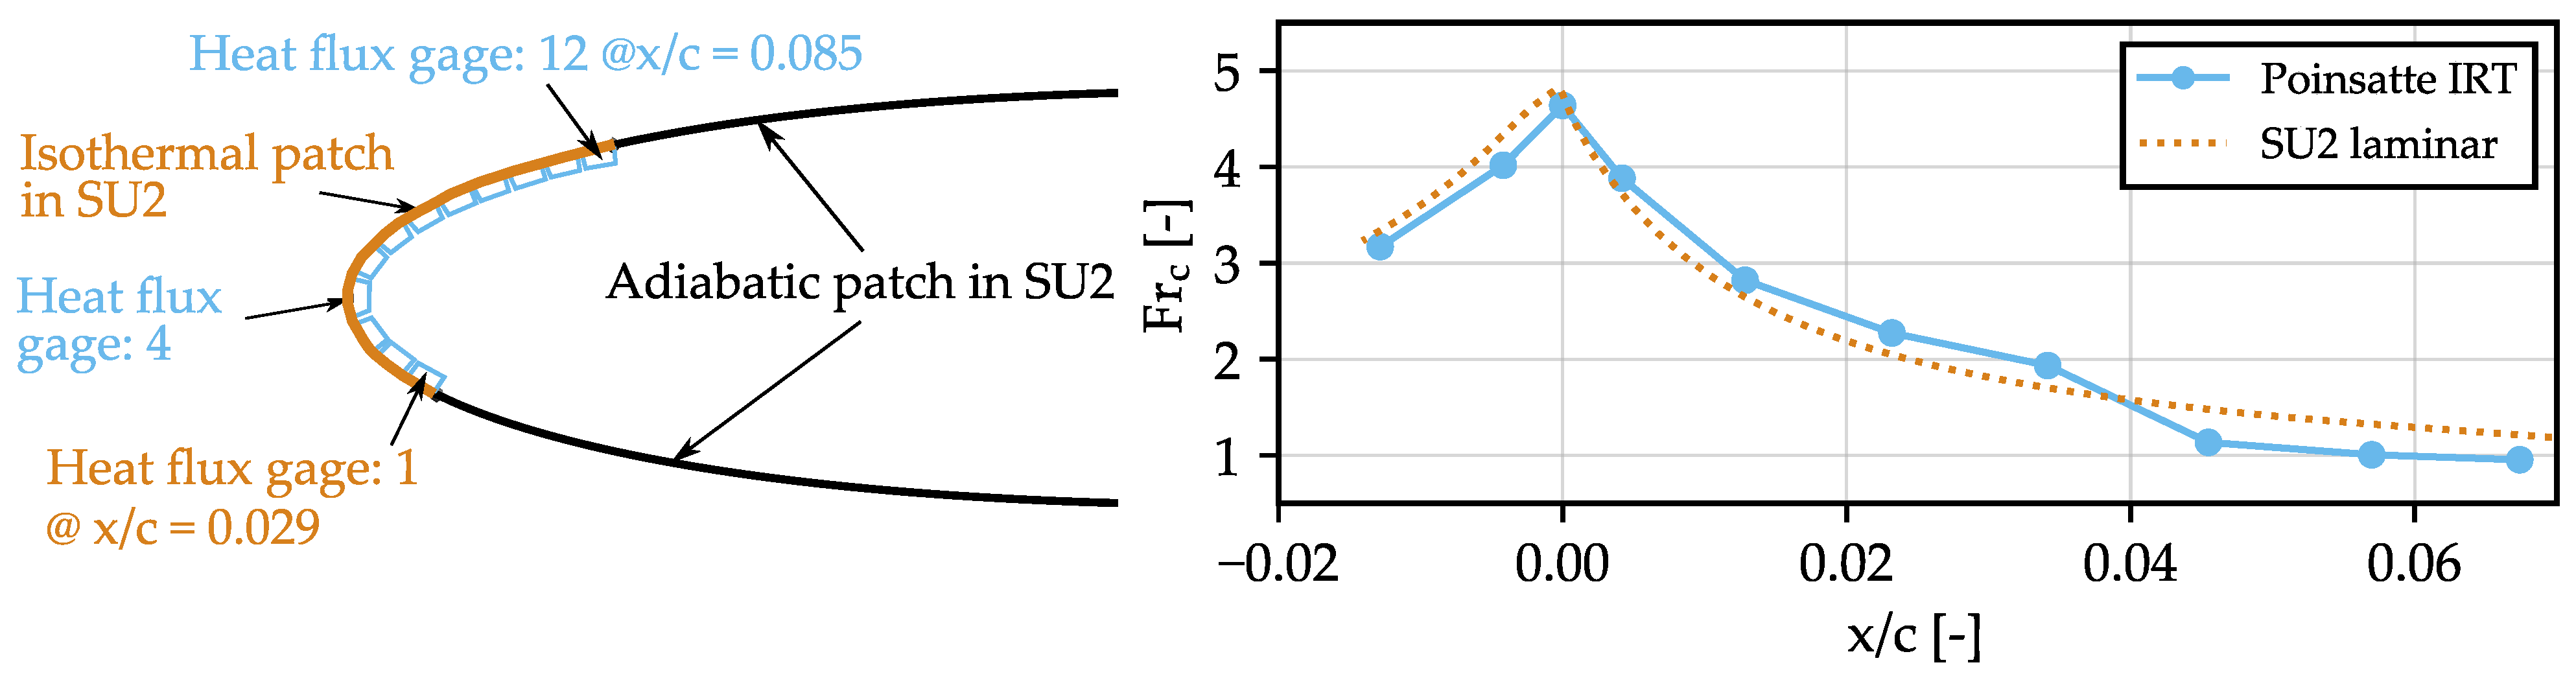
4.2.2. NACA 0012 Airfoil
4.2.3. Actuator Disk
4.3. Study Setup
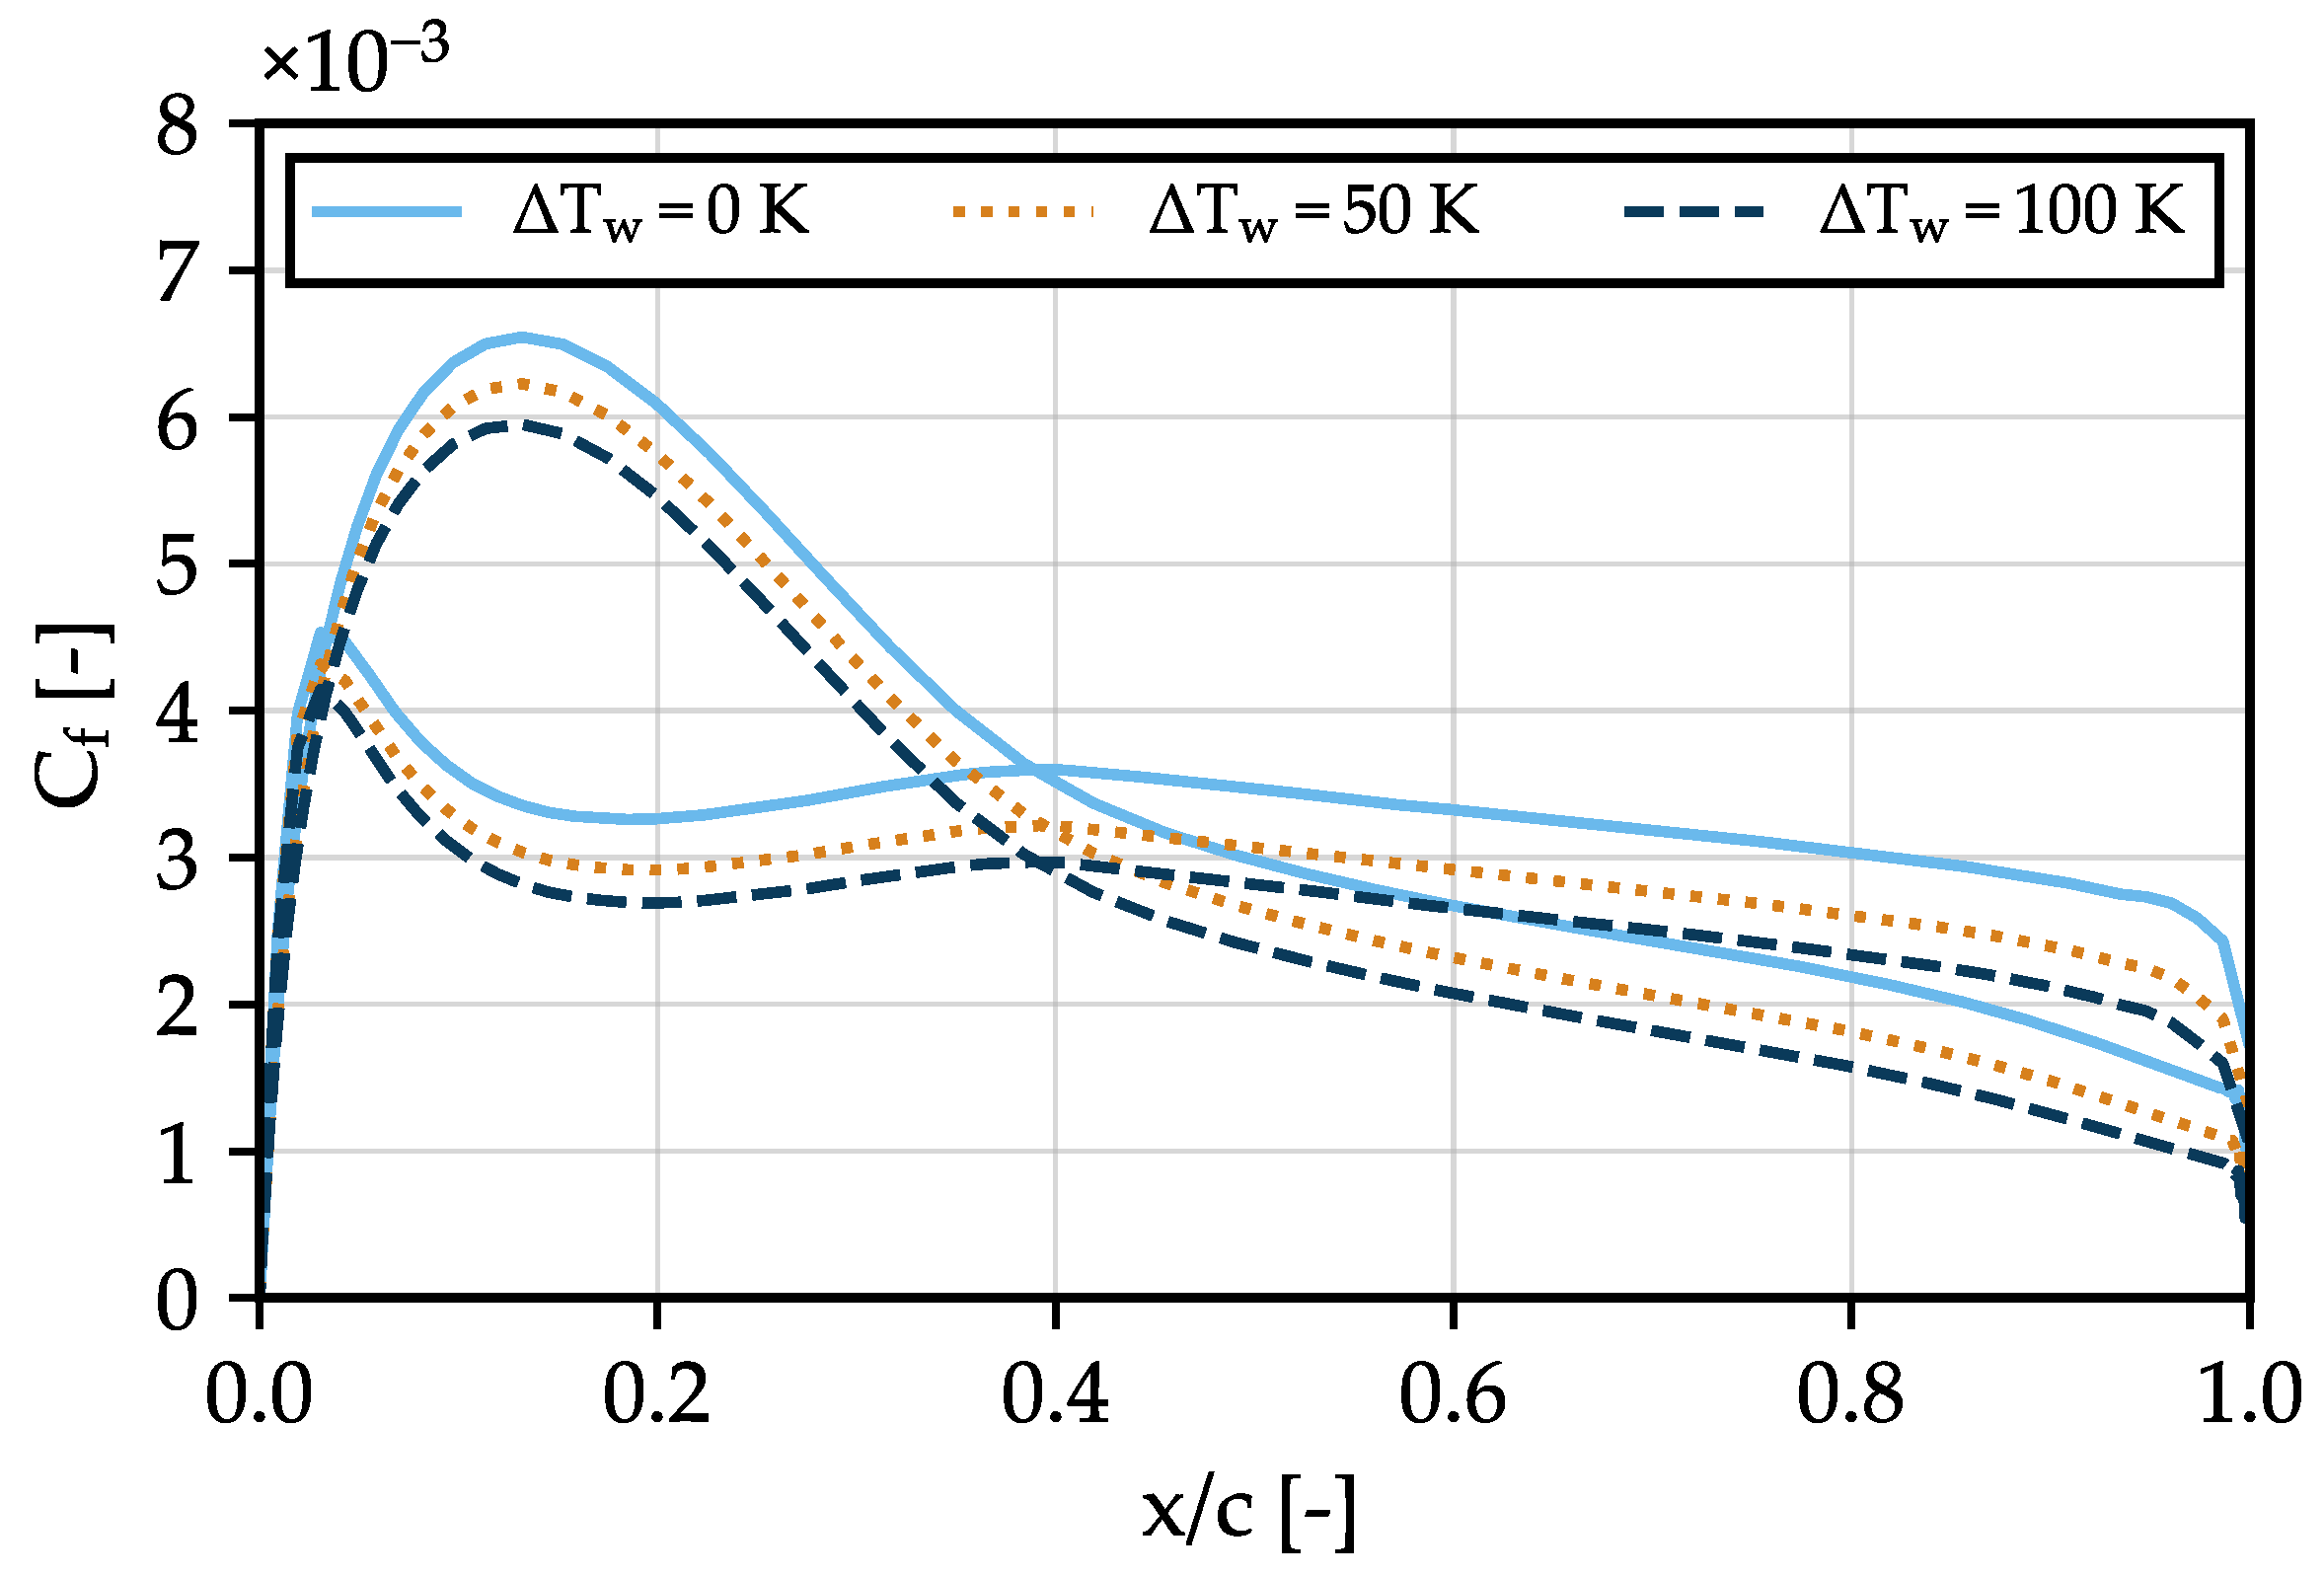
5. Uniformly Heated Two-Dimensional Airfoil
6. Heat Patches on a Two-Dimensional Airfoil
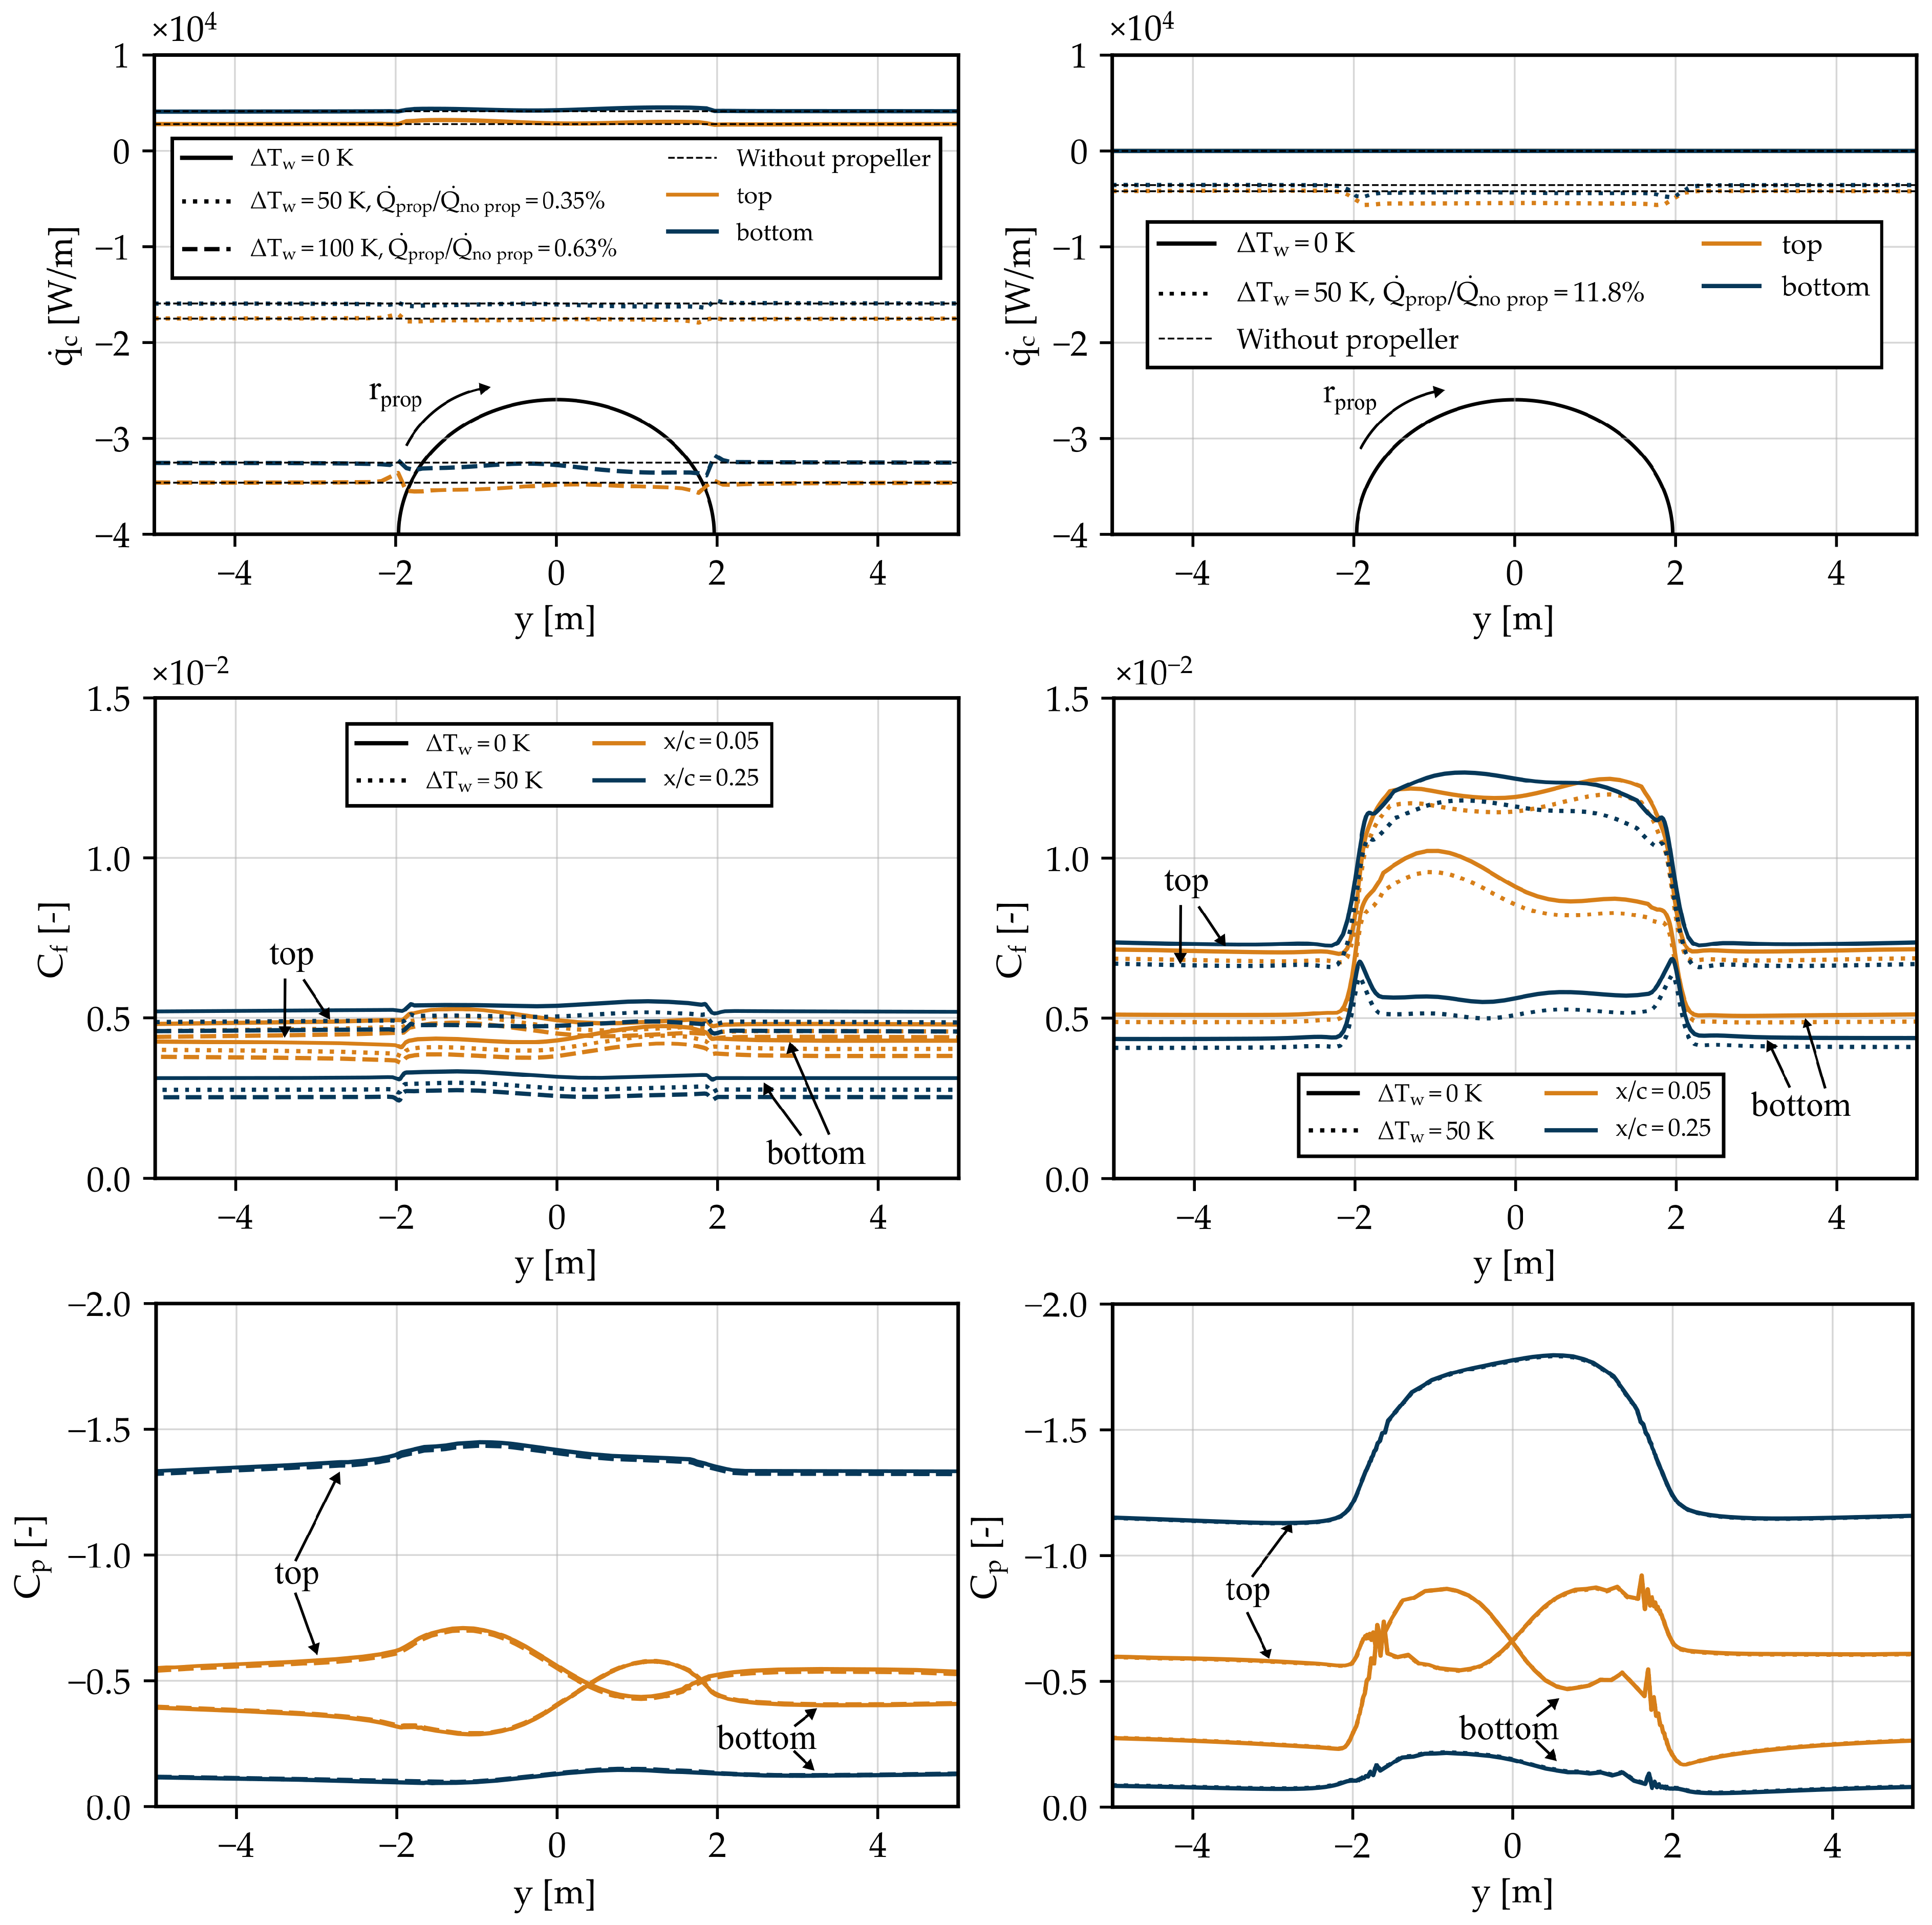
7. Uniformly Heated Three-Dimensional Unswept Wing Section
8. Conceptual Aircraft Design Implications
9. Conclusions
Author Contributions
Funding
Institutional Review Board Statement
Informed Consent Statement
Data Availability Statement
Acknowledgments
Conflicts of Interest
Abbreviations
| BL | Boundary Layer |
| CFD | Computational Fluid Dynamics |
| CR | CRuise |
| FV | Finite Volume |
| HEP | Hybrid-Electric Propulsion |
| IMOTHEP | Investigation and Maturation of Technologies for Hybrid Electric Propulsion |
| IRT | Icing Research Tunnel |
| ISA | International Standard Atmosphere |
| MSES | Software for High Lift Multielement Airfoil Configurations) |
| NACA | National Advisory Committee for Aeronautics |
| NASA | National Aeronautics and Space Administration |
| PI | Point of Inflection |
| PaWAT | Preliminary Design Tool for Propeller–Wing Aerodynamics |
| RANS | Reynolds-Averaged Navier Stokes |
| REG-CON | REGional CONservative |
| TMS | Thermal Management System |
| TO | Take-Off |
| TX | Taxi |
| WSHX | Wing Surface Heat Exchanger |
References and Note
- Aircraft Electrical Propulsion—Onwards and Upwards; Technical Report; Roland Berger: London, UK, 2018.
- Brelje, B.J.; Martins, J.R. Electric, hybrid, and turboelectric fixed-wing aircraft: A review of concepts, models, and design approaches. Prog. Aerosp. Sci. 2019, 104, 1–19. [Google Scholar] [CrossRef]
- Isikveren, A.T.; Seitz, A.; Vratny, P.C.; Pornet, C.; Ploetner, K.O.; Hornung, M. Conceptual Studies of Universally-Electric Systems Architectures Suitable for Transport Aircraft. In Proceedings of the 61. Deutscher Luft- und Raumfahrtkongress (DLRK), Berlin, Germany, 11 September 2012; Deutsche Gesellschaft für Luft- und Raumfahrt, Ed.; DLRK: Berlin, Germany, 2012. [Google Scholar]
- Kuhn, H.; Seitz, A.; Lorenz, L.; Isikveren, A.T.; Sizmann, A. Progress and perspectives of electric air transport. In Proceedings of the 28th Congress of the International Council of the Aeronautical Sciences, Brisbane, Australia, 23–28 September 2012; International Council of the Aeronautical Sciences: Bonn, Germany, 2012; pp. 4886–4899. [Google Scholar] [CrossRef]
- Pornet, C.; Gologan, C.; Vratny, P.C.; Seitz, A.; Schmitz, O.; Isikveren, A.T.; Hornung, M. Methodology for Sizing and Performance Assessment of Hybrid Energy Aircraft. J. Aircr. 2015, 52, 341–352. [Google Scholar] [CrossRef]
- Stoll, A.M.; Veble Mikic, G. Design Studies of Thin-Haul Commuter Aircraft with Distributed Electric Propulsion. In Proceedings of the 16th AIAA Aviation Technology, Integration, and Operations Conference, Washington, DC, USA, 13–17 June 2016. [Google Scholar]
- McCluskey, P.; Saadon, Y.; Yao, Z.; Shah, J.; Kizito, J. Thermal Management Challenges in Turbo-Electric and Hybrid Electric Propulsion. In Proceedings of the 2018 International Energy Conversion Engineering Conference, Cincinnati, OH, USA, 9–11 July 2018; American Institute of Aeronautics and Astronautics: Reston, VA, USA, 2018; p. 34. [Google Scholar] [CrossRef]
- van Heerden, A.; Judt, D.M.; Jafari, S.; Lawson, C.P.; Nikolaidis, T.; Bosak, D. Aircraft thermal management: Practices, technology, system architectures, future challenges, and opportunities. Prog. Aerosp. Sci. 2022, 128, 100767. [Google Scholar] [CrossRef]
- Kellermann, H.; Habermann, A.L.; Hornung, M. Assessment of Aircraft Surface Heat Exchanger Potential. Aerospace 2020, 7, 1. [Google Scholar] [CrossRef]
- Kellermann, H.; Habermann, A.; Vratny, P.; Hornung, M. Assessment of fuel as alternative heat sink for future aircraft. Appl. Therm. Eng. 2020, 170, 114985. [Google Scholar] [CrossRef]
- Belov, I.A.; Litvinov, V.M.; Kazakov, A.V.; Kogan, M.N.; Kuparev, V.A. Laminar boundary layer stability and delayed transition on a nonisothermal surface. Fluid Dyn. 1989, 24, 205–210. [Google Scholar] [CrossRef]
- Dovgal, A.V.; Levchenko, V.Y.; Timopeev, V.A. Boundary Layer Control by a Local Heating of the Wall. In Laminar-Turbulent Transition; Arnal, D., Michel, R., Eds.; Springer: Berlin/Heidelberg, Germany, 1990; pp. 113–121. [Google Scholar] [CrossRef]
- Masad, J.A. Transition in flow over heat–transfer strips. Phys. Fluids 1995, 7, 2163–2174. [Google Scholar] [CrossRef]
- Kametani, Y.; Fukagata, K. Direct numerical simulation of spatially developing turbulent boundary layers with uniform blowing or suction. J. Fluid Mech. 2011, 681, 154–172. [Google Scholar] [CrossRef]
- Lee, J.; Yoon Jung, S.; Jin Sung, H.; Zaki, T.A. Effect of wall heating on turbulent boundary layers with temperature-dependent viscosity. J. Fluid Mech. 2013, 726, 196–225. [Google Scholar] [CrossRef]
- Lin, J.C.; Ash, R.L. Wall temperature control of low-speed body drag. J. Aircr. 1986, 23, 93–94. [Google Scholar] [CrossRef]
- Kramer, B.; Smith, B.; Heid, J.; Noffz, G.; Richwine, D.; Ng, T. Drag reduction experiments using boundary layer heating. In Proceedings of the 37th Aerospace Sciences Meeting and Exhibit, Reno, NV, USA, 11–14 January 1999; American Institute of Aeronautics and Astronautics: Reston, VA, USA, 1999. [Google Scholar] [CrossRef]
- Frick, C.W.; McCullough, G.B. Tests of a Heated Low-Drag Airfoil; Advance Confidential Report No. 244; National Advisory Committee for Aeronautics: Moffet Field, CA, USA, 1942. [Google Scholar]
- Wang, X.; Naterer, G.F.; Bibeau, E. Convective Heat Transfer from a NACA Airfoil at Varying Angles of Attack. J. Thermophys. Heat Transf. 2008, 22, 457–463. [Google Scholar] [CrossRef]
- Norton, D.J.; Macha, J.M.; Young, J.C. Surface Temperature Effect on Subsonic Stall. J. Spacecr. Rocket. 1973, 10, 581–587. [Google Scholar] [CrossRef]
- Longo, J.; Radespiel, R. Numerical simulation of heat transfer effects on two dimensional steady subsonic flows. In Proceedings of the Fluid Dynamics Conference, Bangalore, India, 11–15 July 1994; American Institute of Aeronautics and Astronautics: Reston, VA, USA, 1995. [Google Scholar] [CrossRef]
- Lee, J.D. The Influence of Heat Transfer on the Drag of Airfoils; Defense Technical Information Center: Fort Belvoir, VA, USA, 1981. [Google Scholar]
- Kallath, H.; Kholi, F.K.; Ha, M.Y.; Min, J.K.; Chetwynd-Chatwin, J. Computational study on the aerodynamics of a surface-heated wing for thermal management. AIAA J. 2020, 58, 4339–4356. [Google Scholar] [CrossRef]
- Elsaadawy, E.A.; Britcher, C.P. Effect of Propeller Slipstream on Heat-Exchanger Installations at Low Reynolds Number. J. Aircr. 2003, 40, 751–758. [Google Scholar] [CrossRef]
- Bauhaus Luftfahrt, e.V. Yearbook 2020; Technical Report; Bauhaus Luftfahrt e.V.: Taufkirchen, Germany, 2020. [Google Scholar]
- Economon, T.D.; Palacios, F.; Copeland, S.R.; Lukaczyk, T.W.; Alonso, J.J. SU2: An Open-Source Suite for Multiphysics Simulation and Design. AIAA J. 2015, 54, 828–846. [Google Scholar] [CrossRef]
- Weller, H.G.; Tabor, G.; Jasak, H.; Fureby, C. A tensorial approach to computational continuum mechanics using object-oriented techniques. Comput. Phys. 1998, 12, 620. [Google Scholar] [CrossRef]
- Novelli, P. IMOTHEP: Towards hybrid propulsion for commercial aviation. In Proceedings of the 11th EASN International Conference, Barcelona, Spain, 16 September 2021. [Google Scholar]
- Vratny, P.C.; Kaiser, S.; Seitz, A.; Donnerhack, S. Performance investigation of cycle-integrated parallel hybrid turboshafts. J. Eng. Gas Turbines Power 2017, 139, 031201. [Google Scholar] [CrossRef]
- Seitz, A.; Nickl, M.; Stroh, A.; Vratny, P.C. Conceptual study of a mechanically integrated parallel hybrid electric turbofan. Proc. Inst. Mech. Eng. Part J. Aerosp. Eng. 2018, 232, 2688–2712. [Google Scholar] [CrossRef]
- Habermann, A.L.; Kolb, M.G.; Maas, P.; Kellermann, H.; Rischmüller, C.; Peter, F.; Seitz, A. Study of a Regional Turboprop Aircraft with Electrically-Assisted Turboshaft. Aerospace, 2023; unpublished. [Google Scholar]
- Seitz, A.; Peter, F. Aircraft Concept for IMOTHEP Conservative Regional Platform Bauhaus Luftfahrt Presentation delivered to ONERA: E-Mail, 21.03.2019.
- Lednicer, D. The Incomplete Guide to Airfoil Usage. Available online: https://m-selig.ae.illinois.edu/ads/aircraft.html (accessed on 16 March 2023).
- Drela, M. MSES Overview. Available online: https://web.mit.edu/drela/Public/web/mses/ (accessed on 16 March 2023).
- Steiner, H.J. Preliminary Design Tool for Propeller-Wing Aerodynamics, Version v0.44: Part I: Implementation and Reference Manual; Technical Report; Bauhaus Luftfahrt e.V.: Taufkirchen, Germany; Technical University Munich: Munich, Germany, 2011. [Google Scholar]
- Wilkinson, S.P. Interactive Wall Turbulence Control. In Viscous Drag Reduction in Boundary Layers; Bushnell, D.M., Hefner, J.N., Eds.; American Institute of Aeronautics and Astronautics: Reston, VA, USA, 1990; Volume 1, pp. 479–509. [Google Scholar] [CrossRef]
- Seibert, O. Heat Transfer of Airfoils and Plates; Technical Report No. 1044; NASA: Washington, DC, USA, 1943. [Google Scholar]
- Baehr, H.D.; Stephan, K. Heat and Mass Transfer; Springer: Berlin/Heidelberg, Germany, 2011. [Google Scholar]
- Schlichting, H.; Gersten, K. Boundary-Layer Theory; Springer: Berlin/Heidelberg, Germany, 2017. [Google Scholar]
- Mabey, D.G. Effects of heat transfer on aerodynamics and possible implications for wind tunnel tests. Prog. Aerosp. Sci. 1990, 27, 267–303. [Google Scholar] [CrossRef]
- Reynolds, W.C.; Kays, W.M.; Kline, S.J. A Summary of Experiments on Turbulent Heat Transfer From a Nonisothermal Flat Plate. J. Heat Transf. 1960, 82, 341–348. [Google Scholar] [CrossRef]
- Van Driest, E.R. Calculation of the Stability of the Laminar Boundary Layer in a Compressible Fluid on a Flat Plate with Heat Transfer. J. Aeronaut. Sci. 1952, 19, 801–812. [Google Scholar] [CrossRef]
- Anderson, J.D. Introduction to Flight, 8th ed.; McGraw-Hill Series in Aeronautical and Aerospace Engineering; McGraw-Hill Education: New York, NY, USA, 2016. [Google Scholar]
- Lin, P.; Liu, X.; Xiong, N.; Wang, X.; Shang, M.; Liu, G.; Tao, Y. Numerical study on the influence of wall temperature gradient on aerodynamic characteristics of low aspect ratio flying wing configuration. Sci. Rep. 2021, 11, 16295. [Google Scholar] [CrossRef] [PubMed]
- Li, B.; Sun, Q.; Xiao, D.; Zhang, W. Numerical Investigation of the Aerofoil Aerodynamics with Surface Heating for Anti-Icing. Aerospace 2022, 9, 338. [Google Scholar] [CrossRef]
- DIN ISO 2533; Standard Atmosphere. International Organization for Standardization: Geneva, Switzerland, 1975.
- White, F.M. Viscous Fluid Flow, 3rd ed.; McGraw-Hill Series in Mechanical Engineering; McGraw-Hill Higher Education: New York, NY, USA, 2006. [Google Scholar]
- Geuzaine, C.; Remacle, J.F. Gmsh: A 3-D finite element mesh generator with built-in pre- and post-processing facilities. Int. J. Numer. Methods Eng. 2009, 79, 1309–1331. [Google Scholar] [CrossRef]
- Palacios, F.; Alonso, J.; Duraisamy, K.; Colonno, M.; Hicken, J.; Aranake, A.; Campos, A.; Copeland, S.; Economon, T.; Lonkar, A.; et al. Stanford University Unstructured (SU2): An open-source integrated computational environment for multi-physics simulation and design. In Proceedings of the 51st AIAA Aerospace Sciences Meeting Including the New Horizons Forum and Aerospace Exposition, Texas, TX, USA, 7–10 January 2013. [Google Scholar] [CrossRef]
- Slater, J.W. Examining Spatial (Grid) Convergence. Available online: https://www.grc.nasa.gov/www/wind/valid/tutorial/spatconv.html (accessed on 16 March 2023).
- Saetta, E.; Russo, L.; Tognaccini, R. Implementation and validation of a new actuator disk model in SU2. In Proceedings of the SU2 Conference, Virtual, 10–12 June 2020. [Google Scholar]
- OpenCFD Ltd. OpenFOAM Extended Code Guide Version v2012; OpenCFD Ltd.: Bracknell, UK, 2021. [Google Scholar]
- OpenCFD Ltd. OpenFOAM User Guide Version v2012; OpenCFD Ltd.: Bracknell, UK, 2020. [Google Scholar]
- Poling, B.E.; Prausnitz, J.M.; O’Connell, J.P.; Reid, R.C. The Properties of Gases and Liquids, 5th ed.; McGraw-Hill: New York, NY, USA, 2001. [Google Scholar]
- NASA. 2D Zero Pressure Gradient Flat Plate Validation Case; NASA: Washington, DC, USA, 2020. [Google Scholar]
- Poinsatte, P.; Van Fossem, G.; Dewitt, K. Convective heat transfer measurements from a NACA 0012 airfoil in flight and in the NASA Lewis Icing Research Tunnel. In Proceedings of the 28th Aerospace Sciences Meeting, Reno, NV, USA, 8–11 January 1990; p. 199. [Google Scholar]
- Rumsey, C. 2D NACA 0012 Airfoil Validation Case. Available online: https://turbmodels.larc.nasa.gov/naca0012_val.html (accessed on 16 March 2023).
- Samuelsson, I. Low speed propeller slipstream aerodynamic effects. In AGARD, A Selection of Experimental Test Cases for the Validation of CFD Codes; Advisory Group for Aerospace Research and Development (AGARD): Neuilly-Sur-Seine, France, 1994; Volume 2. [Google Scholar]
- Gregory, N.; O’Reilly, C. Low-Speed Aerodynamic Characteristics of NACA0012 Aerofoil Section, Including the Effects of Upper-Surface Roughness Simulating Hoar Frost; Technical Report 3762; Aeronautical Research Council: London, UK, 1970. [Google Scholar]
- Samuelsson, I. Low speed wind tunnel investigation of propeller slipstream aerodynamic effects on different nacelle/wing combinations. In Proceedings of the 16th ICAS Congress, Jerusalem, Israel, 28 August–2 September 1988; pp. 1749–1765. [Google Scholar]
- Samuelsson, I. Experimental Investigation of Low Speed Model Propeller Slipstream Aerodynamic Characteristics including Flow Field Surveys and Nacelle/Wing Static Pressure Measurements. In Proceedings of the 17th ICAS Congress, Stockholm, Sweden, 9–14 September 1990; pp. 71–84. [Google Scholar]
- Schultz-Grunow, F. New Frictional Resistance Law for Smooth Plates; Technical Report 986; National Advisory Commitee for Aeronautics: Hampton, VA, USA, 1941. [Google Scholar]
- Churchill, S.; Bernstein, M. A correlating equation for forced convection from gases and liquids to a circular cylinder in crossflow. J. Heat Transf. 1977, 99, 300–306. [Google Scholar] [CrossRef]
- Hilpert, R. Wärmeabgabe von geheizten Drähten und Rohren im Luftstrom. In Forschung auf dem Gebiet des Ingenieurwesens; Springer: Berlin/Heidelberg, Germany, 1933. [Google Scholar]
- Wang, X.; Bibeau, E.; Naterer, G. Experimental correlation of forced convection heat transfer from a NACA airfoil. Exp. Therm. Fluid Sci. 2007, 31, 1073–1082. [Google Scholar] [CrossRef]
- Kumar, A.V.M.; Rajendrakumar, N.; Gogineni, P.C.; Gopan, N.; Thangeswaran, R.S.K. Effect of temperature on the aerodynamics of airfoil in low Reynolds number flow. In Proceedings of the International Conference on Applied Mechanics and Optimisation, Thiruvananthapuram, India, 13–15 June 2019; AIP Publishing: College Park, MD, USA, 2019. [Google Scholar] [CrossRef]
- Kellermann, H.; Habermann, A.L.; Seitz, A. Thermal Management System Design for a Regional Hybrid Electric Aircraft. Aerosp. Eur. Conf. 2023; unpublished. [Google Scholar]
- Chakraborty, I. Subsystem Architecture Sizing and Analysis for Aircraft Conceptual Sesign. Ph.D. Thesis, Georgia Institute of Technology, Atlanta, GA, USA, 2015. [Google Scholar]
- Menter, F.R. Two-equation eddy-viscosity turbulence models for engineering applications. AIAA J. 1994, 32, 1598–1605. [Google Scholar] [CrossRef]
- Wilcox, D.C. Turbulence Modeling for CFD, 3rd ed.; DCW Industries: La Cañada, CA, USA, 2006. [Google Scholar]
- McLean, D. Understanding Aerodynamics: Arguing from the Real Physics; Wiley: Hoboken, NJ, USA, 2013. [Google Scholar]
- Menter, F.R.; Sechner, R.; Matyushenko, A. Best Practice: RANS Turbulence Modeling in Ansys CFD: Version 1.0. 2021. Available online: https://www.google.com/url?sa=t&rct=j&q=&esrc=s&source=web&cd=&ved=2ahUKEwiIltqCp8X-AhX3cPEDHW36DGYQFnoECCQQAQ&url=https%3A%2F%2Fwww.ansys.com%2Fcontent%2Fdam%2Famp%2F2022%2Ffebruary%2Fasset-creation%2Fbest-practices-campaign%2FBest%2520Practice-Rans%2520turbulence%2520modeling%2520in%2520Ansys%2520CFD.pdf&usg=AOvVaw1QBesb85eewbczguddwvJs (accessed on 15 March 2023).


| [100 ft] | [] | [K] | [] | |
|---|---|---|---|---|
| CR 1 | 150 | 120/140/160/180 | 0/25/50/75/100/120/140/160/200/300 | 0 |
| 150/160/170/180/200/220 | 140 | 140 | 0 | |
| 150 | 140 | 140 | −5/0/+5 | |
| TO 2 | 0 | 20/40/60/80/100 | 0/20/40/60/80/100/200/300 | 0 |
| 0 | 60 | 0/20/40/60/80/100/200/300 | 0/+10 |
| [100 ft] | Ma∞ [-] | [K] | [kN] | [] | |
|---|---|---|---|---|---|
| CR 1 | 200 | 0.46 | 0/50/100 | 6.5 | 0 |
| 200 | 0.46 | 100 | 8.0 | 0 | |
| 200 | 0.40 | 100 | 5.8 | 0 | |
| 150 | 0.46 | 100 | 6.5 | 0 | |
| TX 2 | 0 | 0.03 | 0 | 0 | 0 |
| 0 | 0.03 | 0/50 | 0.67 | 0 | |
| TO 2 | 0 | 0.17 | 0 | 0.0 | 0/+10 |
| 0 | 0.17 | 50 | 10.0 | +10 | |
| 0 | 0.17 | 0/50 | 21.5 | 0/+10 |
Disclaimer/Publisher’s Note: The statements, opinions and data contained in all publications are solely those of the individual author(s) and contributor(s) and not of MDPI and/or the editor(s). MDPI and/or the editor(s) disclaim responsibility for any injury to people or property resulting from any ideas, methods, instructions or products referred to in the content. |
© 2023 by the authors. Licensee MDPI, Basel, Switzerland. This article is an open access article distributed under the terms and conditions of the Creative Commons Attribution (CC BY) license (https://creativecommons.org/licenses/by/4.0/).
Share and Cite
Habermann, A.L.; Khot, A.; Lampl, D.E.; Perren, C. Aerodynamic Effects of a Wing Surface Heat Exchanger. Aerospace 2023, 10, 407. https://doi.org/10.3390/aerospace10050407
Habermann AL, Khot A, Lampl DE, Perren C. Aerodynamic Effects of a Wing Surface Heat Exchanger. Aerospace. 2023; 10(5):407. https://doi.org/10.3390/aerospace10050407
Chicago/Turabian StyleHabermann, Anaïs Luisa, Ankit Khot, David Emanuel Lampl, and Christof Perren. 2023. "Aerodynamic Effects of a Wing Surface Heat Exchanger" Aerospace 10, no. 5: 407. https://doi.org/10.3390/aerospace10050407
APA StyleHabermann, A. L., Khot, A., Lampl, D. E., & Perren, C. (2023). Aerodynamic Effects of a Wing Surface Heat Exchanger. Aerospace, 10(5), 407. https://doi.org/10.3390/aerospace10050407