Abstract
Accurate predictions of the blade response in a multi-row compressor is one of the most important tasks within the design process of compressor blades. Some recent studies have shown that the decoupled method considering only the stator disturbances cannot obtain accurate results for cases with strong rotor–stator interactions, especially for the interaction between the rotor and downstream stator, and the coupled method with multi-row configurations is necessary. Factors determine what computational domains to model need to be clarified to find a balance between accuracy requirements and computational costs. To this end, this study conducted full-annulus unsteady calculations with decoupled and coupled configurations to investigate the forced response of an embedded compressor rotor induced by upstream and downstream stator disturbances and rotor–stator interactions, respectively. The results show that the upstream IGV disturbances were dominated by the wake, and the IGV and S1 potential fields had little effect on the R1 response. Meanwhile, the IGV–R1 interactions and S1–R1 interactions were dominated by one cut-on mode, respectively. The comparisons of the blade vibration amplitude and the unsteady pressure field calculated by decoupled and coupled methods revealed the mechanism of the forced response, namely, for the R1 response induced by upstream aerodynamic disturbances, the dominant excitation source was the IGV wake, and the blade vibration amplitude can be predicted by the decoupled method. In terms of the response induced by downstream disturbances, the cut-on S1-R1-interaction mode was dominant and the use of the decoupled method without considering its influence will lead to an inaccurate prediction. This study concluded that the formation process of rotor–stator interactions was the key factor that determines whether the decoupled method or coupled method should be used, and analogized a process independent of the downstream stator disturbance. The results can provide a preliminary configuration for accurate and efficient blade response predictions and explain the reason why including downstream stator vanes is very important.
1. Introduction
Compressor flowfields are inherently unsteady due to the relatively high-speed rotation between rotor blades and stator vanes, which leads to the blades constantly suffering from unsteady external excitation forces, resulting in the forced response of blades [1,2]. For the embedded rotor blades of a multistage compressor, the most common excitation sources are the wake from the upstream vane row and the potential field from upstream and downstream vane rows [3,4]. During the compressor operation, the frequencies of excitation forces induced by these disturbances will inevitably coincide with the natural frequencies of rotor blades and resonance may occur, leading to high-cycle fatigue failure. The Campbell diagram can help identify where resonances are likely to occur, but it is almost impossible to avoid all resonant crossings within the operating range of a multistage compressor, thus it is necessary to accurately predict the blade vibration amplitude for each resonance to determine whether the crossings are acceptable [5].
Many efforts have been made to accurately predict the blade response, including using a fluid-structure-coupled method [6,7,8], investigating the influence of the turbulence model [9], damping [6,7], boundary condition [8,9], and mesh densities [8,10], etc. These studies are helpful but mainly focus on the influence of numerical methods. The multi-row interactions may have a greater influence on the blade response prediction.
In engineering practice, the forced response of an embedded compressor rotor is commonly solved by the decoupled method, where the upstream and downstream stator disturbances are applied as boundary conditions to single-row configurations [11]. It can be used to accurately and efficiently predict the blade vibration amplitude if the inter-row coupling effects [12,13], mainly referring to the rotor–stator interactions, can be ignored. However, the use of the decoupled method may lead to inaccurate predictions because the rotor–stator interactions are non-negligible in some cases.
Forced response predictions of a 3.5-stage axial compressor with different computational domains were carried out at Duke University. Besem et al. [14] focused on the first-stage stators and the second-stage rotors and stators (S1/R2/S2), and performed the predictions with decoupled and coupled configurations. The results showed that using a decoupled method cannot obtain accurate results due to the strong inter-row interactions. A three-row coupled configuration including the downstream stator is necessary when adjacent stators excite the embedded rotor at the same frequency. Li et al. [11] subsequently performed detailed analyses by investigating five decoupled and coupled cases. The response of the rotor blade including the upstream and downstream stators is 1.73 and 3.13 times larger than that of the decoupled configuration, respectively, indicating that the downstream stator has a more tremendous effect on the rotor blade. Moreover, it was found that the unsteady pressure in the rotor passage of the S1/R2 coupled configuration and R2 decoupled configuration is more or less similar, whereas it differs dramatically between the R2/S2 coupled configuration and the R2 decoupled configuration. Shreyas et al. [15] suggested that the reflection of the downstream stator has a more significant effect on the response of the rotor blade than that of the upstream stator. Shreyas et al. [16] then analyzed a four-row case with the downstream R2, a five-row case considering the upstream IGV, and the above three-row case. It was found that the reflection of the downstream R2 was also significant, but not contributed much to the blade response, and thus the three-row case can provide accurate and efficient predictions.
The influence of inter-row interactions on the excitation of blade vibration has also been studied. Schoenenborn and Ashcroft [17] compared the calculated unsteady pressure of a quasi-3D axial compressor rotor using coupled and decoupled methods. It was found that the IGV-R1-interaction modes can pass through the rotor passage with little attenuation, and concluded that cut-on modes have a huge impact on the unsteady pressure amplitude of the rotor blade. Schoenenborn [18] showed that the R1-S1-R2 interaction modes can lead to different blade excitations in the circumferential direction. Terstegen et al. [9,19] investigated the effect of rotor–stator interactions on the rotor blade response of a 2.5-stage axial compressor. They performed detailed and comprehensive azimuthal mode analyses and stress predictions. The results show that the vibrational stress predicted by the decoupled method without considering the rotor–stator interactions was 97% lower than the experimental results. It was concluded that the acoustic modes generated by the interactions between the rotor blades and the downstream stator vanes need special attention.
The above results have shown the importance of rotor–stator interactions for blade response predictions. However, these studies mainly emphasized that the interactions between downstream stator vanes and rotor blades were very important, whereas the upstream stator–rotor interactions seem to be not very significant in comparison. This means that the decoupled method can still be used in some cases. Therefore, the main objective of this paper is to accurately and efficiently predict the response of an embedded compressor rotor induced by stator disturbances and rotor–stator interactions, and to clarify the key factor that determines whether the decoupled method or coupled method should be used. For this purpose, full-annulus unsteady calculations were performed based on the decoupled and coupled methods. The dominant stator disturbances and rotor–stator interactions were identified by analyzing the unsteady static pressure field and total pressure field combined with the spinning mode theory and the acoustic wave equation. Meanwhile, the contribution of rotor–stator interactions to the vibration amplitude of the rotor blade was determined. Furthermore, the formation process of rotor–stator interactions and its influence on the selection of predicted methods were revealed, and the mechanisms of forced response were detailed.
2. Numerical Method
An in-house computational fluid dynamics (CFD) code HGAE was used for all steady and unsteady calculations. HGAE integrates a three-dimensional (3D) unstructured finite-volume compressible flow solver and a structured dynamic solver into one computing platform, which can solve the fluid-structure interaction in a coupled or uncoupled way. The CFD code has been developed and used for more than 18 years, and has been validated for various aerodynamic and aeroelastic cases [20,21,22,23,24].
2.1. Aerodynamic Models
The unsteady compressible Navier-Stokes equations are expressed as a system of conservation laws of mass, momentum and energy, and the integral form is given as:
where Ω is the control volume, ∂Ω is its boundary, and dS represents the surface area of an element. W represents the vector of conservative variables:
where ρ is the density. For the convective and viscous flux vectors:
The source term vector S is given by:
One-equation Spalart-Allmaras (S-A) turbulence model was employed for its simple discretization scheme, well convergence, good computational efficiency, and acceptable accuracy, and was widely used in solving aeroelastic problems [25,26,27]. A node-centered finite volume method was adopted to discretize the governing equations and the turbulence model equation. The convective terms and central differences for the diffusion fluxes were calculated using Roe’s upwind scheme with Monotone Upwind Scheme for Conservation Law (MUSCL) extrapolation [28,29]; thus, the numerical scheme achieved second-order accuracy. To enhance the accuracy of the time-marching solution for unsteady computations, Jamerson’s dual time-steeping technique was adopted with 15 sub-iterations [30].
2.2. Structural Models
A linear aeroelasticity model was used to compute the blade vibration, and the structural dynamic equations are given as:
where M, C, and K represent the mass, damping, and stiffness matrices, respectively; x is the displacement vector, and P(t) is the aerodynamic force vector on the blade surface. The generalized coordinates of equations are transformed via x = ϕq yields
where ϕ represents the mass-normalized mode shape matrix and q is the generalized coordinate vector; and are the modal damping and natural frequency corresponding to the mode ; L is the number of modes investigated in the aeroelastic analysis, and the modal force vector is formed as:
In this equation, is the total number of aerodynamic nodes on the blade surface and is the node index., , and represent the surface area, unit normal vector, and instantaneous blade surface pressure related to the node . The mode force, which represents the strength of the unsteady force in a specific vibration mode, is determined by the pressure fluctuation and the correlation between the pressure fluctuation and the structural mode shape. HGAE integrates the surface pressure on the rotor blade to compute the modal force at each time step in a fluid-structure-uncoupled manner, and then the maximum vibration amplitude can be post-processed to calculate [8]:
where is the amplitude of the modal force at the frequency of interest after obtaining the periodic solution; represents the value of the largest mode shape, which was obtained from the Finite Element Analysis (FEA); and is the factor representing the sum of aerodynamic damping and structural damping (structural damping was not considered in this study):
where is the aerodynamic damping ratio obtained from a flutter analysis.
3. Case Study
3.1. 1.5-Stage Axial Compressor
The numerical calculations were based on a 1.5-stage high-pressure compressor, which consisted of inlet guide vanes (IGV) followed by one stage, as shown in Figure 1. Blade numbers of the IGV, rotor1 (R1), and stator1 (S1) were 19, 23, and 30, respectively. The compressor design speed was 17,000 rpm, and the design pressure ratio was 1.45. The axial spacing between the IGV and R1, and S1 and R1 at the hub was 40 mm and 35 mm, respectively. The other design parameters are listed in Table 1. The embedded rotor was excited by the aerodynamic forcing from the upstream and downstream vane rows, and the 19 engine order (EO) and 30EO excitation lines are shown on the Campbell diagram in Figure 2. Within the operating range, only the first six blade modes were considered, and the 19EO excitation line crossed the 6th mode (M6) of 11,624 rpm (68% rotating speed), marked as a pink circle. Hence, it was the resonance point of the blade response induced by upstream IGV, but not the downstream S1.
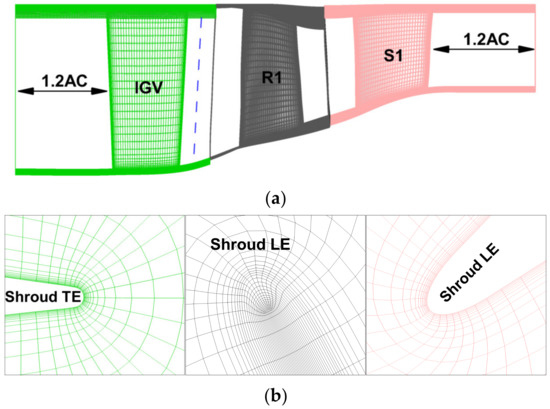
Figure 1.
Computational mesh of the 1.5-stage compressor: (a) Single-passage; (b) Blade leading edge (LE) and trailing edge (TE) at the shroud.

Table 1.
Compressor design parameters.
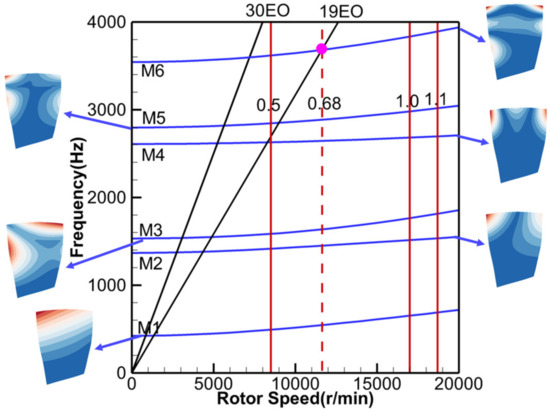
Figure 2.
R1 Campbell diagram.
3.2. Computational Mesh and Code Verification
A computational structured mesh with an O4H topology of the 1.5-stage compressor was generated by AutoGrid. Figure 1 shows a schematic of the mesh with an enlarged view near the blade leading edge (LE) and trailing edge (TE) at the shroud. The thickness of the first near-wall cell was 10−5 m and the y+ at the first cell on the solid boundary was about 5, which was suitable for the employ of the one-equation S-A turbulence model. At the midspan, the inlet and outlet of the computational domain were located at 1.2 axial chord (AC) upstream of the IGV and 1.2 AC downstream of the S1, respectively.
For the boundary conditions, the total pressure (101,325 Pa), total temperature (288.15 K), and flow angle (0 deg) were specified at the IGV inlet. At the S1 exit, the static pressure was imposed by a simple radial equilibrium equation and the working condition was changed by adjusting the back pressure. Reflecting boundary conditions were used and were considered not to have large effects on the calculation results because the inlet and outlet boundaries were far enough away from the blades. Nonslip and adiabatic conditions were imposed on all solid walls. In terms of boundary conditions specified for the turbulence transport variable, the turbulent eddy viscosity at the inlet was taken as , where denotes the laminar kinematic viscosity. At the outlet boundary, was extrapolated from the interior of the computation domain, and it was set to 0 at solid walls.
To choose the suitable mesh, a systematic grid independence verification was conducted for the 1.5-stage compressor [31], and the tests were carried out separately for the IGV, S1, and R1. For the IGV and S1 verification, three different levels of mesh densities (168,435, 314,811, and 483,075 for IGV; 174,135, 324,159, and 505,419 for S1) were conducted on a single-row, single-passage model based on the steady calculations with the same boundary conditions. Figure 3a shows the normalized absolute velocity profile at the IGV exit, which characterizes the wake and potential disturbances from upstream IGV [32]. Meanwhile, the normalized static pressure profile at the S1 inlet characterizes the potential disturbance from downstream S1, as depicted in Figure 3b. For both the absolute velocity and static pressure, the results calculated by the medium mesh, and the fine mesh and the extrapolation from the solutions of the medium and fine meshes present similar trends with only small deviations, and the maximum discretization uncertainty () is 0.34%. In the aspect of the R1 verification, three different levels of R1 meshes (216,765, 407,417, and 612,449) assembled with the medium meshes of IGV and S1 were conducted. The steady aerodynamic characteristics of the 1.5-stage compressor at 100% speed computed by the medium mesh and fine mesh were basically the same, as shown in Figure 4, and the maximum uncertainty is 0.26%. Hence, the medium meshes were chosen for the IGV (314,811), S1 (324,159), and R1 (407,417) under the consideration of accuracy requirements and computational costs.
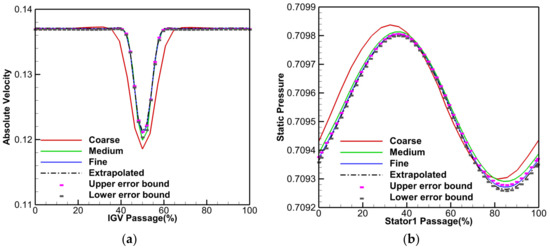
Figure 3.
Aerodynamic parameter distribution of three different meshes: (a) IGV exit absolute velocity at 30% span; (b) S1 inlet static pressure at 99% span.
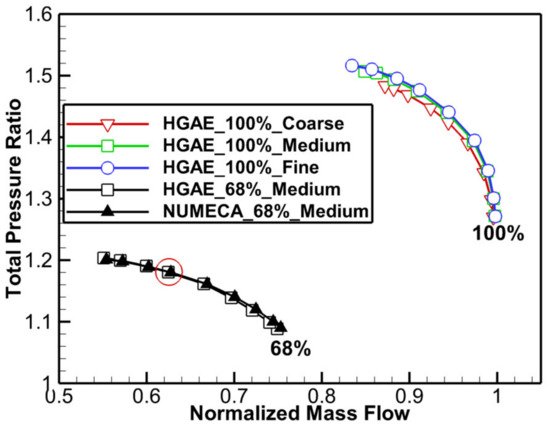
Figure 4.
Total pressure ratio of the compressor at 100% and 68% speeds.
The structured model was discretized by the hexahedral elements with 40 elements chordwise, 53 elements spanwise, and 2 elements in the direction of thickness, respectively, as depicted in Figure 5. The material properties of the rotor blade are shown in Table 2. For the FEA of the rotor blade, the fixed constrained boundary condition was used for the elements at the blade root, and the natural frequencies and mode shapes were obtained from a commercial package ANSYS. Based on the natural frequencies of the first six eigenmodes obtained from modal analyses, the Campbell Diagram is plotted in Figure 2, and the crossing of interest was identified.
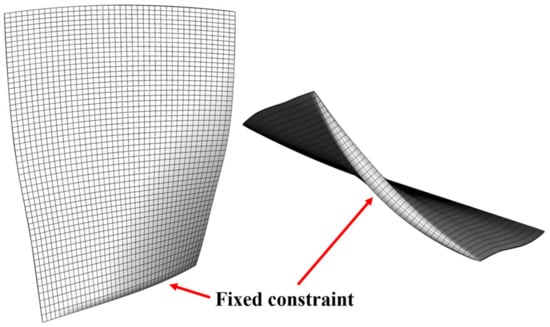
Figure 5.
Structured mesh of the rotor blade.

Table 2.
Material properties of the rotor blade.
To verify the accuracy of the computational results of the HGAE, steady calculations of the 1.5-stage compressor were also performed using a commercial CFD solver NUMECA based on the same fluid mesh. Figure 4 presents the total pressure ratio against normalized mass flow at 68% rotating speed, the aerodynamic characteristic predicted by HGAE was in good agreement with the results of NUMECA. Moreover, the quantitative comparisons were provided in Table 3, and the errors of the total pressure ratio and the adiabatic efficiency at the peak efficiency (PE) point were 0.042% and 0.148%, respectively, which demonstrates that the HGAE code can provide reliable and accurate computational results.

Table 3.
Comparison of aerodynamic characteristics at PE.
3.3. Decoupled and Coupled Configurations
To investigate the stator disturbances and rotor–stator interactions in a 1.5-stage compressor, and their contributions to the response of the embedded rotor blade, the six CFD cases using different configurations based on the decoupled and coupled methods were studied, as listed in Table 4. Case A to Case C were used to calculate the R1 response induced by upstream IGV disturbances (wake and potential field) and IGV–R1 interactions, whereas the downstream S1 disturbances (potential field) and S1–R1 interactions were investigated using Case D, Case E, and Case C.

Table 4.
Cases of decoupled and coupled configurations.
Among them, Case C was a three-row coupled configuration, which was a baseline including all the multi-row interactions in the 1.5-stage compressor. Case A was the decoupled configuration commonly adopted in industrial applications, the IGV disturbances extracted from steady calculations were applied as R1 inlet unsteady boundary condition (BC). Generally, the boundary profile is extracted at the interface between IGV and R1, just before the mixing plane (Case A-1). However, several studies have shown that the wake forcing function was underestimated compared with the results in a coupled configuration (Case B/Case C) due to the use of the mixing plane [11,14,32]. Hence, the boundary profile extracted at the IGV exit from the single-row steady-state calculation was investigated as a modified case (Case A-2), although it still has certain limitations and deficiencies. Case B was the two-row coupled configuration, where the contribution of IGV disturbances and IGV–R1 interactions to the blade vibration amplitude cannot be distinguished due to the rotor blade being excited at the same frequency in the relative frame. However, by comparing decoupled (Case A) and coupled configurations (Case B/Case C), it is possible to assess whether the inter-row interactions are significant and thus whether the decoupled method is applicable. Moreover, the use of Case D and Case E has the same meaning as the above cases.
All the unsteady calculations were performed starting from the steady solutions at the peak efficiency point of 11,624 rpm. The global time step was 5.61 × 10⁻⁶ s, corresponding to 40 time steps per rotor passage. For forced response analyses, the R1 M6 mode shape was interpolated onto the R1 fluid mesh to calculate the vibration characteristics of blades.
4. Results and Discussion
Based on the numerical data of all cases, the forced response of blades induced by upstream IGV disturbances and IGV–R1 interactions, and downstream S1 disturbances and S1–R1 interactions were analyzed, respectively. The details of each part are as follows: Firstly, the amplitude of the concerned aerodynamic wave number (AWN) was analyzed to reveal the axial propagation characteristics of stator (IGV/S1) disturbances. Next, the spinning mode theory was applied to analyze the source of rotor–stator (IGV–R1/S1–R1) interaction modes, and the acoustic properties were evaluated by solving the wave equation. Thirdly, by comparing the results calculated by decoupled and coupled configurations, the contribution of stator disturbances and rotor–stator interactions to the vibration amplitude of the rotor blade were identified. Furthermore, the mechanisms of the forced response induced by upstream and downstream aerodynamic disturbances were discussed in detail.
4.1. Forced Response Induced by Upstream IGV Disturbances and IGV–R1 Interactions
4.1.1. Wake and Potential Disturbances
It is well known that the upstream IGV induces wake and potential field, which propagate axially and excite the downstream rotor blade at the same frequency. To clear the dominant excitation source of the rotor blade, it is necessary to evaluate the effect of the wake and potential field on the rotor blade, which also helps to reveal the formation process of IGV–R1 interactions. Hence, the axial propagation characteristic and the strength of the wake and potential field were analyzed in this section.
To accurately simulate the IGV disturbances and characterize their interactions with the rotor blade, the computational results for the IGV/R1 coupled configuration (Case B) were analyzed. The instantaneous entropy and static pressure contours, which can well characterize the wake and potential disturbances in the flow field, showing the wake–rotor and potential field–rotor interactions at 30% span, are plotted in Figure 6a,b respectively. The results show that the IGV wake propagates downstream and its strength weakens significantly due to blade chops when reaching the LE of the rotor blade. In terms of the IGV potential field, Figure 6b shows that it propagates upstream and downstream and its strength decays rapidly in the axial direction. Meanwhile, the dense and non-uniform distribution of contour lines near the R1 LE indicates strong IGV–R1 interactions (Figure 6b).
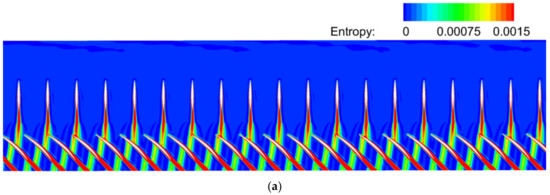
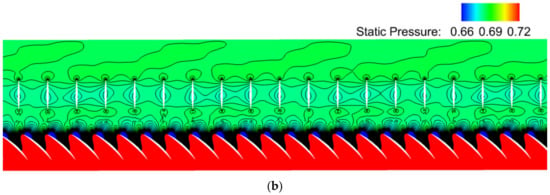
Figure 6.
Contours at 30% span (IGV/R1 coupled): (a) Instantaneous entropy; (b) Instantaneous static pressure.
For the axial propagation characteristics of the wake and potential disturbances, the above results only give qualitative evaluations, and further quantitative analyses were needed to evaluate and compare their effects on the rotor blade. Therefore, discrete Fourier transform (DFT) of the circumferential symmetric total pressure and static pressure was carried out, and the amplitude of the first-harmonic content of the IGV wake and potential disturbances with an aerodynamic wave number of 19 (19AWN) were analyzed [31]. Figure 7 shows the axial distribution of the 19AWN amplitude, from the trailing edge (TE) of IGV to a plane mid-distance between IGV TE and IGV exit at 30% span. The reason for analyzing the midplane is that its axial location, marked as a blue dotted line in Figure 1, is less affected by IGV–R1 interactions than the IGV exit (shown in Figure 6b). The results show that the strength of the wake (total pressure line) decreases slowly at a certain distance away from the IGV TE and the amplitude decreases by 0.5% per 0.001m, while the potential disturbance (static pressure line) decays exponentially and the attenuation coefficient is 88% per 0.001 m. By comparing the amplitude of the total pressure and static pressure at the midplane, it indicates that the strength of the wake is three times larger than that of the potential field. It is worth noting that there is still a 0.029 m axial distance between the midplane and R1 LE, and it can be inferred that the strength of the potential field will decrease to 4.3% of the midplane, while the wake will only decrease by about 15%. Therefore, it can be concluded that IGV disturbances are dominated by the upstream wake and may significantly contribute to the vibration amplitude of the rotor blade, which will be studied below.
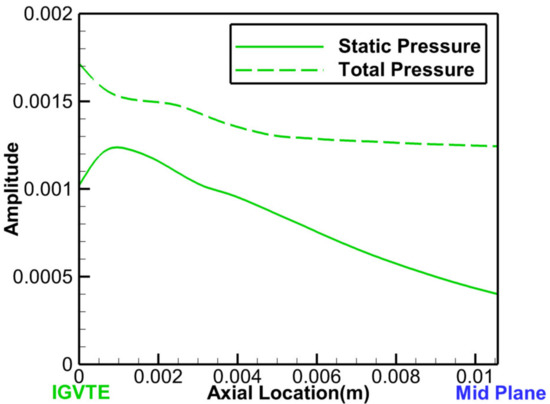
Figure 7.
Axial distribution of the 19AWN amplitude at 30% span.
4.1.2. IGV–R1 Interactions
For the IGV–R1 configuration, the rotor blade may be excited not only by the upstream IGV wake but also by the spinning modes resulting from IGV–R1 interactions. Figure 8 shows the spectrum of IGV–R1 interaction modes, which was calculated by the DFT of the circumferential instantaneous static pressure at 30% span at the IGV exit. The result shows that the compressor pressure field can be very complex due to the presence of multiple significant frequency peaks associated with the IGV–R1 interactions in the mode spectrum. Thanks to Tyler and Sofrin [12], the source of IGV–R1 interactions can be identified based on the spinning mode theory [13].
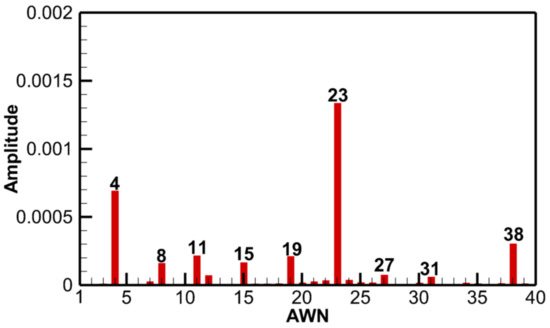
Figure 8.
The mode spectrum at the IGV exit.
In general, when the rotor blades pass through the IGV wakes, the circumferential non-uniform flow causes unsteady loads on the blades and generates the primary discrete pressure wave, which has the same AWN and frequency as the IGV wakes [33]. According to the spinning mode theory, the scattering occurs at the rotor row and the discrete pressure wave is scattered to an infinite number of continuous pressure waves. These scattered waves have the same frequency as the IGV wakes in the relative frame (), while their AWNs become the combination of IGV and R1 blade numbers (), where subscript 1 and subscript 2 denote the quantities for the stator row (stationary frame) and the rotor row (relative frame), respectively; represents the blade number, refers to the integer scattering indices, and is the rotational speed. The negative sign represents a backward traveling pressure wave in the opposite direction of the rotor, whereas the positive sign presents a forward traveling pressure wave.
The scattered pressure waves travel upstream and downstream and some of them reach the IGV row. Their frequencies are shifted in the stationary frame due to the Doppler effect (), whereas the aerodynamic wave numbers do not change (). The pressure waves subsequently impinge the IGV and are being scattered and shifted again, possibly reflecting back and interacting with the rotor blades. The frequency and AWN of reflected pressure waves are the same as the IGV wakes.
According to the formation process of IGV–R1 interactions described above, the spinning modes at the IGV exit are mainly upstream propagating pressure waves generated from the R1 row. Therefore, the source of spinning modes can be identified with different scattering indices (), and their frequencies in the relative frame and stationary frame are and respectively. The properties of spinning modes in Figure 8 are listed in Table 5.

Table 5.
The IGV–R1 interaction modes at the IGV exit.
The spinning modes listed above have 0 frequency and the first three harmonics of IGV blade passing frequency (BPF, namely 19EO) in the relative frame. However, for R1 blade vibrations, excited by the first harmonic of the upstream IGV, only the 19EO frequency contributes to the excitation of blade vibration. Hence, modes ,, and are the pressure waves of interest, and they can be characterized by of −1. Among them, modes and correspond to the first and second R1-scattered pressure waves, respectively, and the mode is the primary pressure wave due to the IGV wake. To clear the dominant excitation source of the rotor blade, the acoustic property (cut-on/cut-off) and the strength of these modes were analyzed.
A wave equation in cylindrical coordinated was solved to obtain the axial wavenumber , which determines the cut-on/cut-off of an acoustic mode, written as [34]:
where and are mean axial and circumferential Mach numbers, respectively; is the freestream wave number calculated by the freestream speed of sound and the angular frequency in the stationary frame; represents the radial-circumferential wave number calculated by the Bessel function. According to the , the acoustic cut-on frequency is defined by:
The last column of Table 5 shows the acoustic property of the spinning modes of interest. Modes and are cut-on upstream, which demonstrates that they propagate in the axial direction without any attenuation, can impinge on the IGV, and may reflect back, and interact with the rotor blades. In terms of the mode , it is cut off upstream and decays exponentially, and thus has little effect on the rotor blades. To compare the strength of modes and , the fluctuation amplitude normalized by the strength of the R1 wake at 99% span is shown in the second column of Table 5. The results show that the amplitude of the mode is approximately nine times larger than that of the mode . Hence, it can be concluded that the IGV–R1 interactions are dominated by the mode , which is generated by the interaction between the first harmonic of IGV and the first harmonic of R1, and its dominance is related to the close blade number of IGV and R1.
4.1.3. Contribution of Upstream Disturbances to Blade Vibration Amplitude
The above analyses have clarified the dominant IGV disturbances and the IGV–R1 interactions. However, since the rotor blade was excited by them at the same frequency, their contributions to the blade vibration cannot be distinguished. Hence, in this section, the calculation results of the decoupled (Case A-1 and Case A-2) and coupled (Case B and Case C) configurations were compared to reveal the dominant excitation source of the blade vibration.
Before comparing the results for different cases, it is critical to ensure that the working conditions of the rotor blade are the same. The deviation of mass flow rate, total pressure ratio, and adiabatic efficiency among the four cases were less than 0.2%. Meanwhile, the time-averaged pressure of the rotor blade at 30% span was compared, and the results show that the blade loading of the decoupled and coupled cases is the same, as presented in Figure 9. Therefore, it is reasonable to compare the blade vibration amplitude among different cases; the results are shown in Table 6.
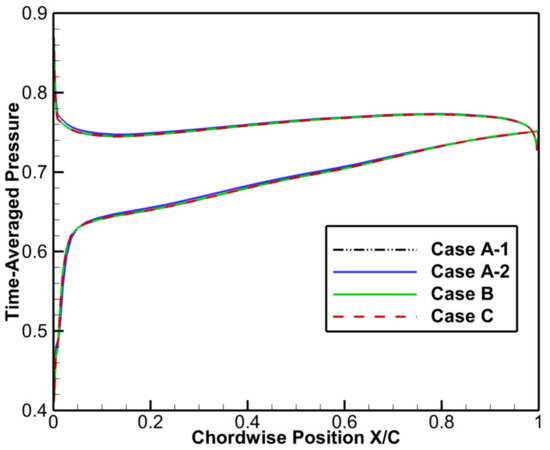
Figure 9.
R1 time-averaged pressure at 30% span.

Table 6.
Maximum vibration amplitude of Case A to Case C.
For the rotor blades subjected to 19EO excitation arising from the IGV wake and IGV–R1 interactions (mode ), no matter which is dominant, the response will occur in BM6/4ND. This is because the aerodynamic wave number of the former is 19, which is higher than the half number of rotor blades (23), thus the 4ND response is excited through the spatial aliasing, while the mode will excite the 4ND response directly. Hence, the amplitude of the BM6/4ND modal force was computed, and the maximum vibration amplitude in Table 6 was calculated using Equation (8).
The response of all cases was normalized by the vibration amplitude of Case C, the response of Case B was only 1% less than Case C, indicating that the downstream S1 has little influence on the BM6/4ND response of the rotor blade, and the two-row coupled configuration (IGV/R1) can accurately predict the blade vibration amplitude. In terms of Case A-1 and Case A-2, the vibration amplitude predicted by the former was 21% less than Case B, whereas the latter was only 4%. To explain the difference between the results of the two decoupled configurations, the radial distribution of the fluctuating amplitude of entropy (19AWN) at the IGV exit was computed to compare the wake strength of different cases, as plotted in Figure 10. Consistent with the results reported in the literature, the wake strength of Case A-1 is lower than that of Case B or Case C in all spans because of the use of the mixing plane. Hence, the 21% difference in blade response is not only the contribution of IGV–R1 interactions but also due to the underestimation of the wake forcing function. With respect to Case A-2, the wake strength is more similar to that of Case B, being higher only at low spans, and this difference does not have a large impact on the blade vibration amplitude because the BM6 mode shape near this region is small (shown in Figure 2). Therefore, the 4% difference is considered to be mainly contributed by the IGV–R1 interactions. According to the above analyses, the dominant excitation source of the R1 blade vibration induced by upstream aerodynamic disturbances is the IGV wake, and the decoupled method is still applicable in this case.
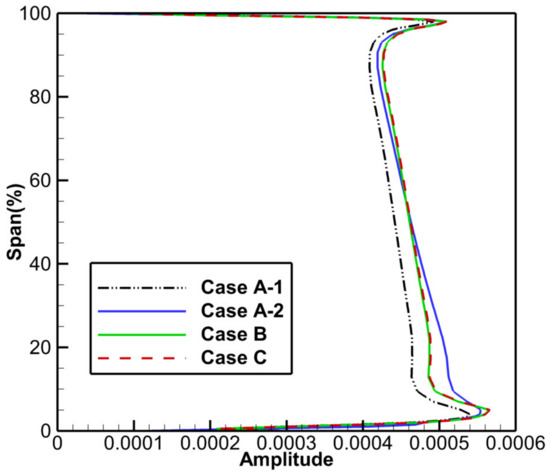
Figure 10.
Radial distribution of the fluctuating entropy amplitude (19AWN) at the IGV exit.
4.2. Forced Response Induced by Downstream S1 Disturbances and S1–R1 Interactions
4.2.1. Potential Field
The downstream S1 only induces the potential field that excites the upstream rotor, and its axial propagation characteristic is shown in Figure 11. The amplitude of the first-harmonic content of the S1 potential field with 30AWN was analyzed for a coupled case (Case E), and the results show that the potential field decays exponentially from the S1 LE to the S1 inlet (shown in Figure 1). The attenuation coefficient is 85% per 0.001 m, and it can be inferred that the strength of the potential field will decrease to 5.9% of the S1 inlet when it reaches the R1 TE 0.0176 m away from the S1 inlet. Compared with the strength of the IGV potential field (shown in Section 4.1), it can be concluded that the S1 potential field has little effect on the vibration amplitude of the rotor blade.
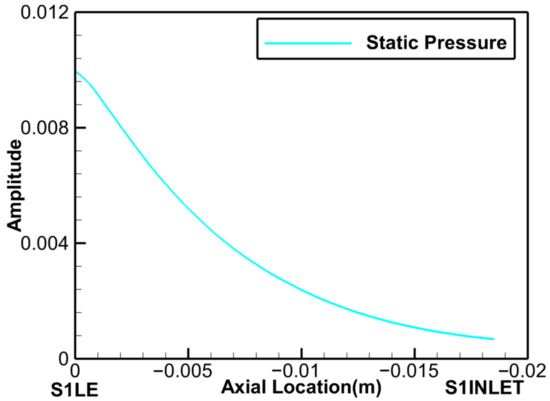
Figure 11.
Axial distribution of the 30AWN amplitude at 99% span.
4.2.2. S1–R1 Interactions
For the S1–R1 configuration, the rotor blade may also be excited by the spinning modes due to S1–R1 interactions, and the spectrum calculated by the DFT of the circumferential instantaneous static pressure at 99% span at the S1 inlet is presented in Figure 12. The formation process of S1–R1 interactions is tentatively considered to be similar to the IGV–R1 interactions, where the pressure waves are generated by the interactions between the S1 potential field and the rotor blades. Hence, the spinning modes at the S1 inlet are mainly downstream propagating pressure waves generated from the R1 row, and the source of modes in Figure 12 was identified based on the spinning mode theory, as listed in Table 7.
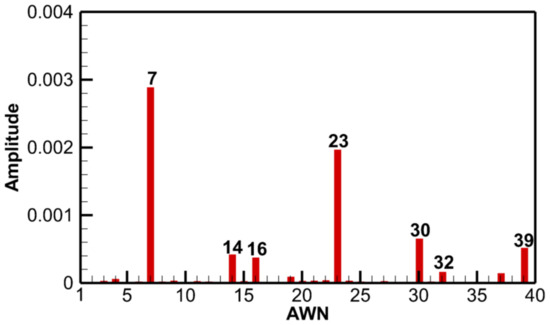
Figure 12.
The mode spectrum at the S1 inlet.

Table 7.
The S1–R1 interaction modes at the S1 inlet.
In the relative frame, the spinning modes in Table 7 have 0 frequency and the first two harmonics of S1 BPF, whereas the R1 blade vibration induced by the first harmonic of the downstream S1 is only contributed by the 30EO excitation. Hence, modes ,, , and are the pressure waves of interest. Among them, modes , , and correspond to the first, second, and third R1-scattered pressure waves, respectively, and mode is considered as the S1 potential disturbance.
The acoustic property of the spinning modes of interest shows that modes and are cut-on downstream, suggesting that they can impinge on the S1 and may reflect back and interact with the rotor blades. In terms of the mode , it is cut-off downstream, and thus has little effect on the rotor blades. Furthermore, the second column of Table 7 shows that the amplitude of mode is about eight times larger than mode . Hence, it can be concluded that the S1–R1 interactions are dominated by mode , and its dominance is associated with the close blade number of S1 and R1.
4.2.3. Contribution of Downstream Disturbances to Blade Vibration Amplitude
In this section, the calculated results of the decoupled (Case E) and coupled (Case D and Case C) configurations were compared to reveal the dominant aerodynamic excitation of the blade vibration. The time-averaged pressure of the rotor blade at 99% span was first compared in Figure 13, and the results show that the working conditions of the blades are the same. Then, the BM6/-7ND response of different cases was compared and the results are shown in Table 8.
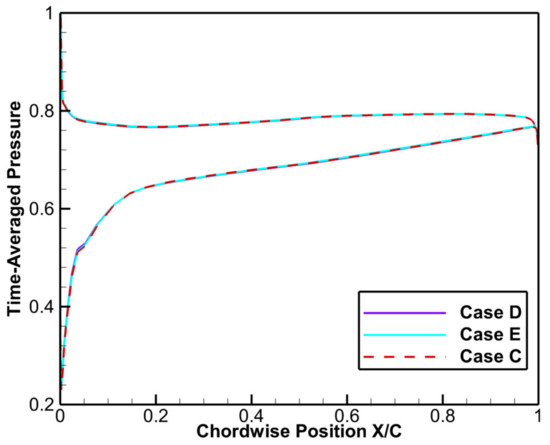
Figure 13.
R1 time-averaged pressure at 99% span.

Table 8.
Maximum vibration amplitude of different cases.
The response of Case E was 14% less than Case C, indicating that the upstream IGV has a certain influence on the BM6/-7ND response of the rotor blade. In terms of Case D, the vibration amplitude was 97.7% less than Case E and 98% less than Case C, suggesting that the dominant excitation source of the blade vibration is the S1–R1 interaction, and the S1 potential field contributes little to the R1 response, which is consistent with the results presented in Section 4.2.1.
To our surprise, the vibration amplitude of the rotor blade considering the effect of S1–R1 interactions is more than 40 times larger than when considering only the S1 potential field. If, as described above, the S1–R1 interactions generated by the interactions between the S1 potential field and rotor blades should have little effect on the R1 response due to the negligible strength of the S1 potential field. This means that the S1–R1 interactions may be not generated by the usual formation process of the rotor–stator interactions, that is, maybe independent of the S1 potential field, which will be clarified in the next section.
4.3. Mechanism of Forced Response Induced by Upstream and Downstream Disturbances
For the response of rotor blades induced by the upstream IGV wake and IGV–R1 interactions, the effect of rotor–stator interactions on blades is not significant, whereas it plays a decisive role in the blade response caused by the downstream S1 potential field and S1–R1 interactions. To explain this difference, the formation process of rotor–stator interactions was studied by analyzing the unsteady pressure field, and the mechanism of the blade vibration induced by upstream and downstream aerodynamic disturbances was further revealed.
Figure 14 shows the fluctuating pressure contours of the decoupled (case A-2) and two-row IGV/R1 coupled configurations (case B), and the mode generated by IGV–R1 interactions can be clearly seen in both configurations (four strip-shaped positive and negative fluctuating pressure regions throughout the blade passage). As mentioned above, the pressure wave that may have some influence on the rotor blade in the coupled configuration is mode generated from the R1 LE and subsequently reflected by the upstream IGV, which does not exist in the decoupled configuration. In Figure 14a,b, the distributions and amplitudes of the fluctuating pressure in the R1 passage are basically the same, indicating that the strength of the reflected mode is small, thus its contribution to the R1 response is limited (shown in Table 6).
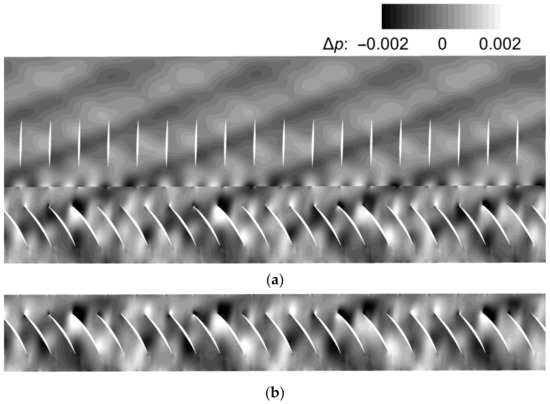
Figure 14.
The fluctuating pressure contours at 30% span: (a) Case B (coupled IGV/R1); (b) Case A-2 (decoupled R1).
In terms of fluctuating pressure contours of the decoupled and R1-S1 coupled configurations, the strong mode generated by S1–R1 interactions can be observed in the coupled configuration (three-and-a-half strip-shaped positive and negative fluctuating pressure regions throughout the blade passage of the half annulus shown in Figure 15a), which is not found in the decoupled configuration (Figure 15b). It is confirmed that mode is not generated by the interaction between the downstream potential field and rotor blades. According to the distribution and amplitude of the fluctuating pressure in the R1 passage and S1 passage, it is found that mode is generated from the S1 LE because the fluctuation here is the highest, and it propagates upstream and subsequently interacts with the rotor blade. Analogous to the IGV–wake–R1 interactions, the R1 wake can also interact with the downstream S1, thereby generating the pressure waves propagating upstream and downstream from the S1 LE. The cut-on pressure waves propagating upstream (mainly refers to the mode ) can excite the R1 at the same frequency as the S1 potential field, whereas they are not included in the decoupled configuration, and thus the R1 vibration amplitude of the two configurations differs dramatically (shown in Table 8).
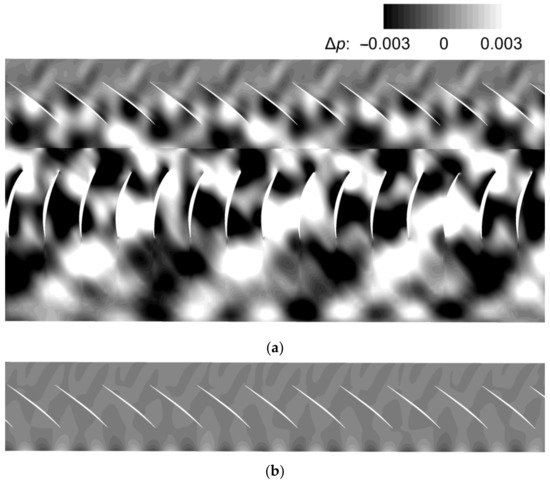
Figure 15.
The fluctuating pressure contours at 99% span (half annulus): (a) Case E (coupled R1/S1); (b) Case D (decoupled R1).
Mechanisms of the R1 forced vibration induced by upstream and downstream aerodynamic disturbances are presented in Figure 16 and Figure 17, respectively. The thick blue arrow represents the disturbances from the upstream IGV or the downstream S1, and the thick green arrow presents the rotor–stator interactions or the disturbances from the embedded R1. Meanwhile, the green and blue arrows with thin dashed lines represent the cut-off pressure waves or the reflected pressure waves. Figure 16 shows that the dominant upstream excitation source of the R1 response is the IGV wake. Since the upstream wake can be applied as the R1 inlet BC in a single-row configuration, shown in Figure 16b, the vibration amplitude of the rotor blade can be predicted by the decoupled method. In the aspect of the R1 vibration induced by the downstream S1 disturbances and S1–R1 interactions, the S1–R1–interaction mode is dominant, as depicted in Figure 17. Because the decoupled configuration cannot take this effect into account (shown in Figure 17b), it is necessary to use the coupled method to accurately predict the vibration amplitude.
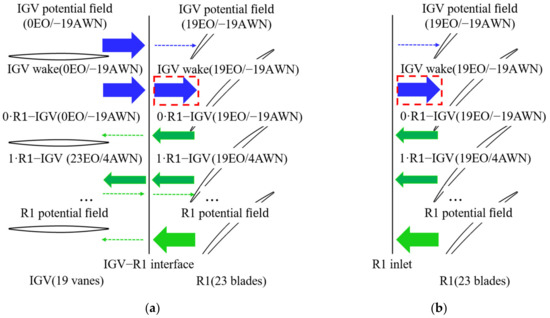
Figure 16.
Mechanism of forced vibration induced by upstream aerodynamic disturbances: (a) IGV–R1 coupled configuration (Case B); (b) Decoupled configuration (Case A-2).
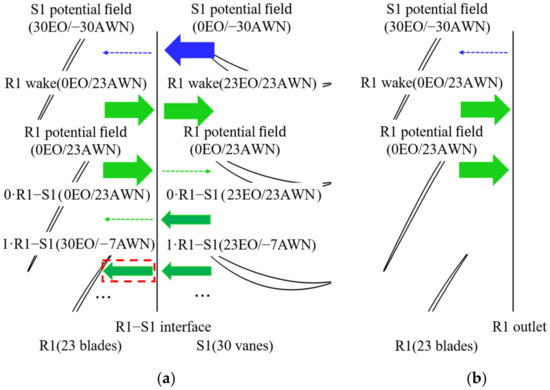
Figure 17.
Mechanism of forced vibration induced by downstream aerodynamic disturbances: (a) R1–S1 coupled configuration (Case E); (b) Decoupled configuration (Case D).
In conclusion, the contribution of rotor–stator interactions to the vibration amplitude of the rotor blade determines whether the decoupled method or coupled method should be used, and the formation process of rotor–stator interactions is the key factor. The formation of IGV–R1 interactions is closely related to the IGV wake, generated near the R1 LE and propagated upstream. The pressure waves acting on the rotor blade can only be generated after interacting with the IGV, which is the usual formation process of rotor–stator interactions as described in literatures [13,19,33]. However, for the S1–R1 interactions, this study analogized a formation process independent of the S1 potential field, which has rarely been reported. It was generated by the interaction between the R1 wake and the S1 vane near the S1 LE and propagated upstream, which can directly act on the rotor blade; thus, the effect is significant and this is the reason why including downstream stator vanes is very important.
5. Conclusions
This paper conducted a numerical study on the forced response of an embedded compressor rotor induced by upstream and downstream stator disturbances and rotor–stator interactions, respectively. The axial propagation characteristics and strengths of stator disturbances and rotor–stator interactions were analyzed to clarify the dominant aerodynamic disturbances. Different configurations based on the decoupled and coupled methods were applied to identify the contribution of stator disturbances and rotor–stator interactions to the vibration amplitude of the rotor blade. The main conclusions can be summarized as follows:
- The axial distribution of the fluctuating static pressure amplitude and total pressure amplitude shows that the IGV disturbances are dominated by the wake, and the IGV and S1 potential fields have little effect on the R1 response for the not small axial spacing between the rotor and stator. The results based on the spinning mode theory and the wave equation illustrate that the IGV–R1 interactions and S1–R1 interactions are dominated by the cut-on pressure wave 19EO/4AWN and 30EO/-7AWN, respectively.
- For the forced response induced by upstream IGV disturbances and IGV–R1 Interactions, the dominant excitation source of the R1 response is the IGV wake, and the vibration amplitude of the rotor blade can be predicted by the decoupled method, where the IGV wake is applied as the inlet boundary condition to single-row configurations.
- In terms of the R1 response induced by the downstream S1 disturbances and S1–R1 interactions, the cut-on S1–R1–interaction mode 30EO/-7AWN is dominant, and the use of the decoupled method without considering its influence will lead to inaccurate predictions of the R1 response; thus, the coupled method considering at least two rows of configurations is necessary.
- The formation process of the rotor–stator interactions is the key factor that determines whether the decoupled method or the coupled method should be used. The cut-on pressure wave generated by the interaction between the front row disturbance and the current row has a huge impact on the front row, rather than the current row. This explains why, for a 1.5-stage compressor with the IGV/R1/S1 configuration, the effect of R1–wake–S1 interactions on R1 response is larger than that of the IGV–wake–R1 interactions. Hence, for the forced response prediction of the embedded rotor, including the downstream S1 is more important than including the upstream IGV in some cases.
The above conclusions imply that, during the design phase of the compressor blade, the method (number of blade rows) for forced response predictions should be chosen carefully. For the IGV–R1 configuration, if the axial spacing between the IGV and R1 is not very small, the decoupled method can be used to accurately and efficiently predict the blade response. In the aspect of the R1–S1 configuration, if the blade number of the rotor and stator is close, the resultant pressure wave with low AWN is extremely easy to cut-on, thus the coupled method should be used regardless of the axial gap size.
Author Contributions
Conceptualization, Q.G. and H.Y.; methodology, Q.G. and H.Y.; software, Y.Z.; validation, Y.Z. and Q.G.; formal analysis, Q.G. and H.Y.; investigation, H.Y. and Q.G.; resources, H.Y. and Y.Z.; data curation, Y.Z.; writing—original draft preparation, Q.G.; writing—review and editing, Q.G.; visualization, Q.G.; supervision, H.Y.; project administration, Y.Z.; funding acquisition, Y.Z. All authors have read and agreed to the published version of the manuscript.
Funding
This research was funded by the National Science and Technology Major Project, China (Grant No.2017-II-0009-0023).
Data Availability Statement
Not applicable.
Acknowledgments
The authors gratefully acknowledge the technical help from Xiubo Jin at Beihang University.
Conflicts of Interest
The authors declare no conflict of interest.
References
- Murray, W.L., III; Nicole, L.K. Experimental investigation of a forced-response condition in a multistage compressor. J. Propul. Power 2015, 31, 1320–1329. [Google Scholar] [CrossRef]
- David, M.; William, M.; Nicole, L.K.; Fulayter, R. Experimental and Computational Study of Forced Response in a Multistage Axial Compressor. In Proceedings of the 53rd AIAA Aerospace Sciences Meeting, Kissimmee, FL, USA, 5–9 January 2015. [Google Scholar]
- Monk, D.J.; Key, N.L.; Fulayter, R.D. Reduction of aerodynamic forcing through introduction of stator asymmetry in axial compressors. J. Propul. Power 2016, 32, 134–141. [Google Scholar] [CrossRef]
- Manwaring, S.R.; Wisler, D.C. Unsteady aerodynamic and gust response in compressors and turbine. J. Turbomach. 1993, 115, 724–740. [Google Scholar] [CrossRef]
- Kielb, R.; Chiang, H.W. Recent Advancements in Turbomachinery Forced Response Analyses. In Proceedings of the 30th Aerospace Sciences Meeting and Exhibit, Reno, NV, USA, 6–9 January 1992. [Google Scholar]
- Sayma, A.I.; Vahdati, M.; Imregun, M. Turbine forced response prediction using an integrated non-linear analysis. Proc. Inst. Mech. Eng. Part K 2000, 214, 45–60. [Google Scholar] [CrossRef]
- Vahdati, M.; Sayma, A.I.; Imregun, M. An integrated nonlinear approach for turbomachinery forced response prediction. Part II: Case studies. J. Fluids Struct. 2000, 14, 103–125. [Google Scholar] [CrossRef]
- Vahdati, M.; Sayma, A.I.; Imregun, M.; Simpson, G. Multibladerow forced response modeling in axial-flow core compressors. J. Turbomach. 2007, 129, 412–420. [Google Scholar] [CrossRef]
- Sanders, C.; Terstegen, M.; Jeschke, P.; Schoenenborn, H.; Heners, J.P. Rotor–stator interactions in a 2.5-stage axial compressor—Part II: Impact of aerodynamic modeling on forced response. J. Turbomach. 2019, 141, 101008. [Google Scholar] [CrossRef]
- Mao, Z.P.; Hegde, S.; Pan, T.Y.; Kielb, R.E.; Zori, L.; Campregher, R. Influence of Rotor-Stator Interaction and Reflecting Boundary Conditions on Compressor Forced Response. In Proceedings of the ASME Turbo Expo 2018: Turbomachinery Technical Conference and Exposition, Oslo, Norway, 11–15 June 2018; Volume 2A: Turbomachinery. [Google Scholar]
- Li, J.; David, C.; Stefan, S.; Besem, F.; Kielb, R.E. Wake and Potential Interactions in a Multistage Compressor. In Proceedings of the 14th International Symposium on Unsteady Aerodynamics, Aeroacoustics & Aeroelasticity of Turbomachines, Stockholm, Sweden, 8–11 September 2015. [Google Scholar]
- Tyler, J.M.; Sofrin, T.G. Axial Flow Compressor Noise Studies; SAE Technical Paper 620532; SAE: Warrendale, PA, USA, 1962. [Google Scholar]
- Hall, K.C.; Silkowski, P.D. The influence of neighboring blade rows on the unsteady aerodynamic response of cascades. J. Turbomach. 1997, 119, 85–93. [Google Scholar] [CrossRef]
- Besem, F.M.; Kielb, R.E.; Galpin, P.; Zori, L.; Key, N.L. Mistuned forced response predictions of an embedded rotor in a multistage compressor. J. Turbomach. 2016, 138, 061003. [Google Scholar] [CrossRef]
- Hegde, S.; Mao, Z.P.; Pan, T.Y.; Zori, L.; Campregher, R.; Kielb, R. Separation of up and downstream forced response excitations of an embedded compressor rotor. J. Turbomach. 2019, 141, 091013. [Google Scholar] [CrossRef]
- Hegde, S.; Kielb, R.E.; Zori, L.; Campregher, R. Impact of Multi-Row Aerodynamic Interaction on the Forced Response Behaviour of an Embedded Compressor Rotor. In Proceedings of the ASME Turbo Expo 2020: Turbomachinery Technical Conference and Exposition, Virtual, Online, 21–25 September 2020; Volume 2E: Turbomachinery. [Google Scholar]
- Schoenenborn, H.; Ashcroft, G. Comparison of Non-Linear and Linearized CFD Analysis of the Stator–Rotor Interaction of a Compressor Stage. In Proceedings of the ASME Turbo Expo, Duesseldorf, Germany, 16–20 June 2014. [Google Scholar]
- Schoenenborn, H. Analysis of the effect of multirow and multipassage aerodynamic interaction on the forced response variation in a compressor configuration—Part I: Aerodynamic excitation. J. Turbomach. 2018, 140, 051004. [Google Scholar] [CrossRef]
- Terstegen, M.; Sanders, C.; Jeschke, P.; Schoenenborn, H. Rotor–stator interactions in a 2.5-stage axial compressor—Part I: Experimental analysis of Tyler–Sofrin modes. J. Turbomach. 2019, 141, 101002. [Google Scholar] [CrossRef]
- Zheng, Y. Computational Aerodynamics on Unstructured Meshes. Doctoral Thesis, School of Engineering, Durham University, Durham, UK, 2004. [Google Scholar]
- Zheng, Y.; Yang, H. Coupled fluid-structure flutter analysis of a transonic fan. Chin. J. Aeronaut. 2011, 24, 258–264. [Google Scholar] [CrossRef]
- Zheng, Y.; Gao, Q.Z.; Yang, H. Non-synchronous blade vibration analysis of a transonic fan. Chin. J. Aeronaut. 2023, 36, 178–190. [Google Scholar] [CrossRef]
- Zheng, Y.; Gao, Q.Z.; Yang, H. Aeroelastic vibration analysis of a 1.5 stage compressor. Propuls. Power Res. 2020, 9, 26–36. [Google Scholar] [CrossRef]
- Zheng, Y.; Jin, X.B.; Yang, H. Effects of asymmetric vane pitch on reducing low-engine-order forced response of a turbine stage. Aerospace 2022, 9, 694. [Google Scholar] [CrossRef]
- Spalart, P.; Allmaras, S. A One-Equation Turbulence Model for Aerodynamic Flows. In Proceedings of the 30th Aerospace Sciences Meeting and Exhibit, Reno, NV, USA, 6–9 January 1992. [Google Scholar]
- Espinal, D.; Im, H.S.; Zha, G.C. Full-annulus simulation of nonsynchronous blade vibration excitation of an axial compressor. J. Turbomach. 2018, 140, 031008. [Google Scholar] [CrossRef]
- Stapelfeldt, S.; Brandstetter, C. Non-synchronous vibration in axial compressors: Lock-in mechanism and semi-analytical model. J. Sound Vib. 2020, 488, 115649. [Google Scholar] [CrossRef]
- Roe, P.L. Approximate Riemann solvers, parameter vectors, and difference schemes. J. Comput. Phys. 1981, 43, 357–372. [Google Scholar] [CrossRef]
- Van Leer, B. Towards the ultimate conservative difference scheme. J. Comput. Phys. 1997, 135, 229–248. [Google Scholar] [CrossRef]
- Jameson, A. Time Dependent Calculations Using Multigrid, with Applications to Unsteady Flows Past Airfoils and Wings. In Proceedings of the 10th Computational Fluid Dynamics Conference, Honolulu, HI, USA, 24–26 June 1991. [Google Scholar]
- Celik, I.B.; Ghia, U.; Roache, P.J.; Freitas, C.J. Procedure for estimation and reporting of uncertainty due to discretization in CFD applications. J. Fluids Eng. 2008, 130, 078001. [Google Scholar]
- Li, J.; Aye-Addo, N.; Kormanik, N., III; Matthews, D.; Key, N.; Kielb, R. Mistuned Higher-Order Mode Forced Response of an Embedded Compressor Rotor: Part I—Steady and Unsteady Aerodynamics. In Proceedings of the Turbo Expo: Power for Land, Sea, and Air, Charlotte, NC, USA, 26–30 June 2017. [Google Scholar]
- Leng, Y.J.; Key, N.L. Utilization of fast response pressure measurements to non-intrusively monitor blade vibration in axial compressors. J. Turbomach. 2020, 142, 031001. [Google Scholar] [CrossRef]
- Kypros, M.; Bernhard, S.; Tom, H. Effect of clocking on compressor noise generation. AIAA J. 2018, 56, 4225–4231. [Google Scholar]
Disclaimer/Publisher’s Note: The statements, opinions and data contained in all publications are solely those of the individual author(s) and contributor(s) and not of MDPI and/or the editor(s). MDPI and/or the editor(s) disclaim responsibility for any injury to people or property resulting from any ideas, methods, instructions or products referred to in the content. |
© 2023 by the authors. Licensee MDPI, Basel, Switzerland. This article is an open access article distributed under the terms and conditions of the Creative Commons Attribution (CC BY) license (https://creativecommons.org/licenses/by/4.0/).
