Abstract
As the core component of the flexible nozzle on solid rocket motors, the flexible joint relies on the shear deformation of its silicone rubber elastomers to achieve a large vector angle, and the joint is prone to fatigue failure when working under high pressure. Aiming to resolve the fatigue failure of flexible joint elastomers, the cracking energy density (CED) method was introduced into the fatigue analysis of flexible joints. A convenient integral formula for calculating the CED of elastomers was derived from the Ogden second-order constitutive model. The CED at the maximum value of the first principal elongation of the joint under 12.3 MPa and 6° swing angle was calculated by the finite element analysis (FEA), and then the fatigue life prediction of elastomers was conducted. The results show that the CED method can better predict the swing fatigue life and cracking plane orientation of elastomers compared with the SED. The results also show that the derived formula can efficiently and accurately obtain the CED distribution of the dangerous area of elastomers under load. The ratio of predicted life to measured life is 1/1.12 within the double dispersion factor. The predicted crack location and cracking plane orientation agree well with the fatigue test result. The method can provide a theoretical reference for fatigue analysis and structural reliability design of flexible joints.
1. Introduction
Flexible nozzles have been widely used in rocket motor thrust vector control systems because of their rapid response, lower thrust loss and high reliability [,,,]. The flexible joint of the nozzle is a metal-rubber layered composite structure, as shown in Figure 1. The large swing angle of joint is realized by the shear deformation of its rubber elastomers. In this structure, the material of elastomers is usually made of silicone rubber. The silicone rubber is a semi-inorganic polymer with excellent high and low temperature resistance along with dynamic properties. The experimental results show that the flexible joint of swing nozzles continues to swing under high pressure, and its elastomers are prone to fatigue failure, which affects the reliability and service life of the joint [,]. Therefore, it is essential to accurately predict the swing fatigue life of the flexible joint.
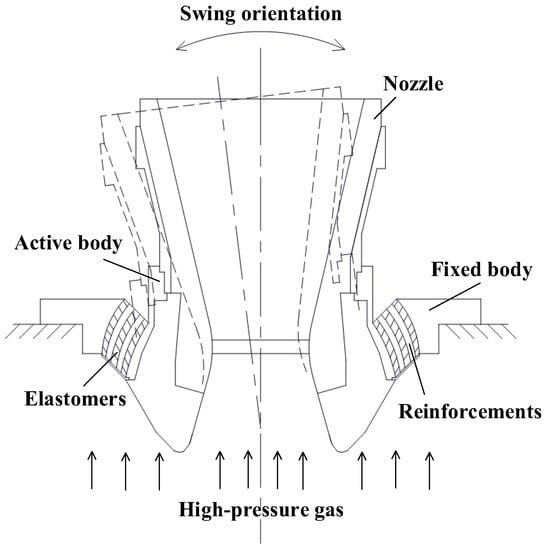
Figure 1.
Swing nozzle and flexible joint.
Wan et al. [] successfully predicted the swing fatigue life of a certain flexible joint under different levels of pressure by combining the S–N curve method with the finite element analysis (FEA). However, in order to establish the fatigue life database, the S–N curve method must use the actual products for the fatigue test, which causes a huge cost for the test. Liu et al. [] considered strain energy density (SED) as the damage parameter of the flexible joint elastomers to predict its multiaxial fatigue life by the crack propagation method. However, the cracking plane orientation of the elastomers cannot be obtained by their multiaxial stress finite element fatigue algorithm based on SED. In addition, the actual fatigue life of the flexible joint was not obtained in the test, so the predicted fatigue life was not verified by the fatigue test result.
The S–N curve method and the fatigue crack propagation are widely used in engineering to evaluate the fatigue life of rubber products. In order to understand the fatigue properties of materials, the S–N curve method requires a lot of time and resources to build a huge fatigue experiment database. Hence, scholars have tried to provide theoretical assurance for the fatigue assessment of rubber materials. The fatigue crack propagation method based on fracture mechanics was first proposed by Griffith [] and was successfully applied to the fatigue analysis of metal materials. At present, the Paris model [,], the rigid insert crack closure (RICC) model [,,,], the scanning electron microscopy (SEM) observation [,] and other effective methods have been developed in the field of metal fatigue. Due to the long application history and relatively mature methods of metal fatigue, Thomas et al. [,], Saintier [] and Mars et al. [,] successively applied Griffith’s theory to the fatigue research of rubber materials, and they developed various fatigue analysis models.
In practice, the fatigue failure of rubber products is mostly caused by complex multiaxial loads. The energy-based method is a typical fatigue criterion in the field of rubber multiaxial fatigue analysis. Rivlin et al. [] first proposed an SED model for predicting the tearing energy and predicted the crack growth behavior of rubber materials under fluctuating stress. Recently, Boulenouar et al. [] and El Yaagoubi et al. [] simulated the crack growth of rubber-like materials and unfilled rubber under mixed-mode loading based on the SED approach, respectively. The use of an SED criterion as a fatigue damage parameter is the simplest way to take into account both the strain and the stress parameters []. As the SED is a scalar parameter, it cannot provide any indication of the crack orientation.
Mars [] proposed the concept of cracking energy density (CED) in 2002, which is used as a damage parameter to explain the crack propagation phenomenon of rubber materials in multiaxial fatigue condition, and achieved a good agreement in the fatigue life prediction of rubber parts under multiaxial load. Tee Yun Lu et al. [] conducted a comprehensive review on the multiaxial fatigue theory of rubber, especially the CED method. Pan et al. [] used four fatigue life prediction models to study the effect of cerium oxide on the multiaxial fatigue life of vulcanized natural rubber under different strain amplitudes and loading paths. It was found that the CED model was a better damage indicator and gave better physical meaning than the SED model. Wang et al. [,] successfully predicted the fatigue life of a vehicle rubber isolator based on the CED and the crack propagation characteristic parameters of rubber materials. Peng et al. [] investigated the CED distribution characteristics in the finite deformation and estimated rubber fatigue life using the CED criterion. However, their formulae of the CED were too complex to apply. Belkhiria et al. [] integrated the CED methods proposed by Mars with Saintier’s experimental research carried out in tension and torsion modes, and they predicted the occurrence of the first crack and its possible orientation depending on the type of loading path. However, it was difficult to obtain the CED by solving the integral of the expression containing tensor. As a portion of the SED, the CED is able to generate the first crack on a given material plane. It is capable of predicting both crack initiation and orientation due to its critical plane feature.
Moreover, the previous application of the CED was aimed at natural rubber, and it used Mooney–Rivlin’s hyperelastic model to predict the fatigue life of rubber products [,]. Compared with common rubber products such as a vibration isolator and rubber spring [,,], whose fatigue failure is mainly caused by tensile and compressive stress, the stress state of the flexible joint elastomer is more complex. The main deformation of elastomers is a large shear deformation when a flexible joint swings under pressure. The Ogden constitutive model can better characterize the mechanical properties of elastomers than the Mooney–Rivlin model []. The Ogden constitutive model can accurately characterize the mechanical behavior of rubber under large strain and various deformation, and can directly express the function of main elongation [].
Previous research on the swing fatigue life of flexible joint have been limited to the S–N curve method and SED criterion. The fatigue life test was only carried out on rubber specimens, and lacked comparative verification between the actual product fatigue test and theoretical analysis. In this paper, it is considered that the fine flaws of elastomers are inherent cracks in the rubber material. In addition, the CED was used as the damage parameter to analyze the fatigue of silicone rubber elastomers by the crack propagation method. A convenient integral formula of the CED was derived by using the Ogden second-order constitutive model. Combined with the fatigue crack growth model of silicone rubber and finite element analysis, the swing fatigue life and cracking plane orientation of the flexible joint were accurately predicted.
2. The Calculated Expression of the CED for Silicone Rubber Elastomers
2.1. General Expression of CED Increment under Finite Strain and Non-Linear Elastic Conditions
The method of CED was first proposed by Mars [,], and gradually applied to the prediction of rubber fatigue life. The stress state of rubber fatigue crack is shown in Figure 2, where is the unit normal vector of the cracking plane at a certain point in the rubber. , are the composite stress vector and the increment of the corresponding strain, respectively. λ1, λ2 are the first and second principal elongation, and θ is the crack angle orientation between the direction of the first principal elongation λ1 and the unit normal vector , as shown in Figure 2. The CED can be regarded as the damage parameter driving the fatigue crack growth of rubber, and its increment noted dWc can be defined as the vector product of the stress vector and the corresponding strain increment under small strain, as follows []:
dWc is the differential work carried out by the stress on the normal vector of the cracking plane at a certain point of material, and the CED on various planes at this point is also different. Therefore, the CED can characterize the cracking orientation owing to its critical plane feature. In addition, the composite stress vector at any point has the effect of both tangential stress and normal stress, so the expression of dWc is suitable for the complex three-dimensional stress state. The elastomers of the flexible joint were mainly subjected to shear stress and internal pressure when the joint swung. The loading condition of elastomer belongs to multiaxial stress state, so the Equation (1) can be applied to fatigue analysis of the flexible joint.
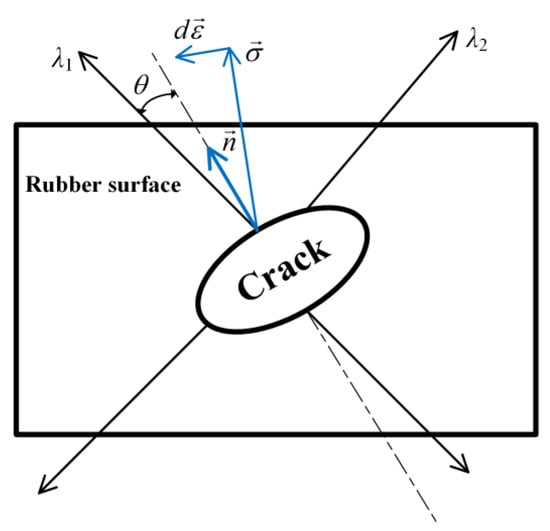
Figure 2.
Stress state of rubber fatigue crack.
Under finite strain and non-linear elastic conditions, the increment of CED in the undeformed configuration can be obtained from Equation (1) as the following expression [,,,]:
where J is the elastic volume ratio before and after deformation, and is the unit normal vector of a potential cracking plane under the undeformed configuration in the Lagrange coordinate system, = (cosθ, sinθ, 0) and . The superscript “T” designates the transpose quantity and θ is the crack angle.
is the right Cauchy–Green strain tensor written as follows []:
where λ1, λ2 and λ3 are the first, second and third principal elongation, respectively.
In the Lagrange coordinate system, the Green–Lagrange strain tensor has relation to the right Cauchy–Green strain tensor as:
The relationship between the second Piola–Kirchhoff stress tensor and the principal elongation λ can be expressed as follows [,]:
where p is the hydrostatic pressure in the plane stress state expressed as:
2.2. The CED Expression of Elastomers Using Ogden Second-Order Constitutive Model
SE2035 phenyl silicone rubber [] is a typical filling rubber, which is used for elastomers of the flexible joint, and its fillers include silicon dioxide, hydroxyl silicone oil and BIPB cross-linking agent. The Ogden constitutive model is usually used to characterize the constitutive behavior of filled rubber materials under large deformation []. The function of the Ogden second-order constitutive model with volume ratio J =1 was adopted:
where μ1, α1, μ2 and α2 are the material constants independent of deformation, which were obtained by fitting the material test data.
Substituting Equation (7) into Equations (5) and (6), and supposing the biaxial parameter b = λ2/λ1, the second Piola–Kirchhoff stress tensor under the Ogden second-order constitutive model was obtained as:
The principal elongation satisfied the relation of λ1λ2λ3 = 1 in the rubber deformation. Considering Equation (3), Equation (4) and = (cosθ, sinθ, 0), a simple expression of the CED (Wc) for flexible joint elastomers was obtained by the integration of the differential Equation (2) as:
2.3. Verification of CED Distribution for Elastomer Material under Typical Strain State
In order to verify the accuracy and feasibility of Equation (10) for calculating the Wc of the flexible joint elastomer, the distribution of Wc and the ratio of CED to SED (Wc/W), with respect to the first principal elongation λ1 and crack angle θ under two typical strain states of uniaxial tension (UT) and simple shear (SS), were calculated.
The main deformation of elastomers was shear deformation when the flexible joint swung under pressure. In order to describe the constitutive relation of the flexible joint elastomers by the Ogden second-order model, a four-plate shear test was applied to obtain the simple shear (SS) stress-strain curve of silicone rubber to fit the corresponding parameters. The four-plate shear specimen of silicone rubber is shown in Figure 3, and the fitting results are shown in Table 1 and Figure 4.
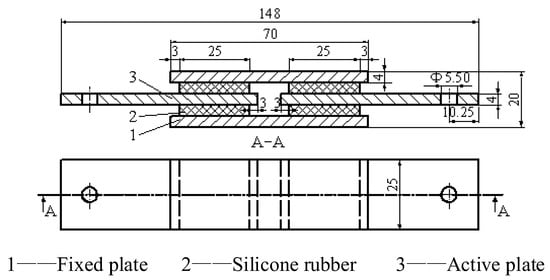
Figure 3.
Four-plate shear specimen.

Table 1.
Material parameters of silicone rubber.
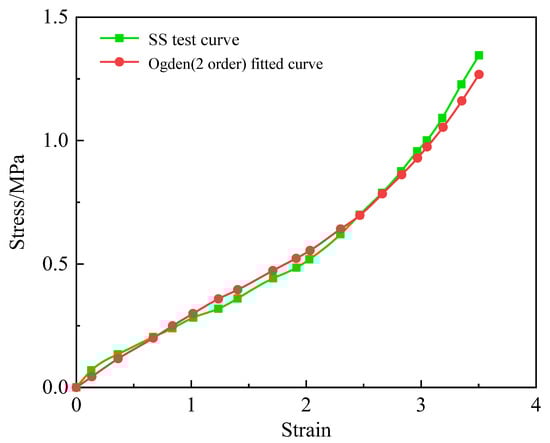
Figure 4.
Correlation of the second order Ogden model with test data.
The hyperelastic parameters of the Ogden model in Table 1 were substituted into Equation (7) and Equation (10), and the Wc and the Wc/W ratio under two typical strain states of uniaxial tension and simple shear were calculated. The distribution of Wc and Wc/W with respect to the first principal elongation λ1 (1.2 ≤ λ1 ≤ 10) and crack angle θ (−π ≤ θ ≤ π) are shown in Figure 5 and Figure 6.
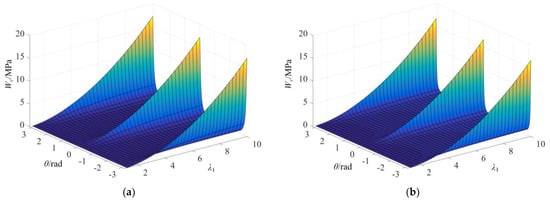
Figure 5.
Distribution of CED under typical strain state: (a) Uniaxial tension (b = λ1−3/2); (b) simple shear (b = λ1−2).
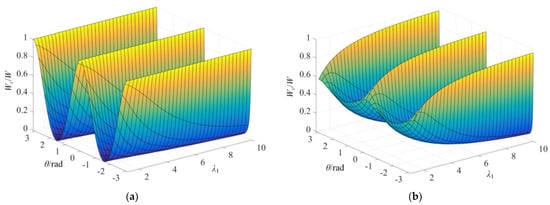
Figure 6.
Distribution of the ratio of CED to SED under typical strain state: (a) Uniaxial tension (b = λ1−3/2); (b) simple shear (b = λ1−2).
Under UT and SS strain states, Wc exhibited the maximum value Wc,max for θ = 0 and ±π, and the Wc of each orientation plane grew with the increase in λ1. Furthermore, it was found that the increase in Wc with λ1 in θ = 0 and ±π was much greater than that of other orientations. Under uniaxial tension, it can be seen from Figure 6a that Wc/W = 1 for θ = 0 and ±π, which means the probable crack plane was perpendicular to the stretch orientation and all SED was applied to the driving crack propagation. Additionally, CED exhibited the minimum value equal to 0 for θ = ±π/2. Under simple shear, Wc/W distributed between 0.5 and 1 for θ = 0 and ±π and it grew with the increase in λ1, while the ratio Wc/W on other orientation planes decreased with the increase in λ1 (Figure 6b). In addition, it can be seen in Figure 5 and Figure 6 that the Wc and Wc/W ratio periodically varied under UT and SS strain states. These π-period evolutions were all symmetrical around θ = 0. The above results are consistent with the distribution of Wc under small deformations [,,,] and the variation obtained by integrating the first principal elongation λ1 using the Neo-Hookean constitutive model in the literature [], which verified the accuracy and feasibility of Equation (10) in calculating the CED.
3. Fatigue Life Prediction of the Flexible Joint Elastomers
3.1. Fatigue Life Calculation of Silicone Rubber with CED
There will inevitably be fine inherent cracks in the silicone rubber of the flexible joint elastomers even though the rubber is strictly fabricated according to the standard. Therefore, the fatigue analysis can be applied by the rubber fatigue crack propagation method. The fatigue life of rubber Nf can be calculated if the crack growth model f [T(c,t)] of rubber material and its inherent crack length c0 and permissible crack length cf are known as [,]:
where crack growth model f [T(c,t)] = dc/dN is the function of tearing energy T, and T(c,t) means the tearing energy T is the function of crack length c and loading time t.
The relationship between tearing energy and crack growth rate can be described by Thomas’s model as []:
where dc/dN is the crack growth rate, rc is the critical crack growth rate, Tc is the critical tearing energy, Tmax,R=0 is the maximum tearing energy and F0 is the material constant determined using the least squares method.
However, the Thomas model is only applied at the condition of R = 0. The load ratio R is defined as the ratio of minimum to maximum tearing energy T in a load cycle (e.g., the flexible joint load ratio R of 0.38, as seen in Section 4). At 0 < R < 1, there are two different fatigue crack growth models for the strain crystalline properties of the rubber [,]. Lindley P. B. [] proposed a fatigue crack growth model of the non-strained crystalline rubber. The maximum tearing energy at 0 < R < 1 can be transformed into the equivalent tearing energy at R = 0. The formula for calculating the equivalent tearing energy is shown as follows:
Aiming at the non-strained crystalline rubber (e.g., the silicone rubber of the flexible joint elastomers in this paper), a unified model for fatigue crack growth of elastomer material at 0 ≤ R < 1 can be obtained by substituting Equation (13) to Equation (12):
When the material satisfies the requirements of fine intrinsic crack size and self-similarity of crack propagation, its tearing energy T can be expressed by cracking energy density Wc and crack length c [,]:
where U is the elastic strain energy stored in the material, and A is the fracture surface area of the crack.
Using Equation (14) and Equation (15) to integrate Equation (11), the multiaxial fatigue life Nf of the flexible joint elastomers can be calculated as follows:
The critical crack growth rate rc, critical tearing energy Tc and power exponent F0 in Equation (15) were obtained by fatigue crack propagation test on pure shear specimens of silicone rubber with prefabricated cracks [,]. Crack growth in rubber can be recorded by a CCD (Charge Coupled Device) camera. The inherent crack length c0 was obtained by uniaxial tensile fatigue test on dumbbell-shaped silicone rubber specimens. Because Wc,max is equal to Wmax under UT strain state, Equation (16) can be converted into Equation (17) to calculate c0:
where Nf,UT is the uniaxial tensile fatigue life of rubber and the correlation coefficient of strain level k is the correlation coefficient of strain level, 2.95 − 0.08εmax)/(1 + εmax)0.5 [,].
The fatigue crack propagation parameters of silicone rubber obtained by dynamic fatigue test system (see Figure 7) are shown in Table 2. The permissible crack length cf for crack propagation is generally considered to be much larger than its inherent crack length c0, and cf =1 mm is used in the fatigue crack propagation method of lifetime prediction for actual rubber products []. By calculating the lifetime of each orientation plane of silicone elastomers, the minimum Nf was selected as the fatigue life of the flexible joint, and the corresponding material point and orientation plane were the predicted failure location and cracking plane.
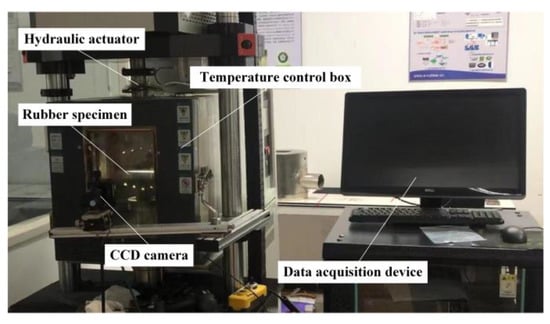
Figure 7.
Electromagnetic dynamic fatigue test system.
Table 2.
Characteristic parameters of fatigue crack propagation of silicone rubber.
3.2. Swing Fatigue Life Test of the Flexible Joint
The swing device of the flexible joint was designed and fabricated for the swing fatigue life test, as shown in Figure 8. In order to simulate a realistic motor environment, a pressure vessel was utilized to pressurize with high-pressure nitrogen gas of 12.3 MPa. The swing angle can be obtained from the displacements of two horizontally installed linear variable differential transformer (LVDT) sensors (with a stroke capacity 50 mm). An electro-hydraulic servo actuator was used to generate sinusoidal excitation signal with different swing angles and different frequencies provided the required torque for the swing of the flexible joint. Then, the servo actuator drove the pendulum rod and flexible joint to swing continuously in the xy plane with the swing angle amplitude of 6° and frequency of 1 Hz until fatigue failure occurred in the joint elastomers.
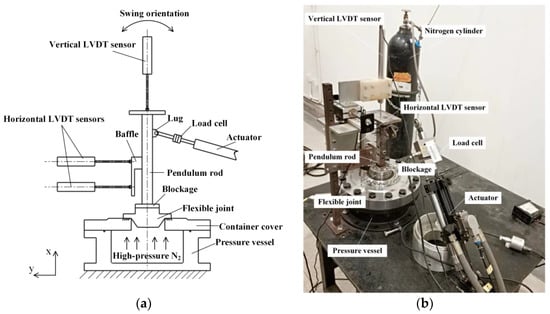
Figure 8.
Swing test device for flexible joint: (a) Plane structure diagram (b) actual swing test device.
In the swing fatigue test, flexible joint swings from 0° to +6°, then from +6° to −6° and finally back to 0° can be regarded as one swing cycle. The cyclic load in the swing fatigue test of the flexible joint was controlled by the swing angle (actually the displacement of actuator) to eliminate ratcheting response []. The horizontal displacement and swing time of the flexible joint were recorded by the data acquisition system. The fatigue test would be interrupted when the measured displacement data occurred a sudden leap, and the swing cycles of the flexible joint at that time could be considered as its swing fatigue life. The hysteresis loops of the flexible joint in swing fatigue test are as shown in Figure 9. The horizontal coordinate is the swing angle of the flexible joint and the vertical coordinate is the driving torque. There are little stiffness degradations of flexible joint elastomers over loading cycles.
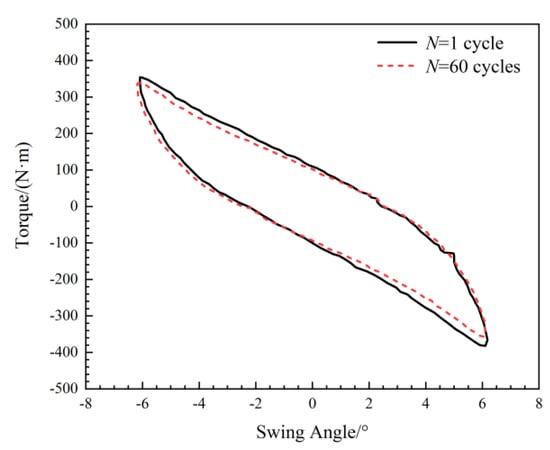
Figure 9.
The hysteresis loops of flexible joint at N = 1 cycle and 60 cycles in swing fatigue test.
3.3. Finite Element Model of the Flexible Joint
The finite element (FE) model of the flexible joint was constructed by ANSYS. The pendulum rod and blockage were also established in the FE model according to the actual test conditions. The finite element computational mesh and constraint conditions are shown in Figure 10. Since the flexible joint was a rotating body, it could be conveniently modeled in the spherical coordinate system in terms of r, θ and φ with the coordinate origin at the pivot point of the joint. Meanwhile, the FE model could be simplified to one-half of geometry because of its plane symmetry nature under the uniaxial driving force. For the considered FE model, a relatively fine mesh with 8-node hexahedral solid (SOLID-185) elements was used. The pendulum rod, the active body, fixed body, metal reinforcements and silicone rubber elastomers of the flexible joint were bonded together as a continuous entity by glue instruction of ANSYS. The meshes of elastomers and reinforcements were divided into 2, 40 and 20 parts in radial direction (r), angular direction (45° ≤ θ ≤ 65°) and circumferential direction (0° ≤ φ ≤ 180°). The material of pendulum rod, blockage, active body, fixed body, and metal reinforcements was 30CrMnSiA alloy steel, and its modulus of elasticity and Poisson’s ratio were 196 Gpa and 0.29, respectively. The mechanical behavior of the silicone rubber elastomer was described by the Ogden second-order constitutive model, and corresponding parameters are shown in Table 1.
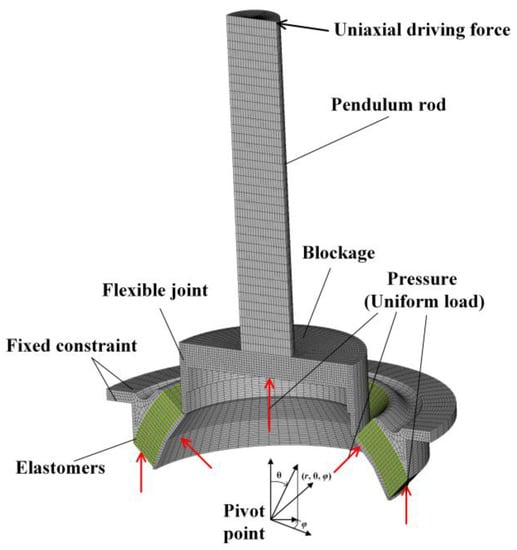
Figure 10.
FE Model of the flexible joint in fatigue test.
All degrees of freedom were constrained at the outermost surface of the fixed body. The inner and bottom surfaces of the active body were subjected to the uniformly distributed vessel pressure. Additionally, the symmetry boundary condition was applied to the symmetric cross sections (φ = 0°, and 180°). The equivalent driving force was loaded by uniaxial vector force, which was applied to the key point on one side at the top of the pendulum rod, and gradually increased to achieve different angles.
4. Results and Discussion
When the flexible joint swung under high pressure, the largest deformation of elastomers occurred at the maximum swing angle. At that time, the stress and strain state of elastomers were becoming severe under multiaxial load, easily leading to crack propagation. So the deformation history of the flexible joint elastomers from 0° to 6° swing angle was calculated by ANSYS, and the FEA results of the maximum angle were used as input for calculating the CED of the flexible joint elastomers.
The biaxial factor b = λ1−0.82464 and load ratio R = 0.38 were determined through the FEA results of 6° swing angle case. The distribution of the first principal elongation λ1 for elastomers and the orientation of the maximum λ1 in the Cartesian coordinate are illustrated in Figure 11. The first principal elongation λ1 reached its maximum value λ1,max =4.064 in the middle position near the bottom of the outermost elastomer, and the direction vector of λ1,max in the Cartesian coordinate was (−0.12174, 1.6823, 1.65701). The vector angle between λ1,max and the axis of x, y, and z was −2.95°, 45.36° and 44.49°, respectively. The maximum value of the first principal elongation λ1,max appears in the element No.7505, regarded as the potential failure area.
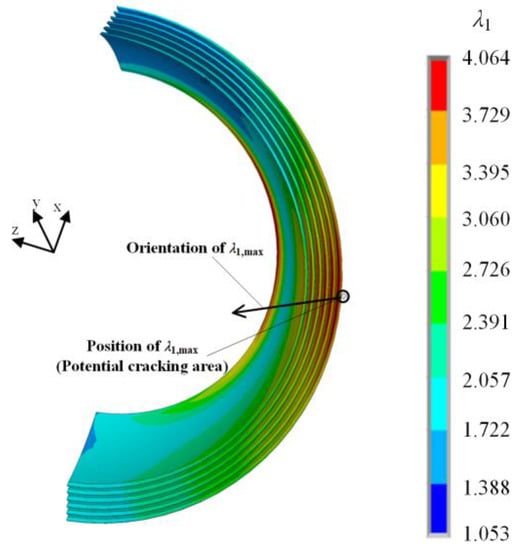
Figure 11.
The first principal elongation distribution of the flexible joint elastomers.
The CED (Wc) of various orientation planes (−π ≤ θ ≤ π) were calculated by substituting the maximum value of the first principal elongation λ1,max into Equation (10), as shown in Figure 12, the maximum CED (Wc,max) =5.585 MPa. The variation of the CED (Wc) of the elastomers in each plane with crack angle θ takes π as the period, and the distribution of Wc was symmetrical around θ = 0, similar to the simple shear condition (see Figure 5b). The maximum CED (Wc,max) occurred on the orientation planes of θ = 0 and ±π; therefore, it can be determined that the orientation of the cracking plane was perpendicular to the direction vector of λ1,max.
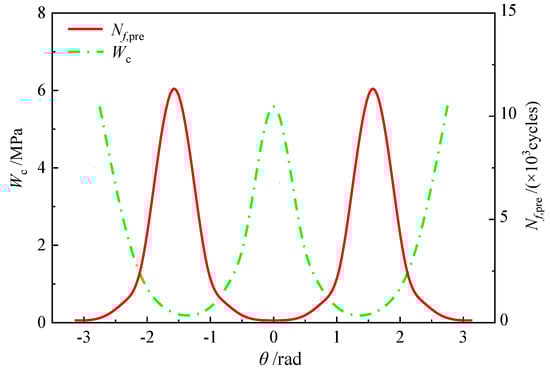
Figure 12.
CED and Nf,pre distribution in different plane at the danger point of elastomer.
By substituting the Wc (see Figure 12) and fatigue crack propagation parameters of silicone rubber (see Table 2) into Equation (16), the predicted swing fatigue life of the flexible joint in various θ was obtained as shown in Figure 12 and Table 3. It can be seen that when the CED reached the maximum, the predicted life had a minimum and the crack angle θ equals 0 or ±π. The minimum predicted life Nf,pre of the flexible joint calculated by fatigue life prediction model was 107 cycles, while the measured life Nf,exp under 12.3 MPa and 6° swing angle amplitude was 120 cycles. As indicated in Table 3, the ratio Nf,pre/Nf,exp was within the range from 0.5 to 2. This meant that the predicted life was distributed within the double dispersion factor of measured life, which is acceptable in engineering. The maximum SED Wmax of the flexible joint elastomer at 6° swing angle was 7.346 MPa. The predicted life Nf,Wpre was 76 cycles and the ratio Nf,Wpre/Nf,exp was 1/1.58, if the SED was taken as the damage parameter. It can be seen that the ratio Nf,pre/Nf,exp based on CED was closer to one (1) than the ratio Nf,Wpre/Nf,exp based on SED (see Figure 13). The fatigue life prediction based on SED was more conservative than the CED, because not all energy was released by crack propagation under multiaxial loading. The flexible joint also needed to overcome the internal friction for the segment motion of polymer. The CED method only considers the strain energy consumed in the crack growth plane and has more considerable accuracy than the SED.
Table 3.
Comparison between predicted fatigue life and measured life of the flexible joint.
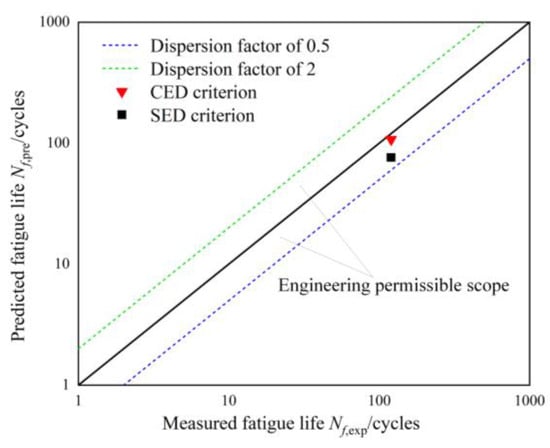
Figure 13.
Comparison between the CED and SED criterion to predict flexible joint fatigue life.
The predicted fatigue crack location and cracking plane orientation were compared with the actual fatigue crack location and orientation on flexible joint elastomers, as shown in Figure 14a,b. It can be seen that the predicted results were in good agreement with the actual failure mode. Cracks occurred at the upper side on the bottom of the outermost elastomer bonded to the fixed body, and the cracks continued to propagate along the circumferential direction on the cracking plane, resulting in the local shear failure of the outermost elastomer. Considering the plane symmetry nature, the FE model was simplified to one-half, so the predicted failure positions were actually on both sides of the symmetrical plane, which is consistent with the cracking situation of actual fatigue test (see Figure 14b,c).
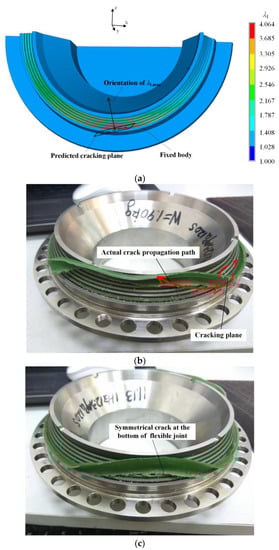
Figure 14.
Comparison between actual failure position and predicted failure position in fatigue life test of the flexible joint: (a) Predicted cracking orientation; (b) actual cracking propagation path; (c) symmetrical side at the bottom of flexible joint after swing fatigue test.
5. Conclusions
In this study, the CED method was introduced into the fatigue analysis of flexible joint elastomers. A convenient formula for the CED calculation was derived from the Ogden second-order constitutive model, and the swing fatigue life calculation for flexible joints was established by the fatigue crack growth model. The swing fatigue life test of flexible joint was then implemented to verify the accuracy of life prediction based on the CED method. The predicted results were in good agreement with the test and achieved the requirements of engineering fatigue life prediction. The main conclusions can be summarized as follows:
(1) The integral formula derived from the Ogden second-order constitutive model is simple and convenient to gain the CED distribution of the flexible joint elastomer. The fatigue life and cracking plane orientation of the flexible joint can be predicted by finite element analysis efficiently and accurately. This method can provide reference for fatigue analysis and structural reliability design of flexible joints.
(2) Compared with S–N curve method and SED model, the CED method can better predict the swing fatigue life of the flexible joint elastomers with fewer test and calculation costs. The ratio of predicted life to measured life based on the CED and SED criterion were 1/1.12 and 1/1.58, respectively. The ratio based on CED was closer to 1 than the SED, indicating that the CED criterion has more considerable accuracy than the SED.
(3) The CED method can predict the cracking plane orientation of the flexible joint elastomers by crack angle. The crack location and the orientation of cracking plane is determined by the position and the perpendicular direction of the maximum value of the first principal elongation, respectively. Additionally, the predicted crack location and cracking plane orientation agrees well with the actual failure mode.
Author Contributions
Conceptualization, J.Z. and J.R.; methodology, J.Z. and J.R.; software, J.Z.; validation, J.Z., M.X., Y.T. and Q.Z.; formal analysis, J.Z.; investigation, J.Z., J.R. and M.X.; resources, J.R., M.X. and H.T.; data curation, J.Z.; writing—original draft preparation, J.Z.; writing—review and editing, J.R.; visualization, J.Z.; supervision, J.R.; project administration, J.R., M.X. and Y.T.; funding acquisition, J.R. and H.T. All authors have read and agreed to the published version of the manuscript.
Funding
This research was funded by the Foundation Technology Strengthening Plan of China, grant number 2020-JCJQ-JJ-014.
Data Availability Statement
Not applicable.
Acknowledgments
The authors would like to express their gratitude to the Shanghai Space Propulsion Technology Research Institute, which provided flexible joint samples for the swing fatigue test.
Conflicts of Interest
The authors declare no conflict of interest.
Nomenclature
| b | biaxial parameter |
| CED, Wc | cracking energy density |
| right Cauchy–Green strain tensor | |
| CCD | charge coupled device |
| c | crack length |
| c0 | inherent crack length |
| cf | permissible crack length |
| dc/dN | crack growth rate |
| dWc | increment of Wc |
| increment of the composite strain | |
| F0 | material constant determined using the least squares method |
| FEA/FE | finite element analysis/finite element |
| f [T(c,t)] | crack growth model of rubber material |
| J | elastic volume ratio before and after deformation |
| LVDT | linear variable differential transformer |
| Nf,pre | predicted life of the flexible joint in the finite element analysis |
| Nf,exp | measured life of the flexible joint in the swing fatigue test |
| unit normal vector of a potential cracking plane under the undeformed configuration in the Lagrange coordinate system | |
| unit normal vector of the cracking plane at a certain point in the rubber | |
| p | hydrostatic pressure in the plane stress state |
| R | ratio of minimum to maximum tearing energy |
| rc | critical crack growth rate |
| r, θ and φ | radial direction, angular direction and circumferential direction in finite element model of the flexible joint, respectively |
| SED, W | strain energy density |
| second Piola–Kirchhoff stress tensor | |
| Tc | critical tearing energy |
| Tmax | maximum tearing energy |
| t | loading time |
| θ | crack angle |
| λ1, λ2 and λ3 | first, second and third principal elongation, respectively |
| μ1, α1, μ2 and α2 | material constants independent of deformation, which are obtained by fitting the material test data |
| composite stress vector of rubber fatigue crack |
References
- Caveny, L.H.; Geisler, R.L.; Ellis, R.A.; Moore, T.L. Solid Rocket Enabling Technologies and Milestones in the United States. J. Propuls. Power 2003, 19, 1038–1066. [Google Scholar] [CrossRef]
- Ren, J.; Zhang, X.; Yang, J.; Wang, C.; Liu, Y.; Yang, W. Structural Analysis and Testing of a Miniature Flexible Joint under Pressure and Vector Loading. J. Mech. Sci. Technol. 2014, 28, 3637–3643. [Google Scholar] [CrossRef]
- Su, H.; Ren, J.; Xue, M.; Tong, Y.; Zheng, Q.; Yang, J. Influence of Pressure and Deflection Loads on the Critical Behavior of Flexible Joint. Compos. Struct. 2017, 180, 772–781. [Google Scholar] [CrossRef]
- Hu, J.; Ren, J.; Zhang, Z.; Xue, M.; Tong, Y.; Zou, J.; Zheng, Q.; Tang, H. A Pressure, Amplitude and Frequency Dependent Hybrid Damping Mechanical Model of Flexible Joint. J. Sound Vib. 2020, 471, 115173. [Google Scholar] [CrossRef]
- Wan, N.; Shi, H.; Qu, Z.; Liu, K. Analysis of Fatigue Properties and Vectoring Life of the Flexible Joint. J. Propuls. Technol. 2022, 43, 200932. (In Chinese) [Google Scholar] [CrossRef]
- Liu, W.; Yang, X.; Wang, Z.; Jia, M.; Zhao, Y. Analysis of Load-Bearing Safety and Reliability of Solid Rocket Motor Flexible Joint Structure. Eng. Fail. Anal. 2022, 144, 106952. [Google Scholar] [CrossRef]
- Griffith, A.A. The Phenomena of Rupture and Flow in Solids. Philos. Trans. R. Soc. A Math. Phys. Eng. Sci. 1920, 221, 163–198. [Google Scholar] [CrossRef]
- Paris, P.C.; Gomez, M.P.; Anderson, W.P. A Rational Analytic Theory of Fatigue. Trends Eng. 1961, 13, 9–14. [Google Scholar]
- Paris, P.C.; Erdogan, F. A Critical Analysis of Crack Propagation Laws. J. Basic Eng. 1963, 85, 528–533. [Google Scholar] [CrossRef]
- Mirzaei, M.; Provan, J.W. A New Method for the Analysis and Assessment of Fatigue Crack Closure. I: Modeling. Theor. Appl. Fract. Mec. 1992, 18, 47–58. [Google Scholar] [CrossRef]
- Shariati, M.; Mirzaei, M.; Nejad, R.M. An Applied Method for Fatigue Life Assessment of Engineering Components Using Rigid-Insert Crack Closure Model. Eng. Fract. Mech. 2018, 204, 421–433. [Google Scholar] [CrossRef]
- Nejad, R.M.; Liu, Z. Analysis of Fatigue Crack Growth under Mixed Mode Loading Conditions for a Pearlitic Grade 900A Steel Used in Railway Applications. Eng. Fract. Mech. 2021, 247, 107672. [Google Scholar] [CrossRef]
- Nejad, R.M.; Berto, F. Fatigue Fracture and Fatigue Life Assessment of Railway Wheel Using Nonlinear Model for Fatigue Crack Growth. Int. J. Fatigue 2021, 153, 106516. [Google Scholar] [CrossRef]
- Ma, T.; Zhou, C.; Chang, L.; He, X. Multiaxial Low Cycle Fatigue Behavior and Life Prediction of CP-Ti under Non-Proportional Stress-Controlled Mode. Fatigue Fract. Eng. Mater. Struct. 2022, 46, 341–356. [Google Scholar] [CrossRef]
- Nejad, R.M.; Aliakbari, K.; Abbasnia, S.K.; Langari, J. Failure Analysis of Overdrive Gear of Passenger Car Gearbox Fabricated from Powder Metallurgy. Eng. Fail. Anal. 2022, 141, 106683. [Google Scholar] [CrossRef]
- Rivlin, R.S.; Thomas, A.G. Rupture of Rubber. Ⅰ. Characteristic Energy for Tearing. J. Polym. Sci. 1953, 10, 291–318. [Google Scholar] [CrossRef]
- Thomas, A.G. Rupture of Rubber. V. Cut Growth in Natural Rubber Vulcanizates. Rubber Chem. Technol. 1959, 32, 477–489. [Google Scholar] [CrossRef]
- Saintier, N.; Cailletaud, G.; Piques, R. Crack Initiation and Propagation under Multiaxial Fatigue in a Natural Rubber. Int. J. Fatigue 2006, 28, 61–72. [Google Scholar] [CrossRef]
- Mars, W.V.; Fatemi, A. Multiaxial Fatigue of Rubber: Part I: Equivalence Criteria and Theoretical Aspects. Fatigue Fract. Eng. Mater. Struct. 2005, 28, 515–522. [Google Scholar] [CrossRef]
- Mars, W.V.; Fatemi, A. Multiaxial Fatigue of Rubber: Part II: Experimental Observations and Life Predictions. Fatigue Fract. Eng. Mater. Struct. 2005, 28, 523–538. [Google Scholar] [CrossRef]
- Boulenouar, A.; Benseddiq, N.; Merzoug, M.; Benamara, N.; Mazari, M. A Strain Energy Density Theory for Mixed Mode Crack Propagation in Rubber-like Materials. J. Theor. App. Mech. 2016, 54, 1417–1431. [Google Scholar] [CrossRef]
- El Yaagoubi, M.; Meier, J. Crack Growth Angle Prediction of an Internal Crack under Mixed Mode Load for Unfilled Elastomer Using the Strain Energy Density Factor. Polym. Eng. Sci. 2021, 61, 2183–2192. [Google Scholar] [CrossRef]
- Belkhiria, S.; Hamdi, A.; Fathallah, R. Cracking Energy Density for Rubber Materials: Computation and Implementation in Multiaxial Fatigue Design. Polym. Eng. Sci. 2020, 60, 2190–2203. [Google Scholar] [CrossRef]
- Mars, W.V. Cracking Energy Density as a Predictor of Fatigue Life under Multiaxial Conditions. Rubber Chem. Technol. 2002, 75, 1–17. [Google Scholar] [CrossRef]
- Tee, Y.L.; Loo, M.S.; Andri, A. Recent Advances on Fatigue of Rubber after the Literature Survey by Mars and Fatemi in 2002 and 2004. Int. J. Fatigue 2018, 110, 115–129. [Google Scholar] [CrossRef]
- Pan, Z.; Lai, Y.; Wang, Y.; Duan, W.; Qiao, Y.; Liu, Y.; Liu, Y.; Song, C. Fatigue Life Prediction and Effects of Cerium Oxide-Filled Vulcanized Natural Rubber on Fatigue Life under Multiaxial Loading. Fatigue Fract. Eng. Mater. Struct. 2021, 44, 3349–3362. [Google Scholar] [CrossRef]
- Wang, X.; Shangguan, W.; Li, M.; Duan, X.; Yan, J. A Method for Calculating Cracking Energy Density of Rubber Components under Different Hyperelastic Models and Multiaxial Stress States. Eng. Mech. 2015, 32, 197–205. (In Chinese) [Google Scholar] [CrossRef]
- Wang, X.; Shangguan, W.; Zeng, X.; Duan, X.; Yan, J. A Method to Predict Fatigue Performances of Rubber Isolator Based on the Cracking Energy Density and the Fatigue Crack Growth Characteristic of Rubber Material. J. Vib. Shock 2016, 35, 70–74. (In Chinese) [Google Scholar] [CrossRef]
- Peng, Y.; Liu, G.; Quan, Y.; Zeng, Q. Cracking Energy Density Calculation of Hyperelastic Constitutive Model and Its Application in Rubber Fatigue Life Estimations. J. Appl. Polym. Sci. 2016, 133, 44195. [Google Scholar] [CrossRef]
- Luo, R.; Wu, W. Fatigue Failure Analysis of Anti-Vibration Rubber Spring. Eng. Fail. Anal. 2006, 13, 110–116. [Google Scholar] [CrossRef]
- Duan, X.; Shangguan, W.; Li, M.; Rakheja, S. Measurement and Modelling of the Fatigue Life of Rubber Mounts for an Automotive Powertrain at High Temperatures. Proc. Inst. Mech. Eng. Part D J. Automob. Eng. 2016, 230, 942–954. [Google Scholar] [CrossRef]
- Peng, X.; Li, L. State of the Art of Constitutive Relations of Hyperelastic Materials. Chin. J. Theor. Appl. Mech. 2020, 52, 1221–1232. (In Chinese) [Google Scholar] [CrossRef]
- Mars, W.V. Multiaxial Fatigue of Rubber. Ph.D. Thesis, The University of Toledo, Toledo, OH, USA, 2001. [Google Scholar]
- Zine, A.; Benseddiq, N.; Abdelaziz, M.N. Rubber Fatigue Life under Multiaxial Loading: Numerical and Experimental Investigations. Int. J. Fatigue 2011, 33, 1360–1368. [Google Scholar] [CrossRef]
- Hao, M.; Huang, Y.; Su, Z.; Wang, J. Dynamic Mechanical Properties of Phenyl Silicone Rubber. J. Mater. Eng. 2012, 10, 35–38. (In Chinese) [Google Scholar] [CrossRef]
- Puglisi, G.; Saccomandi, G. Multi-Scale Modelling of Rubber-Like Materials and Soft Tissues: An Appraisal. Proc. R. Soc. A Math. Phys. Eng. Sci. 2016, 472, 20160060. [Google Scholar] [CrossRef]
- Aït-Bachir, M.; Mars, W.V.; Verron, E. Energy Release Rate of Small Cracks in Hyperelastic Materials. Int. J. Non Linear Mech. 2012, 47, 22–29. [Google Scholar] [CrossRef]
- Marco, Y.; Huneau, B.; Masquelier, I.; Le Saux, V.; Charrier, P. Prediction of Fatigue Properties of Natural Rubber Based on the Descriptions of the Cracks Population and of the Dissipated Energy. Polym. Test. 2017, 59, 67–74. [Google Scholar] [CrossRef]
- Lake, G.J.; Lindley, P.B. Cut Growth and Fatigue of Rubbers. II. Experiments on a Noncrystallizing Rubber. J. Appl. Polym. Sci. 1965, 38, 301–313. [Google Scholar] [CrossRef]
- Lindley, P.B. Non-Relaxing Crack Growth and Fatigue in a Non-Crystallizing Rubber. Rubber Chem. Technol. 1974, 47, 1253–1264. [Google Scholar] [CrossRef]
- Mars, W.V.; Fatemi, A. Fatigue Crack Nucleation and Growth in Filled Natural Rubber. Fatigue Fract. Eng. Mater. Struct. 2003, 26, 779–789. [Google Scholar] [CrossRef]
- Tao, G.; Xia, Z. A Non-Contact Real-Time Strain Measurement and Control System for Multiaxial Cyclic/Fatigue Tests of Polymer Materials by Digital Image Correlation Method. Polym. Test. 2005, 24, 844–855. [Google Scholar] [CrossRef]
Disclaimer/Publisher’s Note: The statements, opinions and data contained in all publications are solely those of the individual author(s) and contributor(s) and not of MDPI and/or the editor(s). MDPI and/or the editor(s) disclaim responsibility for any injury to people or property resulting from any ideas, methods, instructions or products referred to in the content. |
© 2023 by the authors. Licensee MDPI, Basel, Switzerland. This article is an open access article distributed under the terms and conditions of the Creative Commons Attribution (CC BY) license (https://creativecommons.org/licenses/by/4.0/).