Article

Application of a Performance-Improvement Method for Small-Size Axial Flow Turbines

1
Faculty of Aerospace Engineering, University POLITEHNICA of Bucharest, 060042 Bucharest, Romania
2
Romanian Research and Development Institute for Gas Turbines COMOTI, 061126 Bucharest, Romania
*
Author to whom correspondence should be addressed.
Aerospace 2023, 10(11), 928; https://doi.org/10.3390/aerospace10110928
Submission received: 16 September 2023 / Revised: 17 October 2023 / Accepted: 27 October 2023 / Published: 30 October 2023
(This article belongs to the Section Aeronautics)

Abstract

:
As a main component of most gas-turbine engines, the axial flow turbines have been in a process of continuous improvement, reaching high efficiencies and reliability. A well-known drawback of these systems is the rapid decrease in performance when operating at lower than nominal conditions. Thus, a novel performance-enhancement method for axial turbines operating at partial loads has been previously proposed and numerically characterized. In this paper, one applies the aforementioned method for a smaller size axial flow turbine, part of a gas-generator assembly for a microjet engine, to determine, by the use of CFD analysis, the influence of the system at different partial regimes across the working line. A logical scheme based on iterative steps and multiple numerical simulations is also used to determine the engine response to the injection of compressor bleed air into the turbine passages. The results show, as determined in the previous study, that the generated power can be increased for all partial regimes, with the influence being more noticeable at higher regimes, leading to a reduction in fuel consumption in order to achieve the same regimes.

1. Introduction

Gas-turbine engines are widely used on a large scale in multiple industries due to their advantages, such as high power-to-weight ratios, reliability, and lower operational costs. A drawback of these systems is the decrease in performance at lower operational regimes. Micro-gas-turbine engines are a new class of engines characterized by small dimension, low power, and very high rotational speeds. The use of micro-gas-turbine engines has increased in recent times, and they are now utilized in different applications, such as propulsion systems for unmanned aerial vehicles or lightweight airplanes (as microjet or microturboprop engines) or power-generation systems. The engine architecture is, in general, simple, composed of a single-stage centrifugal compressor, a combustion chamber, and a single-stage turbine [1].
The poor performance at lower regimes for these engines is caused in part by the poor performance of axial turbines at these regimes. Turbine design is performed and optimized at nominal regimes, for a set of inlet parameters and power requirements; thus, when operating at different regimes, the flow through the channels and the resulting performance may be less than desirable. To overcome this drawback and improve the axial turbine’s performance at partial loads, a new method to control the flow through the turbine has been proposed in [2,3]. The method consists of injecting a fluid into specific sections of the turbine vanes in order to modify the flow field, accelerate the working fluid, and, thus, increase the rotor-generated power. In previous works, the authors demonstrated that the power generated by the turbine can be increased by as much as 33%, depending on the configuration of the injection system, with smaller dimensions and a larger number of orifices showing the best results. The results were obtained without increasing the total mass flow through the turbine. It was also found that the effectiveness of the injection system is dependent on the turbine regime, with injection at higher operational regimes showing better results [3].
Fluid injection in turbines is a known process; advanced cooling systems use fluid injection through the vanes to form a layer of cooling fluid in order to keep the hot gases away from the walls. This method is known as film cooling and can achieve a difference of a few hundred degrees between the gases and wall temperature. The injection mechanism in a film cooling system has been the main topic for a number of works, such as [4,5,6,7,8,9,10,11], studying the influence of different parameters on the film flow and its effectiveness. The main difference between the film cooling injection and the system proposed in [2,3] is that, in the case of cooling, the objective of injection is to create a layer on the surface of the vane or blade without disturbing the flow through the turbine. For the performance-improvement method by specific fluid injection, the aim is to influence the flow in order to accelerate the working fluid and, thus, increase the power output of the rotor.
A similar injection system is the active flow control system, used for aircraft wings in order to increase the aerodynamic lift and decrease drag. The injection system is used in order to accelerate the flow on the suction side of the wing, thus delaying the separation phenomena. Studies showed that a 30% increase in wing efficiency is possible when combined with a suction process on the suction side downstream of the injection sections [12,13,14].
Fluid injection in turbine profiles has been studied in the past with the aim of reducing pressure losses across the turbine stage. McQuilling [15] showed that the separation bubble on a low-pressure turbine blade can be completely removed by the use of injection. By experimental means, the author showed that, when the injection system was activated, the separation bubble was completely eliminated, and, when the system was deactivated, the separation zone recovered. The study also showed that the injection mass flow could be reduced by the use of pulsating jets with similar results, but the efficiency is highly dependent on jet frequency. Similar studies [16,17,18,19] focused on the use of flow control on high-lift low-pressure turbines; as for these profiles, the high loads resulted in high adverse pressure gradients that led to flow separation. The results showed that the separation bubble can be controlled by fluid injection, making the use of high- and ultra-high-lift low-pressure turbines feasible.
A different approach with a similar goal, reducing the separation bubble on the suction side of the blades at low Reynolds numbers, has been tried by Rohr and Yang [20]. In their work, the authors use numerical studies to validate the use of a “jet flap” injection system. For this case, the injection system is used on the pressure side of the blades in order to decrease the flow section, thus accelerating the flow, which results in more favorable pressure gradients reducing the separation bubble. Two configurations were tested, with normal injection and a 45% tilt of the jets downstream relative to the blades’ surfaces. The tilt configuration showed better results in terms of loss reduction.
The aim of this paper is to apply the injection system studied in previous works, see Refs. [2,3], to a microjet engine, determining its influence on the turbine performance and engine behavior after the injection process. The paper presents the construction of the numerical models and the analysis of the injection-system performance at different partial regimes across the working line, as well as the engine response to the activation of the injection system and the resulting stabilized regimes.
The method is envisioned to be used only for partial loads, as, at the nominal regime, the regime for which the turbine has been designed, considers that the flow is optimal. The power increase due to higher velocities overcomes the losses resulting from fluid interactions in the vicinity of injection sections. This effect has been determined in previous studies [3], as well as in this paper, with an increased power generated by the rotor after injection. From a certain regime onwards, the injection system will not lead to a power increase anymore and will most likely lead to a reduction in rotor-generated work due to increased pressure losses. This trend has been observed in this paper.

2. Materials and Methods

As the previous studies concentrated on a reference turbine, with a nominal power of 1300 kW and a mass flow of approximately 8 kg/s, the present work is conducted to validate those results for a lower-power microturbine. The smaller-size axial flow turbine, with the geometry presented in Figure 1, has a nominal power of approximately 145 kW and a mass flow of 0.66 kg/s. The steady-state numerical study was conducted using ANSYS CFX 19.1 software. A single channel has been simulated (containing one vane and one rotor blade) using periodical boundary conditions.
The numerical case and boundary conditions used for these simulations are typical for axial turbines. Total pressure and temperature were set at the vane inlet considering an axial flow direction and a medium turbulence intensity of 5%, with the value of the mass flow fixed at the rotor outlet. The fluid used is air, which is considered, in these simulations, an ideal gas. At the interface between the stator and the rotor stage, mixing conditions were used as well as periodic conditions for rotational periodicity of both the vane and the rotor blade. The walls of the turbine (hub, shroud, vane, and blade) were considered adiabatically as walls with a no-slip condition. For the novel injection system, injection sections were defined on the vane suction side with inlet boundary conditions, fixing the injection mass flow and defining the energy state of the injection fluid in terms of total temperature.
The k–ε turbulence model has been chosen for this numerical study, as the model is frequently used in many industrial processes to predict the flow behavior under turbulent conditions and is known for its robustness, reasonable accuracy, and lower computational demands. The model is also suited for this numerical study due to the highly turbulent nature of the flow at the interaction between the injection flows and the channel flow [21].

Numerical Model

The turbine has been designed to drive a centrifugal compressor in a gas-generator assembly for a microjet engine. It was designed with axial inlet and outlet directions and a constant profile across the blade height due to small dimensions and low cost requirements. The turbine is uncooled and is fabricated from a high-temperature material, and the maximum temperature does not exceed 900 °C. The main parameters of this microturbine are presented in Table 1.
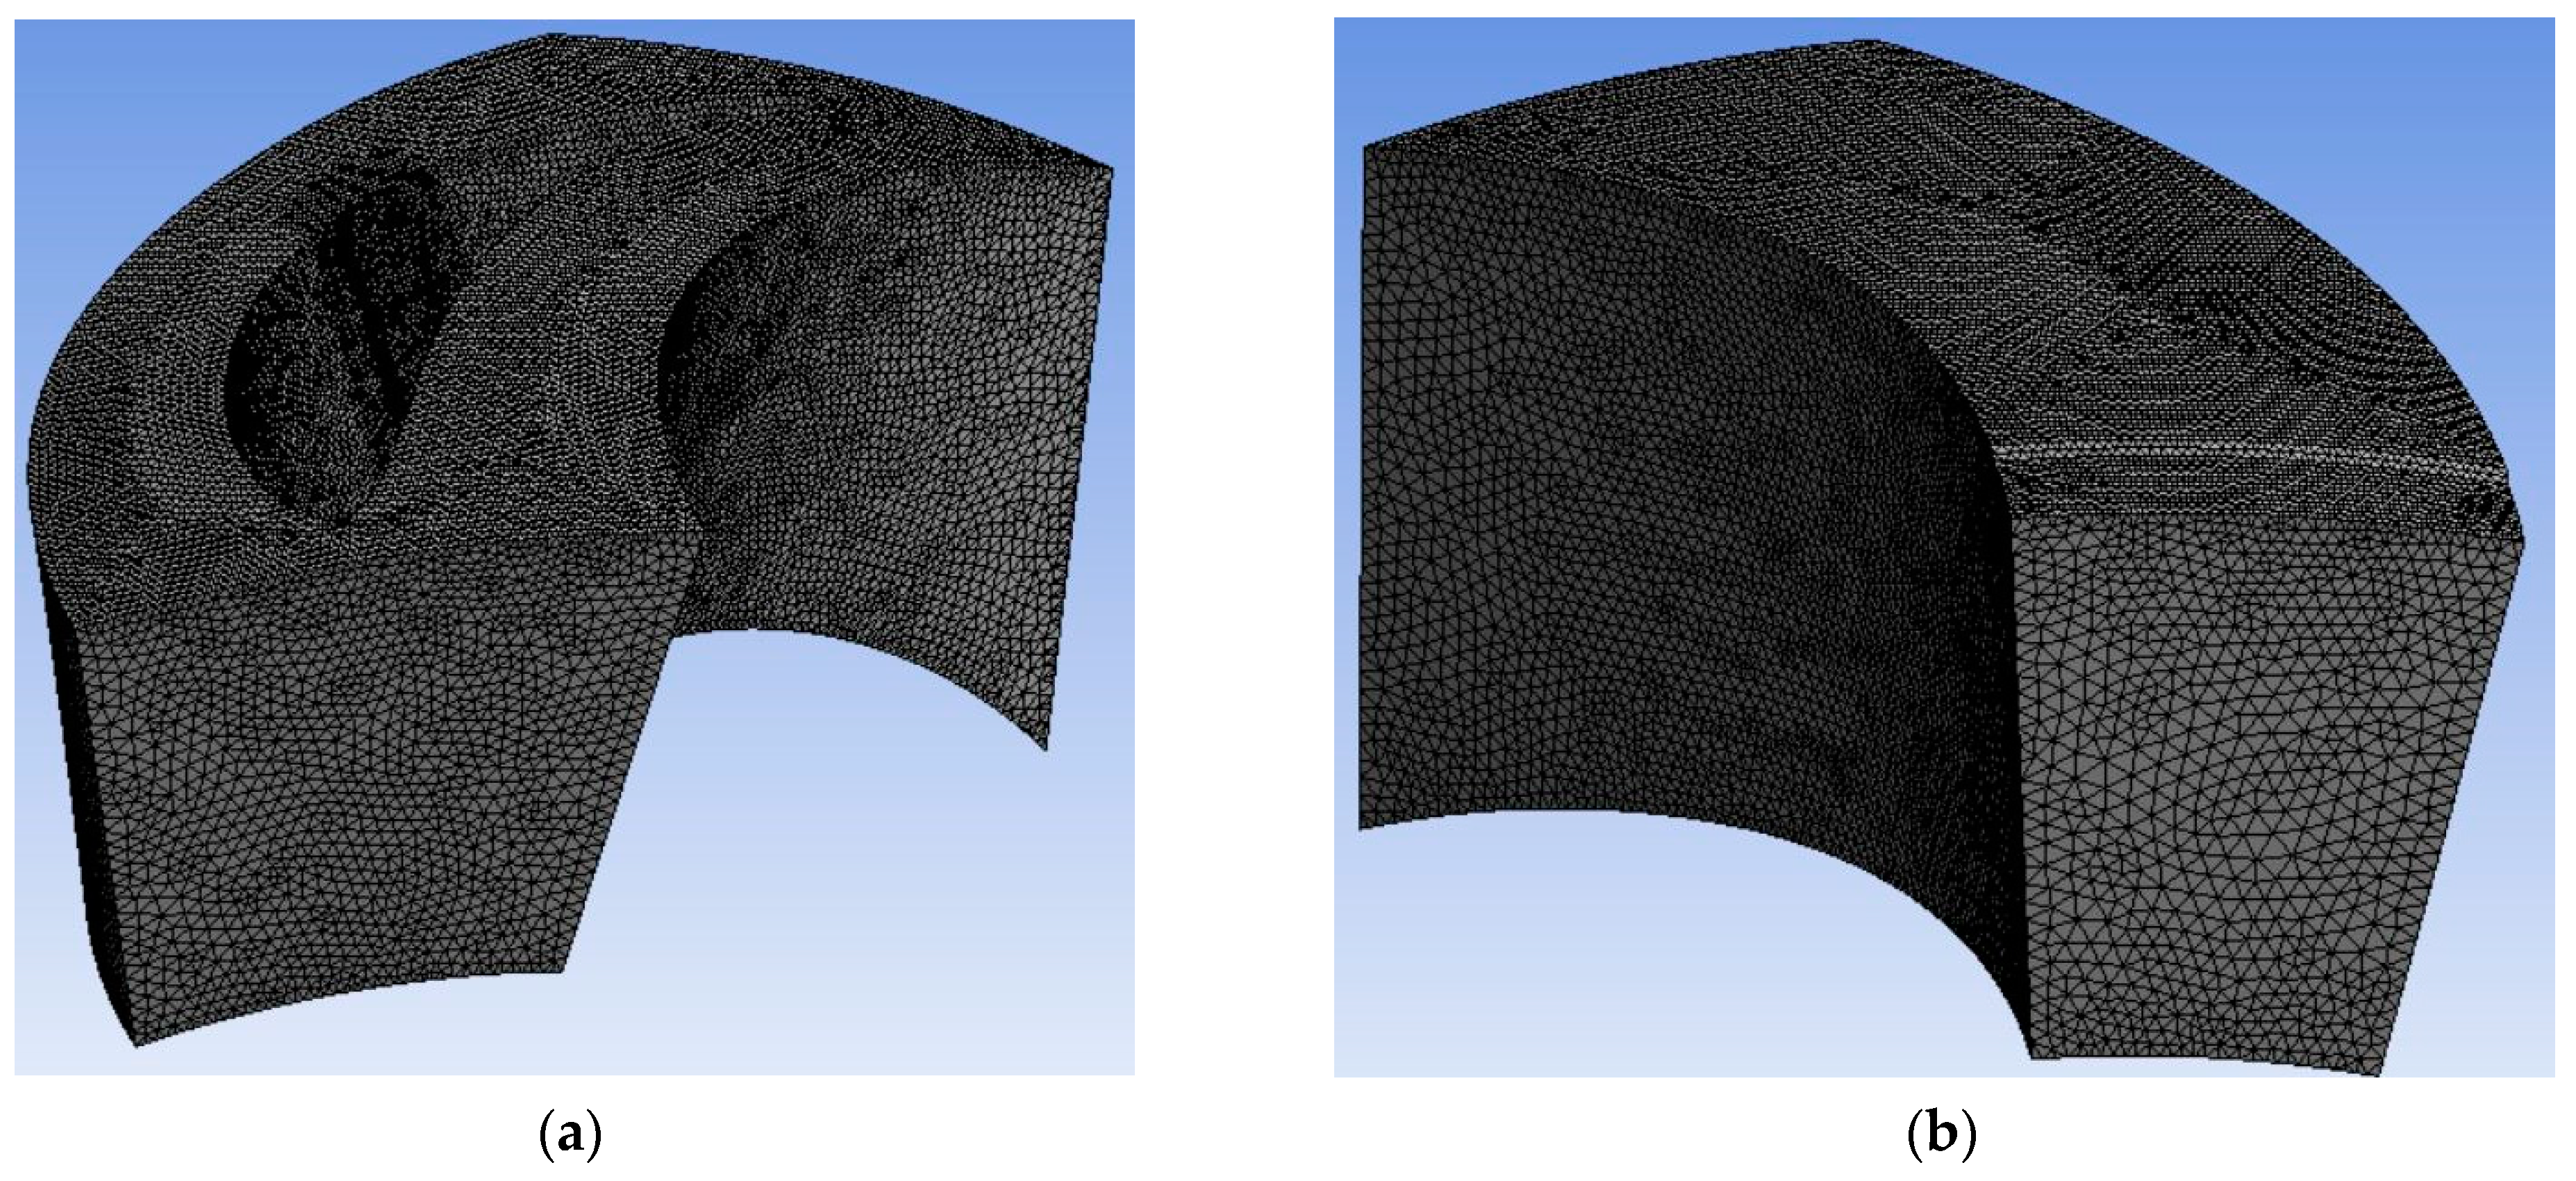
The numerical grid for this study is unstructured and was generated using ANSYS Mesh. To validate the grid, a dependency analysis was conducted using 3 configurations. The number of elements has been increased by a factor of approximately 3.3 across the configurations. The grid dependency analysis results are presented in Table 2. The power and isentropic efficiency values are similar for all configurations. The second configuration has been chosen for this numerical study to lower the computational demand; furthermore, for this configuration, the values of the y+ parameter are in the recommended interval for the selected turbulence model. The general dimension of the cells is 0.5 mm, with lower values and higher numbers of cells near the walls and the injection orifices. The numerical grids for stator and rotor models are presented in Figure 2.
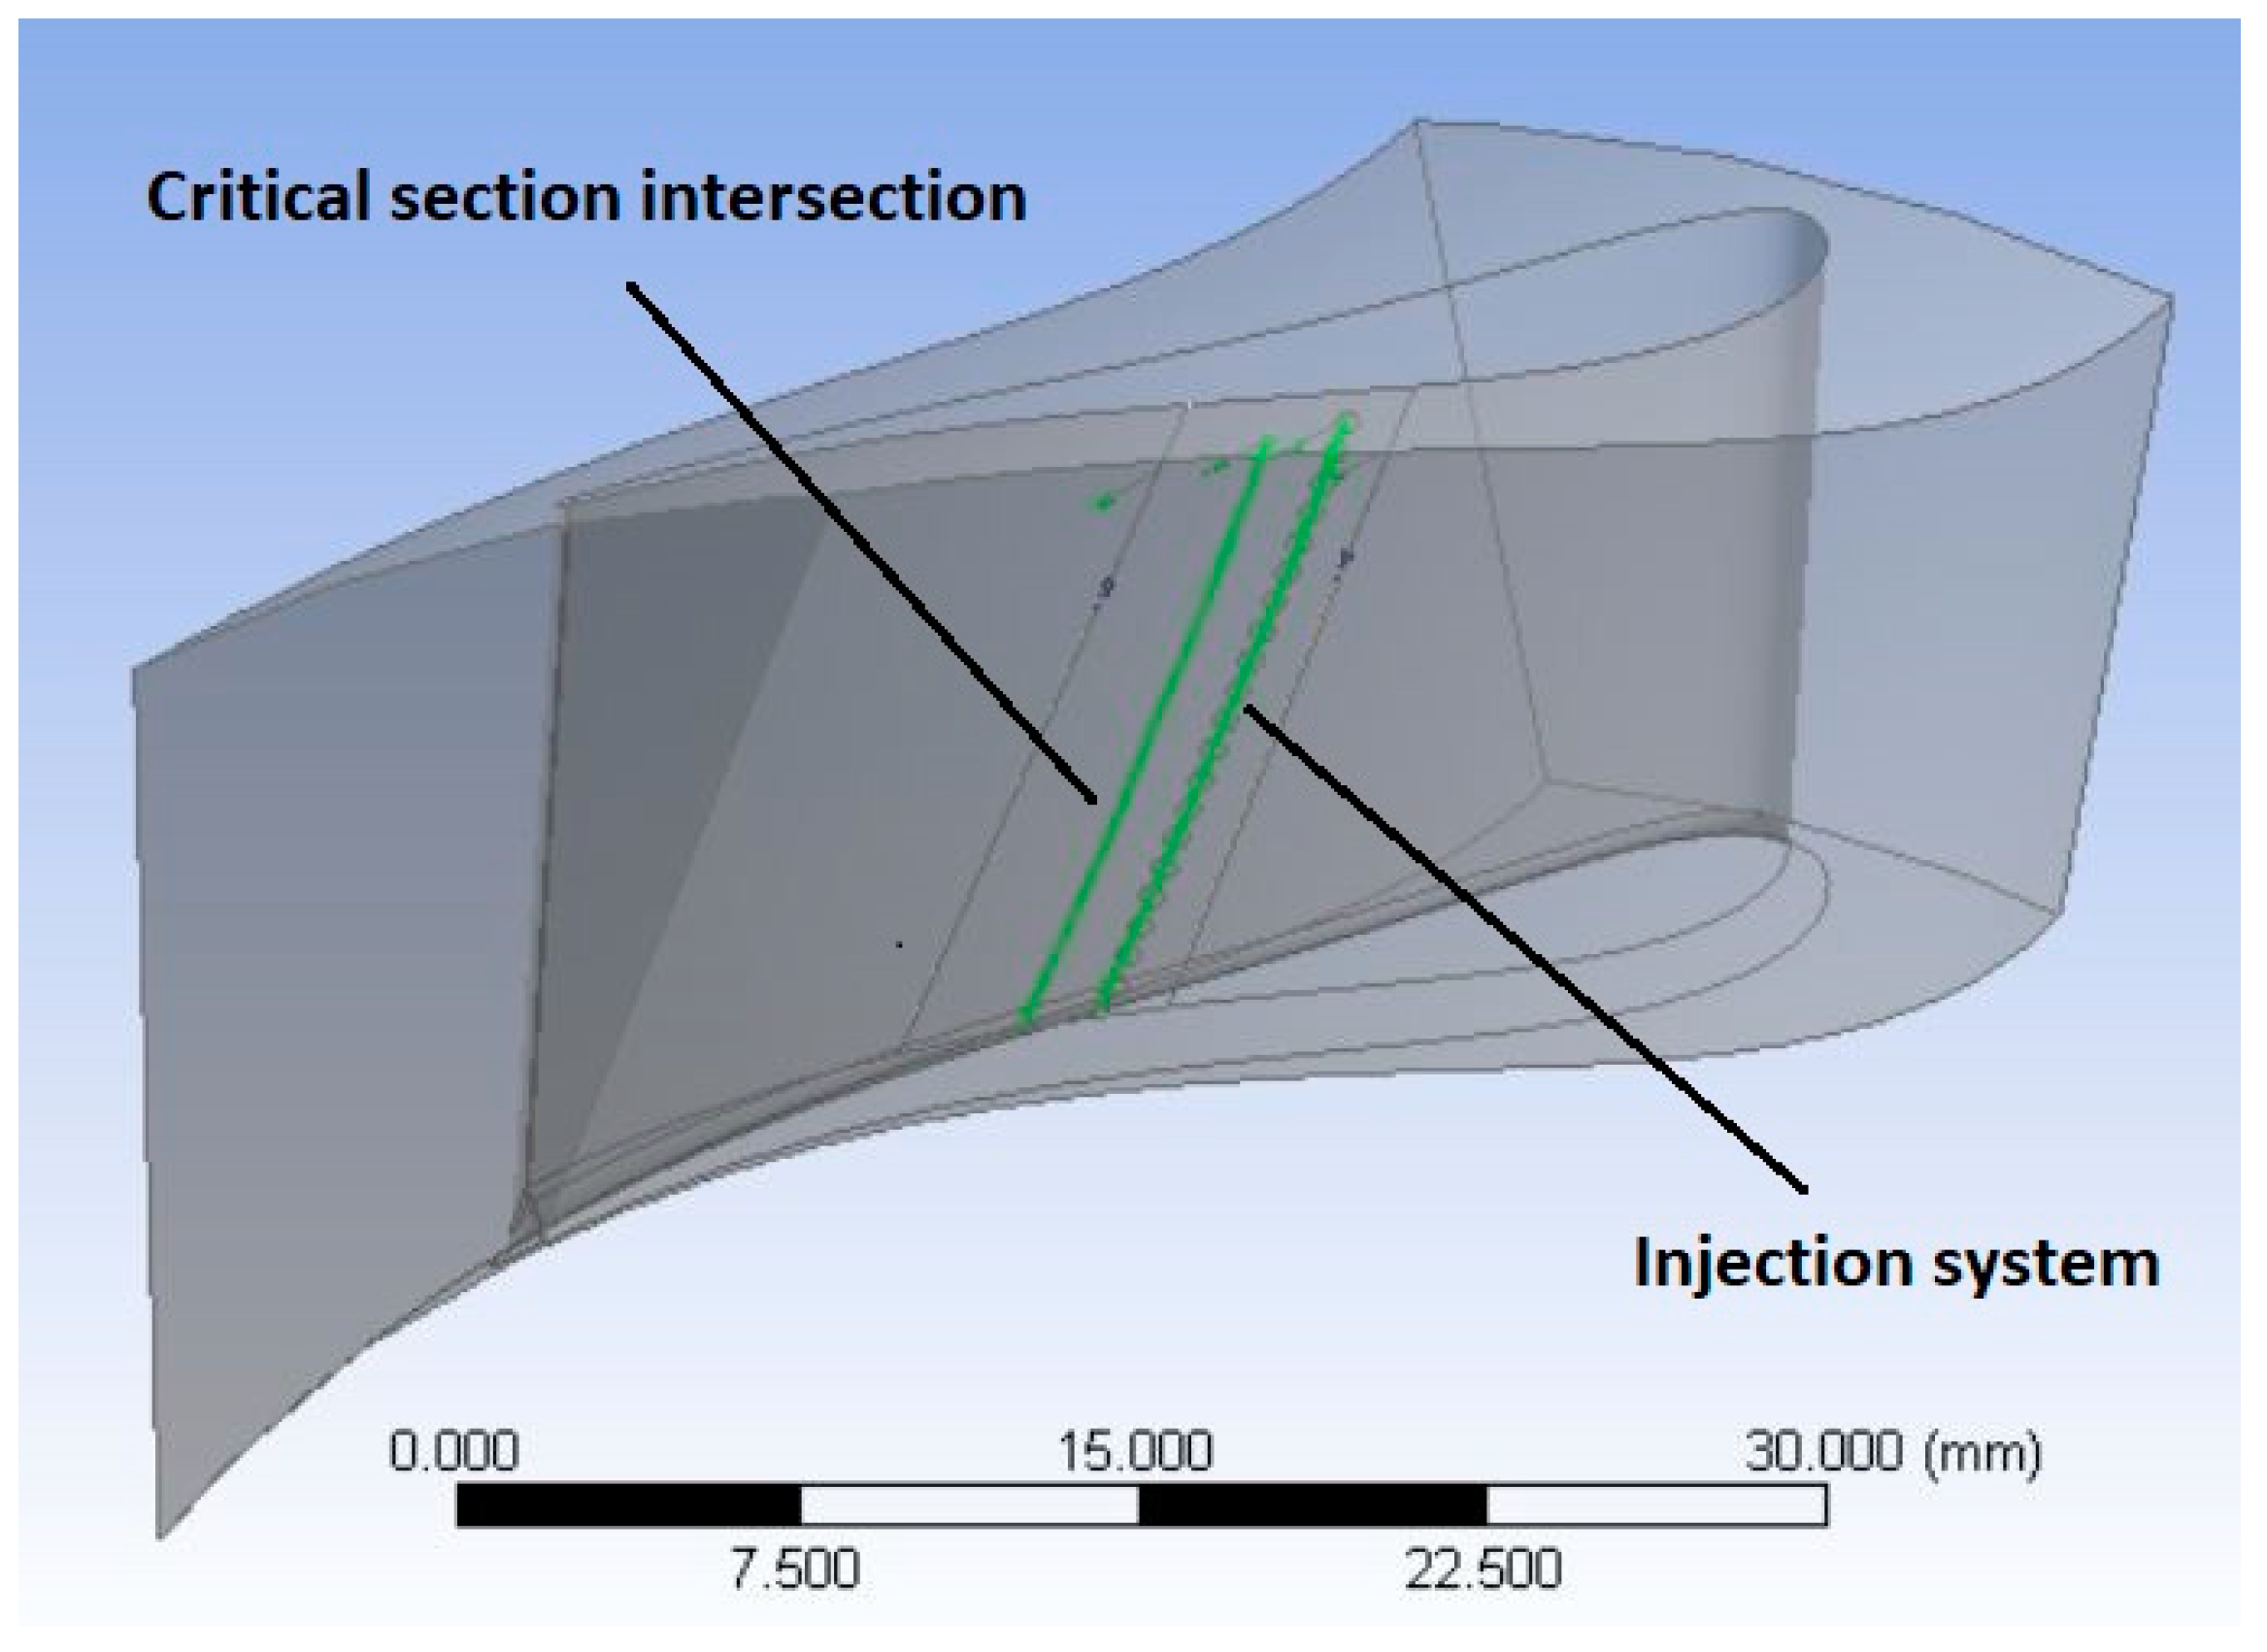
The injection system was generated using the methodology defined in previous studies ([2,3]). The system was constructed starting from the critical section of the vanes and its intersection with the suction side, followed by an offset of the resulting line upstream on the surface with a defined length, and the placement of the orifice sections (with predefined dimensions and numbers). For this numerical study, only perpendicular injection was considered, as better performance was obtained for this kind of injection in previous studies [2]. The injection system parameters are described in Table 3, and the placement of the injection system on the vane suction side for the microturbine is presented in Figure 3. From this figure, the effect of the small dimensions of the turbine can be determined, as the critical section intersection with the suction side of the vane is tilted, resulting in an upstream position of the line at the shroud compared with the line position at the vane hub. The injection-system parameters were selected based on previous studies, limiting the injection orifice to 0.5 mm for manufacturing reasons, and choosing the number of injection sections in order to obtain a coverage degree of approximately 65%.
The influence of the injection system on the performance of the microturbine has been investigated for 5 partial regimes. The input parameters for these regimes were determined using turbine maps and the engine working line, with their respective performance and flow fields being determined by numerical simulations. The partial regimes were selected in the interval of 70–81% of the nominal regime, with the idle regime representing 56.5% for this engine. The input parameters and the resulting power for each regime are presented in Table 4.

3. Results and Discussion

The turbine-inlet parameters at these partial regimes lead to lower than nominal velocities through the turbine profiles resulting in lower momentum on the rotor blades and a decreased power. In order to increase the generated power at these regimes, the injection system was introduced to produce a deviation of the working flow, away from the suction side of the vane, in the near vicinity of the minimum section. With this deviation, a reduction of the flow section is targeted, which will cause an acceleration of the working fluid and an increased power generated by the rotor. It was demonstrated in previous studies [3] that the power generated can be increased by as much as 33%, depending on the injection parameters and turbine power setting.

3.1. Influence of the Injection System for Different Partial Regimes

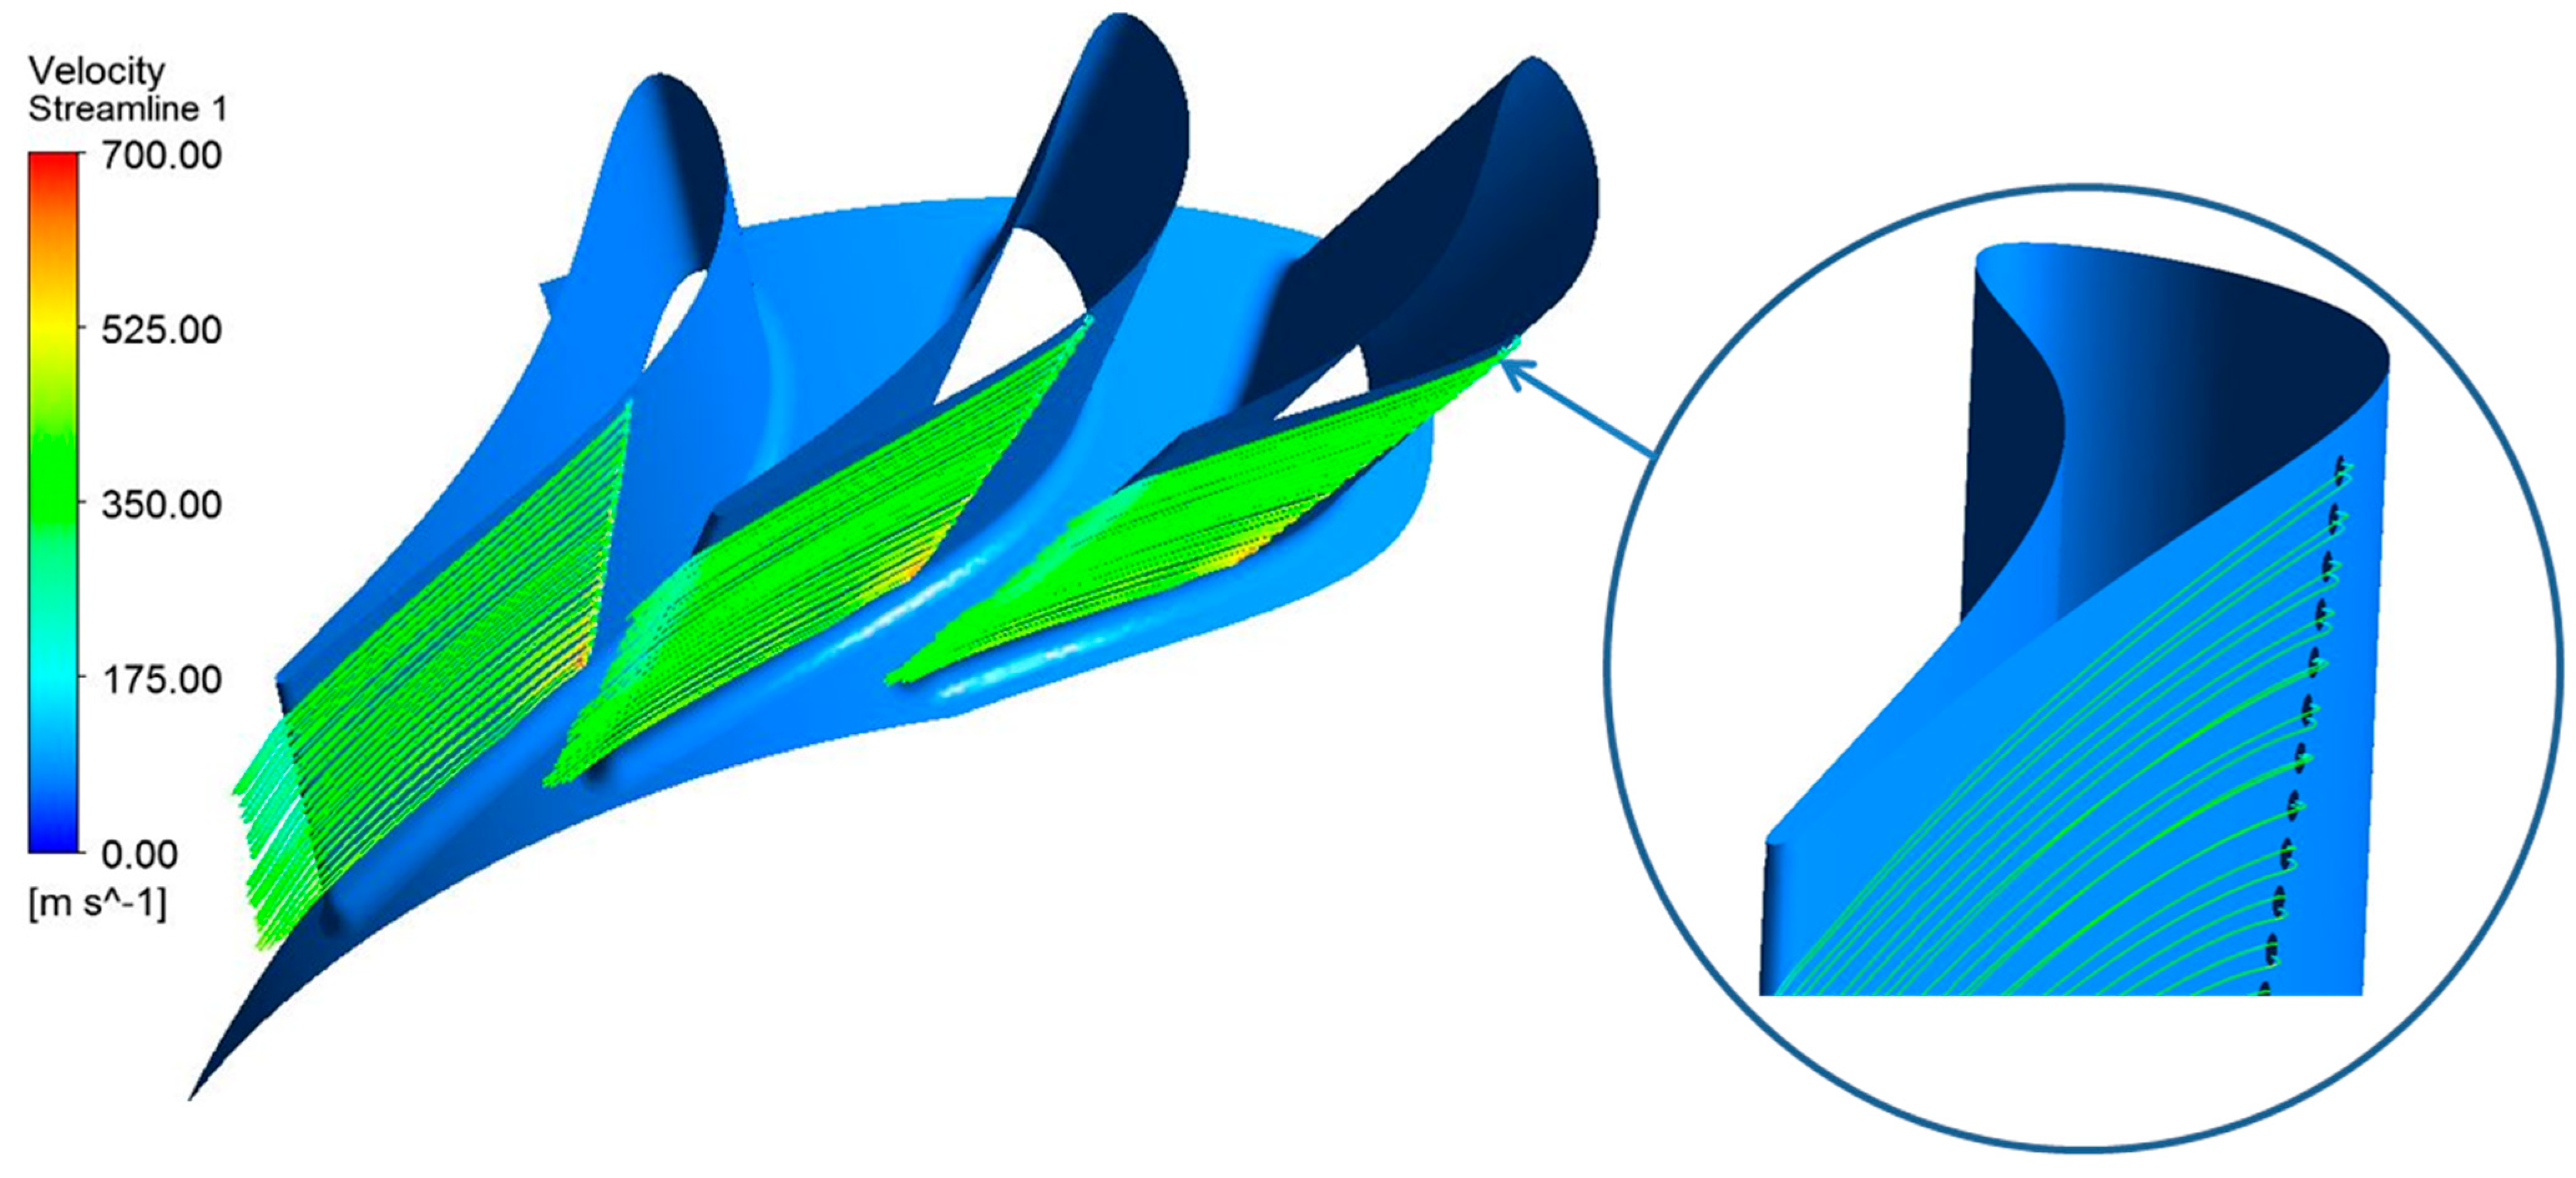
For the turbine studied in this paper, and in accordance with the expected behavior, the injection fluid interacted with the working flow by detaching the flow from the suction side of the vane in the vicinity of the injection sections. This deviation created a low-pressure zone, with the injection flow reattaching to the vane walls downstream, after a rapid change of direction. This behavior can be seen in Figure 4, which presents the injection-flow streamlines downstream of the injection sections.
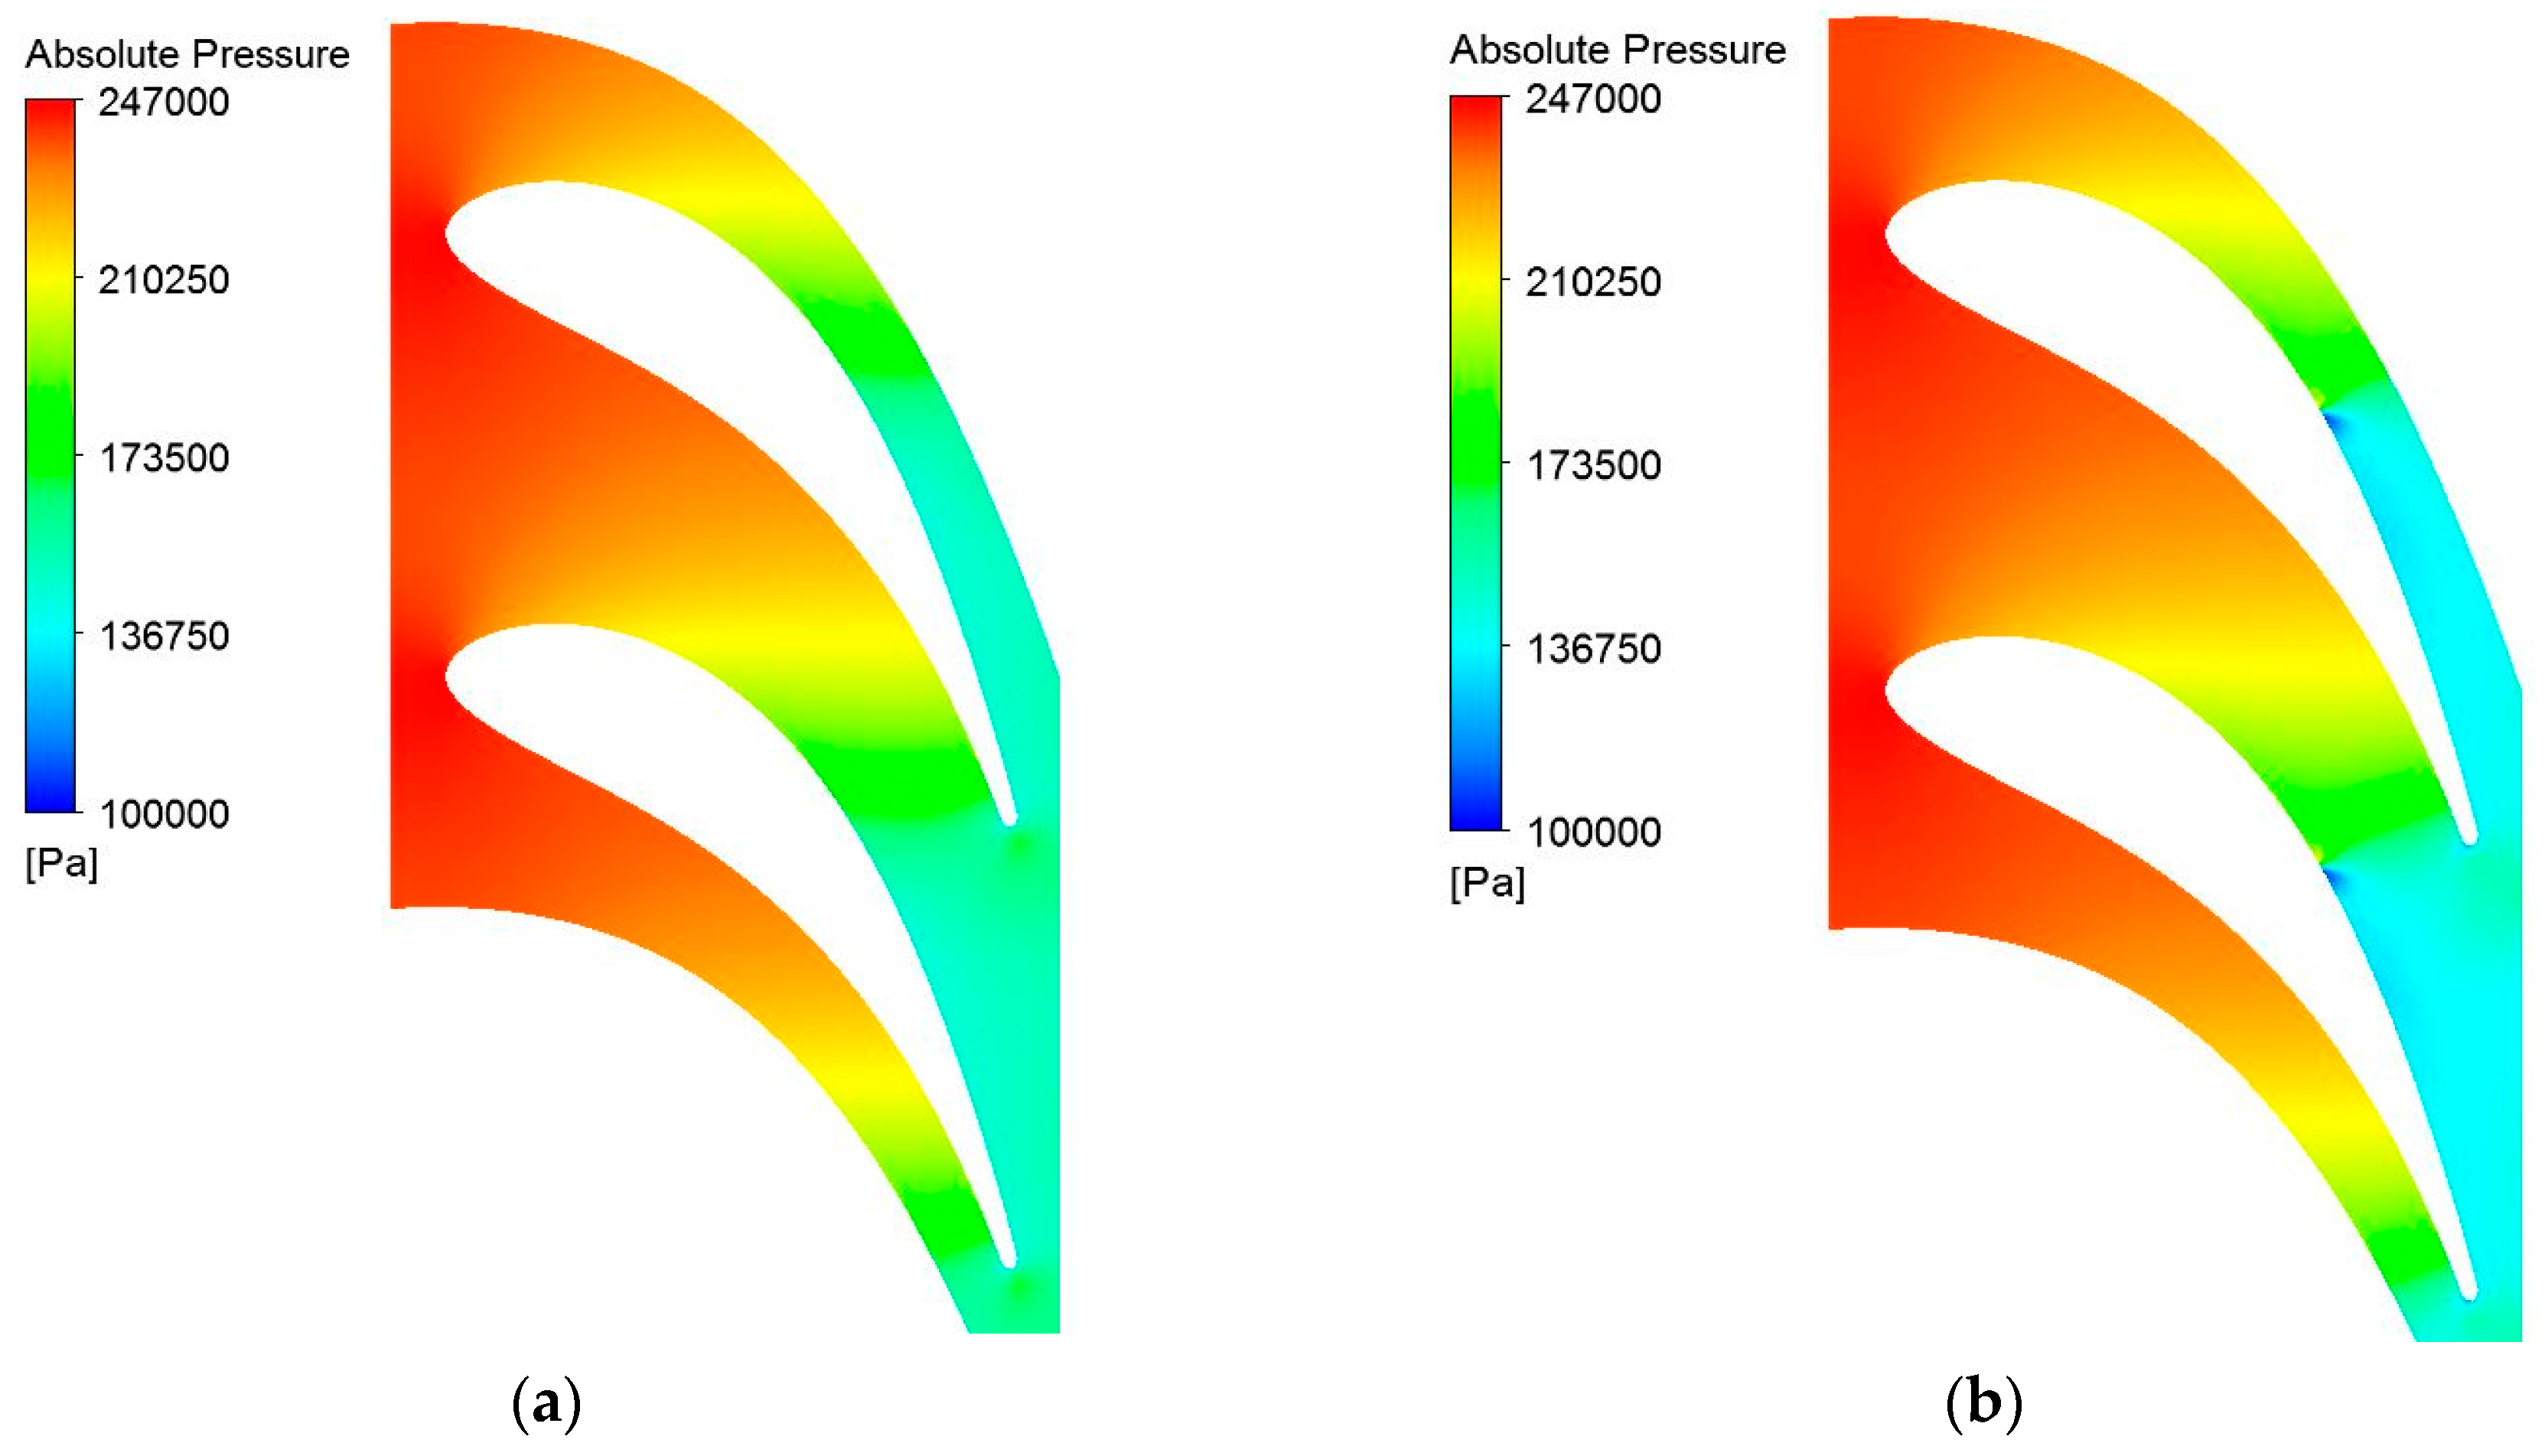
From the static pressure distribution presented in Figure 5, before and after injection, the interaction between the working flow and the injected fluid can be determined. The low-pressure zone downstream of the injection section is visible, as is lower static pressure downstream, which is caused by the acceleration of the working fluid.
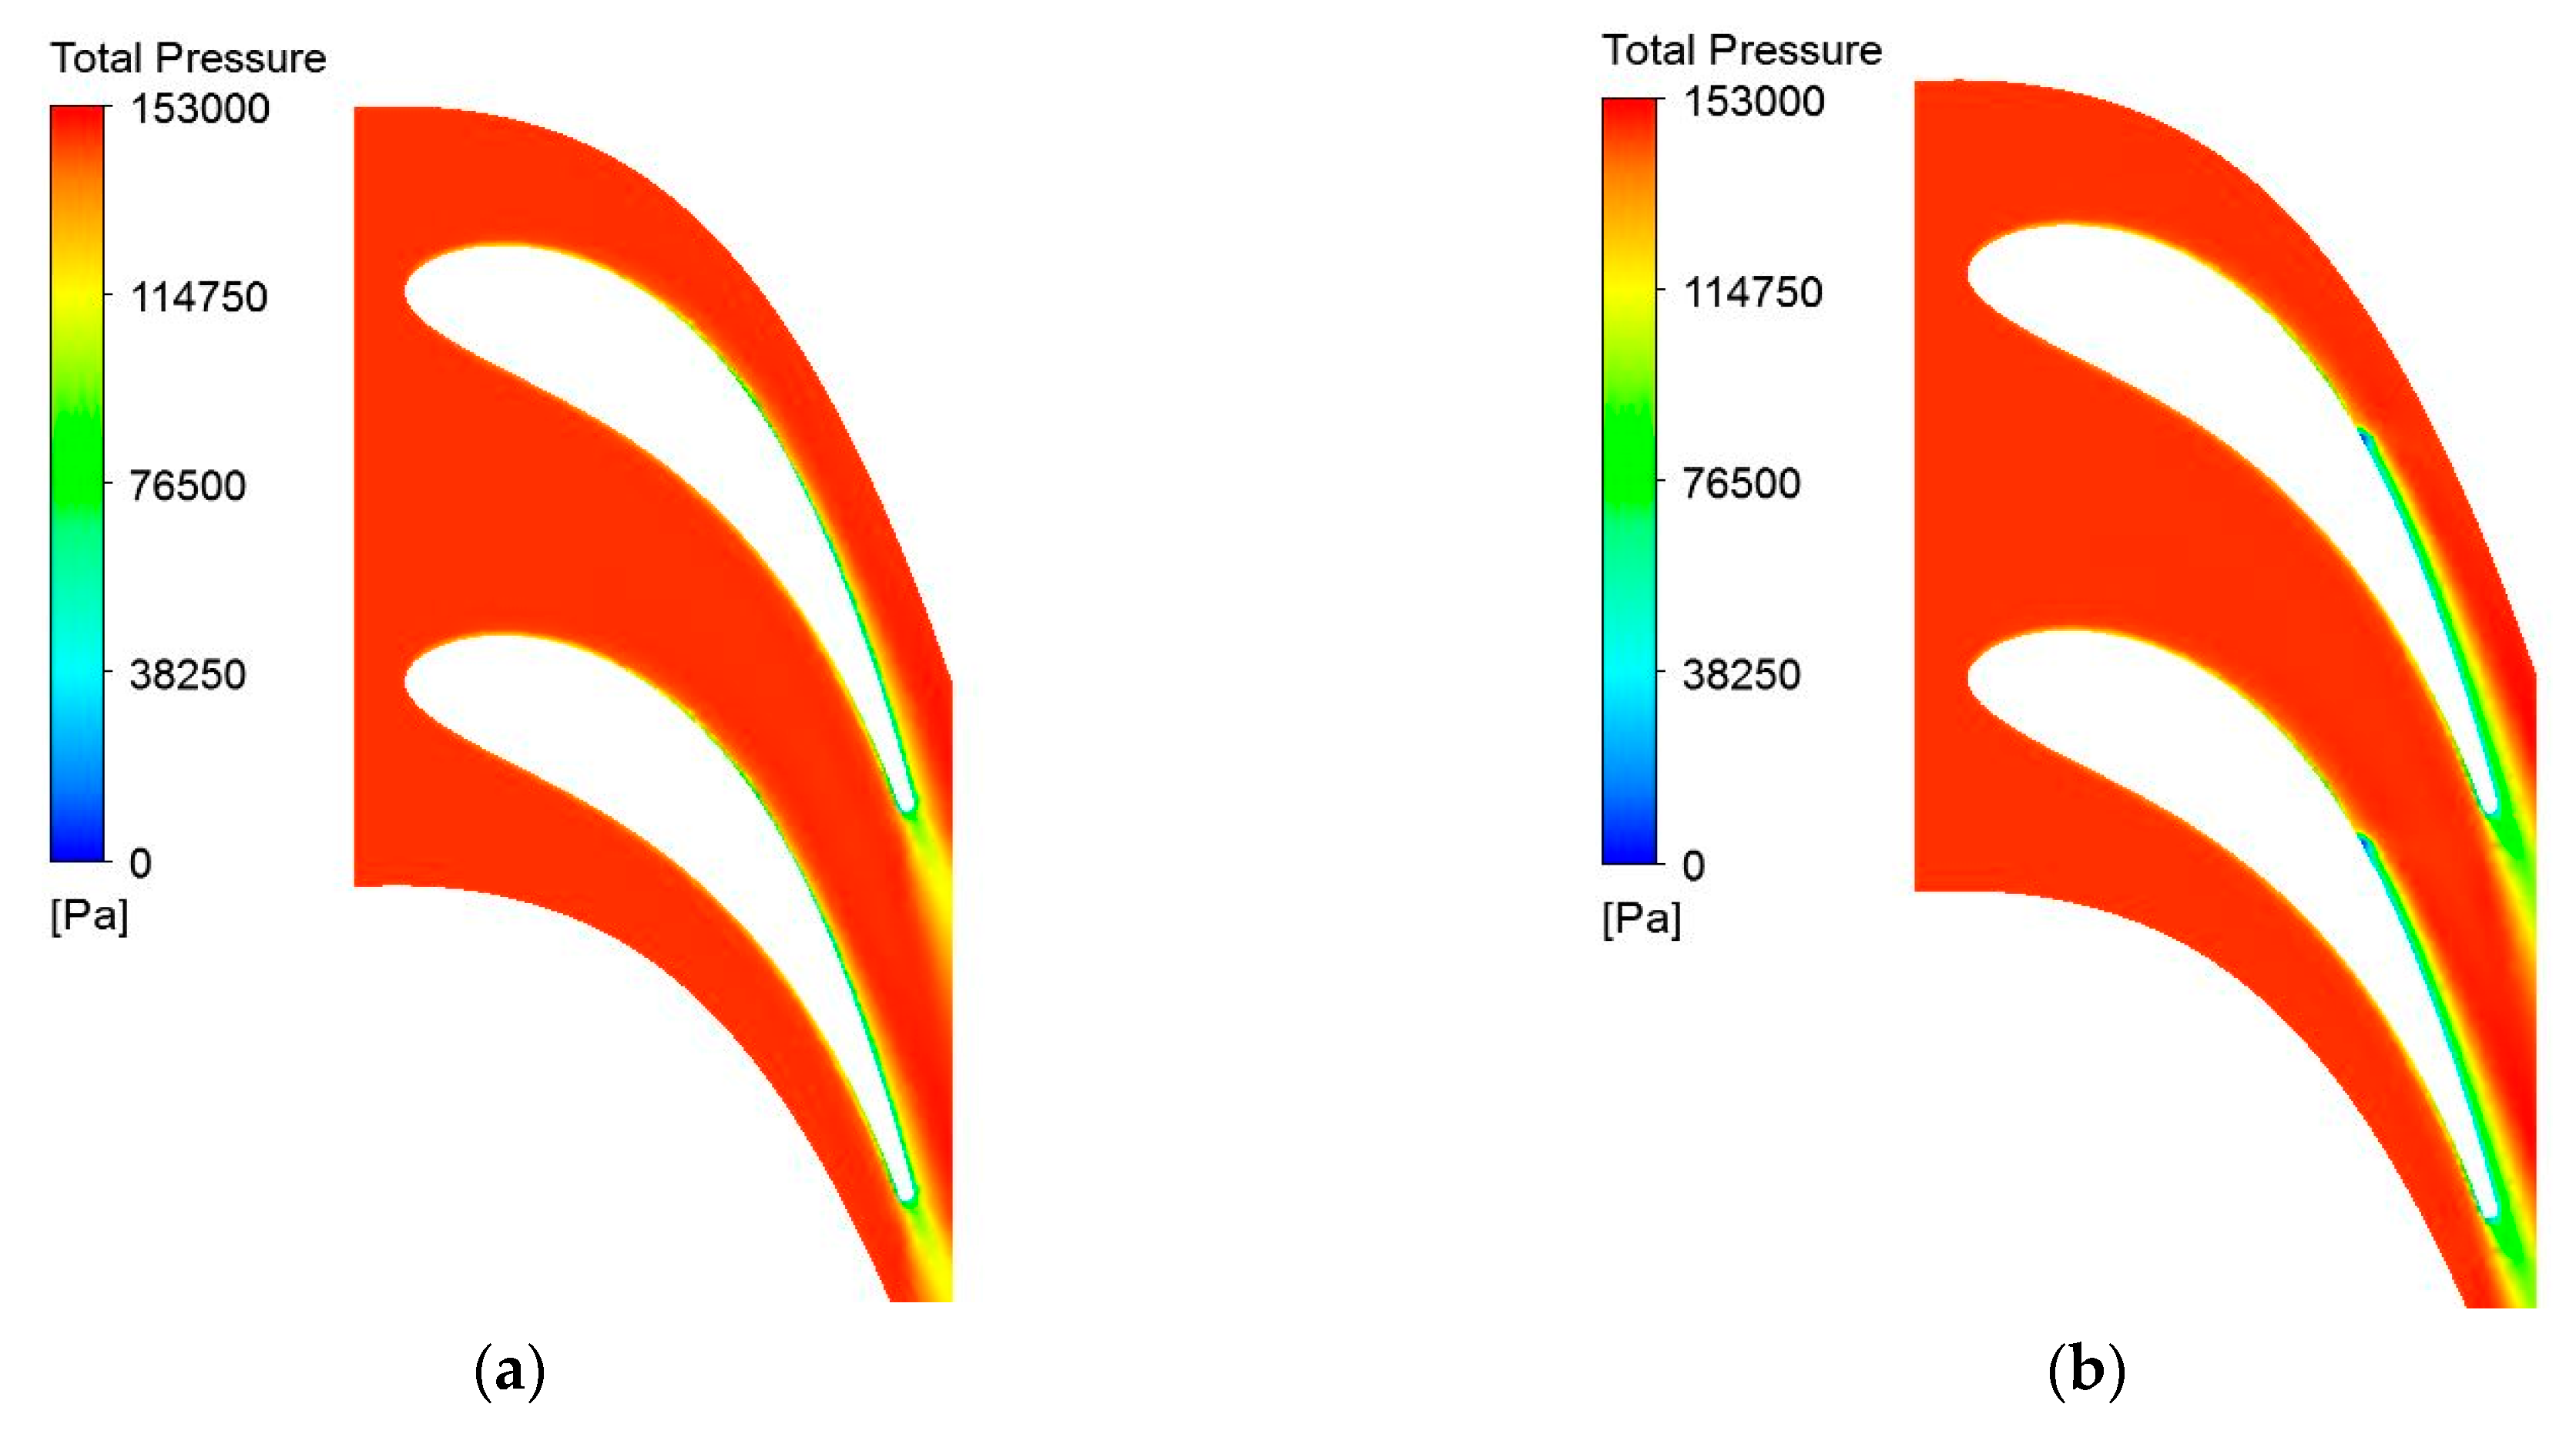
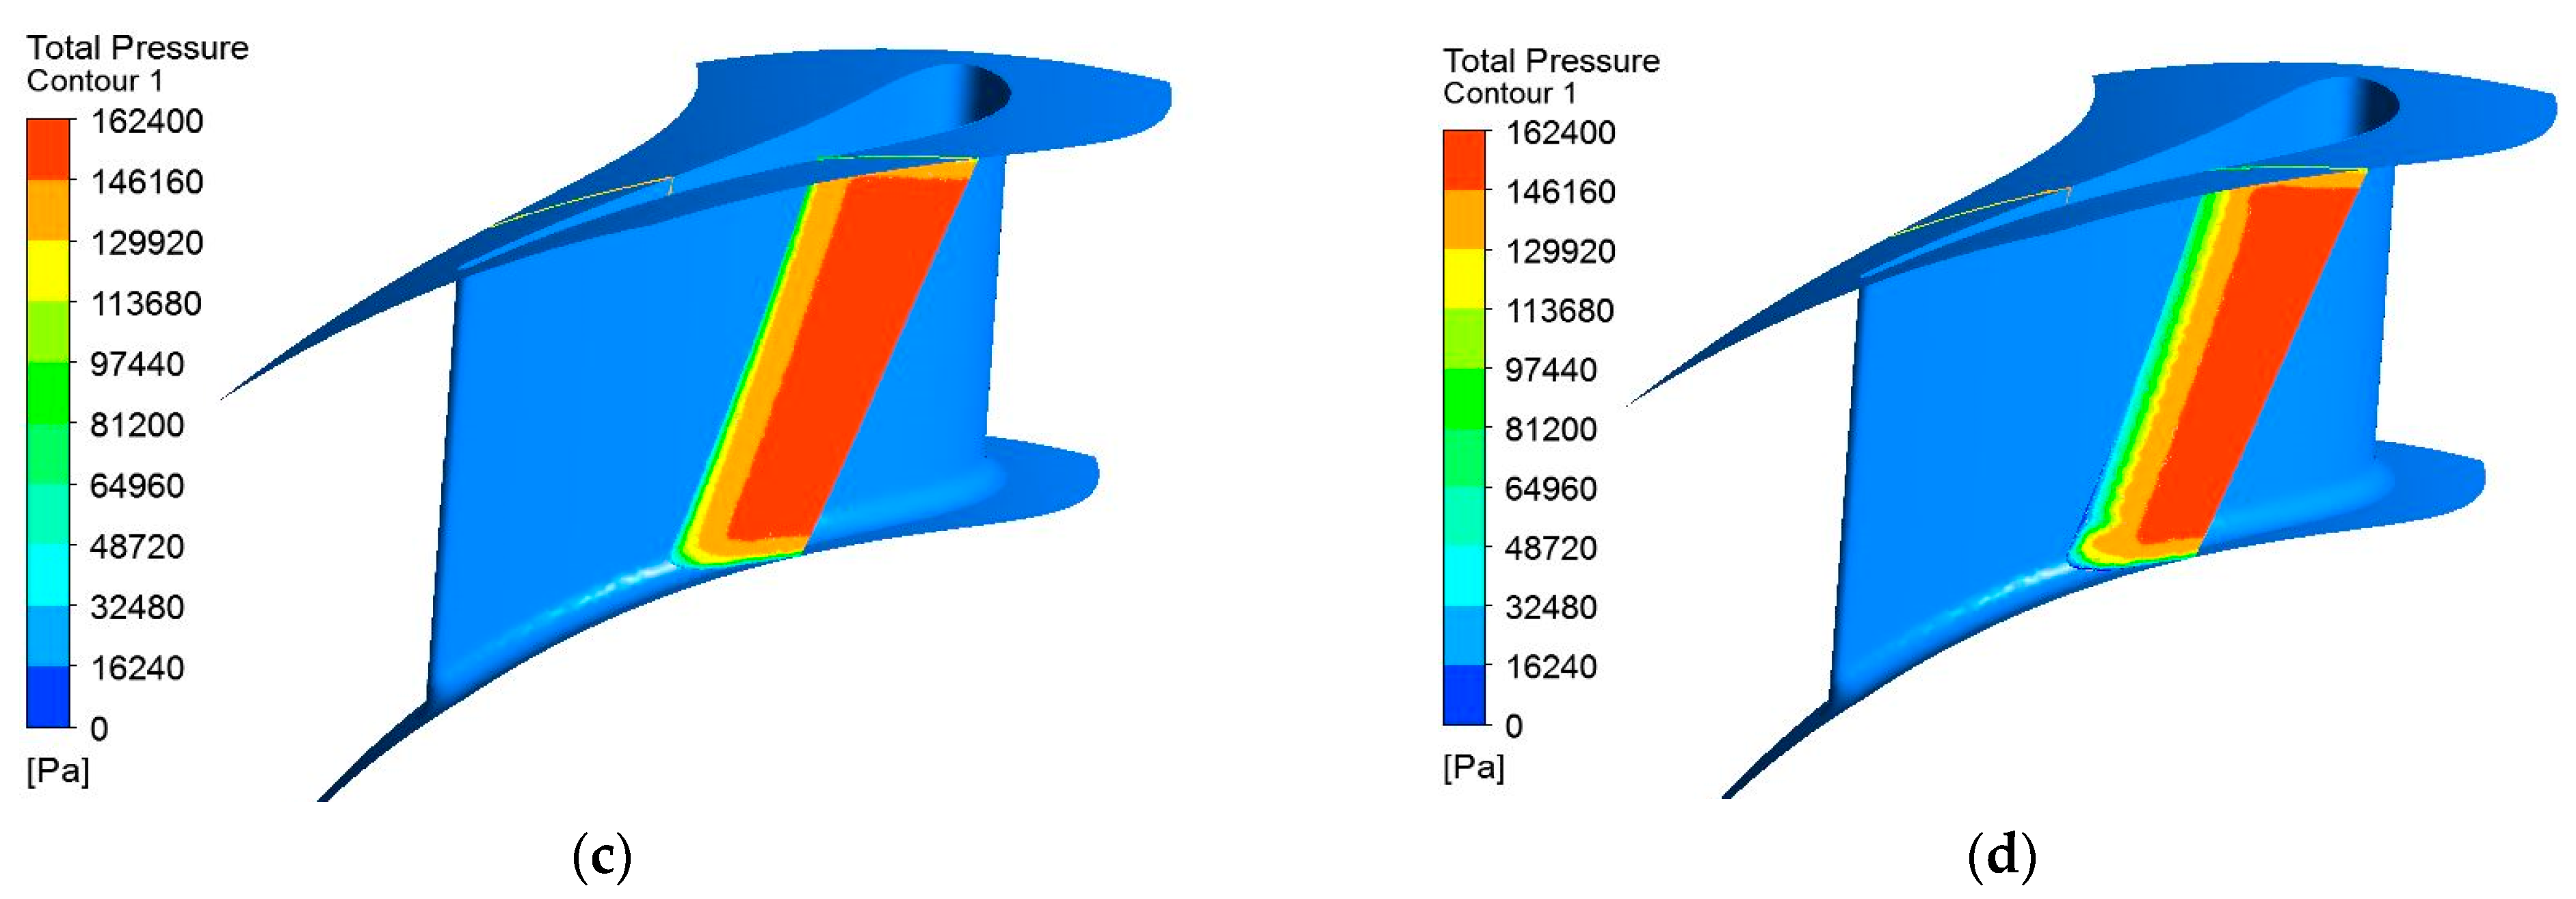
The low-pressure zone downstream of the injection region in the near vicinity is better noticed when representing the total pressure contour in the stator channels. By comparing the cases with and without injection, the effect of the system, which is the decrease in the minimum section, can be deduced. The differences between the two cases are presented in Figure 6.
The mean radius comparison between the cases with and without injection, in Figure 6a,b, shows a clear low-pressure zone after the injection process. If a small low-pressure zone is present on the suction side of the vane for the case without injection, determined by the increased height of the boundary layer, for the case where the injection is present, the low-pressure zone is much more pronounced, leading to a smaller flow section for the working fluid and, thus, higher speed at the vane exit. A similar effect is obtained across the blade height, as can be determined from the comparison between the two cases in a section downstream of the injection orifices, Figure 6c,d.
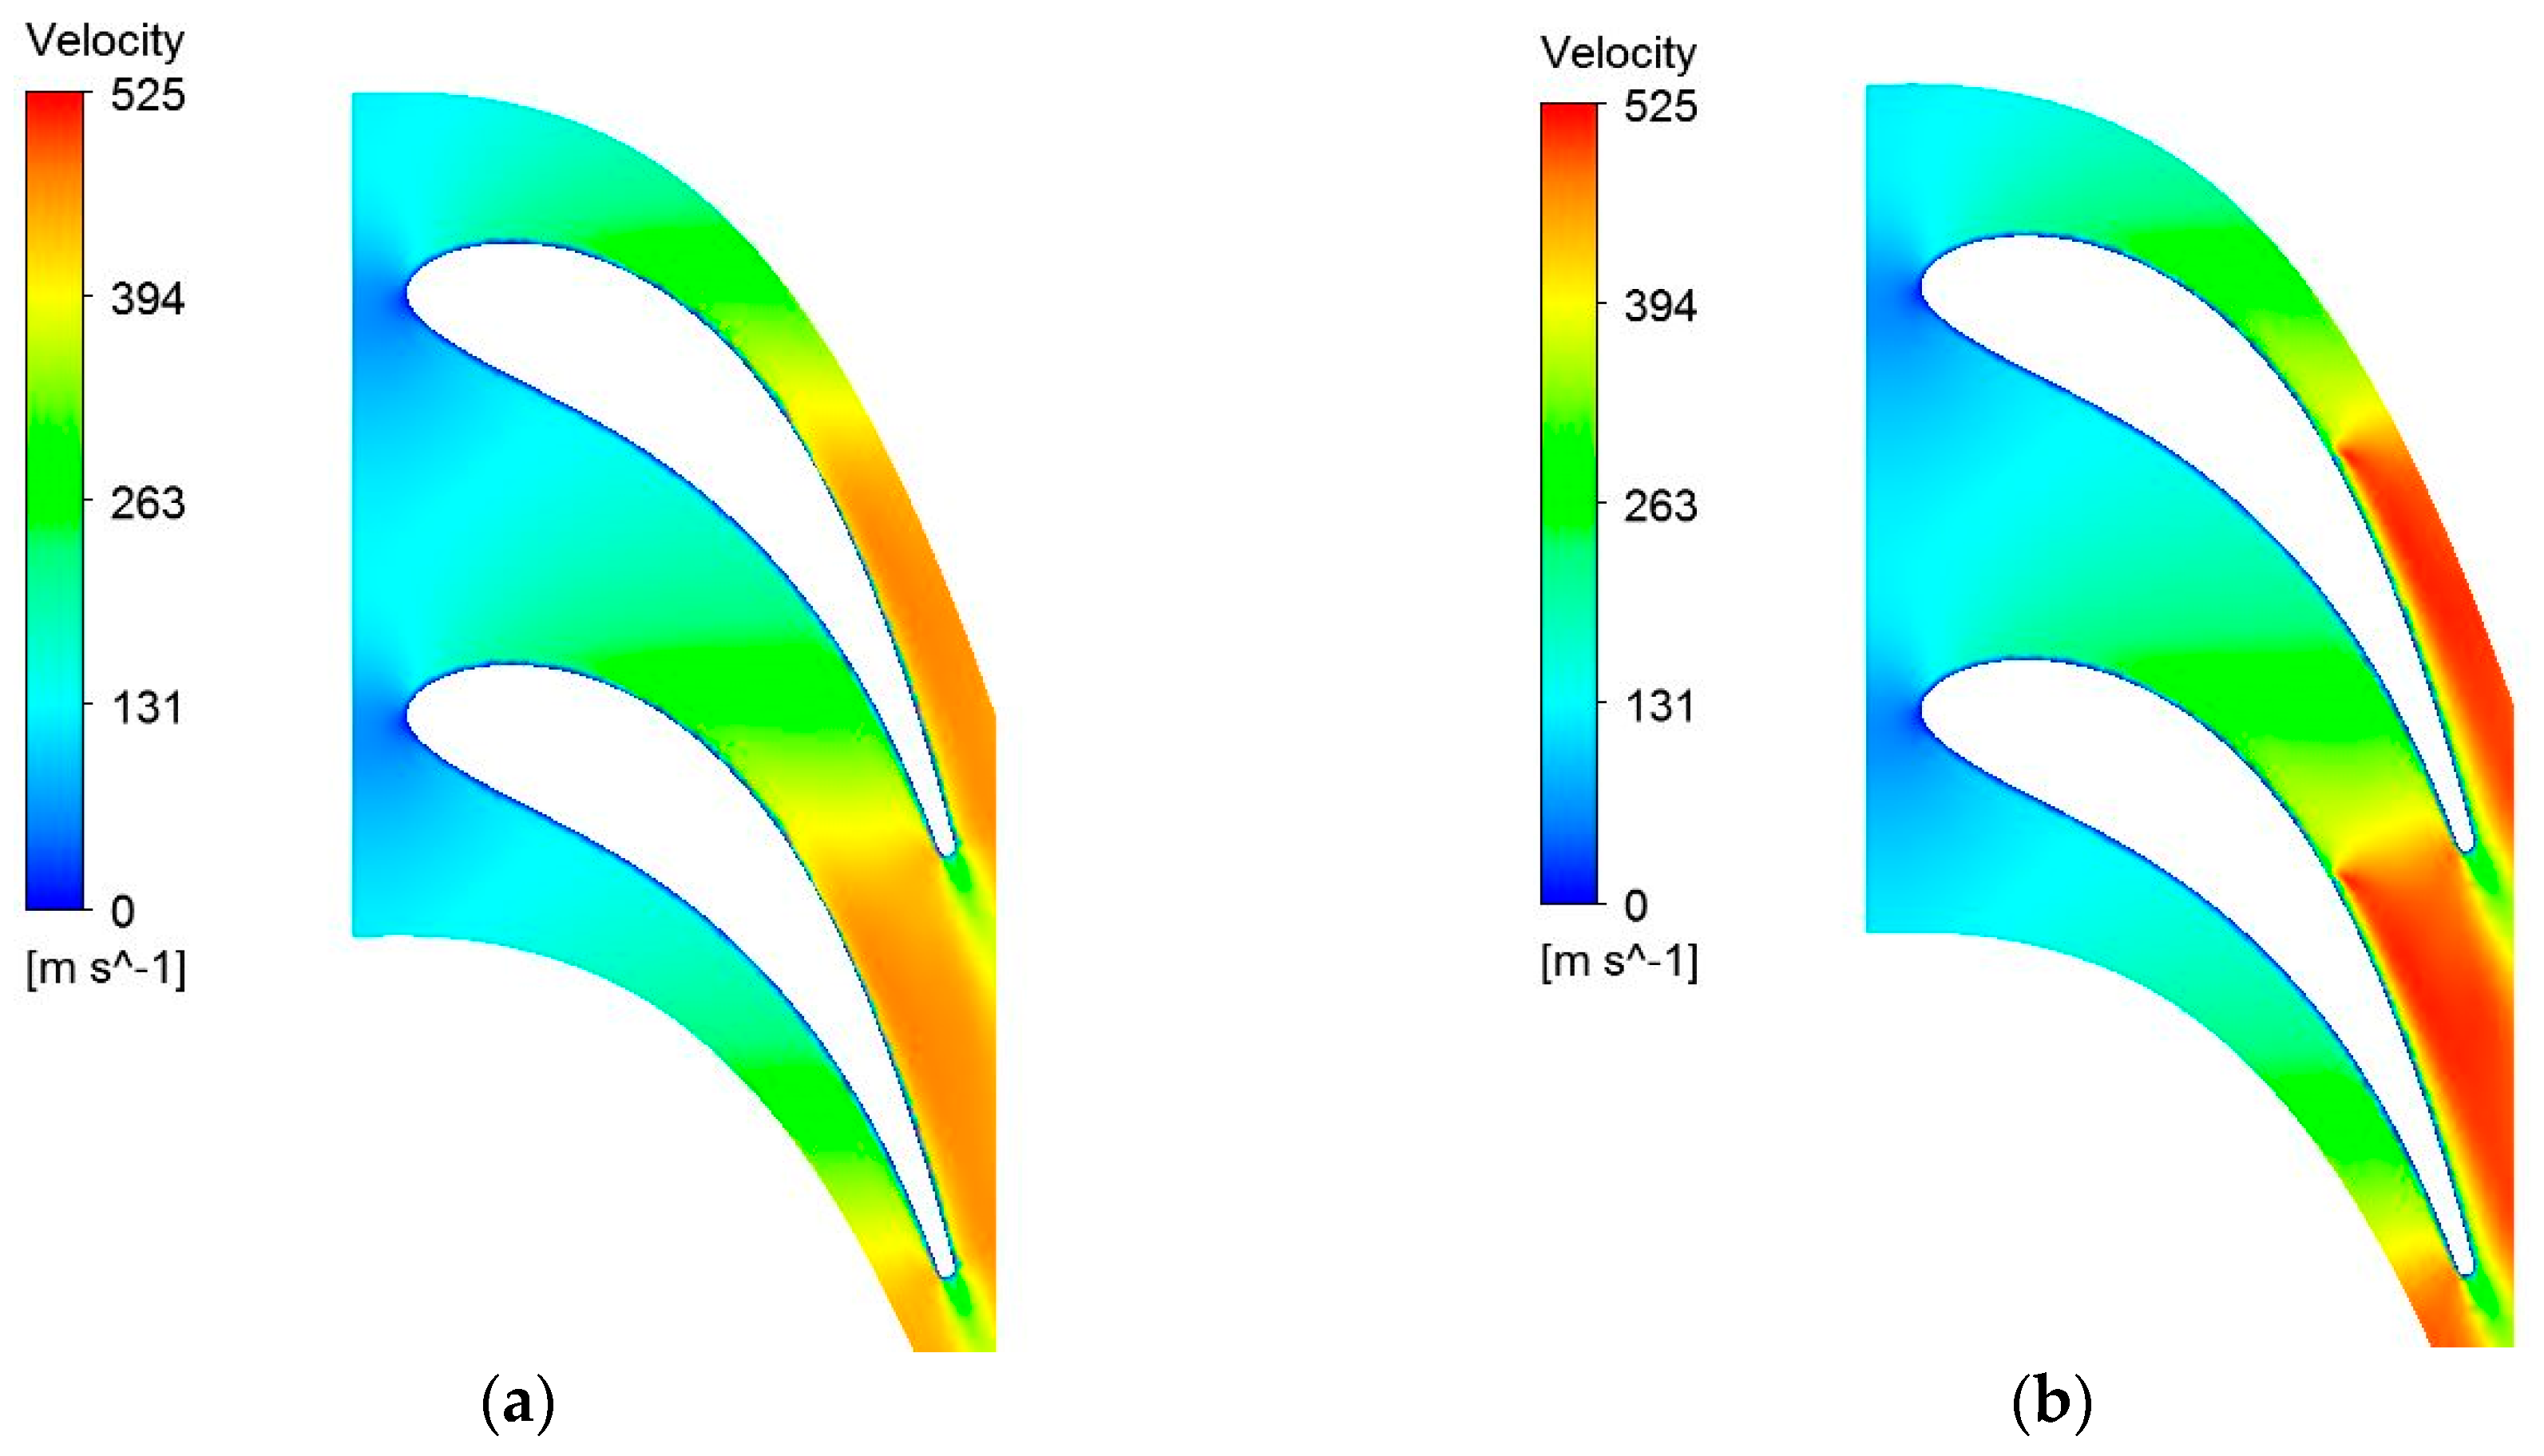
The effect of the decreased minimal section of the flow channel, resulting from the injection process, can be determined in Figure 7, which presents the comparison of the velocities at the mean radius for the case before and after injection. From this comparison, it can be determined that higher velocities resulted downstream of the injection section with similar values upstream.
The injection system has been verified for five partial regimes. The verification was completed by calculating, for each regime, the flow field and performance before and after injection. For each case, the power generated by the rotor has increased by approximately 11% to 21% of the initial value. As the mass flow is a constant value, set at the rotor outlet, the total mass flow through the turbine is the same for the cases with and without injection. Thus, the power increase is not a result of additional mass being introduced in the channels but rather a result of a modified flow geometry better adapted to the respective inlet conditions.
As shown in previous studies, the power increase is more pronounced at higher regimes. If a power increase of approximately 11.7% of the initial value is achieved at 70% speed, an increase of approximately 21.1% is achieved at 76%. The values for generated power, before and after injection, for each case are presented in Table 5. For the last regimes studied, “partial 4” and “partial 5”, the power increase is lower, 13.6%, and 7.9%, respectively, as, for these cases, the injection mass flow is limited at approximately 1.54% and 0.94% of the working-fluid mass flow. This limitation is caused by the flow blockage in the injection sections as the injection mass flow increases.
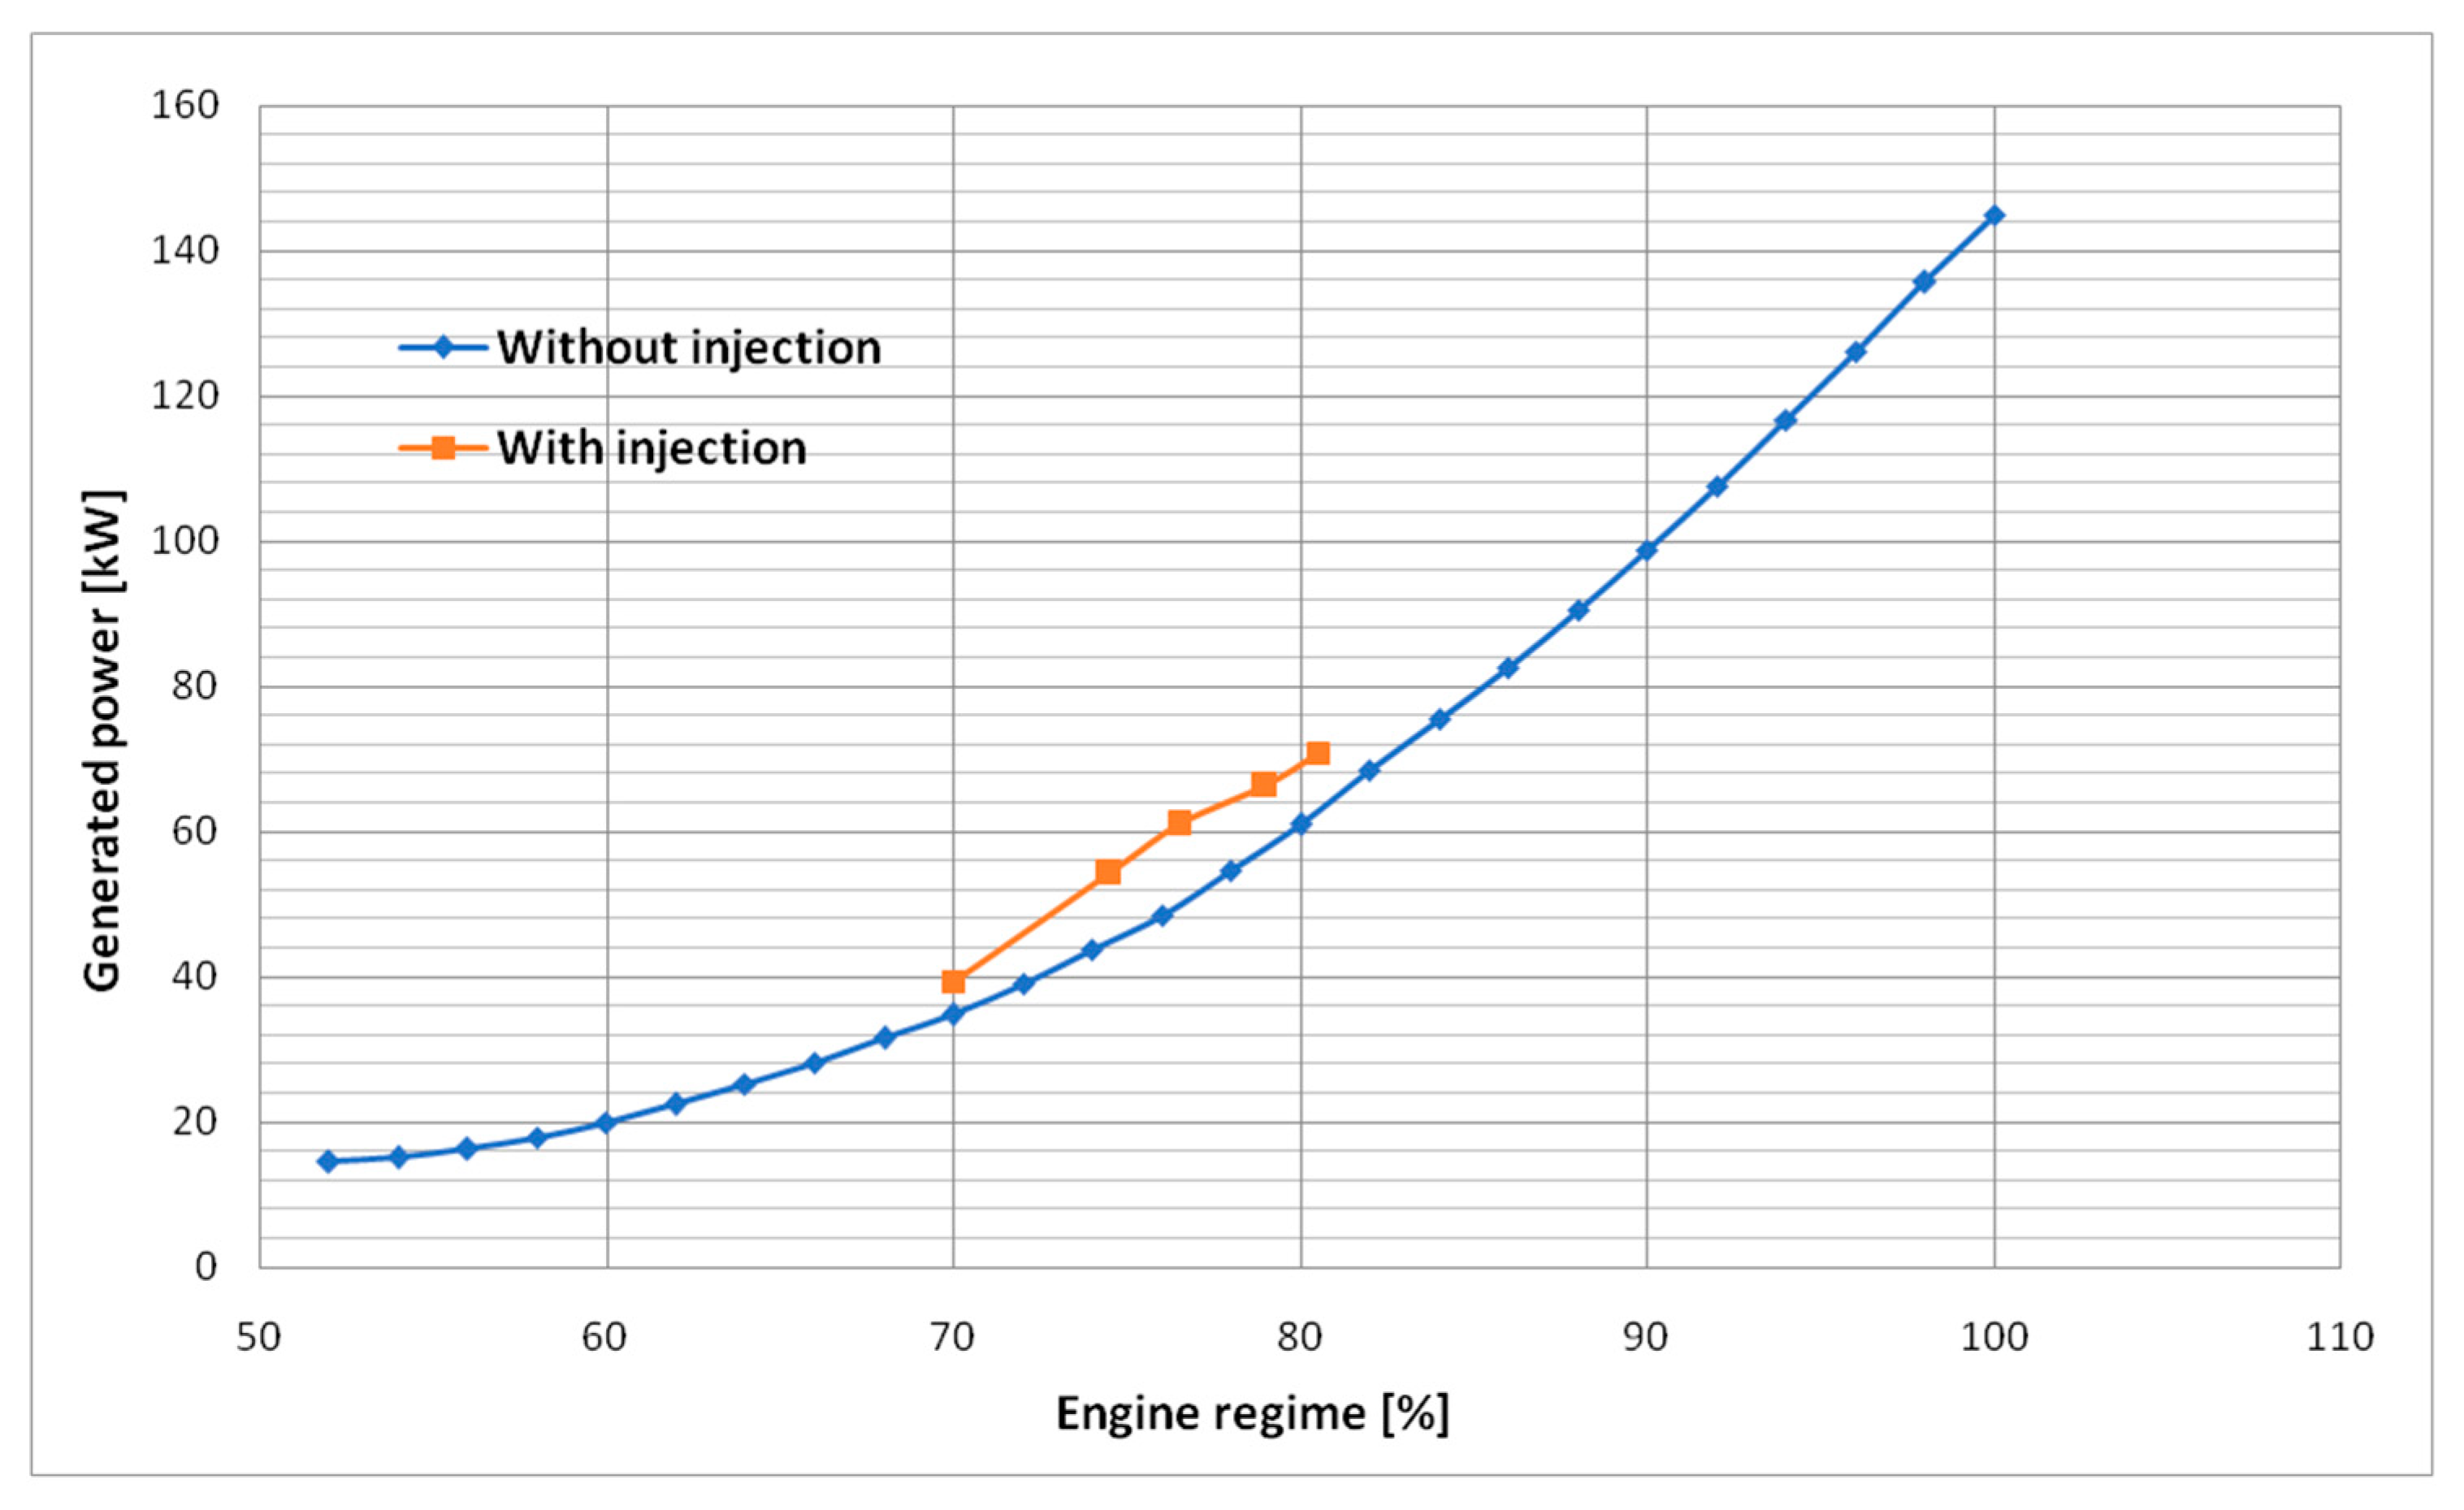
By plotting the power that resulted after injection on the graph representing generated power at different regimes, according to the engine working line, in Figure 8, it can be determined that the injection process is capable of increasing the rotor power output for the same initial conditions. Thus, higher regimes can be achieved without additional fuel. For example, for “partial 3”, the injection process at 76% determined a power output equivalent to an 80% regime.

3.2. Engine Response to Turbine-Specific Injection

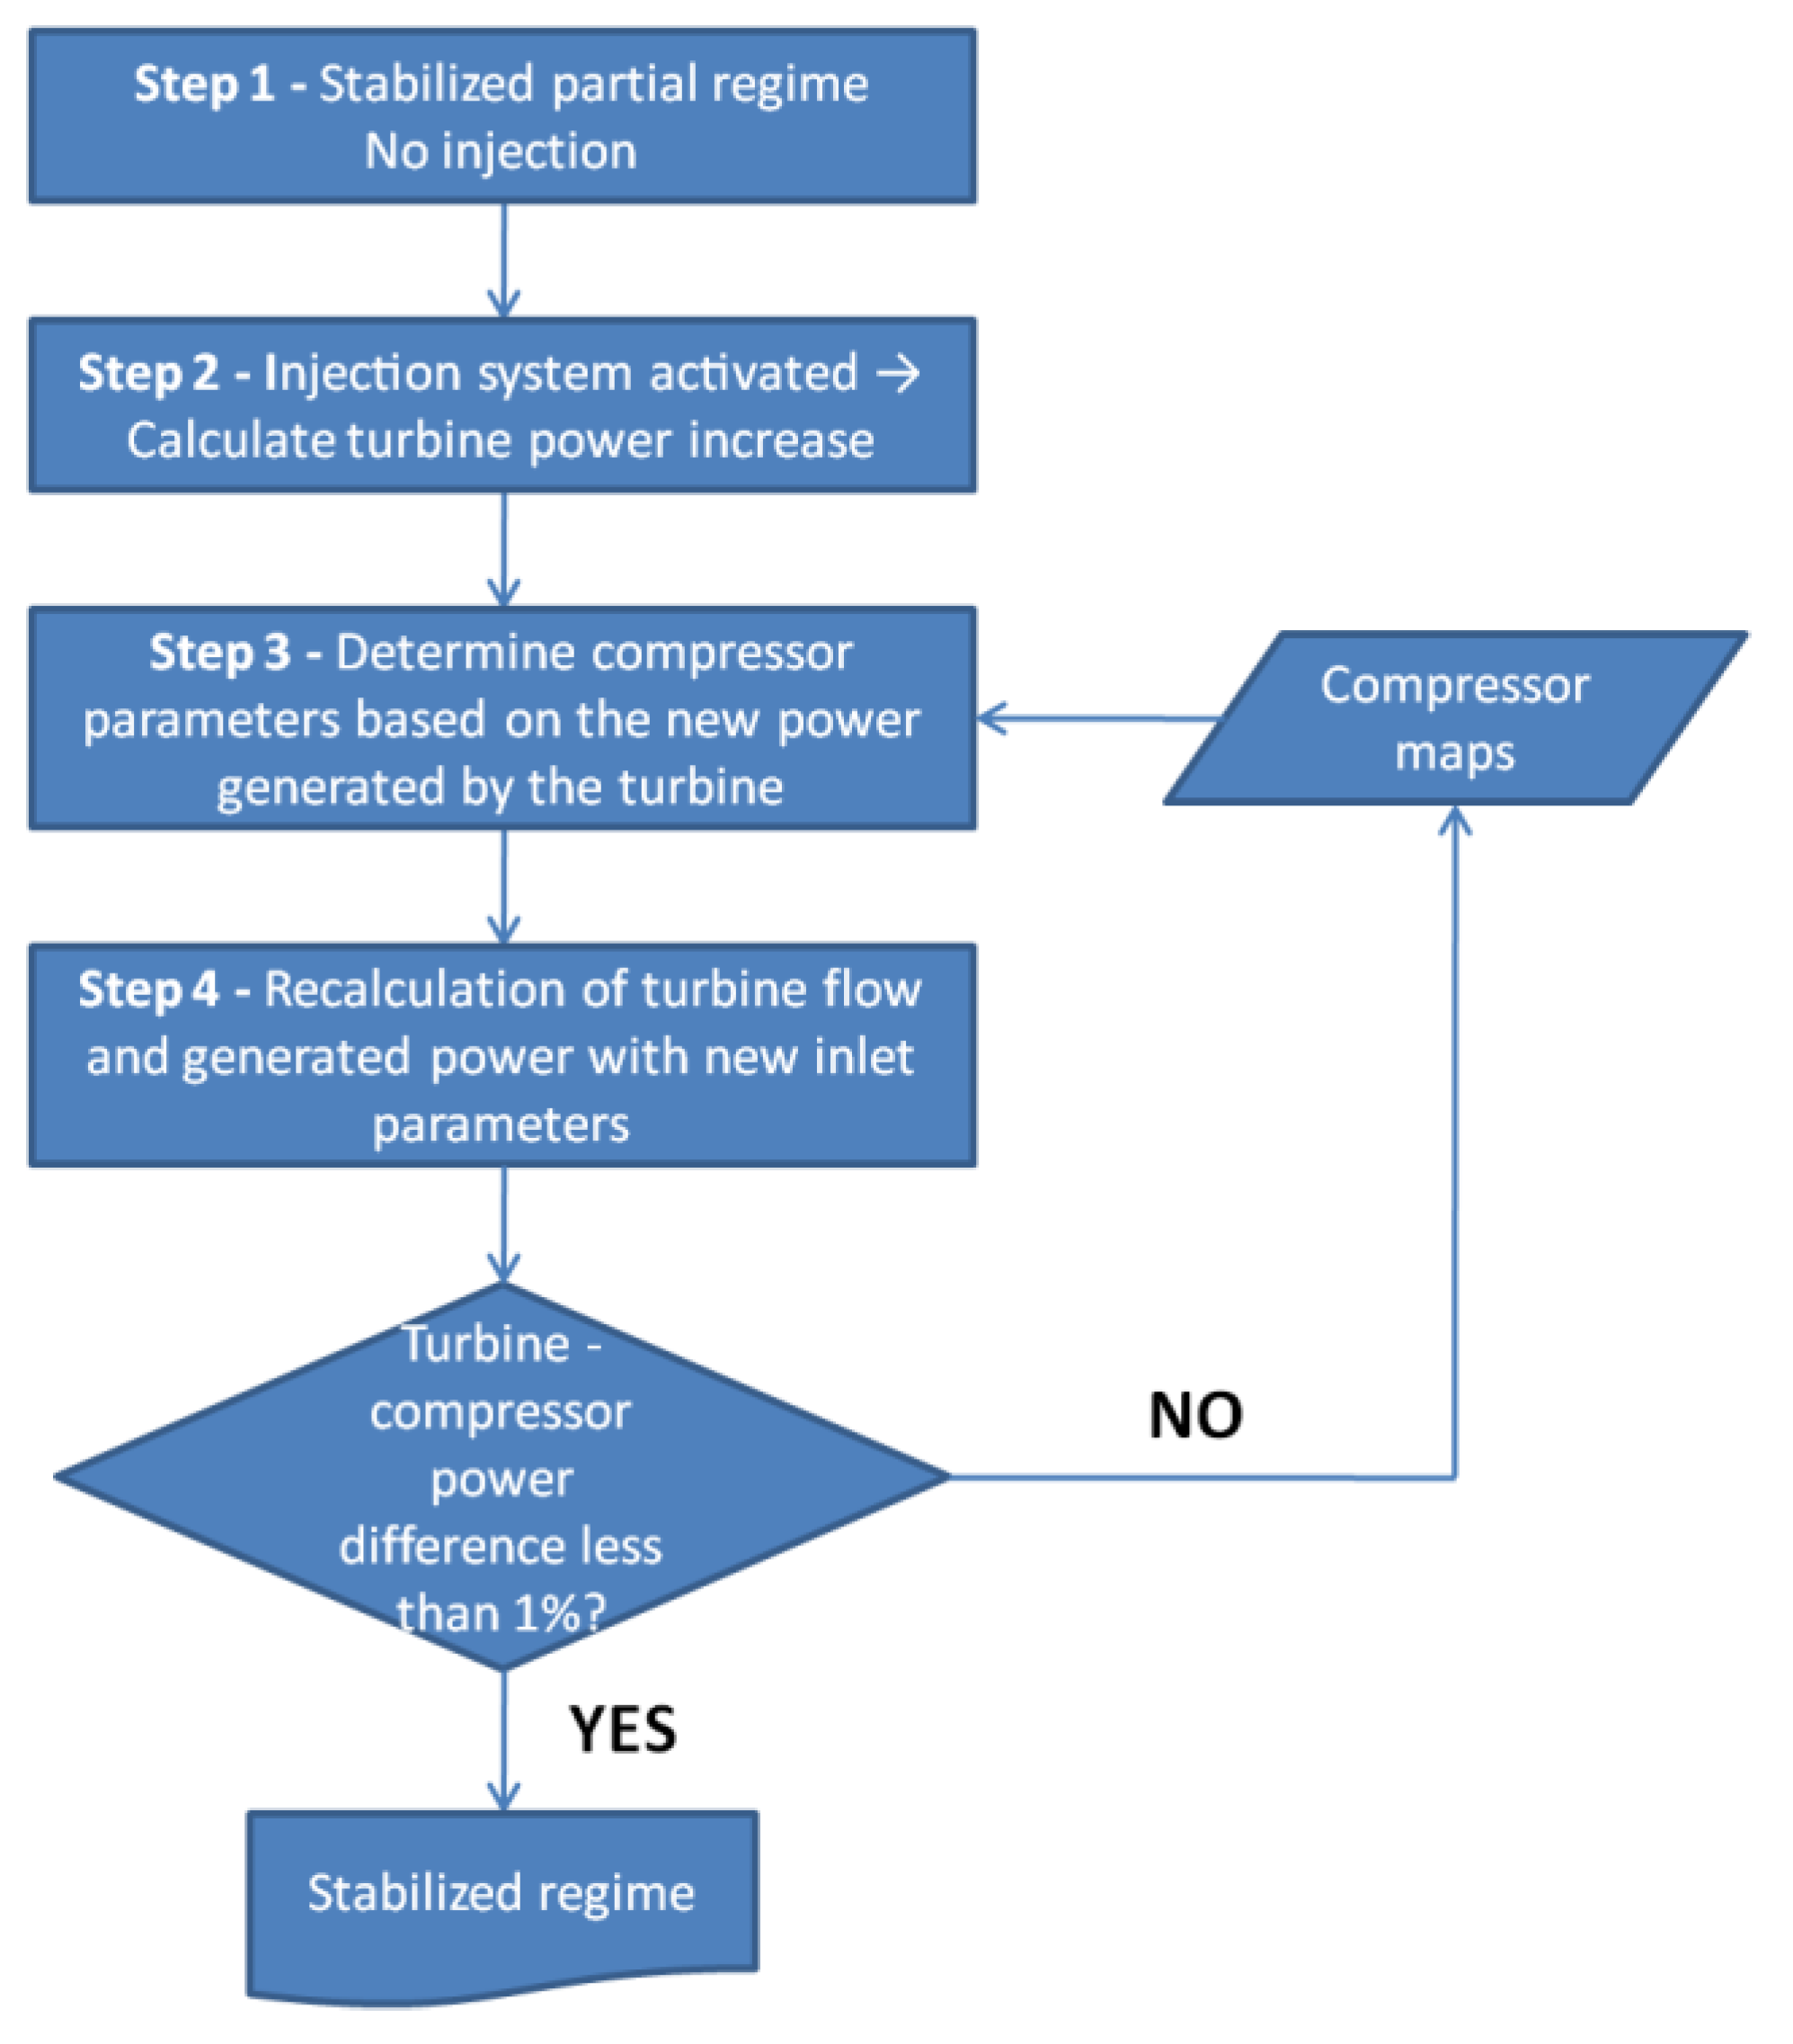
The use of fluid injection in the axial turbine leads to an increase in power generated by the rotor; thus, a surplus of power is created leading to an acceleration of the engine rotor. Even though indications of the resulting regimes were given in Table 5 and Figure 8, the resulting stabilized regime will be different; with the increase in speed, the parameters generated by the compressor will change, leading to a change in turbine-inlet conditions. In order to determine what is the engine response to the injection process, an analysis is conducted using compressor maps and successive numerical simulations of the turbine flow. The goal of this analysis is to determine the stabilized regime after the injection process and then to determine the necessary reduction in fuel mass flow in order to achieve the initial regime. For this purpose, a logical process scheme has been created, Figure 9.
If a stabilized engine operation at a partial load is considered, then, by using the components maps (like compressor, combustion chamber, and turbine) and using the engine operating line, the turbine-inlet parameters can be determined. At this point, the injection system is activated; thus, a certain air mass flow is extracted from the compressor outlet and injected into the turbine vanes at specific sections. The air extraction leads to an increase in turbine-inlet temperature, as the mixture ratio in the combustion chamber is slightly changed. With these new inlet parameters, the flow through the turbine and respective turbine performance can be calculated through numerical simulations, as was described before. The turbine power increase, created by the specific injection, leads to an imbalance in compressor-turbine power. Thus, the rotational speed of the engine is increased. With the new power generated by the turbine and using compressor maps, a new compressor working point is identified, and a new turbine-inlet temperature is computed. With the new parameters, the flow and performance of the turbine are recalculated using numerical simulations. The process continues iteratively until the difference between the power generated by the turbine and the power consumed by the compressor is less than 1%, as, at this point, the engine regime is considered, for the purpose of this study, stabilized. For this analysis, the mechanical losses of the engine are not considered. Throughout the process, the fuel flow is kept constant and the turbine-inlet temperature varies only as a response to compressor-outlet parameters variation.
For this analysis, the partial load of the engine is the regime “partial 2” described before. At this regime, without the use of injection, the engine regime is considered stabilized with the power generated by the turbine equal to the power consumed by the compressor. The engine parameters for this regime are presented in Table 6.
For the next step of the analysis, the injection system is activated. A certain mass flow is extracted from the compressor and injected into the turbine vanes. The extraction is considered at the compressor outlet. Thus, the power consumed by the compressor is constant. The fluid extraction leads to a reduced air mass flow in the combustion chamber and, with a constant fuel flow, leads to a higher turbine-inlet temperature. The temperature was computed using the decreased air mass flow in the chamber and the constant fuel flow. The engine parameters for this step are presented in Table 7.
The power imbalance leads to an acceleration of the engine. The fuel flow is considered constant and, by using the compressor maps, the turbine-inlet parameters are computed. The compressor’s new working point is determined, as a first iteration, based on the turbine power after injection and the engine working line. With the compressor-outlet parameters and constant fuel flow, the turbine-inlet temperature is computed. This completes Step 3 in the presented logical scheme. With these parameters, the flow through the turbine is recalculated, and the engine parameters for this regime are presented in Table 8.
As the power generated by the turbine is still higher than the power consumed by the compressor, the engine will accelerate leading to a higher regime. A second iteration is computed as was described before. The engine parameters for the new regime are presented in Table 9.
With the power imbalance less than 1%, it is considered that the engine has reached a stabilized regime. Starting with a stabilized regime of 74%, after the injection system is activated, the engine stabilizes at a regime of 79% without an increase in fuel flow. Even though a higher rotational speed has been achieved, the gains in generated thrust are marginal, as the turbine extracted more energy from the hot gases leading to a lower available energy for the nozzle.
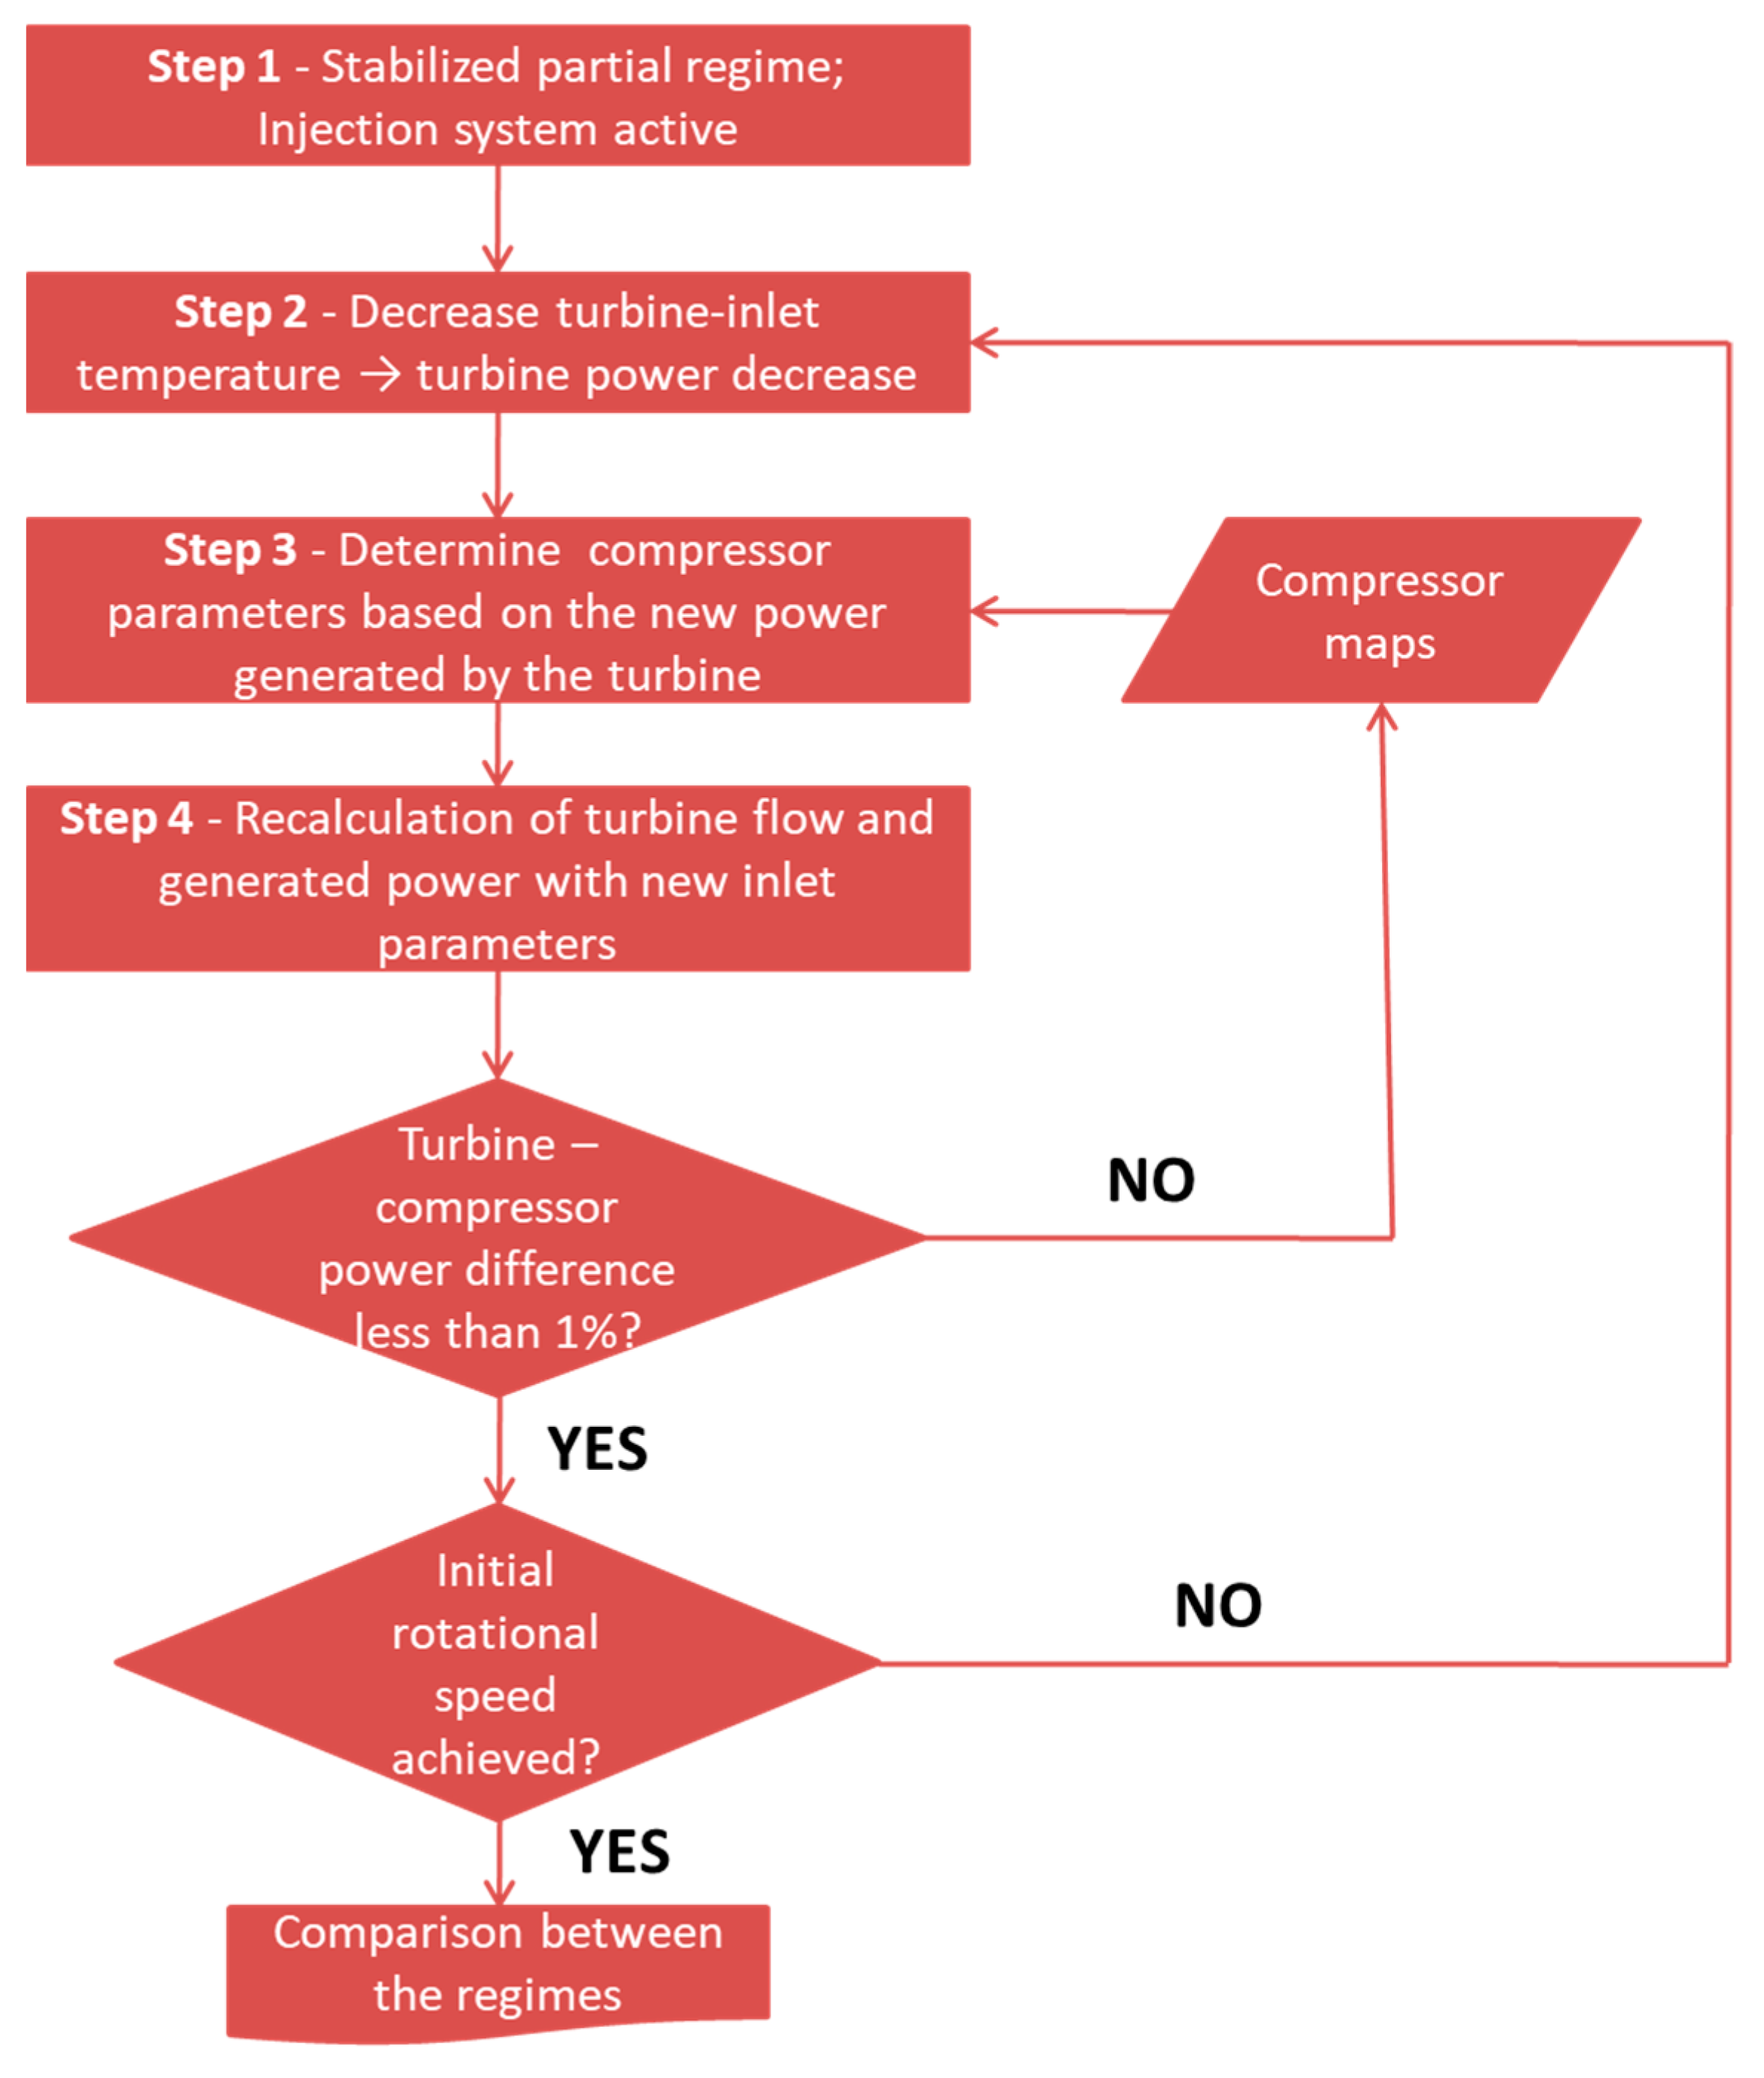
Furthermore, a logical process scheme (Figure 10) has been developed in order to achieve the initial regime in terms of rotational speed but with the injection system still active. The process simulates a response of the pilot or engine automatic control system, as the fuel flow is decreased, to the disturbances caused by the injection process. The logic starts at the stabilized partial regime determined before, and the turbine-inlet temperature is decreased in order to lower the rotational speed. The flow through the turbine is computed by numerical simulations, and the compressor working point is determined using the new power generated by the turbine. With the new compressor-outlet parameters, the turbine-inlet temperature is recomputed, as well as the turbine performance. The process continues iteratively until the difference between the turbine and compressor powers is less than 1%. If this is achieved, the process continues and verifies if the initial rotational speed has been achieved, the speed before the injection process. The verification is considered true if the speed difference is less than 400 rpm (0.5% of nominal speed). If the condition is not fulfilled, the fuel flow is decreased, meaning that a lower turbine-inlet temperature will be considered.
Starting with the stabilized regime achieved after the injection, parameters presented in Table 9 the turbine-inlet temperature was decreased in order to achieve the initial rotational speed, starting with a decrease of 20 degrees. For this temperature decrease, a corresponding fuel-flow value is also computed. With the new temperature value, the turbine performance was recalculated, as well as the flow through the turbine, with the results presented in Table 10.
The resulting power value indicates an engine regime of 76%. Thus, the performance was recalculated using the compressor-outlet parameters for this regime, as well as the new turbine-inlet temperature using the fuel flow determined before. The resulting performance is presented in Table 11.
With the turbine power lower than the compressor’s consumed power for this regime, the logical scheme will continue with a second iteration. Thus, a lower regime is considered, and the turbine parameters are recalculated with the new inlet parameters. The results of the new numerical simulation are presented in Table 12.
With a difference of less than 1% between the compressor and turbine powers, it is considered that the engine has reached a stabilized regime. However, the initial rotational speed, 59,200 rpm, has not been achieved. Thus, the logical process will continue with a new decrease in fuel flow. Starting from the regime described in Table 12, the turbine-inlet temperature is decreased forward and the fuel flow is recomputed based on the new value of the temperature. The results of the second temperature decrease are presented in Table 13.
After the second temperature decrease, a power imbalance has been created leading to a deceleration of the engine. Thus, the turbine performance was recomputed using a lower rotational speed. The results of this iteration are presented in Table 14. After the second iteration, the engine regime is considered stabilized, and the initial speed has been achieved, completing the logical process.
By comparing the regime before injection and the same regime after injection, and the reduction of turbine-inlet temperature, a fuel savings of approximately 5% was identified, without a noticeable variation of engine thrust. Thus, better specific fuel consumption was achieved. Even though the industrial application of the injection system to micro-gas-turbine engines is not feasible, as the performance improvements might not justify the increase in cost and complexity, the present study showed that the injection system introduced in previous works can be applied to other turbines of different sizes and is not limited to the reference turbine used previously. The power has increased after the injection by as much as 21%. The analysis of injection across different partial regimes also showed, as was concluded in [3], that the injection system has greater influence at higher power settings. The influence of the system at different partial regimes is dependent not only on the configuration of the injection system but also on the power consumer and its characteristics.
If in previous studies the injection method was applied to a power turbine, with the benefits clearly anticipated, an increase in generated power after injection leads to more power to the consumer or a lower gas-generator regime, which translates into lower fuel consumption for the same power, the use of the injection system for a gas-generator turbine introduces additional challenges. The additional power obtained after injection determines a lower turbine-outlet temperature, as the turbine extracts more energy from the hot gases, which leads to a lower energy state of the gases at the inlet of downstream elements like other turbines or nozzles. Thus, the use of an injection system at different regimes should take into consideration the regimes of the downstream elements and the required performance of the engine.
Future work should concentrate on optimizing the injection system by using multiple injection sections and unsteady injections. The use of multiple injection sections could decrease the manufacturing complexity by increasing the distances between the injection orifices without sacrificing the performance of the system. Unsteady injection could prove to be a method for reducing the injection mass flow and also increasing the overall interval of the regimes where the injection system could prove efficient. As was demonstrated by many authors, unsteady injection with a high frequency proved efficient in reducing the separation bubble, with similar results as the steady injection but using a lower mass flow. Similar results could be achieved in the case of the performance-enhancement system by specific fluid injection, with the low-pressure zone being controlled by high-frequency injections rather than a steady process. Another topic of research for the injection system is the interaction between other systems, like cooling systems, and the integration in a modern high-temperature, high-load turbine.

4. Conclusions

The paper has demonstrated that the injection system proposed could be applied to other turbines of different sizes with similar results. The main effect of the injection process is the deviation of the working fluid away from the walls of the vane in the vicinity of the injection sections. By positioning these orifices on the suction side of the vane, slightly upstream of the minimal section of the channels, the resulting low-pressure zone acts as a barrier that decreases the flow section, leading to an acceleration of the working fluid. The resulting higher discharge velocities increase the momentum on the rotor blades, resulting in higher generated powers. The system was found to be applicable to a range of partial loads and not limited to a single regime. Similar to a previous study, the system has a greater impact on higher regimes, reaching as much as a 21% power increase after the injection.
The paper has also discussed the influence of the injection system at the engine-assembly level by determining the response of the engine elements to the use of injection. The increased power resulting from the injection process leads to an acceleration of the engine rotor and, thus, a new working point for the compressor. For the case studied in this paper, the power balance was achieved at a regime of 79% starting from a regime of 74% before injection. A similar analysis was conducted by reducing the fuel flow in order to achieve the initial regime, resulting in a 5% fuel saving.

Author Contributions

Conceptualization, R.N.; methodology, R.N.; formal analysis, R.N.; investigation, R.N.; resources, R.N.; data curation, R.N.; writing—original draft preparation, R.N.; writing—review and editing, D.C. and V.V.; supervision, D.C. All authors have read and agreed to the published version of the manuscript.

Funding

This research was funded by the Romanian Research Innovation and Digitalization Ministry through the NUCLEU program under the National Plan for Research Innovation and Development 2022–2027 grant number PN.23.12.01.01.

Data Availability Statement

Not applicable.

Conflicts of Interest

The authors declare no conflict of interest.

References

  1. Nascimento, M.; de Oliviera Rodrigues, L.; Santos, E.C.D.; Gomes, E.E.B.; Dias, F.L.G.D.; Velásques, E.I.G.; Carrillo, R.A.M. Micro gas turbine engine: A review. In Progress in Gas Turbine Performance; Ernesto, B., Ed.; BoD–Books on Demand: Norderstedt, Germany, 2013; pp. 107–141. [Google Scholar]
  2. Nicoara, R.; Crunteanu, D.; Vilag, V. Numerical Study of Axial Turbines Performance Enhancement Technique by Specific Fluid Injection. UPB Sci. Bull. Ser. D 2022, 83, 69–80. [Google Scholar]
  3. Nicoara, R.; Crunteanu, D.; Vilag, V. Axial Turbine Performance Enhancement by Specific Fluid Injection. Aerospace 2023, 10, 47. [Google Scholar] [CrossRef]
  4. Wang, H.; Tao, Z.; Zhou, Z.; Han, F.; Li, H. Experimental and numerical study of the film cooling performance of the suction side of a turbine blade under the rotating condition. Int. J. Heat Mass Transf. 2019, 136, 436–448. [Google Scholar] [CrossRef]
  5. Zhou, J.; Wang, X.; Li, J. Influences of effusion hole diameter on impingement/effusion cooling performance at turbine blade leading edge. Int. J. Heat Mass Transf. 2019, 134, 1101–1118. [Google Scholar] [CrossRef]
  6. Koval, S. Application and Improvement of Gas Turbine Blades Film Cooling. In Proceedings of the International Conference on Aerospace System Science and Engineering; Jing, Z., Ed.; Springer: Singapore, 2018; pp. 69–91. [Google Scholar]
  7. He, W.; Deng, Q.; Zhou, W.; Gao, T.; Feng, Z. Film cooling and aerodynamic performances of a turbine nozzle guide vane with trenched cooling holes. Appl. Therm. Eng. 2019, 150, 150–163. [Google Scholar] [CrossRef]
  8. Zhao, W.; Chi, Z.; Zang, S. Scaling criteria accuracy for turbine blade film cooling effectiveness at unmatched temperature ratio conditions. Appl. Therm. Eng. 2021, 197, 117363. [Google Scholar] [CrossRef]
  9. Duraisamy, R.; Mahali, P. Enhancing film cooling effectiveness in a gas turbine end-wall with a passive semi cylindrical trench. Therm. Sci. 2019, 23, 2013–2023. [Google Scholar]
  10. Berkache, A.; Rabah, D. Numerical and experimental investigation of turbine blade film cooling. Heat Mass Transf. 2017, 53, 3443–3458. [Google Scholar] [CrossRef]
  11. Sakai, E.; Takahashi, T. Numerical Study on Effects of Density Ratio on Film Cooling Flow Structure and Film Cooling Effectiveness. In Proceedings of the ASME Turbo Expo 2017: Turbomachinery Technical Conference and Exposition, Charlotte, NC, USA, 26–30 June 2017. [Google Scholar]
  12. Wang, Y. Study of Power Minimization of Co-Flow Jet Active Flow Control with Fixed Airfoil Geometry. Master’s Thesis, University of Miami, Coral Gables, FL, USA, 2019. [Google Scholar]
  13. Vigneswaran, C.M.; Kumar, V. Aerodynamic Performance Analysis of Co-Flow Jet Airfoil. Int. J. Aviat. Aeronaut. Aerosp. 2021, 8, 10. [Google Scholar] [CrossRef]
  14. Zhi, H.; Zhu, Z.; Lu, Y.; Deng, S.; Xiao, T. Aerodynamic performance enhancement of co-flow jet airfoil with simple high-lift device. Chin. J. Aeronaut. 2021, 34, 143–155. [Google Scholar] [CrossRef]
  15. McQuilling, M. Experimental Study of Active Separation Flow Control in a Low Pressure Turbine Blade Cascade Model. Master’s Thesis, University of Kentucky, Lexington, KY, USA, 2004. [Google Scholar]
  16. Bernardini, C.; Carnevale, M.; Manna, M.; Martelli, F.; Simoni, D.; Zunino, P. Turbine blade boundary layer separation suppression via synthetic jet: An experimental and numerical study. J. Therm. Sci. 2012, 21, 404–412. [Google Scholar] [CrossRef]
  17. Zhang, X.; Vera-Morales, M.; Hodson, H.; Harvey, N. Separation and Transition Control on an Aft-Loaded Ultra-High-Lift LP Turbine Blade at Low Reynolds Numbers: Low-Speed Investigation. J. Turbomach. Trans. ASME 2006, 128, 517–527. [Google Scholar] [CrossRef]
  18. Herbst, F.; Biester, M.; Fiala, A.; Engel, K.; Seume, J. Validation of RANS-Modelling Approaches for Active Flow Control by Vortex Generating Jets in a Low-Pressure Turbine Cascade. In Proceedings of the 8th International Symposium on Engineering Turbulence Modelling and Measurements—ETMM8, Marseille, France, 9–11 June 2010. [Google Scholar]
  19. Volino, R.; Ibrahim, M. Separation Control on a Very High Lift Low Pressure Turbine Airfoil Using Pulsed Vortex Generator Jets. Appl. Therm. Eng. 2012, 49, 31–40. [Google Scholar] [CrossRef]
  20. Rohr, C.; Yang, Z. A numerical study of active flow control for low pressure turbine blades. In Proceedings of the 4th International Symposium on Jet Propulsion and Power Engineering, Xi’an, China, 10–12 September 2012. [Google Scholar]
  21. Ghaffari, P. Passive Tip-Injection in Shrouded Low Pressure Turbines. Doctoral Dissertation, Technische Universität Wien, Vienna, Austria, 2016. [Google Scholar]
Figure 1. (a) Microturbine vane assembly; (b) Microturbine rotor assembly; (c) Microturbine assembly.
Aerospace 10 00928 g001
Figure 2. (a) Numerical grid for the vane; (b) Numerical grid for the rotor blade.
Aerospace 10 00928 g002
Figure 3. Numerical model of turbine vane with injection system.
Aerospace 10 00928 g003
Figure 4. Injection flow streamlines.
Aerospace 10 00928 g004
Figure 5. (a) Mean radius static pressure distribution before injection; (b) Mean radius static pressure distribution after injection.
Aerospace 10 00928 g005
Figure 6. (a) Mean radius total pressure contour without injection; (b) Mean radius total pressure contour with injection; (c) Downstream section total pressure contour without injection; (d) Downstream section total pressure contour with injection.
Aerospace 10 00928 g006aAerospace 10 00928 g006b
Figure 7. (a) Mean radius velocity distribution before injection; (b) Mean radius velocity distribution after injection.
Aerospace 10 00928 g007
Figure 8. Axial turbine power distribution with and without injection.
Aerospace 10 00928 g008
Figure 9. Logic scheme to identify the stabilized regime after the injection process.
Aerospace 10 00928 g009
Figure 10. Logic scheme to identify the initial regime with the injection system active.
Aerospace 10 00928 g010
Table 1. Microturbine main parameters.
ParameterMeasurement UnitValue
Vane-shroud radiusmm47.5
Rotor-shroud radiusmm47.5
Vane maximum heightmm15.35
Rotor maximum heightmm17.5
Rotor-tip clearancemm0.25
Number of vanes-16
Number of rotor blades-23
Nominal rotational speedrpm80,000
Nominal mass flowkg/s0.66
Nominal powerkW145
Pressure ratio-2.53
Isentropic efficiency%81
Table 2. Numerical grid analysis results.
ConfigurationNumber of ElementsGenerated Power [kW]Isentropic Efficiency
1735,27946.230.8196
21,394,88845.720.829
32,454,49945.010.832
Table 3. Injection-system parameters for microturbine.
ParameterMeasurement UnitValue
Injection diameter  Ø i n j  mm0.5
Number of orifices-20
Coverage degree%65
Axial distance  Z a  -0.2
Injection mass flow  M ˙ i n j  kg/s   2.5 % M ˙
Injection total temperature  T i n j  K   T i n j = T i n
Table 4. Partial regimes parameters.
Case Regime [%] M ˙   [ k g / s ] P i n   [ b a r ] T i n   [ K ] Speed [rpm]Power [KW]
Partial 170%0.3552.2580056,00035.2
Partial 274%0.392.4782059,20045.7
Partial 376%0.4072.5983460,80050.4
Partial 479%0.4252.7185062,40058.4
Partial 581%0.4432.8486664,00065.4
Nominal100%0.664.81117380,000145.4
Table 5. Partial regimes analysis results.
NameRegime [%]Power without
Injection [kW]
Power after
Injection [kW]
Power
Increase [%]
Equivalent
Regime [%]
Partial 17035.239.311.772
Partial 27445.754.218.577
Partial 37650.46121.180
Partial 4 *7958.466.313.681
Partial 5 *8165.470.67.983
* a 2.5% injection mass flow could not be achieved.
Table 6. Engine parameters for the stabilized regime before injection.
CaseRegime [%]Speed [rpm] P 3 [ b a r ] T 3 [ K ] M 3 ˙ [ k g / s ] T 2 [ K ] P i n j [ b a r ] T i n j [ K ] Power   Difference   ( W T W C ) [KW]
Partial 2 before injection74%59,2002.478200.39395N/AN/A0 (0%)
Table 7. Engine parameters after injection.
CaseRegime [%]Speed [rpm] P 3 [ b a r ] T 3 [ K ] M 3 ˙ [ k g / s ] T 2 [ K ] P i n j [ b a r ] T i n j [ K ] Power   Difference   ( W T W C ) [KW]
Partial 2 after injection74%59,2002.478310.393951.7139510.2 (22.3%)
Table 8. Engine parameters after acceleration determined by injection.
CaseRegime [%]Speed [rpm] P 3 [ b a r ] T 3 [ K ] M 3 ˙ [ k g / s ] T 2 [ K ] P i n j [ b a r ] T i n j [ K ] Power   Difference   ( W T W C ) [KW]
New regime after acceleration78%62,4002.748050.434071.914071.8 (3.1%)
Table 9. Engine parameters after acceleration determined by injection, second iteration.
CaseRegime [%]Speed [rpm] P 3 [ b a r ] T 3 [ K ] M 3 ˙ [ k g / s ] T 2 [ K ] P i n j [ b a r ] T i n j [ K ] Power   Difference   ( W T W C ) [KW]
New regime after acceleration second iteration79%63,2002.807920.444101.96410−0.3 (0.5%)
Table 10. Engine parameters after turbine-inlet temperature decrease.
CaseRegime [%]Speed [rpm] P 3 [ b a r ] T 3 [ K ] M 3 ˙ [ k g / s ] T 2 [ K ] P i n j [ b a r ] T i n j [ K ] Power   Difference   ( W T W C ) [KW]
Stabilized regime after turbine-inlet temperature decrease79%63,2002.807720.444101.96410−8.2 (13.9%)
Table 11. Engine parameters after deceleration as a result of turbine-inlet temperature decrease.
CaseRegime [%]Speed [rpm] P 3 [ b a r ] T 3 [ K ] M 3 ˙ [ k g / s ] T 2 [ K ] P i n j [ b a r ] T i n j [ K ] Power   Difference   ( W T W C ) [KW]
Regime after turbine-inlet temperature decrease76%60,8002.608030.4124011.82401−1.8 (3.6%)
Table 12. Engine parameters after deceleration, second iteration.
CaseRegime [%]Speed [rpm] P 3 [ b a r ] T 3 [ K ] M 3 ˙ [ k g / s ] T 2 [ K ] P i n j [ b a r ] T i n j [ K ] Power   Difference   ( W T W C ) [KW]
Stabilized regime after turbine-inlet temperature decrease, second iteration75%60,0002.538120.43981.773980.4 (0.8%)
Table 13. Engine parameters after deceleration, second turbine-inlet temperature decrease.
CaseRegime [%]Speed [rpm] P 3 [ b a r ] T 3 [ K ] M 3 ˙ [ k g / s ] T 2 [ K ] P i n j [ b a r ] T i n j [ K ] Power   Difference   ( W T W C ) [KW]
Regime after second turbine-inlet temperature decrease75%60,0002.538100.43981.77398−1.4 (2.9%)
Table 14. Engine parameters after deceleration, second turbine-inlet temperature decrease, second iteration.
CaseRegime [%]Speed [rpm] P 3 [ b a r ] T 3 [ K ] M 3 ˙ [ k g / s ] T 2 [ K ] P i n j [ b a r ] T i n j [ K ] Power   Difference   ( W T W C )
Stabilized regime after second turbine-inlet temperature decrease, second iteration74%59,2002.478100.393951.71395−0.2 (0.4%)
Disclaimer/Publisher’s Note: The statements, opinions and data contained in all publications are solely those of the individual author(s) and contributor(s) and not of MDPI and/or the editor(s). MDPI and/or the editor(s) disclaim responsibility for any injury to people or property resulting from any ideas, methods, instructions or products referred to in the content.