Article

Experimental Study on Optimum Design of Aircraft Icing Detection Based on Large-Scale Icing Wind Tunnel

Key Laboratory of Icing and Anti/De-Icing, China Aerodynamics Research and Development Center, Mianyang 621050, China
*
Author to whom correspondence should be addressed.
Aerospace 2023, 10(11), 926; https://doi.org/10.3390/aerospace10110926
Submission received: 12 September 2023 / Revised: 12 October 2023 / Accepted: 26 October 2023 / Published: 30 October 2023

Abstract

:
Icing detection is the premise and basis for the operation of aircraft icing protection system, and is the primary issue in flight safety assurance. At present, there is a lack of research methods and design reference for the layout optimization of ice detectors. Therefore, in order to simulate the real icing environment encountered by the aircraft more accurately, a large-scale icing wind tunnel was used to carry out experimental research on the icing characteristics of the sensor probes. A closed-loop experimental method including the typical condition selection, sensor array interference examination and ice shape repeatability verification was initially proposed. A stepwise optimization process and a sensitivity analysis on ambient conditions were combined to determine the optimal distribution for sensor installation. It is found that the water collection coefficient on the cylinder surface of the probe first increases and then decreases along the axial direction, reaching the extreme value at a certain position. The height of this extreme point will gradually increase with the development of the wall boundary layer, showing a variation range of 2~30 mm. Improper design may cause the sensor probe to fail to capture the point with the maximum icing thickness, affecting the sensitivity of icing detection. In addition, each probe position has different sensitivity to changes in flow parameters; the points with larger icing mass and lower sensitivity to changes in attack angle will have better detection effect. The measured data and analysis in the present work can provide a basis for the accurate design of icing sensor probes.

1. Introduction

Flight practice shows that when an aircraft passes through clouds containing supercooled water droplets, ice accretion may occur on the windward surfaces of its key parts (wing, engine or windshield) due to droplet impingement [1,2]. Without effective protection measures, icing will worsen the lift and drag characteristics of the aircraft, reduce its stall angle of attack, stability margin and maneuverability [3,4,5], posing a serious threat to flight safety. Icing detection is the prerequisite and basis for the operation of aircraft icing protection systems, and its effectiveness and accuracy are crucial. Ice sensors are generally installed in the areas of aircraft that are prone to icing to determine the severity of the icing environment, and provide information such as icing thickness, icing rate and alarm intensity. High-performance ice sensors can also quantitatively determine the severity of ice accretion, and reduce the possibility of aircraft crashes under icing conditions in conjunction with onboard anti-icing and de-icing devices.
Due to the dynamic characteristics of the aircraft icing process and the extremely complex internal structure of the ice layer, current detection technologies generally have problems such as poor real-time detection reliability, poor installation position, and low real-time quantitative identification accuracy of icing intensity and thickness [6,7]. There are some reports that the pilots have visually detected the occurrence of icing, but the ice sensor did not alarm. The low reliability of the current sensors poses significant potential risks for the flights in icing conditions [8].
Improving the working performance of icing sensors can be achieved through two aspects: (a) improving the detection accuracy of the internal system of the sensor; (b) optimizing the design height and installation position of sensor probes to improve their ability to capture aircraft icing. For aircraft with different shapes, the surface airflow distribution, water droplet impingement, and other flow field characteristics are diverse, so the sensitivity of different regions to ice accretion will inevitably vary. Besides, due to the gradual development of the wall boundary layer along the flow direction, the height requirements of probes at different locations will change. In terms of the above phenomena and issues, only part of the numerical simulation exploration work [9,10] has been carried out, and there is a lack of measured data in the real icing environment. Some laws and characteristics related to the motion and impact of water droplets and the effect of the surface boundary layer still need to be experimentally verified [11,12]. Therefore, based on the fundamental theories of aerodynamics and the icing wind tunnel test methods, a specific aircraft nose shape was selected firstly and an experimental study on the optimum design of aircraft icing detection has been conducted in the CARDC icing wind tunnel, which is equipped with a 3 m × 2 m test section. Through the real-time images, measured icing shapes and ice accretion mass, the detailed characteristics and influencing laws of the icing process on the nose surface probe were intuitively and quantitatively revealed.
Due to the huge cost of a single test in the large icing wind tunnel, it is hoped to cover as many surface locations as possible in the most economical way during the implementation process. Accordingly, an experimental method that combines precise selection of operating conditions, interference level test of sensor array and repeatability verification of ice shapes is proposed in this paper. Starting from the analysis of overall and local icing characteristics of the nose surface under different operating conditions, the law of freezing process on the probes is revealed to guide the probe height design. At the same time, the icing mass on the surface of the probe is used as a reference standard to determine the quality of the installation position, with the original position of the ice sensor investigated and an optimized layout plan provided. Finally, through the analysis of the influence of inflow parameters, the sensitivity of different probe positions to changes in airflow velocity and flight angle of attack is studied. A relatively complete research method for the icing issue of aircraft nose probes is established in the present work; the measured data and result analysis can be used to guide the precise design of ice sensor probes, providing an important theoretical basis and data support for the development of the aircraft icing detection technology.

2. Experimental Setup

The CARDC icing wind tunnel is a closed reflux subsonic wind tunnel with a test section size of 3 m × 2 m, the outline of which is shown in Figure 1. It is mainly composed of a refrigeration system, an altitude simulation system and a spray system [13,14]. The temperature control range is from −40 °C to room temperature, and the height simulation range is 0 m~2000 m. The spray system uses a nozzle array to generate icing cloud, and its simulation range can cover most conditions of the icing meteorological condition envelope [15] in Appendix C of Part 25 of the Civil Aviation Regulations of China. At present, two types of nozzle are used. The envelope of the CARDC-A nozzle has better coverage in the low water content area of Appendix C, while the envelope of the CARDC-B nozzle has a larger MVD range with the maximum particle size exceeding 300 μm. In 2019, a comprehensive flow field calibration (including the aerodynamic heat flow field and icing cloud) was conducted in the main test section of the wind tunnel, and the calibration results indicated that the flow field quality of the main test section can meet the requirements of SAE ARP5095 [16], and the ice shape curve obtained in the present work has good consistency with the results of the other icing wind tunnel tests (Figure 2).
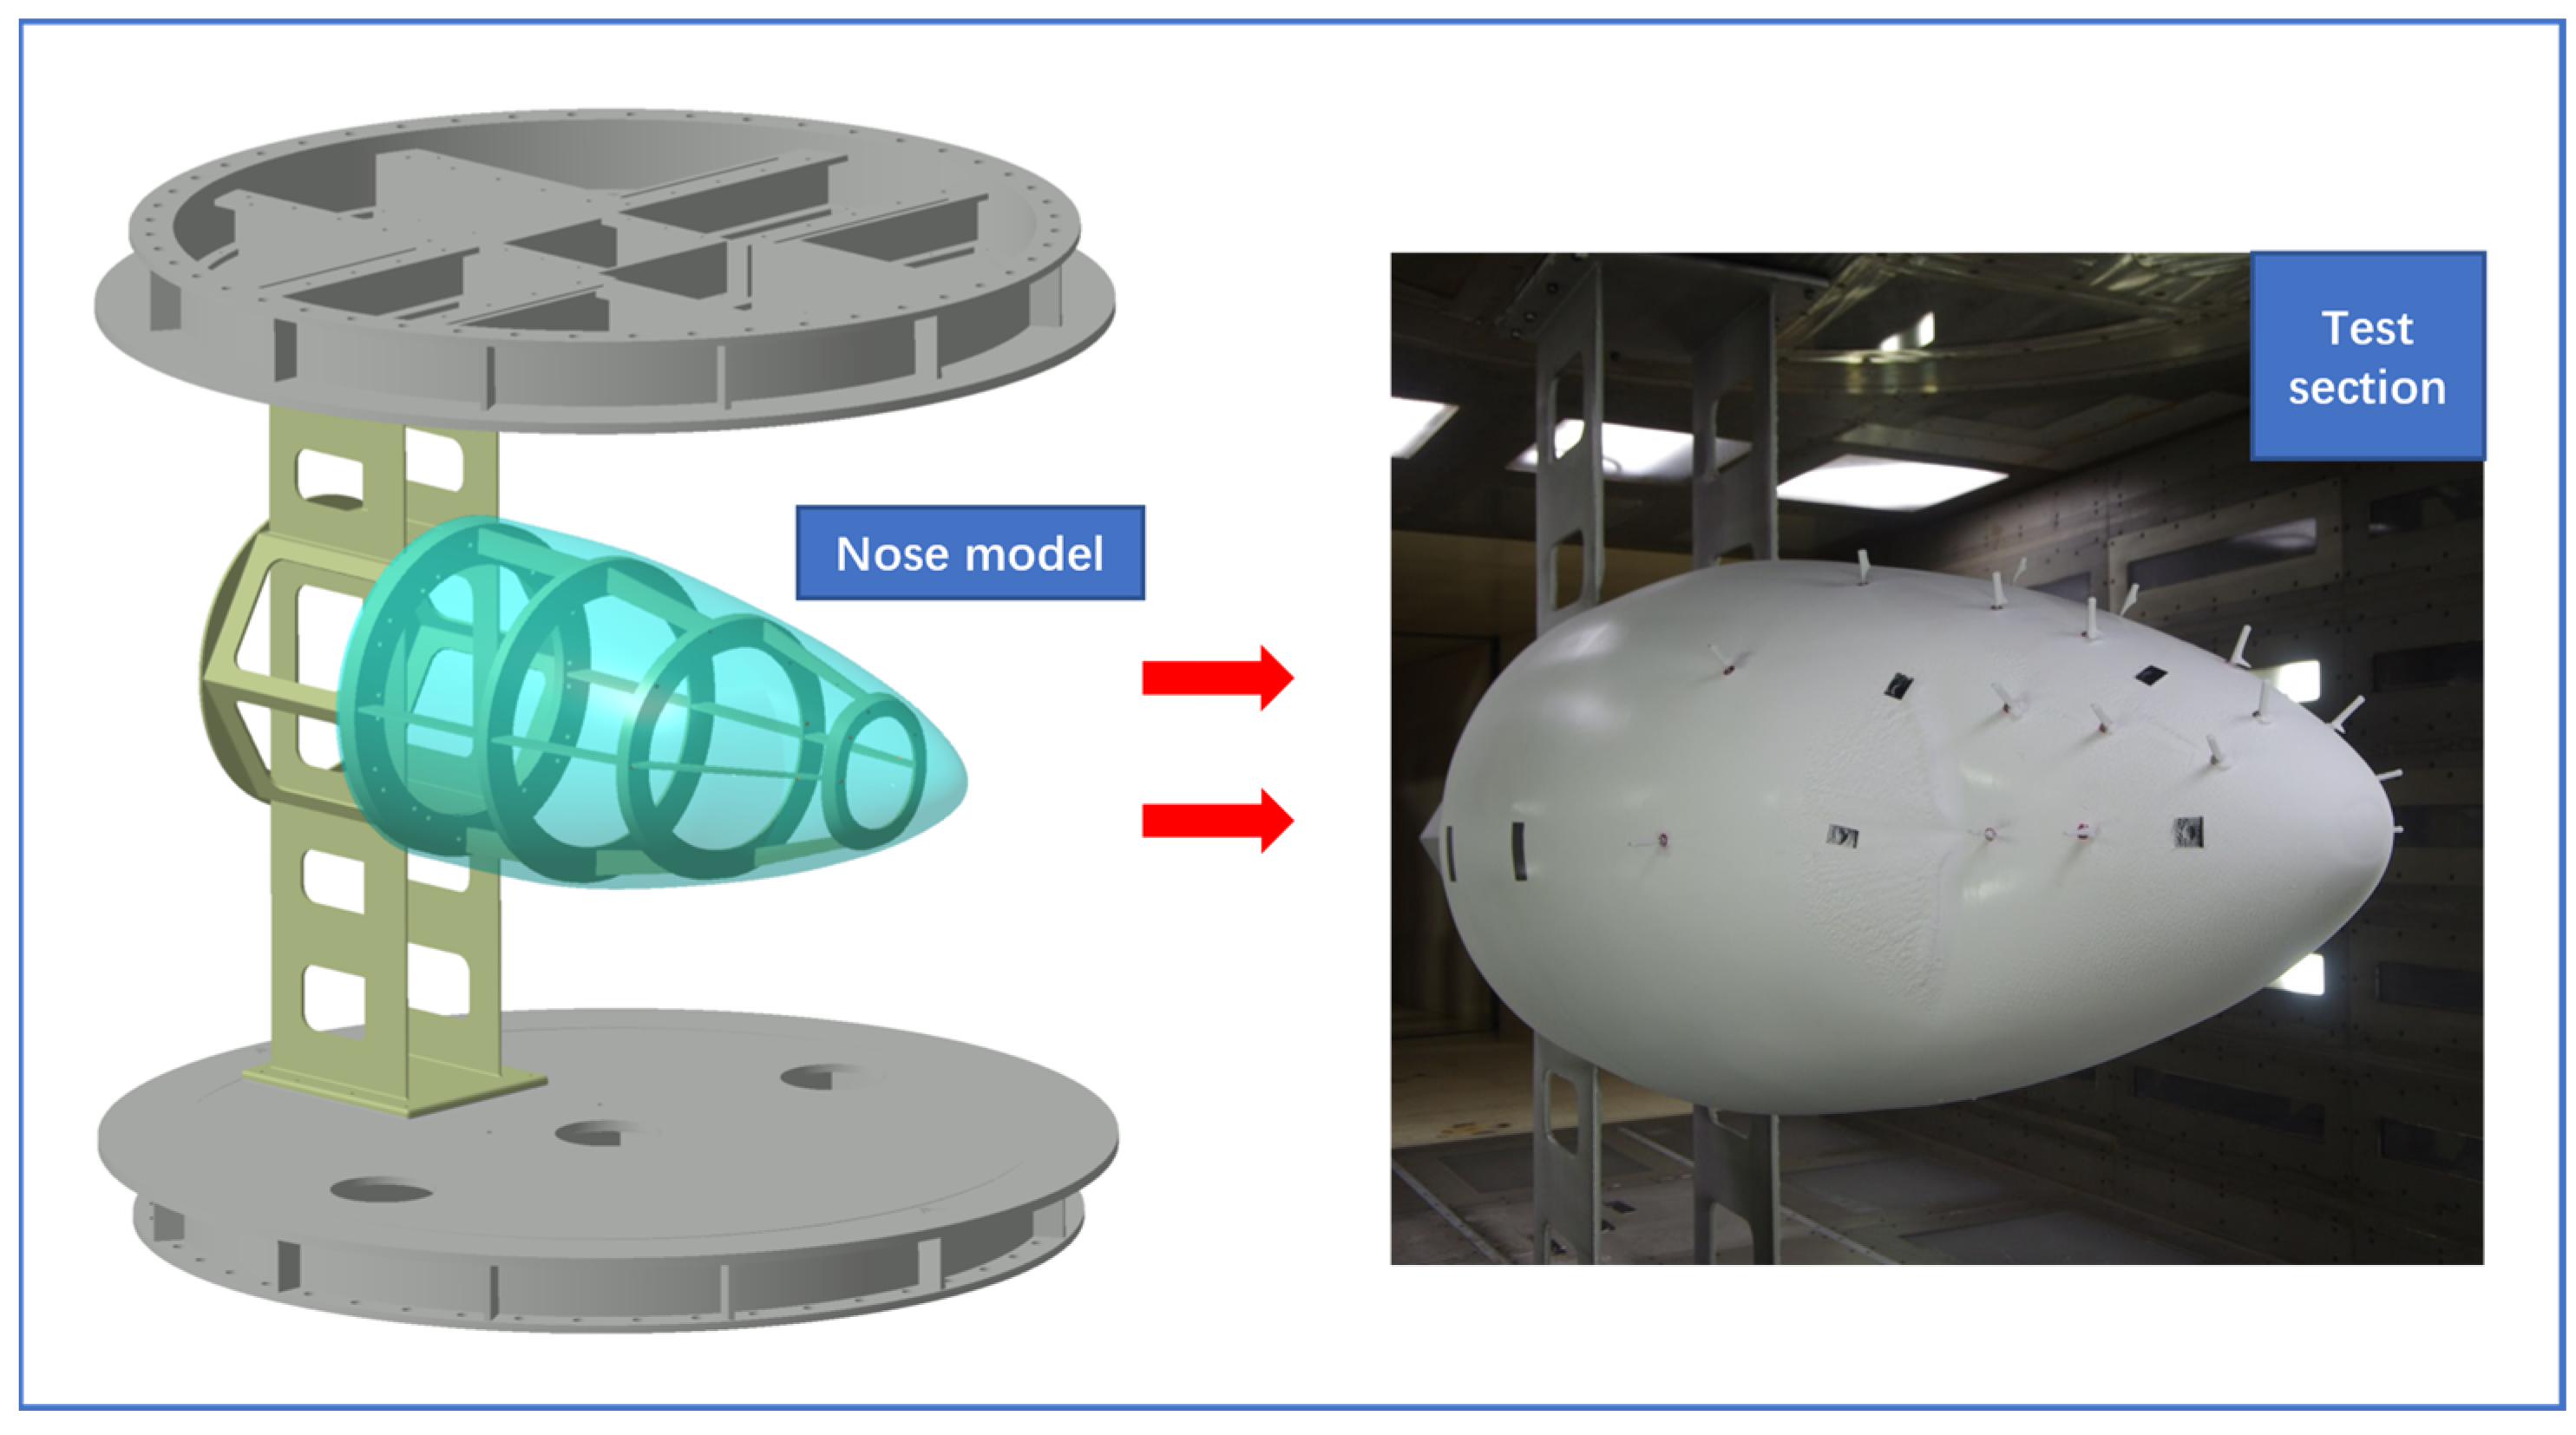
A typical nose shape used by a certain military transport aircraft is selected as the research object, which is a 1/4 scaled down model. The maximum cross-sectional diameter of this model is 0.8 m, and its maximum cross-sectional area is about 0.5 m2, giving a blocking ratio of 8.3% relative to the experimental section. The nose model is vertically installed between the upper and lower turntables of the test section through a bracket, and the change in attack angle of the model is achieved by the rotation of the turntable. This installation form is shown in Figure 3.
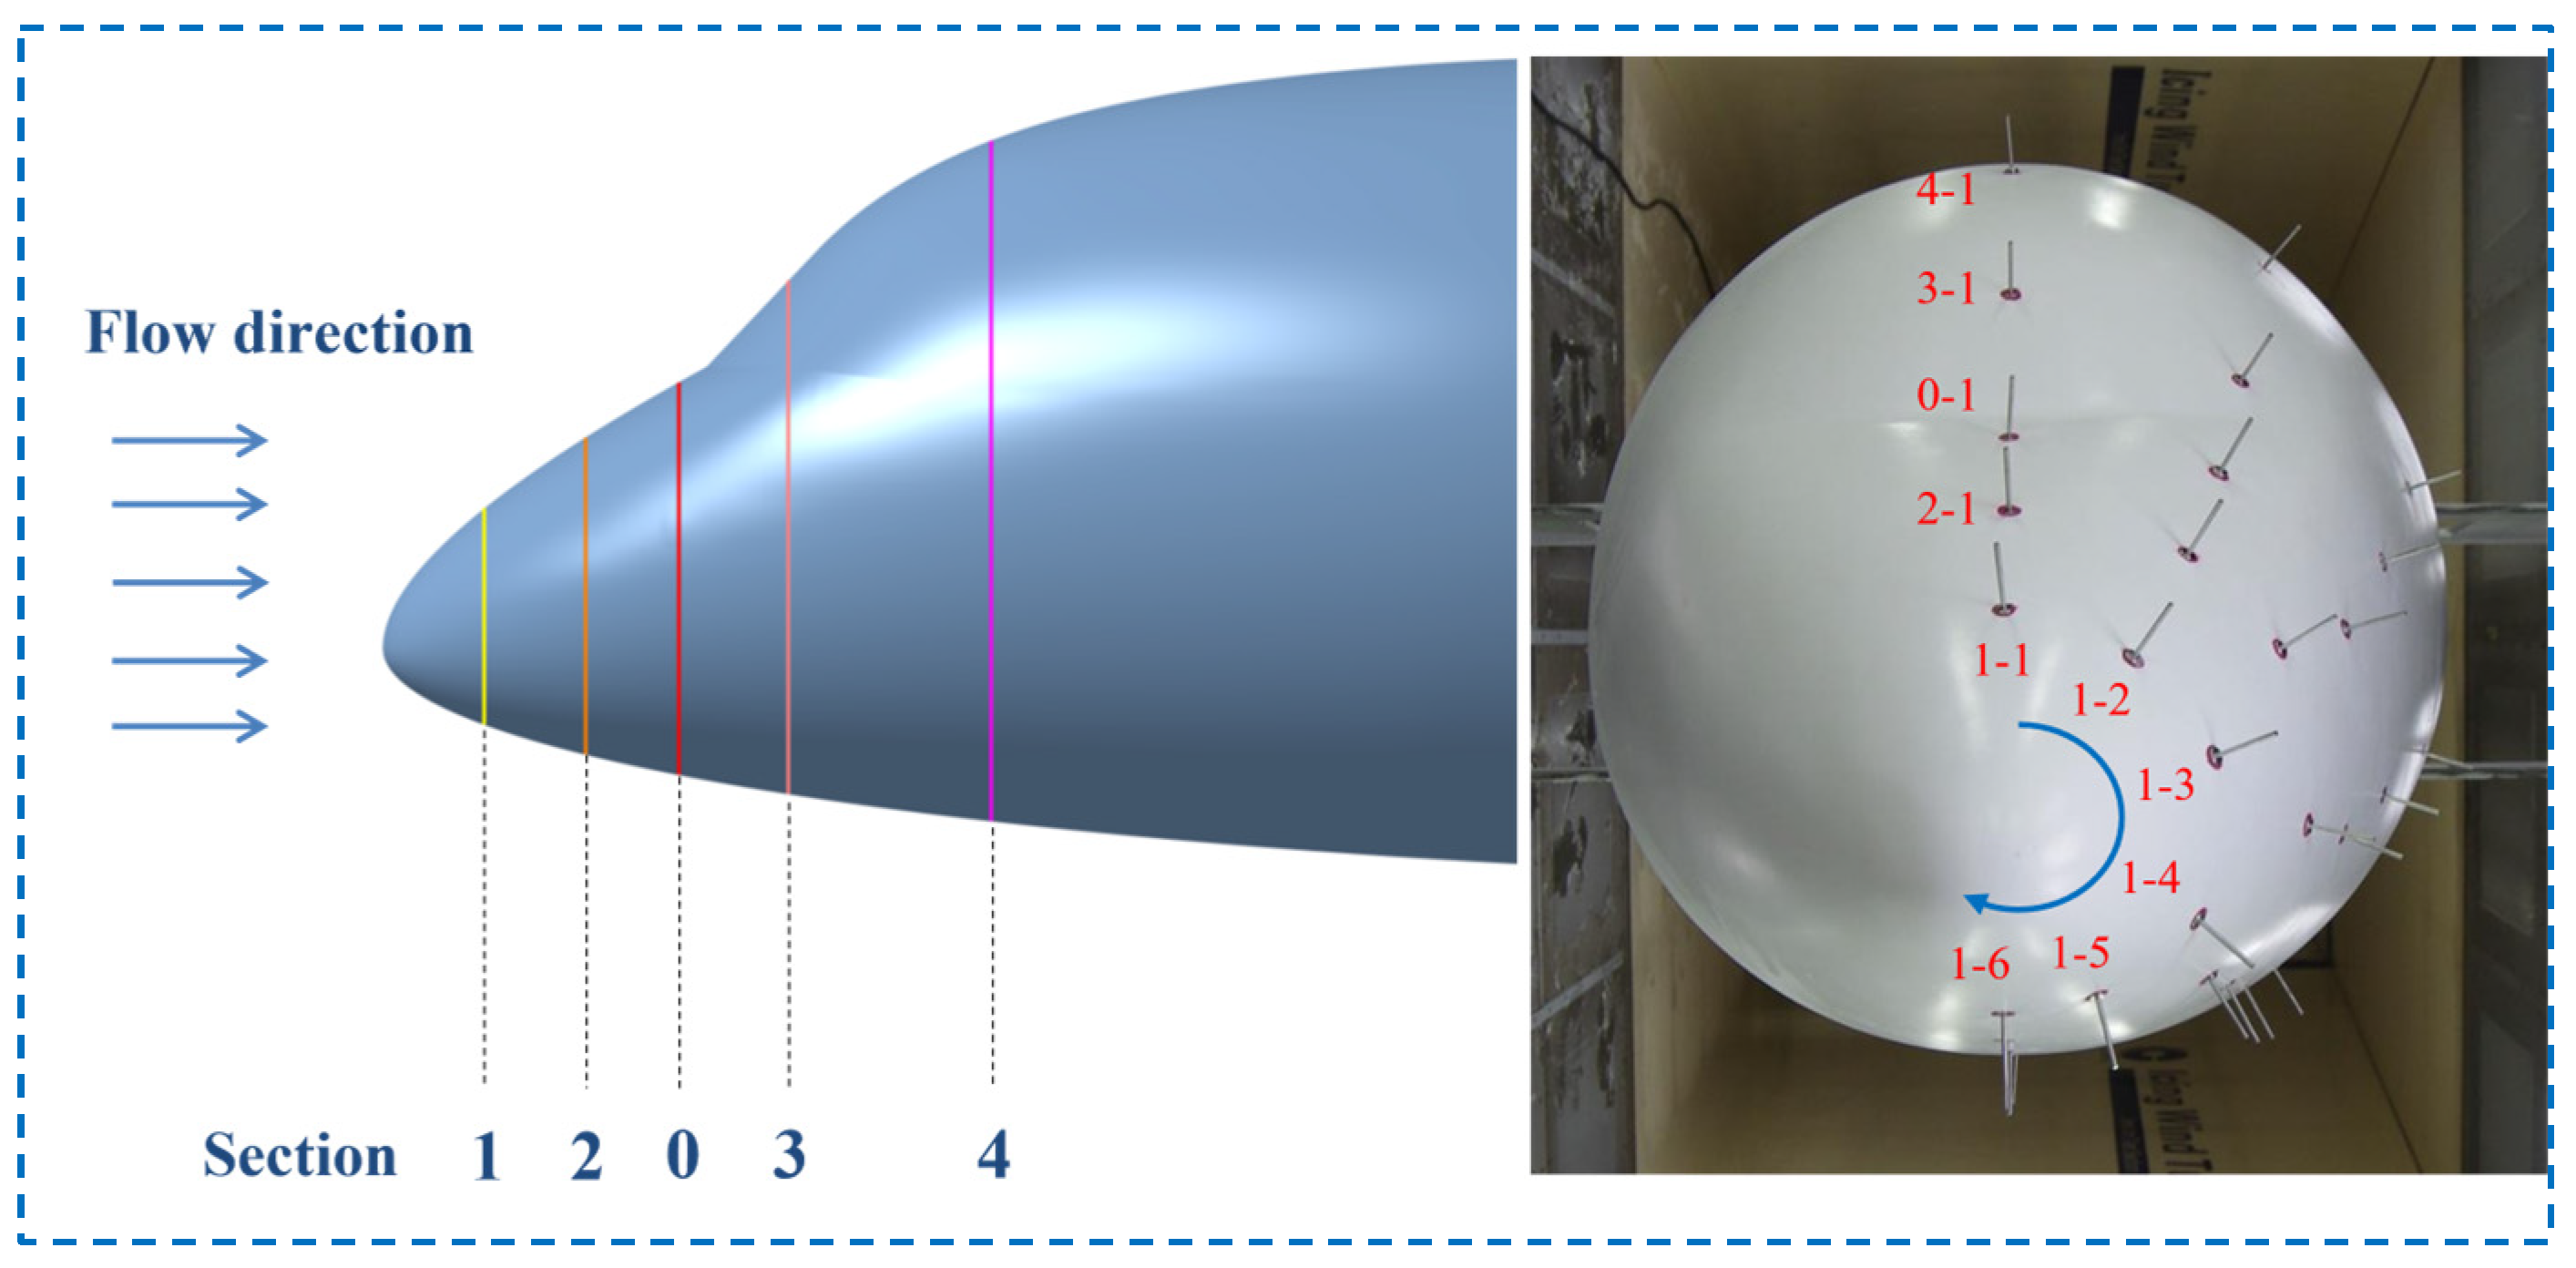
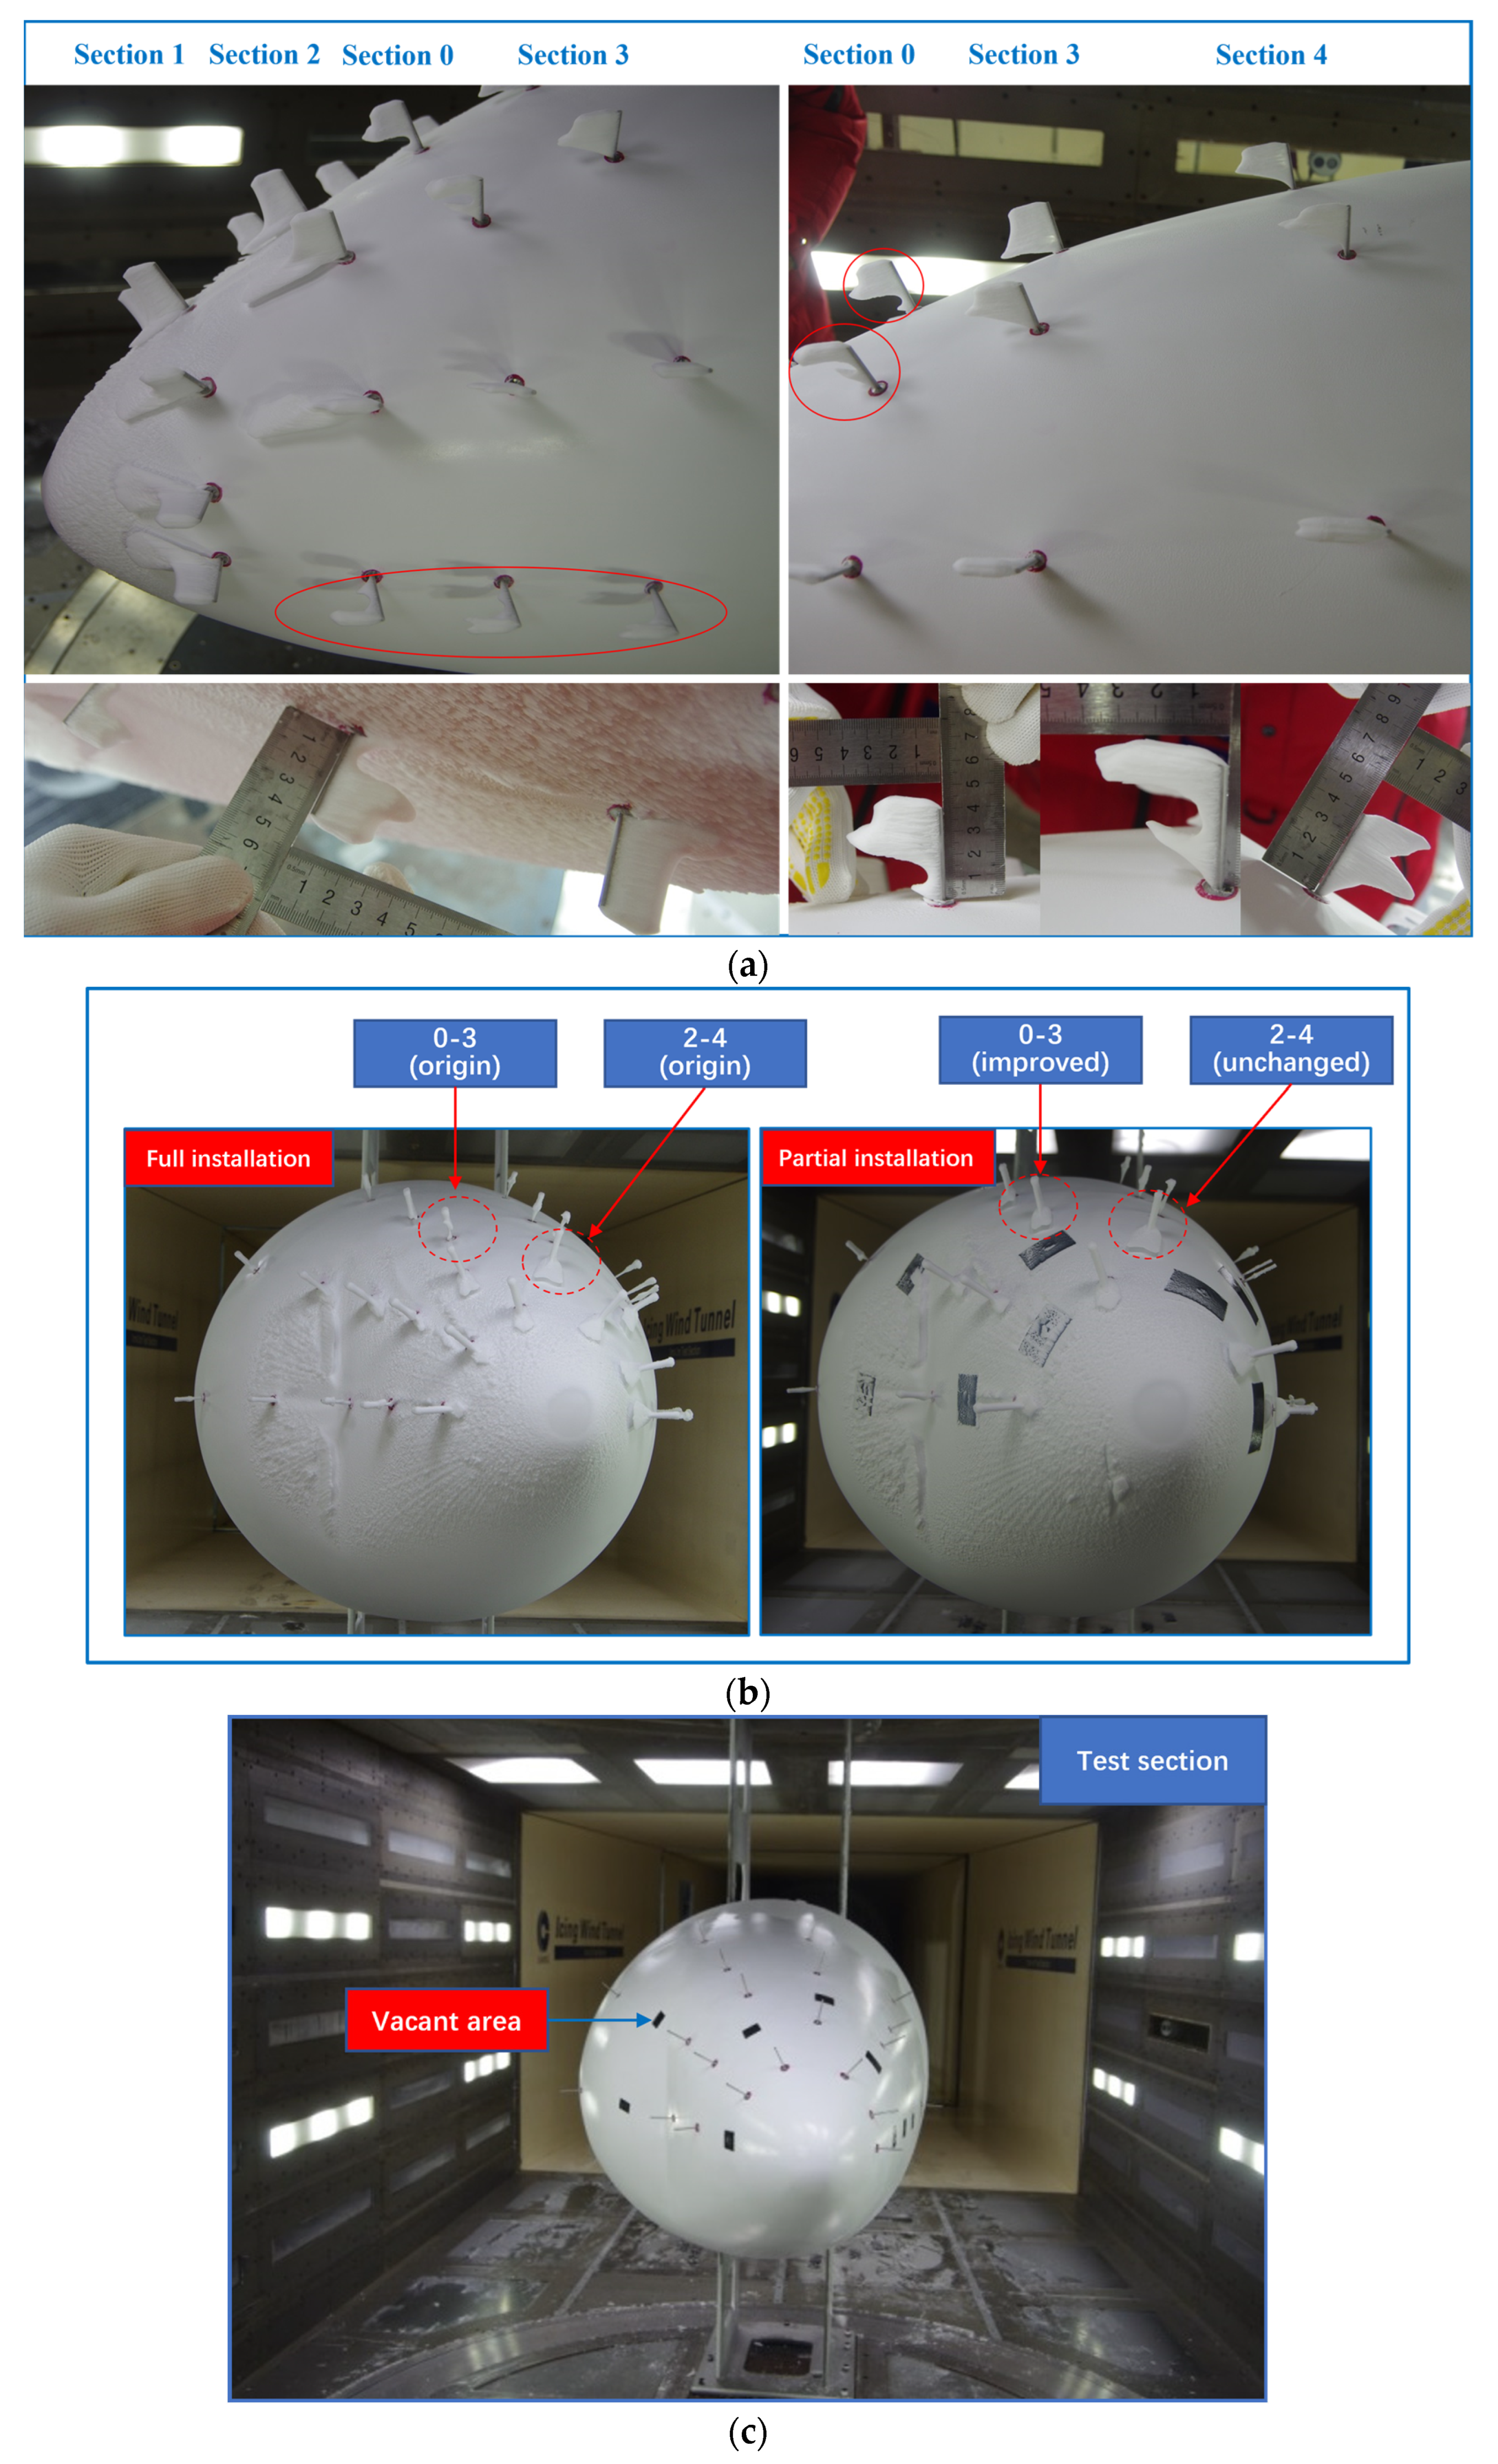
The cost of a single icing test in a large wind tunnel is high and the total number of tests is limited. In order to comprehensively study the icing characteristics at different positions on the nose surface, multiple installation holes have been reserved in the design, hoping to cover as many icing areas as possible with the most economical tests. Accordingly, based on the profile of the nose and the aerodynamic characteristics determined by it, five research sections are set along the curvature transition of the nose surface (as shown in Figure 4), with Section 0 being the location where the sensor was originally installed. Due to the symmetry of this nose shape, six installation holes are evenly arranged on the right half of each section, numbered 1–6 from top to bottom in a clockwise direction along the incoming flow. The height of the sensor probes is 40 mm, with the diameter of 3 mm. Besides, in order to avoid mutual interference between the probes, parts of the surface area are vacated based on the aerodynamic analysis and actual measurement results, and the sensor array form is finally determined as shown in Figure 5c.

3. Test Methods

3.1. Selection of Operating Conditions

After the preliminary preparation for the experiment is completed, the aim is to conduct two aspects of research: (a) the icing characteristics of the aircraft nose and sensor probe surface under different operating conditions; (b) the influence of changes in incoming flow parameters on the sensitivity of probes at different positions. Accordingly, the selected environmental simulation conditions are shown in Table 1, with the five variables of ambient static temperature, velocity, angle of attack, droplet diameter (MVD) and icing time mainly considered, and the liquid water content (LWC) is uniformly set to 1 g/m3. The operating conditions were selected by referring to the flight envelope of the military transport aircraft, and the similarity transformation was carried out to ensure similar water droplet collection coefficients on the probe surface. Among the environmental variables under consideration, it is hoped to obtain different types of attached ice (glaze ice and rime ice) through changes in ambient static temperature; the velocity, angle of attack and droplet diameter all have significant effects on the droplet impact distribution on the probe surface at different positions. In addition, the focus of this test study is the local icing characteristics of the probe surface in the rime ice state, while the liquid water content (LWC) as the total amount of impact water has few effects on the water collection distribution along the probe axis. Therefore, it is fixed as a unified value to reduce the test cost and conveniently compare other variables. Three trials for each case listed in Table 1 have been carried out in the present work.

3.2. Interference Testing of Sensor Array

The diameter of the sensor probe is only 3 mm, and its effect on the flow field is relatively small. However, when the surface of the probe begins to accumulate ice, the increased shielding volume may cause significant disturbances to the surrounding flow field. Therefore, in order to reduce mutual interference during the icing process of sensor arrays, multiple exploratory tests under the same condition (Case 8) are conducted firstly to test the degree of interference and determine a reasonable layout plan.
Five consecutive interference level tests are conducted under Case 8, and the freezing time is uniformly set to 300 s. In the first test, all the hole positions are covered with probes, and the probes at the corresponding positions are disassembled gradually in the last four tests. The degree of interference can be evaluated by comparing the results before and after. The icing situation when the sensors are fully installed is shown in Figure 5a, where the red circles give the locations with obvious interference, presenting the appearance of a middle concave ice shape. It can be observed that Section 0 is significantly affected by the occlusion of Section 2. In addition, due to the high parallelism with the streamline direction, there is severe interference at the leftmost and rightmost sensor positions in the model. According to this phenomenon, the corresponding positions are disassembled during the last four testing processes. As shown in Figure 5b, after Position 2-3 is removed, the ice shape at Position 0-3 behind it will return to normal; on the contrary, after Position 1-4 is removed, there will be almost no change in the ice shape and mass at Position 2-4, indicating that Position 1-4 can be retained. Based on this method, Positions 1-1 and 3-1 on the far-left side of the model, Positions 2-3, 2-5, 0-4 in the middle of the model, and Positions 2-6, 0-6, 3-6 on the far-right side of the model can be gradually determined to remain in a blank state. In addition, Position 3-2 that coincide with the windshield area of the nose is also vacated. The final form of the sensor array adopted in this study is shown in Figure 5c.

3.3. Repeatability Verification of Ice Shapes

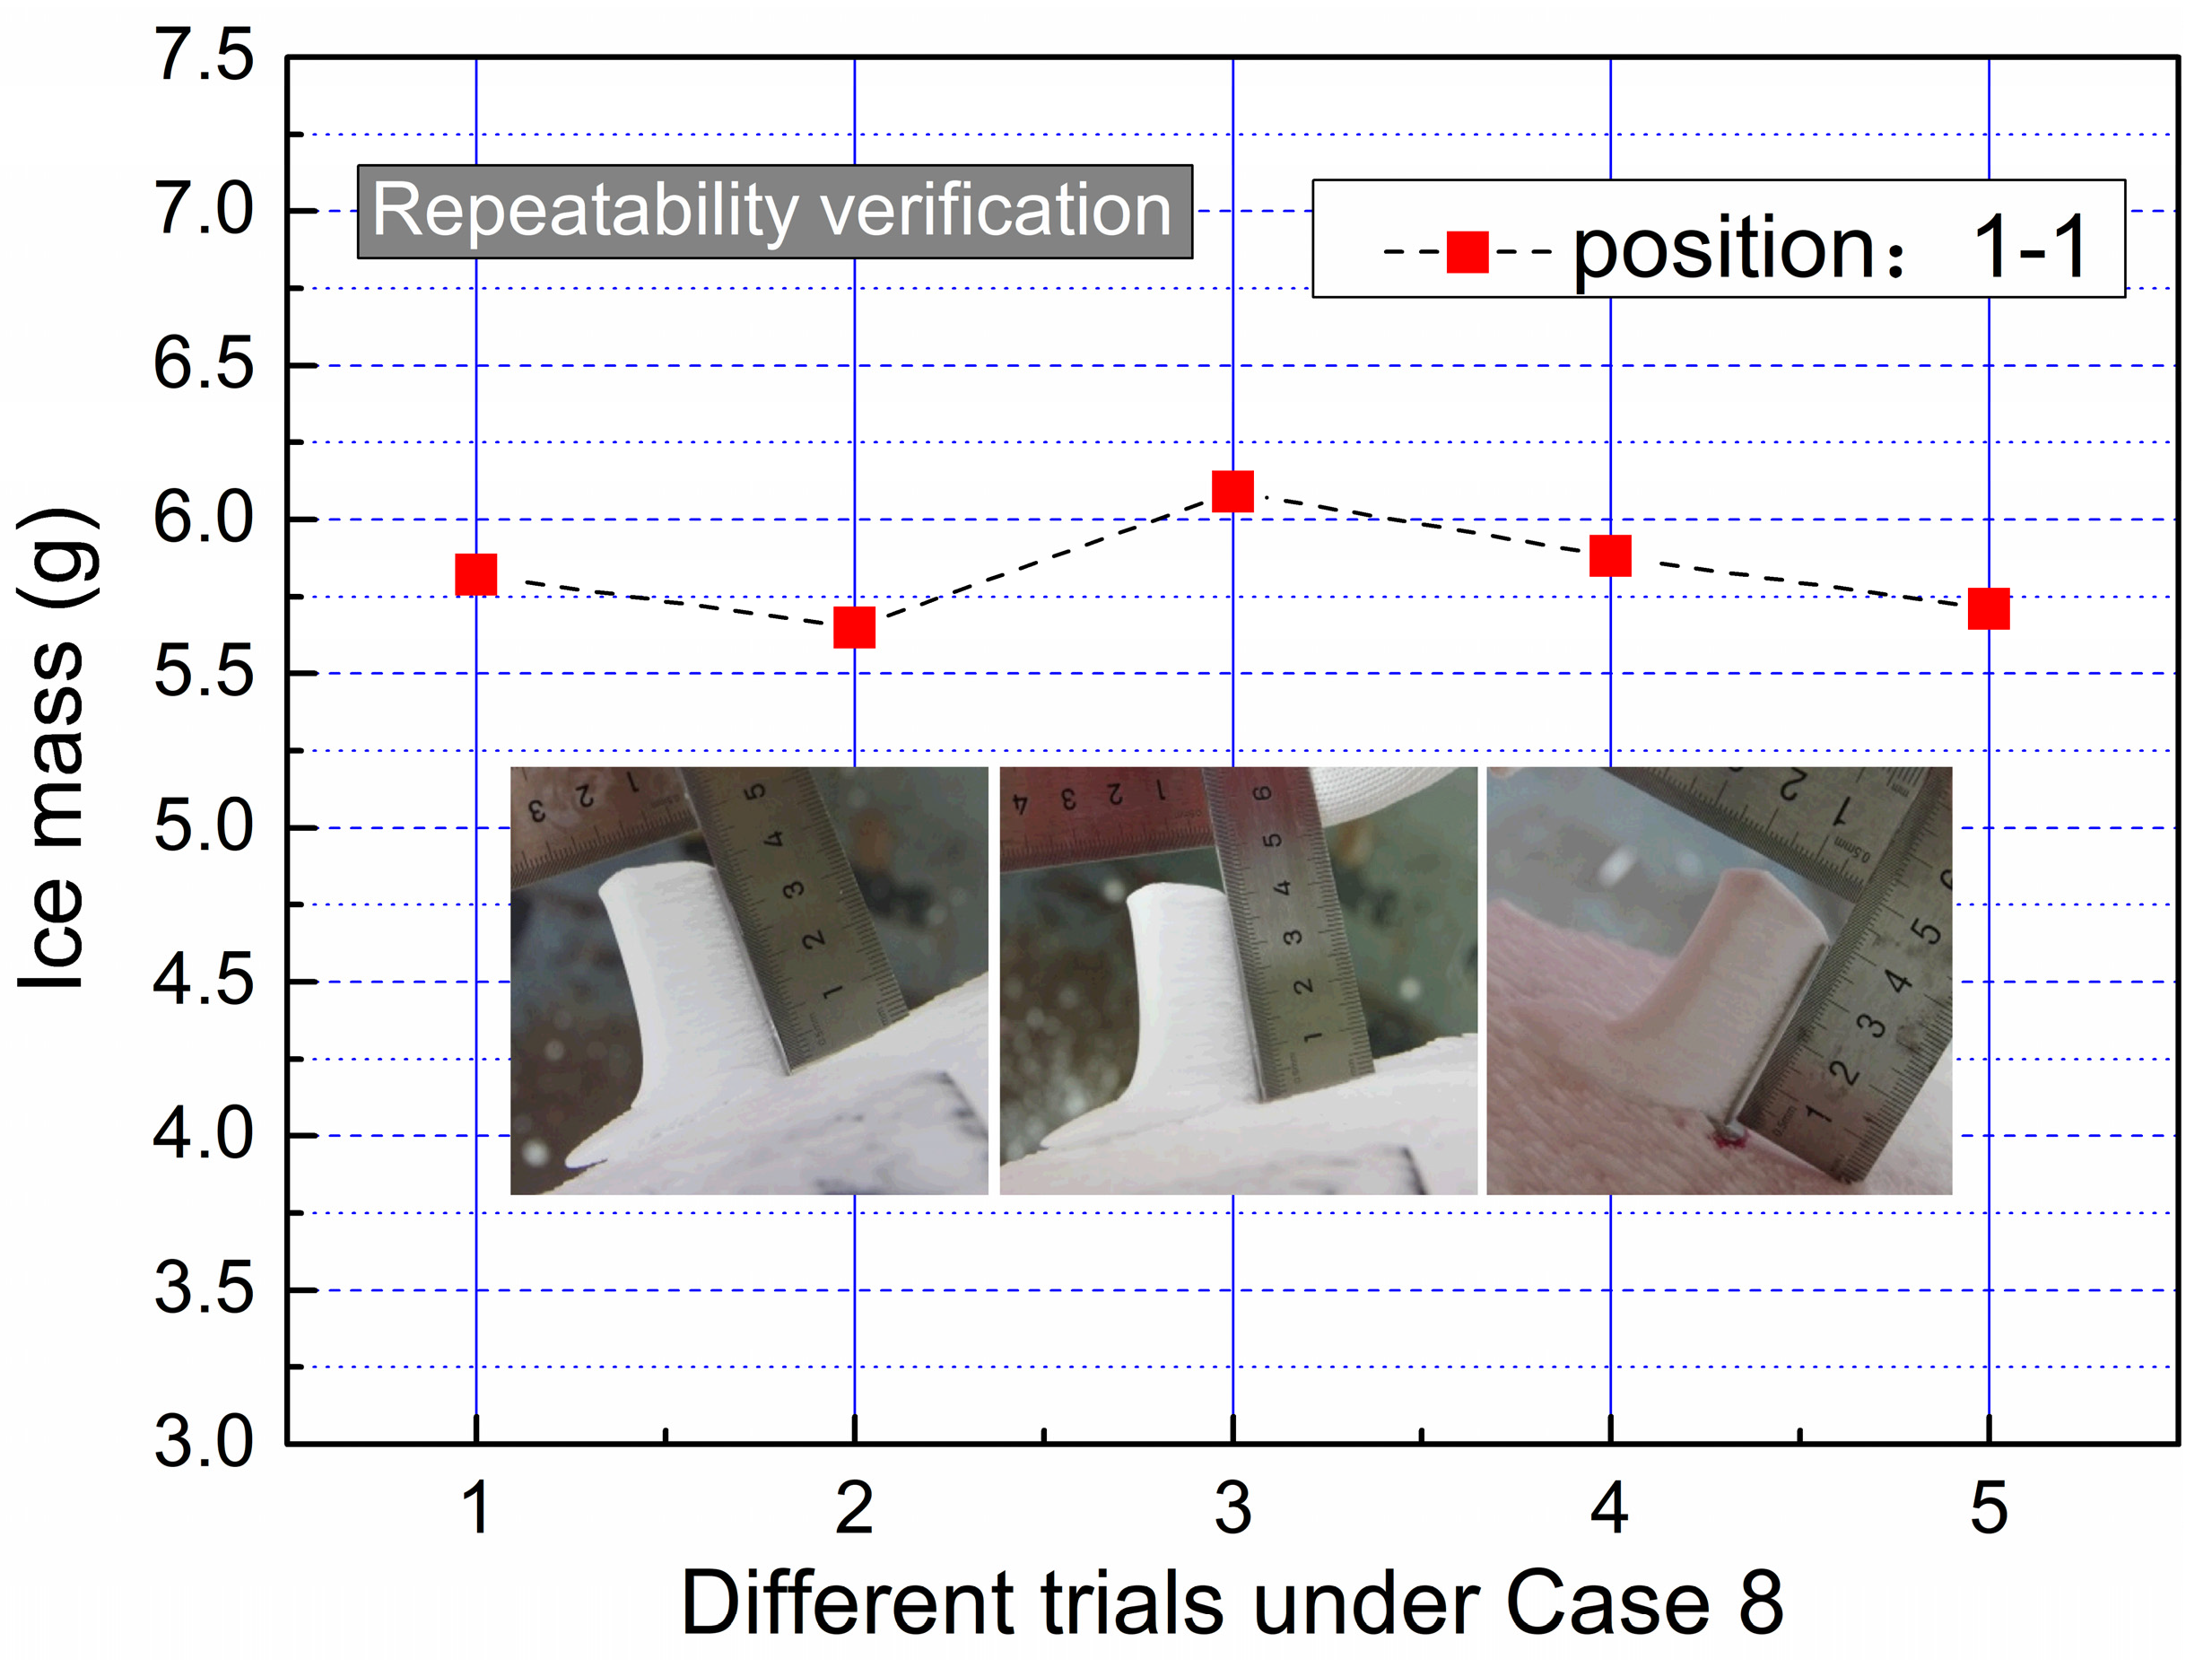
In addition to reducing the mutual interference of sensor icing, the parameter stability of the wind tunnel is another important factor to ensure the accuracy of test results. Therefore, the repeatability verification of the experiment was conducted based on the evaluation criteria of ice shape and icing mass at the same location. The multiple ice shapes formed at Position 1-1 under the same simulated environment (Case 8) are shown in Figure 6, with a comparison of icing mass at the same location presented. It can be found that the similarity of the ice shapes obtained from the repeatability test is very high, which all present a boot-shaped appearance. The thickness of their main area is all within the range of 20 mm to 25 mm, and the length of their protruding sharp corners at the bottom is all around 50 mm. Meanwhile, their icing mass is also very close, with a variation range of 5.65~6.09 g and a mean square error of only 0.171. The data from the above repetitive tests indicate that the parameter stability and accuracy of the wind tunnel can meet the needs of the proposed research.

3.4. Scheme of the Icing Test

During the test, the overall icing properties of the surface sensors can be investigated intuitively through the video recording and detailed photos of the icing process on the sensor probes, and the icing characteristics of each sensor location can be quantitatively analyzed by using methods such as image display, thickness measurement and mass determination. In the specific implementation process, the turntable angle was adjusted to the target angle of attack firstly, then the wind speed, ambient temperature and simulated altitude were set. After the air flow parameters were relatively stable, the water pressure, air pressure and operating time of the spray system were set to the target value, then the spray nozzles were started. The spray and blowing systems were stopped at the end of the freezing time, and the total temperature of the wind tunnel should be reduced appropriately to avoid possible melting of the residual ice. Lastly, the local ice shapes at different locations were captured, with the icing thickness measured and the local icing mass on the surface of each installed probe determined. An electronic balance which has an accuracy of 0.01 g was used, and the mass of ice was determined to be the difference in weight before and after de-icing. The real-time images, icing shapes and local icing characteristics were recorded by the ACS-1 M60 high-speed camera capable of transmitting 60 megapixels per second.

4. Icing Properties of the Sensor Probes

4.1. Overall Distribution of Ice Accretion

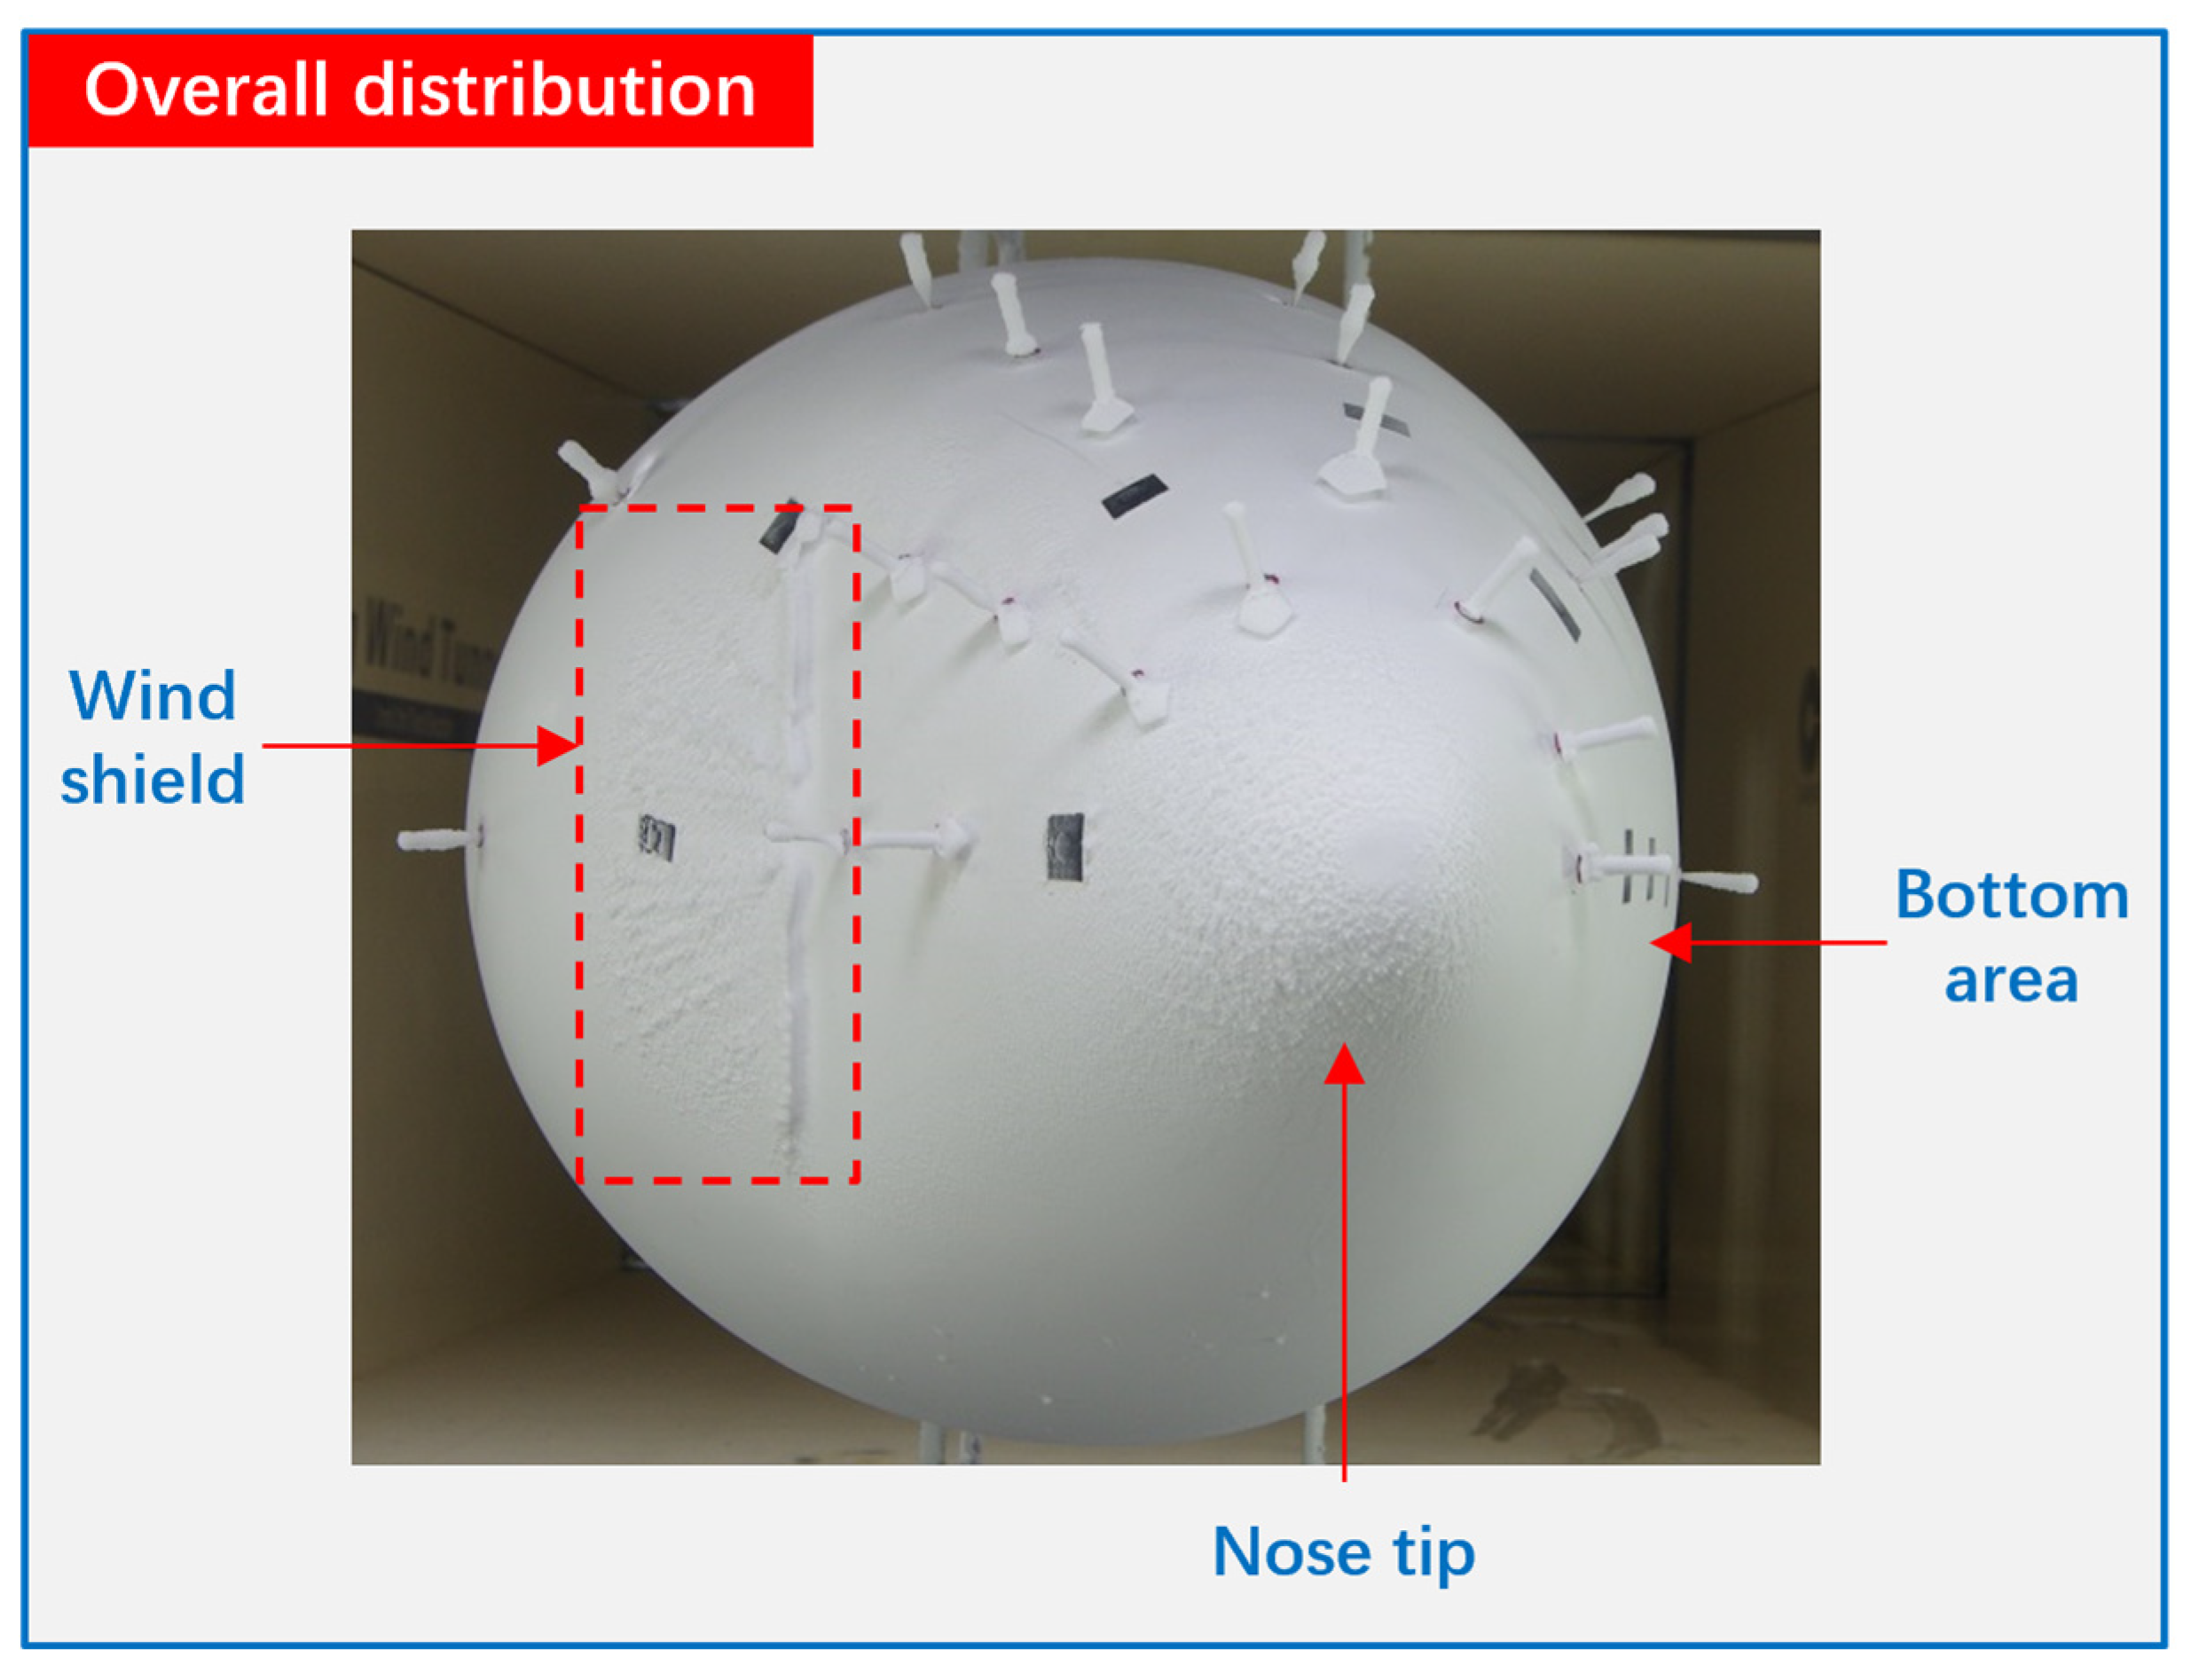
The overall icing situation on the nose surface in the test section is shown in Figure 7, where some of the features are common to all operating conditions. It can be found that there is a large area of ice accretion on the surface of the windshield and the front tip within a certain range, while the bottom area is relatively clean. This is determined by the aerodynamic characteristics of the geometric contour of the nose: the projection area of the windshield and the nose front-end region in the direction opposite to the incoming flow is larger than other locations, which are directly impacted by water droplets; on the contrary, the bottom area is highly parallel to the direction of the incoming flow, making it difficult for water droplets to adhere directly.

4.2. Local Icing Characteristics under Rime Ice Conditions

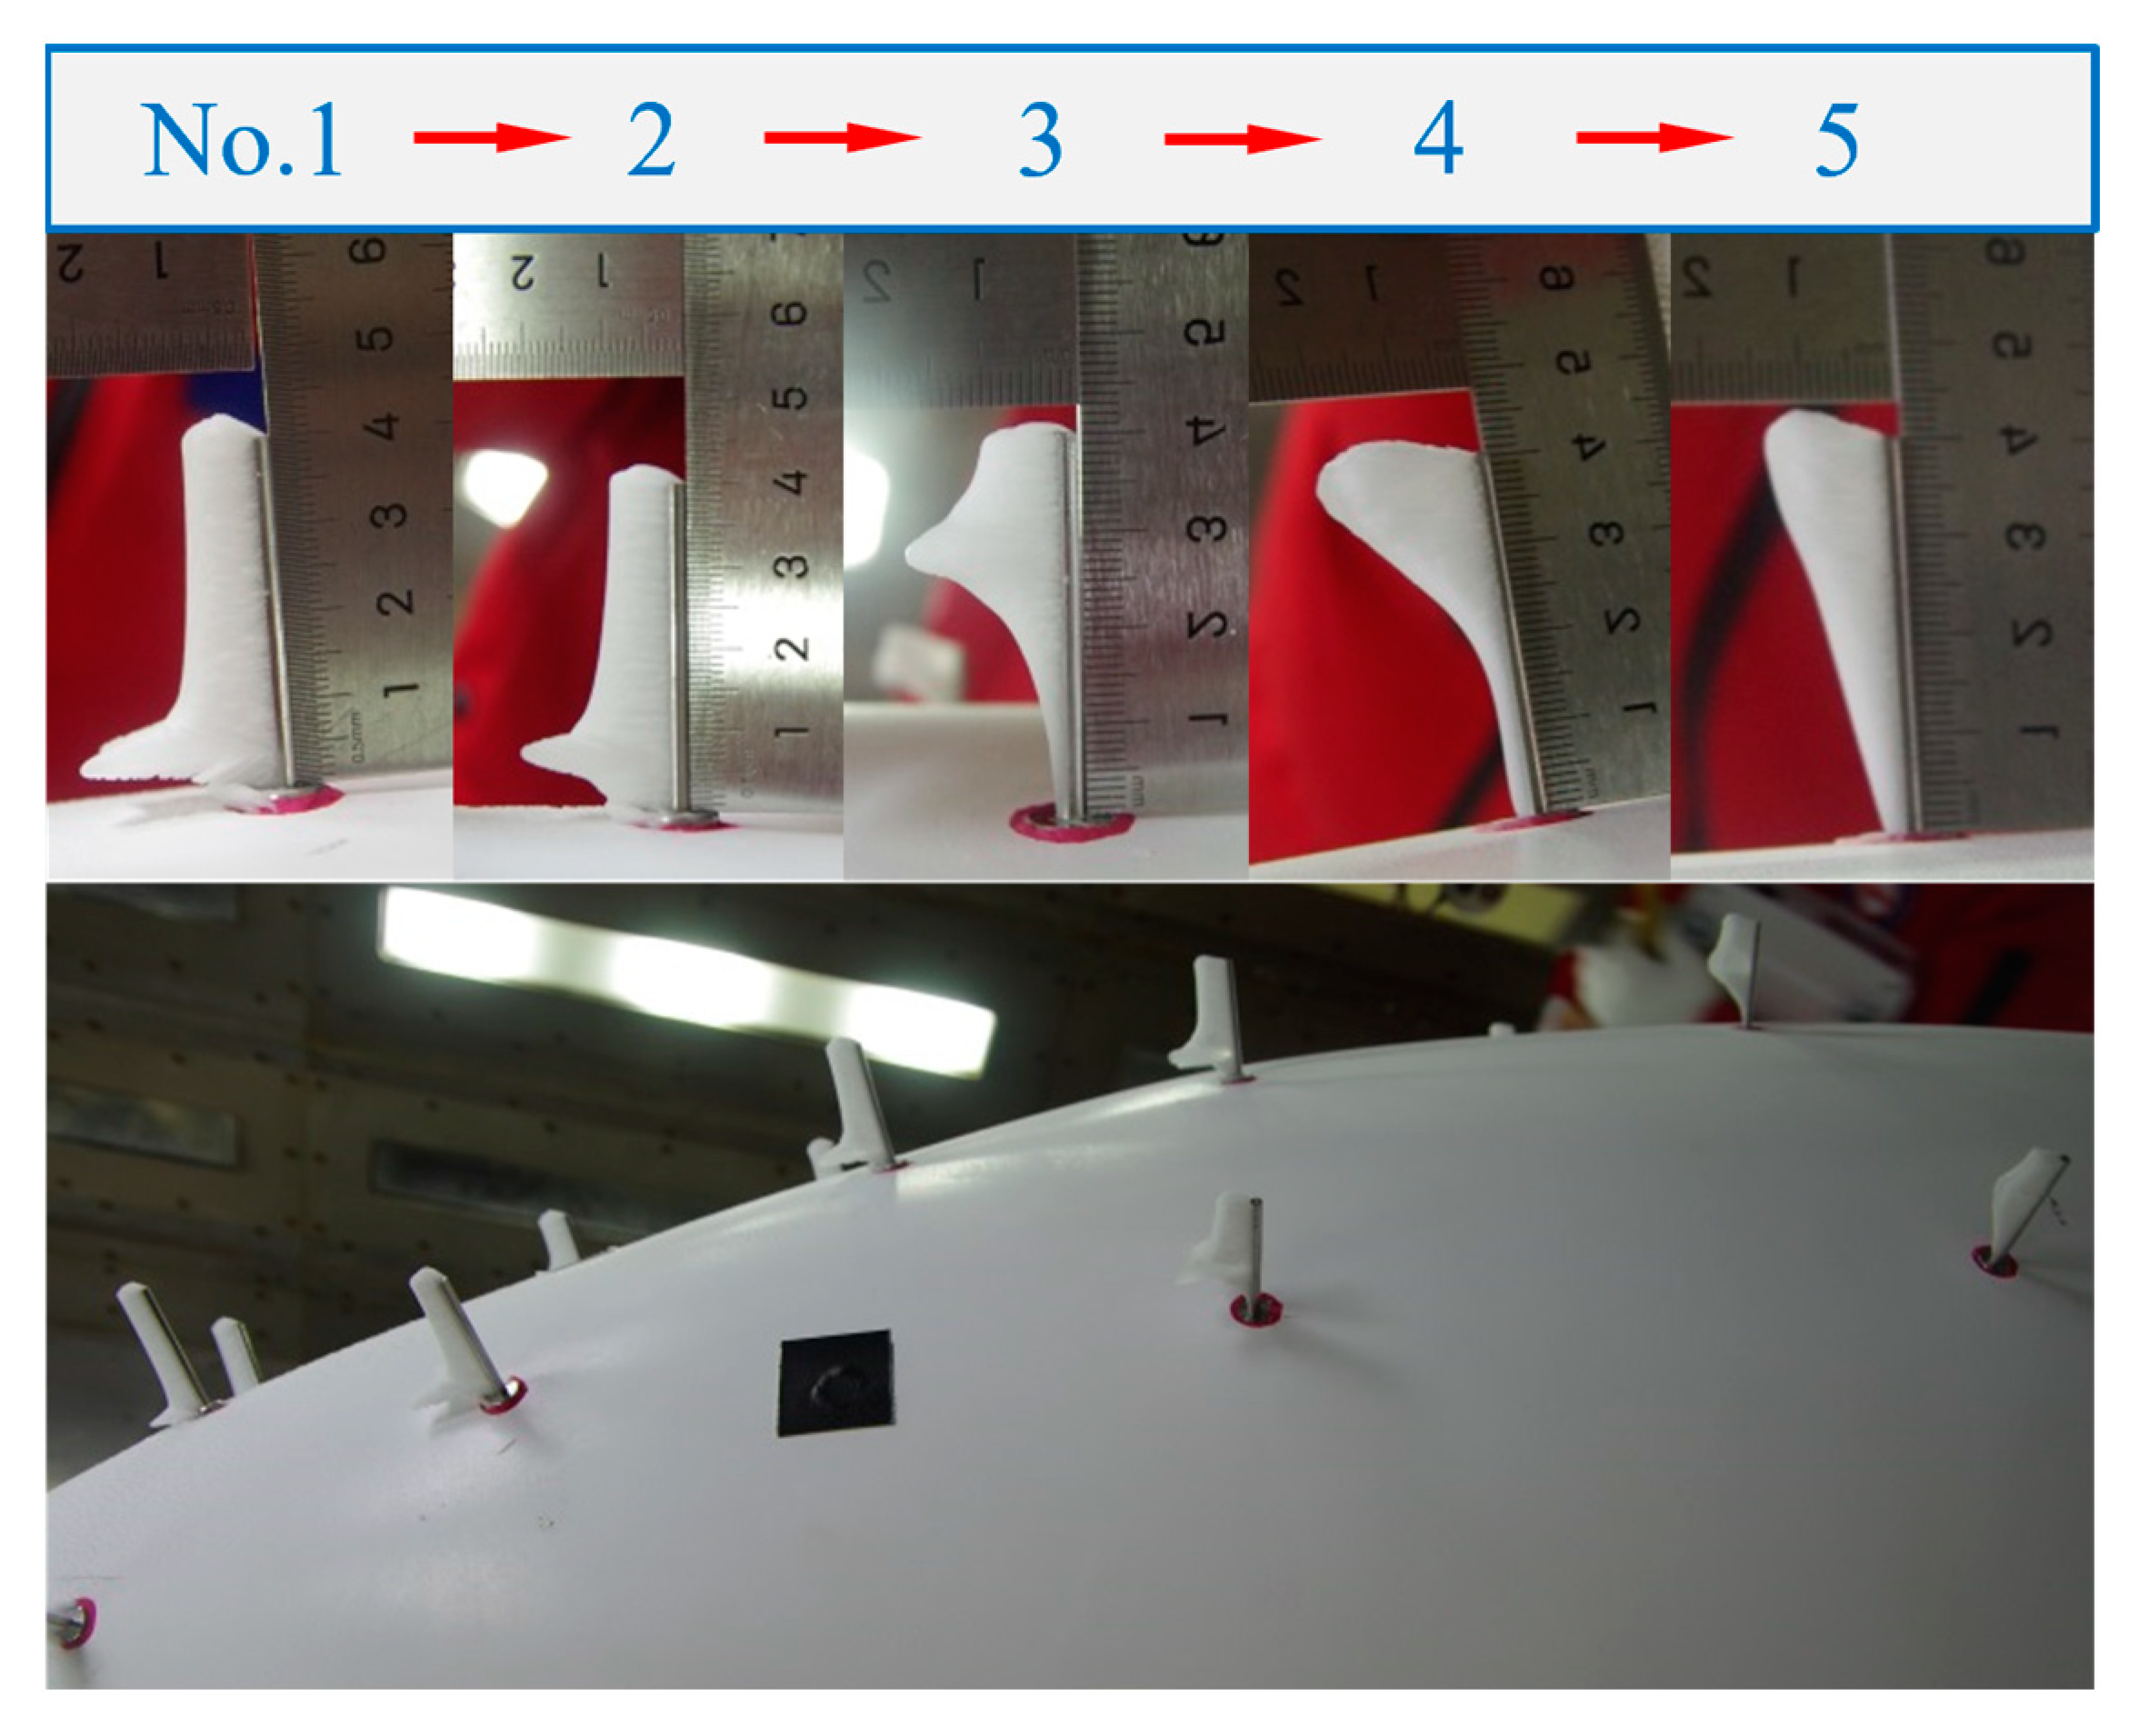
The ambient temperature of Cases 3–11 is relatively low, which are typical rime ice conditions. As shown in Figure 8, the growth direction of the ice layer on the probe surface is parallel to the incoming flow, and its thickness mainly changes along the axial direction of the probe. Five representative ice shapes developed at different installation positions are also given in Figure 8, which are numbered from left to right as Shapes 1–5. Among them, a sharp angled region extending towards the incoming flow appears in Shapes 1, 2 and 3, moving from the bottom of the probe to the upper end gradually, and both sides of these sharp corners develop into arc-shaped contour areas. Besides, Shape 4 also has a sharp angled part at the top of the probe, but it is incomplete and the upper half arc area is missing. Shape 5 gradually thickens from bottom to top, while has not yet reached its potential maximum thickness, thus no obvious sharp corners appear there.

4.3. Analysis of Water Collection Characteristics on Probe Surface

Under the rime ice condition, the supercooled water droplets carried by the incoming flow freeze immediately after hitting the probe cylinder surface. In this case, the mass of ice accretion is very close to the amount of liquid water collection, so the ice shape contour can directly reflect the distribution of the water collection coefficient along the probe axis. Through further analysis of Figure 8, it can be found from the common properties of Shapes 1–5 that the water collection coefficients on the surface of all sensor probes show a trend of first increasing and then decreasing, with extreme points (i.e., sharp corner areas) present along the axis. In addition, the axial positions of the sharp corners in Shapes 1–5 are different, indicating that the axial heights of the water collection extreme points are variable in different installation positions. Due to the height limitation of the sensor probe itself, the extreme point of water collection at Shape 4 appears near the end of the vertical axis, resulting in a loss of the subsequent water collection reduction zone. In addition, the possible location of the water collection extreme point in Shape 5 exceeds the height range of the probe, thus its water collection is maintained in the increasing zone.
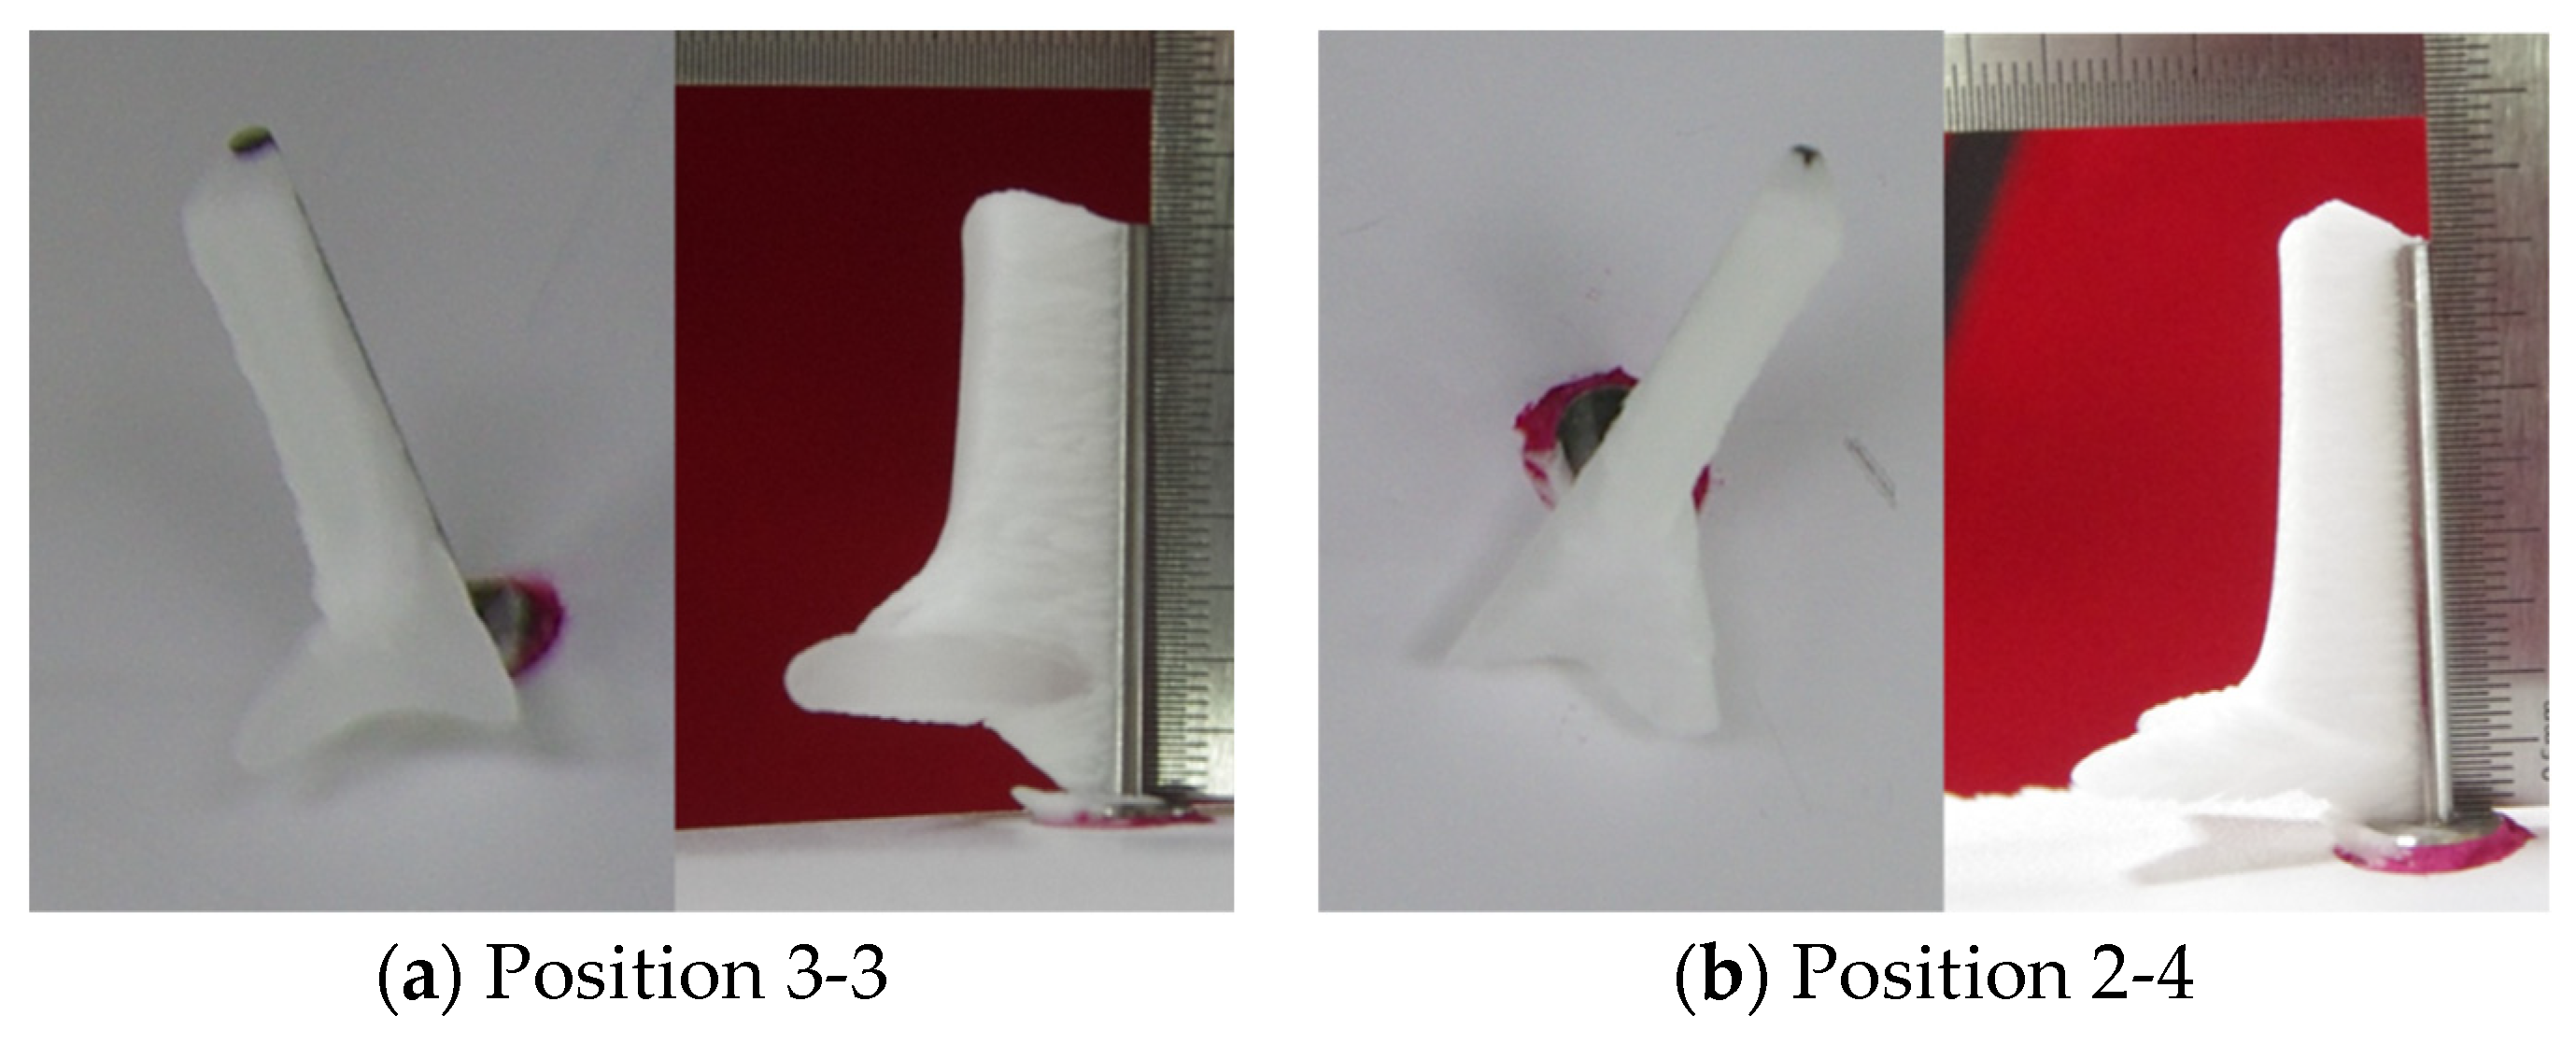
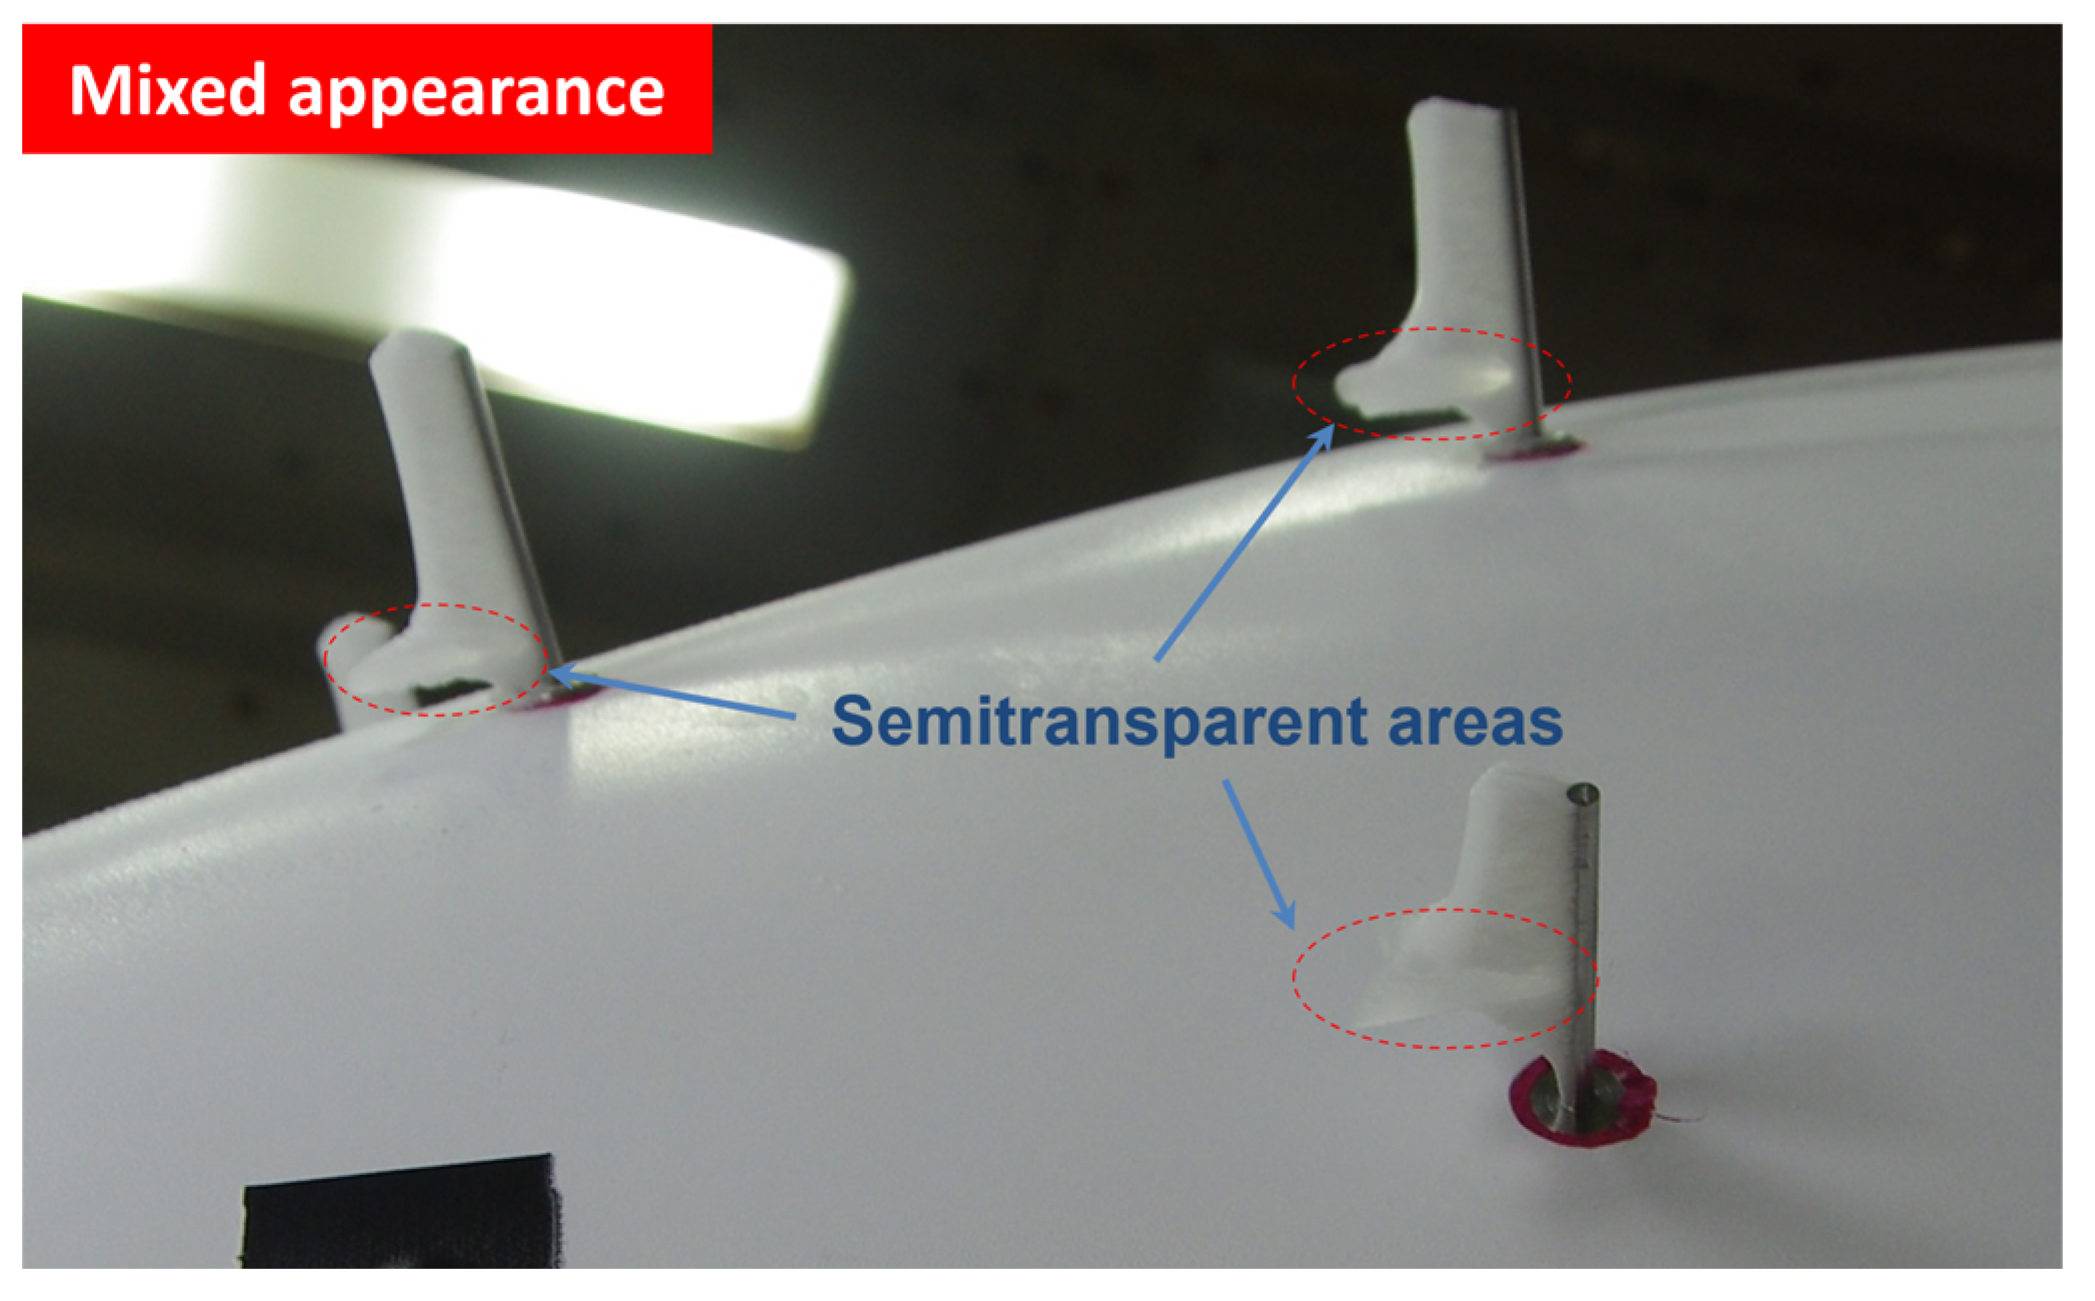
Based on the above analysis, it can be concluded that there are three specific zones with different water droplet impact characteristics on the probe surface from bottom to top: the water collection increasing zone, the water collection extreme point, and the water collection decreasing zone. The appearance of the extreme point is caused by the accumulation effect of water droplets, and the liquid water content in the air flow field near the extreme point is significantly higher than that on both sides. When the liquid water content around the accumulation point of water droplets further increases, with the latent heat released by ice accretion, the water droplets will not freeze immediately after impacting the surface of the formed ice layer (that is, the freezing coefficient is less than 1). Subsequently, the icing characteristics at the water droplet accumulation points will tend towards glaze ice, where the ice horn morphology with three-dimensional features may appear. The ice formation on the probe surfaces at Positions 3-3 and 2-4 under the same ambient condition (Case 3) is given in Figure 9, where both of them develop significant three-dimensional ice horns with glaze ice characteristics. Therefore, at certain installation positions on the nose surface, the appearances of ice formed on the probes include both milky white rime ice (in the water collection increasing and decreasing zones) and semitransparent glaze ice (near the extreme point of water collection), which are shown in Figure 10.

4.4. Variety Rule of the Water Collection Extreme Point with Surface Position

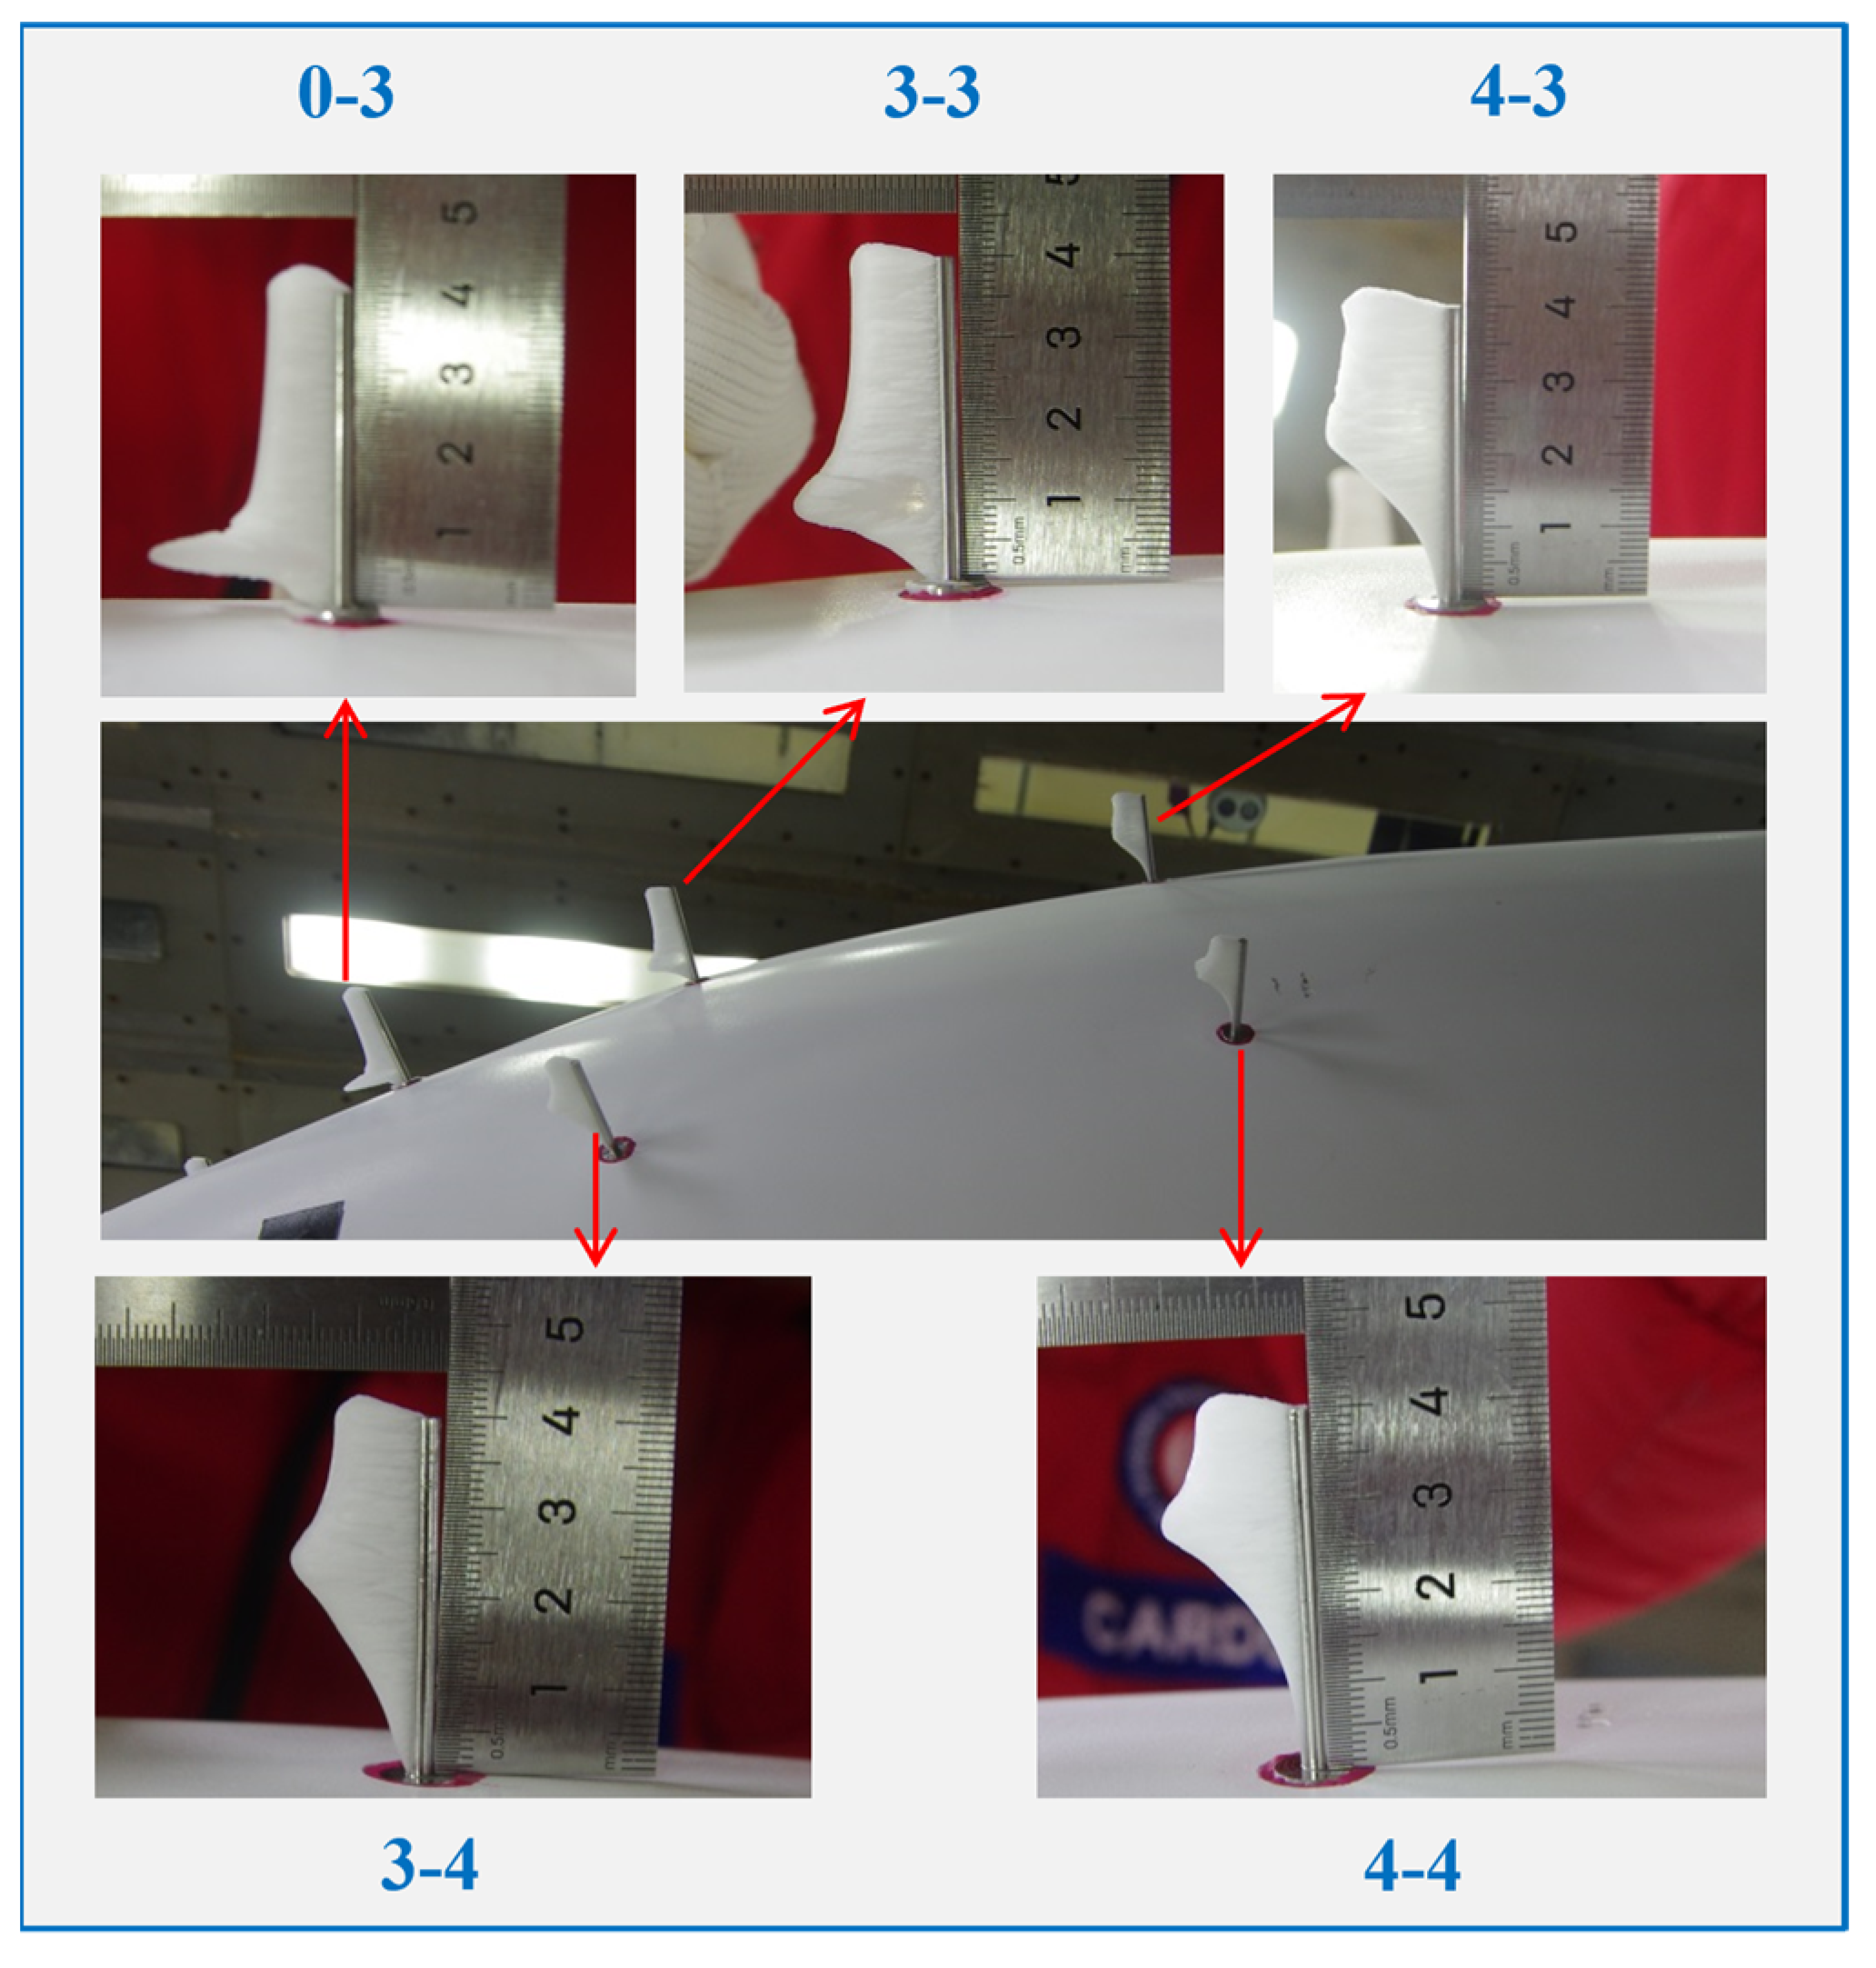
The water collection characteristics on the probe surface are found to be closely related to its installation position. The icing situation of the sensors on Sections 0, 3, and 4 under Case 8 is shown in Figure 11, which can be divided into two groups along the airflow direction: Positions 0-3, 3-3 and 4-3 as one group, Positions 3-4 and 4-4 as the other group. It can be found that along the airflow direction, the sharp horn position of the probe surface ice, i.e., the extreme point of water collection, gradually moves up, which reflects the distribution characteristics of the airflow streamline along the nose surface: the separation degree of the airflow in the downstream area is higher than that in the upstream area.
Based on the above findings, multiple environmental states with the same freezing time are selected (Cases 3, 4, 7, 8, 9, 10 and 11) to analyze the quantitative changes of the water collection extreme points along the longitudinal direction of the airflow. The longitudinal region including Positions 1-3, 0-3, 3-3 and 4-3 is defined as Zone 3, which is shown in Figure 12. Similarly, the longitudinal region including Positions 1-4, 0-4, 3-4 and 4-4 is defined as Zone 3. The icing situation on the surface of each probe in Zone 3 is closely displayed in Figure 12 as well, and it can be intuitively observed that the ice horn on the probe surface gradually moves from the bottom to the upper end of the probe axis along the airflow direction.
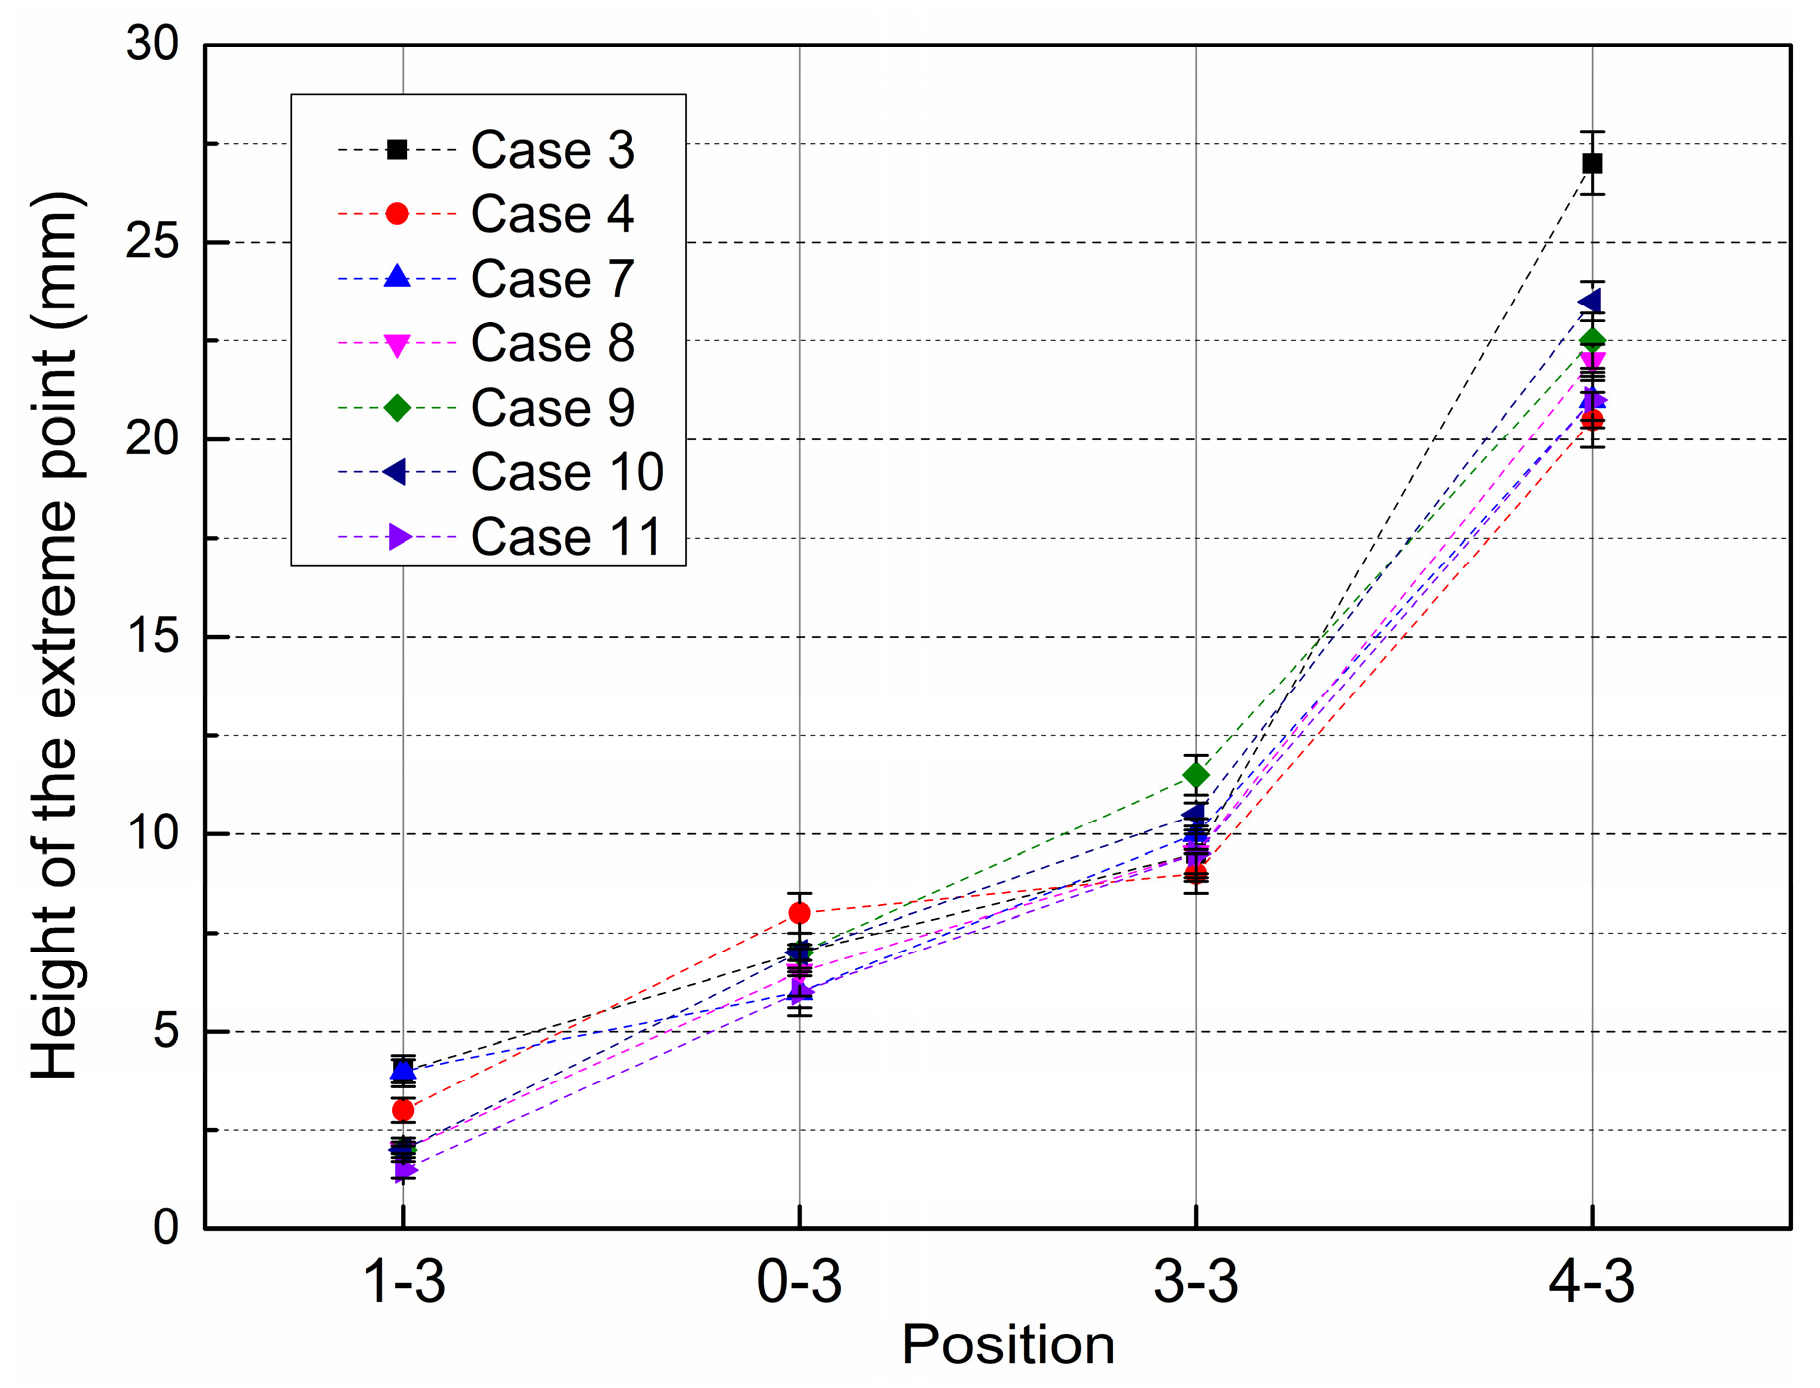
For these two longitudinal regions (Zone 3 and Zone 4), the height changes of the water collection extreme points on the surface of each sensor along the airflow direction in different cases are quantitatively presented in Figure 13 and Figure 14. Among them, the horizontal axis represents different sensor positions, the vertical axis represents the height of the extreme point along the probe axis, and the curves of different colors represent various cases. It can be found that with different environmental parameters, the height of water collection extreme points at the same location varies, where the main influencing factors are the angle of attack and the water droplet diameter. However, the trend of the height changes in all cases along the airflow direction is consistent, presenting a gradual upward pattern with a variation range of 2 mm to 30 mm. Specifically, Positions 1-3 and 1-4 of Section 1 are located at the front end of the aircraft nose, where the development of the wall boundary layer is still in the initial stage, thus the water collection increasing zone (i.e., the area with low liquid water content) at Positions 1-3 and 1-4 is relatively narrow, leading to the very low axial positions of the water collection extreme points, which are below 5 mm in all cases. In Positions 2-4 and 0-3 that belong to Section 2 and Section 0 respectively, there is a slight change in the height of the extreme point, rising to over 5 mm with a maximum value of about 8 mm. However, the overall change is relatively small, and the height of the extreme point for all cases is still below 10 mm. Section 3 and Section 4 are located downstream of the nose surface, where the height of the extreme point is significantly improved compared to the previous two sections. As shown in Figure 13, from Section 3 to Section 4, the height increments of the water collection extreme points in all cases exceed 10 mm. This is because the curvature of the wall profile between Section 3 and Section 4 changes greatly, and the boundary layer also develops rapidly after the airflow passes through the transition area from the windshield to the back of the nose. As the last detection section in the airflow direction, all the heights of the water collection extreme points in Section 4 are above 20 mm, with a maximum value of 29 mm.
To sum up, the wall boundary layer gradually develops along the flow direction based on the flow field characteristics around the nose surface. If the height of the probe axis remains unchanged, the closer the sensor probe is installed downstream of the airflow, the higher the axial position of the water collection extreme point. Therefore, from the perspective of engineering applications, if the design height of the probe is not high enough and its installation position is relatively backward, there may be a situation where the maximum icing thickness point cannot be captured, which will affect the sensitivity and effectiveness of icing detection.

4.5. Local Icing Characteristics under Glaze Ice Conditions

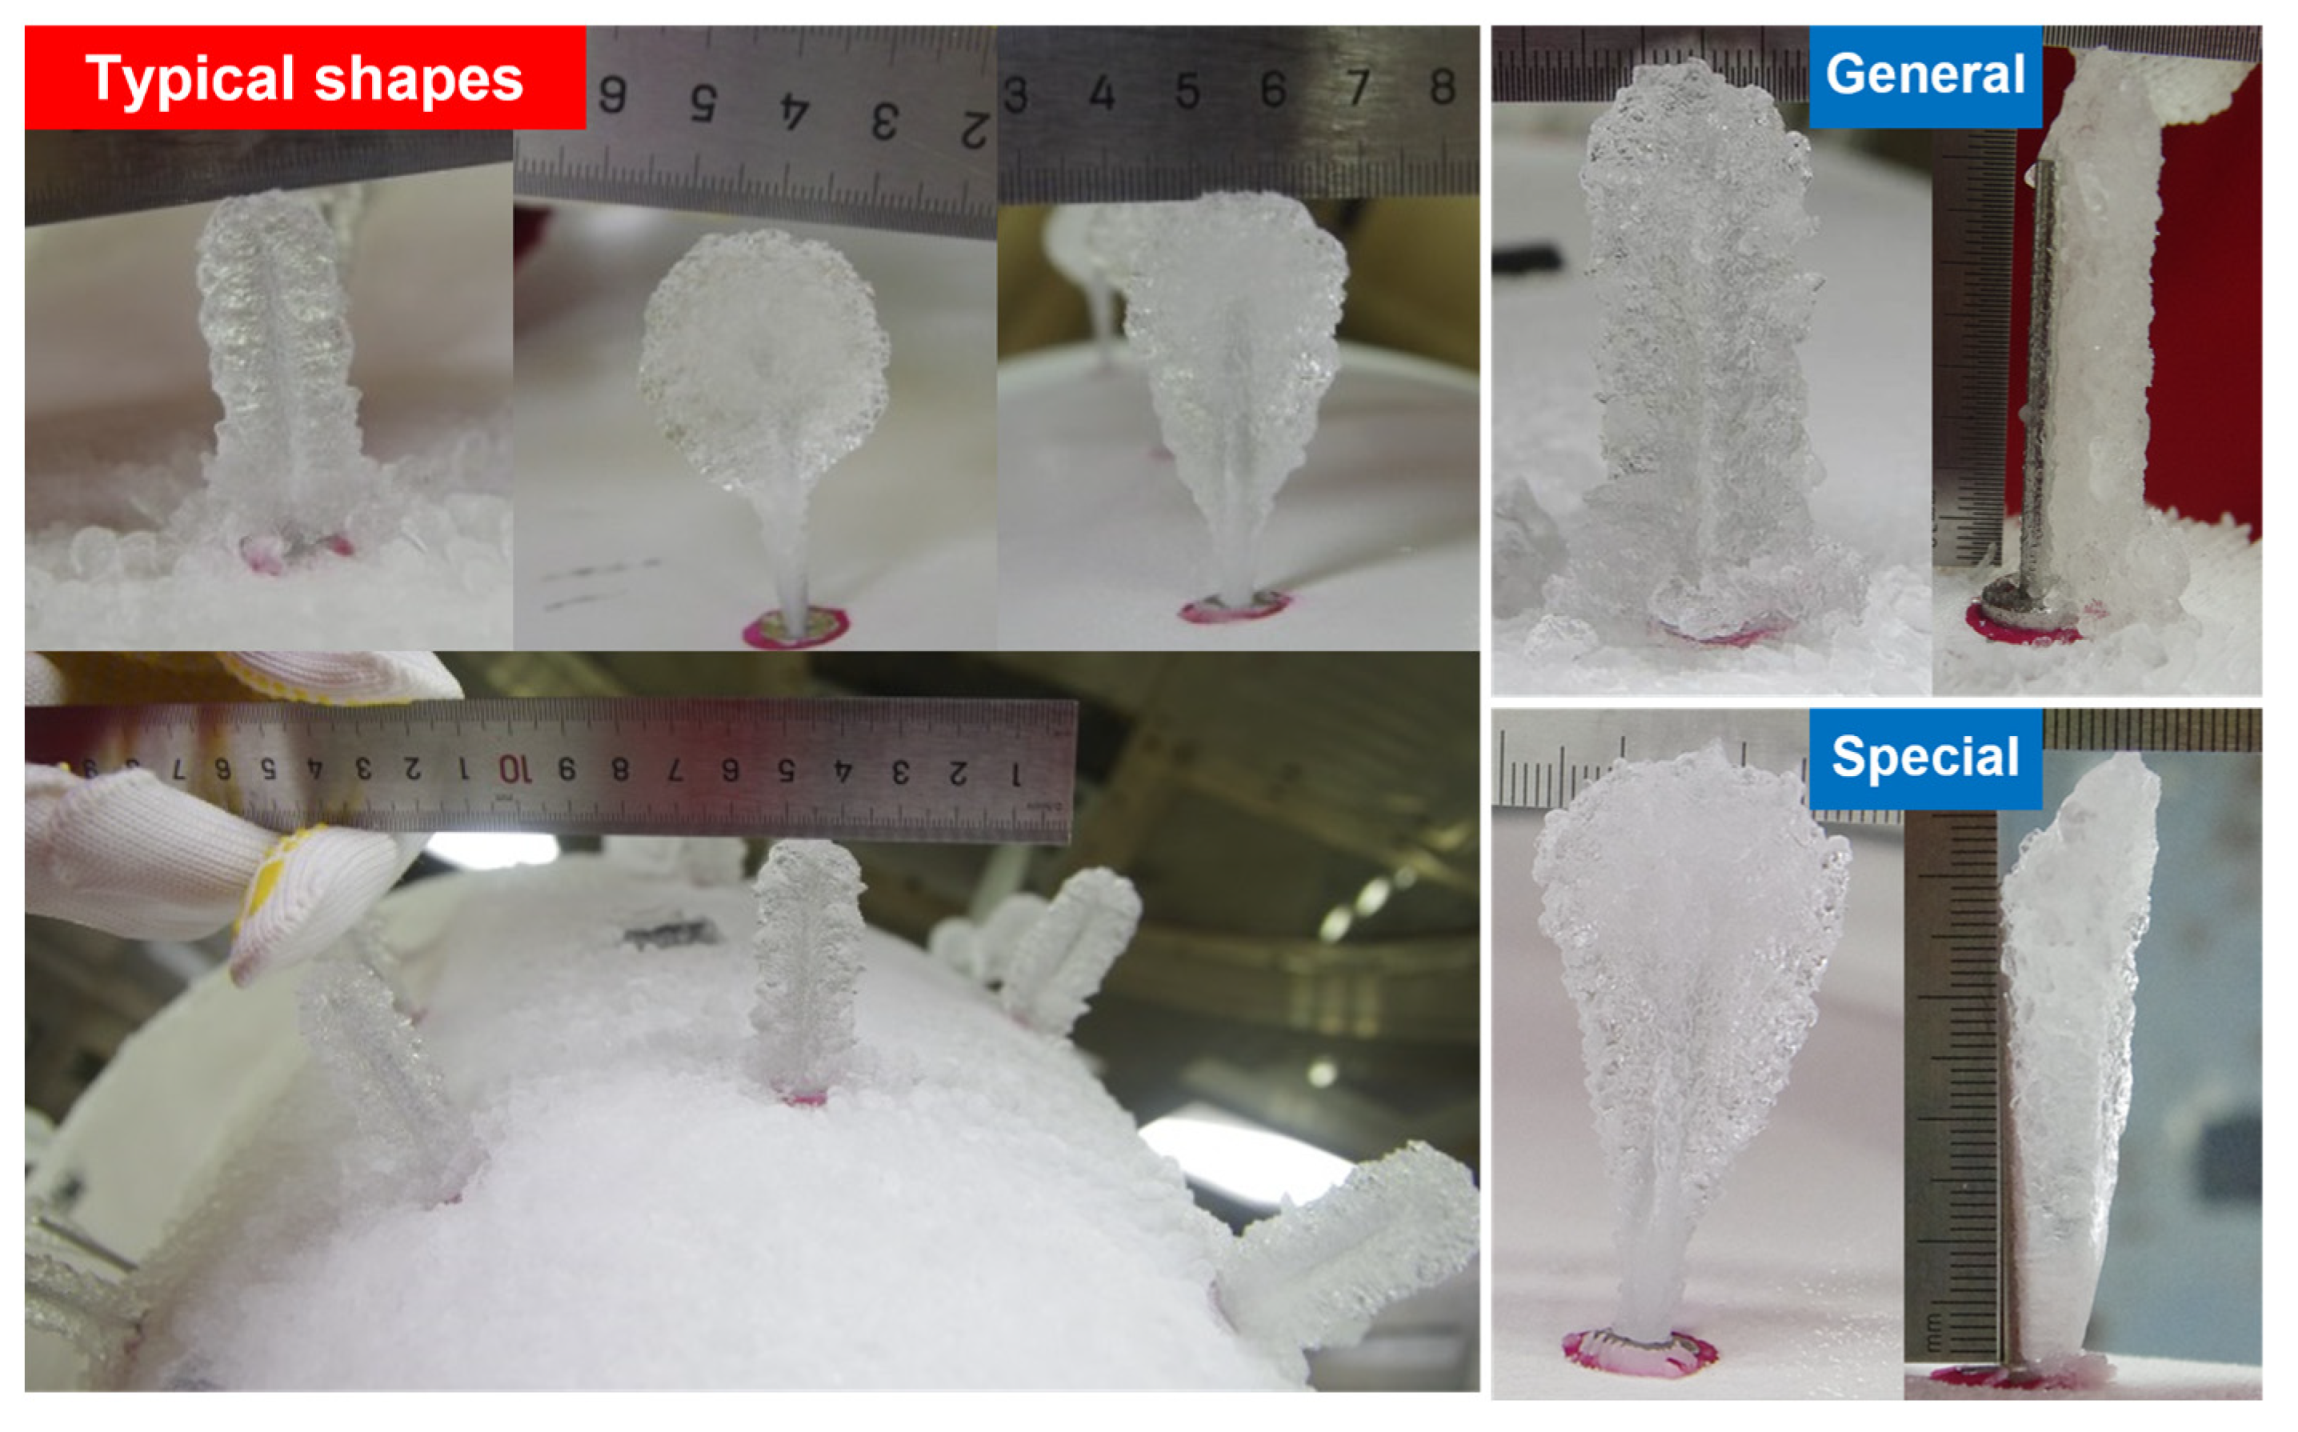
The ambient static temperature of Cases 1 and 2 is −10 °C, with a total temperature of −5.97 °C, which are typical glaze ice conditions. Three types of ice shapes that formed on the sensor probes in this situation are presented in Figure 15, which are different from the rime ice state and have a more transparent texture with a concave middle area. Besides, the ice accretion has strong symmetry around the probe axis and grows into fan-shaped shapes with different extension amplitudes on the cross-section perpendicular to the incoming flow direction.
Unlike the characteristics of rime ice, under the glaze ice conditions, the water droplets carried by the airflow do not freeze immediately after hitting the probe surface, resulting in a slower freezing velocity. Therefore, the water droplets attached to the probe surface flow downward under the influence of gravity, making up for the boundary layer effect. The amount of ice formation along the vertical direction of the probe surface is relatively uniform, shown as the general ice shape in Figure 15. However, due to the aerodynamic characteristics of the nose shape and the influence of incoming flow, the local stagnation temperatures of probes at various positions on the nose surface are different. The freezing rate is faster at the locations with relatively lower stagnation temperatures, and the water film flow phenomenon on the probe surface is not significant, where the characteristics of the icing process are approximate to rime ice. In this case, the icing process on the probe surface is greatly affected by the distribution of axial water droplet impact, and the mass of ice accretion on the probe axis is significantly different from bottom to top, presenting a gradually increasing trend and forming the special ice shape shown in Figure 15.

5. Analysis of the Sensor Optimal Position and the Influence of Ambient Parameters

5.1. Analysis of Optimal Location Based on Icing Mass

Based on the comparison of average icing mass, the icing sensitivity of the original sensor position on the aircraft nose is evaluated and the other optimized positions are determined subsequently. In the optimization method of the present work, the probe positions with the maximum icing mass in each cross-section are obtained firstly, serving as five candidate positions. Then the comprehensive performance of these five candidate positions is compared under all cases, and the optimal position distribution can be determined from a global perspective.
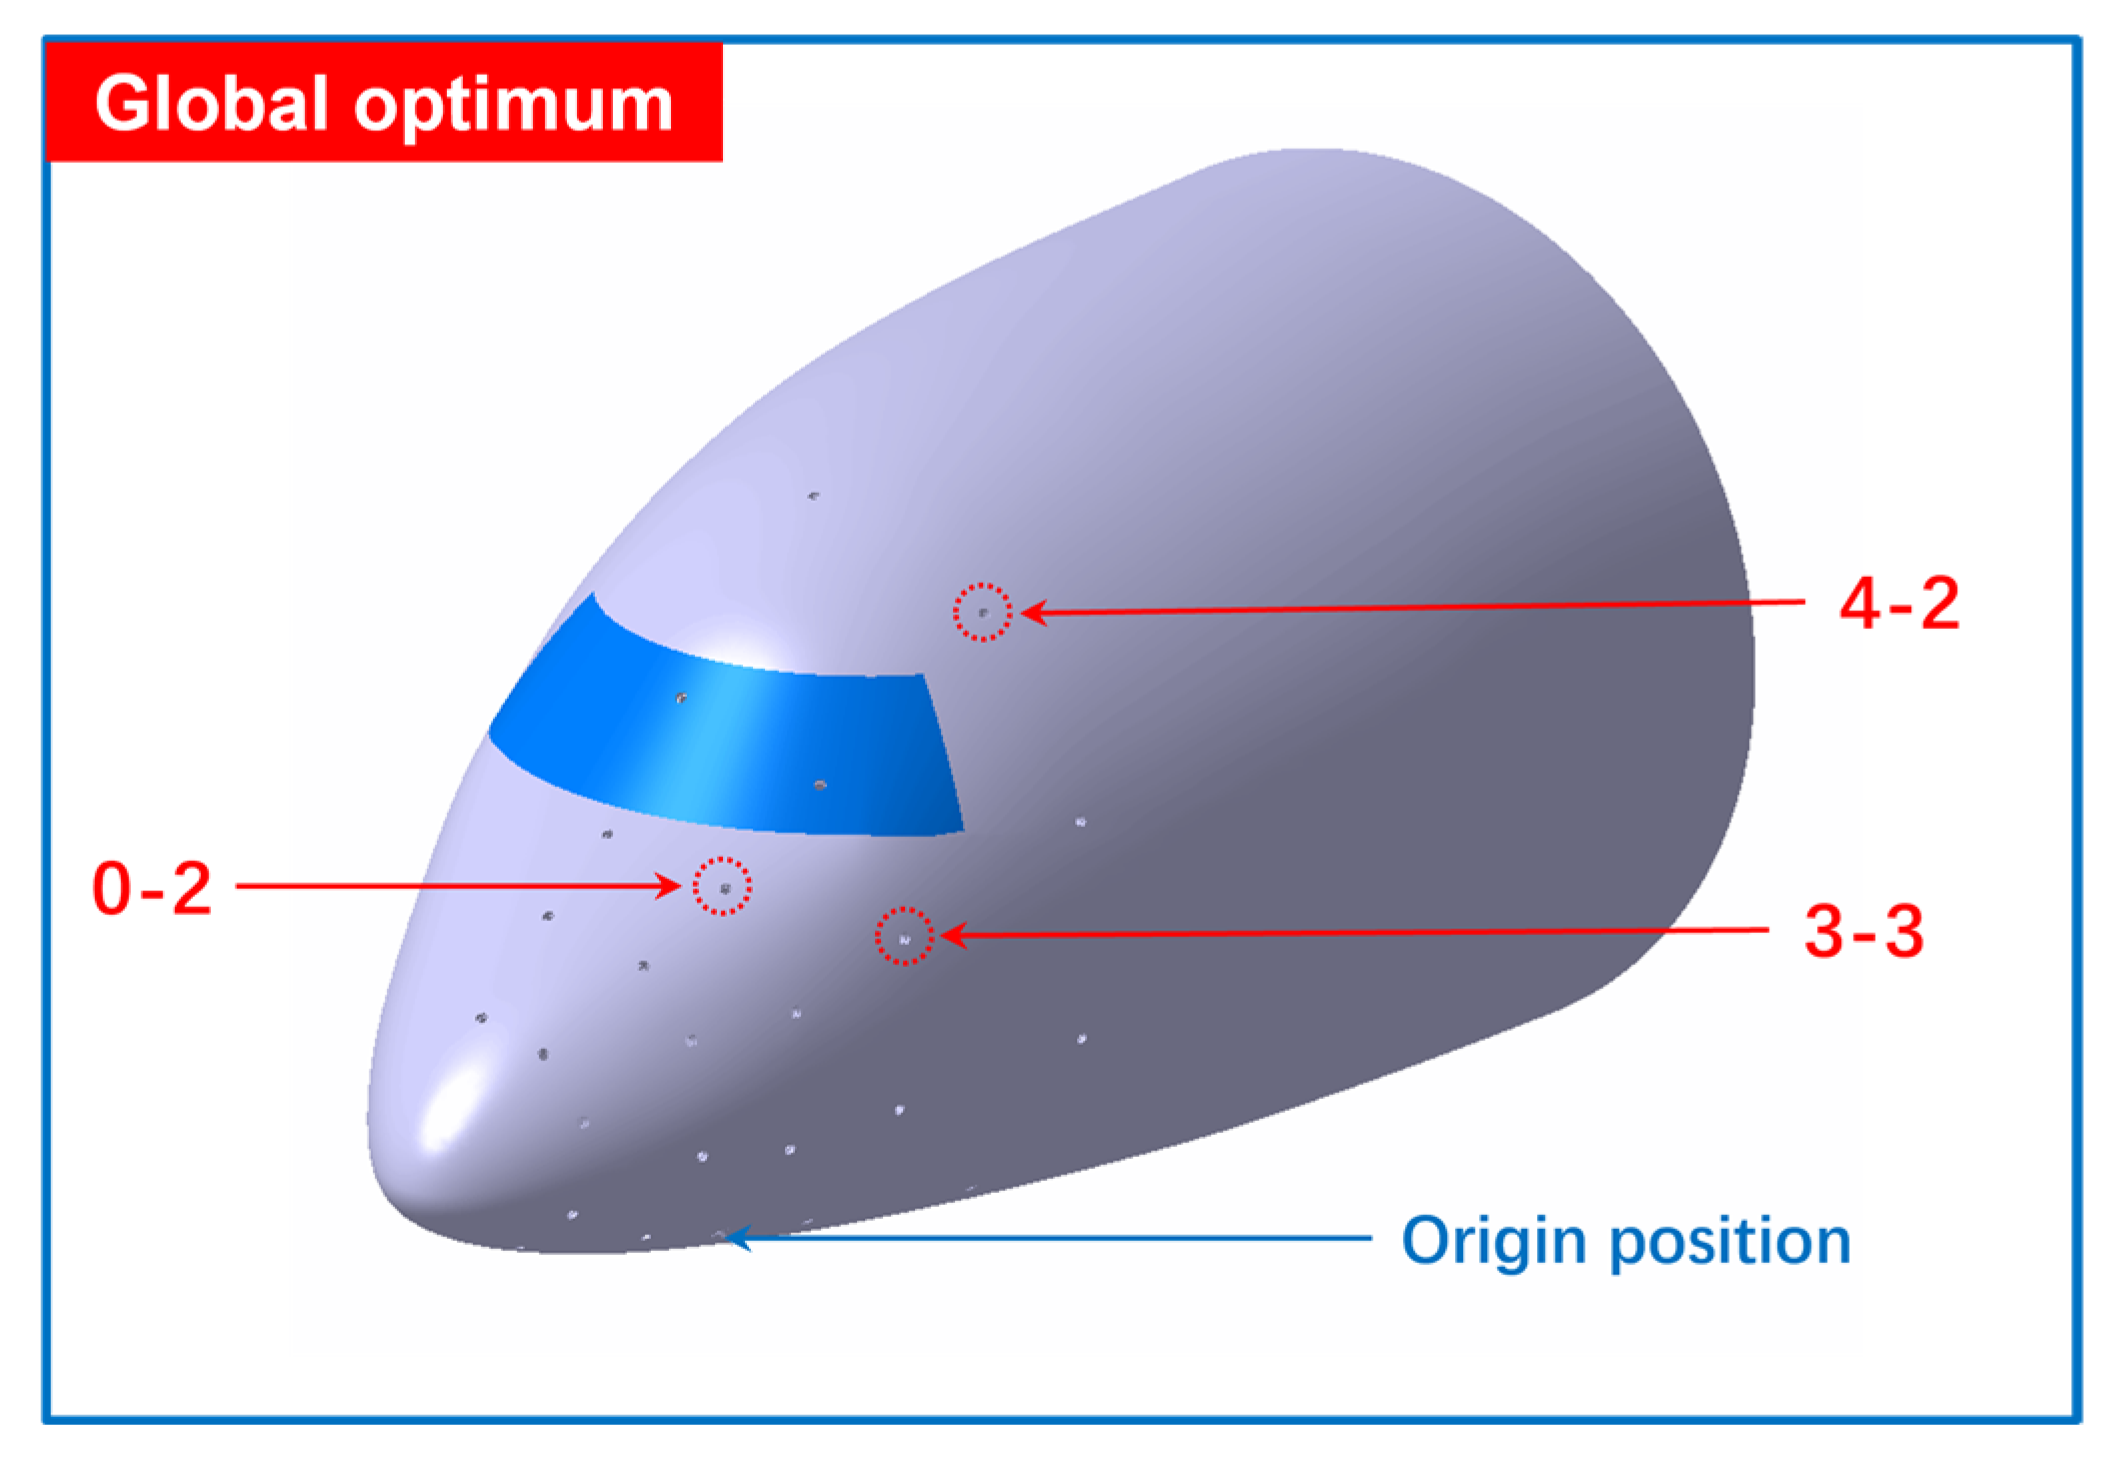
The icing mass of the sensor surface on Sections 1, 2, 0, 3 and 4 are shown in Figure 16a–e respectively, in which the various colors represent different environmental conditions, and the horizontal axis represents different installation positions on the surface of the aircraft nose, with the relatively superior position highlighted by the rectangular box. For Section 1 (Figure 16a), the icing mass at Position 1-4 in Cases 1, 2, 3, 6, 8, 9, 10 and 11 is greater than that at other positions, ranking second in Case 7. It can be found that Position 1-4 is not the maximum point only in Cases 4 and 5, demonstrating obvious advantage in icing mass, which can be determined as the optimal position for Section 1. For Section 2 (Figure 16b), the point with maximum icing mass in all environmental conditions except for Case 10 is Position 2-4, which are selected as the optimal position for Section 2. Using the same analysis method (Figure 16c–e), it can be concluded that the optimal positions for Sections 0, 3 and 4 are Positions 0-2, 3-3 and 4-2 respectively. Among them, Position 3-3 is the point with the maximum average icing mass in all cases, which is the global optimal position for Section 3.
To this step, the local optimal points including Positions 1-4, 2-4, 0-2, 3-3 and 4-2 have been obtained for each cross-section. Furthermore, the values of icing mass at these five candidate positions under all environmental conditions are compared to find the global optimal solution. The icing mass in different cases at the original and candidate positions of the sensor is shown in Figure 17, with various colors used to distinguish the environmental conditions and the error bars for each case given to evaluate the uncertainty of the results. The horizontal axis represents different positions, and the leftmost position is the original installation position of the sensor. It can be found that under all environmental conditions, the original position (Position 0-5) is not the point with the highest icing mass, that is, it is not the global optimal location for installation. As the operating parameters change, the maximum icing mass appears at different positions: in Cases 1, 2 and 5, the maximum mass appears at Position 4-2 of Section 4; in Cases 3, 4, 6 and 11, the maximum mass forms at Position 3-3 of Section 3; in Cases 7, 8, 9 and 10, the maximum mass appears at Position 0-2 of Section 0. In summary, it can be seen that Positions 1-4 and 2-4 which belongs to the candidate positions are not the maximum mass points in all cases, while Positions 0-2 and 3-3 become the maximum points four times in all 11 operating conditions, and Position 4-2 become the maximum points three times. Accordingly, the global optimal locations for installation determined in the present work are Positions 0-2, 3-3 and 4-2, with their distribution on the surface of the aircraft nose shown in Figure 18.

5.2. Influence Law of Incoming Flow Parameters

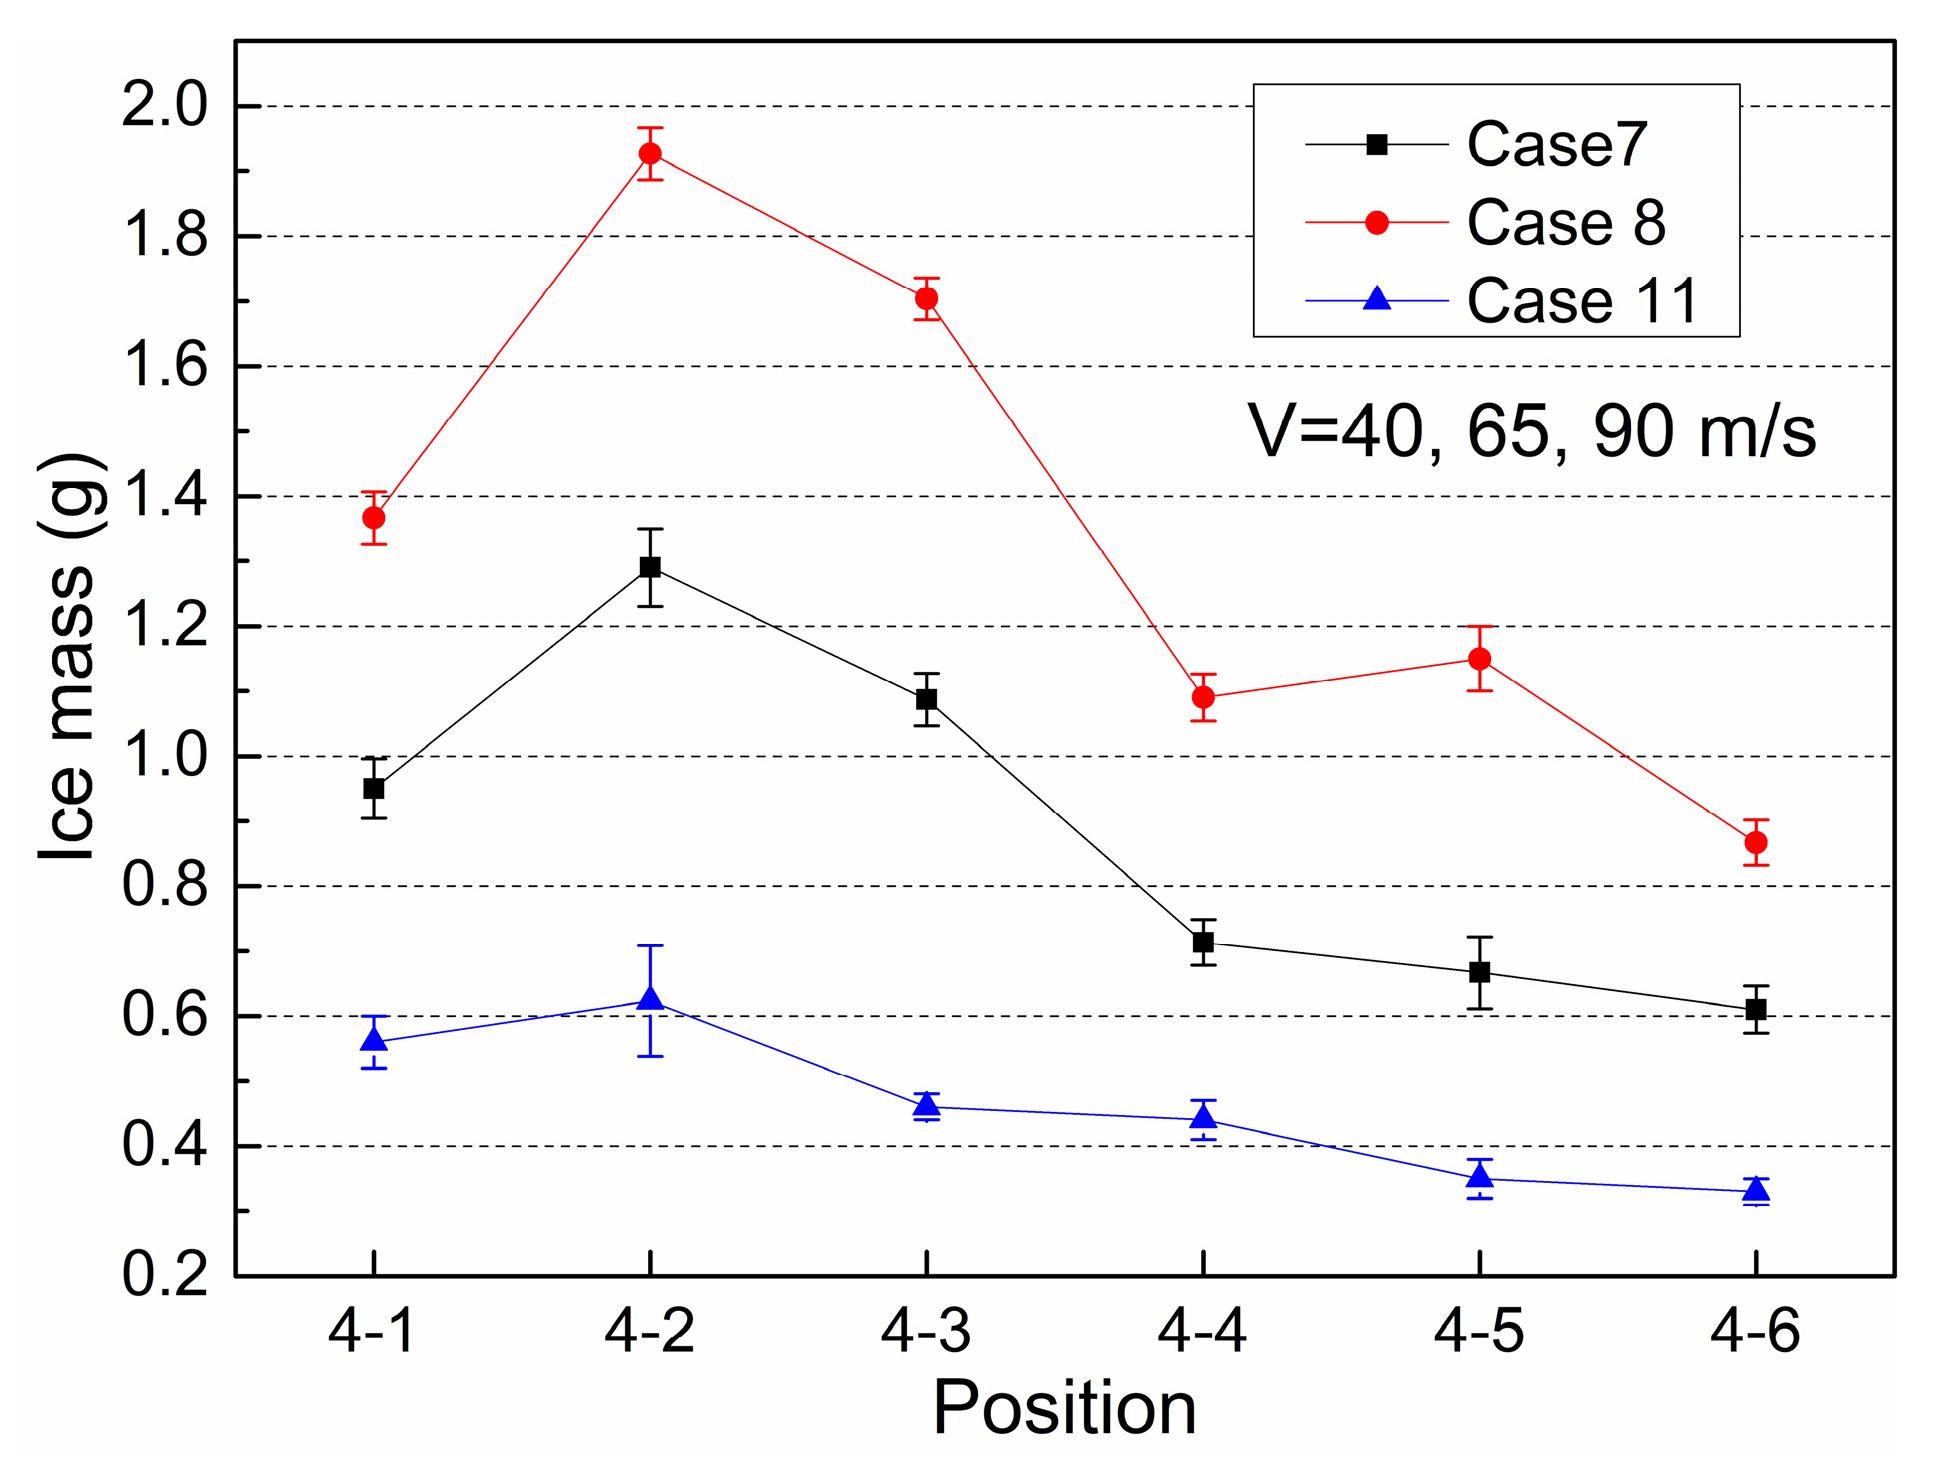
The variation of the incoming flow parameters has certain impacts on the distribution of icing mass on the nose surface, with angle of attack and velocity being the most significant influencing factors. For the six probe positions on Section 4, the distribution of icing mass at Positions 4-1 to 4-6 in Cases 11, 7 and 8 is given in Figure 19, where the velocities of the three cases are 40, 65 and 90 m/s respectively, and the other parameters are completely the same. It can be seen that as the airflow speed gradually increases, the icing mass at each position increases simultaneously, with slightly different changes. The maximum increment is 1.3 g at Position 4-2, and the minimum increment is 0.55 g at Position 4-6. Overall, the variation in flow velocity can significantly increase the amount of ice formation at each sensor position, but will not affect distribution trend of the icing mass on the nose surface, in other words, it will not change the size relationship between adjacent probes of the same cross-section.
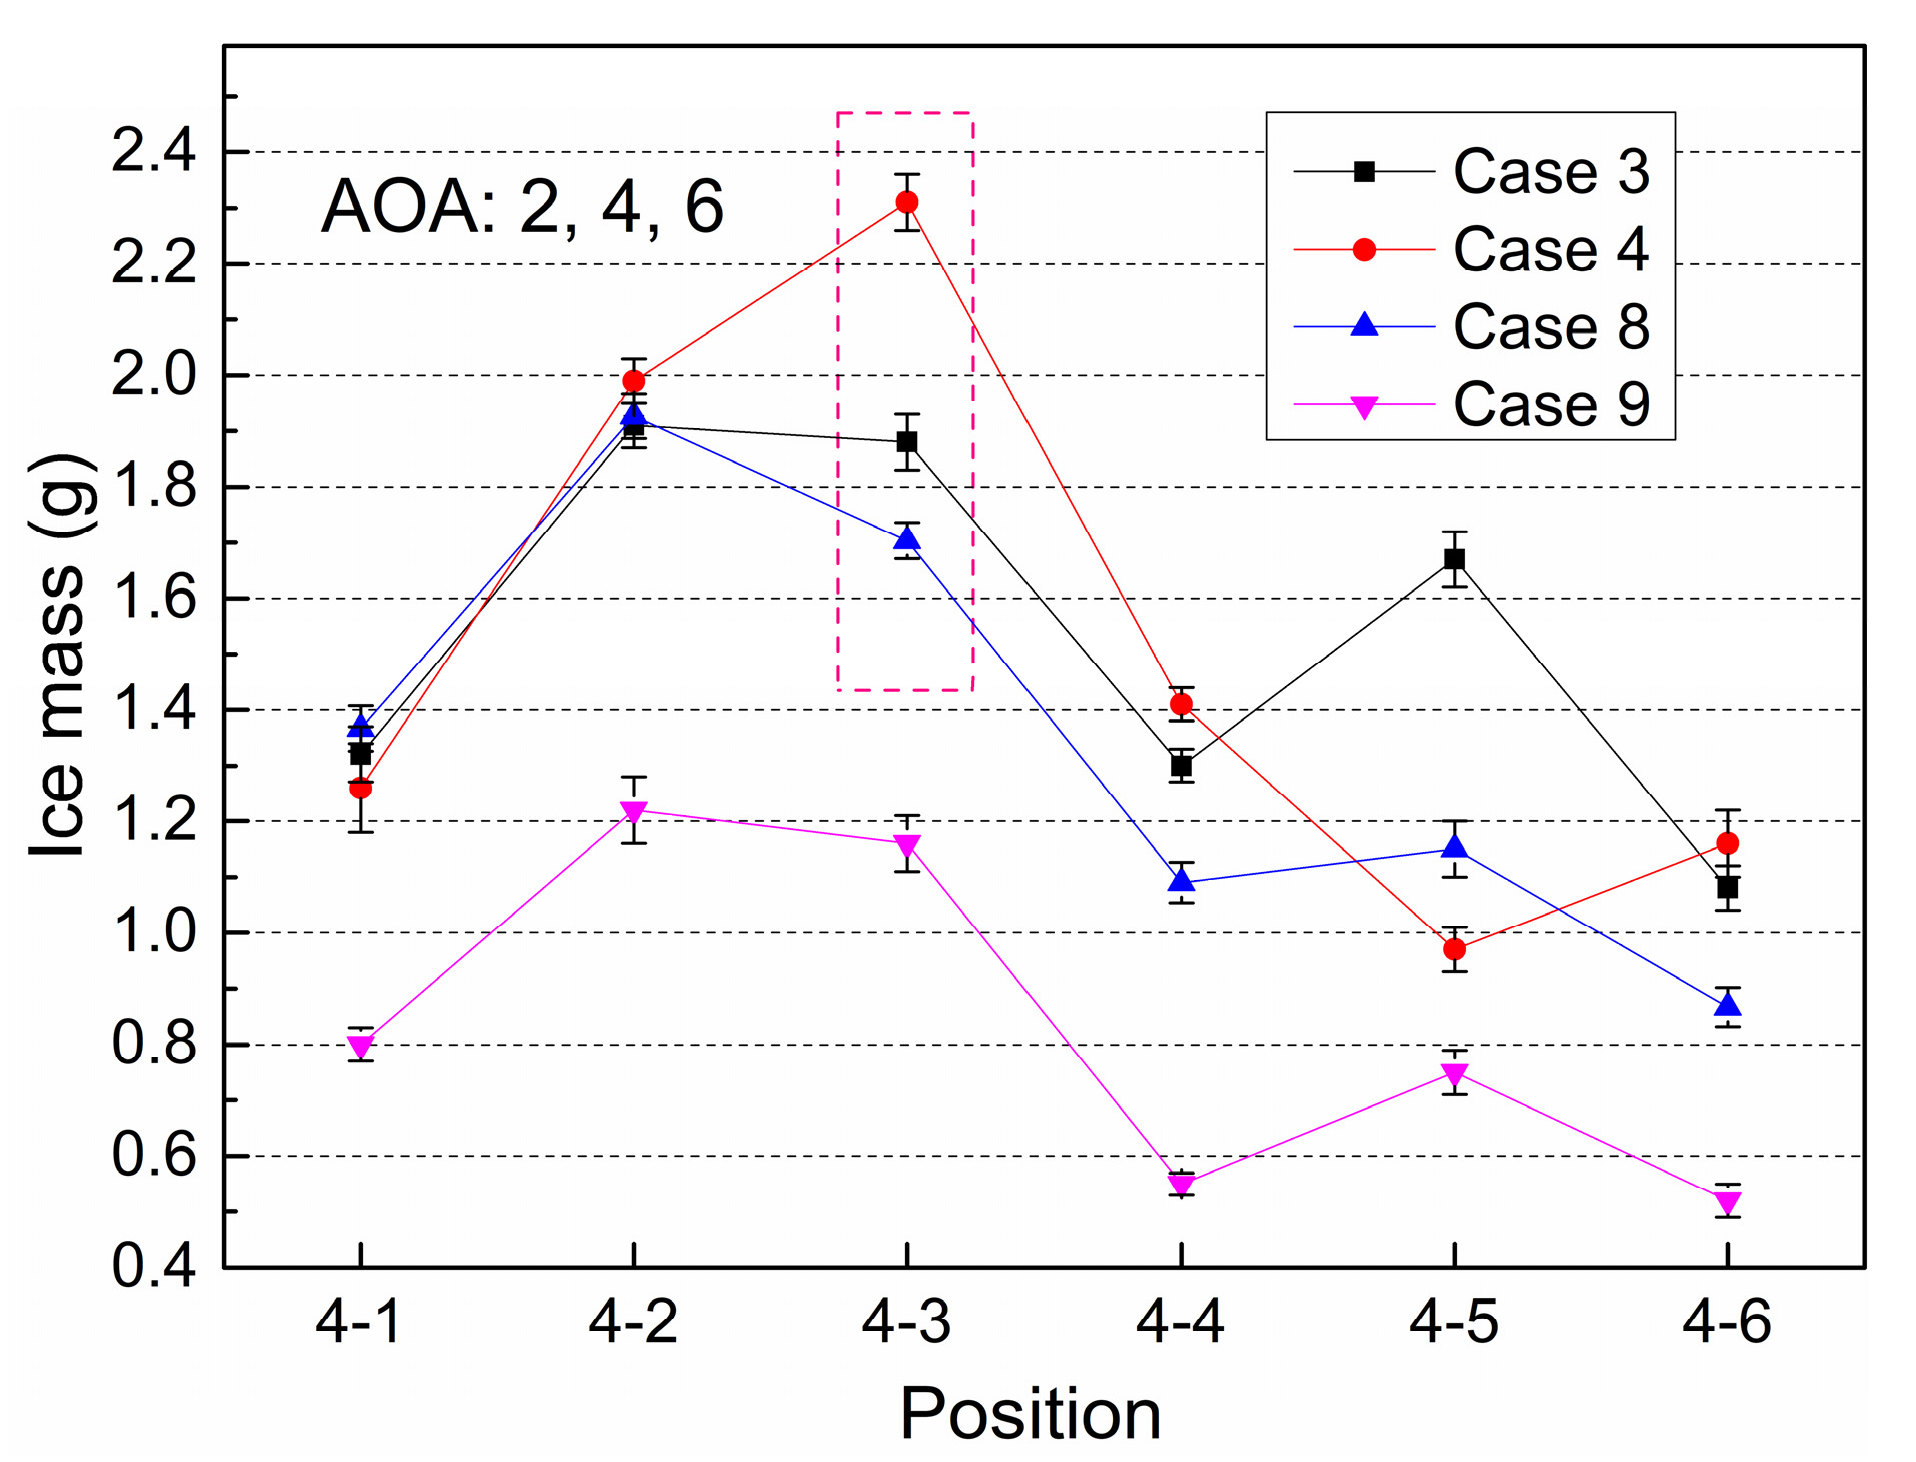
On the other hand, the distribution of icing mass at Positions 4-1 to 4-6 in Cases 3, 4, 8 and 9 is presented in Figure 20, where the attack angles of Cases 8, 3 and 4 are 2°, 4° and 6° respectively. The other environmental parameters of the three cases are completely the same, meeting the single variable principle. Case 9 is the control group, which has the same attack angle as Case 8 (2°). As the angle of attack gradually increases, the ice mass changes very little (less than 0.1 g) at Positions 4-1 and 4-2 in the top area of the nose, while the ice mass at Positions 4-3, 4-4, 4-5 and 4-6 in the side and bottom areas of the nose changes to different degrees: the mass at Positions 4-3, 4-4 and 4-6 gradually increases, while the mass at Position 4-5 first increases and then decreases, with significant fluctuations. Overall, the variation in angle of attack has a significant impact on the icing mass distribution of the nose surface, with marked changes in the size relationship between adjacent probes of the same cross-section. In addition, the insensitivity of the ice accretion at Position 4-2 to the change in attack angle is also one of the reasons why it becomes the global optimal position, which is consistent with the conclusion drawn from the previous analysis.

6. Conclusions

An experimental study on ice detection optimization was conducted by using a large-scale icing wind tunnel to simulate real flight conditions, with a closed-loop test method including the typical condition selection, sensor array interference examination and ice shape repeatability verification proposed. The real-time images, icing shapes and icing mass data were recorded to reveal the characteristics and influencing laws of ice accretion on the aircraft nose surface probes intuitively and quantitatively. Conclusions could be drawn as follows.
(a)
Under rime ice conditions, the water collection coefficient on the probe surface first increases and then decreases from the bottom, reaching the extreme value at a certain position. The height of the extreme points varies with different installation positions.
(b)
As the boundary layer on the wall develops gradually along the flow direction, the closer the sensor probe is installed downstream of the airflow, the higher the axial position of the water collection extreme point, which has a variation range of 2~30 mm. Improper design will cause the sensor probe to fail to capture the point with the maximum icing thickness, affecting the sensitivity of icing detection.
(c)
The original location of the sensor has relatively low icing mass and is not the optimal installation point. The local optimal positions for Sections 1–4 are Points 1-4, 2-4, 0-2, 3-3 and 4-2 respectively, with Points 0-2, 3-3 and 4-2 being the global optimal positions.
(d)
The change in airflow velocity significantly affects the overall icing amount, while the change in angle of attack mainly affects the distribution of ice accretion on the nose surface. The sensitivity of each probe position to changes in flow parameters varies, and the points with larger icing mass and lower sensitivity to changes in attack angle will have better detection effect.

Author Contributions

Conceptualization, L.D.; Methodology, L.D.; Software, Z.H. and X.G.; Writing–original draft, L.D.; Writing–review & editing, X.Y.; Supervision, Z.H.; Funding acquisition, X.Y. All authors have read and agreed to the published version of the manuscript.

Funding

This work was financially supported by the National Natural Science Foundation of China under Grant No. 52106001 and No. 12132019, the China Postdoctoral Science Foundation under Grant No. 2022M713865, and National Science and Technology Major Project under Grant J2019-III-0010-0054.

Data Availability Statement

Not applicable.

Conflicts of Interest

The author declares no conflict of interest.

References

  1. Lynch, F.T.; Khodadoust, A. Effects of ice accretions on aircraft aerodynamics. Prog. Aerosp. Sci. 2001, 37, 669–767. [Google Scholar] [CrossRef]
  2. Thomas, S.K.; Cassoni, R.P.; MacArthur, C.D. Aircraft anti-icing and de-icing techniques and modeling. J. Aircr. 1996, 33, 841–854. [Google Scholar] [CrossRef]
  3. Elangovan, R.; Olsen, R. Analysis of layered composite skin electro-thermal anti-icing system. In Proceedings of the 46th AIAA Aerospace Sciences Meeting and Exhibit, Reno, NV, USA, 7–10 January 2008. AIAA 2008-0446. [Google Scholar]
  4. Fortin, G.; Perron, J. Ice adhesion models to predict shear stress at shedding. J. Adhes. Sci. Technol. 2012, 26, 523–553. [Google Scholar] [CrossRef]
  5. Yamazaki, M.; Jemcov, A.; Sakaue, H. A Review on the Current Status of Icing Physics and Mitigation in Aviation. Aerospace 2021, 8, 188. [Google Scholar] [CrossRef]
  6. Ikiades, A. Fiber Optic Ice Sensor for Measuring Ice Thickness, Type and the Freezing Fraction on Aircraft Wings. Aerospace 2023, 10, 31. [Google Scholar] [CrossRef]
  7. Melody, W.; Basar, T.; Perkins, W.R.; Voulgaris, P.G. Parameter identification for inflight detection and characterization of aircraft icing. Control Eng. Pract. 2000, 8, 985–1001. [Google Scholar] [CrossRef]
  8. Gui, Y.; Zhou, Z.; Li, Y.; Xu, Y. Multiple safety boundaries for aircraft icing. Acta Aeronaut. Astronaut. Sin. 2017, 38, 520723. (In Chinese) [Google Scholar]
  9. Zheng, D.; Li, Z.; Du, Z.; Ma, Y.; Zhang, L.; Du, C.; Li, Z.; Cui, L.; Zhang, L.; Xuan, X.; et al. Design of capacitance and impedance dual-parameters planar electrode sensor for thin ice detection of aircraft wings. IEEE Sens. J. 2022, 22, 11006–11015. [Google Scholar] [CrossRef]
  10. Dong, Y.; Ai, J. Research on inflight parameter identification and icing location detection of the aircraft. Aerosp. Sci. Technol. 2013, 29, 305–312. [Google Scholar] [CrossRef]
  11. Manatbayev, R.; Baizhuma, Z.; Bolegenova, S. Numerical simulations on static Vertical Axis Wind Turbine blade icing. Renew. Energy 2021, 170, 997–1007. [Google Scholar] [CrossRef]
  12. Pasandideh-Fard, M.; Chandra, S.; Mostaghimi, J. A three-dimensional model of droplet impact and solidification. Int. J. Heat Mass Transf. 2002, 45, 2229–2242. [Google Scholar] [CrossRef]
  13. Guo, X.; Wang, Z.; Zhao, R.; Wu, Y.; Wu, X.; Yi, X. Liquid water content measurement with SEA multi-element sensor in CARDC icing wind tunnel: Calibration and performance. Appl. Therm. Eng. 2023, 235, 121255. [Google Scholar] [CrossRef]
  14. Li, Y.; Tagawa, K.; Feng, F.; Li, Q.; He, Q. A wind tunnel experimental study of icing on wind turbine blade airfoil. Energy Convers. Manag. 2014, 85, 591–595. [Google Scholar] [CrossRef]
  15. CCAR25-R4; Airworthiness Standards for Transport Aircraft. Civil Aviation Administration of China: Beijing, China, 2011. (In Chinese)
  16. Liu, H.L.; Fan, T.Y.; Xing, Y.M.; Sheng, Q. Study for spray experiment and simulation of nozzle on icing wind tunnel. Adv. Mater. Res. 2012, 490–495, 2573–2577. [Google Scholar] [CrossRef]
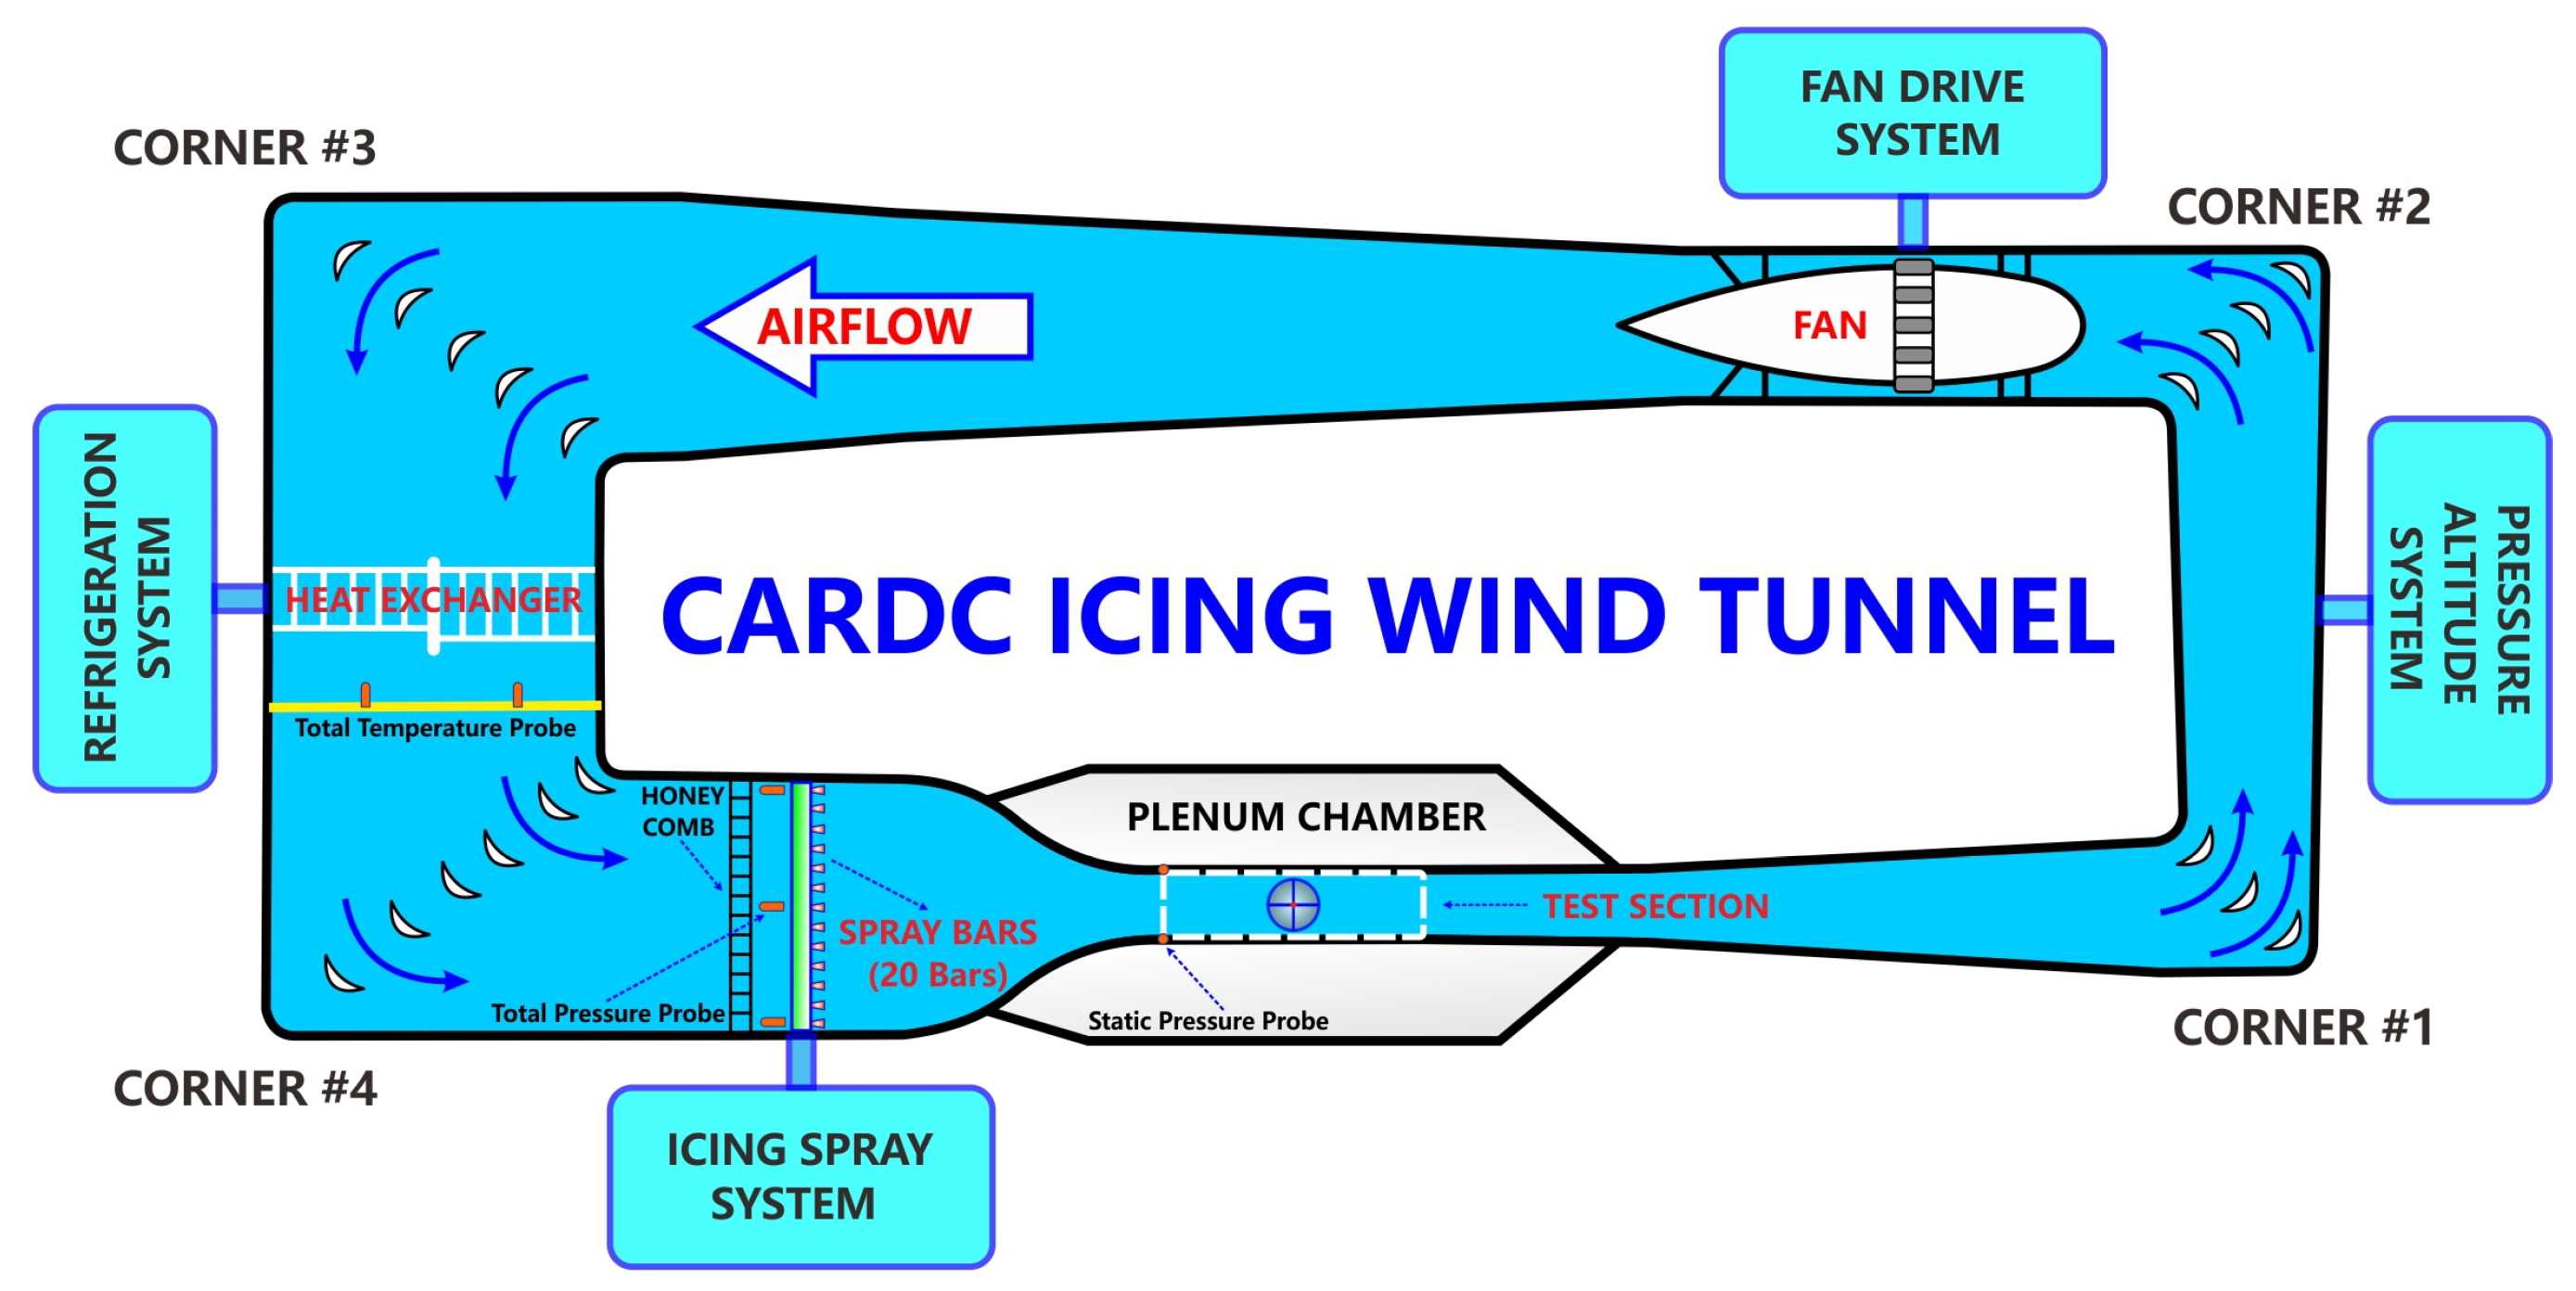
Figure 1. Layout of CARDC icing wind tunnel.
Aerospace 10 00926 g001
Figure 2. Comparison of icing test results.
Aerospace 10 00926 g002
Figure 3. Installation form of the aircraft nose in the test section.
Aerospace 10 00926 g003
Figure 4. Definition of the research sections and sensor positions.
Aerospace 10 00926 g004
Figure 5. Interference testing of the sensor array: (a) display of mutual interference between the sensor probes, (b) comparison of the interference test results, (c) final form of the sensor array.
Aerospace 10 00926 g005
Figure 6. Comparison of the ice shapes and icing mass in the repeatability test.
Aerospace 10 00926 g006
Figure 7. Overall icing characteristics of the nose surface.
Aerospace 10 00926 g007
Figure 8. Local icing properties under rime ice conditions.
Aerospace 10 00926 g008
Figure 9. Three-dimensional feature of the ice horns.
Aerospace 10 00926 g009
Figure 10. Appearance of the ice with a mixture of milky white and semitransparent areas.
Aerospace 10 00926 g010
Figure 11. Variation of the water collection characteristics along the nose surface.
Aerospace 10 00926 g011
Figure 12. Location definition and icing condition of Zone 3.
Aerospace 10 00926 g012
Figure 13. Variation of the extreme point height along the path in Zone 3.
Aerospace 10 00926 g013
Figure 14. Variation of the extreme point height along the path in Zone 4.
Aerospace 10 00926 g014
Figure 15. Typical ice shapes formed under glaze ice conditions including the general and special appearances.
Aerospace 10 00926 g015
Figure 16. Comparison of the average icing mass at different sensor positions in all sections.
Aerospace 10 00926 g016
Figure 17. Icing mass in different cases at the original and candidate positions of the sensor.
Aerospace 10 00926 g017
Figure 18. Distribution of the global optimal locations for sensor installation.
Aerospace 10 00926 g018
Figure 19. Sensitivity analysis of the installation positions to speed changes.
Aerospace 10 00926 g019
Figure 20. Sensitivity analysis of the installation positions to changes in attack angle.
Aerospace 10 00926 g020
Table 1. Environmental simulation conditions.
CaseTemperature
(℃)
Velocity
(m/s)
Attack
(°)
MVD
(μm)
Time
(s)
1−1090220180
2−1090230180
3−259042080
4−259062080
5−2565215300
6−2540215300
7−256522080
8−259022080
9−256523080
10−259023080
11−254022080
Disclaimer/Publisher’s Note: The statements, opinions and data contained in all publications are solely those of the individual author(s) and contributor(s) and not of MDPI and/or the editor(s). MDPI and/or the editor(s) disclaim responsibility for any injury to people or property resulting from any ideas, methods, instructions or products referred to in the content.