
Simulating Flight Crew Workload Settings to Mitigate Fatigue Risk in Flight Operations


1
Faculty of Transport and Traffic Sciences, University of Zagreb, 10000 Zagreb, Croatia
2
Croatian Academy of Sciences and Arts, Traffic Institute, 10000 Zagreb, Croatia
3
Croatia Airlines, 10010 Zagreb, Croatia
*
Author to whom correspondence should be addressed.
Aerospace 2023, 10(10), 904; https://doi.org/10.3390/aerospace10100904
Submission received: 22 August 2023
/
Revised: 26 September 2023
/
Accepted: 20 October 2023
/
Published: 23 October 2023
(This article belongs to the Special Issue Human Factors during Flight Operations)
Abstract
:In flight operations, the workload settings refer to the shift work, duty time, flight time, number of sectors, rest periods, time of day, duty patterns, number of time-zone transitions, number of consecutive duty days, and changes in the schedule. Workload factors, together with the biological mechanisms (the circadian rhythm, homeostatic sleep pressure, sleep inertia), can lead to the appearance of fatigue. Fatigue affects numerous tasks, such as performing inaccurate flight procedures, missing radio calls, missing or being too slow to pick up system warnings, forgetting or performing routine tasks inaccurately, and others. The focus of this paper is to determine which flight crew workload settings elements impact the appearance of fatigue. The process of collecting data regarding flight crew workload settings and fatigue is conducted on a sample of four airline pilots using an electronic CRD system of standardized chronometric cognitive tests and subjective self-assessment scales. Causal modeling tools of the IBM SPSS Statistics were used to detect correlations among flight crew workload settings, indicators of the subjective perception of fatigue, and measured fatigue indicators. In the final step, a set of simulations was created using simulation tools of the IBM SPSS Statistics to show how modifications of flight crew workload settings, such as modified duty time, number of days off, and others, can impact the level of fatigue. The obtained results can help improve the future planning of flight crew workload set-up and mitigate or prevent the appearance of fatigue in flight operations.
1. Introduction
Fatigue in flight operations can be defined as the result of personal and work-related factors [1,2,3,4]. Personal factors affecting fatigue are related to age, chronotype (morning type, evening type) [5], gender, genetic predisposition, and tolerance towards shift work. [6]. In addition to individual lifestyle regarding physical activity or inactivity, numerous factors have an effect on the length and quality of sleep [7,8], which is one the most important personal factors affecting the appearance of fatigue. In flight operations, work-related factors affecting fatigue refer to the shift work that includes early/late/night duties [9], unpredictable schedules (duties can change due to operational reasons, sickness, or other reasons), time-zone transitions, and standby duties. These factors, together with the biological mechanisms affecting periods of wakefulness and drowsiness (the circadian rhythm, homeostatic sleep pressure, sleep inertia), can lead to sleep loss and sleep debt, which incents the appearance of fatigue [10,11].
Fatigue has physical and mental manifestations. Physical manifestations include features such as a general feeling of tiredness, decreased alertness, an irresistible desire for sleep, microsleep, lethargy, and prolonged reaction time. Mental manifestations include features like difficulty with memorizing, forgetting information or actions, lack of concentration, slow understanding, bad will, poor decision-making, and apathy [12].
Long working hours, shift work, work at night, and work in different and numerous time zones—i.e., varying and unbalanced flight crew schedules can cause disturbance of the circadian rhythm and sleep disorder, which can result in the fatigue of flight crew and have an impact on the safety of flight operations [13,14,15]. Fatigue impacts various cognitive abilities, such as vigilance, memory, spatial orientation, learning, problem-solving, and decision-making. In aviation, fatigue is identified as a hazard to the safety of flight operations. Due to this, fatigue risks are continually analyzed and assessed. Due to the severity of fatigue risks, it is necessary to define and implement risk mitigation measures. Aside from provisions of the European regulations—Flight Time Limitations (FTL) [16,17], a vital role in fatigue risk mitigation belongs to the Fatigue Risk Management System (FRMS), which uses various quantification and objectivation methods for measuring the fatigue [18,19].
In flight operations, fatigue affects the tasks or situations such as performing inaccurate flight procedures, missing radio calls, missing or being too slow to pick up system warnings, forgetting or performing routine tasks inaccurately, loss of situational awareness, microsleeps, task fixations, and poor communication between crew members [12,13,14].
Flight crew workload elements that might be considered to mitigate fatigue risk in flight operations include, for example, the length of duty, total flight time, number of sectors, rest period duration, time of day, pattern of duty, rest facilities (management of sleep during layover periods), number of time-zone transitions, and number of consecutive duty days [12,20].
The first part of the paper describes the data collection and objectivation methods that are used to measure fatigue of professional airline pilots using special psychodiagnostics equipment to perform the measurements, i.e., an electronic Complex Reactionmeter Drenovac (CRD) system of standardized chronometric cognitive tests [21]. The construction of these tests is based on a chronometric (in Greek χρόνος: time, μέτρον: measure) approach to measure cognitive functions [12]. Subjective self-assessment fatigue scales of the current state of fatigue (the subjective perception of fatigue) were also used. The aim was to identify and quantify elements that affect the appearance of fatigue.
The second part of the paper presents the causal modeling methods that were used to determine correlations among defined flight crew workload settings, the subjective perception of fatigue, and measured CRD fatigue indicators. Recent studies revealed new possibilities regarding the development of predictive safety management methodology in aviation. The conceptual model of predictive safety management methodology was developed [22,23], which described the usage of predictive (forecasting) [24,25] and causal modeling methods [26,27] to identify potential and possible hazards in aviation and to efficiently define mitigation measures that can prevent or restrain future hazards from turning into adverse events. The idea was to implement described causal modeling methods to detect correlations affecting fatigue.
The third part of the paper presents simulations (case scenarios) that show the impacts of flight crew workload settings on the appearance of fatigue. Seven case scenarios were built to show how modified values of flight crew workload settings indicators, due to detected correlations, impact the appearance of fatigue. For the purpose of creating the simulations, the IBM SPSS Statistics 27 software [28] was used. Simulations revealed significant useful information regarding specific flight crew workload settings impacting the appearance of fatigue, which can be useful in the future planning of flight crew workload set-up.
Therefore, the main objective of this paper was to find specific flight crew workload settings impacting fatigue based on detected correlations among flight crew workload settings, indicators of the subjective perception of fatigue, and measured fatigue indicators. We performed the simulations in order to improve the planning process of flight crew workload set-up by mitigating or preventing the appearance of fatigue in flight operations.
2. Workload versus Fatigue in Flight Operations—Background
Fatigue Risk Management System (FRMS), as defined by the International Civil Aviation Organization (ICAO), represents data-driven methods of constant monitoring, data collecting, analyzing, and mitigating fatigue-related safety risks in flight operations, using scientific methods, previous knowledge, and operational experience [1,18,19].
In Europe, fatigue management ensures that crew members are protected from excessive fatigue levels by issuing regulations called Flight Time Limitations (FTL) [9,29]. However, restrictions on working hours are different from country to country, and in various ways, they restrict the permitted flight duty, length of rest period, and other FTL elements [16,17]. Also, the prescriptive nature of these limitations prohibits some elements of crew schedules but also allows others that can be very fatigue-inducing while all regulatory provisions are complied with at the same time. Although the European regulation—FTL [9] promotes the use of the Fatigue Risk Management System (FRMS) [1,18], it does not oblige the airlines to implement it, except in certain specific cases.
At the same time, European FTL also requires the airlines [9,12] to ensure that flight duty periods are planned in a way that enables crew members to remain sufficiently alert so that they can operate to a satisfactory level of safety to appreciate the relationship between the frequencies and pattern of flight duty and rest periods and consider the cumulative effects of undertaking long duty hours interspersed with minimum rest; to allocate duty patterns that avoid such undesirable practices as alternating day/night duties or the positioning of crew members so that a serious disruption of established sleep/work patterns occurs; and to provide rest periods of sufficient duration, especially after long flights crossing numerous time zones, to enable crew members to overcome the effects of the previous duties and to be rested by the start of the following flight duty period.
Another example is USA regulations pertaining to Fatigue Risk Management Systems (FRMS) for aviation safety, which are issued by the Federal Aviation Administration (FAA). Fatigue Risk Management Systems are prescribed to ensure aviation industry personnel perform their duties safely. Information is provided regarding the components of an aviation FRMS and FRMS implementation within the aviation system, and it defines an FRMS as an operator-specific process, i.e., while all FRMSs have common elements, the specifics can be tailored to a certificate holder’s particular conditions. Detailed guidance on how to prepare for the FRMS approval process, develop the required documentation, develop and apply fatigue risk management and safety assurance processes, collect and analyze data, and develop flight crew FRMS operations procedures is also available [30].
The most commonly used measurement methods of flight crew fatigue in any FRMS include subjective fatigue scales (e.g., Samn Perelli, Karolinska), psychomotor vigilance tests, actigraphy, predictive models (biomathematical algorithms), and sleep diaries [12,19,31].
An important source of data for fatigue research, especially in flight operations, is subjective fatigue scales used in fatigue-related reporting [1]. The application of subjective scales in flight crew fatigue research can be found in numerous studies where pilots reported subjective fatigue levels using the Samn Perelli scale, such as research conducted by Powell and others in 2007 and 2008 [32,33]. Some studies involved actigraphy, sleep diaries, performance vigilance tests, and biomathematical predictive models where fatigue impact was studied using different quantification methods, such as research conducted by Powell and others in 2014, Gander and others in 2014, Van den Berg and others in 2015 [34,35,36]. Predictive models can be found in advanced crew management software, and they can warn flight crew planners on the existence of fatigue risk (usually with warning messages and/or color schemes—from green as no risk to red as high fatigue risk). Research conducted by Yi and Moochhala in 2013 showed that there is a strong correlation between certain biomarkers in saliva and fatigue levels [37]. In addition to the objectivation methods of quantifying the flight crew fatigue, cognitive abilities that deteriorate as fatigue increases, can be measured with a chronometric approach of measuring cognitive functions, i.e., an electronic CRD system of standardized chronometric cognitive tests, as per Drenovac in 2009 [38]. CRD series have been used in various studies since 1969 [38]. Instruments, methodology, measuring parameters, and other information are well explained and documented in the CRD handbook [38]. The CRD series has been used to study psychomotor disturbances of scuba divers, as per Petri in 2003 [39], and other studies showed differences between the working ability of the driver, train operator, and dispatcher during day and night shift [40,41]. A study by Meško in 2008 showed how CRD series have been used to evaluate the psychomotor abilities of military pilots [42], and some older research showed how CRD series have been used to study workload and work efficiency during certain periods [43,44]. Recent research includes several innovative approaches, such as determining sleeping patterns of flight attendants during the off-duty period using a photovoice technique, conducted by Laovoravit and others in 2019 [45]; studying new tools for use by pilots and the aviation industry to manage risks pertaining to work-related stress and wellbeing, performed by Cahill and others in 2020 [46]; analyzing aircraft pilots workload using Heart Rate Variability (HRV) and the NASA Task Load Index questionnaire, presented by Alaimo and others in 2020 [47]; applying multimodal analysis of eye movements and fatigue in a simulated glass cockpit environment, conducted by Naeeri and others in 2021 [48]; studying work type influence on air traffic controllers’ fatigue based on data-driven PERCLOS detection, conducted by Zhang and others in 2021 [49]; identifying pilots’ fatigue status based on functional near-infrared spectroscopy, conducted by Pan and others in 2022 [50]; examining fatigue during long-haul flights of different crew compositions under exemption from layover and flight time during COVID-19, conducted by Zhou and others in 2022 [51]; studying factors impacting fatigue among collegiate aviation pilots, conducted by Keller and others in 2022 [52], and examining fatigue, work overload, and sleepiness on a sample of commercial airline pilots, presented by Alaminos-Torres and others in 2023 [53].
Recently, various studies were conducted regarding fatigue-risk issues related to flight operations. In order to detect and reduce fatigue risks in flight operations, various measurement and analysis methods have been presented in the last decade.
In 2014, Borghini and others reviewed the neurophysiological measurements in pilots/drivers during their operational tasks, with the objective of summarizing the main neurophysiological findings regarding the measurements of the pilot/driver’s brain activity during their performance and its connection with the mental workload, mental fatigue, or situational awareness [54]. In 2015, Thomas and others collected physiological and performance data from commercial flight crews performing simulated operations under both rested and fatigued conditions in order to evaluate the effects of varying levels of fatigue and workload on pilot performance and physiological responses and constructed a statistical/machine learning model that was able to accurately categorize fatigue-related data for each individual pilot [55]. In 2018, Lee and Kim proposed a fatigue model for airline pilots, which verified that pilot physical fatigue, mental decline, and rest defects are affected by seven factors: flight direction, crew scheduling, partnership, aircraft environment, job assignment, ethnic difference, and hotel environment [56]. In 2020, Hu and Lodewijks explored effective non-invasive methods and psychophysiological indicators for detecting and monitoring fatigue in car drivers and aircraft pilots [57]. Papanikou and others studied the neuroscientific methodology able to yield markers of subtle pilot states, such as drowsiness and microsleep episodes, that can be integrated into a decision support system for operational aviation settings [58]. Coombes and others gathered and presented data on reported rates of occurrence and predicted fatigue risk exposure associated with UK airline pilot work schedules [59]. In 2021, Qin and others studied approaches for mental fatigue detection based on psychophysiological measurements in flying-relevant environments by performing an experiment where several conventional heart rate variability and ocular indices were examined to study their relevance to mental fatigue [60]. In 2022, Bongo and Seva studied the effect of fatigue in air traffic controllers’ workload, situational awareness, and control strategy by performing a case study in an actual tower control center in the Philippines, using questionnaires based on situational awareness methods, the Samn-Perelli fatigue scale, and the visual attention self-report [61]. In 2023, Sun and others used a software model as an analysis tool for pilot’s fatigue risk prediction, as well as the fatigue self-assessment scale and the objective alertness test, to conduct a comprehensive analysis and an assessment of the fatigue risk of flight crews before and after the COVID-19 epidemic [62]. Hamann and Carstengerdes performed an experiment where mental fatigue was induced during a simulated flight task, and data were collected from the participants using concurrent electroencephalography (EEG)—functional Near-Infrared Spectroscopy (fNIRS) assessment methods, and the performance and self-reports, with the aim of determining valid physiological assessment measures [63]. Veksler and others integrated a biomathematical fatigue model with a task network model in order to estimate the pilot performance degradation and to provide real-time information on pilot fatigue and the expected performance on specific aircraft operations [64].
It is evident from the literature overview regarding fatigue-risk issues in flight operations that various measurement and analysis methods to address fatigue have been presented and used in the last decade. It is also evident that the application of causal modeling and simulation techniques in this research field is not adequately explored or implemented.
In order to find correlations among various sets of indicators, causal modeling techniques and methods are used in this study. These methods use datasets of collected data and build causal models that show correlations among them. Using causal models, specifically by detecting the correlations (impacts among variables), it can be learned which variables should be modified to obtain the desired performance of targeted indicator(s). In this case, the targeted indicator is the fatigue indicator—fatigue index. Various studies described causality and its variations, including the causal time-series analysis [65,66,67], causes and origins of human error [68], assumptions and methods turning observations into causal knowledge [69], the human perception of the relation between cause and effect [70], the role that human factors play in major aviation accidents [71], the use of causal models to control and manage aircraft accident risks [72], and the graphical causal models that can provide a powerful tool for detecting interrelations between variables [73]. Recent studies showed how causal modeling methods can be used to identify causal relations among aviation hazards to define efficient mitigation measures to prevent or restrain future hazards from turning into adverse events [23]. This methodology can be applied to the issue at hand since fatigue in flight operations is considered to be one of the most significant aviation hazards.
As per described background on the research related to the impact of fatigue in flight operations, the focus of this paper is to use multiple methods, i.e., objectivation methods such as CRD tests and subjective self-assessment fatigue scales to collect necessary data on flight crew workload and fatigue, the causal modeling methods to detect correlations among defined indicators in the observed dataset of collected data, and the simulation methods to simulate flight crew workload settings impact on the fatigue, in order to define the improved measures to mitigate fatigue risk in flight operations.
3. Data Collection and Methods
This chapter describes the process of data collection regarding flight crew workload settings and fatigue using objectivation methods, i.e., an electronic CRD system of standardized chronometric cognitive tests and subjective self-assessment fatigue scales that capture the subjective perception of fatigue by the flight crew. The collected data were used to create a comprehensive database of independent and dependent variables, i.e., indicators of workload settings (number of days off, flight time, duty time), indicators of the subjective perception of fatigue (energy level, anxiety level), and measured CRD fatigue indicators (mental processing speed, mental stability, reliability, fatigue). Detecting correlations among flight crew workload settings, subjective self-assessments, and fatigue indicators was conducted using the defined dataset of collected data and the causal modeling tools available in the IBM SPSS Statistics software. Simulations (case scenarios) of flight crew workload settings impacting the appearance of fatigue were also conducted using the simulation tools of IBM SPSS Statistics software.
3.1. Collecting Data on Flight Crew Fatigue
The data collected for this study were obtained using an electronic CRD system of standardized chronometric cognitive tests and subjective self-assessment fatigue scales that capture the subjective perception of fatigue by the flight crew.
This study included measurements that were conducted anonymously with four male pilots of an average age of 42 years (+/−two years), who have been professional airline pilots for the last 11 years (standard deviation of 4.7 years) and have an average of 6.305 flight hours (standard deviation of 2.532 flight hours) [29]. The pilots were familiarized with the measurement method (the process and dynamics of the study) and the measuring CRD equipment and tests to be used. Pilots had to go through the training before taking the actual tests to avoid the effect of learning how to do the tests because the study aimed to measure the drop in mental potential due to fatigue.
Measurements, during which pilots completed a full set of tests (five CRD tests) and filled out four subjective surveys (self-assessment tables regarding emotional state, energy level, self-confidence, and anxiety level), were performed before or after the duty period. Tests were performed in an improvised “CRD laboratory” in the room of their base airport, where pilots checked in and checked out (pre-flight and post-flight duty). The average duration of testing on the CRD equipment lasted about 15 min [12]. The CRD tests included the CRD 13 test—Spatial visualization test, CRD 241 test—Identifying progressive series of numbers, CRD 23 test—Complex convergent visual orientation, CRD 324 test—Actualization of short-term memory, and CRD 422 test—Operative thinking with sound stimuli.
The task design in the CRD tests is based on measuring the reaction time using CRD measuring instruments [38]. These tests are intended for the chronometric measurement of the effectiveness of achieving mental and psychomotor functions and for determining dynamic features and functional disturbances in the process of mental processing [38]. The efficiency of solving tasks in the CRD tests (output/results) is recorded by CRD fatigue indicators expressed in time (milliseconds).
Independent variables of the collected data represent elements of workload settings, which are described in the following Table 1. For the purpose of detecting correlations among all variables, the independent variables (indicators) are designated with the labels, i.e., “Time of day” is X1, “Start or end of the shift” is X2, “Number of days off in the previous 7 days” is X3, “Number of days off in the previous 28 days” is X4, “Number of individual days off in the previous 28 days” is X5, “Rest length” is X6, “Local night in daily rest” is X7, “Number of local nights in the 48 h before flight duty” is X8, “Changes in the schedule” is X9, “Sectors in the previous 7 days” is X10, “Sectors in the previous 28 days” is X11, “Flight time in the previous 7 days” is X12, “Flight time in the previous 28 days” is X13, “Duty time in the previous 7 days” is X14, “Duty time in the previous 28 days” is X15, and “Multi-day shifts” is X16.
Overall measurements included seven more independent variables in the group “Individual flight duty,” namely, “Flight duty time,” “Duty time,” “Flight time in flight duty,” “Average duration of a sector,” “Average duration of aircraft ground handling,” “Split duty,” and “Change of aircraft during FDP.” For the purpose of detecting correlations in the defined dataset, these variables were excluded due to the fact that the obtained values were constant, i.e., equal to 0, or there were too many missing values for the data to be relevant or usable.
The results of the CRD measurement are called “CRD measures” or “CRD fatigue indicators.” They are considered to be dependent variables, and they include the following variables: Number of errors (Nerr), total test-solving time (Ttot), minimum test-solving time (Tmin), maximum test-solving time (Tmax), total ballast (Btot), initial ballast (Bin), final ballast (Bfin), and fatigue index (Ifatigue).
The dependent variable “Number of errors” (Nerr) is an integer that indicates the number of errors, while other variables “Total test-solving time” (Ttot), “Minimum test-solving time” (Tmin), “Maximum test-solving time” (Tmax), “Total ballast” (Btot), “Initial ballast” (Bin), and “Final ballast” (Bfin) are time indicators (measured in milliseconds). “Fatigue index” (Ifatigue) is the quotient of initial ballast (Bin) and final ballast (Bfin), and it represents a derived indicator of the direction of changes in the speed (acceleration or deceleration) of solving tasks in a particular test, i.e., it represents the endurance and consequently fatigue—if the values of the fatigue index are greater than 1 that indicates the presence of fatigue.
The number of errors (Nerr) shows the accuracy of mental processing, i.e., it shows the coordination between speed and accuracy in mental processing—lower values indicate a higher accuracy and vice versa. Total test-solving time (Ttot) measures the total time for solving a particular test (includes ballast—part of lost time due to the effect of systematic and random factors on the speed of performing a certain mental activity)—lower values indicate a higher level of efficiency and vice versa. Minimum test-solving time (Tmin) measures the speed of mental processing, i.e., the shortest task-solving times in individual tests—lower values indicate a higher level of efficiency and vice versa. Maximum test-solving time (Tmax) measures processing speed, i.e., the longest time to solve a particular task, i.e., an extremely long time to solve one or more tasks in a certain test—lower values indicate a higher level of efficiency and vice versa. Total ballast (Btot) measures total lost time due to the fluctuations in the speed of solving similar tasks in the individual tests and represents the stability of mental processing, i.e., it is an indicator of individual stability as a dynamic feature of mental processing—lower values indicate greater stability and vice versa. Initial ballast (Bin) represents working speed or starting ballast—in the first half of the test, it contains information on the efficiency or interference of working. Final ballast (Bfin) represents fatigue, i.e., it contains information about the transfer of the experience from the initial to the final part of the test.
For the purpose of detecting correlations among all variables, the dependent variables (indicators) are designated with the labels, i.e., “Number of errors” is Nerr, “Total test-solving time” is Ttot, “Minimum test-solving time” is Tmin, “Maximum test-solving time” is Tmax, “Total ballast” is Btot, “Initial ballast” is Bin, “Final ballast” is Bfin, and “Fatigue index” is Ifatigue.
Table 2 shows the overview of dependent variables, including the full name of each CRD fatigue indicator, the label, the short description, and the meaning.
The results of the subjective self-assessment fatigue scales capture the subjective perception of fatigue by the flight crew. Variables of subjective self-assessments represent subjective results of self-assessments regarding the emotional state, energy level, self-confidence, and anxiety level. Variables of subjective self-assessment scales are considered to be both independent and dependent variables, and they are outlined in Table 3. Self-assessment of the emotional state is labeled S1, self-assessment of the energy level is labeled S2, self-assessment of self-confidence is labeled S3, and self-assessment of the anxiety level is labeled S4.
An example of a subjective self-assessment scale of the energy level contains a ranking from 1 to 10, as shown in Table 4, where the rank is the worst for 1 and the best for 10.
All collected data on flight crew fatigue, independent and dependent variables obtained using the described objectivation methods (CRD tests), are presented in Appendix A.
3.2. Defining Correlations among Flight Crew Workload Settings, Subjective Perception of Fatigue, and Fatigue Indicators Using Causal Modeling Methods
Identifying correlations among flight crew workload settings, subjective self-assessments, and fatigue indicators (collected via CRD testing and subjective self-assessment scales) opens up the possibility of improving the planning process of flight crew workload set-up in flight operations and mitigating the risk of fatigue. To find the correlations between the flight crew workload settings indicators, subjective self-assessments (the perception of fatigue), and fatigue indicators, we used the causal modeling methods, i.e., temporal causal modeling of the IBM SPSS Statistics software.
The analytics software called “IBM SPSS Statistics” [28] was used to analyze all data in the observed datasets and create causal models with causal links (correlations) among all variables (indicators) in the observed dataset. For the purpose of this study, the IBM SPSS Statistics 27 version of the software was used.
Prior to creating causal models, the dataset intended for an analysis had to be prepared adequately. The causal model was created using the function called “Create Temporal Causal Model” of the IBM SPSS Statistics 27. The Temporal Causal Model (TCM) detects causal links among all indicators (variables) in the observed dataset, in this case among flight crew workload settings, subjective self-assessments, and fatigue indicators, and presents them in the circular diagram or via the impact diagrams.
The causal model of flight crew workload settings, subjective self-assessments (the perception of fatigue), and fatigue indicators, accompanied by the individual impact diagrams of the targeted indicator (fatigue index), is presented in the following tables and figures.
Table 5 shows all indicators in the observed dataset, with their labels, names, and allocated roles.
The dataset used for this study included 135 entries for 16 indicators of the workload settings (Xs), four indicators of the subjective self-assessments (Ss), and eight measured CRD indicators of mental processing, i.e., the fatigue indicators. The entire dataset is presented in Appendix A.
The setup was made in such a way that the independent variables, i.e., workload settings indicators (Xs), are set to be “inputs” in the temporal causal model, and dependent and independent variables, i.e., Ss and the fatigue indicators are set to be “both inputs and targets”.
Table 6 shows the fit statistics for top causal models generated for each of the twelve dependent indicators, obtained using the IBM SPSS Statistics function “Create Temporal Causal Modeling.” The model quality (model fit) for all built models is evaluated using the R-squared criterion, which is defined as the proportion of the variation in the dependent variable that is predictable from the independent variable or variables. Various criteria can be used to do the “best fit” evaluation (RMSE—Root Mean Squared Error, RMSPE—Root Mean Squared Percent Error, AIC—Akaike Information Criterion, BIC—Bayesian Information Criterion, R-squared). In this case, the R-squared is used, as it is the default criterion in the software. The larger the R-squared value, the better the model.
Figure 1 shows the “overall model quality”, i.e., the distribution of model quality for all built models (from the preceding Table 6). As per Figure 1, models show high quality because 75% of the models have R-squared values in the top interval [0.75–0.88], with the highly positive overall evaluation of the model fit using the R-squared criterion (whose values range from 0.70 to 0.87).
Figure 2 shows the overall causal model system of all correlations among flight crew workload settings, subjective self-assessments (the perception of fatigue), and CRD fatigue indicators obtained using causal modeling functions of the IBM SPSS Statistics 27 “Temporal Causal Modeling.” Straight lines show correlations in both ways (cause and effect), and one-direction arrow lines show correlations in only one way (either cause or effect). The line’s weight indicates a stronger or weaker correlation.
Figure 3 shows direct impacts on the targeted indicator Ifatigue, i.e., the fatigue index. Figure 3a shows correlations (links) with a statistical significance value less or equal to 0.05 (strong links), while Figure 3b shows all detected correlations (links) on Ifatigue. As per these results, Ifatigue correlates strongly with one workload indicator, i.e., X10—Sectors in the previous 7 days, and a medium-strong correlation with six other workload settings indicators, namely X5—Number of individual days off in the previous 28 days, X6—Rest length, X7—Local night in daily rest, X9—Changes in the schedule, X15—Duty time in the previous 28 days, and X16—Multi-day shifts. Also, this model reveals a strong correlation with one CRD fatigue indicator, i.e., Tmin—Minimum test-solving time.
Figure 4 shows an impact diagram of all indicators causing Ifatigue, i.e., Fatigue index. These include X1—Time of day, X2—Start or end of the shift (Check In/Check Out—CI/CO), X5—Number of individual days off in the previous 28 days, X6—Rest length, X7—Local night in daily rest, X9—Changes in the schedule, X10—Sectors in the previous 7 days, X15—Duty time in the previous 28 days, X16—Multi-day shifts, S2—Energy level, S4—Anxiety level, Nerr—Number of errors, Tmin—Minimum test-solving time, Tmax—Maximum test-solving time, and Bin—Initial ballast.
Figure 5 shows the impact diagram of all indicators affected by Ifatigue, i.e., fatigue Index. These include S1—Emotional state, S2—Energy level, S3—Self-confidence, S4—Anxiety level, Nerr—Number of errors, Ttot—Total test-solving time, Tmin—Minimum test-solving time, Tmax—Maximum test-solving time, Btot—Total ballast, Bin—Initial Ballast, and Bfin—Final Ballast.
As previously mentioned, this part focused on finding the correlations among flight crew workload settings, subjective perception of fatigue, and CRD fatigue indicators, with special attention to workload settings impacting fatigue. Using causal modeling techniques, correlations have been detected. Figure 6 shows all the detected correlations with specific emphasis on correlations regarding workload settings, i.e., ones labeled with Xs. The reason why these are of particular interest is because they represent the independent variables susceptible to modification. Hence, finding specific indicators of workload settings that impact flight crew fatigue (Ifatigue) opens up the possibility of modifying them in order to mitigate fatigue risk. In Figure 6, strong links are marked in red squares, and medium-strong are marked in orange squares. The indicators marked in yellow show existent but weak links and were not further examined.
3.3. Case Scenarios of Workload Settings Impacting Flight Crew Fatigue—Simulation Methods
By applying the temporal causal model created and presented in Section 3.2. (Figure 2 and Figure 6), it can be detected which indicators of the observed dataset should be modified in order to obtain desired levels in the targeted indicator, in this case, the fatigue index (Ifatigue).
Functions from IBM SPSS Statistics 27 were used for the purpose of simulating flight crew workload settings to mitigate fatigue by creating case scenarios for each relevant indicator of flight crew workload settings. Tools used include the functions called “Apply Temporal Causal Model,” “Forecasting using Temporal Causal Model,” and “Run Scenarios.” Simulations show how values of chosen workload settings indicators (in this case, the seven most relevant workload settings indicators) affect the behavior of the CRD fatigue indicator, i.e., Fatigue index (Ifatigue).
Hence, seven simulations (case scenarios) were built to show how modified values of workload settings indicators (lower or higher than observed values), due to detected correlations, impact the behavior of CRD fatigue indicator, i.e., fatigue index (Ifatigue).
4. Results
As explained previously, the fatigue index (or Ifatigue in the dataset) is the quotient of the initial ballast (Bin) and final ballast (Bfin). It represents a derived indicator of the direction of changes (an acceleration or a deceleration) in the speed of solving tasks in a particular test, i.e., it represents the endurance and consequently fatigue—if the values of the Fatigue index are greater than 1 that indicates the presence of fatigue.
Workload settings indicators that were the subject of examination are X5—Number of individual days off in the previous 28 days, X6—Rest length, X7—Local night in daily rest, X9—Changes in the schedule, X10—Sectors in the previous 7 days, X15—Duty time in the previous 28 days, and X16—Multi-day shifts. These were examined because they show a strong correlation with the fatigue index (Ifatigue) indicator, detected by the temporal causal model, as per 3.2.
This part shows simulations (case scenarios) conducted to find how each workload settings indicator impacts the fatigue indicator (fatigue index—Ifatigue). All simulations were conducted in the software IBM SPSS Statistics 27.
Hence, all case scenarios (simulations) intend to establish whether a given modification of workload settings indicators decreases the values of the fatigue index (Ifatigue), i.e., keeps them at or below 1. The modification of workload settings indicators includes modifying eight chosen points (results/entries from the used dataset) into increased or decreased values. Case scenarios (simulations) also allow predicting seven points into the future, i.e., they can show the future behavior of the targeted indicator based on the established correlations and given workload settings’ modifications. Comparing the observed and simulated values of the fatigue index by applying the defined correlations and modified values of the workload settings’ indicators clearly shows the differences between them and helps determine the desired values of workload settings that can be used to mitigate fatigue risk in the future. Additionally, to confirm that the simulated values follow the results of each case scenario, the simulations of how workload settings indicators impact two related fatigue indicators, i.e., initial ballast (Bin) and final ballast (Bfin), are also conducted and used for the comparison with the simulated fatigue index (Ifatigue) values.
4.1. Case Scenario 1—Impact on Fatigue Due to Increase of Workload Settings Indicator—Number of Individual Days off in the Previous 28 Days
This case scenario shows the simulation of increasing workload settings indicator, X5—Number of individual days off in the previous 28 days, and its impact on the fatigue indicator Ifatigue—Fatigue index (Figure 7). Figure 7a shows the observed values of X5 and modified (increased) values of X5 by 3 extra days off (X5′ = X5 + 3), while Figure 7b shows how the change in X5 impacts the values of the fatigue indicator Ifatigue. Figure 7b, or the case scenario graph, shows one line and three curves. The red line represents the borderline between the rested state and fatigue. The values above the red line represent the presence of fatigue and vice versa. The blue curve shows the observed values of the fatigue indicator Ifatigue—fatigue index. The green curve shows the original forecast values of Ifatigue obtained by applying the defined causal links between X5 and Ifatigue. The pink curve shows the simulated values (case scenario values) of Ifatigue’, obtained by applying the defined causal links between X5 and Ifatigue to the modified values of workload settings indicator X5. A comparison of the green and pink curves shows direct differences between different values of workload settings indicator X5.
Table 7 shows the observed values of the workload settings indicator, X5—Number of individual days off in the previous 28 days, the modified observed values of X5 or X5′, the observed and original forecast values of the fatigue index (Ifatigue), and the simulated values (case scenario) of the fatigue index (Ifatigue’) obtained by applying the defined causal links between X5 and Ifatigue. It can be observed that by comparing these values (from point 1 to point 7 of the forecasted values part in Table 7), the results show that fatigue (Ifatigue’) decreases due to an increase in workload settings indicator X5—Number of individual days off in the previous 28 days.
Figure 8 shows how the simulation of increasing workload settings indicator, X5—Number of individual days off in the previous 28 days, impacts two related fatigue indicators, i.e., initial ballast (Bin) and final ballast (Bfin), which are used to calculate the fatigue index. Figure 8a shows the impact of a modified X5 on Bin, and Figure 8b shows the impact of a modified X5 on Bfin. This is conducted to confirm that these values follow the results of the case scenario simulating the impact of workload settings indicator X5 on the values of the fatigue indicator Ifatigue, as per the previous Figure 7b.
Table 8 shows a comparison of the observed values of the workload settings indicator, X5—Number of individual days off in the previous 28 days, the modified observed values of X5, i.e., X5′, the observed and original forecast values of the fatigue index (Ifatigue), and the simulated values (case scenario) of the fatigue index (Ifatigue’) obtained by applying the defined causal links between X5 and Ifatigue, the observed values of initial ballast (Bin) and final ballast (Bfin), and the simulated values (case scenario values) of initial ballast (Bin’) and final ballast (Bfin’) obtained by applying the defined causal links between X5 and Bin, and X5 and Bfin. Some of the calculated values of Bin’ and Bfin’ show negative values because the software uses incorporated formulas to calculate the forecasted values, which do not stop at 0, and there is no option to replace them, as it is evident that the initial and final ballast times cannot be less than 0. Nevertheless, these are kept because the aim was to see whether the forecasted values of the final ballast would be greater than the values of the initial ballast, which shows the presence of fatigue and vice versa. It can be observed that by comparing the values, the results show that fatigue (Ifatigue’) decreases due to an increase in the workload settings indicator X5—Number of individual days off in the previous 28 days.
Figure 9 shows two graphs. Figure 9a shows a graph with one line and two curves. The red line represents the borderline between the rested state and fatigue. The values above the red line represent the presence of fatigue (marked in the red area) and vice versa. Figure 9a shows two curves of the forecasted fatigue index (Ifatigue) values. The first curve (dotted green) shows the original forecast values of the fatigue index (Ifatigue), and the second curve (dotted pink) shows the simulated (case scenario) forecast values of the fatigue index (Ifatigue’). Figure 9b shows the case scenario curves of the initial ballast (Bin’) and final ballast (Bfin’). Higher values of Bfin’, in comparison to Bin’, as a rule, confirm the presence of fatigue. In this case, lower values of Bfin’ are observed due to an increase in X5—Number of individual days off in the previous 28 days, which indicates the absence of fatigue.
From Figure 9, it is clear that Ifatigue’ shows the decreased values of the fatigue index comparing them to the original forecast values (Ifatigue), which indicates that increasing workload settings indicator, X5—Number of individual days off in the previous 28 days, by 3 extra days off decreases the values of the fatigue index and keeps them close or below 1.
4.2. Case Scenario 2—Impact on Fatigue Due to Increase/Decrease of Workload Settings Indicator—Rest Length
For the workload settings indicator, X6—Rest length, two case scenarios were conducted, i.e., Iteration 1 and Iteration 2. The first one simulated an increase in X6, and the second one simulated a decrease in X6. Two iterations of case scenarios were performed only when the first iteration provided inconclusive results.
4.2.1. Iteration 1—Increase of Workload Settings Indicator—Rest Length
The case scenario shows the simulation of increasing workload settings indicator, X6—Rest length, and its impact on the fatigue indicator, Ifatigue—fatigue index (Figure 10). Figure 10a shows the observed values of X6 and the modified (increased) values of X6 by 30% (X6′ = X6 × 1.3), while Figure 10b shows how the change in X6 impacts the values of the fatigue indicator, Ifatigue. Figure 10b, or the case scenario graph, shows one line and three curves. The red line represents the borderline between the rested state and fatigue. The values above the red line represent the presence of fatigue and vice versa. The blue curve shows the observed values of the fatigue indicator, Ifatigue—fatigue index. The green curve shows the original forecast values of Ifatigue obtained by applying the defined causal links between X6 and Ifatigue. The pink curve shows simulated values (case scenario values) of Ifatigue’ obtained by applying the defined causal links between X6 and Ifatigue. A comparison of the green and pink curves shows direct differences for the different values of workload settings indicator X6.
Table 9 shows the observed values of the workload settings indicator, X6—Rest length, the modified observed values of X6 or X6′, the observed and original forecast values of the fatigue index (Ifatigue), and the simulated values (case scenario) values of the fatigue index (Ifatigue’) obtained by applying the defined causal links between X6 and Ifatigue. It can be observed that by comparing these values (from point 1 to point 7 of the forecasted values part in Table 9), the results show that the values of fatigue (Ifatigue’) are similar to the original forecast values due to an increase in the workload settings indicator, X6—Rest length; hence, the results are ambiguous.
Figure 11 shows how the simulation of increasing workload settings indicator, X6—Rest length, impacts two related fatigue indicators, i.e., initial ballast (Bin) and final ballast (Bfin), which are used to calculate the fatigue index. Figure 11a shows the impact of a modified X6 on Bin, and Figure 11b shows the impact of a modified X6 on Bfin. This is conducted to check whether these values follow the results of the case scenario simulating the impact of workload settings indicator X6 on the values of the fatigue indicator Ifatigue, as per the previous Figure 10b. It can be observed that the values of Bfin’ are similar to the Bin’ values, which further confirms the ambiguity.
Table 10 shows a comparison of the observed values of the workload settings indicator, X6—Rest length, the modified observed values of X6, i.e., X6′, the observed and original forecast values of the fatigue index (Ifatigue), and the simulated values (case scenario) values of the fatigue index (Ifatigue’) obtained by applying the defined causal links between X6 and Ifatigue, the observed values of the initial ballast (Bin) and final ballast (Bfin), and the simulated values (case scenario values) of the initial ballast (Bin’) and final ballast (Bfin’) obtained by applying the defined causal links between X6 and Bin, and X6 and Bfin. It can be observed that by comparing the values of Ifatigue and Ifatigue’, the results show that the case scenario fatigue (Ifatigue’) values are similar to the original forecast values (Ifatigue) due to an increase in the workload settings indicator X6—Rest length, i.e., the results are ambiguous. This is also confirmed by comparing the values of Bin’ and Bfin’, which further confirms the ambiguity.
Figure 12 shows two graphs. Figure 12a shows a graph with one line and two curves. The red line represents the borderline between the rested state and fatigue. The values above the red line represent the presence of fatigue (marked in the red area) and vice versa. Figure 12a shows two curves of the forecasted fatigue index (Ifatigue) values. The first curve (dotted green) shows the original forecast values of the fatigue index (Ifatigue), and the second curve (dotted pink) shows the simulated (case scenario) forecast values of the fatigue index (Ifatigue’). Figure 12b shows the case scenario curves of the initial ballast (Bin’) and final ballast (Bfin’). Higher values of Bfin’, in comparison to Bin’, as a rule, confirm the presence of fatigue. In this case, similar values of Bfin’ and Bin’ are observed due to an increase in X6—Rest length, which cannot confirm the presence or the absence of fatigue with certainty.
From Figure 12, it is not clear if the Ifatigue ’ values show any true change when comparing them to the original forecast values (Ifatigue), which indicates that increasing workload settings indicator X6—Rest length by 30% cannot confirm any conclusive change in the values of the fatigue index.
4.2.2. Iteration 2—Decrease of Workload Settings Indicator—Rest Length
The Iteration 2 case scenario shows the simulation of decreasing workload settings indicator, X6—Rest length, and its impact on the fatigue indicator, Ifatigue—fatigue index (Figure 13). Figure 13a shows the observed values of X6 and the modified (decreased) values of X6 by 30% (X6′ = X6 × 0.7), while Figure 13b shows how the change in X6 impacts the values of fatigue indicator, Ifatigue. Figure 13b, or the case scenario graph, shows one line and three curves. The red line represents the borderline between the rested state and fatigue. The values above the red line represent the presence of fatigue and vice versa. The blue curve shows the observed values of the fatigue indicator, Ifatigue—fatigue index. The green curve shows the original forecast values of Ifatigue obtained by applying the defined causal links between X6 and Ifatigue. The pink curve shows the simulated values (case scenario values) of Ifatigue obtained by applying the defined causal links between X6 and Ifatigue to the modified values of workload settings indicator X6. A comparison of the green and pink curves shows direct differences for the different values of workload settings indicator X6.
Table 11 shows the observed values of the workload settings indicator, X6—Rest length, the modified observed values of X6 or X6′, the observed and original forecast values of the fatigue index (Ifatigue), and the simulated values (case scenario) of the fatigue index (Ifatigue’) obtained by applying the defined causal links between X6 and Ifatigue. It can be observed that by comparing these values (from point 1 to point 7 of the forecasted values part in Table 11), the case scenario values are similar to the original forecast values due to a decrease in the workload settings indicator X6—Rest length; hence, the results are ambiguous.
Figure 14 shows how the simulation of decreasing workload settings indicator, X6—Rest length, impacts two related fatigue indicators, i.e., initial ballast (Bin) and final ballast (Bfin), which are used to calculate the fatigue index. Figure 14a shows the impact of a modified X6 on Bin, and Figure 14b shows the impact of a modified X6 on Bfin. This is conducted to confirm that these values follow the results of the case scenario simulating the impact of workload settings indicator X6 on the values of the fatigue indicator Ifatigue, as per the previous Figure 13b. It can be observed that the values of Bfin’ are similar to the Bin’ values, which further confirms the ambiguity.
Table 12 shows a comparison of the observed values of the workload settings indicator X6—Rest length, the modified observed values of X6, i.e., X6′, the observed and original forecast values of the fatigue index (Ifatigue), and the simulated values (case scenario) of the fatigue index (Ifatigue’) obtained by applying the defined causal links between X6 and Ifatigue, the observed values of the initial ballast (Bin) and final ballast (Bfin), and the simulated values (case scenario values) of the initial ballast (Bin’) and final ballast (Bfin’) obtained by applying the defined causal links between X6 and Bin, and X6 and Bfin. It can be observed that by comparing the values of Ifatigue and Ifatigue’, the results show that the case scenario fatigue (Ifatigue’) values are similar to the original forecast values (Ifatigue) due to a decrease in the workload settings indicator X6—Rest length, i.e., the results are ambiguous. This is also confirmed by comparing the values of Bin’ and Bfin’, which further confirms the ambiguity.
Figure 15a shows a graph with one line and two curves. The red line represents the borderline between the rested state and fatigue. The values above the red line represent the presence of fatigue (marked in the red area) and vice versa. Figure 15a shows two curves of the forecasted fatigue index (Ifatigue) values. The first curve (dotted green) shows the original forecast values of the fatigue index (Ifatigue), and the second curve (dotted pink) shows the simulated (case scenario) forecast values of the fatigue index (Ifatigue’). Figure 15b shows the case scenario curves of the initial ballast (Bin’) and final ballast (Bfin’). Higher values of Bfin’, in comparison to Bin’, as a rule, confirm the presence of fatigue. In this case, similar values of Bfin’ and Bin’ are observed due to a decrease in X6—Rest length, which cannot confirm the presence or the absence of fatigue with certainty.
From Figure 15, it is not clear if the Ifatigue’ values show any true change when comparing them to the original forecast values (Ifatigue), which indicates that decreasing workload settings indicator X6—Rest length by 30% cannot confirm any conclusive change in the values of Fatigue index.
4.2.3. Comparison of Iteration 1 and Iteration 2
Two case scenarios were conducted for the workload settings indicator X6—Rest length, i.e., Iteration 1 and Iteration 2. The first one simulated an increase in X6, and the second one simulated a decrease in X6. Two iterations of the case scenarios both provided inconclusive results. In fact, both results obtained show almost exactly the same values (Figure 16) for the increased X6 and for the decreased X6, which leads to the conclusion that modifying workload settings indicator X6—Rest length has no significant impact on the values of the fatigue index (Ifatigue’). Hence, whether the rest length is shorter or longer, it does not impact the appearance of fatigue.
4.3. Case Scenario 3—Impact on Fatigue Due to Increase/Decrease of Workload Settings Indicator—Local Night in Daily Rest
For the workload settings indicator, X7—Local night in daily rest, two case scenarios were conducted, i.e., Iteration 1 and Iteration 2. The first one simulated an increase in X7, and the second one simulated a decrease in X7. Two iterations of case scenarios were performed only when the first iteration provided inconclusive results.
4.3.1. Iteration 1—Increase of Workload Settings Indicator—Local Night in Daily Rest
This case scenario shows the simulation of increasing workload settings indicator, X7—Local night in daily rest, and its impact on the fatigue indicator, Ifatigue—fatigue index (Figure 17). Figure 17a shows the observed values of X7 and the modified (increased) values of X7 for 3 extra local nights (X7′ = X7 + 3), while Figure 17b shows how the change in X7 impacts the values of the fatigue indicator Ifatigue. Figure 17b, or the case scenario graph, shows one line and three curves. The red line represents the borderline between rested state and fatigue. The values above the red line represent the presence of fatigue and vice versa. The blue curve shows the observed values of the fatigue indicator Ifatigue—fatigue index. The green curve shows the original forecast values of Ifatigue obtained by applying the defined causal links between X7 and Ifatigue. The pink curve shows the simulated values (case scenario values) of Ifatigue’ obtained by applying the defined causal links between X7 and Ifatigue. A comparison of the green and pink curves shows direct differences for the different values of workload settings indicator X7.
Table 13 shows the observed values of the workload settings indicator, X7—Local night in daily rest, the modified observed values of X7 or X7′, the observed and original forecast values of the fatigue index (Ifatigue), and the simulated values (case scenario) of the fatigue index (Ifatigue’) obtained by applying the defined causal links between X7 and Ifatigue. It can be observed that by comparing these values (from point 1 to point 7 of the forecasted values part in Table 13), the results show that fatigue (Ifatigue’) increases due to an increase in the workload settings indicator X7—Local night in daily rest.
Figure 18 shows how the simulation of increasing workload settings indicator, X7—Local night in daily rest, impacts two related fatigue indicators, i.e., initial ballast (Bin) and final ballast (Bfin), which are used to calculate the fatigue index. Figure 18a shows the impact of a modified X7 on Bin, and Figure 18b shows the impact of a modified X7 on Bfin. This is conducted to confirm that these values follow the results of the case scenario simulating the impact of workload settings indicator X7 on the values of the fatigue indicator Ifatigue, as per the previous Figure 17b.
Table 14 shows a comparison of the observed values of workload settings indicator, X7—Local night in daily rest, the modified observed values of X7, i.e., X7′, the observed and original forecast values of the fatigue index (Ifatigue), and the simulated values (case scenario) of the fatigue index (Ifatigue’) obtained by applying the defined causal links between X7 and Ifatigue, the observed values of the initial ballast (Bin) and final ballast (Bfin), and the simulated values (case scenario values) of Initial ballast (Bin’) and Final ballast (Bfin’) obtained by applying the defined causal links between X7 and Bin, and X7 and Bfin. By comparing the values, the results show that fatigue (Ifatigue’) increases due to an increase in the workload settings indicator X7—Local night in daily rest.
Figure 19a shows a graph with one line and two curves. The red line represents the borderline between rested state and fatigue. The values above the red line represent the presence of fatigue (marked in the red area) and vice versa. Figure 19a shows two curves of the forecasted fatigue index (Ifatigue) values. The first curve (dotted green) shows the original forecast values of the fatigue index (Ifatigue), and the second curve (dotted pink) shows the simulated (case scenario) forecast values of the fatigue index (Ifatigue’). Figure 19b shows the case scenario curves of the initial ballast (Bin’) and final ballast (Bfin’). Higher values of Bfin’, in comparison to Bin’, as a rule, confirm the presence of fatigue. In this case, higher values of Bfin’ are observed due to an increase in X7—Local night in daily rest, indicating fatigue.
From Figure 19, it is clear that Ifatigue’ shows the increased values of the fatigue index comparing them to the original forecast values (Ifatigue), which indicates that increasing workload settings indicator, X7—Local night in daily rest, by 3 extra local nights significantly increases the values of the fatigue index.
4.3.2. Iteration 2—Decrease of Workload Settings Indicator—Local Night in Daily Rest
The following case scenario shows the simulation of decreasing workload settings indicator, X7—Local night in daily rest, and its impact on the fatigue indicator Ifatigue—fatigue index (Figure 20). Figure 20a shows the observed values of X7 and the modified (decreased) values of X7 by 1 local night (X7′ = X7 − 1), while Figure 20b shows how the change in X7 impacts the values of the fatigue indicator Ifatigue. Figure 20b, or the case scenario graph, shows one line and three curves. The red line represents the borderline between the rested state and fatigue. The values above the red line represent the presence of fatigue and vice versa. The blue curve shows the observed values of the fatigue indicator Ifatigue—fatigue index. The green curve shows the original forecast values of Ifatigue obtained by applying the defined causal links between X7 and Ifatigue. The pink curve shows the simulated values (case scenario values) of Ifatigue’ obtained by applying the defined causal links between X7 and Ifatigue to the modified values of workload settings indicator X7. A comparison of the green and pink curves shows direct differences for the different values of workload settings indicator X7.
Table 15 shows the observed values of the workload settings indicator, X7—Local night in daily rest, the modified observed values of X7 or X7′, the observed and original forecast values of the fatigue index (Ifatigue), and the simulated values (case scenario) of the fatigue index (Ifatigue’) obtained by applying the defined causal links between X7 and Ifatigue. It can be observed that by comparing these values (from point 1 to point 7 of the forecasted values part in Table 15), the results show that fatigue (Ifatigue’) decreases due to a decrease in workload settings indicator X7—Local night in daily rest.
Figure 21 shows how the simulation of decreasing workload settings indicator X7—Local night in daily rest impacts two related fatigue indicators, i.e., Initial ballast (Bin) and Final ballast (Bfin). Figure 21a shows the impact of a modified X7 on Bin, and Figure 21b shows the impact of a modified X7 on Bfin. This is conducted to confirm that these values follow the results of the case scenario simulating the impact of workload settings indicator X7 on the values of the fatigue indicator Ifatigue, as per the previous Figure 20b.
Table 16 shows a comparison of the observed values of the workload settings indicator, X7—Local night in daily rest, the modified observed values of X7, i.e., X7′, the observed and original forecast values of the fatigue index (Ifatigue), and the simulated values (case scenario) of the fatigue index (Ifatigue’) obtained by applying the defined causal links between X7 and Ifatigue, the observed values of the initial ballast (Bin) and final ballast (Bfin), and the simulated values (case scenario values) of the initial ballast (Bin’) and final ballast (Bfin’) obtained by applying the defined causal links between X7 and Bin, and X7 and Bfin. It can be observed that by comparing the values, the results show that fatigue (Ifatigue’) decreases due to a decrease in the workload settings indicator X7—Local night in daily rest.
Figure 22 shows two graphs. The one in Figure 22a depicts one line and two curves. The red line represents the borderline between the rested state and fatigue. The values above the red line represent the presence of fatigue (marked in the red area) and vice versa. Figure 22a shows two curves of the forecasted fatigue index (Ifatigue) values. The first curve (dotted green) shows the original forecast values of the fatigue index (Ifatigue), and the second curve (dotted pink) shows the simulated (case scenario) forecast values of the fatigue index (Ifatigue’). Figure 22b shows the case scenario curves of the initial ballast (Bin’) and final ballast (Bfin’). Higher values of Bfin’, in comparison to Bin’, as a rule, confirm the presence of fatigue. In this case, lower values of Bfin’ are observed due to an increase in X7—Local night in daily rest, which indicates the absence of fatigue.
From Figure 22, it is clear that Ifatigue’ shows the decreased values of the fatigue index comparing them to the original forecast values (Ifatigue), which indicates that decreasing workload settings indicator, X7—Local night in daily rest by 1 extra local night, decreases the values of the fatigue index and keeps them under the value of 1.
4.3.3. Comparison of Iteration 1 and Iteration 2
Two case scenarios were conducted for the workload settings indicator, X7—Local night in daily rest, i.e., Iteration 1 and Iteration 2. The first one simulated an increase in X7, and the second one simulated a decrease in X7. Two iterations of the case scenarios both provided conclusive results. For the increased X7, the obtained results show the increased values of the fatigue index, and for the decreased X7, the results show the decreased values of the fatigue index (Figure 23). This leads to the conclusion that modifying the workload settings indicator, X7—Local night in daily rest, has a clear impact on the values of the fatigue index. In conclusion, having a local night in daily rest implies an increase in the level of fatigue.
4.4. Case Scenario 4—Impact on Fatigue Due to Increase of Workload Settings Indicator—Changes in the Schedule
The case scenario shows the simulation of increasing workload settings indicator, X9—Changes in the schedule, and its impact on the fatigue indicator, Ifatigue—fatigue index (Figure 24). Figure 24a shows the observed values of X9 and the modified (increased) values of X9 by 2 extra changes in the schedule (X9′ = X9 + 2), while Figure 24b shows how the change in X9 impacts the values of the fatigue indicator Ifatigue. Figure 24b, or the case scenario graph, shows one line and three curves. The red line represents the borderline between the rested state and fatigue. The values above the red line represent the presence of fatigue and vice versa. The blue curve shows the observed values of the fatigue indicator Ifatigue—fatigue index. The green curve shows the original forecast values of Ifatigue obtained by applying the defined causal links between X9 and Ifatigue. The pink curve shows the simulated values (case scenario values) of Ifatigue’ obtained by applying the defined causal links between X9 and Ifatigue to modified values of workload settings indicator X9. A comparison of the green and pink curves shows direct differences for the different values of workload settings indicator X9.
Table 17 shows the observed values of workload settings indicator X9—Changes in the schedule, the modified observed values of X9 or X9′, the observed and original forecast values of the fatigue index (Ifatigue), and the simulated values (case scenario) of the fatigue index (Ifatigue’) obtained by applying the defined causal links between X9 and Ifatigue. By comparing these values (from point 1 to point 7 of the forecasted values part in Table 17), the results show that fatigue (Ifatigue’) increases by a few points due to an increase in workload settings indicator X9—Changes in the schedule. However, the results are still not clear enough to draw any conclusion.
Figure 25 shows how the simulation of increasing workload settings indicator, X9—Changes in the schedule, impacts two related fatigue indicators, i.e., initial ballast (Bin) and final ballast (Bfin). Figure 25a shows the impact of a modified X9 on Bin, and Figure 25b shows the impact of a modified X9 on Bfin. This is conducted to confirm that these values follow the results of the case scenario simulating the impact of workload settings indicator X9 on the values of the fatigue indicator Ifatigue, as per the previous Figure 24b. It can be observed from Figure 25 that most Bfin’ values are higher than Bin’ values, which confirms the presence of fatigue. By comparing the graphs in Figure 25, the results still do not provide an unambiguous conclusion.
Table 18 shows a comparison of the observed values of workload settings indicator X9—Changes in the schedule, the modified observed values of X9, i.e., X9′, the observed and original forecast values of the fatigue index (Ifatigue), and the simulated values (case scenario) of the fatigue index (Ifatigue’) obtained by applying the defined causal links between X9 and Ifatigue, the observed values of the initial ballast (Bin) and final ballast (Bfin), and the simulated values (case scenario values) of the initial ballast (Bin’) and final ballast (Bfin’) obtained by applying the defined causal links between X9 and Bin, and X9 and Bfin. By comparing the values, the results show that fatigue (Ifatigue’) increases by a few points due to an increase in workload settings indicator X9—Changes in the schedule, but the results are still inconclusive.
Figure 26a presents a graph with one line and two curves. The red line represents the borderline between the rested state and fatigue. All values above the red line represent the presence of fatigue (marked in the red area) and vice versa. Figure 26a shows two curves of the forecasted fatigue index (Ifatigue) values. The first curve (dotted green) shows the original forecast values of the fatigue index (Ifatigue), and the second curve (dotted pink) shows the simulated (case scenario) forecast values of the fatigue index (Ifatigue’). Figure 26b shows the case scenario curves of the initial ballast (Bin’) and the final ballast (Bfin’). Higher values of Bfin’, in comparison to Bin’, as a rule, confirm the presence of fatigue. In this case, some higher values of Bfin’ are observed due to an increase in X9—Changes in the schedule, which indicates the presence of fatigue, but not all of them; hence, no conclusion can be drawn.
From Figure 26, it is not certain that the Ifatigue’ values increase when comparing them to the original forecast values (Ifatigue), which does not provide clear information on whether increasing workload settings indicator X9—Changes in the schedule by 2 extra changes in the schedule affects values of the fatigue index. Since the values of the designated set for modification record the lowest possible values, i.e., 0, the simulation of a decrease cannot be conducted; due to that, another additional simulation of increase was conducted, but this time X9—Changes in the schedule was increased by 5 extra changes in the schedule, to confirm the initial results. The additional simulation results showed almost exactly the same values as the initial one, which leads to the conclusion that modifying workload settings indicator X9—Changes in the schedule, has no significant impact on the values of the fatigue index (Ifatigue’). Hence, it can be concluded that whether the number of changes in the schedule is higher or lower, it does not impact the appearance of fatigue.
4.5. Case Scenario 5—Impact on Fatigue Due to Increase/Decrease of Workload Settings Indicator—Sectors in the Previous 7 Days
For the workload settings indicator X10—Sectors in the previous 7 days, two case scenarios were conducted, i.e., Iteration 1 and Iteration 2. The first one simulated an increase in X10, and the second one simulated a decrease in X10. Two iterations of case scenarios were performed only when the first iteration provided inconclusive results.
4.5.1. Iteration 1—Increase of Workload Settings Indicator—Sectors in the Previous 7 Days
This case scenario shows the simulation of increasing workload settings indicator, X10—Sectors in the previous 7 days, and its impact on the fatigue indicator Ifatigue—fatigue index (Figure 27). Figure 27a shows the observed values of X10 and the modified (increased) values of X10 by 30% (X10′ = X10 × 1.3), while Figure 27b shows how the change in X10 impacts the values of the fatigue indicator Ifatigue. Figure 27b, or the case scenario graph, shows one line and three curves. The red line represents the borderline between the rested state and fatigue. The values above the red line represent the presence of fatigue and vice versa. The blue curve shows the observed values of the fatigue indicator, Ifatigue—fatigue index. The green curve shows the original forecast values of Ifatigue obtained by applying defined causal links between X10 and Ifatigue. The pink curve shows simulated values (case scenario values) of Ifatigue’ obtained by applying the defined causal links between X10 and Ifatigue to the modified values of workload settings indicator X10. A comparison of the green and pink curves shows direct differences for the different values of workload settings indicator X10.
Table 19 shows the observed values of the workload settings indicator, X10—Sectors in the previous 7 days, the modified observed values of X10 or X10′, the observed and original forecast values of the fatigue index (Ifatigue), and the simulated values (case scenario) of the fatigue index (Ifatigue’) obtained by applying the defined causal links between X10 and Ifatigue. It can be observed that by comparing these values (from point 1 to point 7 of the forecasted values part in Table 19), the results show that fatigue (Ifatigue’) values show a high increase on a few points due to an increase in workload settings indicator X10—Sectors in the previous 7 days. However, the results are still not clear enough to draw any concrete conclusion.
Figure 28 shows how the simulation of increasing the workload settings indicator, X10—Sectors in the previous 7 days, impacts two related fatigue indicators, i.e., initial ballast (Bin) and final ballast (Bfin). Figure 28a shows the impact of a modified X10 on Bin, and Figure 28b shows the impact of a modified X10 on Bfin. This is conducted to confirm that these values follow the results of the case scenario simulating the impact of workload settings indicator X10 on the values of the fatigue indicator Ifatigue, as per the previous Figure 27b. By comparing the graphs in Figure 28, the results do not provide an unambiguous conclusion.
Table 20 shows a comparison of the observed values of workload settings indicator, X10—Sectors in the previous 7 days, the modified observed values of X10, i.e., X10′, the observed and original forecast values of the fatigue index (Ifatigue), and the simulated values (case scenario) of the fatigue index (Ifatigue’) obtained by applying the defined causal links between X10 and Ifatigue, the observed values of the initial ballast (Bin) and final ballast (Bfin), and the simulated values (case scenario values) of the initial ballast (Bin’) and final ballast (Bfin’) obtained by applying the defined causal links between X10 and Bin, and X10 and Bfin. By comparing the values, the results show that fatigue (Ifatigue’) increases in some points due to an increase in workload settings indicator X10—Sectors in the previous 7 days, but the results are still inconclusive.
Figure 29a shows one line and two curves. The red line represents the borderline between the rested state and fatigue. The values above the red line represent the presence of fatigue (marked in the red area) and vice versa. Figure 29a shows two curves of the forecasted fatigue index (Ifatigue) values. The first curve (dotted green) shows the original forecast values of the fatigue index (Ifatigue), and the second curve (dotted pink) shows the simulated (case scenario) forecast values of the fatigue index (Ifatigue’). Figure 29b shows the case scenario curves of the initial ballast (Bin’) and final ballast (Bfin’). Higher values of Bfin’, in comparison to Bin’, as a rule, confirm the presence of fatigue. In this case, higher values of Bfin’ are observed in a few points due to an increase in X10—Sectors in the previous 7 days, which indicates the presence of fatigue, but not in all of them; hence, no conclusion can be drawn yet.
From Figure 29 it is not certain that Ifatigue’ increases due to the increase in workload settings indicator X10—Sectors in the previous 7 days by 30%, but it does indicate the presence of fatigue due to the fact that increasing workload settings indicator X10 does increase the fatigue index in few points. This will be confirmed or not by conducting the following Iteration 2.
4.5.2. Iteration 2—Decrease of Workload Settings Indicator—Sectors in the Previous 7 Days
The following case scenario shows the simulation of decreasing the workload settings indicator, X10—Sectors in the previous 7 days, and its impact on the fatigue indicator, Ifatigue—fatigue index (Figure 30). Figure 30a shows the observed values of X10 and the modified (decreased) values of X10 by 30% (X10′ = X10 × 0.7), while Figure 30b shows how the change in X10 impacts the values of the fatigue indicator, Ifatigue. Figure 30b, or the case scenario graph, shows one line and three curves. The red line represents the borderline between the rested state and fatigue. The values above the red line represent the presence of fatigue and vice versa. The blue curve shows the observed values of the fatigue indicator Ifatigue—fatigue index. The green curve shows the original forecast values of Ifatigue obtained by applying the defined causal links between X10 and Ifatigue. The pink curve shows the simulated values (case scenario values) of Ifatigue’ obtained by applying the defined causal links between X10 and Ifatigue. A comparison of the green and pink curves shows direct differences for the different values of workload settings indicator X10.
Table 21 shows the observed values of workload settings indicator X10—Sectors in the previous 7 days, the modified observed values of X10 or X10′, the observed and original forecast values of the fatigue index (Ifatigue), and the simulated values (case scenario values) of the fatigue index (Ifatigue’) obtained by applying the defined causal links between X10 and Ifatigue. It can be observed that by comparing these values (from point 1 to point 7 of the forecasted values part in Table 21), the results show that fatigue (Ifatigue’) values show an increase in a few points due to a decrease in the workload settings indicator X10—Sectors in the previous 7 days. However, the results are not clear enough to draw any conclusion.
Figure 31 shows how the simulation of decreasing the workload settings indicator, X10—Sectors in the previous 7 days, impacts two related fatigue indicators, i.e., initial ballast (Bin) and final ballast (Bfin). Figure 31a shows the impact of a modified X10 on Bin, and Figure 31b shows the impact of a modified X10 on Bfin. This is conducted to confirm that these values follow the results of the case scenario simulating the impact of workload settings indicator X10 on the values of the fatigue indicator Ifatigue, as per the previous Figure 30b. By comparing the graphs in Figure 31, the results still do not provide an unambiguous conclusion.
Table 22 shows a comparison of the observed values of the workload settings indicator X10—Sectors in the previous 7 days, the modified observed values of X10, i.e., X10′, the observed and original forecast values of the fatigue index (Ifatigue), and the simulated values (case scenario values) of the fatigue index (Ifatigue’) obtained by applying the defined causal links between X10 and Ifatigue, the observed values of the initial ballast (Bin) and final ballast (Bfin), and the simulated values (case scenario values) of the initial ballast (Bin’) and final ballast (Bfin’) obtained by applying the defined causal links between X10 and Bin, and X10 and Bfin. By comparing the values, the results show that fatigue (Ifatigue’) increased in some points due to a decrease in the workload settings indicator X10—Sectors in the previous 7 days, but the results are still inconclusive.
A graph in Figure 32a shows one line and two curves. The red line represents the borderline between the rested state and fatigue. The values above the red line represent the presence of fatigue (marked in the red area) and vice versa. Figure 32a shows two curves of the forecasted fatigue index (Ifatigue) values. The first curve (dotted green) shows the original forecast values of the fatigue index (Ifatigue), and the second curve (dotted pink) shows the simulated (case scenario) forecast values of the fatigue index (Ifatigue’). Figure 32b shows the case scenario curves of the initial ballast (Bin’) and final ballast (Bfin’). Higher values of Bfin’, in comparison to Bin’, as a rule, confirm the presence of fatigue. In this case, higher values of Bfin’ are observed in a few points due to a decrease in X10—Sectors in the previous 7 days, which indicates the presence of fatigue, but not in all of them; hence, no conclusion can be drawn yet.
From Figure 32, it is not certain that Ifatigue’ shows increased values in the fatigue index comparing them to the original forecast values (Ifatigue). Hence, it cannot be determined that decreasing workload settings indicator X10—Sectors in the previous 7 days by 30% increases the values of the fatigue index.
4.5.3. Comparison of Iteration 1 and Iteration 2
Two case scenarios were conducted for the workload settings indicator X10—Sectors in the previous 7 days, i.e., Iteration 1 and Iteration 2. The first one simulated an increase in X10, and the second one simulated a decrease in X10. Two iterations of the case scenarios both provided inconclusive results. In fact, both results obtained showed almost exactly the same values (Figure 33) for the increased X10 and for the decreased X10, which leads to the conclusion that modifying the workload settings indicator X10—Sectors in the previous 7 days has no significant impact on the values of the fatigue index (Ifatigue’). Hence, whether the number of sectors conducted in the previous 7 days is higher or lower does not impact the appearance of fatigue.
4.6. Case Scenario 6—Impact on Fatigue Due to Increase/Decrease of Workload Settings Indicator—Duty Time in the Previous 28 Days
For the workload settings indicator X15—Duty time in the previous 28 days, two case scenarios were conducted, i.e., Iteration 1 and Iteration 2. The first simulated an increase in X15, and the second simulated a decrease in X15. Two iterations of case scenarios were performed only when the first iteration provided inconclusive results.
4.6.1. Iteration 1—Increase of Workload Settings Indicator—Duty Time in the Previous 28 Days
This case scenario shows the simulation of increasing the workload settings indicator, X15—Duty time in the previous 28 days, and its impact on the fatigue indicator, Ifatigue—fatigue index (Figure 34). Figure 34a shows the observed values of X15 and the modified (increased) values of X15 by 30% (X15′ = X15 × 1.3), while Figure 34b shows how the change in X15 impacts the values of the fatigue indicator, Ifatigue. Figure 34b, or the case scenario graph, shows one line and three curves. The red line represents the borderline between the rested state and fatigue. The values above the red line represent the presence of fatigue and vice versa. The blue curve shows the observed values of the fatigue indicator, Ifatigue—fatigue index. The green curve shows the original forecast values of Ifatigue obtained by applying the defined causal links between X15 and Ifatigue. The pink curve shows the simulated values (case scenario values) of Ifatigue’ obtained by applying the defined causal links between X15 and Ifatigue to the modified values of the workload settings indicator X15. A comparison of the green and pink curves shows direct differences for the different values of workload settings indicator X15.
Table 23 shows the observed values of the workload settings indicator X15—Duty time in the previous 28 days, the modified observed values of X15 or X15′, the observed and original forecast values of the fatigue index (Ifatigue), and the simulated values (case scenario values) of the fatigue index (Ifatigue’) obtained by applying the defined causal links between X15 and Ifatigue. By comparing the values (from point 1 to point 7 of the forecasted values part in Table 23), the results show that fatigue (Ifatigue’) increases due to an increase in workload settings indicator X15—Duty time in the previous 28 days.
Figure 35 shows how the simulation of increasing the workload settings indicator, X15—Duty time in the previous 28 days, impacts two related fatigue indicators, i.e., initial ballast (Bin) and final ballast (Bfin). Figure 35a shows the impact of a modified X15 on Bin, and Figure 35b shows the impact of a modified X15 on Bfin. This is conducted to confirm that these values follow the results of the case scenario simulating the impact of the workload settings indicator X15 on the values of the fatigue indicator Ifatigue, as per the previous Figure 34b. It can be observed in Figure 35 that most of the Bfin’ values are higher than the Bin’ values, which confirms the presence of fatigue.
Table 24 shows a comparison of the observed values of the workload settings indicator X15—Duty time in the previous 28 days, the modified observed values of X15, i.e., X15′, the observed and original forecast values of Fatigue index (Ifatigue), and the simulated values (case scenario values) of the fatigue index (Ifatigue’) obtained by applying the defined causal links between X15 and Ifatigue, the observed values of the initial ballast (Bin) and final ballast (Bfin), and the simulated values (case scenario values) of the initial ballast (Bin’) and final ballast (Bfin’) obtained by applying the defined causal links between X15 and Bin, and X15 and Bfin. By comparing the values, the results show that fatigue (Ifatigue’) increases due to an increase in workload settings indicator X15—Duty time in the previous 28 days.
Figure 36 shows two graphs. Figure 36a shows a graph with one line and two curves. The red line represents the borderline between the rested state and fatigue. The values above the red line represent the presence of fatigue (marked in the red area) and vice versa. Figure 36a shows two curves of the forecasted fatigue index (Ifatigue) values. The first curve (dotted green) shows the original forecast values of the fatigue index (Ifatigue), and the second curve (dotted pink) shows the simulated (case scenario) forecast values of the fatigue index (Ifatigue’). Figure 36b shows the case scenario curves of the initial ballast (Bin’) and final ballast (Bfin’). Higher values of Bfin’, in comparison to Bin’, as a rule, confirm the presence of fatigue. In this case, higher values of Bfin’ are observed in most points due to an increase in X15—Duty time in the previous 28 days, indicating fatigue.
From Figure 36 it is indicative that Ifatigue’ shows the increased values of the fatigue index comparing them to the original forecast values (Ifatigue), which suggests that increasing workload settings indicator X15—Duty time in the previous 28 days by 30% increases the values of the fatigue index. Iteration 2 should confirm these results.
4.6.2. Iteration 2—Decrease of Workload Settings Indicator—Duty Time in the Previous 28 Days
The next case scenario shows the simulation of decreasing the workload settings indicator, X15—Duty time in the previous 28 days, and its impact on the fatigue indicator, Ifatigue—fatigue index (Figure 37). Figure 37a shows the observed values of X15 and the modified (decreased) values of X15 by 30% (X15′ = X15 × 0.7), while Figure 37b shows how the change in X15 impacts the values of the fatigue indicator Ifatigue. Figure 37b, or the case scenario graph, shows one line and three curves. The red line represents the borderline between the rested state and fatigue. The values above the red line represent the presence of fatigue and vice versa. The blue curve shows the observed values of the fatigue indicator Ifatigue—fatigue index. The green curve shows the original forecast values of Ifatigue obtained by applying the defined causal links between X15 and Ifatigue. The pink curve shows the simulated values (case scenario values) of Ifatigue’ obtained by applying the defined causal links between X15 and Ifatigue. A comparison of the green and pink curves shows direct differences for the different values of workload settings indicator X15.
Table 25 shows the observed values of the workload settings indicator X15—Duty time in the previous 28 days, the modified observed values of X15 or X15′, the observed and original forecast values of the fatigue index (Ifatigue), and the simulated values (case scenario values) of the fatigue index (Ifatigue’) obtained by applying the defined causal links between X15 and Ifatigue. By comparing these values (from point 1 to point 7 of the forecasted values part in Table 25), the results show that fatigue (Ifatigue’) decreases due to a decrease in workload settings indicator X15—Duty time in the previous 28 days.
Figure 38 shows how the simulation of decreasing the workload settings indicator, X15—Duty time in the previous 28 days, impacts two related fatigue indicators, i.e., initial ballast (Bin) and final ballast (Bfin). Figure 38a shows the impact of a modified X15 on Bin, and Figure 38b shows the impact of a modified X15 on Bfin. This is conducted to confirm that these values follow the results of the case scenario simulating the impact of workload settings indicator X15 on the values of the fatigue indicator Ifatigue, as per the previous Figure 37b. From Figure 38, it is clear that the Bfin’ values are lower than the Bin’ values, which confirms the absence of fatigue.
Table 26 shows a comparison of the observed values of the workload settings indicator X15—Duty time in the previous 28 days, the modified observed values of X15, i.e., X15′, the observed and original forecast values of the fatigue index (Ifatigue), and the simulated values (case scenario values) of the fatigue index (Ifatigue’) obtained by applying the defined causal links between X15 and Ifatigue, the observed values of the initial ballast (Bin) and final ballast (Bfin), and the simulated values (case scenario values) of the initial ballast (Bin’) and final ballast (Bfin’) obtained by applying the defined causal links between X15 and Bin, and X15 and Bfin. By comparing these values, the results show that fatigue (Ifatigue’) decreases due to a decrease in workload settings indicator X15—Duty time in the previous 28 days.
Figure 39 shows two graphs. Figure 39a shows a graph with one line and two curves. The red line represents the borderline between the rested state and fatigue. The values above the red line represent the presence of fatigue (marked in the red area) and vice versa. Figure 39a shows two curves of forecasted fatigue index (Ifatigue) values. The first curve (dotted green) shows the original forecast values of the fatigue index (Ifatigue), and the second curve (dotted pink) shows the simulated (case scenario) forecast values of the fatigue index (Ifatigue’). Figure 39b shows the case scenario curves of the initial ballast (Bin’) and final ballast (Bfin’). Higher values of Bfin’, in comparison to Bin’, as a rule, confirm the presence of fatigue. In this case, mostly lower values of Bfin’ are observed due to a decrease in X15—Duty time in the previous 28 days, which indicates the absence of fatigue.
From Figure 39, it is clear that Ifatigue’ shows the decreased values in the fatigue index comparing them to the original forecast values (Ifatigue), which indicates that decreasing workload settings indicator X15—Duty time in the previous 28 days by 30% decreases the values of the fatigue index. This Iteration 2 confirms the results from Iteration 1.
4.6.3. Comparison of Iteration 1 and Iteration 2
Two case scenarios were conducted for the workload settings indicator X15—Duty time in the previous 28 days, i.e., Iteration 1 and Iteration 2. The first one simulated an increase in X15, and the second one simulated a decrease in X15. Two iterations of the case scenarios both provided clear results. For the increased X15, the obtained results show the increased values of the fatigue index, and for the decreased X15, the results show the decreased values of the fatigue index (Figure 40). This leads to the conclusion that modifying workload settings indicator X15—Duty time in the previous 28 days has a clear impact on the values of the fatigue index. Therefore, having less duty time in the previous 28 days decreases fatigue.
4.7. Case Scenario 7—Impact on Fatigue Due to Increase/Decrease of Workload Settings Indicator—Multi-Day Shifts
The last case scenario shows the simulation of increasing the workload settings indicator, X16—Multi-day shifts, and its impact on the fatigue indicator, Ifatigue—fatigue index (Figure 41). Figure 41a shows the observed values of X16 and the modified (increased) values of X16 for 3 extra days on the shift (X16′ = X16 + 3), while Figure 41b shows how the change in X16 impacts the values of the fatigue indicator Ifatigue. Figure 41b, or the case scenario graph, shows one line and three curves. The red line represents the borderline between the rested state and fatigue. The values above the red line represent the presence of fatigue and vice versa. The blue curve shows the observed values of the fatigue indicator, Ifatigue—fatigue index. The green curve shows the original forecast values of Ifatigue obtained by applying the defined causal links between X16 and Ifatigue. The pink curve shows the simulated values (case scenario values) of Ifatigue’ obtained by applying the defined causal links between X16 and Ifatigue to the modified values of the workload settings indicator X16. A comparison of the green and pink curves shows direct differences for the different values of workload settings indicator X16.
Table 27 shows the observed values of the workload settings indicator X16—Multi-day shifts, the modified observed values of X16 or X16′, the observed and original forecast values of the fatigue index (Ifatigue), and the simulated values (case scenario values) values of the fatigue index (Ifatigue’) obtained by applying the defined causal links between X16 and Ifatigue. By comparing these values (from point 1 to point 7 of the forecasted values part in Table 27), the results show that fatigue (Ifatigue’) increases due to an increase in workload settings indicator X16—Multi-day shifts.
Figure 42 shows how the simulation of increasing the workload settings indicator, X16—Multi-day shifts, impacts two related fatigue indicators, i.e., initial ballast (Bin) and final ballast (Bfin), which are used to calculate the fatigue index. Figure 42a shows the impact of a modified X16 on Bin, and Figure 42b shows the impact of a modified X16 on Bfin. This is conducted to confirm that these values follow the case scenario results simulating the impact of the workload settings indicator X16 on the values of the fatigue indicator Ifatigue, as per the previous Figure 41b. It can be observed in Figure 42 that the Bfin’ values are higher than the Bin’ values, which confirms the presence of fatigue.
Table 28 shows a comparison of the observed values of the workload settings indicator X16—Multi-day shifts, the modified observed values of X16, i.e., X16′, the observed and original forecast values of the fatigue index (Ifatigue), and the simulated values (case scenario values) of the fatigue index (Ifatigue’) obtained by applying the defined causal links between X16 and Ifatigue, the observed values of the initial ballast (Bin) and final ballast (Bfin), and the simulated values (case scenario values) of the initial ballast (Bin’) and final ballast (Bfin’) obtained by applying the defined causal links between X16 and Bin, and X16 and Bfin. By comparing the values, the results show that fatigue (Ifatigue’) increases due to an increase in workload settings indicator X16—Multi-day shifts.
Figure 43 shows two graphs. Figure 43a shows a graph with one line and two curves. The red line represents the borderline between the rested state and fatigue. The values above the red line represent the presence of fatigue (marked in the red area) and vice versa. Figure 43a shows two curves of the forecasted fatigue index (Ifatigue) values. The first curve (dotted green) shows the original forecast values of the fatigue index (Ifatigue), and the second curve (dotted pink) shows the simulated (case scenario) forecast values of the fatigue index (Ifatigue’). Figure 43b shows the case scenario curves of the initial ballast (Bin’) and final ballast (Bfin’). Higher values of Bfin’, in comparison to Bin’, as a rule, confirm the presence of fatigue. In this case, higher values of Bfin’ are observed due to an increase in X16—Multi-day shifts, indicating fatigue.
From Figure 43, it is clear that Ifatigue’ shows the increased values of the fatigue index comparing them to the original forecast values (Ifatigue), which indicates that increasing workload settings indicator X16—Multi-day shifts by 3 extra days on the shift increases the values of the fatigue index.
4.8. Summary of Results
After conducting all the simulations, Table 29 shows a summary of all the results and conclusions obtained from this research. These can be used to plan the future flight crew workload set-up to mitigate (prevent/avoid) the appearance of fatigue.
5. Discussion/Conclusions
In flight operations, fatigue affects numerous tasks, such as performing inaccurate flight procedures, missing radio calls, missing or being too slow to pick up system warnings, and forgetting or performing routine tasks inaccurately. Flight crew workload factors include shift work, duty time, flight time, number of sectors, rest periods, time of day, duty patterns, number of time-zone transitions, number of consecutive duty days, and changes in the schedule. As per the reviewed literature, workload impacts the appearance of fatigue in flight operations. The focus of this paper was to find which flight crew workload settings indicators impact fatigue the most and to simulate their modification in order to mitigate or prevent the appearance of fatigue. The results showed that fatigue can be mitigated by modifying workload settings indicators, specifically the number of individual days off in the previous 28 days, local night in daily rest, duty time in the previous 28 days, and multi-day shifts.
The first part of the paper described the process of data collection regarding flight crew workload settings and fatigue using objectivation methods, such as an electronic CRD system of standardized chronometric cognitive tests and subjective self-assessment fatigue scales that capture the subjective perception of fatigue by the flight crew. All measurements were conducted anonymously with four male pilots of an average age of 42 years (+/− two years), who have been professional airline pilots for the last 11 years (standard deviation of 4.7 years) and have an average of 6.305 flight hours (standard deviation of 2.532 flight hours). Pilots completed a full set of tests (five CRD tests) and filled out four subjective surveys (self-assessment tables regarding their emotional state, energy level, self-confidence, and anxiety level). The CRD tests included five tests, i.e., CRD 13 test—Spatial visualization test, CRD 241 test—Identifying progressive series of numbers, CRD 23 test—Complex convergent visual orientation, CRD 324 test—Actualization of short-term memory, and CRD 422 test—Operative thinking with sound stimuli. The purpose of these tests was a chronometric measurement of the effectiveness of achieving mental and psychomotor functions and determining the dynamic features and functional disturbances in the process of mental processing. Independent variables of the collected data represent the elements of workload settings, while the CRD measurement results or CRD fatigue indicators represent the dependent variables. The most important indicator of the collected data is the fatigue index. The fatigue index is a derived indicator of the direction of the changes in the speed (an acceleration or a deceleration) of solving tasks in a particular test, i.e., it represents endurance and, consequently, fatigue. Where the values of the Fatigue index are greater than 1, this indicates the presence of fatigue; this indicator was referred to as “the targeted indicator” in the later stages of the study. Additionally, collected data included indicators of subjective self-assessment fatigue scales, which captured the subjective perception of fatigue by the flight crew. Variables of subjective self-assessments represent the subjective results of self-assessments regarding the emotional state, energy level, self-confidence, and anxiety level. The variables of subjective self-assessment scales were considered as both independent and dependent variables.
In the next part, causal modeling techniques were used to detect correlations among flight crew workload settings indicators, indicators of the subjective perception of fatigue, and CRD fatigue indicators, using previously collected and analyzed data regarding flight crew fatigue. Detecting correlations among indicators showed impacts (causes or effects) of indicators on one another, which in turn provides the possibility to improve the planning of future actions that can help mitigate fatigue risks in flight operations.
To obtain the correlations (causal links) among all indicators in the defined dataset, temporal causal modeling tools of the IBM SPSS Statistics 27 software were used. A dataset used for this part of the study included 135 entries for 16 indicators of workload settings, four indicators of subjective self-assessments, and eight measured CRD indicators of mental processing, i.e., fatigue indicators. The setup was made in such a way that the independent variables, i.e., workload settings indicators, were set to be “inputs” in a temporal causal model, and the dependent and independent variables were set to be “both inputs and targets”. The temporal causal model of flight crew workload settings, subjective self-assessments, and fatigue indicators was created, with the highly positive evaluation of the model fit using the R-squared criterion (whose values ranged from 0.70 to 0.87). The most interesting correlations are those related to the independent variables of workload settings because they are susceptible to modification. As mentioned before, one indicator in the dataset was of particular interest in this study, i.e., the fatigue index (or Ifatigue in the dataset). Hence, in the temporal causal model, the focus was to observe which indicators correlate with this particular indicator, i.e., the fatigue index. The results showed that the fatigue index correlates strongly with seven workload settings indicators, namely X5—Number of individual days off in the previous 28 days, X6—Rest length, X7—Local night in daily rest, X9—Changes in the schedule, X10—Sectors in the previous 7 days, X15—Duty time in the previous 28 days, and X16—Multi-day shifts.
The final and main part of the paper presented simulations (case scenarios) conducted to show the impacts of flight crew workload settings indicators on the appearance of fatigue. By applying the temporal causal model, the simulations of modifying workload settings were conducted to show how values of chosen workload settings indicators (in this case, the seven most relevant workload settings indicators) affect the behavior of the CRD fatigue indicator, i.e., the fatigue index.
The results show that by increasing the workload settings indicator X5—Number of individual days off in the previous 28 days, the fatigue index decreases, i.e., more individual days off in the previous 28 days implies a lower level of fatigue. For workload settings indicator X6—Rest length, two iterations of case scenarios were performed, and the results revealed that the length of the rest has no significant impact on the appearance of fatigue. For workload settings indicator X7—Local night in daily rest, two iterations of case scenarios were performed, and the results revealed that having a local night before duty time implies an increased level of fatigue. The number of changes in the schedule (X9) showed no significant impact on the appearance of fatigue. For workload settings indicator X10—Sectors in the previous 7 days, two iterations of case scenarios were performed, and the results revealed that the number of sectors in the previous 7 days does not affect the appearance of fatigue. Workload settings indicator X15—Duty time in the previous 28 days included two iterations of case scenarios as well, and the results showed that less duty time in the previous 28 days implies a lower level of fatigue. The last examined was the workload settings indicator X16—Multi-day shifts, and the results showed that shorter multi-day shifts imply a lower level of fatigue. The simulations revealed significant useful information regarding which flight crew workload settings elements impact fatigue, i.e., number of individual days off in the previous 28 days, local night in daily rest, duty time in the previous 28 days, and multi-day shifts. This can be useful for the future planning process of flight crew workload set-up.
This study has certain limitations. The study does not include all elements of workload settings that can impact the appearance of fatigue. In future research, more elements of the work environment and personal factors should be examined to obtain more information regarding the appearance of fatigue in flight operations. Another limitation refers to the fact that this study was performed on four male pilots of similar age and work experience; therefore, characteristics such as age, gender, or experience were not examined in relation to the impact on the appearance of fatigue. Collecting data on a larger number (more than four) of female and male pilots with different ages, experience, and other characteristics might provide an even better background to detect and simulate more parameters affecting the appearance of fatigue.
Future research will focus on detecting more elements of workload settings affecting fatigue in flight operations, as well as the other relevant causal factors, with the aim of defining the optimal flight crew workload setup that will have the least impact on the appearance of fatigue, to ensure the highest level of safety in flight operations.
Author Contributions
Conceptualization: D.B., S.S., D.F. and M.M.J.; methodology: D.B., S.S., D.F. and M.M.J.; software: D.B., S.S., D.F. and M.M.J.; validation: D.B., S.S., D.F. and M.M.J.; formal analysis: D.B., S.S., D.F. and M.M.J.; investigation: D.B., S.S., D.F. and M.M.J.; data curation: D.B., S.S., D.F. and M.M.J.; writing—original draft preparation: D.B., S.S., D.F. and M.M.J.; writing—review and editing: D.B., S.S., D.F. and M.M.J.; visualization: D.B., S.S., D.F. and M.M.J.; supervision: D.B., S.S., D.F. and M.M.J. All authors have read and agreed to the published version of the manuscript.
Funding
This research received no external funding.
Informed Consent Statement
All subjects gave their informed consent for the inclusion before they participated in the study. All subjects involved in the study entered voluntarily, and the study was conducted anonymously to protect the privacy of the subjects.
Data Availability Statement
Data supporting reported results can be found in this paper in Appendix A. The entire database of the collected data is not publicly available due to the protection of privacy.
Conflicts of Interest
The authors declare no conflict of interest.
Appendix A
The part of the collected data (the results) on flight crew fatigue, i.e., the independent and dependent variables obtained using the CRD tests and subjective self-assessment scales, are presented in Table A1. Collected data presented in this table were used to detect the workload settings impacting flight crew fatigue and to simulate the case scenarios that show which elements of workload settings can be modified to mitigate fatigue risk in flight operations. Each indicator of the dataset is explained in Section 3.1, Table 1.

Table A1.
CRD tests results (the collected data) on flight crew workload settings elements, indicators of subjective perception of fatigue, and measured CRD fatigue indicators.
Table A1.
CRD tests results (the collected data) on flight crew workload settings elements, indicators of subjective perception of fatigue, and measured CRD fatigue indicators.
| No. | X1 | X2 | X3 | X4 | X5 | X6 | X7 | X8 | X9 | X10 | X11 | X12 | X13 | X14 | X15 | X16 | S1 | S2 | S3 | S4 | Nerr | Ttot | Tmin | Tmax | Btot | Bin | Bfin | Ifatigue |
|---|---|---|---|---|---|---|---|---|---|---|---|---|---|---|---|---|---|---|---|---|---|---|---|---|---|---|---|---|
| 1 | 20.17 | 0 | 2 | 14 | 2 | 21.48 | 1 | 2 | 0 | 8 | 20 | 13.37 | 33.48 | 21.72 | 77.78 | 0 | 8 | 6 | 8 | 8 | 2 | 16,222 | 367 | 687 | 3377 | 862 | 2516 | 2.9199 |
| 2 | 20.17 | 0 | 2 | 9 | 1 | 32.50 | 1 | 1 | 1 | 8 | 39 | 9.85 | 63.52 | 19.68 | 142.13 | 1 | 7 | 7 | 7 | 8 | 1 | 37,892 | 544 | 2344 | 18,852 | 8639 | 10,213 | 1.1822 |
| 3 | 20.25 | 0 | 2 | 10 | 4 | 20.23 | 1 | 2 | 0 | 10 | 42 | 17.33 | 71.67 | 43.00 | 150.13 | 0 | 7 | 6 | 8 | 8 | 1 | 36,503 | 629 | 1748 | 14,488 | 5121 | 9368 | 1.8294 |
| 4 | 20.17 | 0 | 2 | 9 | 1 | 32.50 | 1 | 1 | 1 | 8 | 39 | 9.85 | 63.52 | 19.68 | 142.13 | 1 | 7 | 7 | 7 | 8 | 3 | 52,834 | 697 | 4446 | 28,439 | 13,065 | 15,375 | 1.1768 |
| 5 | 20.25 | 0 | 2 | 10 | 4 | 20.23 | 1 | 2 | 0 | 10 | 42 | 17.33 | 71.67 | 43.00 | 150.13 | 0 | 7 | 6 | 8 | 8 | 6 | 53,360 | 722 | 3590 | 28,090 | 10,511 | 17,579 | 1.6724 |
| 6 | 20.17 | 0 | 2 | 9 | 1 | 32.50 | 1 | 1 | 1 | 8 | 39 | 9.85 | 63.52 | 19.68 | 142.13 | 1 | 7 | 7 | 7 | 8 | 1 | 78,969 | 108 | 12,369 | 74,649 | 46,639 | 28,010 | 0.6006 |
| 7 | 20.25 | 0 | 2 | 10 | 4 | 20.23 | 1 | 2 | 0 | 10 | 42 | 17.33 | 71.67 | 43.00 | 150.13 | 0 | 7 | 6 | 8 | 8 | 0 | 85,185 | 203 | 14,895 | 77,065 | 35,019 | 42,046 | 1.2007 |
| 8 | 20.17 | 0 | 2 | 9 | 1 | 32.50 | 1 | 1 | 1 | 8 | 39 | 9.85 | 63.52 | 19.68 | 142.13 | 1 | 7 | 7 | 7 | 8 | 4 | 26,644 | 153 | 1261 | 17,464 | 10,352 | 7112 | 0.6870 |
| 9 | 20.25 | 0 | 2 | 10 | 4 | 20.23 | 1 | 2 | 0 | 10 | 42 | 17.33 | 71.67 | 43.00 | 150.13 | 0 | 7 | 6 | 8 | 8 | 1 | 22,903 | 231 | 599 | 9043 | 5193 | 3850 | 0.7414 |
| 10 | 20.17 | 0 | 2 | 9 | 1 | 32.50 | 1 | 1 | 1 | 8 | 39 | 9.85 | 63.52 | 19.68 | 142.13 | 1 | 7 | 7 | 7 | 8 | 8 | 12,191 | 282 | 577 | 2321 | 1036 | 1285 | 1.2403 |
| 11 | 20.25 | 0 | 2 | 8 | 2 | 28.25 | 1 | 2 | 0 | 13 | 56 | 15.22 | 72.93 | 45.32 | 172.37 | 0 | 8 | 8 | 8 | 8 | 0 | 37,792 | 886 | 2203 | 6782 | 2430 | 4352 | 1.7909 |
| 12 | 21.08 | 0 | 3 | 12 | 0 | 33.43 | 1 | 1 | 0 | 9 | 43 | 10.53 | 48.33 | 30.50 | 116.72 | 0 | 6 | 6 | 6 | 6 | 0 | 29,322 | 595 | 1441 | 8497 | 3733 | 4765 | 1.2765 |
| 13 | 21.08 | 0 | 3 | 12 | 0 | 33.43 | 1 | 1 | 0 | 9 | 43 | 10.53 | 48.33 | 30.50 | 116.72 | 0 | 6 | 6 | 6 | 6 | 1 | 37,984 | 864 | 2039 | 7744 | 3694 | 4050 | 1.0964 |
| 14 | 20.25 | 0 | 2 | 8 | 2 | 28.25 | 1 | 2 | 0 | 13 | 56 | 15.22 | 72.93 | 45.32 | 172.37 | 0 | 8 | 8 | 8 | 8 | 0 | 50,869 | 1110 | 3568 | 12,019 | 4376 | 7643 | 1.7466 |
| 15 | 20.25 | 0 | 2 | 8 | 2 | 28.25 | 1 | 2 | 0 | 13 | 56 | 15.22 | 72.93 | 45.32 | 172.37 | 0 | 8 | 8 | 8 | 8 | 0 | 23,701 | 301 | 720 | 5641 | 3185 | 2456 | 0.7711 |
| 16 | 21.08 | 0 | 3 | 12 | 0 | 33.43 | 1 | 1 | 0 | 9 | 43 | 10.53 | 48.33 | 30.50 | 116.72 | 0 | 6 | 6 | 6 | 6 | 0 | 18,486 | 141 | 1144 | 10,026 | 5864 | 4162 | 0.7098 |
| 17 | 21.08 | 0 | 3 | 12 | 0 | 33.43 | 1 | 1 | 0 | 9 | 43 | 10.53 | 48.33 | 30.50 | 116.72 | 0 | 6 | 6 | 6 | 6 | 0 | 62,539 | 187 | 11,750 | 55,059 | 35,959 | 19,100 | 0.5312 |
| 18 | 20.25 | 0 | 2 | 8 | 2 | 28.25 | 1 | 2 | 0 | 13 | 56 | 15.22 | 72.93 | 45.32 | 172.37 | 0 | 8 | 8 | 8 | 8 | 0 | 104,551 | 296 | 16,661 | 92,711 | 44,247 | 48,464 | 1.0953 |
| 19 | 21.08 | 0 | 3 | 12 | 0 | 33.43 | 1 | 1 | 0 | 9 | 43 | 10.53 | 48.33 | 30.50 | 116.72 | 0 | 6 | 6 | 6 | 6 | 0 | 14,580 | 307 | 588 | 3835 | 1509 | 2327 | 1.5423 |
| 20 | 20.25 | 0 | 2 | 8 | 2 | 28.25 | 1 | 2 | 0 | 13 | 56 | 15.22 | 72.93 | 45.32 | 172.37 | 0 | 8 | 8 | 8 | 8 | 4 | 16,040 | 275 | 743 | 6415 | 2822 | 3594 | 1.2736 |
| 21 | 19.10 | 1 | 4 | 8 | 2 | 13.82 | 1 | 2 | 1 | 8 | 34 | 11.48 | 40.07 | 28.45 | 152.80 | 0 | 8 | 5 | 8 | 6 | 1 | 30,130 | 624 | 1354 | 8290 | 3190 | 5100 | 1.5987 |
| 22 | 19.10 | 1 | 4 | 8 | 2 | 13.82 | 1 | 2 | 1 | 8 | 34 | 11.48 | 40.07 | 28.45 | 152.80 | 0 | 8 | 5 | 8 | 6 | 0 | 39,954 | 918 | 1483 | 7824 | 3570 | 4254 | 1.1916 |
| 23 | 19.10 | 1 | 4 | 8 | 2 | 13.82 | 1 | 2 | 1 | 8 | 34 | 11.48 | 40.07 | 28.45 | 152.80 | 0 | 8 | 5 | 8 | 6 | 0 | 75,681 | 202 | 13,052 | 67,601 | 41,322 | 26,279 | 0.6360 |
| 24 | 19.10 | 1 | 4 | 8 | 2 | 13.82 | 1 | 2 | 1 | 8 | 34 | 11.48 | 40.07 | 28.45 | 152.80 | 0 | 8 | 5 | 8 | 6 | 0 | 16,050 | 114 | 556 | 9210 | 4903 | 4307 | 0.8784 |
| 25 | 18.58 | 1 | 4 | 10 | 4 | 18.15 | 1 | 2 | 2 | 12 | 40 | 14.82 | 56.00 | 26.25 | 157.37 | 0 | 8 | 6 | 8 | 7 | 0 | 36,338 | 623 | 2232 | 14,533 | 6718 | 7816 | 1.1635 |
| 26 | 18.58 | 1 | 4 | 10 | 4 | 18.15 | 1 | 2 | 2 | 12 | 40 | 14.82 | 56.00 | 26.25 | 157.37 | 0 | 8 | 6 | 8 | 7 | 5 | 61,740 | 1191 | 2821 | 20,055 | 7188 | 12,868 | 1.7903 |
| 27 | 18.58 | 1 | 4 | 10 | 4 | 18.15 | 1 | 2 | 2 | 12 | 40 | 14.82 | 56.00 | 26.25 | 157.37 | 0 | 8 | 6 | 8 | 7 | 0 | 116,194 | 473 | 33,791 | 97,274 | 58,696 | 38,578 | 0.6573 |
| 28 | 18.58 | 1 | 4 | 10 | 4 | 18.15 | 1 | 2 | 2 | 12 | 40 | 14.82 | 56.00 | 26.25 | 157.37 | 0 | 8 | 6 | 8 | 7 | 0 | 24,176 | 245 | 625 | 9476 | 4844 | 4632 | 0.9562 |
| 29 | 19.10 | 1 | 4 | 8 | 2 | 13.82 | 1 | 2 | 1 | 8 | 34 | 11.48 | 40.07 | 28.45 | 152.80 | 0 | 8 | 5 | 8 | 6 | 0 | 11,561 | 222 | 894 | 3791 | 1684 | 2107 | 1.2512 |
| 30 | 18.58 | 1 | 4 | 10 | 4 | 18.15 | 1 | 2 | 2 | 12 | 40 | 14.82 | 56.00 | 26.25 | 157.37 | 0 | 8 | 6 | 8 | 7 | 0 | 13,162 | 236 | 735 | 4902 | 2310 | 2592 | 1.1221 |
| 31 | 21.05 | 1 | 3 | 14 | 1 | 41.13 | 1 | 2 | 0 | 9 | 27 | 16.70 | 43.33 | 31.53 | 91.45 | 0 | 8 | 6 | 8 | 8 | 0 | 36,120 | 743 | 2575 | 10,115 | 5807 | 4309 | 0.7420 |
| 32 | 20.00 | 1 | 4 | 21 | 0 | 17.08 | 1 | 1 | 0 | 3 | 13 | 5.75 | 22.97 | 11.17 | 45.23 | 0 | 8 | 6 | 8 | 8 | 2 | 40,148 | 733 | 2597 | 14,493 | 8622 | 5872 | 0.6810 |
| 33 | 20.00 | 1 | 4 | 21 | 0 | 17.08 | 1 | 1 | 0 | 3 | 13 | 5.75 | 22.97 | 11.17 | 45.23 | 0 | 8 | 6 | 8 | 8 | 1 | 54,991 | 1039 | 3377 | 18,626 | 4312 | 14,315 | 3.3201 |
| 34 | 21.05 | 1 | 3 | 14 | 1 | 41.13 | 1 | 2 | 0 | 9 | 27 | 16.70 | 43.33 | 31.53 | 91.45 | 0 | 8 | 6 | 8 | 8 | 2 | 61,787 | 1107 | 3446 | 23,042 | 5885 | 17,158 | 2.9157 |
| 35 | 21.05 | 1 | 3 | 14 | 1 | 41.13 | 1 | 2 | 0 | 9 | 27 | 16.70 | 43.33 | 31.53 | 91.45 | 0 | 8 | 6 | 8 | 8 | 0 | 139,839 | 234 | 22,395 | 130,479 | 66,298 | 64,181 | 0.9681 |
| 36 | 20.00 | 1 | 4 | 21 | 0 | 17.08 | 1 | 1 | 0 | 3 | 13 | 5.75 | 22.97 | 11.17 | 45.23 | 0 | 8 | 6 | 8 | 8 | 3 | 98,933 | 127 | 13,928 | 93,853 | 65,499 | 28,354 | 0.4329 |
| 37 | 21.05 | 1 | 3 | 14 | 1 | 41.13 | 1 | 2 | 0 | 9 | 27 | 16.70 | 43.33 | 31.53 | 91.45 | 0 | 8 | 6 | 8 | 8 | 1 | 27,118 | 165 | 759 | 17,218 | 8876 | 8342 | 0.9398 |
| 38 | 20.00 | 1 | 4 | 21 | 0 | 17.08 | 1 | 1 | 0 | 3 | 13 | 5.75 | 22.97 | 11.17 | 45.23 | 0 | 8 | 6 | 8 | 8 | 0 | 28,452 | 137 | 1518 | 20,232 | 10,584 | 9648 | 0.9116 |
| 39 | 21.05 | 1 | 3 | 14 | 1 | 41.13 | 1 | 2 | 0 | 9 | 27 | 16.70 | 43.33 | 31.53 | 91.45 | 0 | 8 | 6 | 8 | 8 | 0 | 15,980 | 332 | 579 | 4360 | 1801 | 2559 | 1.4209 |
| 40 | 20.00 | 1 | 4 | 21 | 0 | 17.08 | 1 | 1 | 0 | 3 | 13 | 5.75 | 22.97 | 11.17 | 45.23 | 0 | 8 | 6 | 8 | 8 | 2 | 15,761 | 315 | 620 | 4736 | 1957 | 2780 | 1.4206 |
| 41 | 20.88 | 1 | 7 | 16 | 2 | 297.47 | 1 | 2 | 0 | 0 | 25 | 0.00 | 41.40 | 0.00 | 95.33 | 0 | 7 | 6 | 6 | 6 | 1 | 47,783 | 663 | 3046 | 24,578 | 11,769 | 12,810 | 1.0885 |
| 42 | 21.45 | 1 | 3 | 7 | 4 | 22.68 | 1 | 2 | 0 | 2 | 34 | 4.05 | 65.53 | 7.07 | 149.13 | 0 | 6 | 5 | 6 | 6 | 1 | 44,105 | 600 | 2647 | 23,105 | 11,050 | 12,055 | 1.0910 |
| 43 | 20.65 | 1 | 1 | 9 | 3 | 33.00 | 1 | 2 | 0 | 2 | 33 | 2.58 | 56.72 | 27.72 | 137.07 | 0 | 6 | 5 | 6 | 6 | 1 | 43,261 | 620 | 4914 | 21,561 | 7941 | 13,620 | 1.7151 |
| 44 | 20.88 | 1 | 7 | 16 | 2 | 297.47 | 1 | 2 | 0 | 0 | 25 | 0.00 | 41.40 | 0.00 | 95.33 | 0 | 7 | 6 | 6 | 6 | 4 | 76,663 | 1030 | 4405 | 40,613 | 18,289 | 22,324 | 1.2206 |
| 45 | 21.45 | 1 | 3 | 7 | 4 | 22.68 | 1 | 2 | 0 | 2 | 34 | 4.05 | 65.53 | 7.07 | 149.13 | 0 | 6 | 5 | 6 | 6 | 7 | 73,752 | 776 | 4320 | 46,592 | 22,544 | 24,048 | 1.0667 |
| 46 | 20.65 | 1 | 1 | 9 | 3 | 33.00 | 1 | 2 | 0 | 2 | 33 | 2.58 | 56.72 | 27.72 | 137.07 | 0 | 6 | 5 | 6 | 6 | 1 | 49,869 | 923 | 2826 | 17,564 | 6365 | 11,200 | 1.7597 |
| 47 | 20.88 | 1 | 7 | 16 | 2 | 297.47 | 1 | 2 | 0 | 0 | 25 | 0.00 | 41.40 | 0.00 | 95.33 | 0 | 7 | 6 | 6 | 6 | 1 | 119,304 | 288 | 9762 | 107,784 | 64,361 | 43,423 | 0.6747 |
| 48 | 21.45 | 1 | 3 | 7 | 4 | 22.68 | 1 | 2 | 0 | 2 | 34 | 4.05 | 65.53 | 7.07 | 149.13 | 0 | 6 | 5 | 6 | 6 | 0 | 110,491 | 200 | 15,972 | 102,491 | 56,396 | 46,095 | 0.8173 |
| 49 | 20.65 | 1 | 1 | 9 | 3 | 33.00 | 1 | 2 | 0 | 2 | 33 | 2.58 | 56.72 | 27.72 | 137.07 | 0 | 6 | 5 | 6 | 6 | 0 | 110,867 | 267 | 29,153 | 100,187 | 40,453 | 59,734 | 1.4766 |
| 50 | 21.45 | 1 | 3 | 7 | 4 | 22.68 | 1 | 2 | 0 | 2 | 34 | 4.05 | 65.53 | 7.07 | 149.13 | 0 | 6 | 5 | 6 | 6 | 0 | 28,119 | 296 | 1045 | 10,359 | 4712 | 5647 | 1.1984 |
| 51 | 20.65 | 1 | 1 | 9 | 3 | 33.00 | 1 | 2 | 0 | 2 | 33 | 2.58 | 56.72 | 27.72 | 137.07 | 0 | 6 | 5 | 6 | 6 | 0 | 30,047 | 268 | 884 | 13,967 | 6505 | 7462 | 1.1471 |
| 52 | 20.88 | 1 | 7 | 16 | 2 | 297.47 | 1 | 2 | 0 | 0 | 25 | 0.00 | 41.40 | 0.00 | 95.33 | 0 | 7 | 6 | 6 | 6 | 6 | 34,546 | 275 | 2194 | 18,046 | 4434 | 13,612 | 3.0699 |
| 53 | 21.45 | 1 | 3 | 7 | 4 | 22.68 | 1 | 2 | 0 | 2 | 34 | 4.05 | 65.53 | 7.07 | 149.13 | 0 | 6 | 5 | 6 | 6 | 9 | 14,462 | 338 | 608 | 2632 | 938 | 1694 | 1.8060 |
| 54 | 20.88 | 1 | 7 | 16 | 2 | 297.47 | 1 | 2 | 0 | 0 | 25 | 0.00 | 41.40 | 0.00 | 95.33 | 0 | 7 | 6 | 6 | 6 | 0 | 16,956 | 312 | 752 | 6036 | 2867 | 3169 | 1.1053 |
| 55 | 20.65 | 1 | 1 | 9 | 3 | 33.00 | 1 | 2 | 0 | 2 | 33 | 2.58 | 56.72 | 27.72 | 137.07 | 0 | 6 | 5 | 6 | 6 | 0 | 14,508 | 258 | 954 | 5478 | 2507 | 2971 | 1.1851 |
| 56 | 21.67 | 1 | 2 | 16 | 1 | 16.10 | 1 | 2 | 1 | 10 | 20 | 11.80 | 24.63 | 36.27 | 91.50 | 0 | 7 | 7 | 7 | 7 | 0 | 32,729 | 593 | 1571 | 11,974 | 5692 | 6283 | 1.1038 |
| 57 | 21.67 | 1 | 2 | 16 | 1 | 16.10 | 1 | 2 | 1 | 10 | 20 | 11.80 | 24.63 | 36.27 | 91.50 | 0 | 7 | 7 | 7 | 7 | 1 | 45,795 | 894 | 2346 | 14,505 | 6949 | 7556 | 1.0874 |
| 58 | 21.67 | 1 | 2 | 16 | 1 | 16.10 | 1 | 2 | 1 | 10 | 20 | 11.80 | 24.63 | 36.27 | 91.50 | 0 | 7 | 7 | 7 | 7 | 0 | 22,968 | 306 | 778 | 4608 | 2249 | 2359 | 1.0489 |
| 59 | 21.67 | 1 | 2 | 16 | 1 | 16.10 | 1 | 2 | 1 | 10 | 20 | 11.80 | 24.63 | 36.27 | 91.50 | 0 | 7 | 7 | 7 | 7 | 0 | 83,933 | 267 | 7525 | 73,253 | 45,676 | 27,577 | 0.6038 |
| 60 | 21.67 | 1 | 2 | 16 | 1 | 16.10 | 1 | 2 | 1 | 10 | 20 | 11.80 | 24.63 | 36.27 | 91.50 | 0 | 7 | 7 | 7 | 7 | 0 | 14,721 | 334 | 539 | 3031 | 1029 | 2002 | 1.9456 |
| 61 | 21.05 | 1 | 4 | 13 | 0 | 21.02 | 1 | 2 | 1 | 4 | 25 | 4.00 | 27.83 | 23.73 | 118.43 | 0 | 8 | 6 | 8 | 6 | 2 | 39,858 | 610 | 2398 | 18,508 | 9894 | 8614 | 0.8706 |
| 62 | 21.05 | 1 | 4 | 13 | 0 | 21.02 | 1 | 2 | 1 | 4 | 25 | 4.00 | 27.83 | 23.73 | 118.43 | 0 | 8 | 6 | 8 | 6 | 1 | 45,003 | 1027 | 1886 | 9058 | 4719 | 4340 | 0.9197 |
| 63 | 21.05 | 1 | 4 | 13 | 0 | 21.02 | 1 | 2 | 1 | 4 | 25 | 4.00 | 27.83 | 23.73 | 118.43 | 0 | 8 | 6 | 8 | 6 | 0 | 80,844 | 209 | 15,144 | 72,484 | 36,809 | 35,675 | 0.9692 |
| 64 | 21.05 | 1 | 4 | 13 | 0 | 21.02 | 1 | 2 | 1 | 4 | 25 | 4.00 | 27.83 | 23.73 | 118.43 | 0 | 8 | 6 | 8 | 6 | 1 | 21,293 | 139 | 735 | 12,953 | 6095 | 6858 | 1.1252 |
| 65 | 18.33 | 1 | 2 | 11 | 3 | 42.53 | 1 | 2 | 0 | 12 | 16 | 19.30 | 26.37 | 42.63 | 88.88 | 0 | 8 | 5 | 6 | 6 | 0 | 34,367 | 650 | 1675 | 11,617 | 5401 | 6216 | 1.1509 |
| 66 | 18.33 | 1 | 2 | 11 | 3 | 42.53 | 1 | 2 | 0 | 12 | 16 | 19.30 | 26.37 | 42.63 | 88.88 | 0 | 8 | 5 | 6 | 6 | 5 | 49,160 | 1040 | 2479 | 12,760 | 4925 | 7835 | 1.5909 |
| 67 | 18.33 | 1 | 2 | 11 | 3 | 42.53 | 1 | 2 | 0 | 12 | 16 | 19.30 | 26.37 | 42.63 | 88.88 | 0 | 8 | 5 | 6 | 6 | 1 | 67,096 | 255 | 5033 | 56,896 | 35,160 | 21,736 | 0.6182 |
| 68 | 18.33 | 1 | 2 | 11 | 3 | 42.53 | 1 | 2 | 0 | 12 | 16 | 19.30 | 26.37 | 42.63 | 88.88 | 0 | 8 | 5 | 6 | 6 | 0 | 21,941 | 194 | 662 | 10,301 | 5340 | 4961 | 0.9290 |
| 69 | 21.82 | 1 | 2 | 6 | 2 | 21.92 | 1 | 2 | 0 | 8 | 16 | 9.08 | 19.93 | 32.77 | 111.78 | 0 | 8 | 6 | 8 | 6 | 0 | 28,792 | 648 | 1403 | 6112 | 2031 | 4081 | 2.0094 |
| 70 | 21.82 | 1 | 2 | 6 | 2 | 21.92 | 1 | 2 | 0 | 8 | 16 | 9.08 | 19.93 | 32.77 | 111.78 | 0 | 8 | 6 | 8 | 6 | 2 | 40,802 | 904 | 1404 | 9162 | 4684 | 4478 | 0.9560 |
| 71 | 21.82 | 1 | 2 | 6 | 2 | 21.92 | 1 | 2 | 0 | 8 | 16 | 9.08 | 19.93 | 32.77 | 111.78 | 0 | 8 | 6 | 8 | 6 | 0 | 43,302 | 182 | 3348 | 36,022 | 20,999 | 15,023 | 0.7154 |
| 72 | 21.82 | 1 | 2 | 6 | 2 | 21.92 | 1 | 2 | 0 | 8 | 16 | 9.08 | 19.93 | 32.77 | 111.78 | 0 | 8 | 6 | 8 | 6 | 0 | 17,394 | 97 | 1050 | 11,574 | 6823 | 4751 | 0.6963 |
| 73 | 21.05 | 1 | 4 | 13 | 0 | 21.02 | 1 | 2 | 1 | 4 | 25 | 4.00 | 27.83 | 23.73 | 118.43 | 0 | 8 | 6 | 8 | 6 | 1 | 12,721 | 224 | 735 | 4881 | 2210 | 2671 | 1.2086 |
| 74 | 18.33 | 1 | 2 | 11 | 3 | 42.53 | 1 | 2 | 0 | 12 | 16 | 19.30 | 26.37 | 42.63 | 88.88 | 0 | 8 | 5 | 6 | 6 | 4 | 11,663 | 232 | 520 | 3543 | 1504 | 2039 | 1.3557 |
| 75 | 21.82 | 1 | 2 | 6 | 2 | 21.92 | 1 | 2 | 0 | 8 | 16 | 9.08 | 19.93 | 32.77 | 111.78 | 0 | 8 | 6 | 8 | 6 | 1 | 10,676 | 166 | 469 | 4866 | 2290 | 2576 | 1.1249 |
| 76 | 19.68 | 1 | 7 | 22 | 0 | 216.75 | 1 | 2 | 0 | 0 | 12 | 0.00 | 18.83 | 0.00 | 46.00 | 0 | 8 | 6 | 8 | 8 | 6 | 53,930 | 764 | 4265 | 27,190 | 18,640 | 8550 | 0.4587 |
| 77 | 19.78 | 1 | 4 | 16 | 1 | 46.68 | 1 | 2 | 0 | 2 | 19 | 2.00 | 31.77 | 21.87 | 81.28 | 0 | 8 | 6 | 8 | 8 | 1 | 35,228 | 689 | 1637 | 11,113 | 4582 | 6532 | 1.4256 |
| 78 | 19.98 | 1 | 2 | 14 | 0 | 18.25 | 0 | 1 | 0 | 8 | 27 | 12.60 | 40.75 | 26.33 | 94.43 | 1 | 8 | 6 | 8 | 8 | 1 | 40,475 | 773 | 1861 | 13,420 | 7659 | 5762 | 0.7523 |
| 79 | 19.92 | 1 | 2 | 11 | 2 | 20.08 | 1 | 2 | 0 | 6 | 24 | 10.13 | 38.08 | 23.80 | 111.03 | 0 | 8 | 6 | 8 | 8 | 1 | 34,512 | 706 | 1483 | 9802 | 4797 | 5005 | 1.0434 |
| 80 | 19.92 | 1 | 2 | 11 | 2 | 20.08 | 1 | 2 | 0 | 6 | 24 | 10.13 | 38.08 | 23.80 | 111.03 | 0 | 8 | 6 | 8 | 8 | 4 | 50,530 | 942 | 3055 | 17,560 | 7361 | 10,199 | 1.3855 |
| 81 | 19.78 | 1 | 4 | 16 | 1 | 46.68 | 1 | 2 | 0 | 2 | 19 | 2.00 | 31.77 | 21.87 | 81.28 | 0 | 8 | 6 | 8 | 8 | 3 | 48,723 | 969 | 2668 | 14,808 | 5360 | 9449 | 1.7629 |
| 82 | 19.68 | 1 | 7 | 22 | 0 | 216.75 | 1 | 2 | 0 | 0 | 12 | 0.00 | 18.83 | 0.00 | 46.00 | 0 | 8 | 6 | 8 | 8 | 2 | 56,692 | 1028 | 2459 | 20,712 | 6978 | 13,734 | 1.9682 |
| 83 | 19.98 | 1 | 2 | 14 | 0 | 18.25 | 0 | 1 | 0 | 8 | 27 | 12.60 | 40.75 | 26.33 | 94.43 | 1 | 8 | 6 | 8 | 8 | 2 | 61,508 | 1056 | 5393 | 24,548 | 7521 | 17,027 | 2.2639 |
| 84 | 19.78 | 1 | 4 | 16 | 1 | 46.68 | 1 | 2 | 0 | 2 | 19 | 2.00 | 31.77 | 21.87 | 81.28 | 0 | 8 | 6 | 8 | 8 | 0 | 80,223 | 188 | 13,363 | 72,703 | 43,091 | 29,612 | 0.6872 |
| 85 | 19.68 | 1 | 7 | 22 | 0 | 216.75 | 1 | 2 | 0 | 0 | 12 | 0.00 | 18.83 | 0.00 | 46.00 | 0 | 8 | 6 | 8 | 8 | 0 | 149,004 | 162 | 18,150 | 142,524 | 98,975 | 43,549 | 0.4400 |
| 86 | 19.98 | 1 | 2 | 14 | 0 | 18.25 | 0 | 1 | 0 | 8 | 27 | 12.60 | 40.75 | 26.33 | 94.43 | 1 | 8 | 6 | 8 | 8 | 0 | 149,015 | 465 | 16,770 | 130,415 | 58,137 | 72,278 | 1.2432 |
| 87 | 19.92 | 1 | 2 | 11 | 2 | 20.08 | 1 | 2 | 0 | 6 | 24 | 10.13 | 38.08 | 23.80 | 111.03 | 0 | 8 | 6 | 8 | 8 | 1 | 111,350 | 152 | 15,477 | 105,270 | 67,556 | 37,714 | 0.5583 |
| 88 | 19.68 | 1 | 7 | 22 | 0 | 216.75 | 1 | 2 | 0 | 0 | 12 | 0.00 | 18.83 | 0.00 | 46.00 | 0 | 8 | 6 | 8 | 8 | 2 | 28,685 | 196 | 890 | 16,925 | 8985 | 7940 | 0.8837 |
| 89 | 19.92 | 1 | 2 | 11 | 2 | 20.08 | 1 | 2 | 0 | 6 | 24 | 10.13 | 38.08 | 23.80 | 111.03 | 0 | 8 | 6 | 8 | 8 | 3 | 27,924 | 123 | 844 | 20,544 | 10,070 | 10,474 | 1.0401 |
| 90 | 19.78 | 1 | 4 | 16 | 1 | 46.68 | 1 | 2 | 0 | 2 | 19 | 2.00 | 31.77 | 21.87 | 81.28 | 0 | 8 | 6 | 8 | 8 | 2 | 26,983 | 110 | 1253 | 20,383 | 10,968 | 9415 | 0.8584 |
| 91 | 19.98 | 1 | 2 | 14 | 0 | 18.25 | 0 | 1 | 0 | 8 | 27 | 12.60 | 40.75 | 26.33 | 94.43 | 1 | 8 | 6 | 8 | 8 | 0 | 28,935 | 180 | 827 | 18,135 | 9133 | 9002 | 0.9857 |
| 92 | 19.98 | 1 | 2 | 14 | 0 | 18.25 | 0 | 1 | 0 | 8 | 27 | 12.60 | 40.75 | 26.33 | 94.43 | 1 | 8 | 6 | 8 | 8 | 0 | 15,993 | 333 | 647 | 4338 | 1589 | 2750 | 1.7309 |
| 93 | 19.92 | 1 | 2 | 11 | 2 | 20.08 | 1 | 2 | 0 | 6 | 24 | 10.13 | 38.08 | 23.80 | 111.03 | 0 | 8 | 6 | 8 | 8 | 3 | 15,019 | 335 | 611 | 3294 | 1366 | 1929 | 1.4123 |
| 94 | 19.78 | 1 | 4 | 16 | 1 | 46.68 | 1 | 2 | 0 | 2 | 19 | 2.00 | 31.77 | 21.87 | 81.28 | 0 | 8 | 6 | 8 | 8 | 12 | 14,831 | 340 | 555 | 1699 | 1196 | 503 | 0.4206 |
| 95 | 19.68 | 1 | 7 | 22 | 0 | 216.75 | 1 | 2 | 0 | 0 | 12 | 0.00 | 18.83 | 0.00 | 46.00 | 0 | 8 | 6 | 8 | 8 | 3 | 15,461 | 296 | 643 | 5101 | 2299 | 2802 | 1.2188 |
| 96 | 20.90 | 1 | 5 | 11 | 3 | 40.00 | 1 | 2 | 0 | 4 | 36 | 6.52 | 61.12 | 18.15 | 129.93 | 0 | 6 | 5 | 6 | 6 | 0 | 39,822 | 672 | 2617 | 16,302 | 7387 | 8915 | 1.2068 |
| 97 | 20.90 | 1 | 5 | 11 | 3 | 40.00 | 1 | 2 | 0 | 4 | 36 | 6.52 | 61.12 | 18.15 | 129.93 | 0 | 6 | 5 | 6 | 6 | 2 | 62,921 | 686 | 4858 | 38,911 | 17,394 | 21,517 | 1.2370 |
| 98 | 20.90 | 1 | 5 | 11 | 3 | 40.00 | 1 | 2 | 0 | 4 | 36 | 6.52 | 61.12 | 18.15 | 129.93 | 0 | 6 | 5 | 6 | 6 | 1 | 102,063 | 302 | 16,578 | 89,983 | 24,508 | 65,475 | 2.6716 |
| 99 | 20.90 | 1 | 5 | 11 | 3 | 40.00 | 1 | 2 | 0 | 4 | 36 | 6.52 | 61.12 | 18.15 | 129.93 | 0 | 6 | 5 | 6 | 6 | 0 | 24,765 | 218 | 721 | 11,685 | 6480 | 5205 | 0.8032 |
| 100 | 20.90 | 1 | 5 | 11 | 3 | 40.00 | 1 | 2 | 0 | 4 | 36 | 6.52 | 61.12 | 18.15 | 129.93 | 0 | 6 | 5 | 6 | 6 | 2 | 13,648 | 293 | 805 | 3393 | 1560 | 1834 | 1.1757 |
| 101 | 20.95 | 1 | 2 | 19 | 0 | 17.30 | 1 | 2 | 1 | 15 | 20 | 18.78 | 26.05 | 36.60 | 68.98 | 0 | 7 | 7 | 7 | 6 | 0 | 30,855 | 610 | 1594 | 9505 | 4305 | 5200 | 1.2079 |
| 102 | 21.77 | 1 | 2 | 17 | 0 | 15.15 | 1 | 2 | 0 | 12 | 23 | 11.85 | 23.30 | 32.70 | 78.67 | 0 | 6 | 6 | 6 | 6 | 1 | 31,794 | 608 | 1498 | 10,514 | 5258 | 5256 | 0.9996 |
| 103 | 18.27 | 1 | 5 | 18 | 0 | 12.17 | 1 | 2 | 1 | 0 | 16 | 0.00 | 16.73 | 8.00 | 71.43 | 0 | 7 | 7 | 7 | 7 | 0 | 30,297 | 637 | 1539 | 8002 | 3792 | 4211 | 1.1105 |
| 104 | 20.95 | 1 | 2 | 19 | 0 | 17.30 | 1 | 2 | 1 | 15 | 20 | 18.78 | 26.05 | 36.60 | 68.98 | 0 | 7 | 7 | 7 | 6 | 2 | 43,923 | 836 | 1797 | 14,663 | 8374 | 6289 | 0.7510 |
| 105 | 18.27 | 1 | 5 | 18 | 0 | 12.17 | 1 | 2 | 1 | 0 | 16 | 0.00 | 16.73 | 8.00 | 71.43 | 0 | 7 | 7 | 7 | 7 | 0 | 43,862 | 965 | 1837 | 10,087 | 3754 | 6334 | 1.6874 |
| 106 | 21.77 | 1 | 2 | 17 | 0 | 15.15 | 1 | 2 | 0 | 12 | 23 | 11.85 | 23.30 | 32.70 | 78.67 | 0 | 6 | 6 | 6 | 6 | 0 | 42,698 | 1040 | 1600 | 6298 | 3230 | 3068 | 0.9498 |
| 107 | 18.27 | 1 | 5 | 18 | 0 | 12.17 | 1 | 2 | 1 | 0 | 16 | 0.00 | 16.73 | 8.00 | 71.43 | 0 | 7 | 7 | 7 | 7 | 0 | 17,640 | 214 | 484 | 4800 | 2451 | 2349 | 0.9584 |
| 108 | 21.77 | 1 | 2 | 17 | 0 | 15.15 | 1 | 2 | 0 | 12 | 23 | 11.85 | 23.30 | 32.70 | 78.67 | 0 | 6 | 6 | 6 | 6 | 0 | 18,397 | 178 | 637 | 7717 | 4260 | 3457 | 0.8115 |
| 109 | 20.95 | 1 | 2 | 19 | 0 | 17.30 | 1 | 2 | 1 | 15 | 20 | 18.78 | 26.05 | 36.60 | 68.98 | 0 | 7 | 7 | 7 | 6 | 0 | 22,695 | 191 | 1742 | 11,235 | 4882 | 6353 | 1.3013 |
| 110 | 20.95 | 1 | 2 | 19 | 0 | 17.30 | 1 | 2 | 1 | 15 | 20 | 18.78 | 26.05 | 36.60 | 68.98 | 0 | 7 | 7 | 7 | 6 | 0 | 77,577 | 172 | 8529 | 70,697 | 46,719 | 23,978 | 0.5132 |
| 111 | 21.77 | 1 | 2 | 17 | 0 | 15.15 | 1 | 2 | 0 | 12 | 23 | 11.85 | 23.30 | 32.70 | 78.67 | 0 | 6 | 6 | 6 | 6 | 0 | 58,345 | 227 | 6089 | 49,265 | 25,053 | 24,212 | 0.9664 |
| 112 | 18.27 | 1 | 5 | 18 | 0 | 12.17 | 1 | 2 | 1 | 0 | 16 | 0.00 | 16.73 | 8.00 | 71.43 | 0 | 7 | 7 | 7 | 7 | 0 | 59,546 | 300 | 6115 | 47,546 | 25,010 | 22,536 | 0.9011 |
| 113 | 20.95 | 1 | 2 | 19 | 0 | 17.30 | 1 | 2 | 1 | 15 | 20 | 18.78 | 26.05 | 36.60 | 68.98 | 0 | 7 | 7 | 7 | 6 | 2 | 13,792 | 295 | 529 | 3467 | 1484 | 1984 | 1.3370 |
| 114 | 18.27 | 1 | 5 | 18 | 0 | 12.17 | 1 | 2 | 1 | 0 | 16 | 0.00 | 16.73 | 8.00 | 71.43 | 0 | 7 | 7 | 7 | 7 | 0 | 14,711 | 316 | 630 | 3651 | 1650 | 2001 | 1.2127 |
| 115 | 21.77 | 1 | 2 | 17 | 0 | 15.15 | 1 | 2 | 0 | 12 | 23 | 11.85 | 23.30 | 32.70 | 78.67 | 0 | 6 | 6 | 6 | 6 | 0 | 13,618 | 301 | 546 | 3083 | 1439 | 1645 | 1.1432 |
| 116 | 20.77 | 1 | 1 | 6 | 3 | 34.92 | 1 | 1 | 1 | 12 | 25 | 15.48 | 37.73 | 40.97 | 122.38 | 3 | 8 | 6 | 8 | 6 | 0 | 32,450 | 639 | 1482 | 10,085 | 4782 | 5304 | 1.1092 |
| 117 | 20.77 | 1 | 1 | 6 | 3 | 34.92 | 1 | 1 | 1 | 12 | 25 | 15.48 | 37.73 | 40.97 | 122.38 | 3 | 8 | 6 | 8 | 6 | 3 | 53,631 | 1060 | 3893 | 16,531 | 6849 | 9682 | 1.4136 |
| 118 | 20.77 | 1 | 1 | 6 | 3 | 34.92 | 1 | 1 | 1 | 12 | 25 | 15.48 | 37.73 | 40.97 | 122.38 | 3 | 8 | 6 | 8 | 6 | 0 | 74,068 | 393 | 9284 | 58,348 | 34,856 | 23,492 | 0.6740 |
| 119 | 20.77 | 1 | 1 | 6 | 3 | 34.92 | 1 | 1 | 1 | 12 | 25 | 15.48 | 37.73 | 40.97 | 122.38 | 3 | 8 | 6 | 8 | 6 | 1 | 20,984 | 178 | 642 | 10,304 | 5550 | 4754 | 0.8566 |
| 120 | 20.82 | 1 | 2 | 10 | 1 | 13.27 | 1 | 2 | 0 | 11 | 20 | 12.68 | 25.22 | 40.25 | 145.33 | 2 | 8 | 6 | 8 | 8 | 0 | 36,645 | 773 | 2135 | 9590 | 5763 | 3828 | 0.6642 |
| 121 | 20.82 | 1 | 2 | 10 | 1 | 13.27 | 1 | 2 | 0 | 11 | 20 | 12.68 | 25.22 | 40.25 | 145.33 | 2 | 8 | 6 | 8 | 8 | 2 | 55,586 | 1272 | 2483 | 11,066 | 4286 | 6780 | 1.5819 |
| 122 | 20.82 | 1 | 2 | 10 | 1 | 13.27 | 1 | 2 | 0 | 11 | 20 | 12.68 | 25.22 | 40.25 | 145.33 | 2 | 8 | 6 | 8 | 8 | 2 | 75,727 | 349 | 6821 | 61,767 | 31,613 | 30,154 | 0.9538 |
| 123 | 20.82 | 1 | 2 | 10 | 1 | 13.27 | 1 | 2 | 0 | 11 | 20 | 12.68 | 25.22 | 40.25 | 145.33 | 2 | 8 | 6 | 8 | 8 | 1 | 23,328 | 191 | 694 | 11,868 | 6394 | 5474 | 0.8561 |
| 124 | 20.77 | 1 | 1 | 6 | 3 | 34.92 | 1 | 1 | 1 | 12 | 25 | 15.48 | 37.73 | 40.97 | 122.38 | 3 | 8 | 6 | 8 | 6 | 0 | 11,091 | 231 | 681 | 3006 | 779 | 2228 | 2.8613 |
| 125 | 20.82 | 1 | 2 | 10 | 1 | 13.27 | 1 | 2 | 0 | 11 | 20 | 12.68 | 25.22 | 40.25 | 145.33 | 2 | 8 | 6 | 8 | 8 | 1 | 12,621 | 231 | 576 | 4536 | 2097 | 2440 | 1.1636 |
| 126 | 20.62 | 1 | 2 | 13 | 0 | 13.32 | 1 | 2 | 0 | 13 | 29 | 21.82 | 45.55 | 39.40 | 100.02 | 2 | 8 | 6 | 8 | 8 | 0 | 36,827 | 760 | 1672 | 10,227 | 5104 | 5123 | 1.0037 |
| 127 | 20.62 | 1 | 2 | 13 | 0 | 13.32 | 1 | 2 | 0 | 13 | 29 | 21.82 | 45.55 | 39.40 | 100.02 | 2 | 8 | 6 | 8 | 8 | 1 | 63,795 | 1114 | 4864 | 24,805 | 6003 | 18,802 | 3.1321 |
| 128 | 20.62 | 1 | 2 | 13 | 0 | 13.32 | 1 | 2 | 0 | 13 | 29 | 21.82 | 45.55 | 39.40 | 100.02 | 2 | 8 | 6 | 8 | 8 | 0 | 162,276 | 314 | 30,380 | 149,716 | 64,774 | 84,942 | 1.3114 |
| 129 | 20.62 | 1 | 2 | 13 | 0 | 13.32 | 1 | 2 | 0 | 13 | 29 | 21.82 | 45.55 | 39.40 | 100.02 | 2 | 8 | 6 | 8 | 8 | 1 | 29,406 | 197 | 966 | 17,586 | 9336 | 8250 | 0.8837 |
| 130 | 20.62 | 1 | 2 | 13 | 0 | 13.32 | 1 | 2 | 0 | 13 | 29 | 21.82 | 45.55 | 39.40 | 100.02 | 2 | 8 | 6 | 8 | 8 | 0 | 16,300 | 328 | 671 | 4820 | 2148 | 2672 | 1.2439 |
| 131 | 20.88 | 1 | 2 | 8 | 0 | 13.05 | 1 | 2 | 0 | 9 | 37 | 15.53 | 58.70 | 36.88 | 144.80 | 2 | 5 | 5 | 6 | 6 | 2 | 50,920 | 690 | 2242 | 26,770 | 11,861 | 14,909 | 1.2570 |
| 132 | 20.88 | 1 | 2 | 8 | 0 | 13.05 | 1 | 2 | 0 | 9 | 37 | 15.53 | 58.70 | 36.88 | 144.80 | 2 | 5 | 5 | 6 | 6 | 4 | 59,715 | 820 | 3766 | 31,015 | 14,602 | 16,413 | 1.1240 |
| 133 | 20.88 | 1 | 2 | 8 | 0 | 13.05 | 1 | 2 | 0 | 9 | 37 | 15.53 | 58.70 | 36.88 | 144.80 | 2 | 5 | 5 | 6 | 6 | 0 | 91,758 | 263 | 7274 | 81,238 | 42,932 | 38,306 | 0.8922 |
| 134 | 20.88 | 1 | 2 | 8 | 0 | 13.05 | 1 | 2 | 0 | 9 | 37 | 15.53 | 58.70 | 36.88 | 144.80 | 2 | 5 | 5 | 6 | 6 | 0 | 26,104 | 174 | 1097 | 15,664 | 7404 | 8260 | 1.1156 |
| 135 | 20.88 | 1 | 2 | 8 | 0 | 13.05 | 1 | 2 | 0 | 9 | 37 | 15.53 | 58.70 | 36.88 | 144.80 | 2 | 5 | 5 | 6 | 6 | 0 | 15,495 | 253 | 612 | 6640 | 2990 | 3651 | 1.2211 |
References
- Fatigue Management Guide for Airline Operators. Available online: https://www.icao.int/safety/fatiguemanagement/FRMS%20Tools/FMG%20for%20Airline%20Operators%202nd%20Ed%20(Final)%20EN.pdf (accessed on 12 April 2023).
- Hartzler, B.M. Fatigue on the flight deck: The consequences of sleep loss and the benefits of napping. Accid. Anal. Prev. 2014, 62, 309–318. [Google Scholar] [CrossRef]
- Fakleš, D.; Petrin, I.; Simonić, D. The Issue of Fatigue in Planning Flight Operations. In Proceedings of the Medical, Technical and Legal Aspects of Traffic Safety, Zagreb, Croatia, 1 December 2009. [Google Scholar]
- Bendak, S.; Rashid, H. Fatigue in aviation: A systematic review of the literature. Int. J. Ind. Ergon. 2020, 76, 102928. [Google Scholar] [CrossRef]
- Horne, J.A.; Ostberg, O. A self-assessment questionnaire to determine morningness-eveningness in human circadian rhythms. Int. J. Chronobiol. 1976, 4, 97–110. [Google Scholar]
- Saksvik, I.B.; Bjorvatn, B.; Hetland, H.; Sandal, G.M.; Pallesen, S. Individual differences in tolerance to shift work: A systematic review. Sleep Med. Rev. 2011, 15, 221–235. [Google Scholar] [CrossRef]
- Kakinami, L.; O’Loughlin, E.K.; Brunet, J.; Dugas, E.N.; Constantin, E.; Sabiston, C.M.; O’Loughlin, J. Associations between physical activity and sedentary behavior with sleep quality and quantity in young adults. Sleep Health 2016, 3, 56–61. [Google Scholar] [CrossRef]
- King, A.C.; Oman, R.F.; Brassington, G.S.; Bliwise, D.L.; Haskell, W.L. Moderate-intensity exercise and self-rated quality of sleep in older adults. JAMA 1997, 277, 32–37. [Google Scholar] [CrossRef]
- Commission Regulation (EU) No 83/2014. Annex II. Subpart FTL. Flight and Duty Time Limitations and Rest Requirements. Available online: https://eur-lex.europa.eu/legal-content/EN/TXT/?uri=CELEX:32014R0083 (accessed on 15 July 2023).
- Van den Berg, J.; Neely, G. Performance on a simple reaction time task while sleep deprived. Percept. Mot. Skills 2006, 102, 589–599. [Google Scholar] [CrossRef]
- Bougard, C.; Espie, S.; Larnaudie, B.; Moussay, S.; Davenne, D. Effects of time of day and sleep deprivation on motorcycle-driving performance. PLoS ONE 2012, 7, e39735. [Google Scholar] [CrossRef]
- Steiner, S.; Bartulović, D.; Fakleš, D. Integration of Fatigue Risk Management in Aviation Safety Management System. In Proceedings of the 18th International Conference on Transport Science, Portorož, Slovenia, 14–15 June 2018. [Google Scholar]
- Goode, J.H. Are pilots at risk of accidents due to fatigue? J. Saf. Res. 2003, 34, 309–313. [Google Scholar] [CrossRef]
- Williamson, A.; Lombardi, D.A.; Folkard, S.; Stutts, J.; Courtney, T.K.; Connor, J.L. The link between fatigue and safety. Accid. Anal. Prev. 2011, 43, 498–515. [Google Scholar] [CrossRef]
- Caldwell, J.A. Crew schedules, sleep deprivation, and aviation performance. Curr. Dir. Psychol. Sci. 2012, 21, 85–89. [Google Scholar] [CrossRef]
- Cabon, P.; Bourgeois-Bougrine, S.; Mollard, R.; Coblentz, A.; Speyer, J.J. Flight and duty time limitations in civil aviation and their impact on crew fatigue: A comparative analysis of 26 national regulations. Hum. Factors Aerosp. Safety. 2002, 2, 379–393. [Google Scholar]
- Caldwell, J.A.; Mallis, M.M.; Caldwell, J.L.; Paul, M.A.; Miller, J.C.; Neri, D.F. Fatigue countermeasures in aviation. Aviat. Space Environ. Med. 2009, 80, 29–59. [Google Scholar] [CrossRef] [PubMed]
- Fatigue Risk Management Systems. Implementation Guide for Operators. Available online: www.icao.int/safety/fatiguemanagement/frms%20tools/frms%20implementation%20guide%20for%20operators%20july%202011.pdf (accessed on 12 April 2023).
- Steiner, S.; Fakleš, D.; Bartulović, D. Methodological Approach to Fatigue Risk Mitigation in Flight Operations. In Proceedings of the International Conference on Traffic and Transport Engineering (ICTTE 2018), Belgrade, Serbia, 27–28 September 2018. [Google Scholar]
- Gander, P.H.; Graeber, R.C.; Foushee, H.C.; Lauber, J.K.; Connell, L.J. Crew Factors in Flight Operations II: Psychophysiological Responses to Short-Haul Air Transport Operations; NASA Ames Research Center: Moffett Field, USA, 1994.
- CRD Series Tests of Cognitive Functions. Available online: https://www.crd.hr/wp/ (accessed on 12 March 2023).
- Bartulović, D.; Steiner, S. Conceptual model of predictive safety management methodology in aviation. Aerospace 2023, 10, 268. [Google Scholar] [CrossRef]
- Bartulović, D. Development of Predictive Safety Management Methodology in Aviation. Doctoral Dissertation, University of Zagreb, Faculty of Transport and Traffic Sciences, Zagreb, Croatia, 2022. [Google Scholar]
- Bartulović, D. Predictive safety management system development. Trans. Marit. Sci. 2021, 10, 135–146. [Google Scholar] [CrossRef]
- Bartulović, D.; Steiner, S. Liaison between Proactive and Predictive Methodology of Aviation Safety Management System. In Proceedings of the 19th International Conference on Transport Science (ICTS 2020), Portorož, Slovenia, 17–18 September 2020. [Google Scholar]
- Bartulović, D.; Steiner, S. Cause-Effect Relations between Organizational and Safety Performance Indicators. In Proceedings of the 20th International Conference on Transport Science (ICTS 2022), Portorož, Slovenia, 23–24 May 2022. [Google Scholar]
- Bartulović, D.; Steiner, S. Predictive analysis of airport safety performance: Case study of Split Airport. Aerospace 2023, 10, 303. [Google Scholar] [CrossRef]
- IBM SPSS Statistics. Available online: https://www.ibm.com/support/pages/ibm-spss-statistics-2701-documentation (accessed on 23 April 2023).
- Starr, A.W., Jr. Tegrating Fatigue management with safety management systems for commercial flight crew operations. Int. J. Aviat. Aeronaut. Aerosp. 2017, 4, 1–13. [Google Scholar] [CrossRef]
- FAA AC 120-103: Fatigue Risk Management Systems for Aviation Safety. Available online: https://www.faa.gov/regulations_policies/advisory_circulars/index.cfm/go/document.information/documentid/1021088 (accessed on 4 September 2023).
- Steiner, S.; Fakleš, D.; Gradišar, T. Problems of Crew Fatigue Management in Airline Operations. In Proceedings of the 1st International Conference on Traffic and Transport Engineering (ICTTE 2012), Belgrade, Serbia, 29–30 November 2012. [Google Scholar]
- Powell, D.M.C.; Spencer, M.B.; Holland, D.; Broadbent, E.; Petrie, K.J. Pilot fatigue in short-haul operations: Effects of number of sectors, duty length, and time of day. Aviat. Space Environ. Med. 2007, 78, 698–701. [Google Scholar]
- Powell, D.M.C.; Spencer, M.B.; Holland, D.; Petrie, K.J. Fatigue in two-pilot operations: Implications for flight and duty time limitations. Aviat. Space Environ. Med. 2008, 79, 1047–1050. [Google Scholar] [CrossRef]
- Powell, D.M.C.; Spencer, M.B.; Petrie, K.J. Comparison of In-flight measures with predictions of a bio-mathematical fatigue model. Aviat. Space Environ. Med. 2014, 85, 1177–1184. [Google Scholar] [CrossRef]
- Gander, P.H.; Mulrine, H.M.; Van den Berg, M.J.; Smith, A.A.T.; Signal, T.L.; Wu, L.J.; Belenky, G. Pilot fatigue: Relationships with departure and arrival times, flight duration, and direction. Aviat. Space Environ. Med. 2014, 85, 833–840. [Google Scholar] [CrossRef] [PubMed]
- Van den Berg, M.J.; Signal, T.J.; Mulrine, H.M.; Smith, A.A.T.; Gander, P.H.; Serfontein, W. Monitoring and managing cabin crew sleep and fatigue during an ultra-long range trip. Aerosp. Med. Hum. Perform. 2015, 86, 705–713. [Google Scholar] [CrossRef]
- Yi, T.C.; Moochhala, S. Current opinion on salivary biomarkers as a measurement for stress and fatigue. Open Biomark. J. 2013, 6, 9–14. [Google Scholar] [CrossRef]
- Drenovac, M. Chronometry of Mental Processing Dynamics; Josip Juraj Strossmayer University, Philosophy Faculty: Osijek, Croatia, 2009. [Google Scholar]
- Petri, N. Change in strategy of solving psychological tests: Evidence of nitrogen narcosis in shallow air-diving. Undersea Hyperb. Med. 2003, 30, 293–303. [Google Scholar]
- Drenovac, S.; Drenovac, M. Fluctuations in the performance of dispatchers in solving mental and psychomotor tasks during day and night 12-hour shift. Hum. Traffic 1989, 15, 115–127. [Google Scholar]
- Drenovac, M. Sports Psychology; Josip Juraj Strossmayer University, Philosophy Faculty: Osijek, Croatia, 2005. [Google Scholar]
- Meško, M. Defining the Peculiarities of Some Movement Abilities and Psychological Characteristics of Slovenian Military Pilots. Ph.D. Thesis, University of Ljubljana, Faculty of Sport, Ljubljana, Slovenia, 2008. [Google Scholar]
- Drenovac, M.; Drenovac, S. Achievement on Time Restricted Tests as the Function of Previous Working Load. In Proceedings of the Fifth Congress of Yugoslav Psychologists, Skopje, Macedonia, 12–16 May 1976. [Google Scholar]
- Lučanin, D.; Matešić, K. Daily Variations in Work Efficiency on Short-Time Memory Examination Tasks; Days of Ramiro Bujas: Zagreb, Croatia, 1980. [Google Scholar]
- Laovoravit, V.; Pongpirul, K.; Manon, W.; Thiptananont, N.; Imsombut, A. Sleeping patterns of Thai Airways flight attendants during the off-duty period using a photovoice technique. Proceedings 2019, 39, 7. [Google Scholar] [CrossRef]
- Cahill, J.; Cullen, P.; Anwer, S.; Gaynor, K.; Wilson, S. The requirements for new tools for use by pilots and the aviation industry to manage risks pertaining to work-related stress (WRS) and wellbeing, and the ensuing impact on performance and safety. Technologies 2020, 8, 40. [Google Scholar] [CrossRef]
- Alaimo, A.; Esposito, A.; Orlando, C.; Simoncini, A. Aircraft pilots workload analysis: Heart Rate Variability objective measures and NASA-Task Load Index Subjective Evaluation. Aerospace 2020, 7, 137. [Google Scholar] [CrossRef]
- Naeeri, S.; Kang, Z.; Mandal, S.; Kim, K. Multimodal analysis of eye movements and fatigue in a simulated glass cockpit environment. Aerospace 2021, 8, 283. [Google Scholar] [CrossRef]
- Zhang, J.; Chen, Z.; Liu, W.; Ding, P.; Wu, Q. A field study of work type influence on air traffic controllers’ fatigue based on data-driven PERCLOS detection. Int. J. Environ. Res. Public Health 2021, 18, 11937. [Google Scholar] [CrossRef]
- Pan, T.; Wang, H.; Si, H.; Liu, H.; Xu, M. Research on the identification of pilots’ fatigue status based on functional near-infrared spectroscopy. Aerospace 2022, 9, 173. [Google Scholar] [CrossRef]
- Li, J.; Zhou, Y.; Zhang, X.; Fan, T. Fatigue during long-haul flights of different crew compositions under exemption from layover and flight time during COVID-19. Int. J. Environ. Res. Public Health 2022, 19, 13567. [Google Scholar] [CrossRef]
- Keller, J.; Mendonca, F.A.C.; Adjekum, D.K. Understanding factors underlying fatigue among collegiate aviation pilots in the United States. Safety 2022, 8, 46. [Google Scholar] [CrossRef]
- Alaminos-Torres, A.; Martínez-Álvarez, J.R.; Martínez-Lorca, M.; López-Ejeda, N.; Marrodán Serrano, M.D. Fatigue, work overload, and sleepiness in a sample of Spanish commercial airline pilots. Behav. Sci. 2023, 13, 300. [Google Scholar] [CrossRef] [PubMed]
- Borghini, G.; Astolfi, L.; Vecchiato, G.; Mattia, D.; Babiloni, F. Measuring neurophysiological signals in aircraft pilots and car drivers for the assessment of mental workload, fatigue and drowsiness. Neurosci. Biobehav. Rev. 2014, 44, 58–75. [Google Scholar] [CrossRef] [PubMed]
- Thomas, L.C.; Gast, C.; Grube, R.; Kimberly, C. Fatigue detection in commercial flight operations: Results using physiological measures. Procedia Manuf. 2015, 3, 2357–2364. [Google Scholar] [CrossRef]
- Lee, S.; Kim, J.K. Factors contributing to the risk of airline pilot fatigue. J. Air Transp. Manag. 2018, 67, 197–207. [Google Scholar] [CrossRef]
- Hu, X.; Lodewijks, G. Detecting fatigue in car drivers and aircraft pilots by using non-invasive measures: The value of differentiation of sleepiness and mental fatigue. J. Saf. Res. 2020, 72, 173–187. [Google Scholar] [CrossRef]
- Papanikou, M.C.; Frantzidis, C.A.; Nikolaidou, A.; Plomariti, C.; Karagianni, M.; Nigdelis, V.; Karkala, A.; Nday, C.; Ntakakis, G.; Krachtis, A.; et al. Neuroscientific tools in the cockpit: Towards a meaningful decision support system for fatigue risk management. In Proceedings of the MATEC Web Conference, International Cross-Industry Safety Conference & International Symposium on Aircraft Technology, MRO and Operations (ICSC-ISATECH 2019), Amsterdam, The Netherlands, 9–11 October 2019. [Google Scholar] [CrossRef]
- Coombes, C.; Whale, A.; Hunter, R.; Christie, N. Sleepiness on the flight deck: Reported rates of occurrence and predicted fatigue risk exposure associated with UK airline pilot work schedules. Saf. Sci. 2020, 129, 104833. [Google Scholar] [CrossRef]
- Qin, H.; Zhou, X.; Ou, X.; Liu, Y.; Xue, C. Detection of mental fatigue state using heart rate variability and eye metrics during simulated flight. Hum. Factors Ergon. Manuf. 2021, 31, 637–651. [Google Scholar] [CrossRef]
- Bongo, M.; Seva, R. Effect of fatigue in air traffic controllers’ workload, situation awareness, and control strategy. Int. J. Aerosp. Psychol. 2022, 32, 1–23. [Google Scholar] [CrossRef]
- Sun, J.Y.; Liao, Y.; Lu, F.; Sun, R.S.; Jia, H.B. Assessment of pilot fatigue risk on international flights under the prevention and control policy of the Chinese civil aviation industry during the COVID-19. J. Air Transp. Manag. 2023, 112, 102466. [Google Scholar] [CrossRef]
- Hamann, A.; Carstengerdes, N. Assessing the development of mental fatigue during simulated flights with concurrent EEG-fNIRS measurement. Sci. Rep. 2023, 13, 4738. [Google Scholar] [CrossRef] [PubMed]
- Veksler, B.Z.; Morris, M.B.; Krusmark, M.A.; Gunzelmann, G. Integrated modeling of fatigue impacts on C-17 approach and landing performance. Int. J. Aerosp. Psychol. 2023, 33, 61–78. [Google Scholar] [CrossRef]
- Granger, C.W.J. Investigating causal relations by econometric models and cross-spectral methods. Econometrica 1969, 37, 424–438. [Google Scholar] [CrossRef]
- Granger, C.W.J. Testing for causality: A personal viewpoint. J. Econ. Dyn. Control. 1980, 2, 329–352. [Google Scholar] [CrossRef]
- Granger, C.W.J. Some recent development in a concept of causality. J. Econom. 1988, 39, 199–211. [Google Scholar] [CrossRef]
- Senders, J.W.; Moray, N.P. Human Error Cause Prediction and Reduction; Lawrence Erlbaum: Hillsdale, NJ, USA, 1991. [Google Scholar]
- Spirtes, P.; Glymour, C.; Scheines, R. Causation, Prediction, and Search, 2nd ed.; MIT Press: Cambridge, UK, 2000. [Google Scholar]
- Sloman, S.A. Causal Models: How We Think about the World and Its Alternatives; Oxford University Press: New York, NY, USA, 2005. [Google Scholar]
- Liou, J.J.H.; Yen, L.; Tzeng, G.H. Building an effective safety management system for airlines. J. Air Transp. Manag. 2008, 14, 20–26. [Google Scholar] [CrossRef]
- Roelen, A.L.C. Causal Risk Models of Air Transport: Comparison of User Needs and Model Capabilities; IOS Press: Amsterdam, Netherlands, 2008. [Google Scholar]
- Rohrer, J.M. Thinking clearly about correlations and causation: Graphical causal models for observational data. Adv. Meth. Pract. Psychol. Sci. 2018, 1, 27–42. [Google Scholar] [CrossRef]
Figure 1.
Overall model quality.

Figure 2.
Temporal causal model of flight crew workload settings parameters, the subjective perception of fatigue, and CRD fatigue indicators.
Figure 2.
Temporal causal model of flight crew workload settings parameters, the subjective perception of fatigue, and CRD fatigue indicators.

Figure 3.
Direct impacts on targeted indicator Ifatigue—fatigue index: (a) Links with a statistical significance value less or equal to 0.05 (strong links); (b) All the links.
Figure 3.
Direct impacts on targeted indicator Ifatigue—fatigue index: (a) Links with a statistical significance value less or equal to 0.05 (strong links); (b) All the links.

Figure 4.
Impact diagram—causes of the fatigue Index (Ifatigue).

Figure 5.
Impact diagram—effects of the fatigue Index (Ifatigue).

Figure 6.
Relevant correlations between workload settings and flight crew fatigue (Ifatigue).
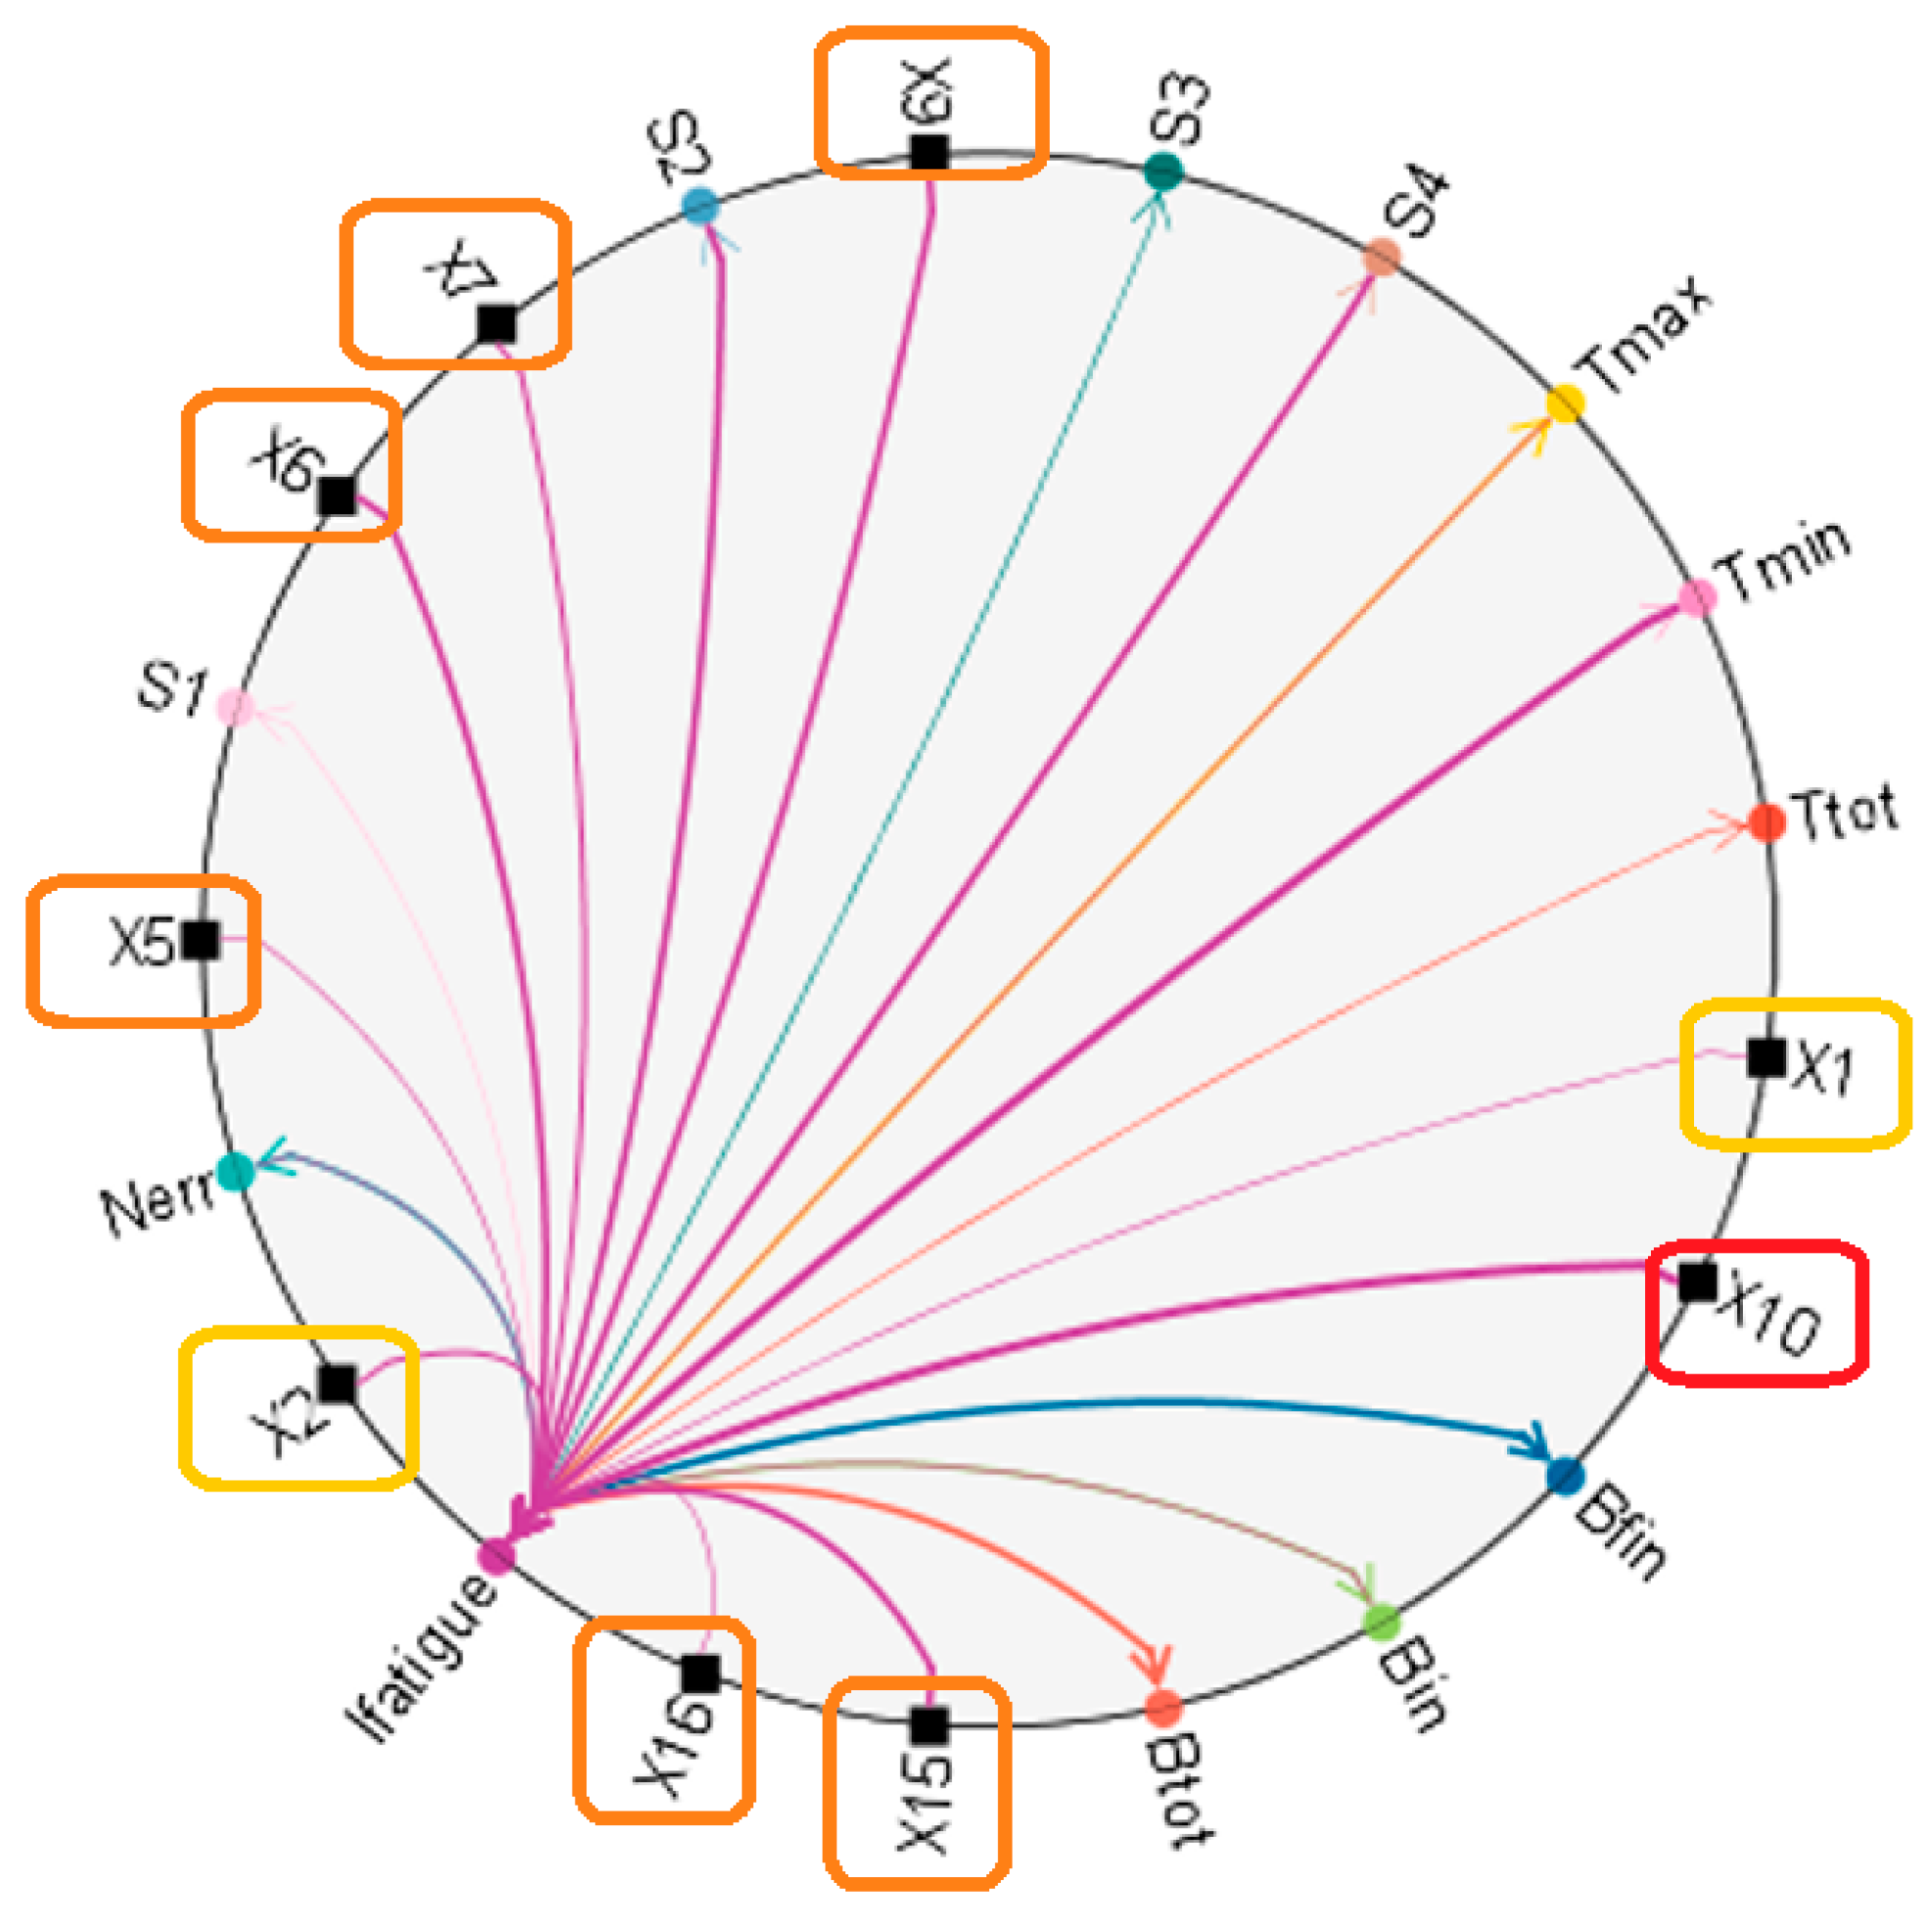
Figure 7.
Increasing workload settings indicator X5 in the observed dataset by 3 extra days off and its impact on the values of the fatigue index (Ifatigue): (a) A modified workload settings indicator X5; (b) impact of a modified X5 on Ifatigue (case scenario).
Figure 7.
Increasing workload settings indicator X5 in the observed dataset by 3 extra days off and its impact on the values of the fatigue index (Ifatigue): (a) A modified workload settings indicator X5; (b) impact of a modified X5 on Ifatigue (case scenario).

Figure 8.
Impacts of an increased workload settings indicator X5 in the observed dataset by 3 extra days off on the values of initial ballast (Bin) and final ballast (Bfin): (a) Impact of a modified X5 on Bin (scenario case); (b) impact of a modified X5 on Bfin (case scenario).
Figure 8.
Impacts of an increased workload settings indicator X5 in the observed dataset by 3 extra days off on the values of initial ballast (Bin) and final ballast (Bfin): (a) Impact of a modified X5 on Bin (scenario case); (b) impact of a modified X5 on Bfin (case scenario).

Figure 9.
Comparison of the case scenario values: (a) The original forecast values of the fatigue index (Ifatigue) vs. the case scenario forecast values of the fatigue index (Ifatigue’); (b) The case scenario values of the final ballast (Bfin’) vs. the case scenario values of the initial ballast (Bin’).

Figure 10.
Increasing workload settings indicator X6 in the observed dataset by 30% and its impact on the values of the fatigue index (Ifatigue): (a) A modified workload settings indicator X6; (b) impact of a modified X6 on Ifatigue (case scenario).
Figure 10.
Increasing workload settings indicator X6 in the observed dataset by 30% and its impact on the values of the fatigue index (Ifatigue): (a) A modified workload settings indicator X6; (b) impact of a modified X6 on Ifatigue (case scenario).

Figure 11.
Impacts of an increased workload settings indicator X6 in the observed dataset by 30% on the values of the initial ballast (Bin) and final ballast (Bfin): (a) Impact of a modified X6 on Bin (scenario case); (b) impact of a modified X6 on Bfin (case scenario).
Figure 11.
Impacts of an increased workload settings indicator X6 in the observed dataset by 30% on the values of the initial ballast (Bin) and final ballast (Bfin): (a) Impact of a modified X6 on Bin (scenario case); (b) impact of a modified X6 on Bfin (case scenario).

Figure 12.
Comparison of the case scenario values: (a) The original forecast values of the fatigue index (Ifatigue) vs. the case scenario forecast values of the fatigue index (Ifatigue’); (b) The case scenario values of the final ballast (Bfin’) vs. the case scenario values of the initial ballast (Bin’).

Figure 13.
Decreasing workload settings indicator X6 in the observed dataset by 30% and its impact on the values of the fatigue index (Ifatigue): (a) A modified workload settings indicator X6; (b) impact of a modified X6 on Ifatigue (case scenario).
Figure 13.
Decreasing workload settings indicator X6 in the observed dataset by 30% and its impact on the values of the fatigue index (Ifatigue): (a) A modified workload settings indicator X6; (b) impact of a modified X6 on Ifatigue (case scenario).

Figure 14.
Impacts of a decreased workload settings indicator X6 in the observed dataset by 30% on the values of the initial ballast (Bin) and final ballast (Bfin): (a) Impact of a modified X6 on Bin (scenario case); (b) impact of a modified X6 on Bfin (case scenario).
Figure 14.
Impacts of a decreased workload settings indicator X6 in the observed dataset by 30% on the values of the initial ballast (Bin) and final ballast (Bfin): (a) Impact of a modified X6 on Bin (scenario case); (b) impact of a modified X6 on Bfin (case scenario).

Figure 15.
Comparison of the case scenario values: (a) The original forecast values of the fatigue index (Ifatigue) vs. the case scenario forecast values of the fatigue index (Ifatigue’); (b) The case scenario values of the final ballast (Bfin’) vs. the case scenario values of the initial ballast (Bin’).

Figure 16.
Comparison of the case scenario Iteration 1 and Iteration 2: (a) Increasing workload settings indicator X6 and its impact on the values of the fatigue index; (b) decreasing workload settings indicator X6 and its impact on the values of the fatigue index.
Figure 16.
Comparison of the case scenario Iteration 1 and Iteration 2: (a) Increasing workload settings indicator X6 and its impact on the values of the fatigue index; (b) decreasing workload settings indicator X6 and its impact on the values of the fatigue index.

Figure 17.
Increasing workload settings indicator X7 in the observed dataset for 3 extra local nights and its impact on the values of the fatigue index (Ifatigue): (a) A modified workload settings indicator X7; (b) impact of a modified X7 on Ifatigue (case scenario).
Figure 17.
Increasing workload settings indicator X7 in the observed dataset for 3 extra local nights and its impact on the values of the fatigue index (Ifatigue): (a) A modified workload settings indicator X7; (b) impact of a modified X7 on Ifatigue (case scenario).

Figure 18.
Impacts of an increased workload settings indicator X7 in the observed dataset by 3 extra local nights on the values of the initial ballast (Bin) and final ballast (Bfin): (a) Impact of a modified X7 on Bin (scenario case); (b) impact of a modified X7 on Bfin (case scenario).
Figure 18.
Impacts of an increased workload settings indicator X7 in the observed dataset by 3 extra local nights on the values of the initial ballast (Bin) and final ballast (Bfin): (a) Impact of a modified X7 on Bin (scenario case); (b) impact of a modified X7 on Bfin (case scenario).

Figure 19.
Comparison of the case scenario values: (a) The original forecast values of the fatigue index (Ifatigue) vs. the case scenario forecast values of the fatigue index (Ifatigue’); (b) The case scenario values of the final ballast (Bfin’) vs. the case scenario values of the initial ballast (Bin’).

Figure 20.
Decreasing workload settings indicator X7 in the observed dataset by 1 local night and its impact on the values of the fatigue index (Ifatigue): (a) A modified workload settings indicator X7; (b) impact of a modified X7 on Ifatigue (case scenario).
Figure 20.
Decreasing workload settings indicator X7 in the observed dataset by 1 local night and its impact on the values of the fatigue index (Ifatigue): (a) A modified workload settings indicator X7; (b) impact of a modified X7 on Ifatigue (case scenario).

Figure 21.
Impacts of a decreased workload settings indicator X7 in the observed dataset by 1 local night on the values of the initial ballast (Bin) and final ballast (Bfin): (a) Impact of a modified X7 on Bin (scenario case); (b) impact of a modified X7 on Bfin (case scenario).
Figure 21.
Impacts of a decreased workload settings indicator X7 in the observed dataset by 1 local night on the values of the initial ballast (Bin) and final ballast (Bfin): (a) Impact of a modified X7 on Bin (scenario case); (b) impact of a modified X7 on Bfin (case scenario).

Figure 22.
Comparison of the case scenario values: (a) The original forecast values of the fatigue index (Ifatigue) vs. the case scenario forecast values of the fatigue index (Ifatigue’); (b) The case scenario values of the final ballast (Bfin’) vs. the case scenario values of the initial ballast (Bin’).

Figure 23.
Comparison of the case scenario Iteration 1 and Iteration 2: (a) Increasing workload settings indicator X7 and its impact on the values of the fatigue index; (b) decreasing workload settings indicator X7 and its impact on the values of the fatigue index.
Figure 23.
Comparison of the case scenario Iteration 1 and Iteration 2: (a) Increasing workload settings indicator X7 and its impact on the values of the fatigue index; (b) decreasing workload settings indicator X7 and its impact on the values of the fatigue index.

Figure 24.
Increasing workload settings indicator X9 in the observed dataset by 2 extra changes in the schedule and its impact on the values of the fatigue index (Ifatigue): (a) A modified workload settings indicator X9; (b) impact of a modified X9 on Ifatigue (case scenario).
Figure 24.
Increasing workload settings indicator X9 in the observed dataset by 2 extra changes in the schedule and its impact on the values of the fatigue index (Ifatigue): (a) A modified workload settings indicator X9; (b) impact of a modified X9 on Ifatigue (case scenario).

Figure 25.
Impacts of an increased workload settings indicator X9 in the observed dataset by 2 extra changes in the schedule on the values of the initial ballast (Bin) and final ballast (Bfin): (a) Impact of a modified X9 on Bin (scenario case); (b) impact of a modified X9 on Bfin (case scenario).
Figure 25.
Impacts of an increased workload settings indicator X9 in the observed dataset by 2 extra changes in the schedule on the values of the initial ballast (Bin) and final ballast (Bfin): (a) Impact of a modified X9 on Bin (scenario case); (b) impact of a modified X9 on Bfin (case scenario).

Figure 26.
Comparison of the case scenario values: (a) The original forecast values of the fatigue index (Ifatigue) vs. the case scenario forecast values of the fatigue index (Ifatigue’); (b) The case scenario values of the final ballast (Bfin’) vs. the case scenario values of the initial ballast (Bin’).

Figure 27.
Increasing workload settings indicator X10 in the observed dataset by 30% and its impact on the values of the fatigue index (Ifatigue): (a) A modified workload settings indicator X10; (b) impact of a modified X10 on Ifatigue (case scenario).
Figure 27.
Increasing workload settings indicator X10 in the observed dataset by 30% and its impact on the values of the fatigue index (Ifatigue): (a) A modified workload settings indicator X10; (b) impact of a modified X10 on Ifatigue (case scenario).

Figure 28.
Impacts of an increased workload settings indicator X10 in the observed dataset by 30% on the values of the initial ballast (Bin) and final ballast (Bfin): (a) Impact of a modified X10 on Bin (scenario case); (b) impact of a modified X10 on Bfin (case scenario).
Figure 28.
Impacts of an increased workload settings indicator X10 in the observed dataset by 30% on the values of the initial ballast (Bin) and final ballast (Bfin): (a) Impact of a modified X10 on Bin (scenario case); (b) impact of a modified X10 on Bfin (case scenario).

Figure 29.
Comparison of the case scenario values: (a) The original forecast values of the fatigue index (Ifatigue) vs. the case scenario forecast values of the fatigue index (Ifatigue’); (b) The case scenario values of the final ballast (Bfin’) vs. the case scenario values of the initial ballast (Bin’).

Figure 30.
Decreasing workload settings indicator X10 in the observed dataset by 30% and its impact on the values of the fatigue index (Ifatigue): (a) A modified workload settings indicator X10; (b) impact of a modified X10 on Ifatigue (case scenario).
Figure 30.
Decreasing workload settings indicator X10 in the observed dataset by 30% and its impact on the values of the fatigue index (Ifatigue): (a) A modified workload settings indicator X10; (b) impact of a modified X10 on Ifatigue (case scenario).

Figure 31.
Impacts of a decreased workload settings indicator X10 in the observed dataset by 30% on the values of the initial ballast (Bin) and final ballast (Bfin): (a) Impact of a modified X10 on Bin (scenario case); (b) impact of a modified X10 on Bfin (case scenario).
Figure 31.
Impacts of a decreased workload settings indicator X10 in the observed dataset by 30% on the values of the initial ballast (Bin) and final ballast (Bfin): (a) Impact of a modified X10 on Bin (scenario case); (b) impact of a modified X10 on Bfin (case scenario).

Figure 32.
Comparison of the case scenario values: (a) The original forecast values of the fatigue index (Ifatigue) vs. the case scenario forecast values of the fatigue index (Ifatigue’); (b) the case scenario values of the final ballast (Bfin’) vs. the case scenario values of the initial ballast (Bin’).

Figure 33.
Comparison of the case scenario Iteration 1 and Iteration 2: (a) Increasing workload settings indicator X10 and its impact on the values of the fatigue index; (b) decreasing workload settings indicator X10 and its impact on the values of the fatigue index.
Figure 33.
Comparison of the case scenario Iteration 1 and Iteration 2: (a) Increasing workload settings indicator X10 and its impact on the values of the fatigue index; (b) decreasing workload settings indicator X10 and its impact on the values of the fatigue index.

Figure 34.
Increasing workload settings indicator X15 in the observed dataset by 30% and its impact on the values of the fatigue index (Ifatigue): (a) A modified workload settings indicator X15; (b) impact of a modified X15 on Ifatigue (case scenario).
Figure 34.
Increasing workload settings indicator X15 in the observed dataset by 30% and its impact on the values of the fatigue index (Ifatigue): (a) A modified workload settings indicator X15; (b) impact of a modified X15 on Ifatigue (case scenario).

Figure 35.
Impacts of an increased workload settings indicator X15 in the observed dataset by 30% on the values of the initial ballast (Bin) and final ballast (Bfin): (a) Impact of a modified X15 on Bin (scenario case); (b) impact of a modified X15 on Bfin (case scenario).
Figure 35.
Impacts of an increased workload settings indicator X15 in the observed dataset by 30% on the values of the initial ballast (Bin) and final ballast (Bfin): (a) Impact of a modified X15 on Bin (scenario case); (b) impact of a modified X15 on Bfin (case scenario).

Figure 36.
Comparison of the case scenario values: (a) The original forecast values of the fatigue index (Ifatigue) vs. the case scenario forecast values of the fatigue index (Ifatigue’); (b) the case scenario values of the final ballast (Bfin’) vs. the case scenario values of the initial ballast (Bin’).

Figure 37.
Decreasing workload settings indicator X15 in the observed dataset by 30% and its impact on the values of the fatigue index (Ifatigue): (a) A modified workload settings indicator X15; (b) impact of a modified X15 on Ifatigue (case scenario).
Figure 37.
Decreasing workload settings indicator X15 in the observed dataset by 30% and its impact on the values of the fatigue index (Ifatigue): (a) A modified workload settings indicator X15; (b) impact of a modified X15 on Ifatigue (case scenario).

Figure 38.
Impacts of a decreased workload settings indicator X15 in the observed dataset by 30% on the values of the initial ballast (Bin) and final ballast (Bfin): (a) Impact of a modified X15 on Bin (scenario case); (b) impact of a modified X15 on Bfin (case scenario).
Figure 38.
Impacts of a decreased workload settings indicator X15 in the observed dataset by 30% on the values of the initial ballast (Bin) and final ballast (Bfin): (a) Impact of a modified X15 on Bin (scenario case); (b) impact of a modified X15 on Bfin (case scenario).

Figure 39.
Comparison of the case scenario values: (a) The original forecast values of the fatigue index (Ifatigue) vs. the case scenario forecast values of the fatigue index (Ifatigue’); (b) the case scenario values of the final ballast (Bfin’) vs. the case scenario values of the initial ballast (Bin’).

Figure 40.
Comparison of the case scenario Iteration 1 and Iteration 2: (a) Increasing workload settings indicator X15 and its impact on the values of the fatigue index; (b) Decreasing workload settings indicator X15 and its impact on the values of the fatigue index.
Figure 40.
Comparison of the case scenario Iteration 1 and Iteration 2: (a) Increasing workload settings indicator X15 and its impact on the values of the fatigue index; (b) Decreasing workload settings indicator X15 and its impact on the values of the fatigue index.

Figure 41.
Increasing workload settings indicator X16 in the observed dataset by 3 extra days on the shift and its impact on the values of the fatigue index (Ifatigue): (a) A modified workload settings indicator X16; (b) impact of a modified X16 on Ifatigue (case scenario).
Figure 41.
Increasing workload settings indicator X16 in the observed dataset by 3 extra days on the shift and its impact on the values of the fatigue index (Ifatigue): (a) A modified workload settings indicator X16; (b) impact of a modified X16 on Ifatigue (case scenario).

Figure 42.
Impacts of an increased workload settings indicator X16 in the observed dataset by 3 extra days on the shift on the values of the initial ballast (Bin) and final ballast (Bfin): (a) Impact of a modified X16 on Bin (scenario case); (b) Impact of a modified X16 on Bfin (case scenario).
Figure 42.
Impacts of an increased workload settings indicator X16 in the observed dataset by 3 extra days on the shift on the values of the initial ballast (Bin) and final ballast (Bfin): (a) Impact of a modified X16 on Bin (scenario case); (b) Impact of a modified X16 on Bfin (case scenario).

Figure 43.
Comparison of the case scenario values: (a) The original forecast values of the fatigue index (Ifatigue) vs. the case scenario forecast values of the fatigue index (Ifatigue’); (b) The case scenario values of the final ballast (Bfin’) vs. the case scenario values of the initial ballast (Bin’).

Table 1.
Elements of workload settings—independent variables.
| Independent Variables—Groups of Workload Settings | Label | Name | Description |
|---|---|---|---|
| Time of day | X1 | Time of day | Local time of test execution at the beginning of the shift (Check In—CI) and at the end of the shift (Check Out—CO) |
| Start or end of the shift | X2 | Start or end of the shift (Check In/Check Out—CI/CO) | Start of the shift or Check In—CI, or end of the shift or Check Out—CO |
| Days off | X3 | Number of days off in the previous 7 days | Number of days off in the previous 7 days, at the beginning of the shift (CI) or at the end of the shift (CO) |
| X4 | Number of days off in the previous 28 days | Number of days off in the previous 28 days, at the beginning of the shift (CI) or at the end of the shift (CO) | |
| X5 | Number of individual days off in the previous 28 days | Number of individual days off in the previous 28 days, at the beginning of the shift (CI) or at the end of the shift (CO) | |
| Rest | X6 | Rest length | Rest length before flying duty, at the start of a shift (CI), or at the end of a shift (CO) |
| X7 | Local night in daily rest | Whether the rest before flight duty includes a local night | |
| X8 | Number of local nights in the 48 h before flight duty | How many local nights include rest 48 h before flight duty | |
| X9 | Changes in the schedule | Changes in the schedule of crews in the previous 7 days by more than 1 h | |
| Cumulative workload | X10 | Sectors in the previous 7 days | Number of sectors (flights) completed in the previous 7 days |
| X11 | Sectors in the previous 28 days | Number of sectors (flights) performed in the previous 28 days | |
| X12 | Flight time in the previous 7 days | Total flight time (includes only flight time, not aircraft dispatch acceptance time) in the previous 7 days | |
| X13 | Flight time in the previous 28 days | Total flight time (includes flight time only, not the time of aircraft ground handling) in the previous 28 days | |
| X14 | Duty time in the previous 7 days | Total duty time (includes all time on duty—from CI to CO and duties on the ground) in the previous 7 days | |
| X15 | Duty time in the previous 28 days | Total duty time (includes all time on duty—from CI to CO and duties on the ground) in the previous 28 days | |
| Individual flight duty | X16 | Multi-day shifts | Multi-day shifts |
Table 2.
Overview of CRD fatigue indicators.
| Name of CRD Fatigue Indicator | Label | Short Description | Meaning |
|---|---|---|---|
| Number of errors | Nerr | Number of errors—the accuracy of mental processing | Lower value—higher accuracy |
| Total time | Ttot | Mental processing speed—total time for solving a test | Lower value—a higher level of efficiency |
| Minimum test-solving time | Tmin | Mental processing speed—the shortest task-solving times | Lower value—a higher level of efficiency |
| Maximum test-solving time | Tmax | Mental processing speed—the longest task-solving times | Lower value—a higher level of efficiency |
| Total ballast | Btot | Total lost time due to fluctuations in the speed of solving similar tasks | Lower value—greater stability |
| Initial ballast | Bin | Working speed or initial ballast | Lower value—greater stability |
| Final ballast | Bfin | Fatigue or final ballast | Lower value—greater stability |
| Fatigue index | Ifatigue | The quotient of Bfin and Bin (Bfin/Bin) | Values greater than 1 indicate fatigue |
Table 3.
Elements of subjective self-assessment scales—independent and dependent variables.
| Independent and Dependent Variables—Subjective Self-Assessments | Label | Name | Description |
|---|---|---|---|
| Subjective self-assessments | S1 | Emotional state | Subjective self-assessment of the emotional state (scale from 1 to 10) |
| S2 | Energy level | Subjective self-assessment of the energy level (scale from 1 to 10) | |
| S3 | Self-confidence | Subjective self-assessment of the self-confidence (scale from 1 to 10) | |
| S4 | Anxiety level | Subjective self-assessment of the anxiety level (scale from 1 to 10) |
Table 4.
Example of the subjective self-assessment scale of energy level.
| Rank | Description of Energy Level |
|---|---|
| 1 | I am completely exhausted, unable to do the least effort. |
| 2 | I’m terribly tired, incapable of any activity. |
| 3 | I am very tired, without energy, immobile. |
| 4 | I’m pretty tired, apathetic, wishing a good night sleep. |
| 5 | I do not have enough energy, I get tired easily. |
| 6 | I feel quite fresh. |
| 7 | I’m fresh and I have a lot of energy. |
| 8 | I have a lot of energy, I feel the need for action. |
| 9 | I have great energy and a strong need for action. |
| 10 | I feel great energy for which there are no imperceptible obstacles. |
Table 5.
Variables of the observed dataset (collected data) of flight crew workload settings, subjective self-assessments, and CRD fatigue indicators.
Table 5.
Variables of the observed dataset (collected data) of flight crew workload settings, subjective self-assessments, and CRD fatigue indicators.
| Label | Name | Role |
|---|---|---|
| X1 | Time of day | Independent variable (input) |
| X2 | Start or end of the shift (Check In/Check Out—CI/CO) | Independent variable (input) |
| X3 | Number of days off in the previous 7 days | Independent variable (input) |
| X4 | Number of days off in the previous 28 days | Independent variable (input) |
| X5 | Number of individual days off in the previous 28 days | Independent variable (input) |
| X6 | Rest length | Independent variable (input) |
| X7 | Local night in daily rest | Independent variable (input) |
| X8 | Number of local nights in the 48 h before flight duty | Independent variable (input) |
| X9 | Changes in the schedule | Independent variable (input) |
| X10 | Sectors in the previous 7 days | Independent variable (input) |
| X11 | Sectors in the previous 28 days | Independent variable (input) |
| X12 | Flight time in the previous 7 days | Independent variable (input) |
| X13 | Flight time in the previous 28 days | Independent variable (input) |
| X14 | Duty time in the previous 7 days | Independent variable (input) |
| X15 | Duty time in the previous 28 days | Independent variable (input) |
| X16 | Multi-day shifts | Independent variable (input) |
| S1 | Self-assessment of the emotional state | Independent and dependent variable (input/target, i.e., both) |
| S2 | Self-assessment of the energy level | Independent and dependent variable (input/target, i.e., both) |
| S3 | Self-assessment of self-confidence | Independent and dependent variable (input/target, i.e., both) |
| S4 | Self-assessment of the anxiety level | Independent and dependent variable (input/target, i.e., both) |
| Nerr | Number of errors | Independent and dependent variable (input/target, i.e., both) 1 |
| Ttot | Total time | Independent and dependent variable (input/target, i.e., both) 1 |
| Tmin | Minimum time | Independent and dependent variable (input/target, i.e., both) 1 |
| Tmax | Maximum time | Independent and dependent variable (input/target, i.e., both) 1 |
| Btot | Total ballast | Independent and dependent variable (input/target, i.e., both) 1 |
| Bin | Initial ballast | Independent and dependent variable (input/target, i.e., both) 1 |
| Bfin | Final ballast | Independent and dependent variable (input/target, i.e., both) 1 |
| Ifatigue | Fatigue index | Independent and dependent variable (input/target, i.e., both) 1 |
1 These indicators were initially determined as dependent variables, but in the context of causal impacts, it has been concluded that they can also be independent variables influencing other variables; hence, their role has been determined as “both input and target” for the process of generating causal models.
Table 6.
Fit statistics for the top causal models of each target indicator in the observed dataset.
| Model for Target | Model Quality | ||||
|---|---|---|---|---|---|
| RMSE | RMSPE | AIC | BIC | R-Squared | |
| S1 | 0.54 | 0.05 | –125.33 | 106.94 | 0.87 |
| S4 | 0.60 | 0.05 | –99.73 | 132.54 | 0.85 |
| S2 | 0.52 | 0.05 | –135.07 | 97.20 | 0.81 |
| S3 | 0.64 | 0.06 | –79.23 | 153.04 | 0.80 |
| Ttot | 23,659.43 | 0.63 | 2653.75 | 2886.02 | 0.80 |
| Btot | 26,037.96 | 2.08 | 2678.66 | 2910.93 | 0.77 |
| Bfin | 12,395.61 | 1.80 | 2485.68 | 2717.95 | 0.77 |
| Nerr | 1.58 | 0.44 | 154.83 | 387.10 | 0.76 |
| Bin | 15,056.92 | 3.24 | 2536.25 | 2768.52 | 0.76 |
| Tmax | 5197.53 | 2.92 | 2259.70 | 2491.97 | 0.73 |
| Ifatigue | 0.47 | 0.32 | −158.64 | 73.63 | 0.71 |
| Tmin | 280.03 | 0.58 | 1500.23 | 1732.50 | 0.70 |
Table 7.
Case scenario results for the fatigue index (Ifatigue’).
| Variables | 1 | 2 | 3 | 4 | 5 | 6 | 7 | 8 | 1 | 2 | 3 | 4 | 5 | 6 | 7 |
|---|---|---|---|---|---|---|---|---|---|---|---|---|---|---|---|
| Observed Values | Forecasted Values | ||||||||||||||
| X5 | 0 | 0 | 0 | 0 | 0 | 0 | 0 | 0 | – | – | – | – | – | – | – |
| X5′ | 3 | 3 | 3 | 3 | 3 | 3 | 3 | 3 | – | – | – | – | – | – | – |
| Ifatigue | 1.31 | 0.88 | 1.24 | 1.25 | 1.12 | 0.89 | 1.11 | 1.22 | 1.13 1 | 1.11 1 | 1.71 1 | 1.59 1 | 2.13 1 | 1.89 1 | 2.10 1 |
| Ifatigue’ | 1.46 2 | 2.03 2 | 1.80 2 | 1.19 2 | 0.76 2 | 1.13 2 | 1.11 2 | 1.20 2 | 0.71 2 | 0.96 2 | 0.39 2 | 1.05 2 | 0.68 2 | 1.54 2 | 0.25 2 |
1 Original forecast. 2 Case scenario observed and forecasted values.
Table 8.
Comparison of all case scenario results.
| Variables | 1 | 2 | 3 | 4 | 5 | 6 | 7 | 8 | 1 | 2 | 3 | 4 | 5 | 6 | 7 |
|---|---|---|---|---|---|---|---|---|---|---|---|---|---|---|---|
| Observed Values | Forecasted Values | ||||||||||||||
| X5 | 0 | 0 | 0 | 0 | 0 | 0 | 0 | 0 | – | – | – | – | – | – | – |
| X5′ | 3 | 3 | 3 | 3 | 3 | 3 | 3 | 3 | – | – | – | – | – | – | – |
| Ifatigue | 1.31 | 0.88 | 1.24 | 1.25 | 1.12 | 0.89 | 1.11 | 1.22 | 1.13 1 | 1.11 1 | 1.71 1 | 1.59 1 | 2.13 1 | 1.89 1 | 2.10 1 |
| Ifatigue’ | 1.46 2 | 2.03 2 | 1.80 2 | 1.19 2 | 0.76 2 | 1.13 2 | 1.11 2 | 1.20 2 | 0.71 2 | 0.96 2 | 0.39 2 | 1.05 2 | 0.68 2 | 1.54 2 | 0.25 2 |
| Bin | 64,774 | 9336 | 2148 | 11,861 | 14,602 | 42,932 | 7404 | 2990 | 3277 1 | 4960 1 | −29,895 1 | 4638 1 | 8476 1 | 23,989 1 | −25,659 1 |
| Bin’ | 29,177 2 | −13,365 2 | −6320 2 | −14,816 2 | −14,292 2 | –22,925 2 | –33,044 2 | 11,169 2 | −6396 2 | 26,090 2 | 62,024 2 | 30,497 2 | 68,166 2 | 23,734 2 | 66,491 2 |
| Bfin | 84,942 | 8250 | 2672 | 14,909 | 16,413 | 38,306 | 8260 | 3651 | 4771 1 | –3052 1 | −24,765 1 | –12,462 1 | 8485 1 | 17,777 1 | −8640 1 |
| Bfin’ | 52,746 2 | −6311 2 | 23,883 2 | 32,905 2 | 17,225 2 | 14,168 2 | 28,690 2 | 35,494 2 | 11,778 2 | 14,448 2 | 8490 2 | −10,030 2 | −38,619 2 | −30,379 2 | −21,996 2 |
1 Original forecast. 2 Case scenario observed and forecasted values.
Table 9.
Case scenario results for the fatigue index (Ifatigue’).
| Variables | 1 | 2 | 3 | 4 | 5 | 6 | 7 | 8 | 1 | 2 | 3 | 4 | 5 | 6 | 7 |
|---|---|---|---|---|---|---|---|---|---|---|---|---|---|---|---|
| Observed Values | Forecasted Values | ||||||||||||||
| X6 | 13.32 | 13.32 | 13.32 | 13.05 | 13.05 | 13.05 | 13.05 | 13.05 | – | – | – | – | – | – | – |
| X6′ | 17.31 | 17.31 | 17.31 | 16.97 | 16.97 | 16.97 | 16.97 | 16.97 | – | – | – | – | – | – | – |
| Ifatigue | 1.31 | 0.88 | 1.24 | 1.25 | 1.12 | 0.89 | 1.11 | 1.22 | 1.13 1 | 1.11 1 | 1.71 1 | 1.59 1 | 2.13 1 | 1.89 1 | 2.10 1 |
| Ifatigue’ | 1.21 2 | 1.49 2 | 1.45 2 | 0.98 2 | 0.62 2 | 1.54 2 | 1.06 2 | 1.47 2 | 1.38 2 | 2.28 2 | 0.78 2 | 1.32 2 | 1.62 2 | 3.10 2 | 2.01 2 |
1 Original forecast. 2 Case scenario observed and forecasted values.
Table 10.
Comparison of all case scenario results.
| Variables | 1 | 2 | 3 | 4 | 5 | 6 | 7 | 8 | 1 | 2 | 3 | 4 | 5 | 6 | 7 |
|---|---|---|---|---|---|---|---|---|---|---|---|---|---|---|---|
| Observed Values | Forecasted Values | ||||||||||||||
| X6 | 13.32 | 13.32 | 13.32 | 13.05 | 13.05 | 13.05 | 13.05 | 13.05 | – | – | – | – | – | – | – |
| X6′ | 17.31 | 17.31 | 17.31 | 16.97 | 16.97 | 16.97 | 16.97 | 16.97 | – | – | – | – | – | – | – |
| Ifatigue | 1.31 | 0.88 | 1.24 | 1.25 | 1.12 | 0.89 | 1.11 | 1.22 | 1.13 1 | 1.11 1 | 1.71 1 | 1.59 1 | 2.13 1 | 1.89 1 | 2.10 1 |
| Ifatigue’ | 1.21 2 | 1.49 2 | 1.45 2 | 0.98 2 | 0.62 2 | 1.54 2 | 1.06 2 | 1.47 2 | 1.38 2 | 2.28 2 | 0.78 2 | 1.32 2 | 1.62 2 | 3.10 2 | 2.01 2 |
| Bin | 64,774 | 9336 | 2148 | 11,861 | 14,602 | 42,932 | 7404 | 2990 | 3277 1 | 4960 1 | −29,895 1 | 4638 1 | 8476 1 | 23,989 1 | −25,659 1 |
| Bin’ | 47,219 2 | 3156 2 | 9436 2 | 7648 2 | 25,920 2 | 7710 2 | 4869 2 | 31,744 2 | −27,142 2 | −42,570 2 | −11,107 2 | −619 2 | 54,743 2 | −30,700 2 | −22,171 2 |
| Bfin | 84,942 | 8250 | 2672 | 14,909 | 16,413 | 38,306 | 8260 | 3651 | 4771 1 | −3052 1 | −24,765 1 | −12,462 1 | 8485 1 | 17,777 1 | −8640 1 |
| Bfin’ | 60,120 2 | 8395 2 | 16,727 2 | 20,936 2 | 19,052 2 | 14,006 2 | 14,699 2 | 25,777 2 | 16,571 2 | −16,253 2 | −31,652 2 | −6056 2 | 8344 2 | −3344 2 | −13,146 2 |
1 Original forecast. 2 Case scenario observed and forecasted values.
Table 11.
Case scenario results for the fatigue index (Ifatigue’).
| Variables | 1 | 2 | 3 | 4 | 5 | 6 | 7 | 8 | 1 | 2 | 3 | 4 | 5 | 6 | 7 |
|---|---|---|---|---|---|---|---|---|---|---|---|---|---|---|---|
| Observed Values | Forecasted Values | ||||||||||||||
| X6 | 13.32 | 13.32 | 13.32 | 13.05 | 13.05 | 13.05 | 13.05 | 13.05 | – | – | – | – | – | – | – |
| X6′ | 9.32 | 9.32 | 9.32 | 9.14 | 9.14 | 9.14 | 9.14 | 9.14 | – | – | – | – | – | – | – |
| Ifatigue | 1.31 | 0.88 | 1.24 | 1.25 | 1.12 | 0.89 | 1.11 | 1.22 | 1.13 1 | 1.11 1 | 1.71 1 | 1.59 1 | 2.13 1 | 1.89 1 | 2.10 1 |
| Ifatigue’ | 1.24 2 | 1.51 2 | 1.49 2 | 1.00 2 | 0.65 2 | 1.56 2 | 1.07 2 | 1.48 2 | 1.39 2 | 2.26 2 | 0.73 2 | 1.28 2 | 1.56 2 | 3.07 2 | 1.96 2 |
1 Original forecast. 2 Case scenario observed and forecasted values.
Table 12.
Comparison of all case scenario results.
| Variables | 1 | 2 | 3 | 4 | 5 | 6 | 7 | 8 | 1 | 2 | 3 | 4 | 5 | 6 | 7 |
|---|---|---|---|---|---|---|---|---|---|---|---|---|---|---|---|
| Observed values | Forecasted values | ||||||||||||||
| X6 | 13.32 | 13.32 | 13.32 | 13.05 | 13.05 | 13.05 | 13.05 | 13.05 | – | – | – | – | – | – | – |
| X6′ | 9.32 | 9.32 | 9.32 | 9.14 | 9.14 | 9.14 | 9.14 | 9.14 | – | – | – | – | – | – | – |
| Ifatigue | 1.31 | 0.88 | 1.24 | 1.25 | 1.12 | 0.89 | 1.11 | 1.22 | 1.13 1 | 1.11 1 | 1.71 1 | 1.59 1 | 2.13 1 | 1.89 1 | 2.10 1 |
| Ifatigue’ | 1.24 2 | 1.51 2 | 1.49 2 | 1.00 2 | 0.65 2 | 1.56 2 | 1.07 2 | 1.48 2 | 1.39 2 | 2.26 2 | 0.73 2 | 1.28 2 | 1.56 2 | 3.07 2 | 1.96 2 |
| Bin | 64,774 | 9336 | 2148 | 11,861 | 14,602 | 42,932 | 7404 | 2990 | 3277 1 | 4960 1 | −29,895 1 | 4638 1 | 8476 1 | 23,989 1 | −25,659 1 |
| Bin’ | 46,966 2 | 1724 2 | 7764 2 | 5816 2 | 22,981 2 | 3559 2 | 718 2 | 26,998 2 | −27,100 2 | −40,715 2 | −7665 2 | 4905 2 | 61,241 2 | −23,244 2 | −12,721 2 |
| Bfin | 84,942 | 8250 | 2672 | 14,909 | 16,413 | 38,306 | 8260 | 3651 | 4771 1 | −3052 1 | −24,765 1 | −12,462 1 | 8485 1 | 17,777 1 | −8640 1 |
| Bfin’ | 59,937 2 | 7487 2 | 15,685 2 | 20,148 2 | 17,966 2 | 12,511 2 | 13,228 2 | 24,388 2 | 15,631 2 | −16,425 2 | −30,489 2 | −4538 2 | 9327 2 | −2336 2 | −10,517 2 |
1 Original forecast. 2 Case scenario observed and forecasted values.
Table 13.
Case scenario results for Fatigue index (Ifatigue’).
| Variables | 1 | 2 | 3 | 4 | 5 | 6 | 7 | 8 | 1 | 2 | 3 | 4 | 5 | 6 | 7 |
|---|---|---|---|---|---|---|---|---|---|---|---|---|---|---|---|
| Observed Values | Forecasted Values | ||||||||||||||
| X7 | 1 | 1 | 1 | 1 | 1 | 1 | 1 | 1 | – | – | – | – | – | – | – |
| X7′ | 4 | 4 | 4 | 4 | 4 | 4 | 4 | 4 | – | – | – | – | – | – | – |
| Ifatigue | 1.31 | 0.88 | 1.24 | 1.25 | 1.12 | 0.89 | 1.11 | 1.22 | 1.13 1 | 1.11 1 | 1.71 1 | 1.59 1 | 2.13 1 | 1.89 1 | 2.10 1 |
| Ifatigue’ | 3.81 2 | 5.04 2 | 7.38 2 | 6.50 2 | 5.28 2 | 5.79 2 | 7.51 2 | 9.38 2 | 14.64 2 | 10.15 2 | 7.18 2 | 9.07 2 | 5.81 2 | 8.82 2 | 12.40 2 |
1 Original forecast. 2 Case scenario observed and forecasted values.
Table 14.
Comparison of all case scenario results.
| Variables | 1 | 2 | 3 | 4 | 5 | 6 | 7 | 8 | 1 | 2 | 3 | 4 | 5 | 6 | 7 |
|---|---|---|---|---|---|---|---|---|---|---|---|---|---|---|---|
| Observed Values | Forecasted Values | ||||||||||||||
| X7 | 1 | 1 | 1 | 1 | 1 | 1 | 1 | 1 | – | – | – | – | – | – | – |
| X7′ | 4 | 4 | 4 | 4 | 4 | 4 | 4 | 4 | – | – | – | – | – | – | – |
| Ifatigue | 1.31 | 0.88 | 1.24 | 1.25 | 1.12 | 0.89 | 1.11 | 1.22 | 1.13 1 | 1.11 1 | 1.71 1 | 1.59 1 | 2.13 1 | 1.89 1 | 2.10 1 |
| Ifatigue’ | 3.81 2 | 5.04 2 | 7.38 2 | 6.50 2 | 5.28 2 | 5.79 2 | 7.51 2 | 9.38 2 | 14.64 2 | 10.15 2 | 7.18 2 | 9.07 2 | 5.81 2 | 8.82 2 | 12.40 2 |
| Bin | 64,774 | 9336 | 2148 | 11,861 | 14,602 | 42,932 | 7404 | 2990 | 3277 1 | 4960 1 | −29,895 1 | 4638 1 | 8476 1 | 23,989 1 | −25,659 1 |
| Bin’ | 72,696 2 | 36,194 2 | 63,098 2 | 148,456 2 | 182,972 2 | 192,454 2 | 245,395 2 | 309,951 2 | −115,659 2 | −66,328 2 | −120,406 2 | −73,851 2 | −134,908 2 | −133,430 2 | −186,009 2 |
| Bfin | 84,942 | 8250 | 2672 | 14,909 | 16,413 | 38,306 | 8260 | 3651 | 4771 1 | −3052 1 | −24,765 1 | −12,462 1 | 8485 1 | 17,777 1 | −8640 1 |
| Bfin’ | 136,952 2 | 81,888 2 | 106,569 2 | 167,401 2 | 166,468 2 | 151,386 2 | 162,473 2 | 247,703 2 | 120,089 2 | −18,249 2 | 44,970 2 | 194,242 2 | 246,330 2 | 306,845 2 | 411,432 2 |
1 Original forecast. 2 Case scenario observed and forecasted values.
Table 15.
Case scenario results for the fatigue index (Ifatigue’).
| Variables | 1 | 2 | 3 | 4 | 5 | 6 | 7 | 8 | 1 | 2 | 3 | 4 | 5 | 6 | 7 |
|---|---|---|---|---|---|---|---|---|---|---|---|---|---|---|---|
| Observed Values | Forecasted Values | ||||||||||||||
| X7 | 1 | 1 | 1 | 1 | 1 | 1 | 1 | 1 | – | – | – | – | – | – | – |
| X7′ | 0 | 0 | 0 | 0 | 0 | 0 | 0 | 0 | – | – | – | – | – | – | – |
| Ifatigue | 1.31 | 0.88 | 1.24 | 1.25 | 1.12 | 0.89 | 1.11 | 1.22 | 1.13 1 | 1.11 1 | 1.71 1 | 1.59 1 | 2.13 1 | 1.89 1 | 2.10 1 |
| Ifatigue’ | 0.40 2 | 0.37 2 | −0.53 2 | −0.93 2 | −0.87 2 | 0.21 2 | −0.97 2 | −0.92 2 | −3.36 2 | −0.64 2 | −1.57 2 | −0.14 2 | −0.27 2 | 0.91 2 | −2.56 2 |
1 Original forecast. 2 Case scenario observed and forecasted values.
Table 16.
Comparison of all case scenario results.
| Variables | 1 | 2 | 3 | 4 | 5 | 6 | 7 | 8 | 1 | 2 | 3 | 4 | 5 | 6 | 7 |
|---|---|---|---|---|---|---|---|---|---|---|---|---|---|---|---|
| Observed Values | Forecasted Values | ||||||||||||||
| X7 | 1 | 1 | 1 | 1 | 1 | 1 | 1 | 1 | – | – | – | – | – | – | – |
| X7′ | 0 | 0 | 0 | 0 | 0 | 0 | 0 | 0 | – | – | – | – | – | – | – |
| Ifatigue | 1.31 | 0.88 | 1.24 | 1.25 | 1.12 | 0.89 | 1.11 | 1.22 | 1.13 1 | 1.11 1 | 1.71 1 | 1.59 1 | 2.13 1 | 1.89 1 | 2.10 1 |
| Ifatigue’ | 0.40 2 | 0.37 2 | −0.53 2 | −0.93 2 | −0.87 2 | 0.21 2 | −0.97 2 | −0.92 2 | −3.36 2 | −0.64 2 | −1.57 2 | −0.14 2 | −0.27 2 | 0.91 2 | −2.56 2 |
| Bin | 64,774 | 9336 | 2148 | 11,861 | 14,602 | 42,932 | 7404 | 2990 | 3277 1 | 4960 1 | −29,895 1 | 4638 1 | 8476 1 | 23,989 1 | −25,659 1 |
| Bin’ | 44,187 2 | −4230 2 | −12,617 2 | −36,796 2 | −27,989 2 | −53,445 2 | −77,985 2 | −73,548 2 | 19,089 2 | −4743 2 | 49,956 2 | −13,487 2 | 105,581 2 | 5343 2 | 122,539 2 |
| Bfin | 84,942 | 8250 | 2672 | 14,909 | 16,413 | 38,306 | 8260 | 3651 | 4771 1 | −3052 1 | −24,765 1 | −12,462 1 | 8485 1 | 17,777 1 | −8640 1 |
| Bfin’ | 39,988 2 | −11,390 2 | −17,551 2 | −31,670 2 | −30,532 2 | −26,844 2 | −38,872 2 | −50,984 2 | −16,153 2 | 147 2 | −41,391 2 | −70,273 2 | −89,406 2 | −109,609 2 | −133,500 2 |
1 Original forecast. 2 Case scenario observed and forecasted values.
Table 17.
Case scenario results for Fatigue index (Ifatigue’).
| Variables | 1 | 2 | 3 | 4 | 5 | 6 | 7 | 8 | 1 | 2 | 3 | 4 | 5 | 6 | 7 |
|---|---|---|---|---|---|---|---|---|---|---|---|---|---|---|---|
| Observed Values | Forecasted Values | ||||||||||||||
| X9 | 0 | 0 | 0 | 0 | 0 | 0 | 0 | 0 | – | – | – | – | – | – | – |
| X9′ | 2 | 2 | 2 | 2 | 2 | 2 | 2 | 2 | – | – | – | – | – | – | – |
| Ifatigue | 1.31 | 0.88 | 1.24 | 1.25 | 1.12 | 0.89 | 1.11 | 1.22 | 1.13 1 | 1.11 1 | 1.71 1 | 1.59 1 | 2.13 1 | 1.89 1 | 2.10 1 |
| Ifatigue’ | 0.37 2 | 1.40 2 | 0.90 2 | 0.10 2 | −0.49 2 | 1.63 2 | −0.13 2 | 1.37 2 | −1.42 2 | 2.18 2 | −1.16 2 | 2.65 2 | 0.34 2 | 3.18 2 | −0.36 2 |
1 Original forecast. 2 Case scenario observed and forecasted values.
Table 18.
Comparison of all case scenario results.
| Variables | 1 | 2 | 3 | 4 | 5 | 6 | 7 | 8 | 1 | 2 | 3 | 4 | 5 | 6 | 7 |
|---|---|---|---|---|---|---|---|---|---|---|---|---|---|---|---|
| Observed Values | Forecasted Values | ||||||||||||||
| X9 | 0 | 0 | 0 | 0 | 0 | 0 | 0 | 0 | – | – | – | – | – | – | – |
| X9′ | 2 | 2 | 2 | 2 | 2 | 2 | 2 | 2 | – | – | – | – | – | – | – |
| Ifatigue | 1.31 | 0.88 | 1.24 | 1.25 | 1.12 | 0.89 | 1.11 | 1.22 | 1.13 1 | 1.11 1 | 1.71 1 | 1.59 1 | 2.13 1 | 1.89 1 | 2.10 1 |
| Ifatigue’ | 0.37 2 | 1.40 2 | 0.90 2 | 0.10 2 | −0.49 2 | 1.63 2 | −0.13 2 | 1.37 2 | −1.42 2 | 2.18 2 | −1.16 2 | 2.65 2 | 0.34 2 | 3.18 2 | −0.36 2 |
| Bin | 64,774 | 9336 | 2148 | 11,861 | 14,602 | 42,932 | 7404 | 2990 | 3277 1 | 4960 1 | −29,895 1 | 4638 1 | 8476 1 | 23,989 1 | −25,659 1 |
| Bin’ | 87,181 2 | 35,465 2 | 20,573 2 | 41,099 2 | 80,677 2 | 48,325 2 | 59,103 2 | 15,319 2 | −3299 2 | −78,746 2 | −68, 692 2 | −200,575 2 | −45,130 2 | −235,275 2 | −74,604 2 |
| Bfin | 84,942 | 8250 | 2672 | 14,909 | 16,413 | 38,306 | 8260 | 3651 | 4771 1 | −3052 1 | −24,765 1 | −12,462 1 | 8485 1 | 17,777 1 | −8640 1 |
| Bfin’ | 86,400 2 | 39,258 2 | 7374 2 | 29,523 2 | 40,714 2 | 29,197 2 | 756 2 | 27,921 2 | 19,794 2 | −32,766 2 | −85,421 2 | −73,648 2 | −65,677 2 | −116,096 2 | −145,900 2 |
1 Original forecast. 2 Case scenario observed and forecasted values.
Table 19.
Case scenario results for the fatigue index (Ifatigue’).
| Variables | 1 | 2 | 3 | 4 | 5 | 6 | 7 | 8 | 1 | 2 | 3 | 4 | 5 | 6 | 7 |
|---|---|---|---|---|---|---|---|---|---|---|---|---|---|---|---|
| Observed Values | Forecasted Values | ||||||||||||||
| X10 | 13 | 13 | 13 | 9 | 9 | 9 | 9 | 9 | – | – | – | – | – | – | – |
| X10′ | 16.90 | 16.90 | 16.90 | 11.70 | 11.70 | 11.70 | 11.70 | 11.70 | – | – | – | – | – | – | – |
| Ifatigue | 1.31 | 0.88 | 1.24 | 1.25 | 1.12 | 0.89 | 1.11 | 1.22 | 1.13 1 | 1.11 1 | 1.71 1 | 1.59 1 | 2.13 1 | 1.89 1 | 2.10 1 |
| Ifatigue’ | 1.01 2 | 1.26 2 | 0.82 2 | 0.54 2 | 0.71 2 | 1.36 2 | 1.04 2 | 1.60 2 | 1.14 2 | 2.42 2 | 0.45 2 | 1.91 2 | 2.12 2 | 3.05 2 | 1.60 2 |
1 Original forecast. 2 Case scenario observed and forecasted values.
Table 20.
Comparison of all case scenario results.
| Variables | 1 | 2 | 3 | 4 | 5 | 6 | 7 | 8 | 1 | 2 | 3 | 4 | 5 | 6 | 7 |
|---|---|---|---|---|---|---|---|---|---|---|---|---|---|---|---|
| Observed Values | Forecasted Values | ||||||||||||||
| X10 | 13 | 13 | 13 | 9 | 9 | 9 | 9 | 9 | – | – | – | – | – | – | – |
| X10′ | 16.90 | 16.90 | 16.90 | 11.70 | 11.70 | 11.70 | 11.70 | 11.70 | – | – | – | – | – | – | – |
| Ifatigue | 1.31 | 0.88 | 1.24 | 1.25 | 1.12 | 0.89 | 1.11 | 1.22 | 1.13 1 | 1.11 1 | 1.71 1 | 1.59 1 | 2.13 1 | 1.89 1 | 2.10 1 |
| Ifatigue’ | 1.01 2 | 1.26 2 | 0.82 2 | 0.54 2 | 0.71 2 | 1.36 2 | 1.04 2 | 1.60 2 | 1.14 2 | 2.42 2 | 0.45 2 | 1.91 2 | 2.12 2 | 3.05 2 | 1.60 2 |
| Bin | 64,774 | 9336 | 2148 | 11,861 | 14,602 | 42,932 | 7404 | 2990 | 3277 1 | 4960 1 | −29,895 1 | 4638 1 | 8476 1 | 23,989 1 | −25,659 1 |
| Bin’ | 47,021 2 | −7360 2 | −6892 2 | −9958 2 | −982 2 | −26,981 2 | −35,240 2 | −26,829 2 | −41,752 2 | −55,402 2 | −12,269 2 | 13,637 2 | 51,716 2 | −31,629 2 | −494 2 |
| Bfin | 84,942 | 8250 | 2672 | 14,909 | 16,413 | 38,306 | 8260 | 3651 | 4771 1 | −3052 1 | −24,765 1 | −12,462 1 | 8485 1 | 17,777 1 | −8640 1 |
| Bfin’ | 63,455 2 | 1089 2 | −1604 2 | 4681 2 | 11,810 2 | −1130 2 | 4646 2 | 23,217 2 | 14,832 2 | −19,875 2 | −26,806 2 | 26,719 2 | 17,094 2 | 13,534 2 | 1274 2 |
1 Original forecast. 2 Case scenario observed and forecasted values.
Table 21.
Case scenario results for the fatigue index (Ifatigue’).
| Variables | 1 | 2 | 3 | 4 | 5 | 6 | 7 | 8 | 1 | 2 | 3 | 4 | 5 | 6 | 7 |
|---|---|---|---|---|---|---|---|---|---|---|---|---|---|---|---|
| Observed Values | Forecasted Values | ||||||||||||||
| X10 | 13 | 13 | 13 | 9 | 9 | 9 | 9 | 9 | – | – | – | – | – | – | – |
| X10′ | 9.10 | 9.10 | 9.10 | 6.30 | 6.30 | 6.30 | 6.30 | 6.30 | – | – | – | – | – | – | – |
| Ifatigue | 1.31 | 0.88 | 1.24 | 1.25 | 1.12 | 0.89 | 1.11 | 1.22 | 1.13 1 | 1.11 1 | 1.71 1 | 1.59 1 | 2.13 1 | 1.89 1 | 2.10 1 |
| Ifatigue’ | 1.65 2 | 1.86 2 | 1.62 2 | 1.04 2 | 0.83 2 | 1.54 2 | 1.39 2 | 1.57 2 | 1. 04 2 | 2.50 2 | 0.74 2 | 1.58 2 | 1.98 2 | 3.04 2 | 1.61 2 |
1 Original forecast. 2 Case scenario observed and forecasted values.
Table 22.
Comparison of all case scenario results.
| Variables | 1 | 2 | 3 | 4 | 5 | 6 | 7 | 8 | 1 | 2 | 3 | 4 | 5 | 6 | 7 |
|---|---|---|---|---|---|---|---|---|---|---|---|---|---|---|---|
| Observed Values | Forecasted Values | ||||||||||||||
| X10 | 13 | 13 | 13 | 9 | 9 | 9 | 9 | 9 | – | – | – | – | – | – | – |
| X10′ | 9.10 | 9.10 | 9.10 | 6.30 | 6.30 | 6.30 | 6.30 | 6.30 | – | – | – | – | – | – | – |
| Ifatigue | 1.31 | 0.88 | 1.24 | 1.25 | 1.12 | 0.89 | 1.11 | 1.22 | 1.13 1 | 1.11 1 | 1.71 1 | 1.59 1 | 2.13 1 | 1.89 1 | 2.10 1 |
| Ifatigue’ | 1.65 2 | 1.86 2 | 1.62 2 | 1.04 2 | 0.83 2 | 1.54 2 | 1.39 2 | 1.57 2 | 1. 04 2 | 2.50 2 | 0.74 2 | 1.58 2 | 1.98 2 | 3.04 2 | 1.61 2 |
| Bin | 64,774 | 9336 | 2148 | 11,861 | 14,602 | 42,932 | 7404 | 2990 | 3277 1 | 4960 1 | −29,895 1 | 4638 1 | 8476 1 | 23,989 1 | −25,659 1 |
| Bin’ | 57,095 2 | 18,642 2 | 27,230 2 | 35,051 2 | 58,877 2 | 44,631 2 | 40,893 2 | 80,825 2 | −36,160 2 | −35,523 2 | 11,128 2 | 35,111 2 | 63,452 2 | −9346 2 | 4544 2 |
| Bfin | 84,942 | 8250 | 2672 | 14,909 | 16,413 | 38,306 | 8260 | 3651 | 4771 1 | −3052 1 | −24,765 1 | −12,462 1 | 8485 1 | 17,777 1 | −8640 1 |
| Bfin’ | 69,937 2 | 24,773 2 | 29,861 2 | 31,642 2 | 38,020 2 | 25,270 2 | 22,885 2 | 32,628 2 | 16,431 2 | −3690 2 | −21,967 2 | 37,704 2 | 41,189 2 | 42,385 2 | 24,445 2 |
1 Original forecast. 2 Case scenario observed and forecasted values.
Table 23.
Case scenario results for the fatigue index (Ifatigue’).
| Variables | 1 | 2 | 3 | 4 | 5 | 6 | 7 | 8 | 1 | 2 | 3 | 4 | 5 | 6 | 7 |
|---|---|---|---|---|---|---|---|---|---|---|---|---|---|---|---|
| Observed Values | Forecasted Values | ||||||||||||||
| X15 | 100.02 | 100.02 | 100.02 | 144.80 | 144.80 | 144.80 | 144.80 | 144.80 | – | – | – | – | – | – | – |
| X15′ | 130.02 | 130.02 | 130.02 | 188.24 | 188.24 | 188.24 | 188.24 | 188.24 | – | – | – | – | – | – | – |
| Ifatigue | 1.31 | 0.88 | 1.24 | 1.25 | 1.12 | 0.89 | 1.11 | 1.22 | 1.13 1 | 1.11 1 | 1.71 1 | 1.59 1 | 2.13 1 | 1.89 1 | 2.10 1 |
| Ifatigue’ | 1.28 2 | 1.71 2 | 1.66 2 | 1.19 2 | 0.99 2 | 1.74 2 | 1.74 2 | 2.13 2 | 2.47 2 | 3.02 2 | 1.60 2 | 2.03 2 | 1.92 2 | 3.34 2 | 2.55 2 |
1 Original forecast. 2 Case scenario observed and forecasted values.
Table 24.
Comparison of all case scenario results.
| Variables | 1 | 2 | 3 | 4 | 5 | 6 | 7 | 8 | 1 | 2 | 3 | 4 | 5 | 6 | 7 |
|---|---|---|---|---|---|---|---|---|---|---|---|---|---|---|---|
| Observed Values | Forecasted Values | ||||||||||||||
| X15 | 100.02 | 100.02 | 100.02 | 144.80 | 144.80 | 144.80 | 144.80 | 144.80 | – | – | – | – | – | – | – |
| X15′ | 130.02 | 130.02 | 130.02 | 188.24 | 188.24 | 188.24 | 188.24 | 188.24 | – | – | – | – | – | – | – |
| Ifatigue | 1.31 | 0.88 | 1.24 | 1.25 | 1.12 | 0.89 | 1.11 | 1.22 | 1.13 1 | 1.11 1 | 1.71 1 | 1.59 1 | 2.13 1 | 1.89 1 | 2.10 1 |
| Ifatigue’ | 1.28 2 | 1.71 2 | 1.66 2 | 1.19 2 | 0.99 2 | 1.74 2 | 1.74 2 | 2.13 2 | 2.47 2 | 3.02 2 | 1.60 2 | 2.03 2 | 1.92 2 | 3.34 2 | 2.55 2 |
| Bin | 64,774 | 9336 | 2148 | 11,861 | 14,602 | 42,932 | 7404 | 2990 | 3277 1 | 4960 1 | −29,895 1 | 4638 1 | 8476 1 | 23,989 1 | −25,659 1 |
| Bin’ | 58,623 2 | 12,805 2 | 10,210 2 | 28,882 2 | 54,300 2 | 47,992 2 | 53,940 2 | 94,813 2 | −6410 2 | 15,159 2 | 48,058 2 | 67,581 2 | 131,776 2 | 83,409 2 | 81,371 2 |
| Bfin | 84,942 | 8250 | 2672 | 14,909 | 16,413 | 38,306 | 8260 | 3651 | 4771 1 | −3052 1 | −24,765 1 | −12,462 1 | 8485 1 | 17,777 1 | −8640 1 |
| Bfin’ | 63,601 2 | 13,946 2 | 7355 2 | 20,854 2 | 25,878 2 | 29,865 2 | 29,719 2 | 40,185 2 | 49,701 2 | 14,378 2 | 14,767 2 | 74,441 2 | 129,760 2 | 143,032 2 | 125,120 2 |
1 Original forecast. 2 Case scenario observed and forecasted values.
Table 25.
Case scenario results for the fatigue index (Ifatigue’).
| Variables | 1 | 2 | 3 | 4 | 5 | 6 | 7 | 8 | 1 | 2 | 3 | 4 | 5 | 6 | 7 |
|---|---|---|---|---|---|---|---|---|---|---|---|---|---|---|---|
| Observed Values | Forecasted Values | ||||||||||||||
| X15 | 100.02 | 100.02 | 100.02 | 144.80 | 144.80 | 144.80 | 144.80 | 144.80 | – | – | – | – | – | – | – |
| X15′ | 70.01 | 70.01 | 70.01 | 101.36 | 101.36 | 101.36 | 101.36 | 101.36 | – | – | – | – | – | – | – |
| Ifatigue | 1.31 | 0.88 | 1.24 | 1.25 | 1.12 | 0.89 | 1.11 | 1.22 | 1.13 1 | 1.11 1 | 1.71 1 | 1.59 1 | 2.13 1 | 1.89 1 | 2.10 1 |
| Ifatigue’ | 1.29 2 | 1.26 2 | 1.41 2 | 0.40 2 | 0.22 2 | 1.30 2 | 0.73 2 | 0.88 2 | 0.42 2 | 1.16 2 | 0.11 2 | 0.63 2 | 1.17 2 | 2.73 2 | 1.46 2 |
1 Original forecast. 2 Case scenario observed and forecasted values.
Table 26.
Comparison of all case scenario results.
| Variables | 1 | 2 | 3 | 4 | 5 | 6 | 7 | 8 | 1 | 2 | 3 | 4 | 5 | 6 | 7 |
|---|---|---|---|---|---|---|---|---|---|---|---|---|---|---|---|
| Observed Values | Forecasted Values | ||||||||||||||
| X15 | 100.02 | 100.02 | 100.02 | 144.80 | 144.80 | 144.80 | 144.80 | 144.80 | – | – | – | – | – | – | – |
| X15′ | 70.01 | 70.01 | 70.01 | 101.36 | 101.36 | 101.36 | 101.36 | 101.36 | – | – | – | – | – | – | – |
| Ifatigue | 1.31 | 0.88 | 1.24 | 1.25 | 1.12 | 0.89 | 1.11 | 1.22 | 1.13 1 | 1.11 1 | 1.71 1 | 1.59 1 | 2.13 1 | 1.89 1 | 2.10 1 |
| Ifatigue’ | 1.29 2 | 1.26 2 | 1.41 2 | 0.40 2 | 0.22 2 | 1.30 2 | 0.73 2 | 0.88 2 | 0.42 2 | 1.16 2 | 0.11 2 | 0.63 2 | 1.17 2 | 2.73 2 | 1.46 2 |
| Bin | 64,774 | 9336 | 2148 | 11,861 | 14,602 | 42,932 | 7404 | 2990 | 3277 1 | 4960 1 | −29,895 1 | 4638 1 | 8476 1 | 23,989 1 | −25,659 1 |
| Bin’ | 54,110 2 | 5805 2 | −383 2 | 27 2 | 3800 2 | −13,675 2 | −37,461 2 | −22,934 2 | −57,048 2 | −85,668 2 | −81,817 2 | −73,143 2 | −41,077 2 | −126,192 2 | −125,589 2 |
| Bfin | 84,942 | 8250 | 2672 | 14,909 | 16,413 | 38,306 | 8260 | 3651 | 4771 1 | −3052 1 | −24,765 1 | −12,462 1 | 8485 1 | 17,777 1 | −8640 1 |
| Bfin’ | 74,163 2 | 14,191 2 | 16,988 2 | 8718 2 | 13,882 2 | 12,022 2 | 8942 2 | 9386 2 | −13,330 2 | −66,599 2 | −100,595 2 | −86,328 2 | −86,169 2 | −107,341 2 | −140,325 2 |
1 Original forecast. 2 Case scenario observed and forecasted values.
Table 27.
Case scenario results for the fatigue index (Ifatigue’).
| Variables | 1 | 2 | 3 | 4 | 5 | 6 | 7 | 8 | 1 | 2 | 3 | 4 | 5 | 6 | 7 |
|---|---|---|---|---|---|---|---|---|---|---|---|---|---|---|---|
| Observed Values | Forecasted Values | ||||||||||||||
| X16 | 2 | 2 | 2 | 2 | 2 | 2 | 2 | 2 | – | – | – | – | – | – | – |
| X16′ | 5 | 5 | 5 | 5 | 5 | 5 | 5 | 5 | – | – | – | – | – | – | – |
| Ifatigue | 1.31 | 0.88 | 1.24 | 1.25 | 1.12 | 0.89 | 1.11 | 1.22 | 1.13 1 | 1.11 1 | 1.71 1 | 1.59 1 | 2.13 1 | 1.89 1 | 2.10 1 |
| Ifatigue’ | 0.12 2 | 0.77 2 | 1.97 2 | 1.04 2 | 2.10 2 | 0.58 2 | 1.01 2 | 1.22 2 | 2.74 2 | 1.71 2 | 2.89 2 | 1.93 2 | 2.84 2 | 2.40 2 | 3.12 2 |
1 Original forecast. 2 Case scenario observed and forecasted values.
Table 28.
Comparison of all case scenario results.
| Variables | 1 | 2 | 3 | 4 | 5 | 6 | 7 | 8 | 1 | 2 | 3 | 4 | 5 | 6 | 7 |
|---|---|---|---|---|---|---|---|---|---|---|---|---|---|---|---|
| Observed Values | Forecasted Values | ||||||||||||||
| X16 | 2 | 2 | 2 | 2 | 2 | 2 | 2 | 2 | – | – | – | – | – | – | – |
| X16′ | 5 | 5 | 5 | 5 | 5 | 5 | 5 | 5 | – | – | – | – | – | – | – |
| Ifatigue | 1.31 | 0.88 | 1.24 | 1.25 | 1.12 | 0.89 | 1.11 | 1.22 | 1.13 1 | 1.11 1 | 1.71 1 | 1.59 1 | 2.13 1 | 1.89 1 | 2.10 1 |
| Ifatigue’ | 0.12 2 | 0.77 2 | 1.97 2 | 1.04 2 | 2.10 2 | 0.58 2 | 1.01 2 | 1.22 2 | 2.74 2 | 1.71 2 | 2.89 2 | 1.93 2 | 2.84 2 | 2.40 2 | 3.12 2 |
| Bin | 64,774 | 9336 | 2148 | 11,861 | 14,602 | 42,932 | 7404 | 2990 | 3277 1 | 4960 1 | −29,895 1 | 4638 1 | 8476 1 | 23,989 1 | −25,659 1 |
| Bin’ | 45,660 2 | 2792 2 | 55,736 2 | 48,314 2 | 15,067 2 | −1921 2 | −22,851 2 | 756 2 | −58,537 2 | −61,686 2 | −141,993 2 | −84,822 2 | −145,946 2 | −92,746 2 | −150,069 2 |
| Bfin | 84,942 | 8250 | 2672 | 14,909 | 16,413 | 38,306 | 8260 | 3651 | 4771 1 | −3052 1 | −24,765 1 | −12,462 1 | 8485 1 | 17,777 1 | −8640 1 |
| Bfin’ | 60,635 2 | −23,290 2 | 15,832 2 | 40,640 2 | 536 2 | −31,541 2 | −63,445 2 | −78,187 2 | −66,089 2 | −48,404 2 | −39,856 2 | −52,874 2 | −100,000 2 | −87,854 2 | −45,263 2 |
1 Original forecast. 2 Case scenario observed and forecasted values.
Table 29.
Summary of results and conclusions.
| Examined Workload Settings Indicator—Label/Name | Implemented Modification | Fatigue Index—Results | Conclusion |
|---|---|---|---|
| X5—Number of individual days off in the previous 28 days | Increased by 3 extra days off (X5 + 3) | Decrease | More individual days off in the previous 28 days implies a lower level of fatigue. |
| X6—Rest length | Increased for 30% (X6 × 1.3) | Inconclusive | Rest length shows no significant impact on the appearance of fatigue. |
| X6—Rest length | Decreased for 30% (X6 × 0.7) | Inconclusive | |
| X7—Local night in daily rest | Increased by 3 extra local nights (X7 + 3) | Increase | Having a local night implies an increased level of fatigue. 1 |
| X7—Local night in daily rest | Decreased by 1 extra local night (X7 − 3) | Decrease | |
| X9—Changes in the schedule | Increased by 2 extra changes in the schedule (X9 + 2) | Inconclusive | The number of changes in the schedule shows no significant impact on the appearance of fatigue. |
| X10—Sectors in the previous 7 days | Increased for 30% (X10 × 1.3) | Inconclusive | The number of sectors in the previous 7 days shows no significant impact on the appearance of fatigue. |
| X10—Sectors in the previous 7 days | Decreased for 30% (X10 × 0.7) | Inconclusive | |
| X15—Duty time in the previous 28 days | Increased for 30% (X15 × 1.3) | Increase | Less duty time in the previous 28 days implies a lower level of fatigue. |
| X15—Duty time in the previous 28 days | Decreased for 30% (X15 × 0.7) | Decrease | |
| X16—Multi-day shifts | Increased by 3 extra days on the shift (X16 + 3) | Increase | Shorter multi-day shifts imply a lower level of fatigue. |
1 This should be additionally examined.
Disclaimer/Publisher’s Note: The statements, opinions and data contained in all publications are solely those of the individual author(s) and contributor(s) and not of MDPI and/or the editor(s). MDPI and/or the editor(s) disclaim responsibility for any injury to people or property resulting from any ideas, methods, instructions or products referred to in the content. |
© 2023 by the authors. Licensee MDPI, Basel, Switzerland. This article is an open access article distributed under the terms and conditions of the Creative Commons Attribution (CC BY) license (https://creativecommons.org/licenses/by/4.0/).
Share and Cite
MDPI and ACS Style
Bartulović, D.; Steiner, S.; Fakleš, D.; Mavrin Jeličić, M. Simulating Flight Crew Workload Settings to Mitigate Fatigue Risk in Flight Operations. Aerospace 2023, 10, 904. https://doi.org/10.3390/aerospace10100904
AMA Style
Bartulović D, Steiner S, Fakleš D, Mavrin Jeličić M. Simulating Flight Crew Workload Settings to Mitigate Fatigue Risk in Flight Operations. Aerospace. 2023; 10(10):904. https://doi.org/10.3390/aerospace10100904
Chicago/Turabian StyleBartulović, Dajana, Sanja Steiner, Dario Fakleš, and Martina Mavrin Jeličić. 2023. "Simulating Flight Crew Workload Settings to Mitigate Fatigue Risk in Flight Operations" Aerospace 10, no. 10: 904. https://doi.org/10.3390/aerospace10100904
Note that from the first issue of 2016, this journal uses article numbers instead of page numbers. See further details here.