Article

Inversion of Space Debris Material by Synthetic Light Curves

Shandong Key Laboratory of Optical Astronomy and Solar-Terrestrial Environment, School of Space Science and Physics, Institute of Space Sciences, Shandong University, No. 180, Wenhua West Road, Weihai 264209, China
*
Author to whom correspondence should be addressed.
Aerospace 2023, 10(1), 41; https://doi.org/10.3390/aerospace10010041
Submission received: 25 November 2022 / Revised: 22 December 2022 / Accepted: 26 December 2022 / Published: 2 January 2023
(This article belongs to the Section Astronautics & Space Science)

Abstract

:
Ground-based optical observation of GEO space debris plays an essential role in tracking, identifying, cataloging, and classifying space debris. The factors that affect the brightness of space debris include size, surface material, illumination geometry, attitude, shape, position, and so on. In order to better understand the influence of the above factors on the brightness of space debris, the synthetic light curves are analyzed. The Ashikhmin–Shirley model is chosen to simulate the light curves of space debris. The effects of orbit, attitude, model parameters, and the location of the observation station on the synthetic light curves are analyzed by the control variable method. Based on the Markov Chain Monte Carlo method (MCMC), the optimal model parameters that characterize the surface material of space debris can be obtained by comparing the synthetic light curves with the observed light curves under certain shape, orbit, and attitude characteristics. The results are roughly in good agreement with those measured in the laboratory.

1. Introduction

The orbit status and attitude of space debris have always been a hot topic. The motion characteristics of space debris can be invertd by analyzing the law of light reflection on the surface of the object, which provides an essential theoretical basis for the optical research of space debris. When the light shines on the surface of the object, it may be absorbed and reflected, or it may directly pass through the object. The reflected and transmitted light received by the observation system carries information about the surface of the object, so it provides the possibility of object imaging and recognition. Photometry observation of space debris by ground-based optical telescopes has essential applications in tracking, identifying, classifying, and detecting space debris [1,2,3]. The brightness variation of space debris with time is affected by characteristics such as shape, size, position, attitude, surface material, and illumination geometry. Moreover, the variation in the light curves of space debris reflects the changes in its related characteristics. So, it is possible to invert the correlated characteristics of space debris from the light curves [4,5,6,7].
The most common method for space debris material identification is to use spectral data to invert material. The type of space material is determined by comparing the continuous reflective spectral and multi-band spectral signature of space debris with known materials [8,9]. The measured spectral data are decomposed and compared with the spectrum of material samples measured in the laboratory to obtain the composition of the materials on the surface of the debris [10,11]. Since the material of various parts of space debris are different, and the observed spectrum is mixed, a spectral unmixing technology is needed. A mathematical algorithm was used to decompose the mixed spectral signal into a single spectrum and analyze the composition of the material in the mixed spectrum. Currently, the application of spectral unmixing technology in space debris material identification is still under further study [12,13]. The color indices difference of the multi-band reflection spectrum also provides a new way to identify space material. Cowardin et al. [14] measured the color indices of space material commonly used by comparing the color indices of different materials before sunlight correction. They proved that it is theoretically feasible to estimate the materials composition of the surface of space debris by observing the color indices of space debris. The aging of the surface material of space debris significantly affects the spectrum characteristics, which is very unfavorable to identifying space debris. In addition, the phase angle also significantly influences the spectral line characteristics of the reflected spectrum. So, the spectral curves observed on different nights may also have significant differences. Therefore, repeated debris observations from multiple angles are required, taking considerable time.
We took photometry observations of a GEO space debris from 14:00 to 21:00 (UTC) on 17 October 2020. Its brightness changed significantly, with a broader peak appearing from 16:00 to 17:00 (UTC). When analyzing the observation data of GEO, many scholars found that there would be the peaking phenomenon during two periods of a year, also known as the seasonal “shine” phenomenon [3,15,16]. This phenomenon is due to the illumination geometry change by the solar phase angle. Moreover, drastic brightness changes will also occur when the target maneuvers or deviates from the original operation mode under particular circumstances. Without prior information, it is tough for a single observation station to judge whether a behavior differs from the conventional mode only from the peak value change of the light curves. Furthermore, the brightness of space debris is mainly affected by its shape, position, attitude, and surface material. Therefore, the overall brightness is the result of multiple factors coupled together. It is difficult to separate these factors from the overall brightness of the observed light curves. In order to understand the brightness changes of space debris and invert the surface characteristics of space debris better, we use the synthetic light curves for analysis.
A simple photometric model was developed by Cognion [17], which approximates the space debris as a Lambertian (diffusely reflecting) sphere. The model describes the light reflected from the main components of the space debris. The model allows each contribution to the debris’s reflected flux to be examined independently and provides insight into the physical origins of the debris’s signature. However, it only considers the diffuse reflection effect and has poor universality. Bradley and Axelrad [18] used simulated photometric observations of an upper-stage rocket body, a high area-to-mass ratio (HAMR) object, 1U and 3U CubeSats, as well as a box-wing satellite taken from a space-based optical sensor to assess the feasibility of light curve inversion method. The simulated model combines Lommel–Seeliger and Lambert laws [19,20]. This particular combination works well for modeling asteroids and extrasolar planets and is currently used by the light curve inversion (LCI) software suite [19,21]. However, the model cannot reflect the material characteristic of the object, so its applicability to space debris is limited.
The bidirectional reflection distribution function (BRDF) could be used to characterize the reflection characteristics of an object surface between ideal specular reflection and ideal diffuse reflection. The BRDF model is widely used to describe the geometric reflection relationship and material properties of space debris to accurately simulate light curves [18,22]. The BRDF model is generally divided into three categories: empirical model [23,24,25], physical-based model [26,27,28,29,30], and data-driven model [31]. The empirical model uses formulas based on experiments to make rapid estimates of BRDF but does not take into account the physical rationality behind it. The data-driven model establishes the BRDF’s lookup table according to the measured data to facilitate rapid search and calculation, but the calculation is rough, and the error is significant. The physical-based model establishes the reflection equation according to the geometry and optical properties of the material on the surface of the object that meets the energy conservation and interaction. It has the rationality and explanation of physics and is more widely used. At present, the improved Phong model [32], Cook–Torrance model [33], and Ashikhmin–Shirley model are the most commonly used by scholars [30,34,35].
In this work, a new idea is proposed to obtain the best model parameters by comparing observed light curves with synthetic light curves. These parameters include the reflection parameters and the parameters of the Phong model that mirror the surface material characteristics of space debris. The surface material of space debris could be roughly judged by comparing it with the reflective properties of materials measured in the laboratory on the ground.
In Section 2, the brightness simulation model that we employed is described. The model is used to generate the light curves of a cube-shaped target, and the effects of different factors on the synthetic light curves are analyzed. In Section 3, the materials of space debris are inverted by the Markov Chain Monte Carlo method. Given the shape and attitude parameters, the observed light curves are compared with the synthetic light curves to fit the optimal model parameters. The summary is given in Section 4.

2. Brightness Simulation Model and Result Analysis

2.1. Brightness Simulation Model

The surface of an object can be decomposed into a finite number of flat facets, and the properties of each facet can be described by a set of vectors. Therefore, we can simulate and analyze the individual facet of the object and then combine them together. The illumination geometric relationship of a single facet is shown in Figure 1. Superscript I denotes that the vector is expressed in inertial coordinates, superscript B denotes that the vector is expressed in body coordinates. Here, u u B , u v B , and u n B are three unit vectors representing the facet; u n B is the normal vector of the lighted facet; u u B and u v B are the in-plane vector. Furthermore, the unit vector u sun I points to the Object-to-Sun direction, and the unit vector u obs I points to the Object-to-Observer direction; u h I is the Sun–Object–Observer bisector.
The BRDF can be used to characterize the reflection characteristics of an object surface between ideal specular reflection and ideal diffuse reflection. The BRDF [36] is given by
f r ( θ i , ϕ i ; θ r , ϕ r ; λ ) = d L r ( θ r , ϕ r ; λ ) d E i ( θ i , ϕ i ; λ ) ,
where θ i is the angle between the incident direction and the normal direction of the surface, and θ r is the angle between the outgoing direction and the normal direction of the surface. Here, ϕ i and ϕ r are the azimuth of the incident direction and the emergent direction; λ is the wavelength; d L r is the differential radiance of the reflected light in W · m 2 · sr 1 , and d E i is the differential irradiance from the direction of incident light in W · m 2 .
The BRDF model adopted in this paper is the Ashikhmin–Shirley model [30,34], which is a kind of anisotropic physical model and satisfies the law of energy conservation and interaction. The model decomposed BRDF into specular reflection part and diffuse reflection part:
F = f spec + f diff ,
f spec = ( n u + 1 ) ( n v + 1 ) 8 π ( u n I · u h I ) z ( u h I · u sun I ) max ( u n I · u sun I , u n I · u obs I ) F reflect ,
z = n u ( u h I · u u I ) 2 + n v ( u h I · u v I ) 2 1 ( u h I · u n I ) 2 ,
F reflect = R spec + ( 1 R spec ) ( 1 u sun I · u h I ) 5 ,
f diff = ( 28 R diff 23 π ) ( 1 R spec ) [ 1 ( 1 u n I · u sun I 2 ) 5 ] [ 1 ( 1 u n I · u obs I 2 ) 5 ] ,
u i I = A ( q ) u i B , i = u , v , n .
In the Equations (3)–(7), n u and n v are the parameters of the Phong model related only to surface material of space debris. R spec and R diff are reflection coefficients of specular and diffuse of space debris. F reflect is the Fresnel reflection function. The vectors in body coordinates can be rotated to the inertial coordinates by the attitude matrix ( A ( q ) ) using the quaternion parameterization.
The total solar flux over optical wavelengths that strikes an object surface is
F sun = C sun F u n I · u sun I ,
where C sun = 455 W · m 2 is the power per square meter impinging on a particular facet due to visible light striking the surface [34].
The solar reflected energy for one facet observed at the observation station is
F obs = F sun A i u n I · u obs I r obs 2 ,
where r obs is the position vector from space debris to the observer, and A i is the surface area of a facet. If there is no sunlight reflected from the surface of the debris to the observer, that is, the angle between the surface normal and the observer’s direction, or the surface normal and the direction of solar incidence is greater than π / 2 . In this case, F sun = 0 or F obs = 0 . The total energy observed is
F total , obs = i = 1 n F obs ( i ) .
The reflected sunlight can be used to calculate the apparent magnitude by Equation (10).
m app = 26.7 2.5 log 10 F total , obs C sun ,
where 26.7 is the apparent magnitude of the Sun.

2.2. The Analysis of the Simulation Model

The brightness of space debris results from the joint action of many factors. How does each factor affect the brightness of space debris? In general, the larger the area, the brighter the space debris under the same reflection conditions. In this section, the influence of several primary factors on the brightness of space debris is analyzed by using the control variable method. Suppose that we have a space debris X , which is shaped like a cube, and the area of each facet is set as 16 m 2 . The simulation time was from 12:00 to 20:00 (UTC) on 10 October 2020. The simulation was conducted for the station from which the debris was observed. We consider the following three scenarios at the same station:
(1)
The identical shape, attitude, reflection condition( R spec , R diff , n u , n v ), and various orbit.
(2)
The identical shape, orbit, reflection condition( R spec , R diff , n u , n v ), and various attitude.
(3)
The identical shape, orbit, attitude, and various reflection condition( R spec , R diff , n u , n v ).
Finally, we changed the observation station position in the fourth case, leaving everything else unchanged. The following four cases are discussed separately.

2.2.1. Effect of Orbit Parameters on Light Curves

Here, the attitude is selected as the three-axis stabilized attitude control system, with Z axis pointing to the nadir and X axis pointing to the velocity direction. The parameters of the Phong model and the reflection parameters are n u = n v = 12 , 000 , R spec = 0.8 , and R diff = 0.2 . GEO orbit and MEO orbit are selected, with the orbit altitude of about 36,000 km and 20,000 km . Each type of orbit is divided into two orbits with different inclinations. The TLE is shown in Table 1, and the corresponding synthetic light curves are shown in Figure 2.
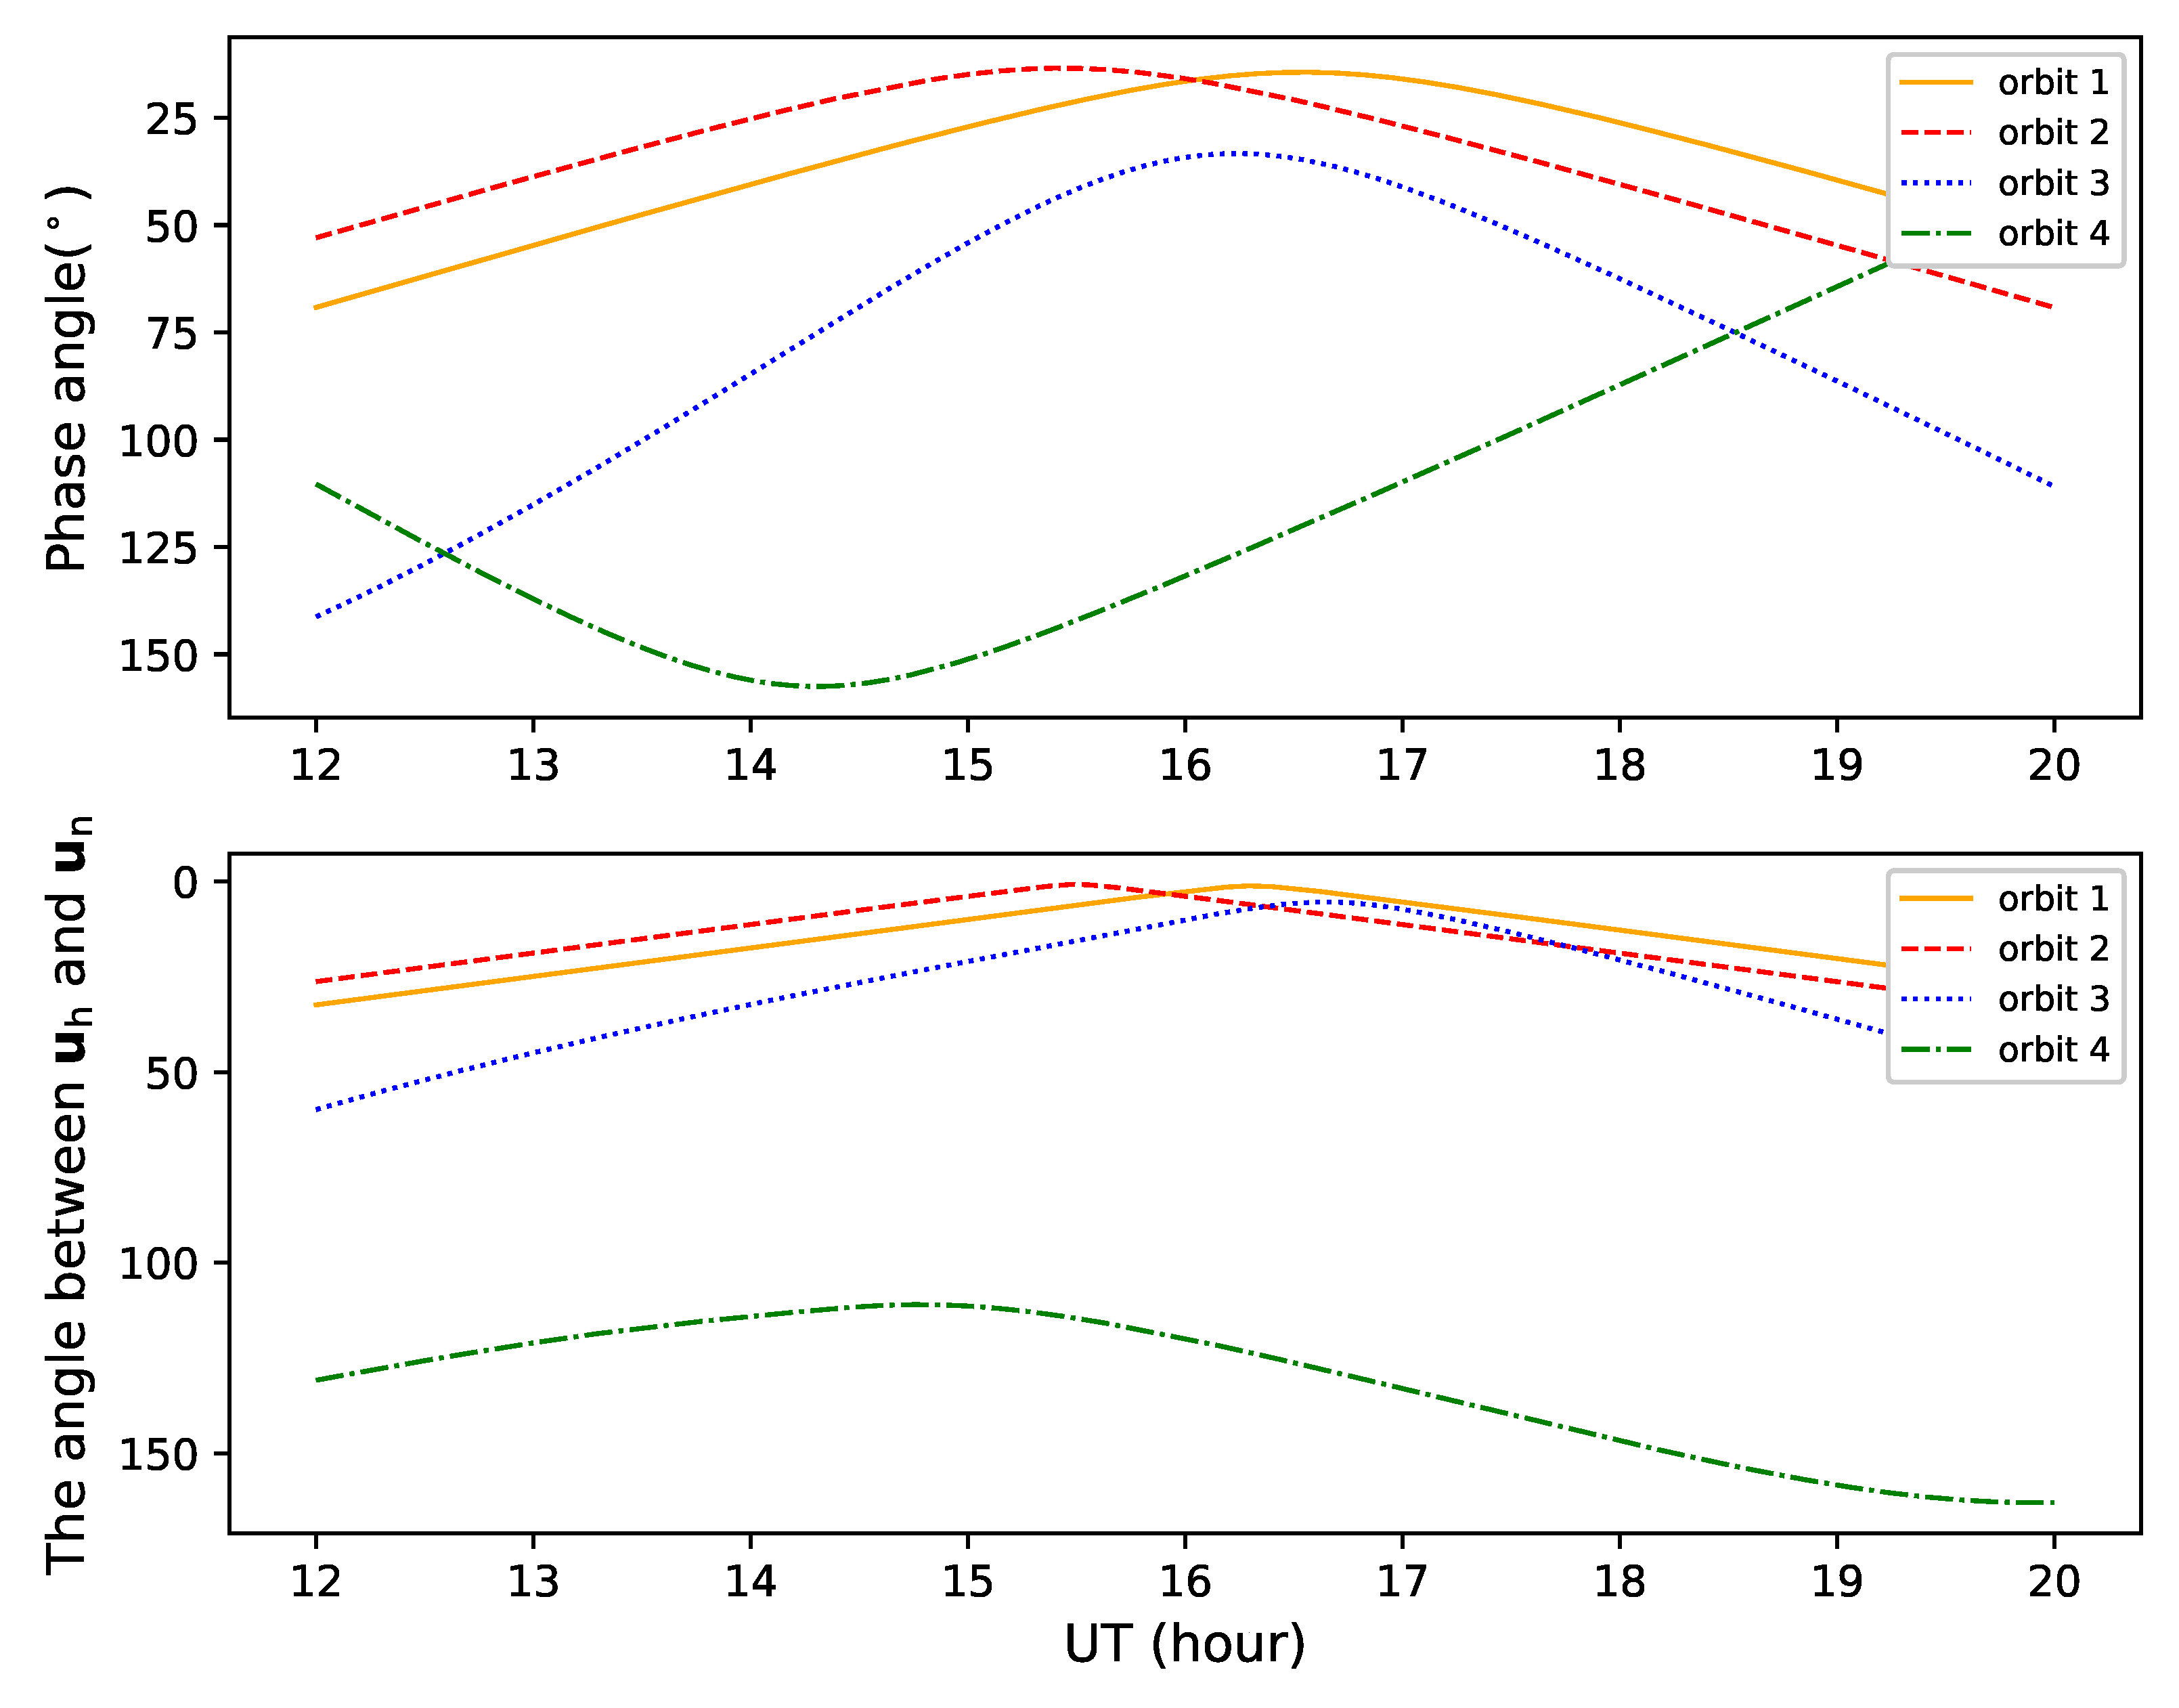
As seen from Figure 2, there are apparent differences in the light curves of different orbits and peaking phenomena in specific orbits. Here, we assumed that the shape, attitude, surface material, and other properties were identical. So, the main factor influencing the light curves is the observation geometry between the Sun, the object, and the observer. The observed geometry is different for different orbits, and the brightness changes are also different. The change of the angles with time for different orbits is shown in Figure 3. The phase angle of Orbit 1 and Orbit 2 is small at the peak position, and the angle between the bisector of the phase angle and the normal of the facet is close to 0 . When the observed geometry of space debris satisfies the specular reflection condition, that is, the bisector of the phase angle is perpendicular to the surface of the object, the brightness changes dramatically. When a ray of light hits the surface of an object for specular reflection, there is not only one direction but a set of directions called specular reflection cone. Within this range, the specular reflection effect can be observed. Therefore, the magnitude of the brightness change also varies with the orbit, namely the observation geometry between the Sun, the object, and the observer.

2.2.2. Effect of Attitude Parameters on Light Curves

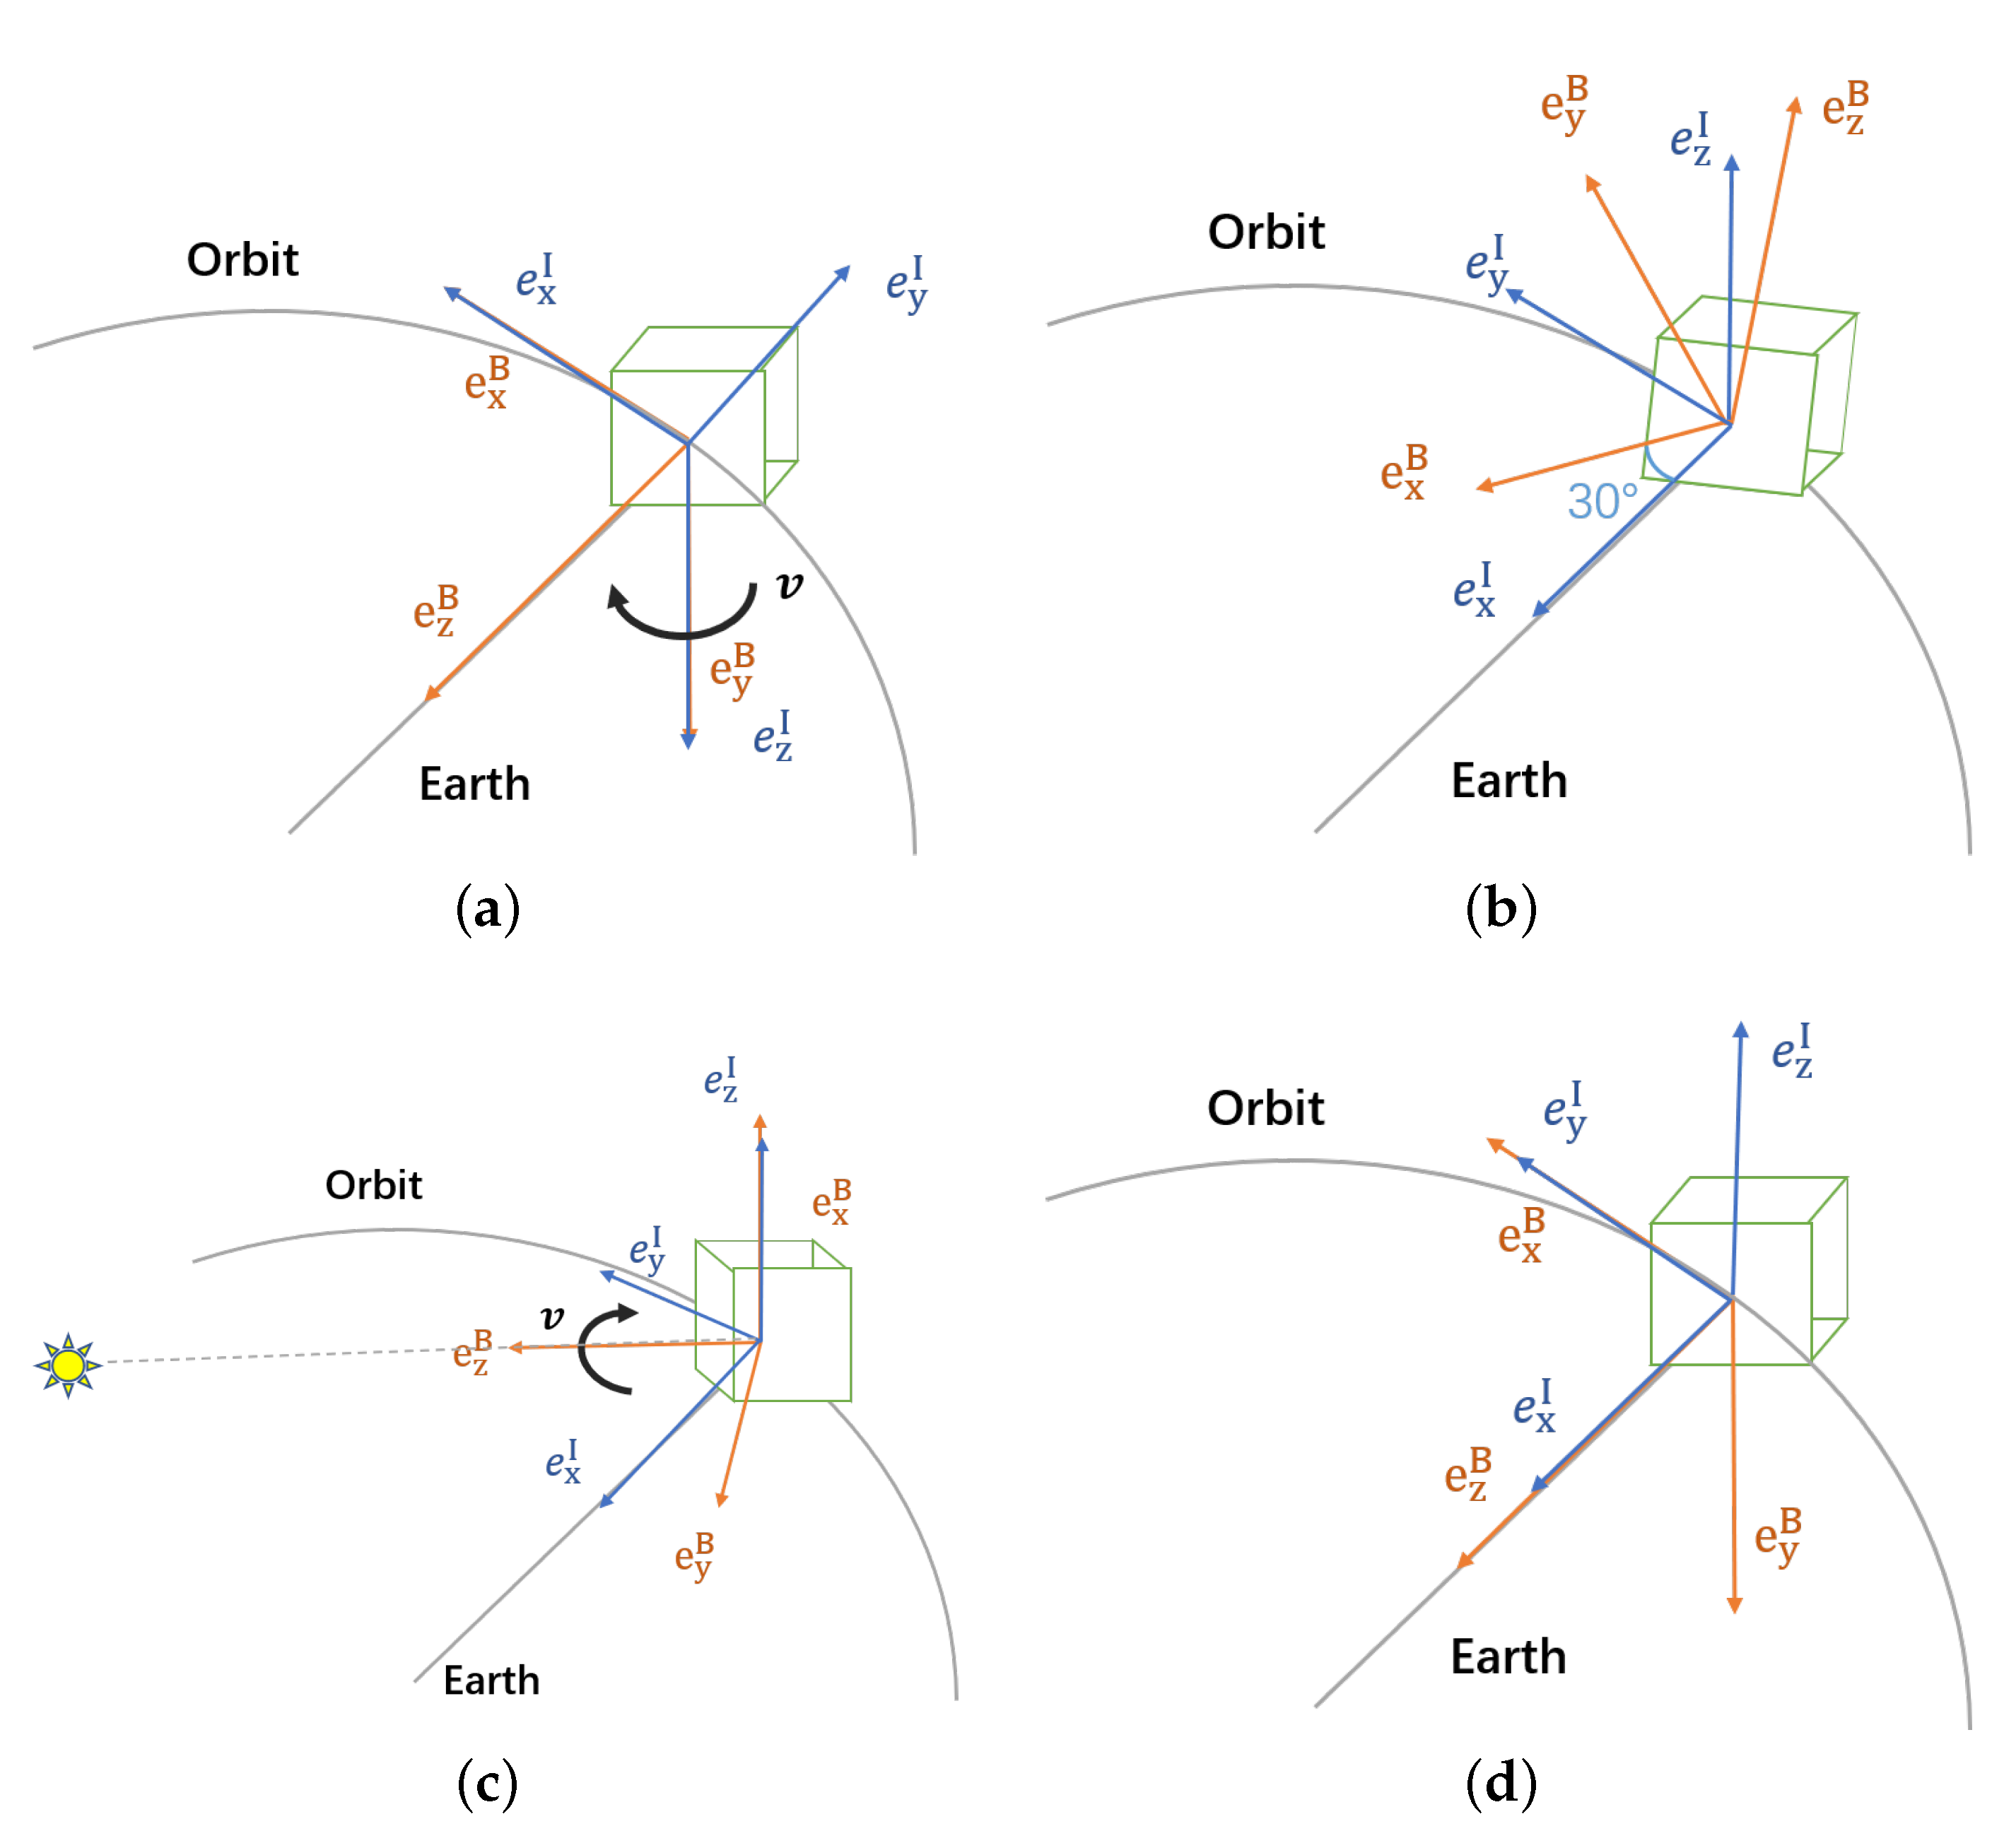
The TLE of Orbit 1 in Table 1 is used in the following simulations. The reflection conditions are the same as those in Section 2.2.1. The attitudes fall into the following four cases:
  • The Z axis of the body points to the nadir and spins around the Y axis of the body at the rate of 1 revs / h ;
  • The Z axis of the body is aligned with the inertial Z axis, and the angle between the X axis of the body and the inertial X axis is 30 ;
  • The Z axis of the body points to the Object-to-Sun vector, and the object spins around it at the rate of 1 revs / h ;
  • The Z axis of the body points to the nadir, and the X axis of the body points to the velocity direction.
The attitude is described by the position relationship between the body coordinate system and the reference coordinate system. There are two types of attitude control for space debris: three-axis stabilization and spinning stabilization. The above four attitude cases cover the two types. The effect of attitude on the light curve is actually the reflection of sunlight by different components of space debris. Therefore, if the change of attitude causes the sunlight reflected by the components to change, it will be reflected in the change of the light curve. Figure 4 shows a simplified schematic diagram of the above four attitude cases. Superscript B represents the axis orientation in the body coordinate system, and superscript I represents the axis orientation in the inertial coordinate system.
The synthetic light curves are shown in Figure 5, and we can see that attitudes dramatically influence the light curves. Though Attitude 1 and Attitude 3 rotate at the same rate, the light curves are different. The most interesting aspect of this figure is that there is obvious periodicity and sudden change in the brightness of the light curve of Attitude 1, but it is not seen in the light curve of Attitude 3. It is due to the axis of rotation being different. For Attitude 1, the observer can observe a particular facet regularly due to the object rotating about the Y axis of the body. As a result, brightness varies periodically. After analysis, it is found that the included angle between the Sun (or the object) and the surface normal is tiny at the position of brightness mutation, resulting in a powerful specular reflection effect, as shown in Figure 6. However, Attitude 3 rotates around the Object-to-Sun vector ( e z B ). The position of the Sun is unchanged for a short period. From Figure 4c, we can find that the observable facet of the station is the facet perpendicular to the e z B . During the rotation of the object, the observable facet hardly changes, resulting in no significant changes in the brightness of the light curve. The light curves of Attitude 2 and Attitude 4 are similar in shape, but the peak position is different. As can be seen from the attitude diagram in Figure 4b,d, there is an angle between the two attitudes. The observer observed a time difference on the identical facet, leading to the peak time difference. In addition, the geometric relationship when the peak occurs is also slightly different, so the brightness of the peak has a difference.

2.2.3. Effect of the Parameters of the BRDF Model on Light Curves

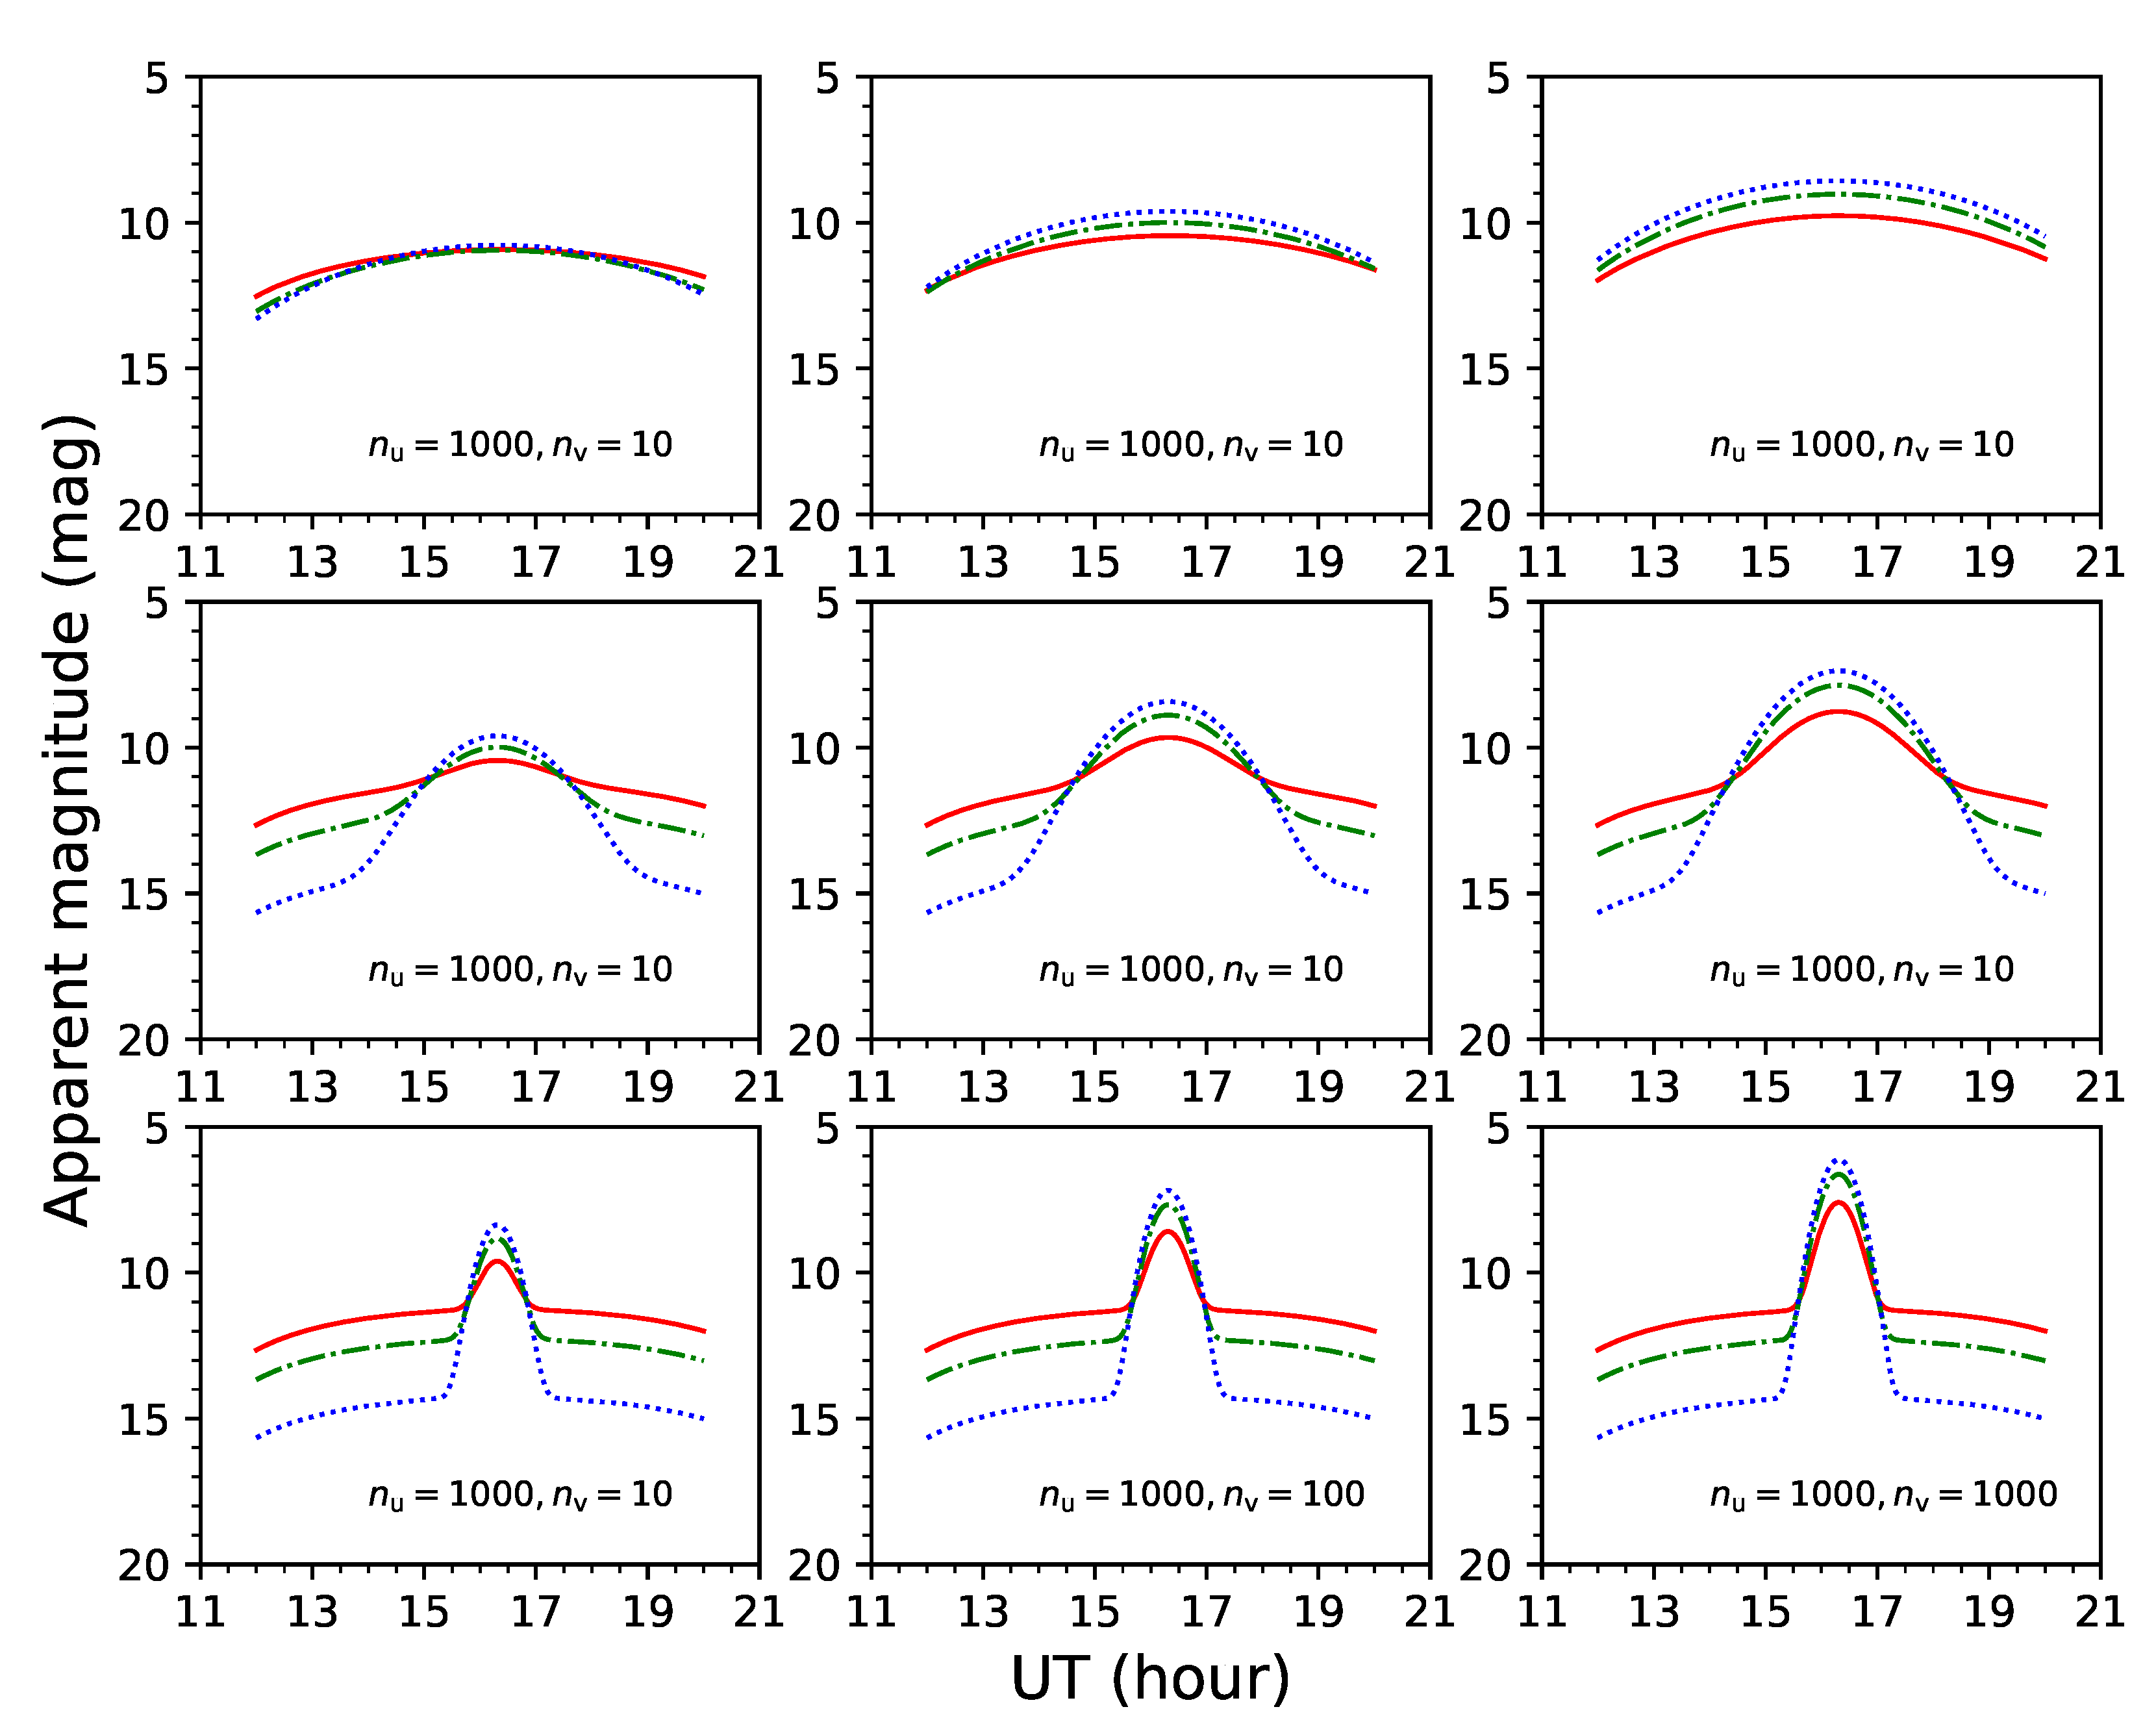
Here, the TLE of Orbit 1 in Table 1 and Attitude 4 in Section 2.2.2 (Figure 5d) are used in the following simulations. We compare the changes of the synthetic light curves under different parameters of the Phong model ( n u , n v ) and different reflection parameters ( R spec , R diff ), and the results are shown in Figure 7.
It is apparent from Figure 7 that the peak values depend on the parameters of the Phong model ( n u , n v ). The larger the parameters, the more obvious the peak and the sharper the light curve is. It indicates that the peak phenomenon is related to the parameters of the Phong model. The reflection parameters determine the bending degree of the light curve and the peak value. The larger the parameters of the specular reflection ( R spec ) are, the more obvious the peak is, and the greater the bending degree of the light curve is. It indicates that the reflection parameters are also related to the peak phenomenon. In general, it seems that the larger the parameters of the Phong model ( n u , n v ) and the parameters of the specular reflection ( R spec ) are, the more obvious the peak phenomenon is.

2.2.4. Effect of the Position of the Observation Station on the Light Curves

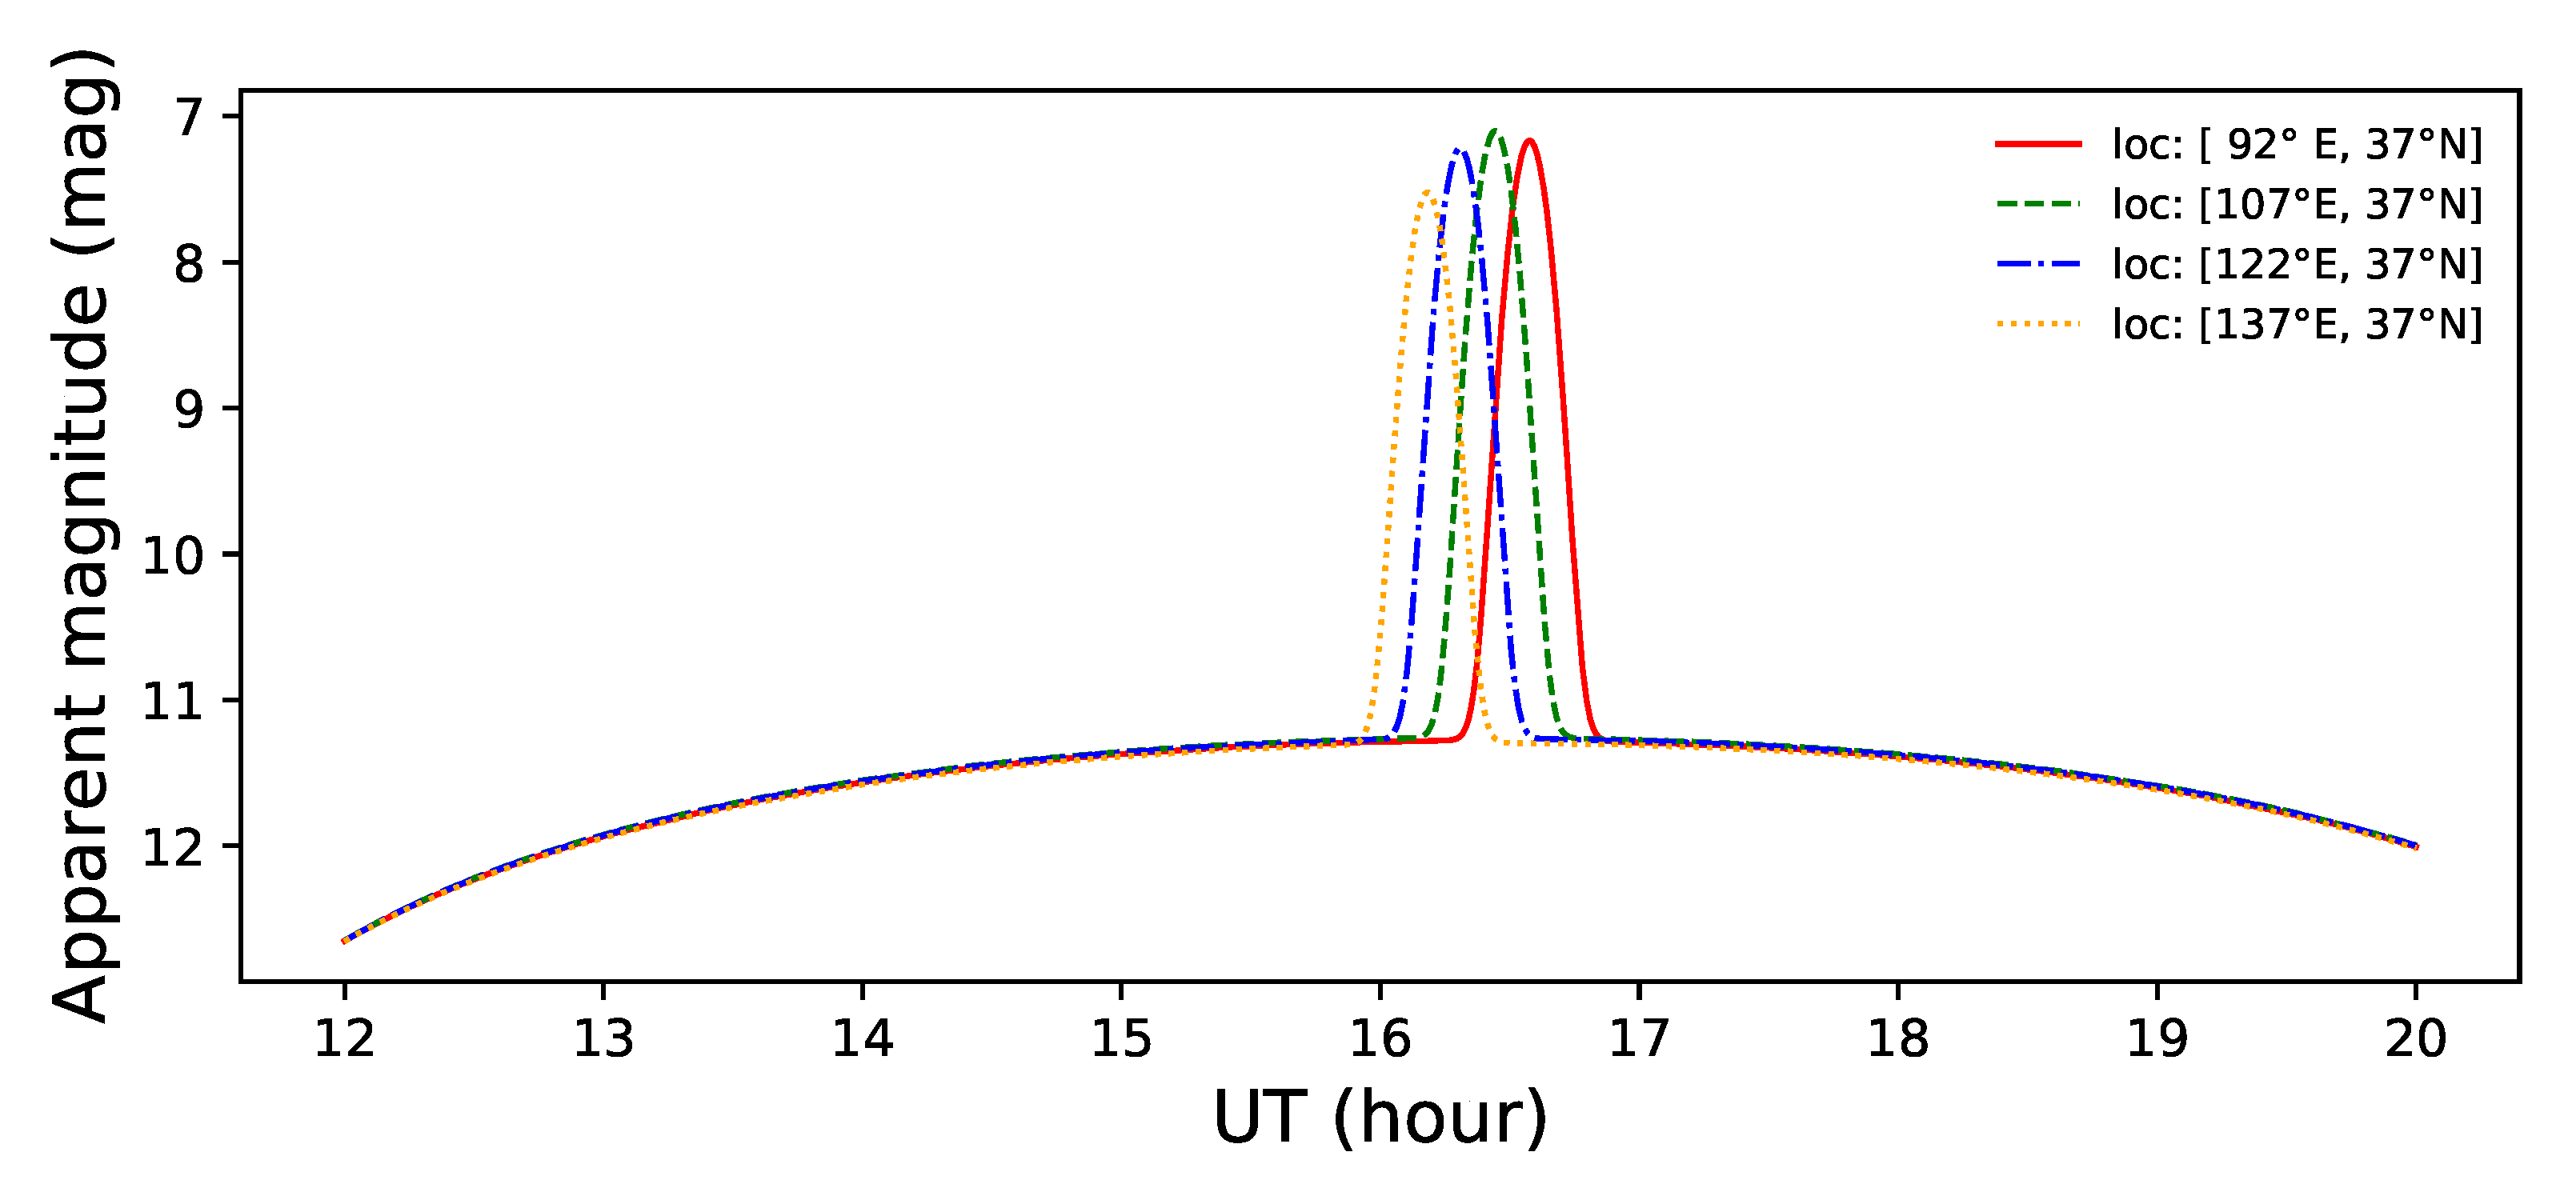
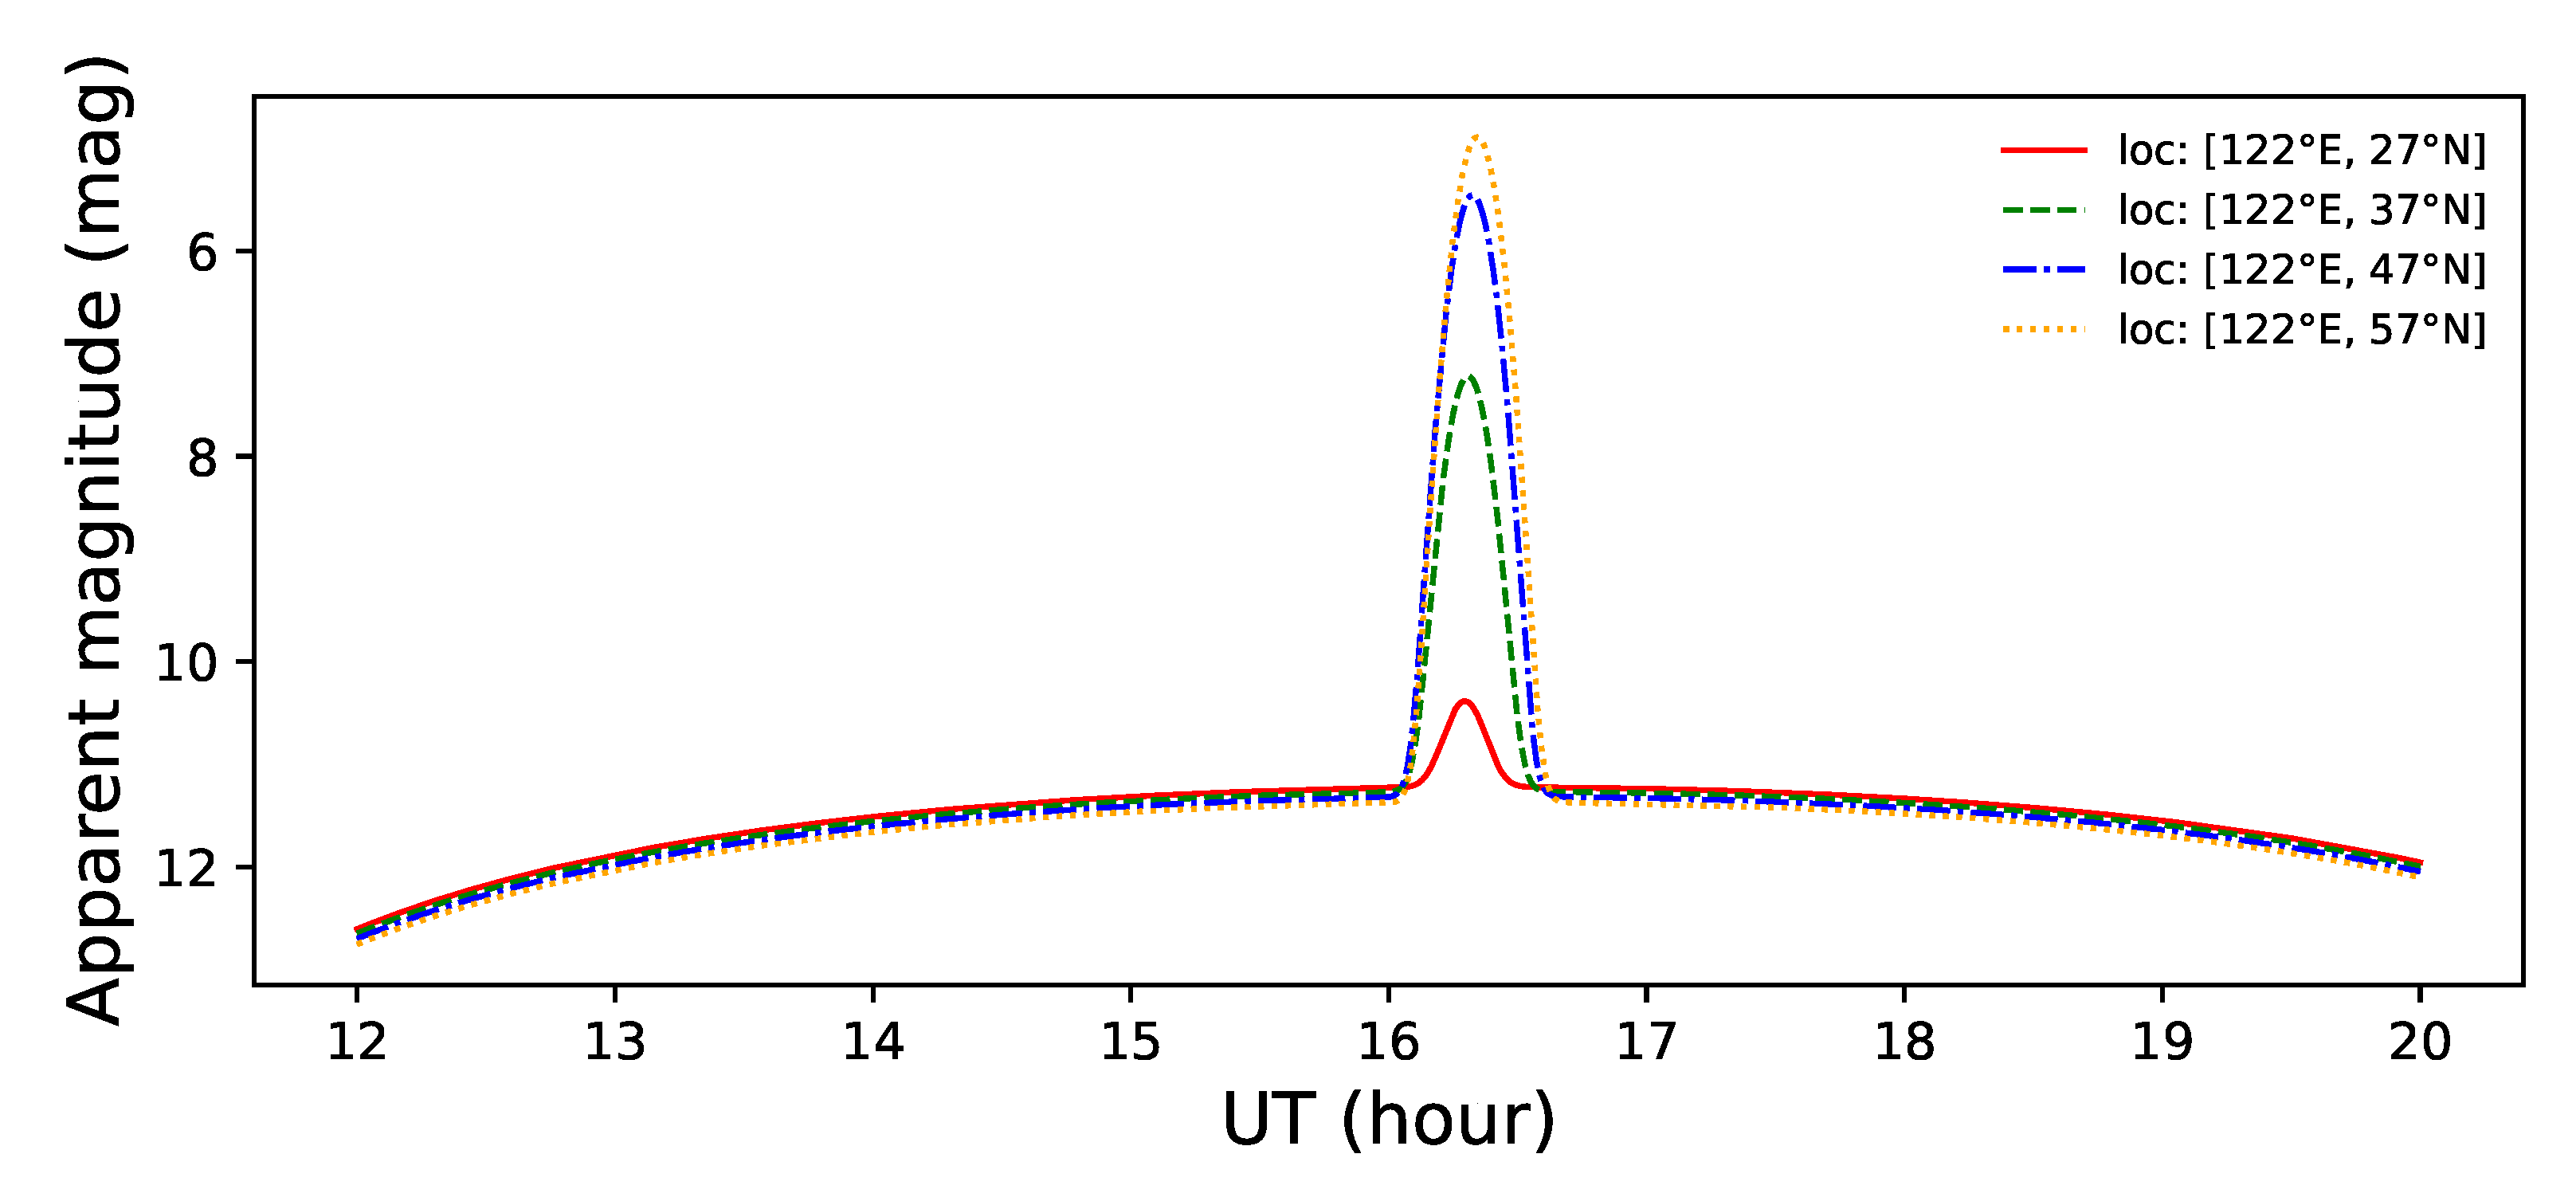
Here, the orbit and attitude are the same as those in Section 2.2.3. The parameters of the Phong model and the reflection parameters are n u = n v = 12 , 000 , R spec = 0.2 , and R diff = 0.8 . We change the location of the observation station, 15 apart in longitude and 10 apart in latitude, and the results are shown in Figure 8 and Figure 9.
It can be seen from Figure 8 that the light curves of space debris observed at identical latitude and different longitude stations have a time shift of about eight minutes, and there is not much difference in the size of the peak value. It can be inferred that the difference in longitude will lead to a specific time difference in the observed peak position. The time shift is caused by the geometric relationship of space debris to the station and the Sun. In order to observe the peak phenomenon of space debris, the geometric relationship between the Sun, the debris, and the observer needs to satisfy certain specular reflection conditions. In the case of simulation in this section, the latitude of the two stations is 37 N, and the longitude difference is 15 . The angular distance between the object and the two stations can be calculated to be about 2 . The orbit of the space debris is GEO orbit, the orbital period is 1436.16 min, and the angular distance that the debris travelled is about 2 in eight minutes. Therefore, when two stations with 15 longitude difference reach the same geometric observation conditions, there will be a time difference of eight minutes. As can be seen from Figure 9, the peak positions of space debris observed by stations at identical longitude and different latitudes are roughly consistent. However, there is a big difference in the amplitude of the peak values. It can be inferred that peaks may be observed at certain latitudes that are not observed at other latitudes, which is consistent with the actual observation situation. In conclusion, the longitude of the observation station determines when the peak is located, and the latitude determines whether we can observe the peak and how prominent the peak is.

2.2.5. Summary of the Brightness Simulation Model

We use the control variable method to analyze the influence of the above factors on synthetic light curves of space debris. The orbital parameters (position) of space debris have a greater influence on the object’s brightness than the shape parameters. The light curves of objects with different orbit types are obviously different. If the same orbital type objects have similar structures, their light curves will also be similar. We set up four attitude modes, including rotation, turn, and conventional. The analysis of the synthetic light curves show that the attitude mode has a great influence on the light curves, and the shape of the light curves are related to the attitude mode. The surface material of space debris (BRDF model parameters) are related to the peak phenomenon. The larger Phong model parameters ( n u , n v ) and specular reflection parameters ( R spec ) are, the more obvious the peak phenomenon is. The longitude of the observation station determines when the peak is located, and the latitude determines whether we can observe the peak and how large the peak is.
The simulation model is the basis of the material inversion method proposed in this paper. The accuracy and reliability of synthetic light curves also determine the accuracy of material inversion to some extent. Through the above analysis, on the one hand, we can understand the effects of these main influencing factors on the change of the light curve. On the other hand, the simulation results are consistent with the actual situation, which can also indirectly prove the reliability of the simulation model.

3. Material Inversion

In the previous sections, we discussed the effects of different factors on the light curve of space debris. The size of space debris mainly determines the magnitude of its brightness. When the shape, orbit, and attitude are fixed, the brightness of space debris will be determined by the parameters of the reflection and the parameters of the Phong model. The changes in these parameters mainly affect the shape of the light curve. Next, we proposed a similarity calculation method based on the Markov Chain Monte Carlo method. The optimal combination of the surface material parameters is obtained by comparing the similarity between the synthetic and observed light curves. These parameters are related to the material properties of the object itself, and the material information of the object can be deduced.

3.1. Markov Chain Monte Carlo Method

The Markov Chain Monte Carlo method (MCMC) is a method of fitting a model to data produced in the early 1950s [37]. It is a Monte Carlo simulation method under the framework of Bayesian theory. The method introduces a Markov Chain into an Monte Carlo simulation (i.e., random sampling), which is a method to generate a series of random variables in which the current value is dependent on the value of the prior variable in probability. Specifically, the selection of the following variable depends only on the last variable in the chain, thus achieving the dynamic simulation of the sampling distribution, unlike the traditional Monte Carlo simulation, which can only be static. During the simulation, the Markov chain converges to a stationary distribution. The basic idea of the Monte Carlo method is to use the “frequency” of an event as an approximation of the “probability” of the event. First, a probabilistic model is established so that its parameters serve as the solution to the problem. Then, the random process of the model parameters are simulated to obtain the probability of event occurrence. Finally, approximate values for the parameters of the desired solution are given.
According to the Bayesian theory, the complete posterior probability distribution ( P ( Θ | D ) ) of a given data set ( D ) by the prior distribution of the parameter space ( Θ ) is obtained by the following relationship:
P ( Θ | D ) p ( D | Θ ) P ( Θ )
Define − ln p ( D | Θ ) i = 1 N ( f model f obs σ obs ) 2 as the likelihood function; f model is the model values. f obs , and σ obs are the observed values and their errors, respectively. We assume that all materials of the research object are isotropic (i.e., n u = n v ). Therefore, parameter space Θ = [ n body , u , v , R body , spec , R body , diff , n panel , u , v , R panel , spec , R panel , diff ] includes the parameters of the Phong model of the body, the specular reflectance of the body, the diffuse reflectance of the body, the parameters of the Phong model of the solar panel, the specular reflectance of the solar panel, and the diffuse reflectance of the solar panel.
The main idea of the MCMC method is to obtain the probability density distribution of model parameters directly from the frequency distribution of parameters in the sample through random sampling in multi-dimensional parameter space. Since the specular reflection coefficient and diffuse reflection coefficient are floating-point numbers less than one, and their sum should be less than one, constraints are set:
0 < R body , spec < 1 , 0 < R body , diff < 1 , 0 < R panel , spec < 1 , 0 < R panel , diff < 1 , 0 < R body , spec + R body , diff < 1 , 0 < R panel , spec + R panel , diff < 1 .

3.2. The Simulation of the Actual Objects

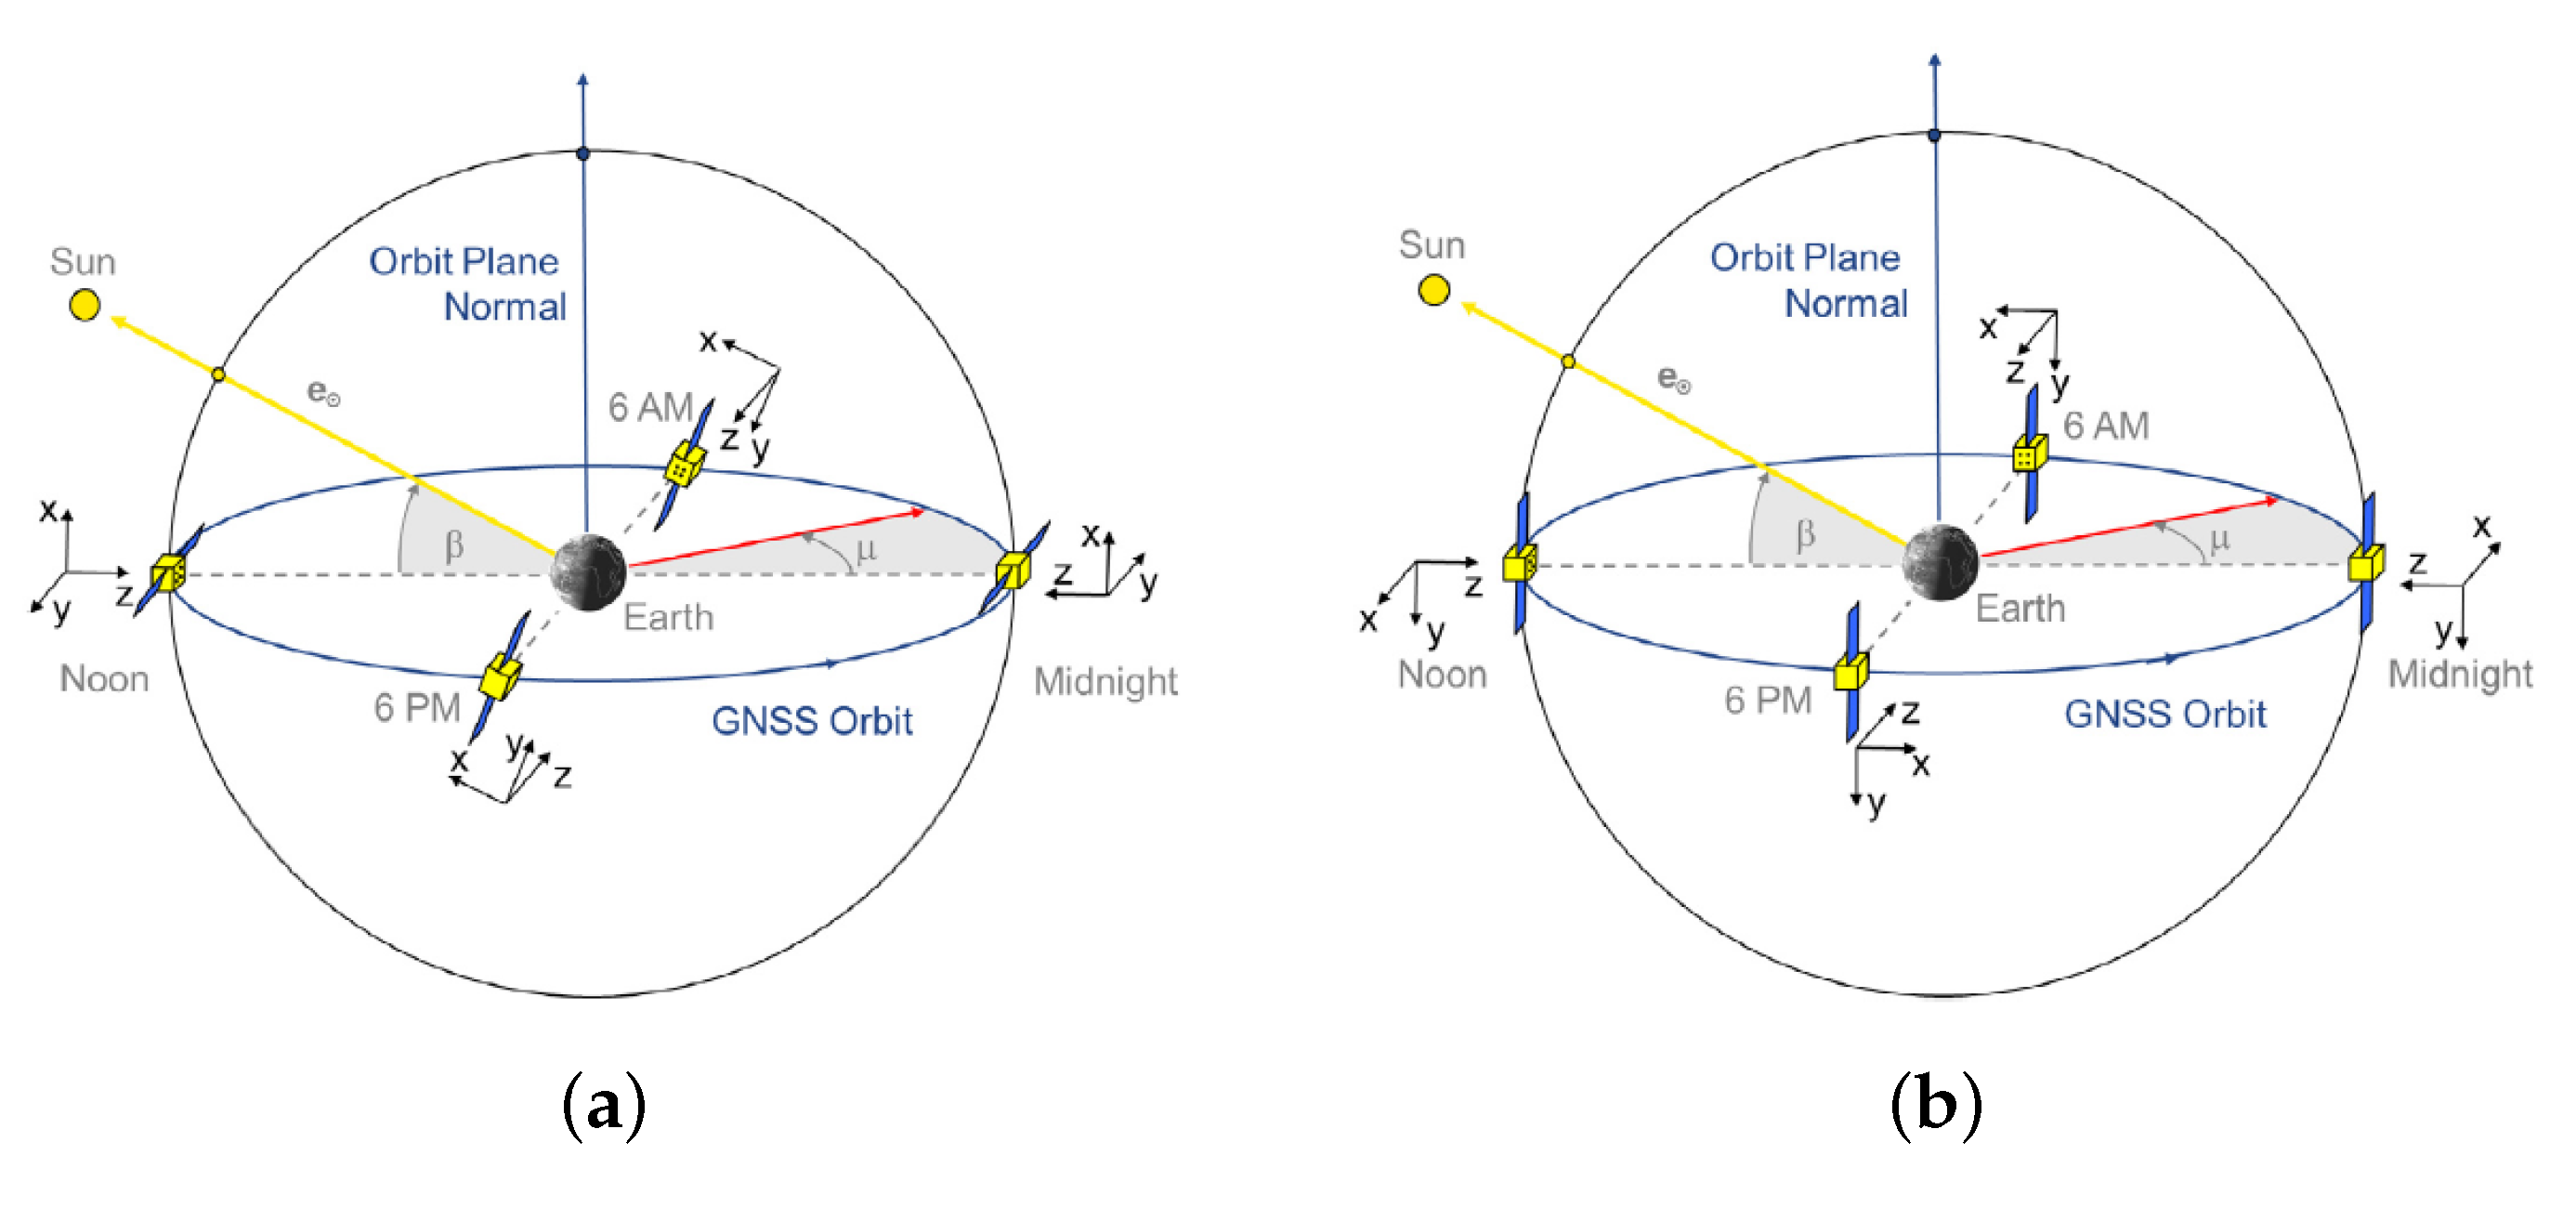
In this paper, we select two actual objects, located in GEO and MEO orbits respectively, as simulation objects to invert their surface material properties. Their structures are composed of the body, solar panels, and other components. In order to simplify the shape model of the structure, we ignore the influence of other components during the simulation. Suppose the body is a cuboid, and the solar panel is a thin panel. For Object 1 (GEO), its shape, size, orbit, and attitude are known, but the reflection parameters of the surface material are unknown. For Object 2 (MEO), its orbit and attitude are known, but its shape, size, and reflection parameters of surface material are unknown. According to the analysis in the previous section, the size of the shape is only related to the overall magnitude of space debris. It has almost no influence on the shape of the light curves. Therefore, here, we make reasonable assumptions about the shape of Object 2, which does not affect the final result. All the shape parameters are described in Table 2. The orbit parameters are Orbit 1 and 3 in Table 1. The attitude of the two objects are similar and only slightly vary in different situations. Figure 10 shows the attitude modes of Object 1 and 2. They are three-axis stability, with the Z axis pointing to the nadir, the Y axis along the rotation axis of the solar panel, the X axis following the right-hand rule, and the solar panel tracking the Sun. The difference is that Object 2 will adopt certain attitude maneuvers in a particular period. In contrast, Object 1 always maintains the existing attitude mode [38].
We took photometric observations for Object 1 with the Clear filter from about 14:00 to 21:00 (UTC) on 17 October 2020, and the observations for Object 2 were taken with the Clear filter from about 14:00 to 19:00 (UTC) on 25 February 2019. Since the transmittance curve of the G band of GAIA DR3 is close to that of the Clear filter, field star calibration was carried out by using the G band of GAIA DR3 to obtain the apparent magnitude outside the atmosphere for further analysis.

3.3. The Result of MCMC

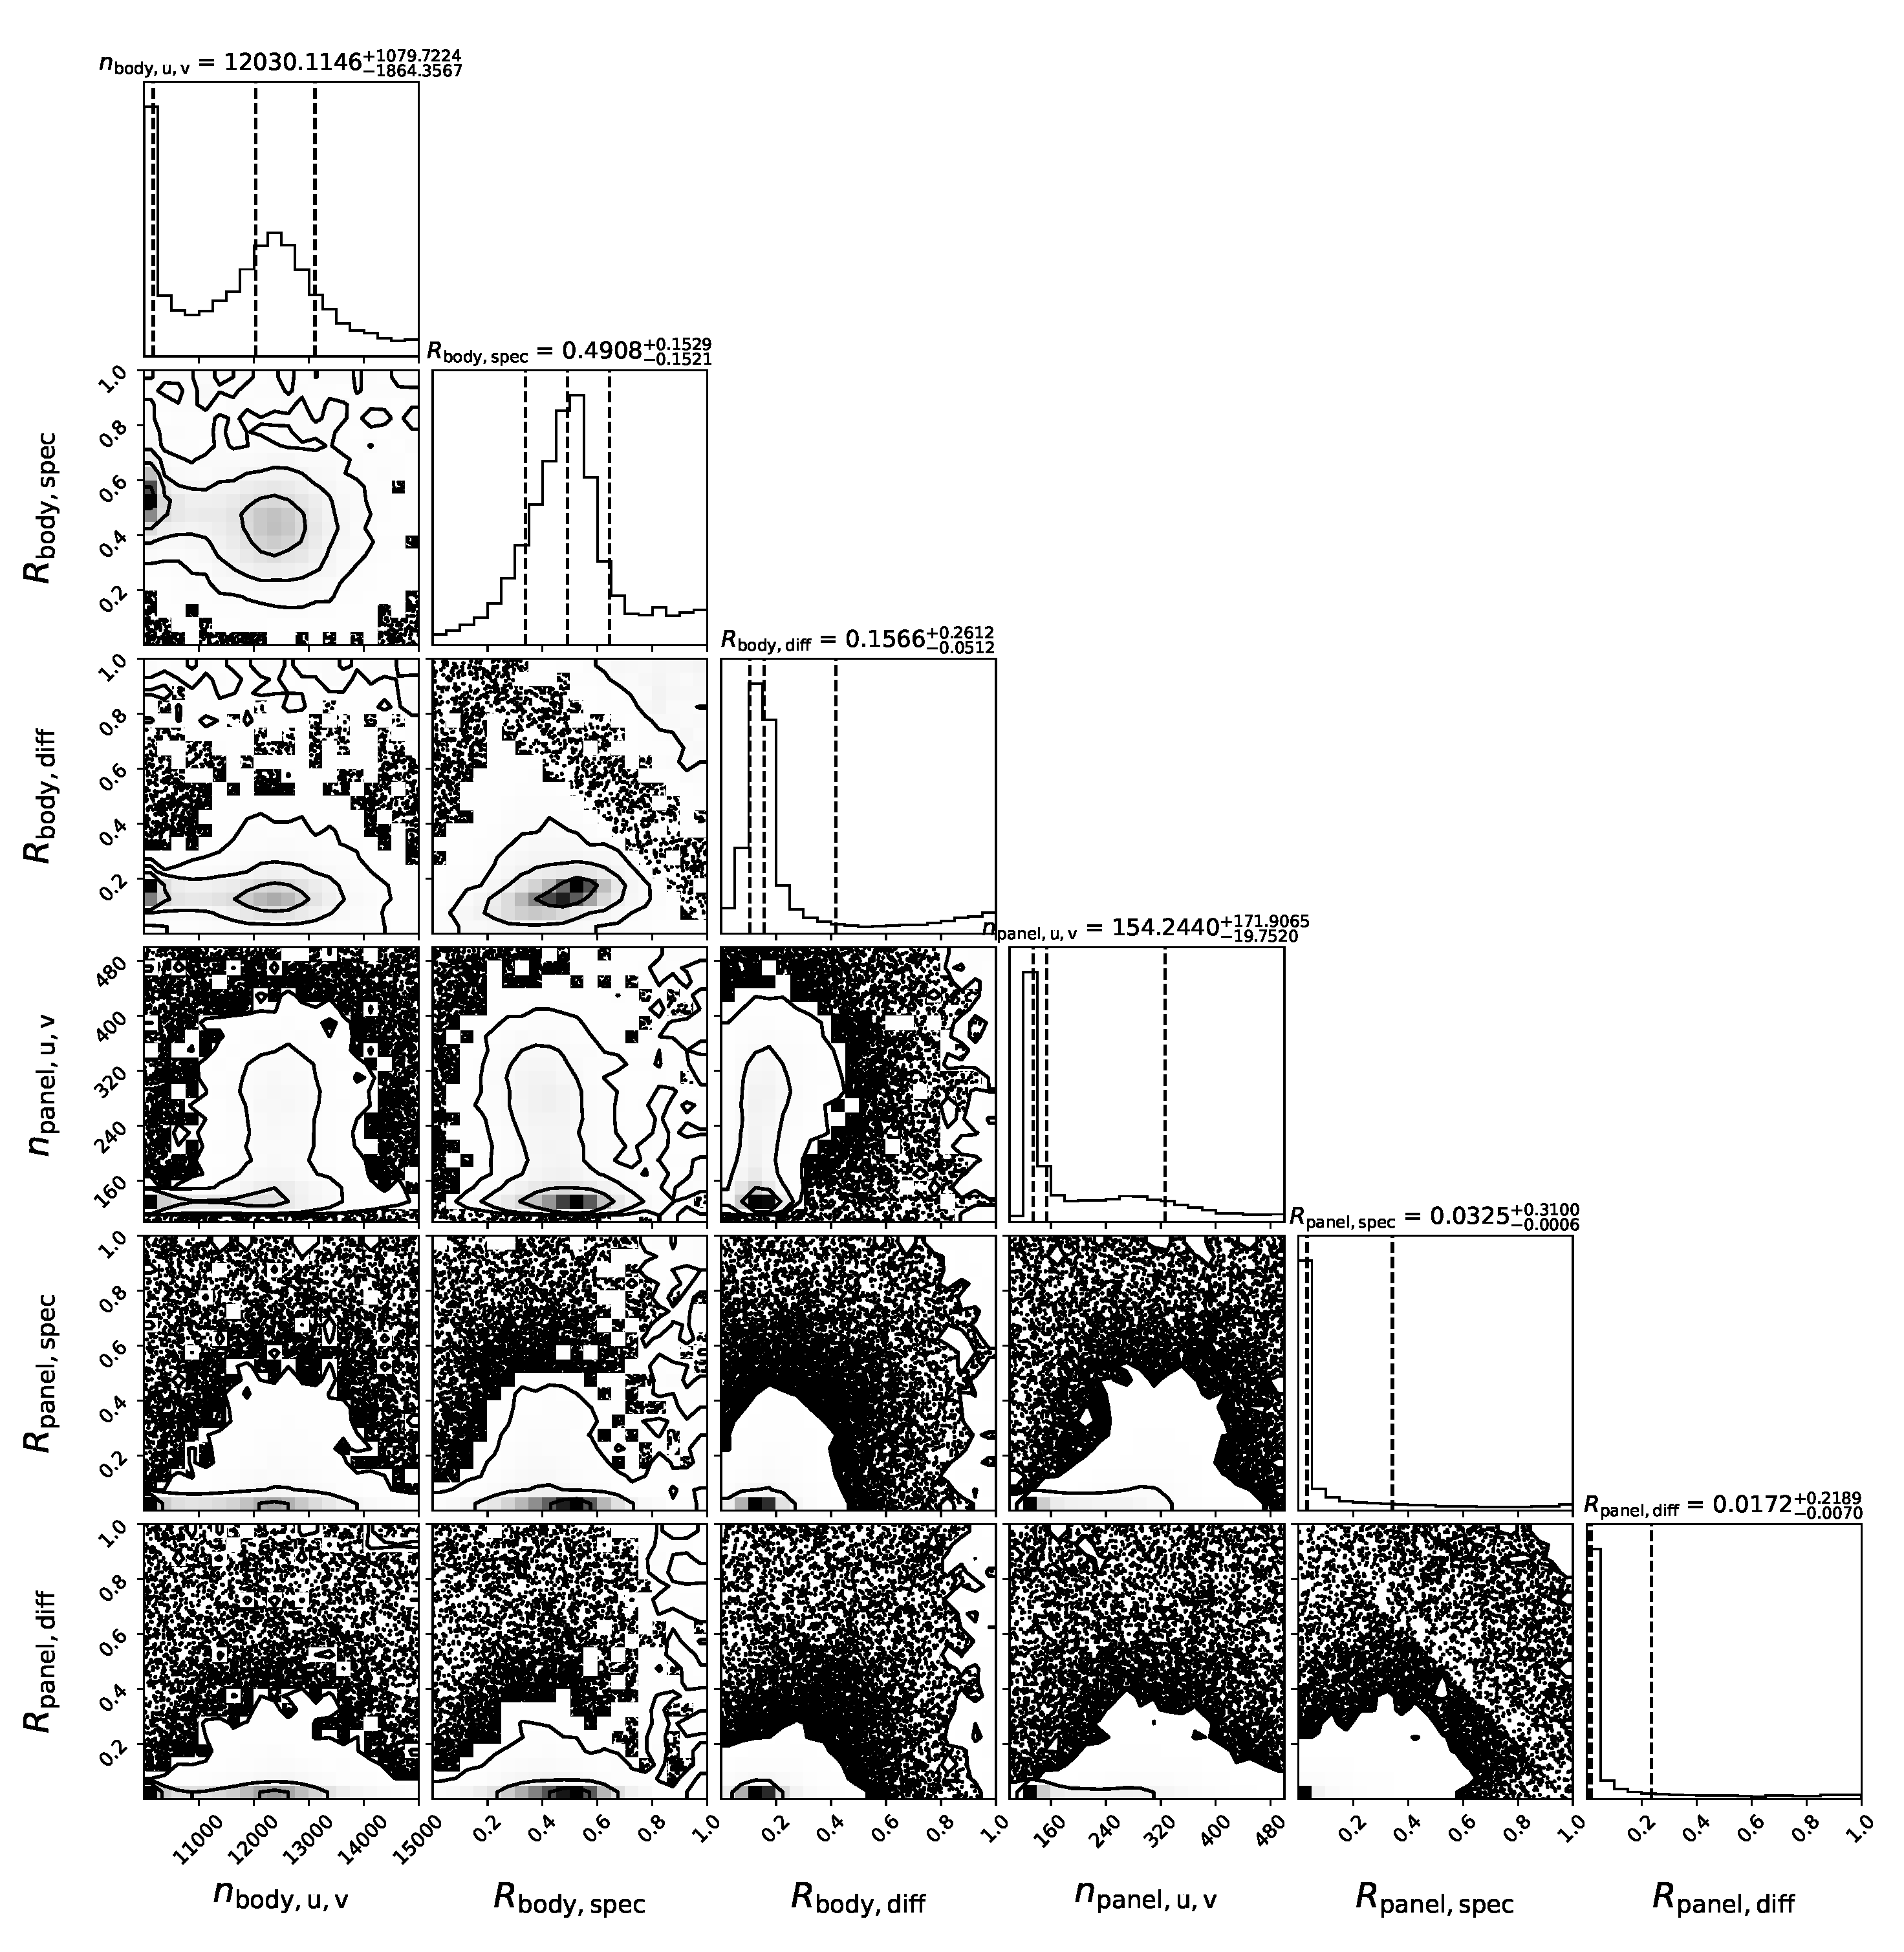
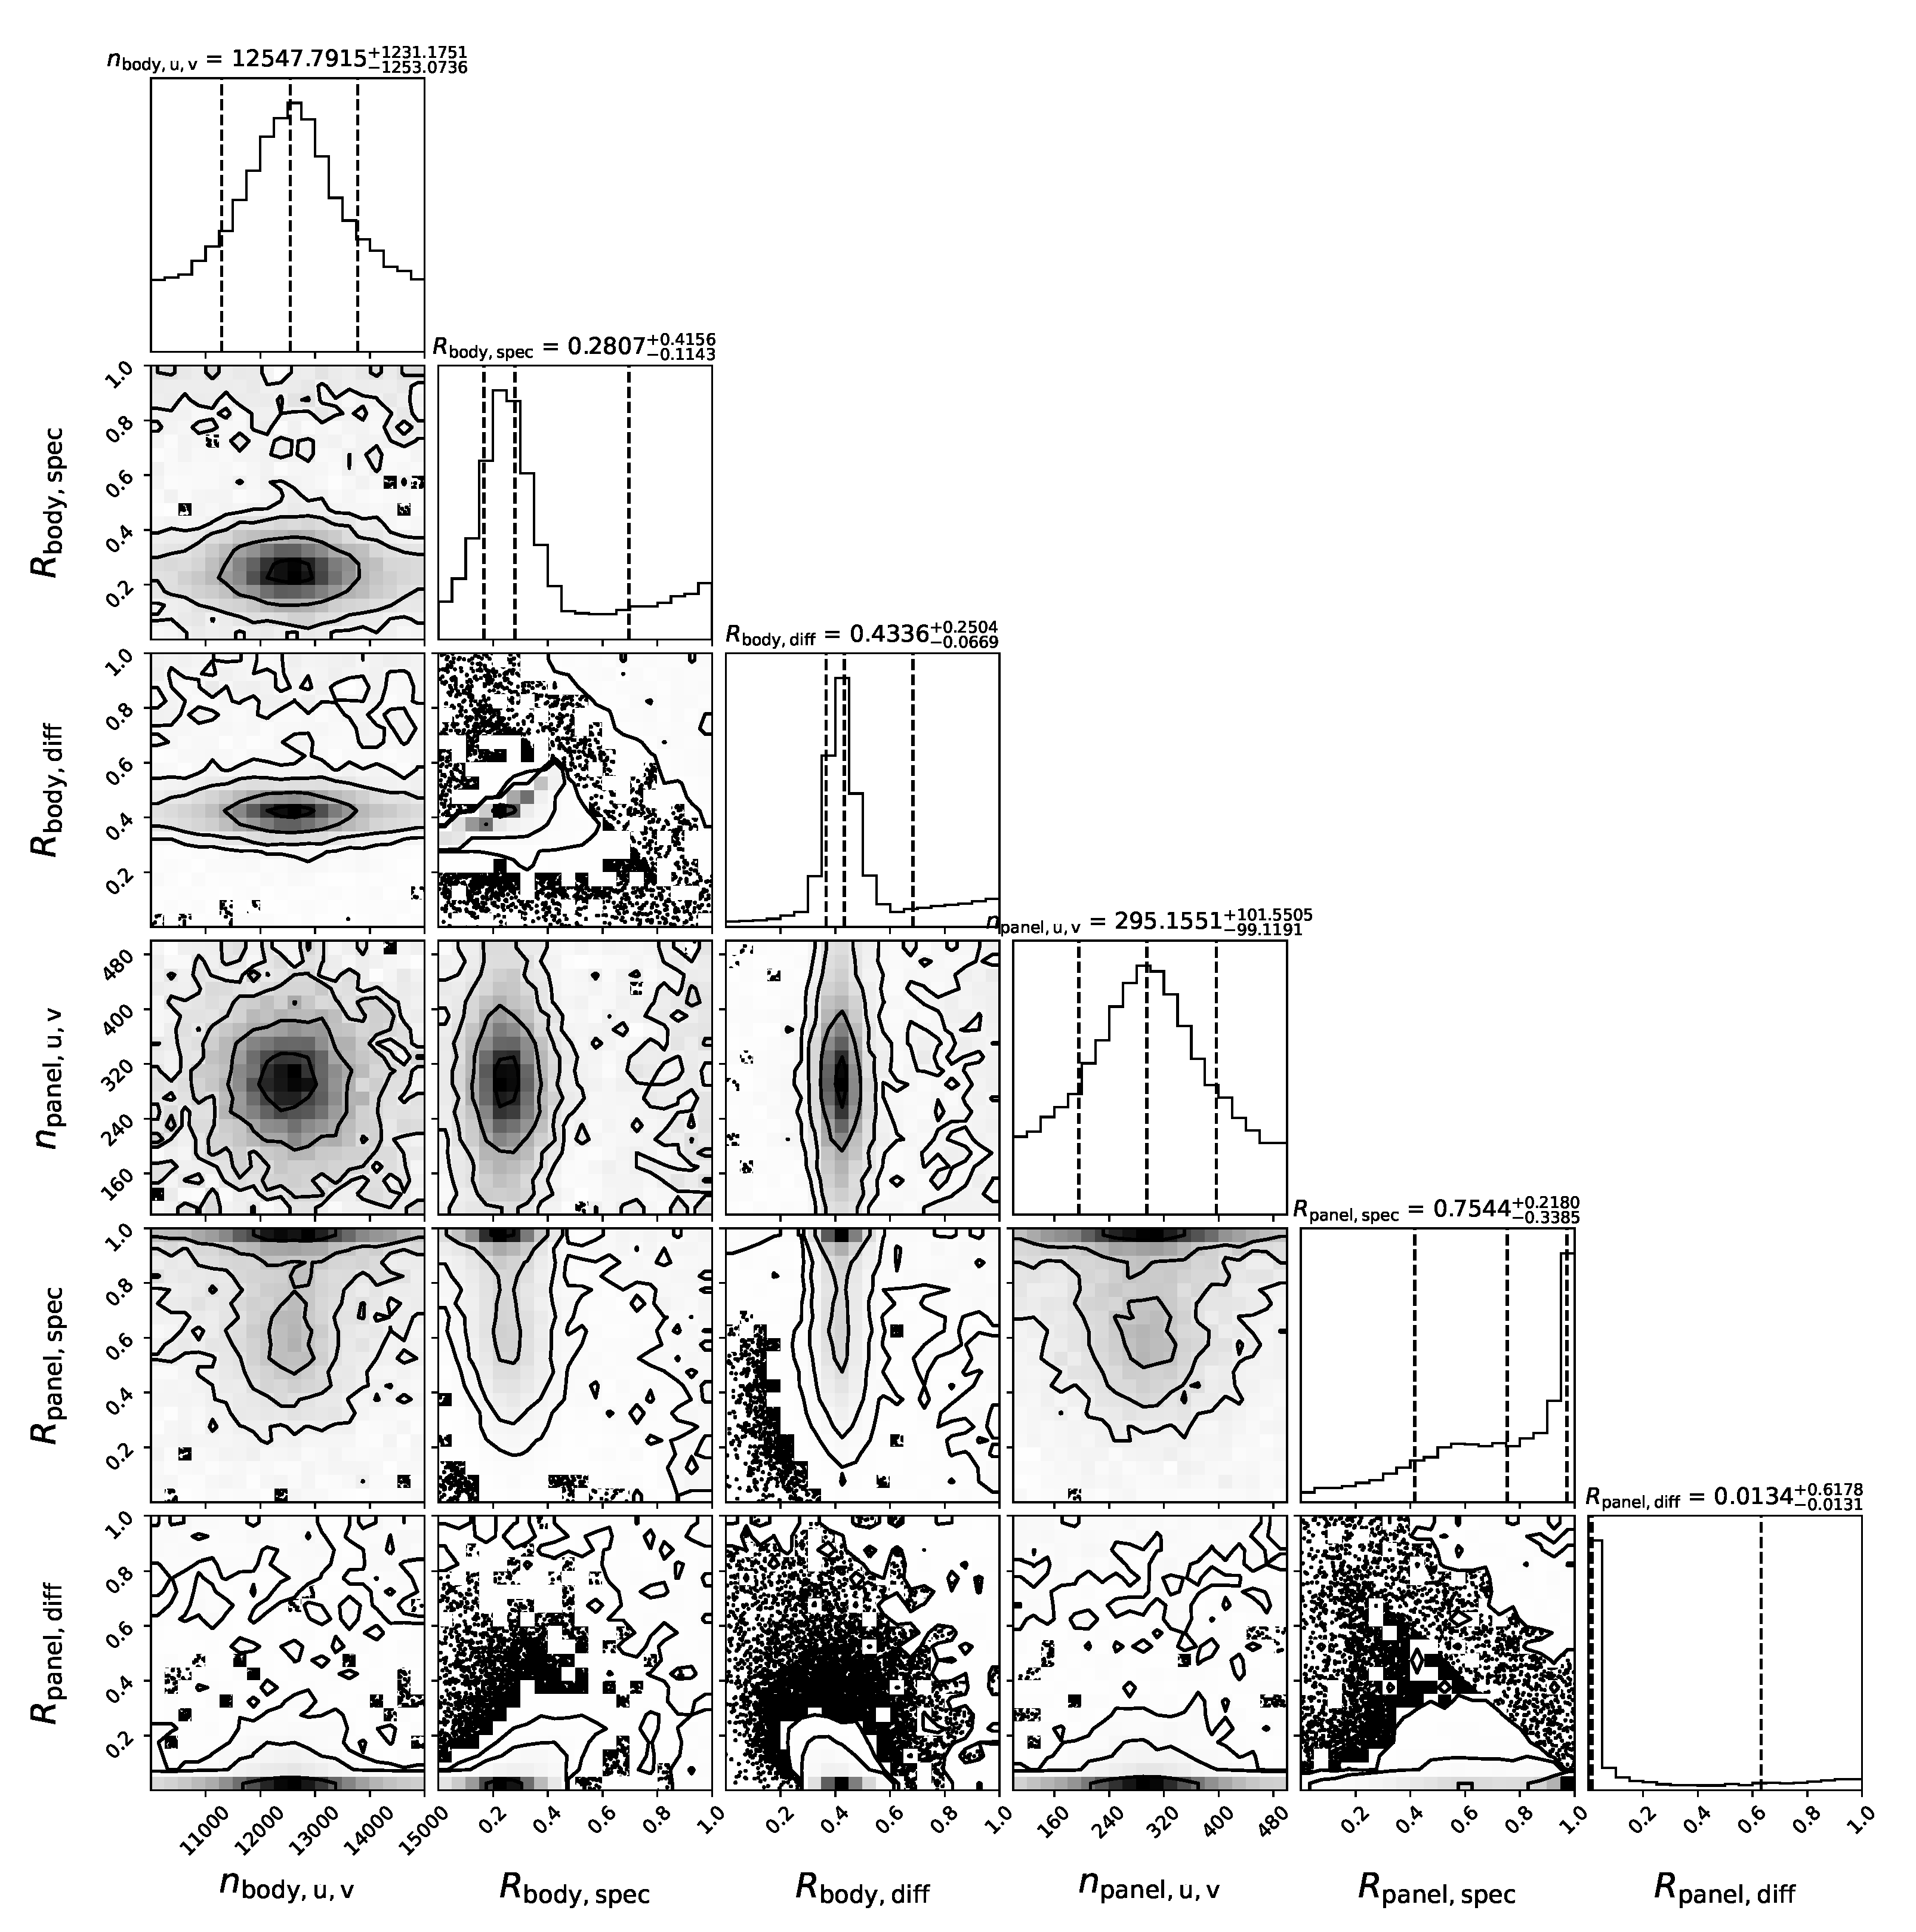
After MCMC calculation using the python software package emcee (https://emcee.readthedocs.io/en/stable/index.html, accessed on 23 November 2022), the fitted values of model parameters and error ranges of parameters can be obtained by marginalizing probability distributions, as shown in Figure 11 and Figure 12.
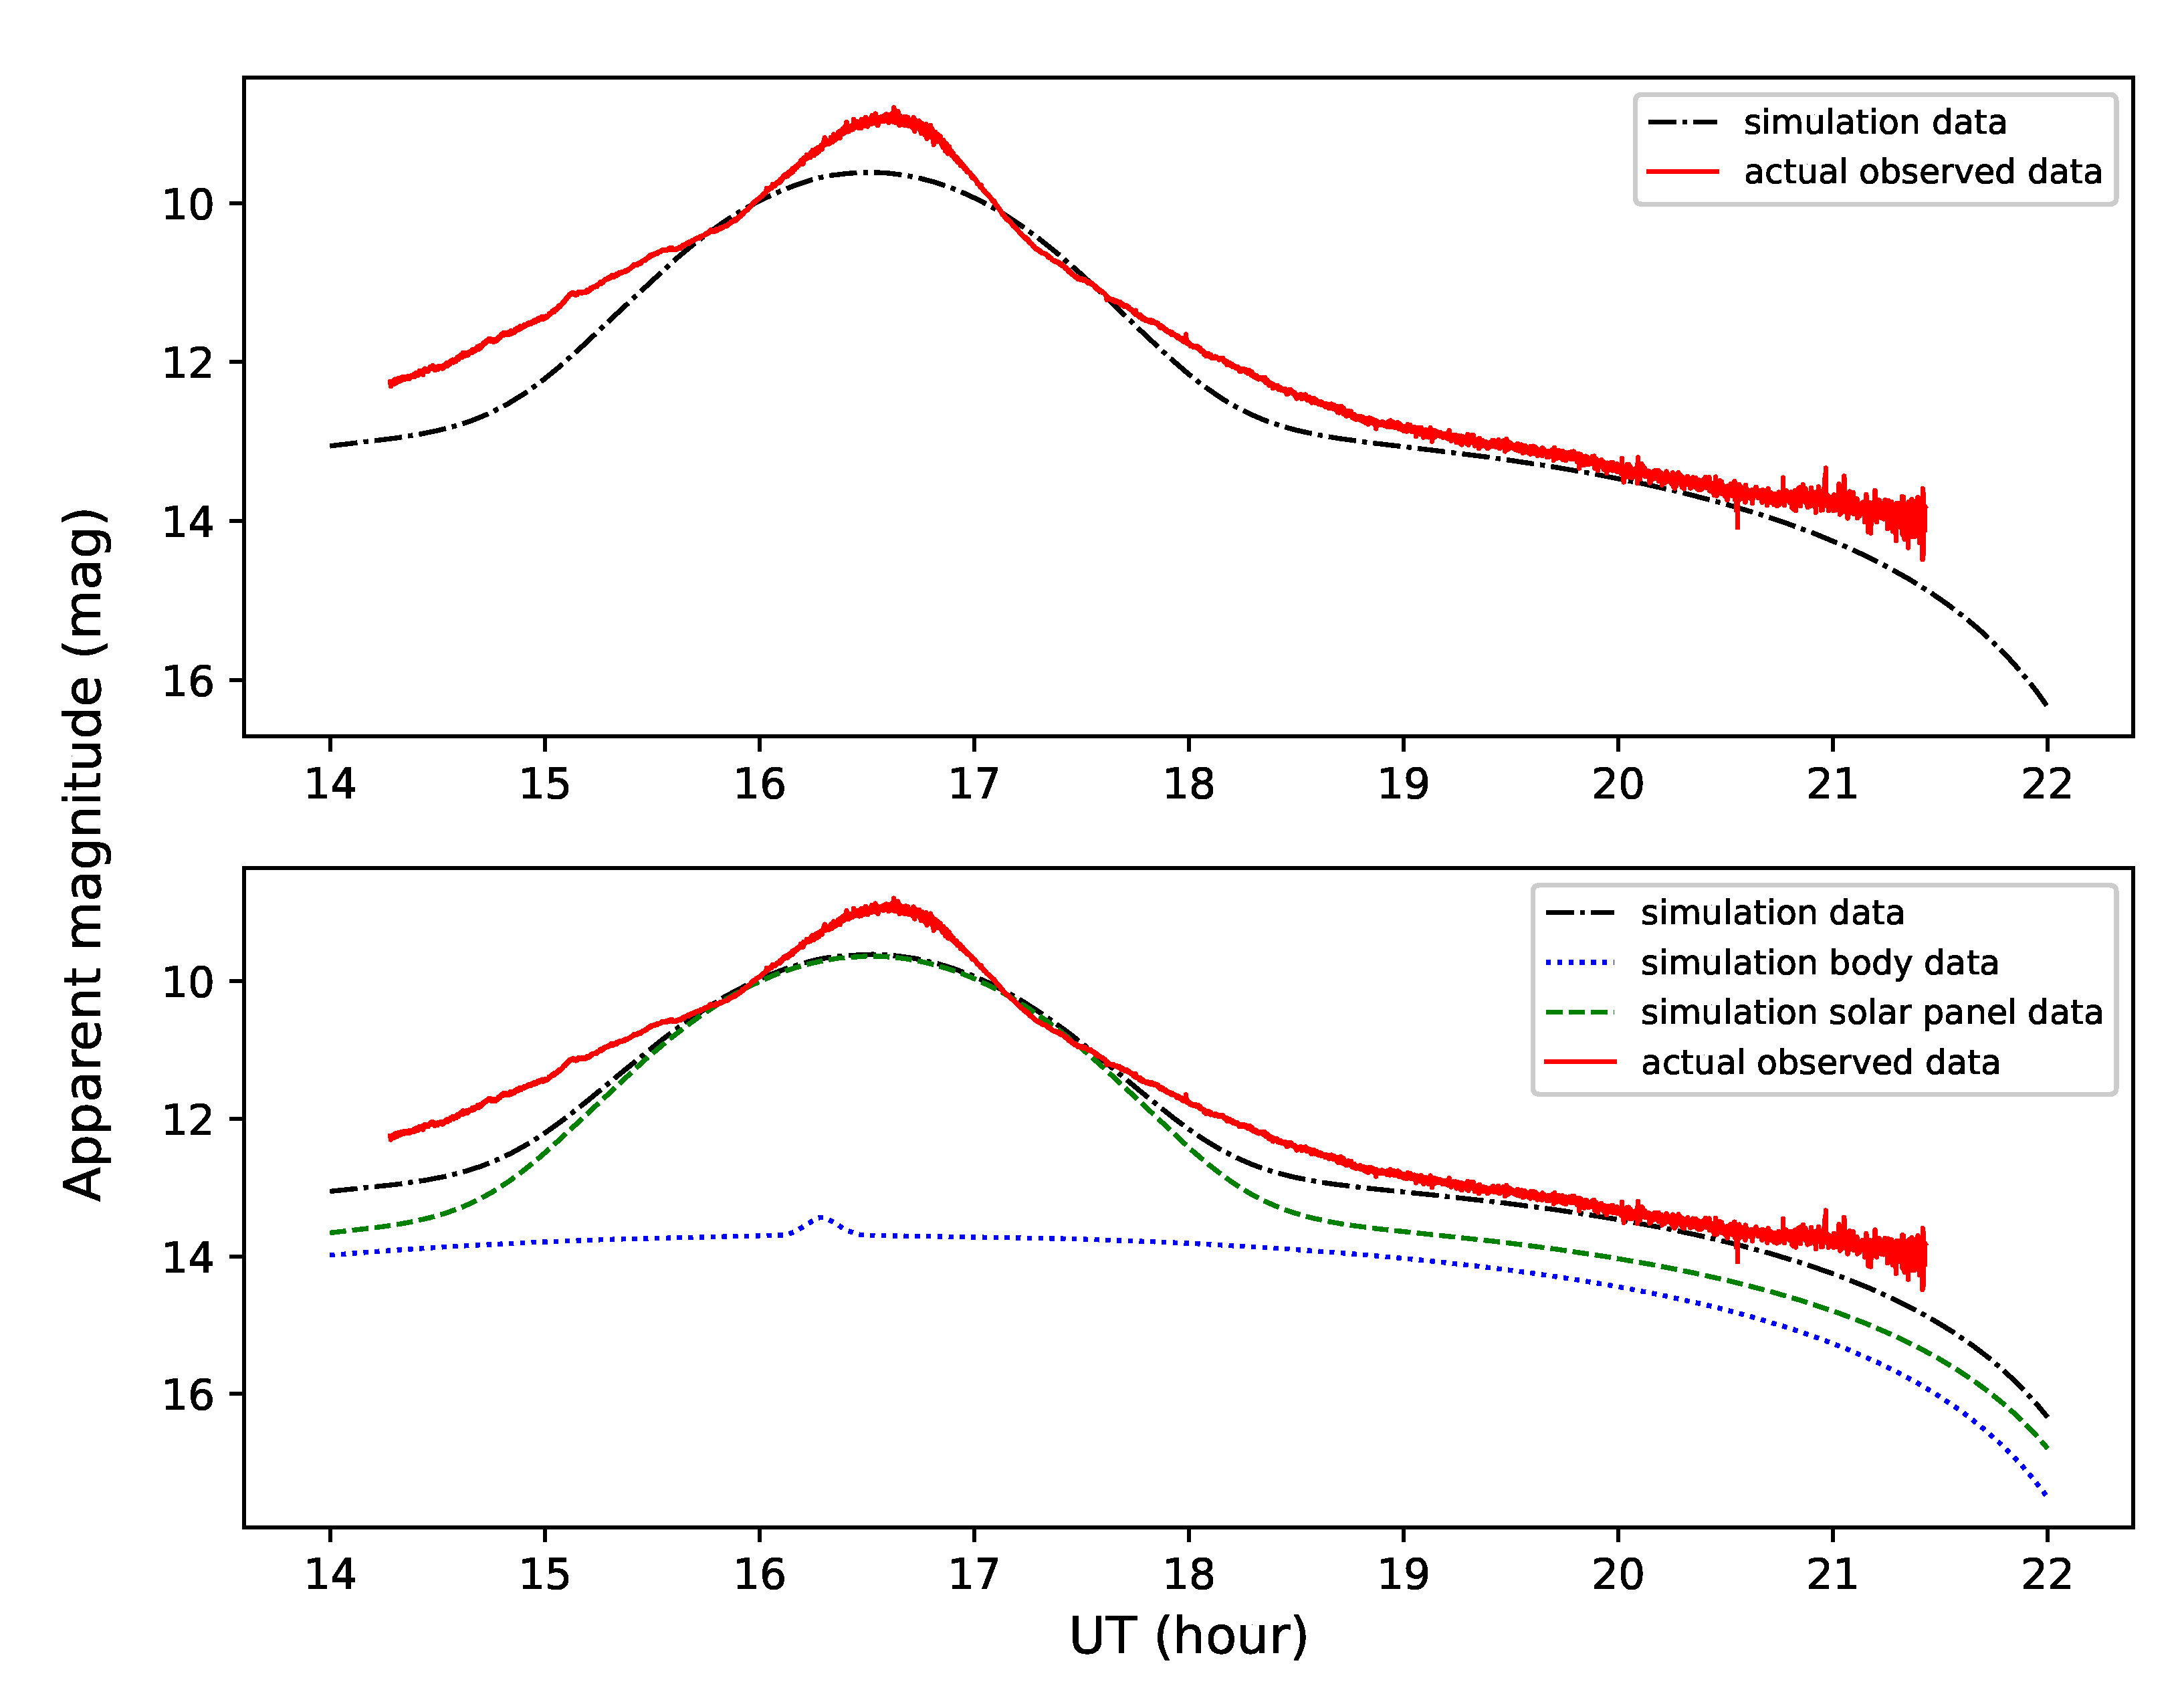
We obtained the best-fitted results of surface material parameters by comparing the observed light curves with the synthetic light curves, as shown in Table 3. The results of optimal parameters were put into the simulation model. We divided the overall brightness of each object into the brightness of the body and the solar panels. The contrast diagram of the light curves are shown in Figure 13 and Figure 14. The light curves shown in Figure 13 are slightly different at the peak position. The synthetic light curve changes more gently than the observed one. The simulation model used in this paper did not consider the occlusion between components, which may be the cause of this difference. From Figure 13, it can be seen that for Object 1, the overall brightness change is caused by the brightness change of the solar panels, while the brightness change of the body is so small that it is ignored. For Object 2, the brightness of the body determines the overall brightness, and the contribution of the solar panels is small and covered (see Figure 14). Therefore, for Object 1, we could think that only the material of the solar panels is relatively accurate, and the material of the body could not be determined. On the contrary, for Object 2, we could confirm the material of the body, but we could not infer the material of the solar panels.
Table 4 shows some existing material data obtained from public papers [32]. We find that the Phong model parameters of the body for Object 2 ( n body , u , v = 12 , 547.7915 ) are similar to Kapton. However, the values of specular and diffuse reflection parameters differ significantly. Under the long-term action of the space environment, the reflectance of materials will decrease in different degrees by reason of aging or wrinkling of the surface material. It is reasonable to guess that the specular reflection decreases and the diffuse reflection increases due to the influence of the space environment, or a class of materials such as Kapton. It turns out that Kapton is indeed a common material of the body but not the only one. Due to a lack of material information and prior information, we could not be sure about the material of the solar panels of Object 1 and the body of Object 2 from the existing material data. At present, everyone is not sure how different the material information measured in the laboratory is from the material information observed in space. The material information inverted by the method proposed in this work can be used as a reference, and simulation data can be generated to verify the correlation analysis method. We will establish a material database for comparison in the future, and we also welcome experts and peers to verify.
From the light curve of Object 1, the phenomenon of specular reflection can be obviously seen. Therefore, the difference in the contribution of different components to the overall brightness is determined by the surface material properties and the geometric relationship between the Sun, the object, and the station. It also verifies the credibility of the inferred material and the reliability of the simulation model to a certain extent.

3.4. Summary

In this method, the structure of the object is simplified so that only the body and the solar panel are considered, and the influence of other components is ignored. The method has some limitations to the complex structure of the object. However, we can infer the material information of space debris without relying on spectral data. It provides a new idea for the identification of space debris. It is an innovative contribution to the material inversion of space debris.

4. Conclusions

The brightness simulation model of space debris is established by analyzing its shape, size, position, attitude, and surface material. Here, we use a simplified model, which only considers simple shapes and ignores the shielding effect between different components. As a result, the simulation model may need improvement for complex shapes, especially for objects with a profound shielding effect. Later, we will consider more factors to build a high-precision brightness simulation model.
We compare the similarity of the observed light curves with the synthetic light curves based on the Markov Chain Monte Carlo method and then obtain the best-fitted result of material parameters. Due to the lack of public material data and the differences between laboratory and space measurements, the inverted material information can only match partially. The analysis of space debris through simulation data dramatically simplifies the observation process and is not restricted by observation time and conditions. A large amount of high-quality photometric data can be obtained quickly, and multi-station joint observation can be realized more conveniently and quickly. It also provides extensive and reliable verification data for related method research and subsequent analysis and application. There are multiple kinds of surface materials for space debris. In addition, the phase angle and the azimuth angle of incidence and emergence will affect the measurement result, so it is necessary to measure multiple angles. In addition to the influence of space environment factors, it may not be practical to obtain optical scattering characteristics of different materials only by laboratory measurement. The material properties of space debris can be roughly inferred by measuring the similarity between the observed and synthetic light curves, which provides a new idea and direction for identifying space debris. We have tried various calculation methods, such as a method based on morphological similarity, but the calculation is too large due to many parameters. In the future, we will continue to research and improve relevant algorithms to improve computational efficiency. Then, we will combine the BRDF data measured in the laboratory with the mathematical model to fit the model parameters to establish the material-matching library.

Author Contributions

Conceptualization, Y.J., S.H. and J.D.; methodology, Y.J. and J.D; program, Y.J. and J.D.; validation, X.C., H.C. and S.H.; formal analysis, Y.J.; investigation, Y.J.; resources, Y.J. and S.L.; data curation, Y.J. and S.L.; writing—original draft preparation, Y.J.; writing—review and editing, Y.J., S.H., J.D., S.L. and S.F.; visualization, Y.J., S.H., J.D., S.L. and S.F.; supervision, S.H., X.C., H.C. and S.F.; project administration, S.H., X.C., H.C. and S.F.; funding acquisition, S.H. All authors have read and agreed to the published version of the manuscript.

Funding

This work is supported by the Space Debris and Near-Earth Asteroid Defense Research Project (No. KJSP2020020205) and the Natural Science Foundation of Shandong province (No. JQ201702).

Data Availability Statement

The data presented in this study are available on request from the corresponding author. The data are not publicly available due to privacy.

Conflicts of Interest

The authors declare no conflict of interest.

References

  1. Payne, T.; Gregory, S.; Luu, K. SSA analysis of GEOS photometric signature classifications and solar panel offsets. In Proceedings of the Advanced Maui Optical and Space Surveillance Technologies Conference, Maui, HI, USA, 10–14 September 2006; p. E73. [Google Scholar]
  2. Henderson, L.S. Modeling, Estimation, and Analysis of Unresolved Space Object Tracking and Identification; The University of Texas at Arlington: Arlington, TX, USA, 2014. [Google Scholar]
  3. Jolley, A. Analysis of specular reflections off geostationary satellites. In Proceedings of the Advanced Maui Optical and Space Surveillance Technologies Conference, Maui, HI, USA, 20–23 September 2016; pp. 89–99. [Google Scholar]
  4. Fulcoly, D.O.; Kalamaroff, K.I.; Chun, F.K. Determining basic satellite shape from photometric light curves. J. Spacecr. Rockets 2012, 49, 76–82. [Google Scholar] [CrossRef]
  5. Wetterer, C.J.; Jah, M. Attitude determination from light curves. J. Guid. Control Dyn. 2009, 32, 1648–1651. [Google Scholar] [CrossRef]
  6. Linares, R.; Jah, M.K.; Crassidis, J.L. Space object area-to-mass ratio estimation using multiple model approaches. Adv. Astronaut. Sci. 2012, 144, 55–72. [Google Scholar]
  7. Hall, D.; Calef, B.; Knox, K.; Bolden, M.; Kervin, P. Separating attitude and shape effects for non-resolved objects. In Proceedings of the Advanced Maui Optical and Space Surveillance Technologies Conference, Maui, HI, USA, 12–15 September 2007; pp. 464–475. [Google Scholar]
  8. Bédard, D.; Lévesque, M. Analysis of the CanX-1 engineering model spectral reflectance measurements. J. Spacecr. Rockets 2014, 51, 1492–1504. [Google Scholar] [CrossRef]
  9. Cauquy, M.A.A.; Roggemann, M.C.; Schulz, T.J. Approaches for processing spectral measurements of reflected sunlight for space situational awareness. In Proceedings of the Signal and Data Processing of Small Targets 2004, Orlando, FL, USA, 13–15 April 2004; Volume 5428, pp. 48–57. [Google Scholar]
  10. Bédard, D.; Wade, G.A.; Abercromby, K. Laboratory characterization of homogeneous spacecraft materials. J. Spacecr. Rockets 2015, 52, 1038–1056. [Google Scholar] [CrossRef]
  11. Chaudhary, A.; Birkemeier, C.; Gregory, S.; Payne, T.; Brown, J. Unmixing the materials and mechanics contributions in non-resolved object signatures. In Proceedings of the Advanced Maui Optical and Space Surveillance Technologies Conference, Maui, HI, USA, 16–19 September 2008; p. E39. [Google Scholar]
  12. Cauquy, M.A.A. Approaches for Processing Spectral Measurements of Reflected Sunlight for Space Object Detection and Identification; Michigan Technological University: Houghton, MI, USA, 2004. [Google Scholar]
  13. Dao, P.; Dentamaro, A.; Ryan, B.; Ryan, E. Unmixing space object’s moderate resolution spectra. In Proceedings of the Advanced Maui Optical and Space Surveillance Technologies Conference, Maui, HI, USA, 10–13 September 2013; p. E36. [Google Scholar]
  14. Cowardin, H.; Seitzer, P.; Abercromby, K.; Barker, E.; Schildknecht, T. Characterization of orbital debris photometric properties derived from Laboratory-Based Measurements. In Proceedings of the Advanced Maui Optical and Space Surveillance Technologies Conference, Maui, HI, USA, 14–17 September 2010; pp. 433–442. [Google Scholar]
  15. Murray-Krezan, J.; Inbody, W.; Dentamaro, A.; Gregory, S.; Dao, P.; Fulcoly, D. Algorithms for Automated Characterization of Three-Axis Stabilized GEOs using Non-Resolved Optical Observations. In Proceedings of the Advanced Maui Optical and Space Surveillance Technologies Conference, Maui, HI, USA, 11–14 September 2012; pp. 192–199. [Google Scholar]
  16. Vrba, F.J.; DiVittorio, M.E.; Hindsley, R.B.; Schmitt, H.R.; Armstrong, J.T.; Shankland, P.D.; Hutter, D.J.; Benson, J.A. A survey of geosynchronous satellite glints. In Proceedings of the Advanced Maui Optical and Space Surveillance Technologies Conference, Maui, HI, USA, 1–4 September 2009; p. E28. [Google Scholar]
  17. Cognion, R.L. Observations and modeling of GEO satellites at large phase angles. In Proceedings of the Advanced Maui Optical and Space Surveillance Technologies Conference, Maui, HI, USA, 10–13 September 2013; pp. 638–645. [Google Scholar]
  18. Bradley, B.K.; Axelrad, P. Lightcurve inversion for shape estimation of geo objects from space-based sensors. In Proceedings of the International Space Symposium for Flight Dynamics, Laurel, MD, USA, 5–9 May 2014; pp. 1–20. [Google Scholar]
  19. Kaasalainen, M.; Torppa, J. Optimization Methods for Asteroid Lightcurve Inversion: I. Shape Determination. Icarus 2001, 153, 24–36. [Google Scholar] [CrossRef]
  20. Fairbairn, M. Planetary Photometry: The Lommel-Seeliger Law. J. R. Astron. Soc. Can. 2005, 99, 92. [Google Scholar]
  21. Kaasalainen, M.; Torppa, J.; Muinonen, K. Optimization Methods for Asteroid Lightcurve Inversion: II. The Complete Inverse Problem. Icarus 2001, 153, 37–51. [Google Scholar] [CrossRef]
  22. Kelecy, T.; Hussein, I.I.; Miller, K.; Coughlin, J. Probabilistic Analysis of Light Curves. J. Astronaut. Sci. 2019, 66, 142–161. [Google Scholar] [CrossRef]
  23. Phong, B.T. Illumination for computer generated pictures. Commun. ACM 1975, 18, 311–317. [Google Scholar] [CrossRef] [Green Version]
  24. Blinn, J.F. Models of light reflection for computer synthesized pictures. In Proceedings of the 4th Annual Conference on Computer Graphics and Interactive Techniques, San Jose, CA, USA, 20–22 July 1977; pp. 192–198. [Google Scholar]
  25. Strauss, P.S. A realistic lighting model for computer animators. IEEE Comput. Graph. Appl. 2002, 10, 56–64. [Google Scholar] [CrossRef]
  26. Oren, M.; Nayar, S.K. Generalization of Lambert’s reflectance model. In Proceedings of the 21st Annual Conference on Computer Graphics and Interactive Techniques, Orlando, FL, USA, 24–29 July 1994; pp. 239–246. [Google Scholar]
  27. Torrance, K.E.; Sparrow, E.M. Theory for off-specular reflection from roughened surfaces. Josa 1967, 57, 1105–1114. [Google Scholar] [CrossRef]
  28. Cook, R.L.; Torrance, K.E. A reflectance model for computer graphics. ACM Trans. Graph. ToG 1982, 1, 7–24. [Google Scholar] [CrossRef]
  29. Ward, G.J. Measuring and modeling anisotropic reflection. In Proceedings of the 19th Annual Conference on Computer Graphics and Interactive Techniques, Chicago, IL, USA, 26–31 July 1992; pp. 265–272. [Google Scholar]
  30. Ashikhmin, M.; Shirley, P. An anisotropic phong BRDF model. J. Graph. Tools 2000, 5, 25–32. [Google Scholar] [CrossRef] [Green Version]
  31. Matusik, W. A data-driven reflectance model. ACM Trans. Graph. 2003, 22, 759–769. [Google Scholar] [CrossRef] [Green Version]
  32. Wang, X.; Zhang, Y.; Xu, C.; Li, P.; Zhang, F.; Zhou, T. Attitude Estimation of GEO Objects of Space-based Optical Observation Based on the Improved Phong Model. Acta Photonica Sin. 2020, 49, 112004. [Google Scholar] [CrossRef]
  33. Kelecy, T.; Gerber, E.; Akram, S.; Paffett, J. Characterization of Resident Space object States Using Functional Data Analysis. J. Astronaut. Sci. 2022, 69, 627–649. [Google Scholar] [CrossRef]
  34. Linares, R.; Crassidis, J.; Jah, M.; Kim, H. Astrometric and photometric data fusion for resident space object orbit, attitude, and shape determination via multiple-model adaptive estimation. In Proceedings of the AIAA Guidance, Navigation, and Control Conference, Toronto, ON, Canada, 2–5 August 2010; p. 8341. [Google Scholar]
  35. Rush, K.A.; Yost, M.; Smith, L.; Zizzo, A. An application of the unscented Kalman filter for spacecraft attitude estimation on real and simulated light curve data. In Proceedings of the Advanced Maui Optical and Space Surveillance Technologies Conference, Maui, HI, USA, 15–18 September 2020; pp. 198–217. [Google Scholar]
  36. Akenine-Moller, T.; Haines, E.; Hoffman, N. Real-Time Rendering, 3rd ed.; AK PETERS: Natick, MA, USA, 2008. [Google Scholar]
  37. Foreman-Mackey, D.; Hogg, D.; Lang, D.; Goodman, J. emcee: The MCMC hammer. Publ. Astron. Soc. Pac. 2013, 125, 306–312. [Google Scholar] [CrossRef] [Green Version]
  38. Montenbruck, O.; Schmid, R.; Mercier, F.; Steigenberger, P.; Noll, C.; Fatkulin, R.; Kogure, S.; Ganeshan, A.S. GNSS satellite geometry and attitude models. Adv. Space Res. 2015, 56, 1015–1029. [Google Scholar] [CrossRef]
Figure 1. Illumination geometry of a single facet.
Aerospace 10 00041 g001
Figure 2. Synthetic light curves for different orbits.
Aerospace 10 00041 g002
Figure 3. The variation of the angles with time for different orbits.
Aerospace 10 00041 g003
Figure 4. Diagram of the four attitudes: (a) attitude 1; (b) attitude 2; (c) attitude 3; (d) attitude 4.
Aerospace 10 00041 g004
Figure 5. Synthetic light curves for different attitudes.
Aerospace 10 00041 g005
Figure 6. The analysis of synthetic light curve of Attitude 1.
Aerospace 10 00041 g006
Figure 7. Synthetic light curves with different parameters of the Phong model. Red solid line: R spec = 0.2 , R diff = 0.8 ; Green dash-dotted line: R spec = 0.5 , R diff = 0.5 ; Blue dotted line: R spec = 0.8 , R diff = 0.2 .
Aerospace 10 00041 g007
Figure 8. The synthetic light curves simulated with the same model parameters and different station longitudes.
Aerospace 10 00041 g008
Figure 9. The synthetic light curves simulated with the same model parameters and different station latitudes.
Aerospace 10 00041 g009
Figure 10. The attitude mode diagram of research objects (Reprinted with permission from Ref. [38], 2022, Yuchen Jiang): (a) Object 1; (b) Object 2.
Aerospace 10 00041 g010
Figure 11. The parameter distributions of Object 1.
Aerospace 10 00041 g011
Figure 12. The parameter distributions of Object 2.
Aerospace 10 00041 g012
Figure 13. The synthetic light curve of Object 1.
Aerospace 10 00041 g013
Figure 14. The synthetic light curve of Object 2.
Aerospace 10 00041 g014
Table 1. TLE of simulated orbit.
OrbitTLE
orbit 11xxxxxU16,037 A20,284.07341138−0.0000035400000-000000+009996
2xxxxx1.723767.235100074710.181888.72331.0027312415,969
orbit 21xxxxxU19,097 A20,284.25674796−0.00000355+00000-0+00000-009990
2xxxxx000.4814094.59140028139151.0334350.769401.00271793002881
orbit 31xxxxxU14,026 A20,284.37504348−0.00000027+00000-0+00000-009997
2xxxxx056.2287052.28350020597291.4800068.306902.00569053046,909
orbit 41xxxxxU18,109 A20,284.07190081+0.00000009+00000-0+00000-009995
2xxxxx055.0110174.18070009159205.9132258.757202.00569258013,471
Table 2. The shape parameters of simulation objects.
ObjectComponent 1Facet 2Area ( m 2 )
Object 1body ± X 3.748
body ± Y 4.4
body ± Z 3.44
solar panel 11.352 × 2
Object 2body ± X 4
body ± Y 4
body ± Z 4
solar panel 11 × 2
1 We simulate the main components of the space debris: the body (the bus) and the solar panels. 2 The facet is perpendicular to the body axis; ±X represents two facets perpendicular to the X axis of the body; + represents the facet with the positive X axis as the normal. And the same for the rest in different directions.
Table 3. The best-fitted parameters of the simulation objects.
Simulation ObjectComponentParameterBest-Fitted Parameter
Object 1body n u ( n v ) 12,030.1146
R spec 0.4908
R diff 0.1566
panel n u ( n v ) 154.2440
R spec 0.0325
R diff 0.0172
Object 2body n u ( n v ) 12,547.791
R spec 0.2807
R diff 0.4336
panel n u ( n v ) 295.1551
R spec 0.7544
R diff 0.0134
Table 4. Traditional Phong model parameters of some surface material of space debris [32].
Material R diff R spec n u ( n v )
Kapton0.14180.823412,455.8892
Lambert-plate0.63500.02200.0719
GaAs0.27460.64272233.3101
Al0.36850.5746596.9783
Disclaimer/Publisher’s Note: The statements, opinions and data contained in all publications are solely those of the individual author(s) and contributor(s) and not of MDPI and/or the editor(s). MDPI and/or the editor(s) disclaim responsibility for any injury to people or property resulting from any ideas, methods, instructions or products referred to in the content.