
Physical Modeling of Snow Gliding: A Case Study in the NW Italian Alps


 and
and 
Abstract
1. Introduction
2. Study Area
3. Data
4. Methods
4.1. Poli-Glide Model
4.2. Snow Accumulation
4.3. Snowpack Settling
4.4. Snowpack Ablation
4.5. Snowpack Temperature Distribution
4.6. Snowpack and Soil Water Content and Budget
4.7. Gliding Velocity
4.8. Model Set Up
4.9. Correlation Analysis
5. Results and Discussion
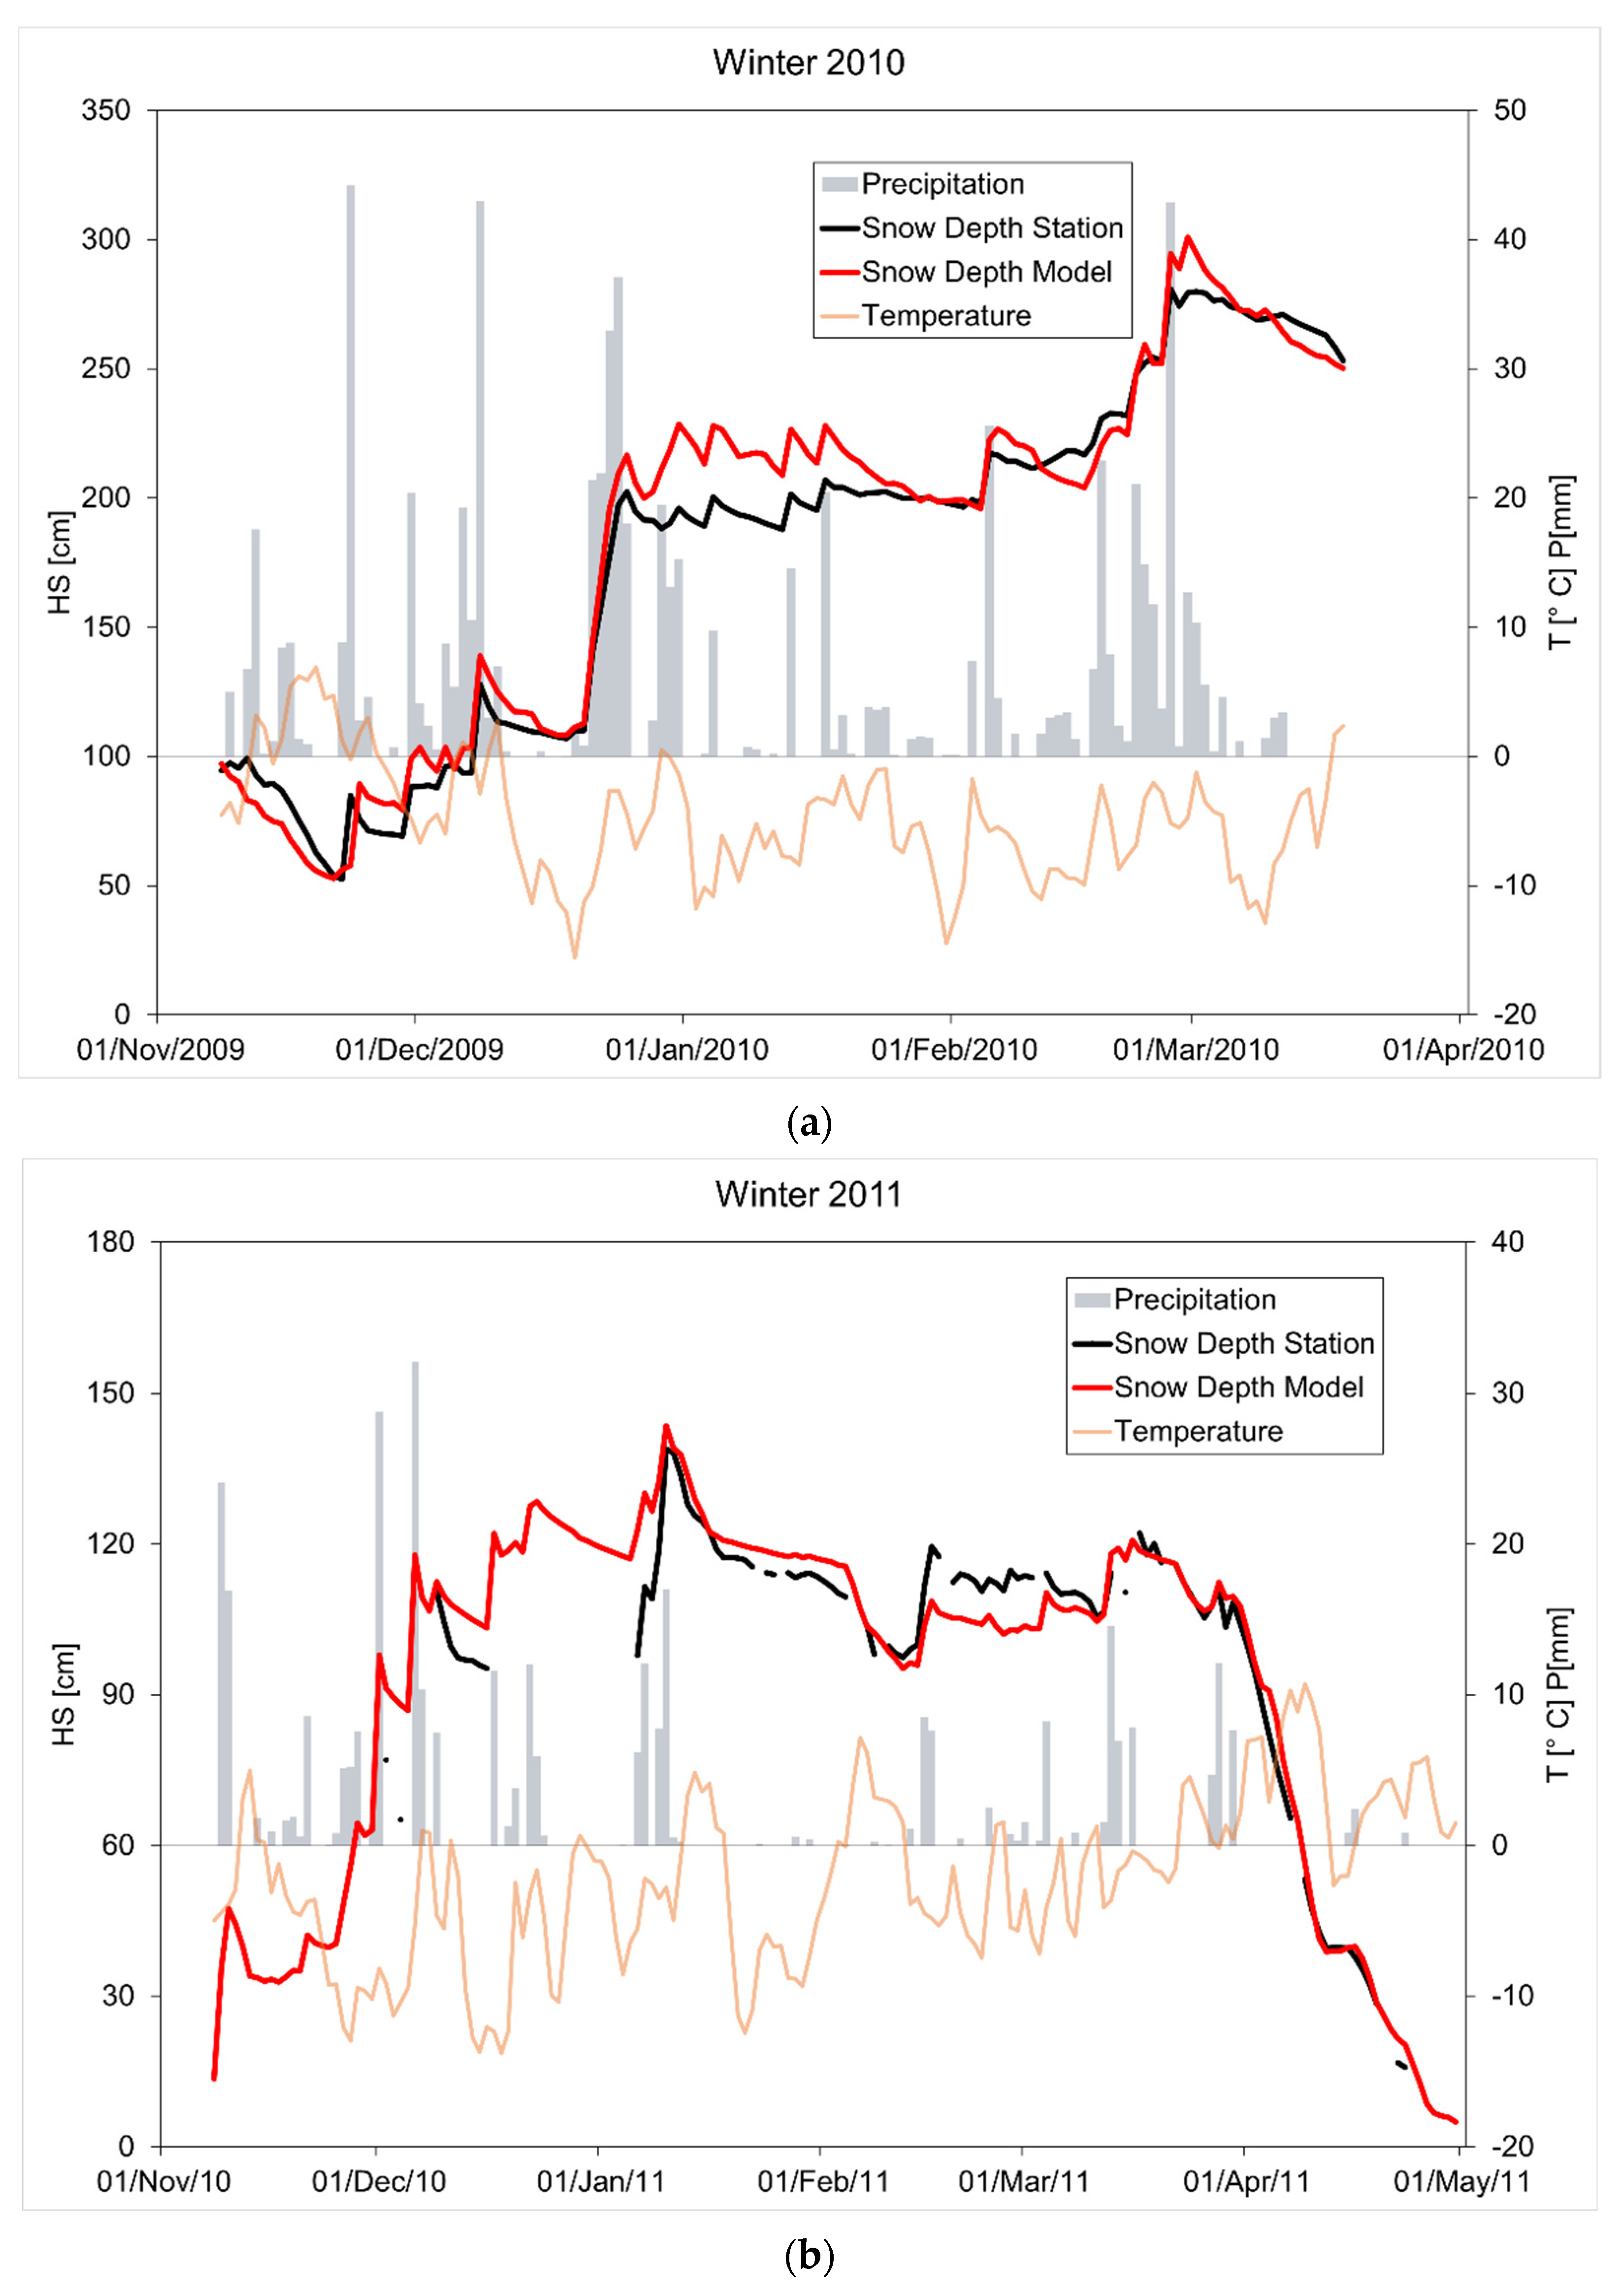
5.1. Snowpack Dynamics
5.2. Snow Gliding Parameterization
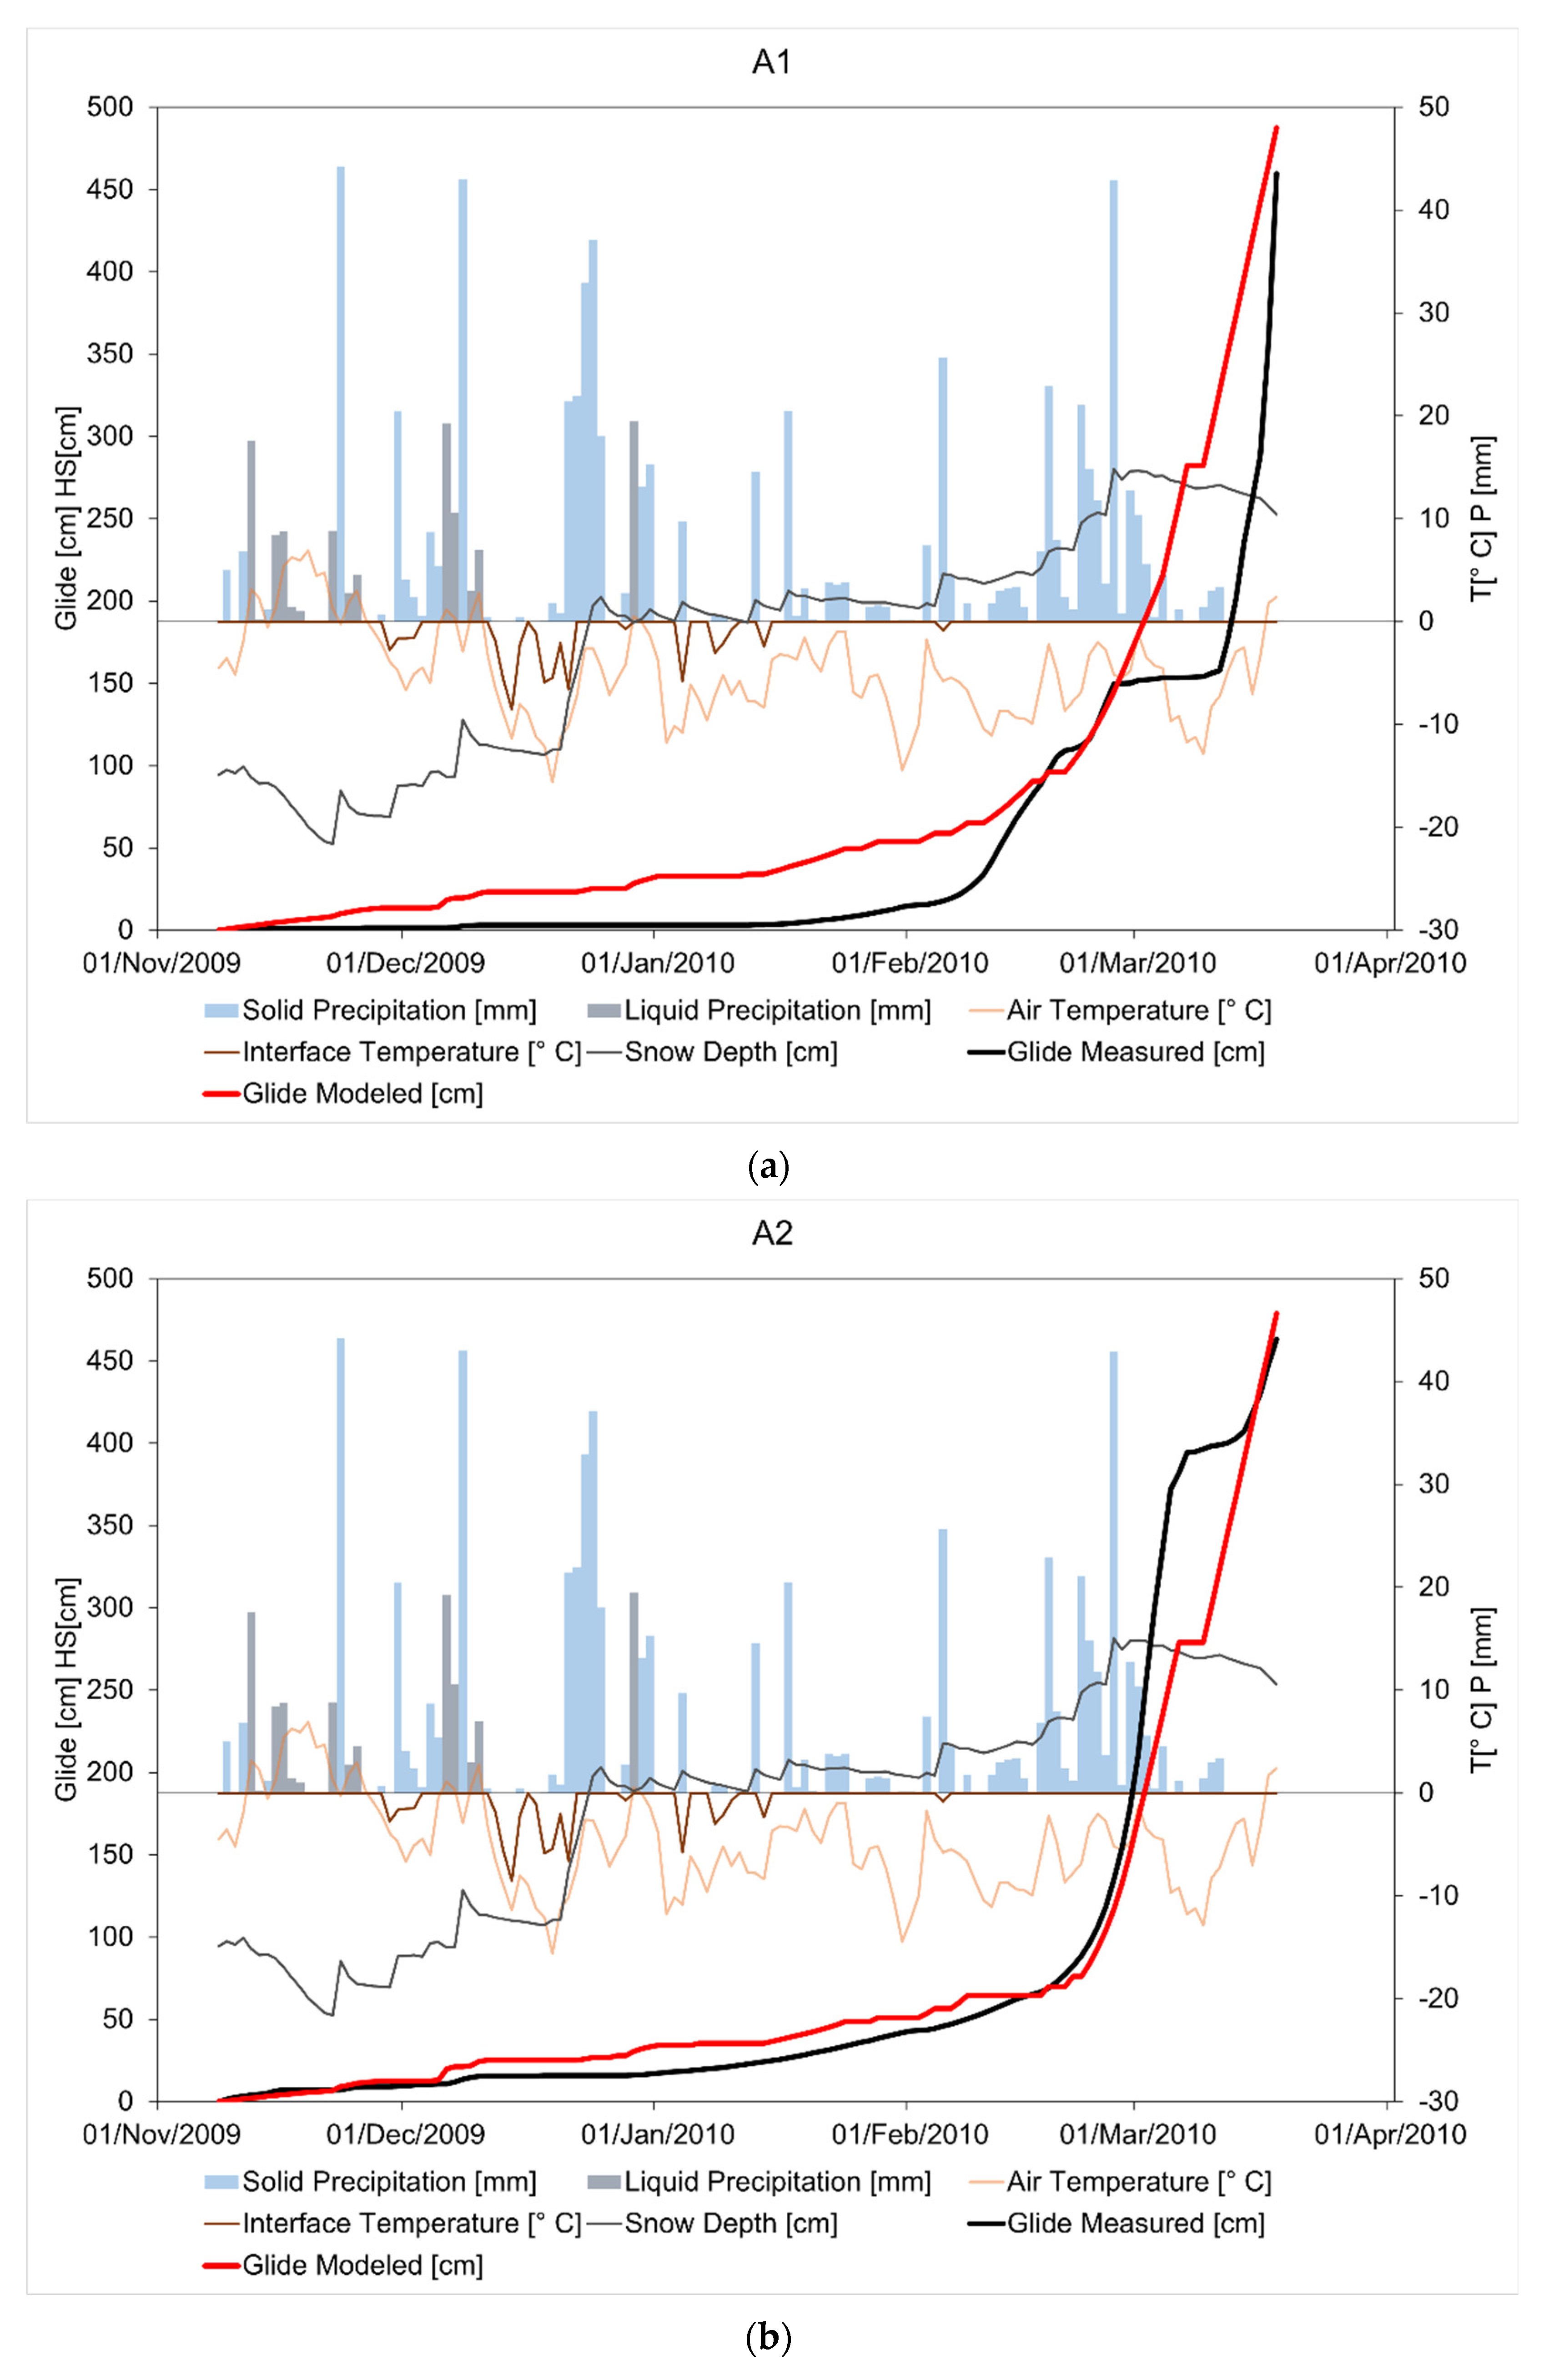
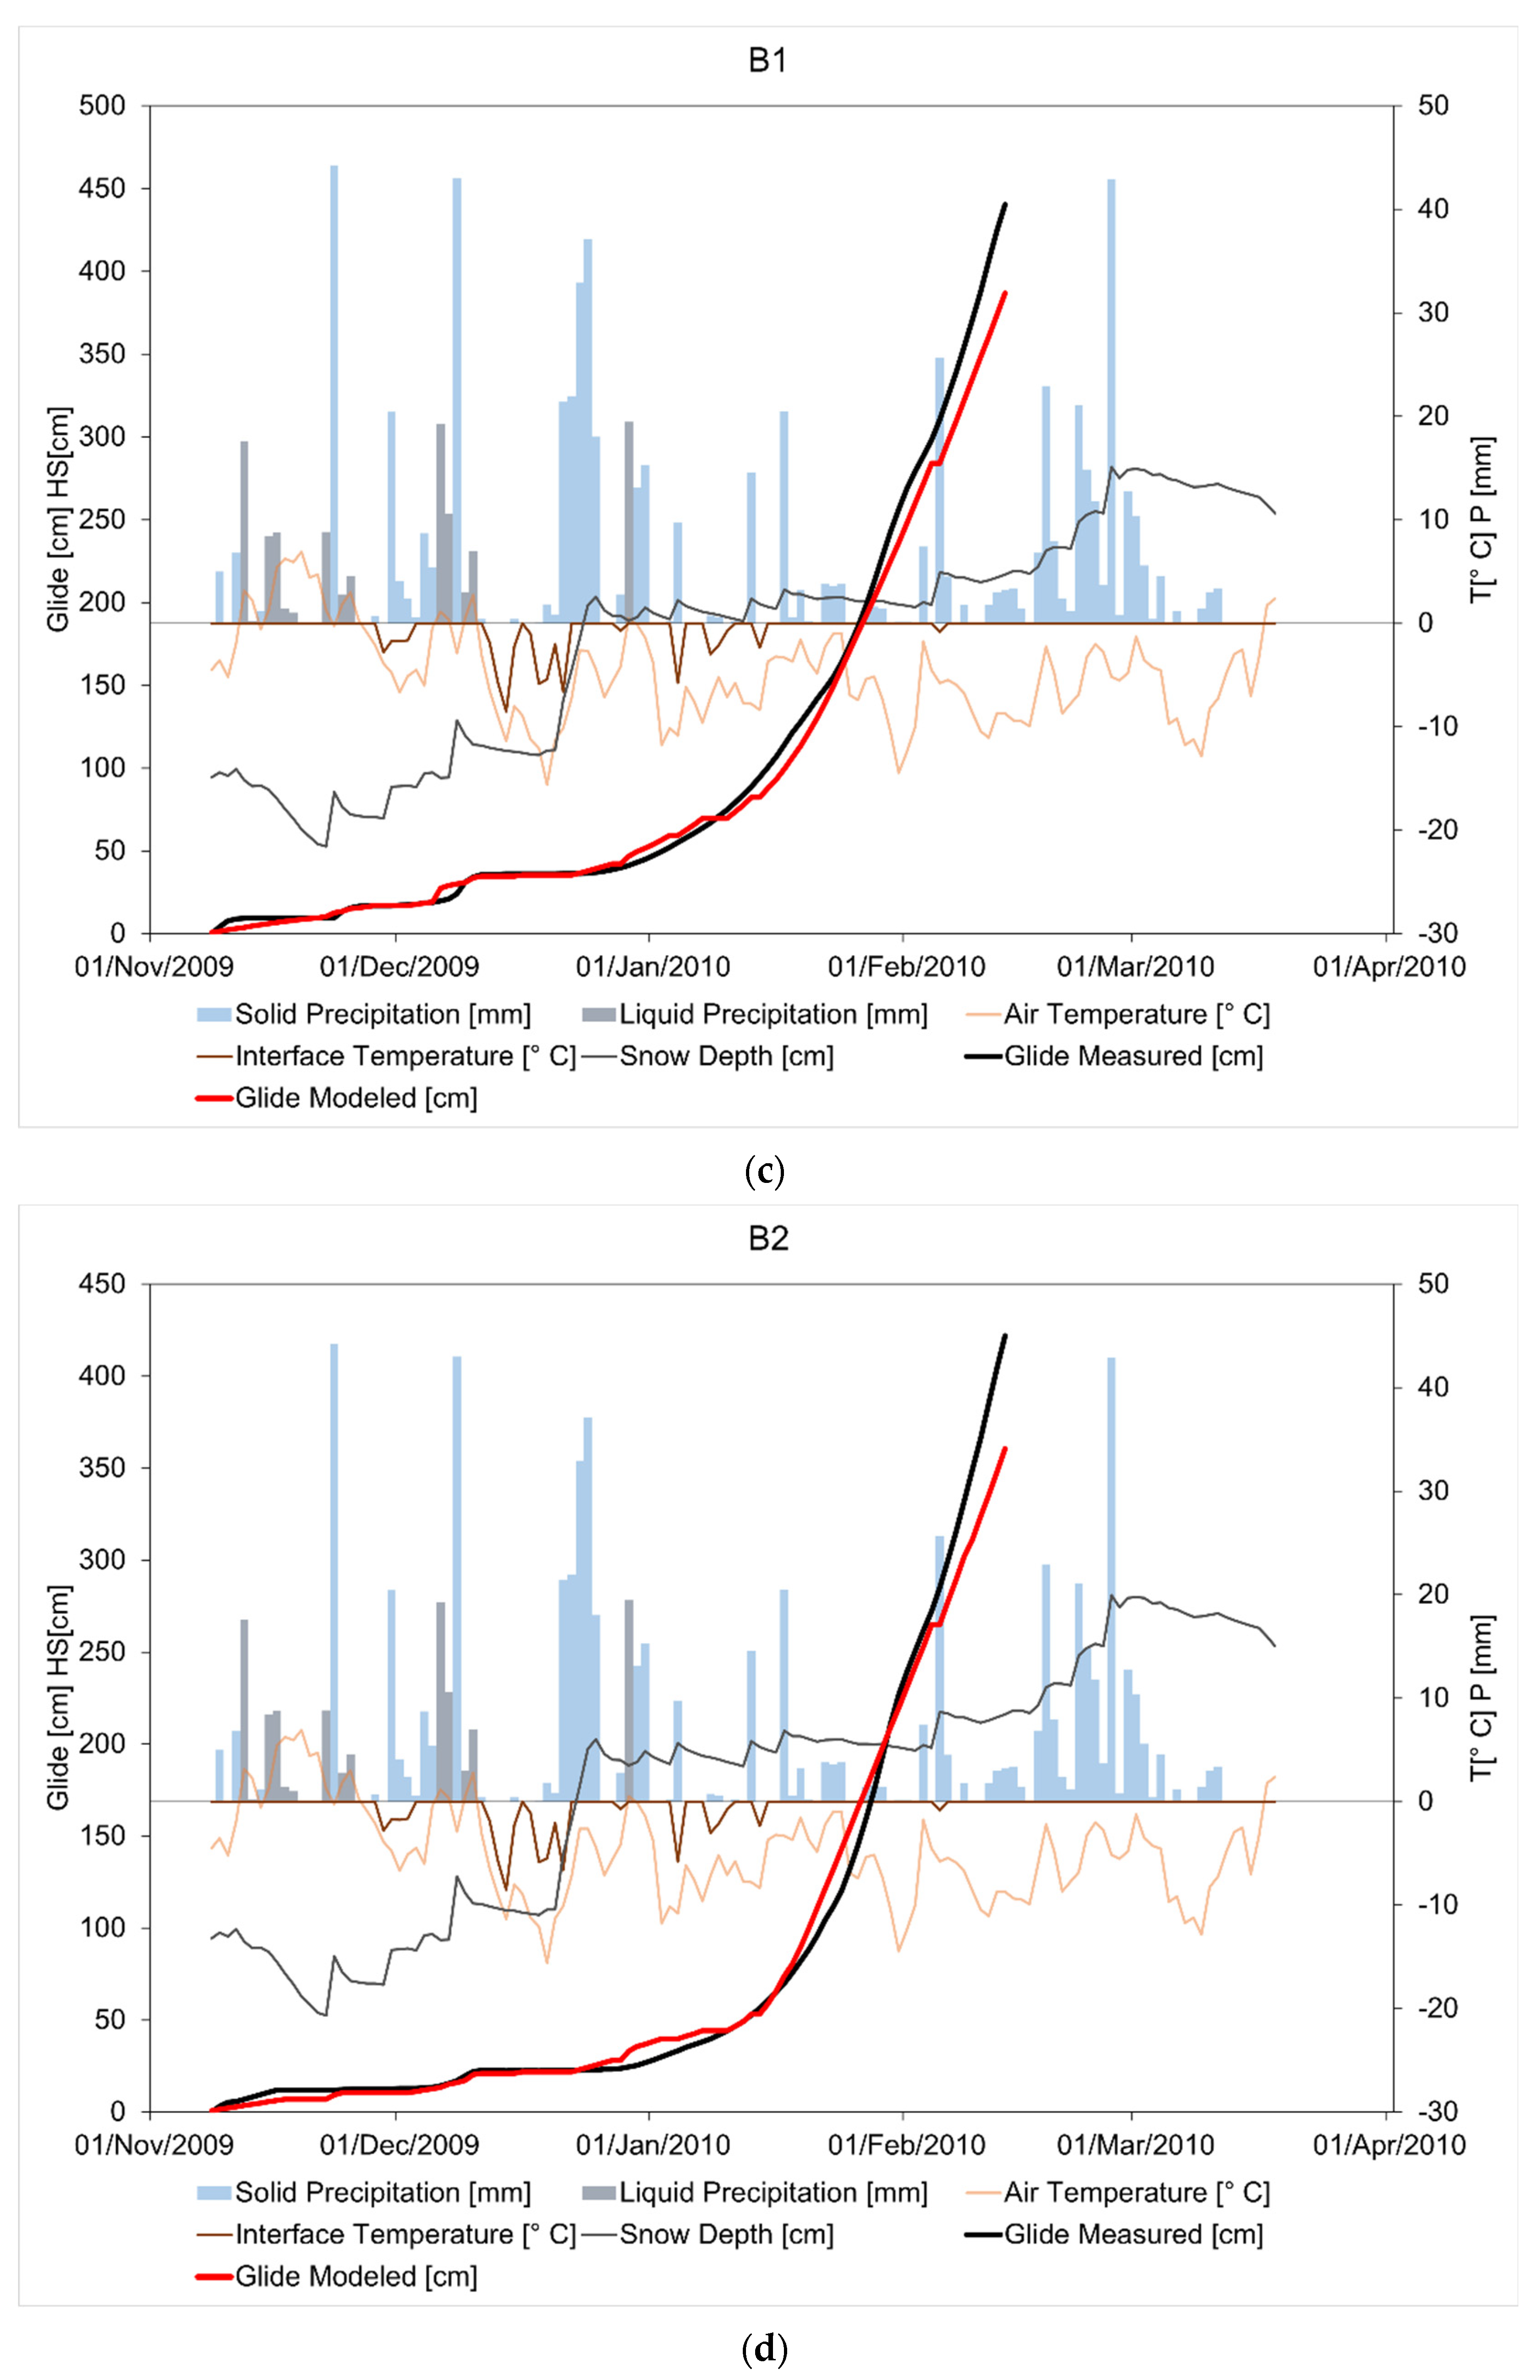
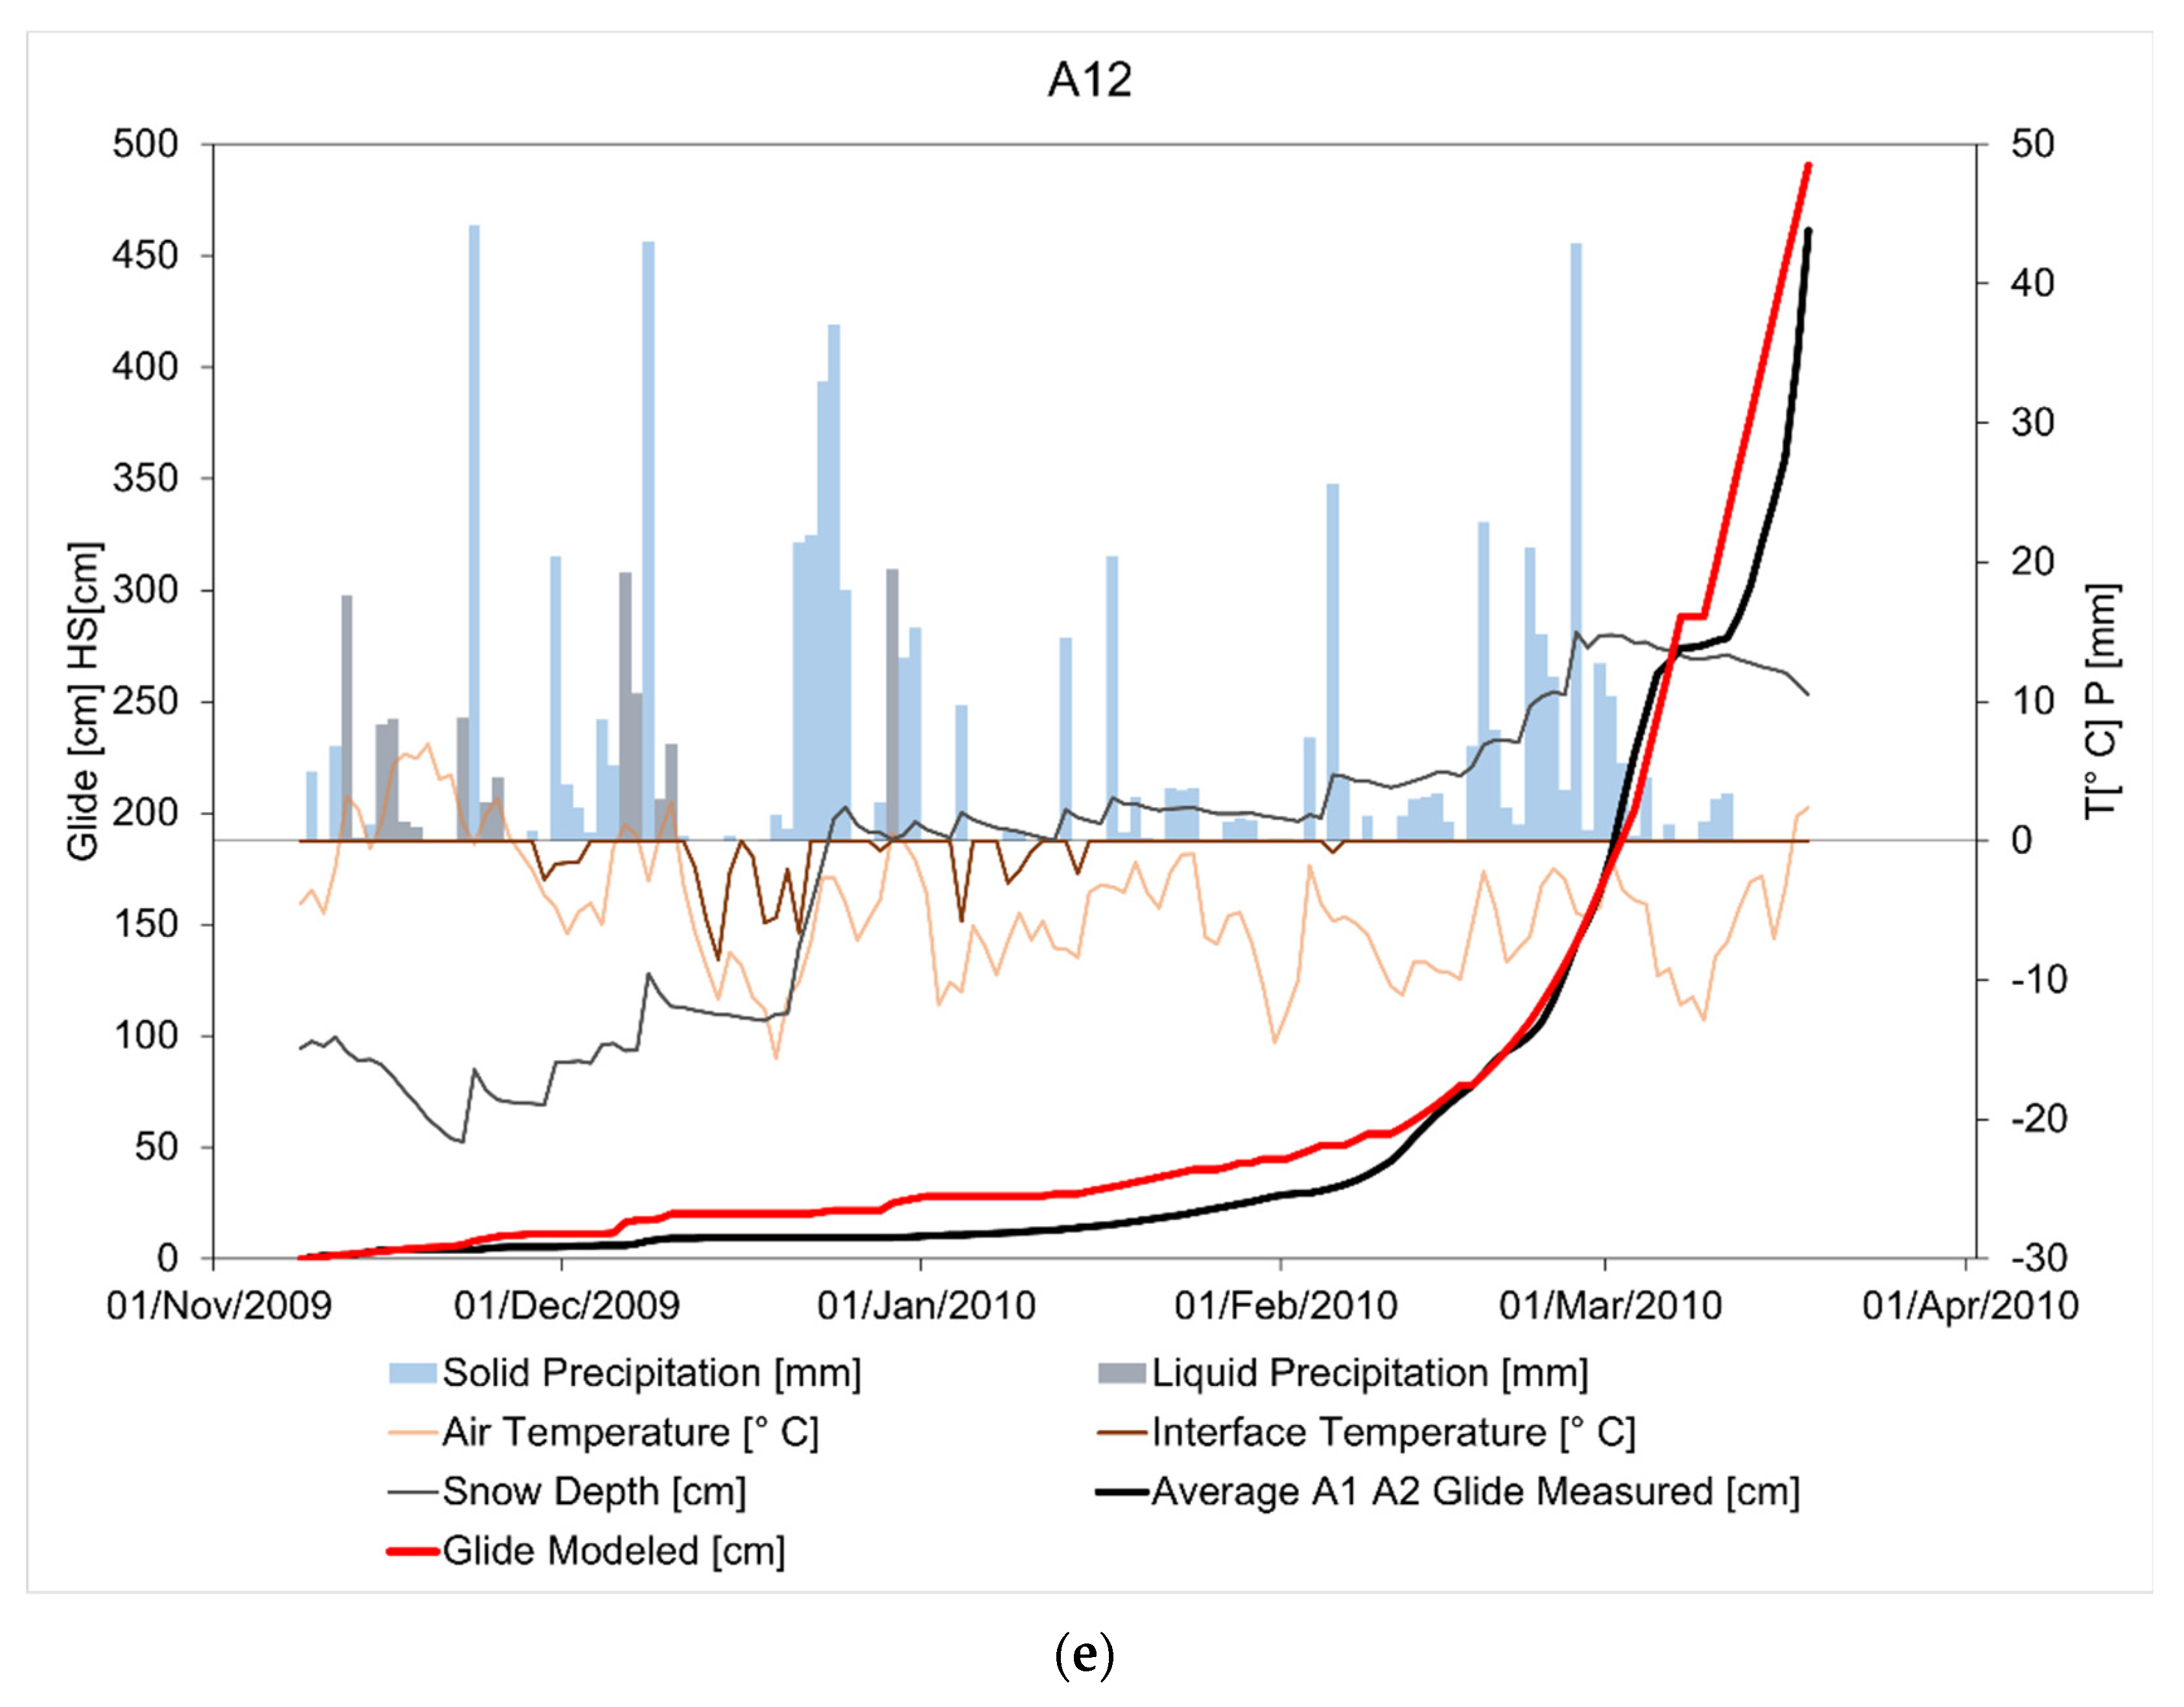
5.3. Gliding Events
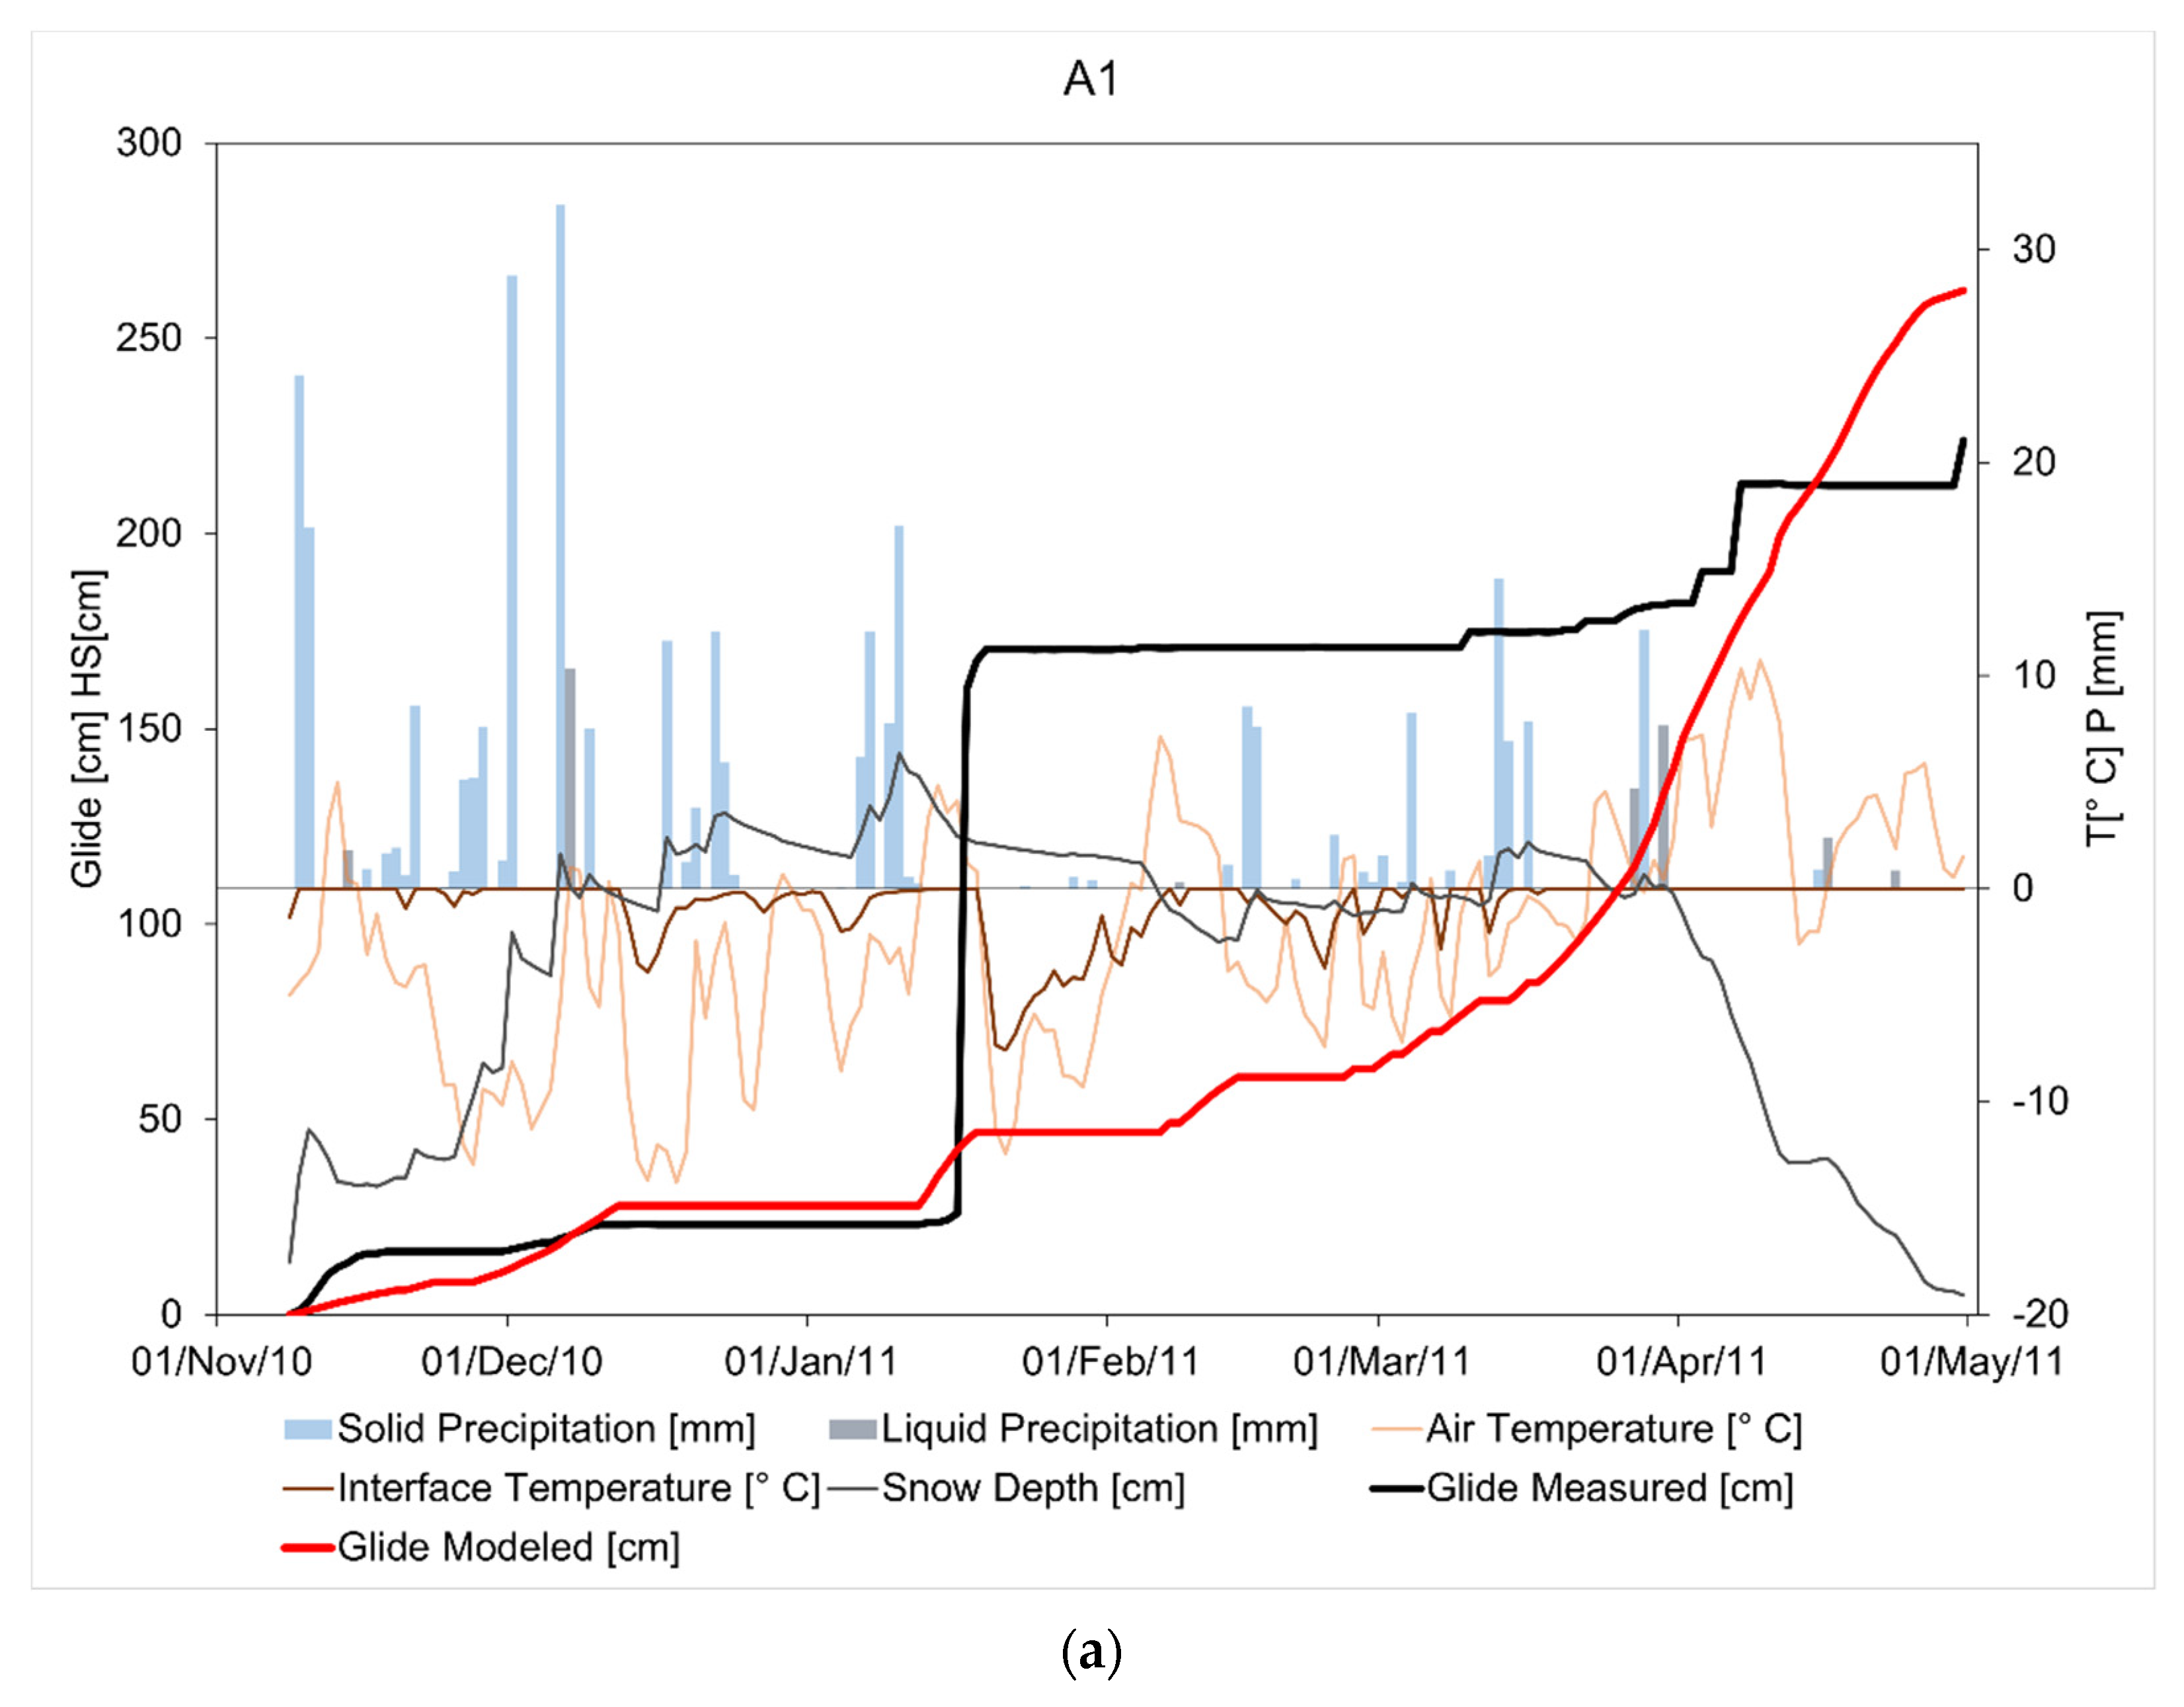
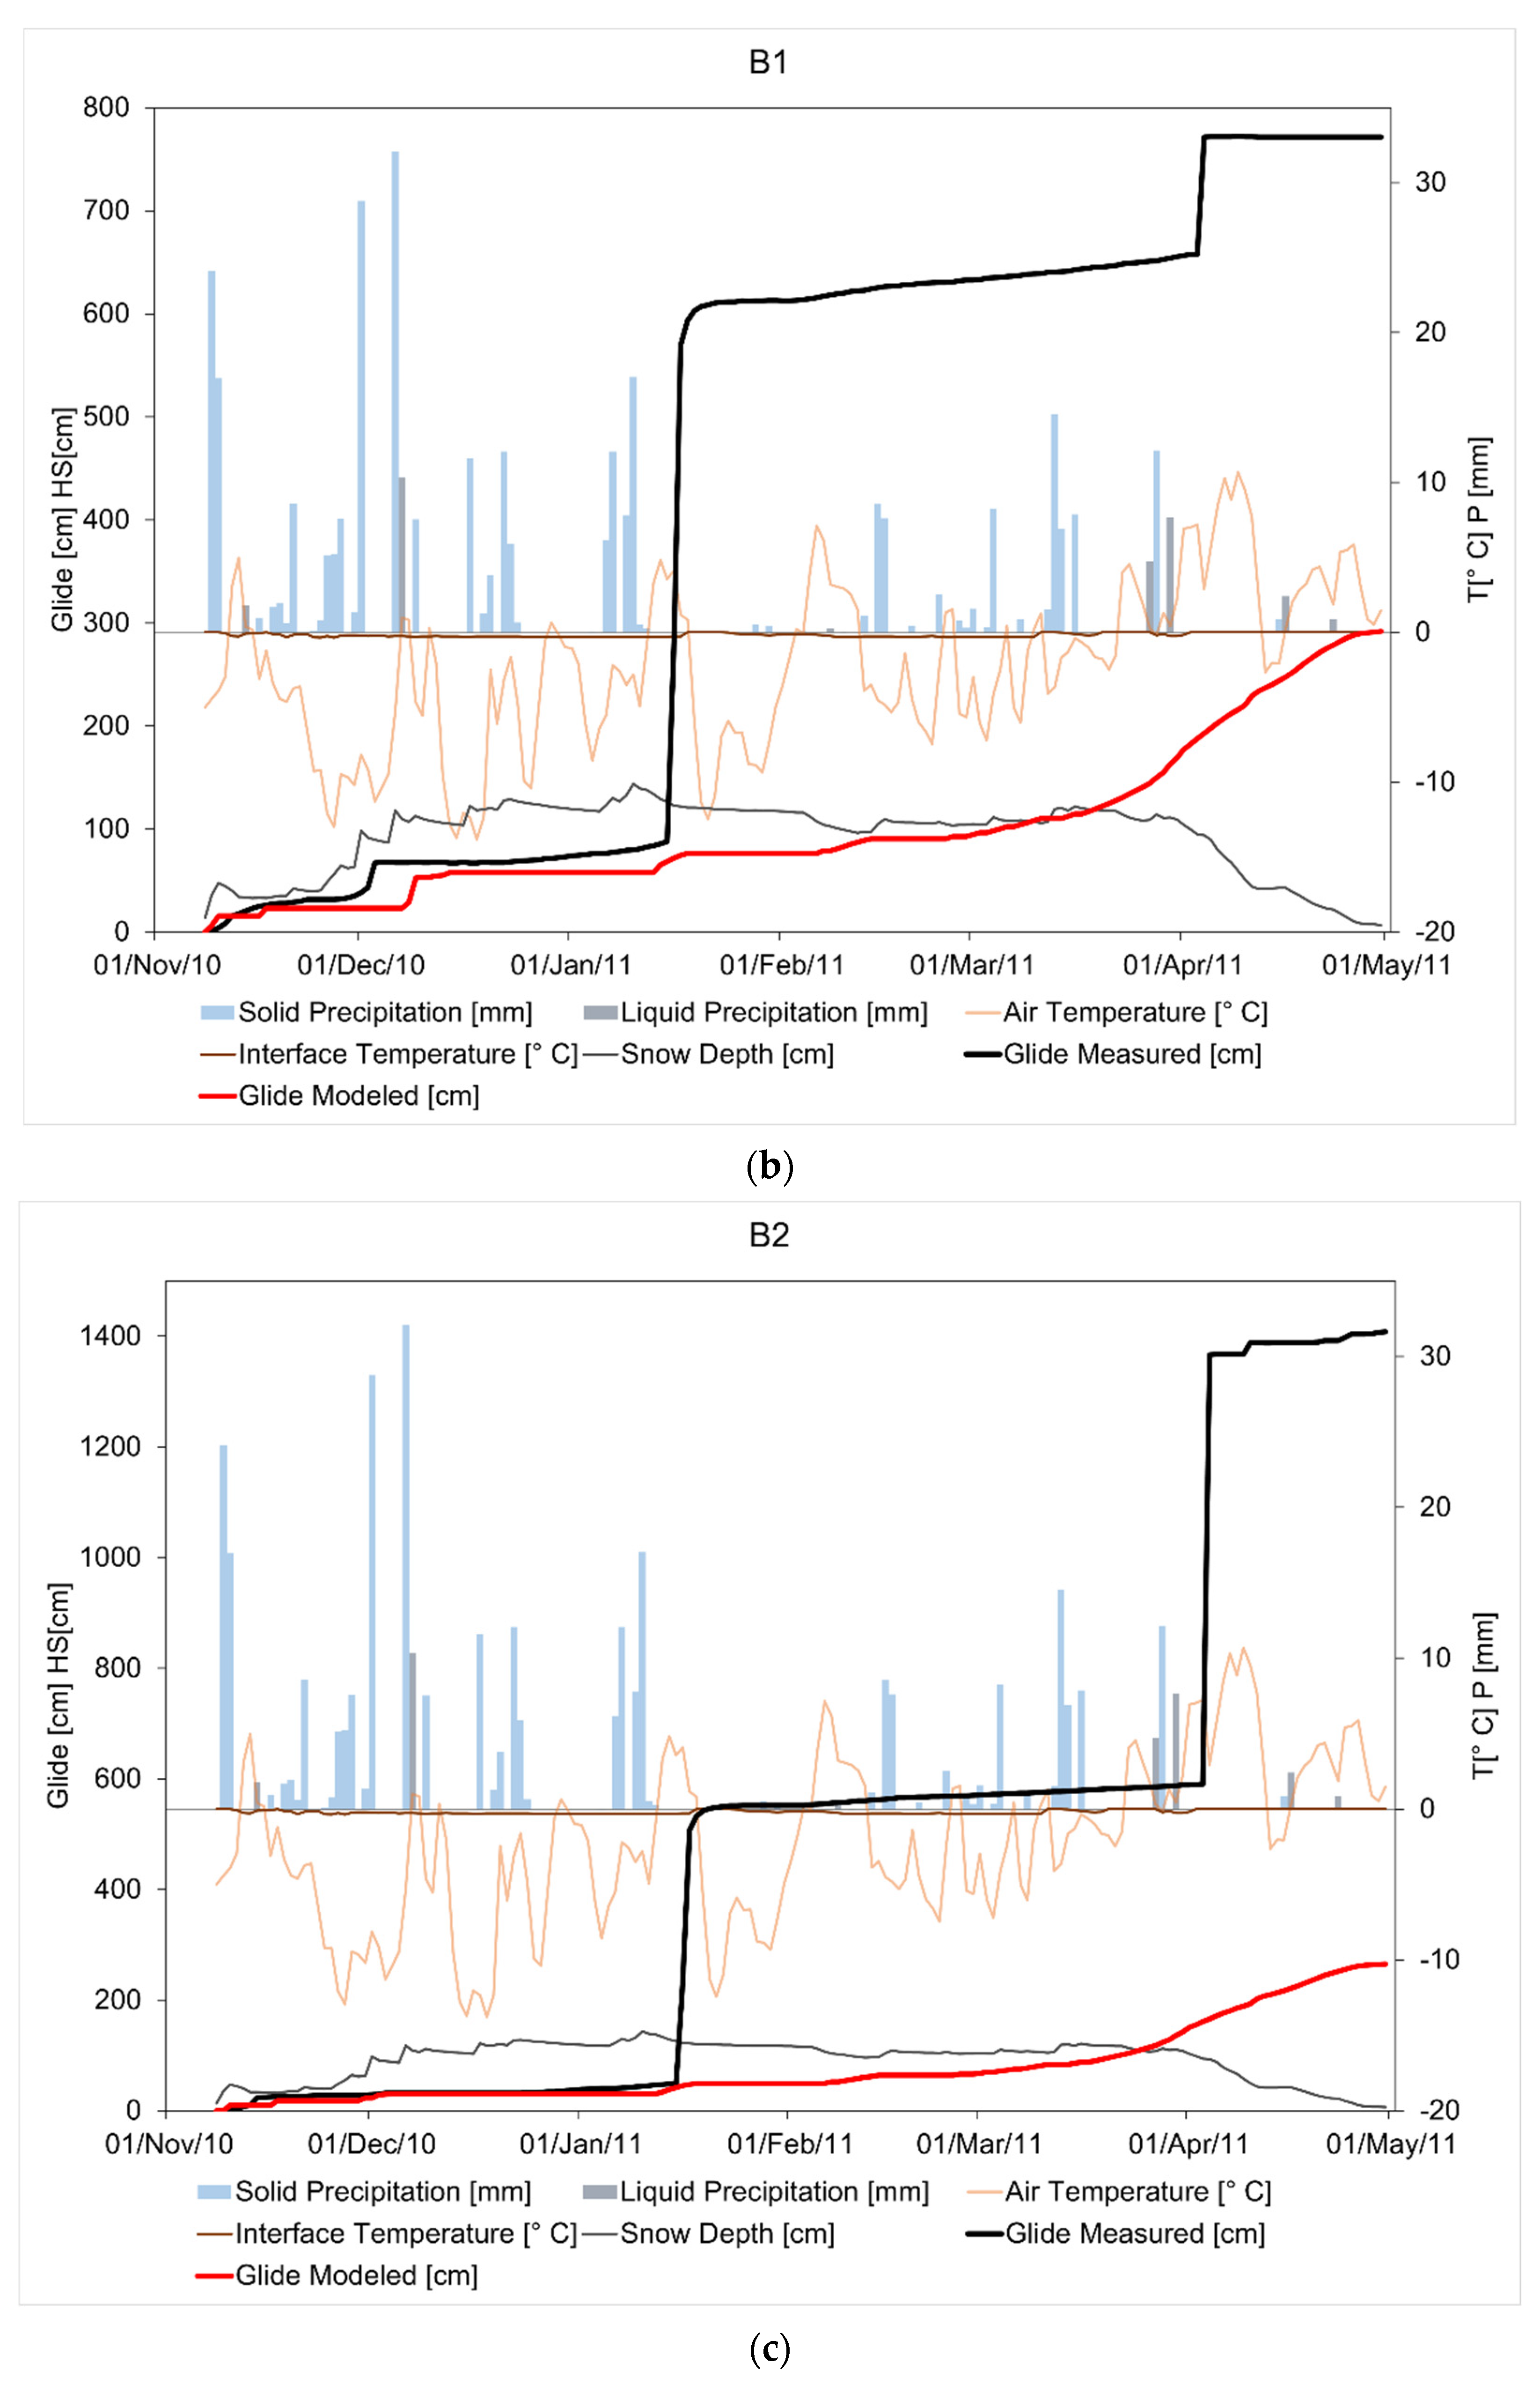
5.3.1. Winter 2010
5.3.2. Winter 2011
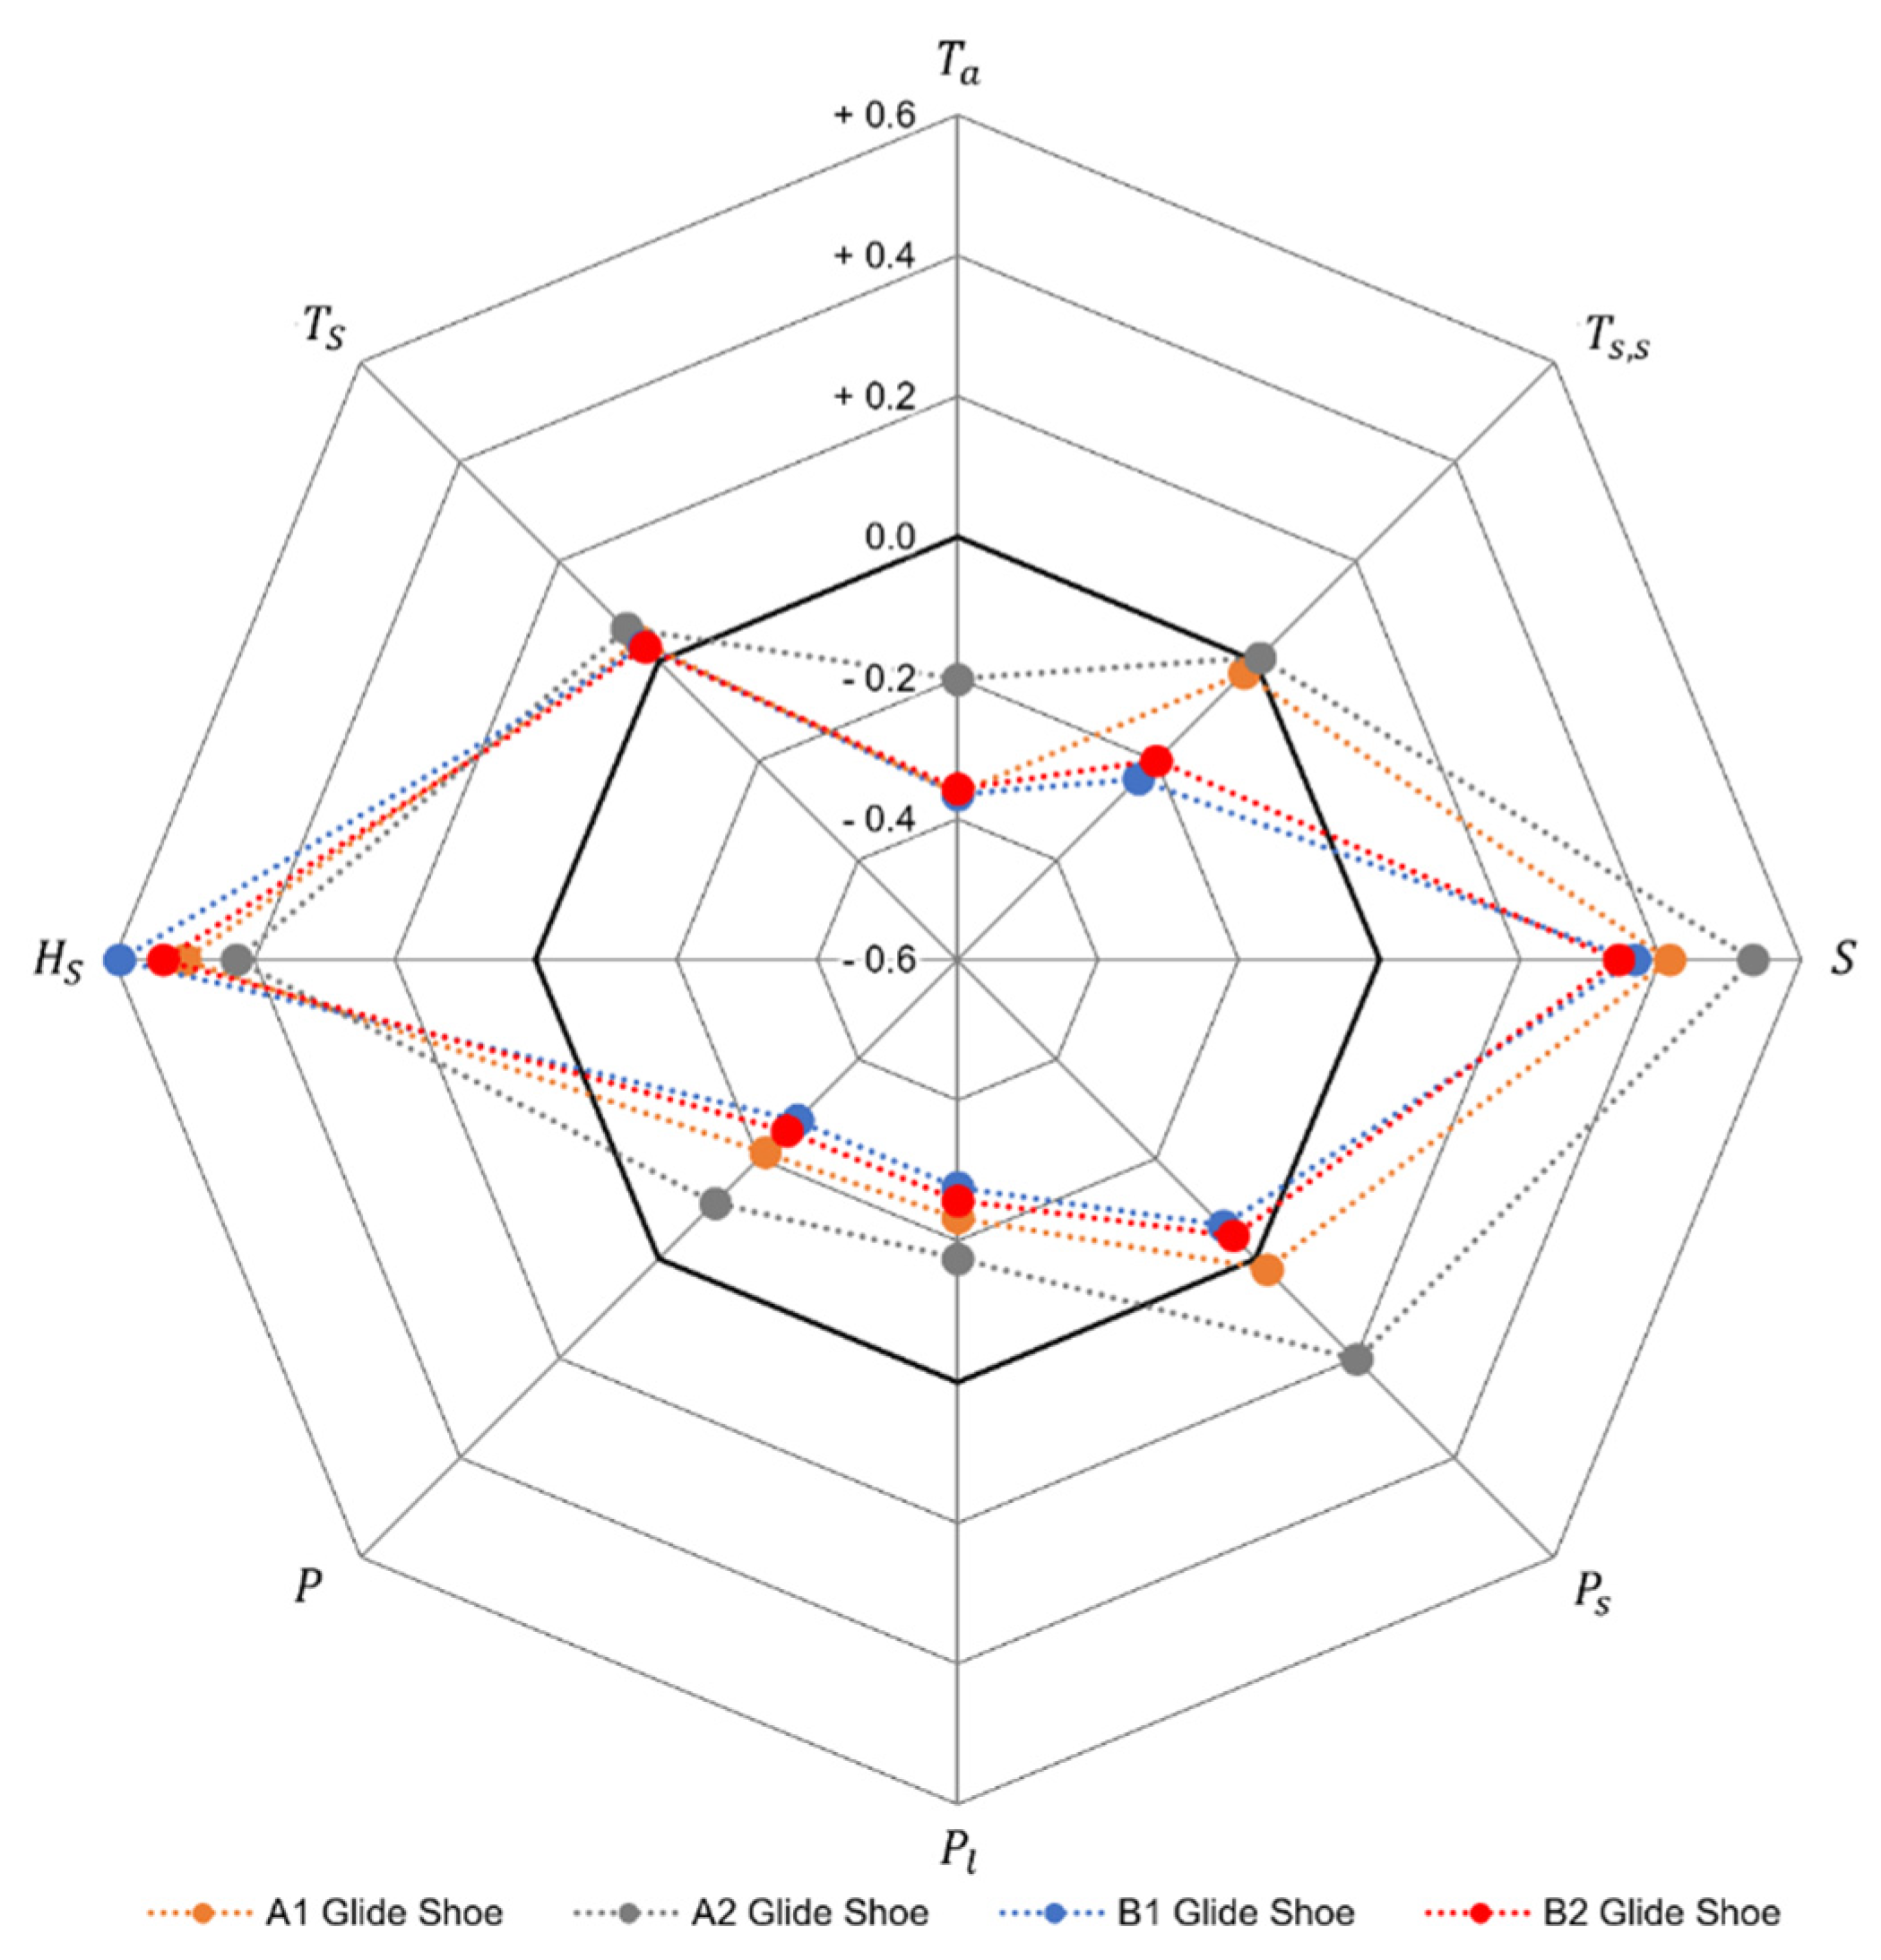
5.4. Correlation Analysis
6. Conclusions
Author Contributions
Funding
Institutional Review Board Statement
Informed Consent Statement
Data Availability Statement
Acknowledgments
Conflicts of Interest
References
- Höller, P. Snow gliding and glide avalanches: A review. Nat. Hazards 2014, 71, 1259–1288. [Google Scholar] [CrossRef]
- Reardon, B.A.; Fagre, D.B.; Dundas, M.; Lundy, C. Natural Glide Slab Avalanches, Glacier National Park, USA: A Unique Hazard and Forecasting Challenge. In Proceedings of the International Snow Science Workshop, Telluride, CO, USA, 1–6 October 2006; pp. 778–785. [Google Scholar]
- Baggi, S.; Schweizer, J. Characteristics of wet-snow avalanche activity: 20 years of observations from a high alpine valley (Dischma, Switzerland). Nat. Hazards 2009, 50, 97–108. [Google Scholar] [CrossRef]
- Peitzsch, E.H.; Hendrikx, J.; Fagre, D.B.; Reardon, B. Examining spring wet slab and glide avalanche occurrence along the Going-to-the-Sun Road corridor, Glacier National Park, Montana, USA. Cold Reg. Sci. Technol. 2012, 78, 73–81. [Google Scholar] [CrossRef]
- Reardon, B.; Lundy, C. Forecasting for Natural Avalanches during Spring Opening of the Going-to-the-Sun Road, Glacier National Park, USA. In Proceedings of the 2004 International Snow Science Workshop, Jackson Wyoming, WY, USA, 19–24 September 2004; pp. 566–581. [Google Scholar]
- Simenhois, R.; Birkeland, K. Meteorological and Environmental Observations from Three Glide Avalanche Cycles and the Resulting Hazard Management Technique. In Proceedings of the International Snow Science Workshop ISSW, Lake Tahoe, CA, USA, 17–22 October 2010. [Google Scholar]
- Feick, S.; Brunner, S.; Mitterer, C.; Schweizer, J. Automated detection and analysis of gliding snow. Geophys. Res. Abstr. 2011, 201, 361–367. [Google Scholar]
- Clarke, J.; McClung, D. Full-depth avalanche occurrences caused by snow gliding, Coquihalla, British Columbia, Canada. J. Glaciol. 1999, 45, 539–546. [Google Scholar] [CrossRef]
- Lackinger, B. Stability and fracture of the snow pack for glide avalanches. In Avalanche Formation, Movement and Effects; Gubler, H., Salm, B., Eds.; IAHS: Wallingford, UK, 1987; pp. 229–241. [Google Scholar]
- Jones, A.S.T. Review of Glide Processes and Glide Avalanche Release. Avalanche News 2004, 69, 53–60. [Google Scholar]
- Mitterer, C.; Schweizer, J. Towards a Better Understanding of Glide-Snow Avalanche Formation. In Proceedings of the International Snow Science Workshop ISSW, Anchorage, AK, USA, 16–21 September 2012; pp. 610–616. [Google Scholar]
- Ceaglio, E.; Meusburger, K.; Freppaz, M.; Zanini, E.; Alewell, C. Estimation of soil redistribution rates due to snow cover related processes in a mountainous area (Valle d’Aosta, NW Italy). Hydrol. Earth Syst. Sci. 2012, 16, 517–528. [Google Scholar] [CrossRef]
- Ceaglio, E.; Mitterer, C.; Maggioni, M.; Ferraris, S.; Segor, V.; Freppaz, M. The role of soil volumetric liquid water content during snow gliding processes. Cold Reg. Sci. Technol. 2017, 136, 17–29. [Google Scholar] [CrossRef]
- Stimberis, J.; Rubin, C. Glide avalanche detection on a smooth rock slope, Snoqualmie Pass, Washington. In Proceedings of the ISSW 2004 International Snow Science Workshop, Jackson Hole, WY, USA, 19–24 September 2004; pp. 608–610. [Google Scholar]
- Dreier, L.; Harvey, S.; van Herwijnen, A.; Mitterer, C. Relating meteorological parameters to glide-snow avalanche activity. Cold Reg. Sci. Technol. 2016, 128, 57–68. [Google Scholar] [CrossRef]
- Höller, P.; Fromm, R.; Leitinger, G. Snow forces on forest plants due to creep and glide. For. Ecol. Manag. 2009, 257, 546–552. [Google Scholar] [CrossRef]
- Haefeli, R. Schneemechanik mit Hinweisen auf die Erdbaumechanik. Ph.D. Thesis, ETH Zurich, Zürich, Switzerland, 1939. [Google Scholar] [CrossRef]
- Premoli, G.A. Modellazione Monodimensionale Dello Snow Gliding: Il Caso di Mont de la Saxe (AO) (Monodimensional Modeling of Snow Gliding: The Case of Mont de la Saxe (AO)). Master’s Thesis, Politecnicodi Milano, Milano, Italy, 2014. (In Italian). [Google Scholar]
- der Gand, H.I.; Zupancic, M. Snow Gliding and Avalanches. In Proceedings of the Scientific Aspects of Snow and Ice Avalanches/Les Aspects Scientifiques des Avalanches de Neige, Davos, Switzerland, 5–10 April 1965; pp. 230–242. [Google Scholar]
- McClung, D.M. Fracture mechanical models of dry slab avalanche release. J. Geophys. Res. Solid Earth 1981, 86, 10783–10790. [Google Scholar] [CrossRef]
- McClung, D.M.; Clarke, G.K.C. The effects of free water on snow gliding. J. Geophys. Res. 1987, 92, 6301. [Google Scholar] [CrossRef]
- Frigo, B.; Chiaia, B.; De Biagi, V.; Dublanc, L.; Freppaz, M.; Godone, D.; Maggioni, M.; Viglietti, D.; Ceaglio, E.; Dellavedova, P. Mountain Risk Research Team—Ricerca a supporto della gestione del rischio valanghe di neve bagnata e da slittamento in Valle d’Aosta. Neve Valanghe 2015, 83, 36–45. [Google Scholar]
- Leitinger, G.; Höller, P.; Tasser, E.; Walde, J.; Tappeiner, U. Development and validation of a spatial snow-glide model. Ecol. Modell. 2008, 211, 363–374. [Google Scholar] [CrossRef]
- Maggioni, M.; Godone, D.; Frigo, B.; Freppaz, M. Snow gliding and glide snow avalanches: Recent outcomes from two experimental test sites in Aosta Valley (NW Italian Alps). Nat. Hazards Earth Syst. Sci. 2019, 19, 2667–2676. [Google Scholar] [CrossRef]
- Mercalli; Berro, D. Atlante Climatico della Valle d’Aosta; SMS: Aosta, Italy, 2003; Volume 2, ISBN 8890009934. [Google Scholar]
- Fierz, C.; Armstrong, R.L.; Durand, Y.; Etchevers, P.; Greene, E.; McClung, D.M.; Nishimura, K.; Satyawali, P.K.; Sokratov, S.A. The International Classification of Seasonal Snow on the Ground; UNESCO: Paris, France, 2009. [Google Scholar]
- Bras, R. Hydrology: An Introduction to Hydrologic Science; Addison-Wesley: Boston, MA, USA, 1990; ISBN 978-0201059229. [Google Scholar]
- Bocchiola, D.; Rosso, R. The distribution of daily snow water equivalent in the central Italian Alps. Adv. Water Resour. 2007, 30, 135–147. [Google Scholar] [CrossRef]
- Martinec, J.; Rango, A. Indirect Evaluation of Snow Reserves in Mountain Basins; IAHS Publication (International Association of Hydrological Sciences): London, UK, 1991; pp. 111–119. [Google Scholar]
- Ohmura, A. Physical Basis for the Temperature-Based Melt-Index Method. J. Appl. Meteorol. 2001, 40, 753–761. [Google Scholar] [CrossRef]
- Bocchiola, D.; Mihalcea, C.; Diolaiuti, G.; Mosconi, B.; Smiraglia, C.; Rosso, R. Flow prediction in high altitude ungauged catchments: A case study in the Italian Alps (Pantano Basin, Adamello Group). Adv. Water Resour. 2010, 33, 1224–1234. [Google Scholar] [CrossRef]
- Bocchiola, D.; Diolaiuti, G.; Soncini, A.; Mihalcea, C.; D’Agata, C.; Mayer, C.; Lambrecht, A.; Rosso, R.; Smiraglia, C. Prediction of future hydrological regimes in poorly gauged high altitude basins: The case study of the upper Indus, Pakistan. Hydrol. Earth Syst. Sci. 2011, 15, 2059–2075. [Google Scholar] [CrossRef]
- Chen, J.M.; Chen, X.; Ju, W.; Geng, X. Distributed hydrological model for mapping evapotranspiration using remote sensing inputs. J. Hydrol. 2005, 305, 15–39. [Google Scholar] [CrossRef]
- Salm, B. Snow Forces. J. Glaciol. 1977, 19, 67–100. [Google Scholar] [CrossRef][Green Version]
- Ancey, C.; Bain, V. Dynamics of glide avalanches and snow gliding. Rev. Geophys. 2015, 53, 745–784. [Google Scholar] [CrossRef]
- Lehning, M.; Völksch Ingo, I.; Gustafsson, D.; Nguyen, T.A.; Stähli, M.; Zappa, M. ALPINE3D: A detailed model of mountain surface processes and its application to snow hydrology. Hydrol. Process. Int. J. 2006, 20, 2111–2128. [Google Scholar] [CrossRef]
- Podolskiy, E.A.; Chambon, G.; Naaim, M.; Gaume, J. Mechanics of Weak Layer Snow under Cyclic Loading Studied by FEM. In Proceedings of the 2012 International Snow Science Workshop, Anchorage, AK, USA, 16–21 September 2012; pp. 617–621. [Google Scholar]
- Pushpalatha, R.; Perrin, C.; Le Moine, N.; Andréassian, V. A review of efficiency criteria suitable for evaluating low-flow simulations. J. Hydrol. 2012, 420–421, 171–182. [Google Scholar] [CrossRef]
- Muhuri, A.; Manickam, S.; Bhattacharya, A. Snehmani Snow Cover Mapping Using Polarization Fraction Variation With Temporal RADARSAT-2 C-Band Full-Polarimetric SAR Data Over the Indian Himalayas. IEEE J. Sel. Top. Appl. Earth Obs. Remote Sens. 2018, 11, 2192–2209. [Google Scholar] [CrossRef]
- Deschamps-Berger, C.; Gascoin, S.; Berthier, E.; Deems, J.; Gutmann, E.; Dehecq, A.; Shean, D.; Dumont, M. Snow depth mapping from stereo satellite imagery in mountainous terrain: Evaluation using airborne laser-scanning data. Cryosphere 2020, 14, 2925–2940. [Google Scholar] [CrossRef]
- Yueh, S.H.; Xu, X.; Shah, R.; Kim, Y.; Garrison, J.L.; Komanduru, A.; Elder, K. Remote Sensing of Snow Water Equivalent Using Coherent Reflection From Satellite Signals of Opportunity: Theoretical Modeling. IEEE J. Sel. Top. Appl. Earth Obs. Remote Sens. 2017, 10, 5529–5540. [Google Scholar] [CrossRef]
- Shugar, D.H.; Jacquemart, M.; Shean, D.; Bhushan, S.; Upadhyay, K.; Sattar, A.; Schwanghart, W.; McBride, S.; de Vries, M.V.W.; Mergili, M.; et al. A massive rock and ice avalanche caused the 2021 disaster at Chamoli, Indian Himalaya. Science 2021, 373, 300–306. [Google Scholar] [CrossRef]


| R2 | Bias% | RMSE [cm] | |
|---|---|---|---|
| Winter 2010 | 0.96 | −2.3% | 13.2 |
| Winter 2011 | 0.52 | −1.0% | 7.8 |
| A1 | A2 | B1 | B2 | A12 | |
|---|---|---|---|---|---|
| Wavelength λ0 [m] | 10 | 10 | 10 | 11 | 10 |
| Amplitude A [mm] | 36 | 26 | 31 | 19 | 28 |
| Max Angle of Friction ϕmax [°] | 32° | ||||
| Min Angle of Friction ϕmin [°] | 6° | ||||
| Displacement threshold after which there is the decrease in the angle of friction [cm] | 42 | ||||
| Rate of decrease in the angle of friction after the displacement threshold [°/cm] | −0.25 | ||||
| Cohesion cS [Pa] | 35 | ||||
| A1 | A2 | B1 | B2 | A12 | |
|---|---|---|---|---|---|
| Max Abs Diff of cumulative glide [cm] | 174.5 | 117.4 | 53.5 | 61.2 | 86.8 |
| RMSE cumulative glide [cm] | 51.2 | 30.2 | 131.1 | 122.1 | 21.2 |
| NSE cumulative glide | 0.58 | 0.94 | 0.97 | 0.96 | 0.95 |
| RMSE glide rate [cm/d] | 9.6 | 5.92 | 2.13 | 2.34 | 5.46 |
| NSE glide rate | 0.33 | 0.48 | 0.79 | 0.78 | 0.52 |
Publisher’s Note: MDPI stays neutral with regard to jurisdictional claims in published maps and institutional affiliations. |
© 2021 by the authors. Licensee MDPI, Basel, Switzerland. This article is an open access article distributed under the terms and conditions of the Creative Commons Attribution (CC BY) license (https://creativecommons.org/licenses/by/4.0/).
Share and Cite
Bombelli, G.M.; Confortola, G.; Maggioni, M.; Freppaz, M.; Bocchiola, D. Physical Modeling of Snow Gliding: A Case Study in the NW Italian Alps. Climate 2021, 9, 171. https://doi.org/10.3390/cli9120171
Bombelli GM, Confortola G, Maggioni M, Freppaz M, Bocchiola D. Physical Modeling of Snow Gliding: A Case Study in the NW Italian Alps. Climate. 2021; 9(12):171. https://doi.org/10.3390/cli9120171
Chicago/Turabian StyleBombelli, Giovanni Martino, Gabriele Confortola, Margherita Maggioni, Michele Freppaz, and Daniele Bocchiola. 2021. "Physical Modeling of Snow Gliding: A Case Study in the NW Italian Alps" Climate 9, no. 12: 171. https://doi.org/10.3390/cli9120171
APA StyleBombelli, G. M., Confortola, G., Maggioni, M., Freppaz, M., & Bocchiola, D. (2021). Physical Modeling of Snow Gliding: A Case Study in the NW Italian Alps. Climate, 9(12), 171. https://doi.org/10.3390/cli9120171