Article

Determinants of Household-Level Coping Strategies and Recoveries from Riverine Flood Disasters: Empirical Evidence from the Right Bank of Teesta River, Bangladesh

by
Md. Sanaul Haque Mondal
*,
Takehiko Murayama
and
Shigeo Nishikizawa
School of Environment and Society, Tokyo Institute of Technology, Yokohama, Kanagawa 226-8502, Japan
*
Author to whom correspondence should be addressed.
Climate 2021, 9(1), 4; https://doi.org/10.3390/cli9010004
Submission received: 9 November 2020 / Revised: 14 December 2020 / Accepted: 24 December 2020 / Published: 29 December 2020
(This article belongs to the Special Issue Climate Resilient Cities and Communities)

Abstract

:
Although recurrent floods cause detrimental impact for the people living in riverine floodplains, households are taking up various risks management strategies to deal with them. This paper examined household’s post-disaster coping strategies to respond and recover from riverine floods in 2017. Data were collected through a questionnaire survey from 377 households from the right bank of Teesta River in Bangladesh. Households employed different coping strategies including borrowing money, assets disposal, consumption reduction, temporary migration, and grants from external sources, to cope with flood. Results from logistic regression models suggested that increasing severity of flood reduced households’ consumption. Exposed households were more likely to borrow money. Consumption reduction and temporary migration were mostly adopted by agricultural landless households. Income from nonfarm sources was found to be an important factor influencing household’s decisions on coping. Furthermore, households that recovered from the last flood disaster seek insurance through their own savings and available physical assets, highlighting the role of disaster preparedness in resilient recovery. This study calls for the policy intervention at the household-level to enhance the adaptive capacity of riverine households so that people at risk can cope better and recover from flood disaster using their resources.

1. Introduction

Floods are a serious threat to sustainability [1] of riverine communities around the world. From 1995 to 2015, floods killed more than 157,000 people and affected over 2.3 billion worldwide [2]. Most of these deaths and devastation occurred in Asia, however, evidence showed that the number of deaths from flooding has increased in many parts of the world [1]. For example, in Bangladesh, flood-related death tolls have risen from 223 between 2010–2014 to 435 between 2015–2019 [3]. The number of people affected and the economic losses caused by floods are also increasing. On the other hand, floods are the primary source of risk to agriculture [4] in terms of production loss and food shortage [5]. Studies found that recurrent flooding also presents severe public health concerns in developing countries [2]. Therefore, researchers around the world are now motivated to investigate why and how damage from a flood event occurs and who are the most affected.
As a riverine floodplain country, Bangladesh faces floods almost every year with varying intensity and frequency. From 1971 to 2019, the country was affected by 89 floods, causing damage of around $13 billion and over 42 thousand casualties [3]. In August 2017, Bangladesh faced one of the historically devastating river flooding events in its recent history. The northern region of the country was severely affected by the August 2017 flood, impacting around 6.9 million people, destroyed 593,250 houses and claimed the lives of over 114 people [6]. The water levels of major rivers in the northern region crossed their danger levels leading to the inundation of riverine areas. The flood in August 2017 was particularly impactful for the riverine people as it followed two earlier episodes in March and July that year [7]. The timing and severity of August 2017 flood disrupted this year’s agricultural production resulted in a record price of rice, affecting food security. Roads, railways and bridges were severely damaged, leaving many areas inaccessible to emergency relief efforts. Thousands of waterborne diseases were reported in the post-disaster period. Although riverine people developed their own level of resilience and adapted their livelihood strategies to the flood pattern, severe flood like 2017 exceeds the coping capacity of people [8], undermines household’s food security and resilience [9].
A number of studies have already been conducted focusing 2017 flood, such as attributing factors of flood [7], forecast based cash transfer [8], household’s risk and vulnerability [10,11]. The study of Sultana, Thompson, and Wesselink [12] investigated the impacts of two successive years floods (2016–2017) on riverine households of northern Bangladesh and found that embankments, local community-based organizations, and seasonal-migration plays an important role in coping with floods. However, limited attention has been paid to explore the factors that influence households to adopt coping strategies after facing a historical flood in 2017. This paper addresses this gap by investigating the coping strategies adopted by the riverine households in northern Bangladesh during 2017 flood.
Household responses to flood disaster in a variety of ways which can be classified as ex-ante strategies and ex-post strategies, where the foremost includes risk reduction and risk mitigation strategies are taken by the households in pre-hazard periods, while the latter refers to risk coping strategies to recover from disasters in post-disaster periods [13]. Riverine people are at risk due to exposure to flood hazards and their vulnerable conditions [11]. On the other hand, capacity is the ability of a household to resist or recover from the negative impact of a flood disaster.
In a post-disaster period, households adopt different coping strategies including loan arrangements; sale of assets, livestock, or labor; temporary migration; clearing savings; living on charity; receiving emergency support from external actors; starvation [12,14,15,16,17]. Coping strategies do not lessen vulnerability; however, understanding the rationale behind coping behaviors might help towards effective targeting of those who are at their greatest risk [18]. Successful coping may foster households to recover from the impact of a disaster. On the other hand, when coping strategies turn ineffective, households face difficulties in recovering from a disaster. However, the severity of impact may vary across households and most often poor people, who have limited coping capacities, bear the greatest risks [4].
Studies revealed that the adoption of a particular set of coping strategies depends on several factors, including socioeconomic factors, types of shocks, severity of the event, physical location, ability to recover, information on opportunities [4,12,19,20,21,22,23]. The adoption of coping strategies also varies with the income level of the household [24]. However, flood risk not only depends on the hazard, exposure and current level of vulnerability but also the capacity of a household to recover from the flood’s impact [11].
In Bangladesh, earlier studies researched coping strategies in situations such as riverine floods [12,25,26,27,28], riverbank erosion [29], urban (slum) flood [30,31]. However, a very little research has been carried out on model-based analysis of households’ coping strategies against flood disaster (e.g., [14,15,17,20,24,32]). There are several recent studies focused on riverine areas of Bangladesh looking at different issues of households’ perception and adaptation strategies [33,34]; coping strategies with food insecurity [35]; migration decisions due to natural disasters [36]; livelihood vulnerability [37,38,39], livelihood diversification [40] and livelihood resilience [41,42], but little is known which factors influence riverine households, especially in the context of transboundary river floods, to adopt post-disaster coping strategies. Research suggests that there is a need for place and context-specific assessments of household’s response to flood, since responses may differ with respect to local characteristics of flooding [11,43].
Numerous studies revealed that factors such household characteristics [44,45,46], social capital [46], physical assets ownership [47] are associated with disaster recovery. Based on a survey in Metro Manila, Philippines Francisco [48] indicated that access to credit (borrowing) significantly reduce post-disaster recovery time. However, researchers have paid little attention to the post-disaster coping strategies to recover from the disaster.
Keeping in view the current research gap, this study aims to examine post-disaster coping strategies adopted by the riverine households and identify the determinants to adopt a particular coping measure to respond and recover from the impact of a flood disaster. There are three research questions to be answered: (i) What post-disaster coping strategies did a household employ to respond immediately after the 2017 flood? (ii) Which factors influenced households to adopt these coping strategies? (iii) How effective were the coping strategies adopted by the household in recovering from flood disaster? An understanding of why a household chooses coping strategies and whether these strategies help them recover from the disaster can guide policymakers in promoting effective flood risk management through identifying target variables.

2. Materials and Methods
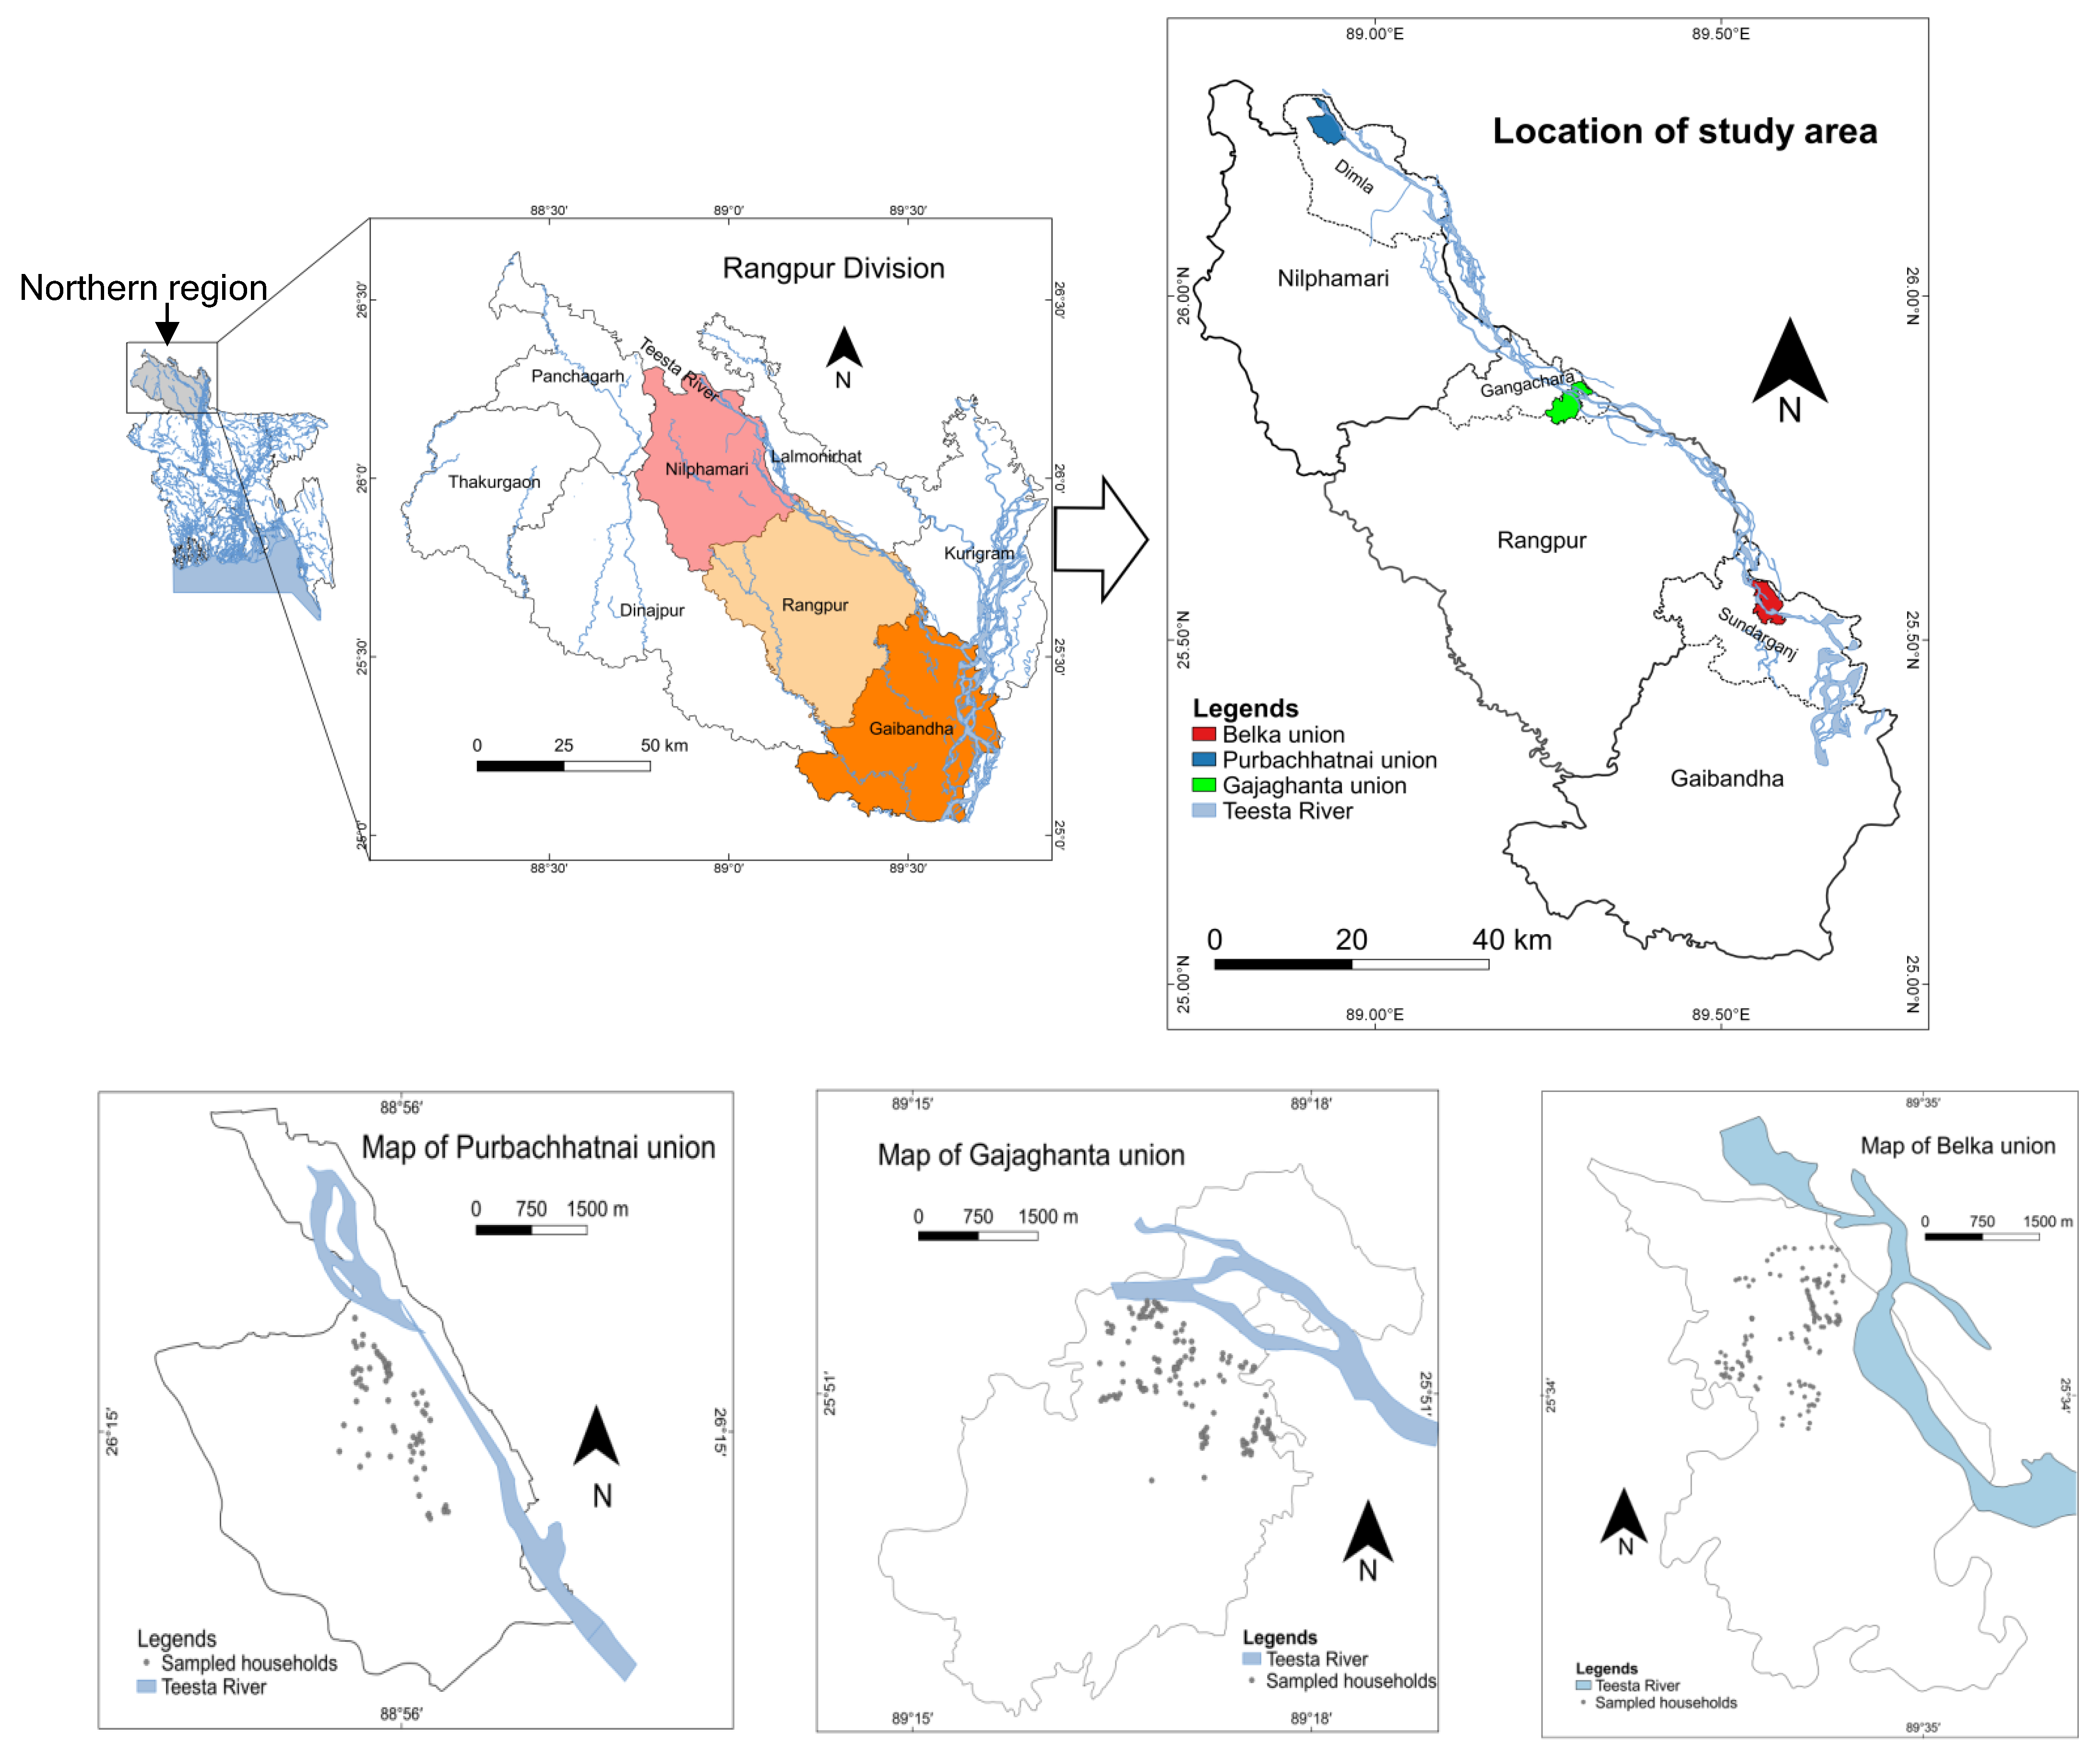
2.1. Study Area

The Teesta floodplain is one of the largest floodplains in Bangladesh, located in the northern region of the country (Figure 1). This northern region has a higher incidence of poverty, characterized by income deficit and undiversified income [26,28]. The maximum and minimum monthly average temperature for Rangpur station in 2017 was 30.2 °C and 20.9 °C, respectively, with a maximum day temperature of 37 °C in July and a minimum of 6.6 °C in January (Source: Bangladesh Meteorological Department). The average annual rainfall in this region is slightly over 1900 mm. Teesta River, which is one of the most important rivers of the northern region, cut through the Teesta floodplain. This river runs through Sikkim and West Bengal of India, and the five northern districts of Bangladesh: Nilphamari, Lalmonirhat, Kurigram, Rangpur, and Gaibandha (Figure 1). It is the fourth largest transboundary river of Bangladesh after Ganges, Brahmaputra, and Meghna.
People lives along the banks of Teesta River are exposed to uncertain floods, bank erosions, and periodic droughts. Among these disasters, floods are the most destructive for the riparian people. Households adopt a variety of measures to manage flood risks. The primary causes of floods in the Teesta River are river overflow, particularly due to the release of water from the barrage, erratic rainfall, riverbank erosion, and poor drainage. The most recent disastrous floods related to the Teesta River were in 1998, 2004, 2008, 2017, and 2020. The flood in 2017 was particularly devastating, causing severe damage to houses and crops, and more than fifty casualties in those five northern districts [6]. At Dalia station of Teesta River, the water level crossed the danger level (52.6 m) four times and reached at the highest recorded peak (53.05 m) on 13 August 2017. Floods are regular event for the people who reside along the Teesta riverbank.

2.2. Sampling and Data Collection

This study used a multi-stage sampling technique to select survey locations and households. The right bank of the Teesta River was selected purposively for this study. The reason behind the selection of the right bank of Teesta River was that Dharla River and Brahmaputra River are situated on the left bank side of the Teesta River. To understand the impact of Teesta River floods, only the right bank side was selected as a case study area. Next, three districts from the right bank were considered for sampling, selecting one upazila (Upazila functions as a sub-district of a district in Bangladesh) from each: Dimla upazila from Nilphamari district, Gangachara upazila from Rangpur district, and Sundarganj upazila from Gaibandha district (Figure 1). From each upazila, one union (Union is the lowest tier of the local government structure in Bangladesh) was selected based on its location along the riverbank: Purbachhatnai union from Dimla upazila, Gajaghanta union from Gangachara upazila, and Belka union from Sundarganj upazila. These three unions are located in the upstream (Purbachhatnai), midstream (Gajaghanta), and downstream (Belka) segment of Teesta River in Bangladesh, respectively (Figure 1), and are exposed to sudden and recurrent flooding from Teesta River. In the final stage, households were selected from each union.
Following the Cochran’s formula, a sample size of 377 households was calculated using the total number of households of these three unions with a 95% confidence level and 5% margins of errors (confidence interval). After that proportional allocation technique was applied to compute optimum number of households of each union: 68 for Purbachhatnai union, 158 for Gajaghanta union, and 151 for Belka union (Table 1).
In the next stage, 377 households were selected using a systematic random sampling technique from the study area. A semi-structured questionnaire was used to collect data using face-to-face interview between April and May 2019. The survey instruments consists of a series of questions ranging from socio-demographic characteristics of the households, income sources, dwelling information, health status, land ownership, coping strategies during flood, preparedness and perception on flood risk [11]. Initially, it was planned to interview with the head of the households. However, we find it difficult to get the household head in the randomly selected houses, even though the interview was on weekends or holidays. To expedite the field survey, we continued interviewing either with the head (male or female) or the elderly person in the household. One focus group discussion (FGD) in each union was also conducted. The language of each interview was Bengali.
Before the interview, the respondents were informed regarding the purpose of the study and asked whether they would like to participate. The interview was conducted after receiving the verbal consent from the respondents. This study was approved by the Tokyo Institute of Technology Human Ethics Committee.

3. Variables Selection and Statistical Analysis

3.1. Dependent Variables

To assess post-disaster coping strategies adopted by the households, the respondents were asked whether or not they adopted 21 measures during or immediate (within one month) after the 2017 flood which was selected based on literature review [4,12,15,16,17], focus group discussion and informal interviews. These coping strategies, which are described in Appendix A Table A1, are classified into five groups: namely, borrowing money; assets disposal; consumption reduction; temporary migration; and grants from external sources.
Borrowing money: The term borrowing includes all kinds of strategies that a household employed to take loans from others. The formal sources include banks and non-governmental organizations (NGOs), whereas informal sources include local money lenders, friends, relatives, or neighbors. In extreme situations, some people borrow money by selling labor or field crops with an advance payment. Households that employed one or a combination of these strategies were grouped in this category.
Assets disposal: Disposable items include financial and physical assets. The physical disposable assets are comprised of livestock (poultry, cattle, goats), household utensils, jewelry, trees, crops, land. On the other hand, financial assets include household savings (deposits). If a household sold any physical assets or used up its savings in response to flood, it was classified in this category.
▪ Consumption reduction: Food scarcity is common in disaster-affected areas. Households adopt numerous strategies to cope with shocks, including consumption smoothing, resorting to cheap foods, wild foods collection [16]. In this study, consumption reduction implies a household reducing their consumption in response to a flood disaster, in the form of meal skipping or starvation.
Temporary migration: Migration to cities or other flood-free areas is a common measure to compensate losses incurred from flood. If a family member from a household migrated outside of the flood prone area (study area) for income and then returned to their houses within six months, the household was labeled in this category.
Grants from external sources: Grants from external sources are vital for short-term survival. It helps flood disaster victims to compensate their losses [21]. Grants are distributed among flood victims by the local/national government, NGOs, local elites, or a host of other organizations. In this study, if a household received grants from external sources (e.g., government, NGOs, or local elites), it was classified in this category.

3.2. Explanatory Variables

A multitude of factors influences coping strategies, and there is no agreed framework for choosing explanatory variables. A household’s choice of a particular set of strategies and their timing depends on the complex dimensions of vulnerability [50]. The selection of explanatory variables such as depth of floodwater, location of house, affected by disease, age, female, agricultural landless was based on the literature [14,15,17,20,24,32] (Table 2). Besides, we included four capacity variables (crop save, mobile phone, mitigation measures, nonfarm income) to understand household’s coping behavior (Table 2).
Flood hazard is determined by the frequency and intensity of the flood event. This study considered one proxy variable to capture the severity of a flood hazard, namely, “floodwater depth”. The deeper the floodwater inside a home, the more severe is the flood and resultant damages [11]. Exposure to flood refers to the elements at risk from a flood event [51]. Exposure to flood increases with the proximity of human settlements to the riverbank. Human exposure increases if family member(s) were injured or infected by communicable diseases due to flood [52,53]. Vulnerability is represented by the conditions that are determined by “physical, social, economic, and environmental factors or processes, which increase the susceptibility of an individual, a community, assets or systems to the impact of hazards [54]. This study considered three proxy variables to capture the vulnerability of households, namely “age”, “female”, and “agricultural landless”. The vulnerability of a household increases with the age of the household’s head [16]. Female-headed households are more vulnerable than male-headed ones [53,55]. Agricultural landless households are also considered vulnerable [53]. The capacity of a household includes the available strategies and resources that help be prepared for mitigating future flood risks, in order to better respond and quickly return to the proper level of functioning following a flood disaster [54]. To capture the capacity of a household, this study considered four variables. Households who save their crops are capable of absorbing flood disaster shocks [53,55]. Ownership of communication devices, such as mobile phones, can facilitate receiving early flood warnings [11] or other useful information from friends/relatives. Structural risk mitigation strategies (such as raising the plinth of house/building home on natural levee/modification of house with strong materials) is positively related with risk perception [52], thus influencing coping choices. Income from nonfarm sources plays an important role for the rural people in Bangladesh by generating alternative sources of income [11]. In this study, nonfarm income refers to the income from non-agricultural sources, such as remittance, transport, petty trade, construction, tailoring, services and others.

3.3. Recovery from Flood Disasters

In this study, recovery from the flood disaster was investigated by asking households whether they were able to recover from the losses and damages incurred from the last flood disaster in 2017. A household’s recovery from flood disaster was coded as “1” for yes, “0” for no.

3.4. Data Analysis

Data collected through the structured questionnaire were coded and then analyzed using the Statistical Package for Social Sciences (SPSS, version 25). The Chi-square test of independence, bivariate correlation, and logistic regression techniques were used to explore the relationship between dependent and independent variables.
The dependent variable of this study is whether a household adopted a particular coping strategy or not. To determine the dummy, a value of “1” was assigned to those households that adopted at least one measure within the borrowing money category and “0” for those that had not adopted. Similar process was repeated to determine the dummy value for assets disposal, consumption reduction, temporary migration, and grants from external sources. Since the dependent variable is dichotomous (yes and no), a logistic regression was used to model the influence of explanatory variables on adopting different coping strategies. In the logistic regression model, the dependent variable becomes the natural logarithm of the odds when a positive choice is made and can be written as [56]:
Logit ( P x ) = log P x 1 P x = β 0 + β 1 x 1 + β 2 x 2 + β 3 x 3 + +   β j x j
where,
Px = Probability of adopting a coping strategy
1 − Px = Probability of not adopting coping strategy
β0 = Probability constant
β1, β2, β3, ⋯, βj = Coefficient of the explanatory variables
x1, x2, x3, ⋯, xj = Explanatory variables

4. Results and Discussion

4.1. Households’ Characteristics

The age of the household head ranged from 22 to 90 years, with a mean age of 48.93 years. Almost 95% of the sampled households were male headed. Around 66% of the households had at least one member who completed primary education or more. The average household size was 4.8, which was higher than the national average (4.4 persons). The average monthly income of the surveyed households was around 8977 Bangladeshi Taka (BDT) (SD = 5113; range 1000 BDT to 40,000 BDT) at the time of the survey (1 USD = 84.25 BDT, as of April 2019; Source: Bangladesh Bank). The majority of the households (85%) were located within 1000 m from the riverbank. Most of the households (97%) reported that their houses were inundated in 2017 flood. Around 48% households did not have any cultivable lands. Agriculture (63%) was the dominant form of livelihood options, followed by wage labor (23%). Around one-third of the households had income from nonfarm sources. Among the agricultural occupants, 24% (58 out of 238) had nonfarm income sources.

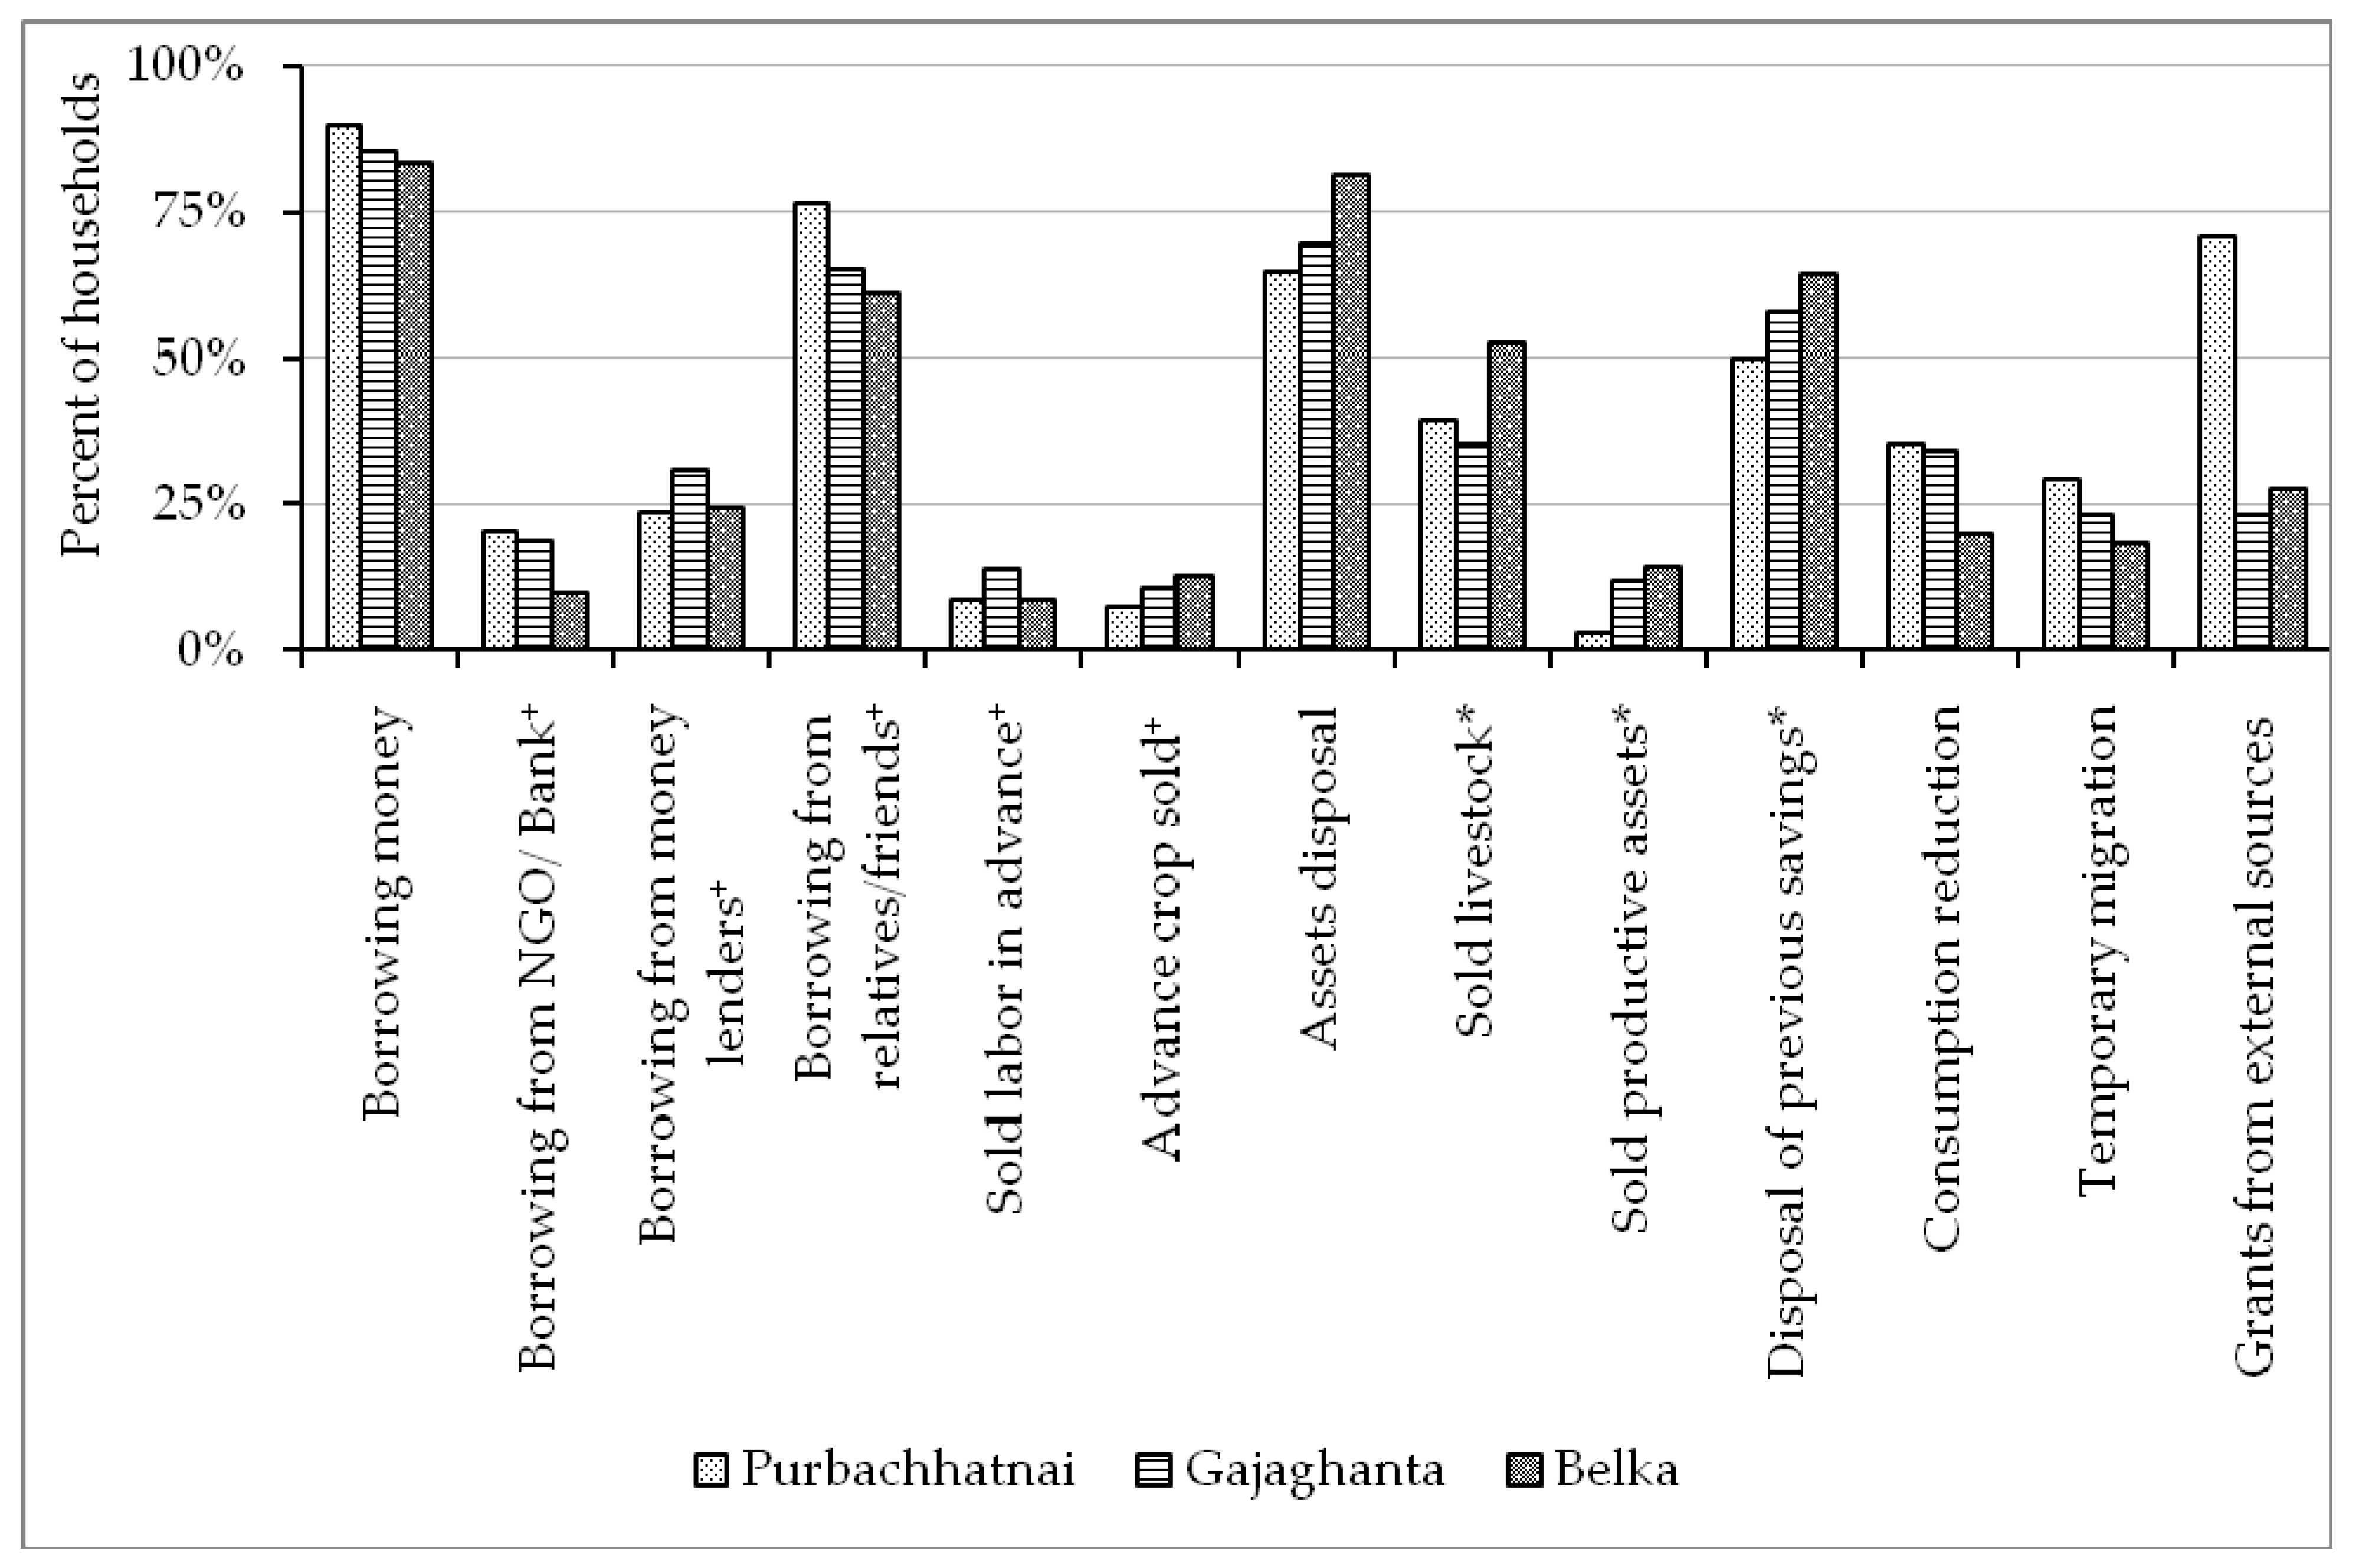
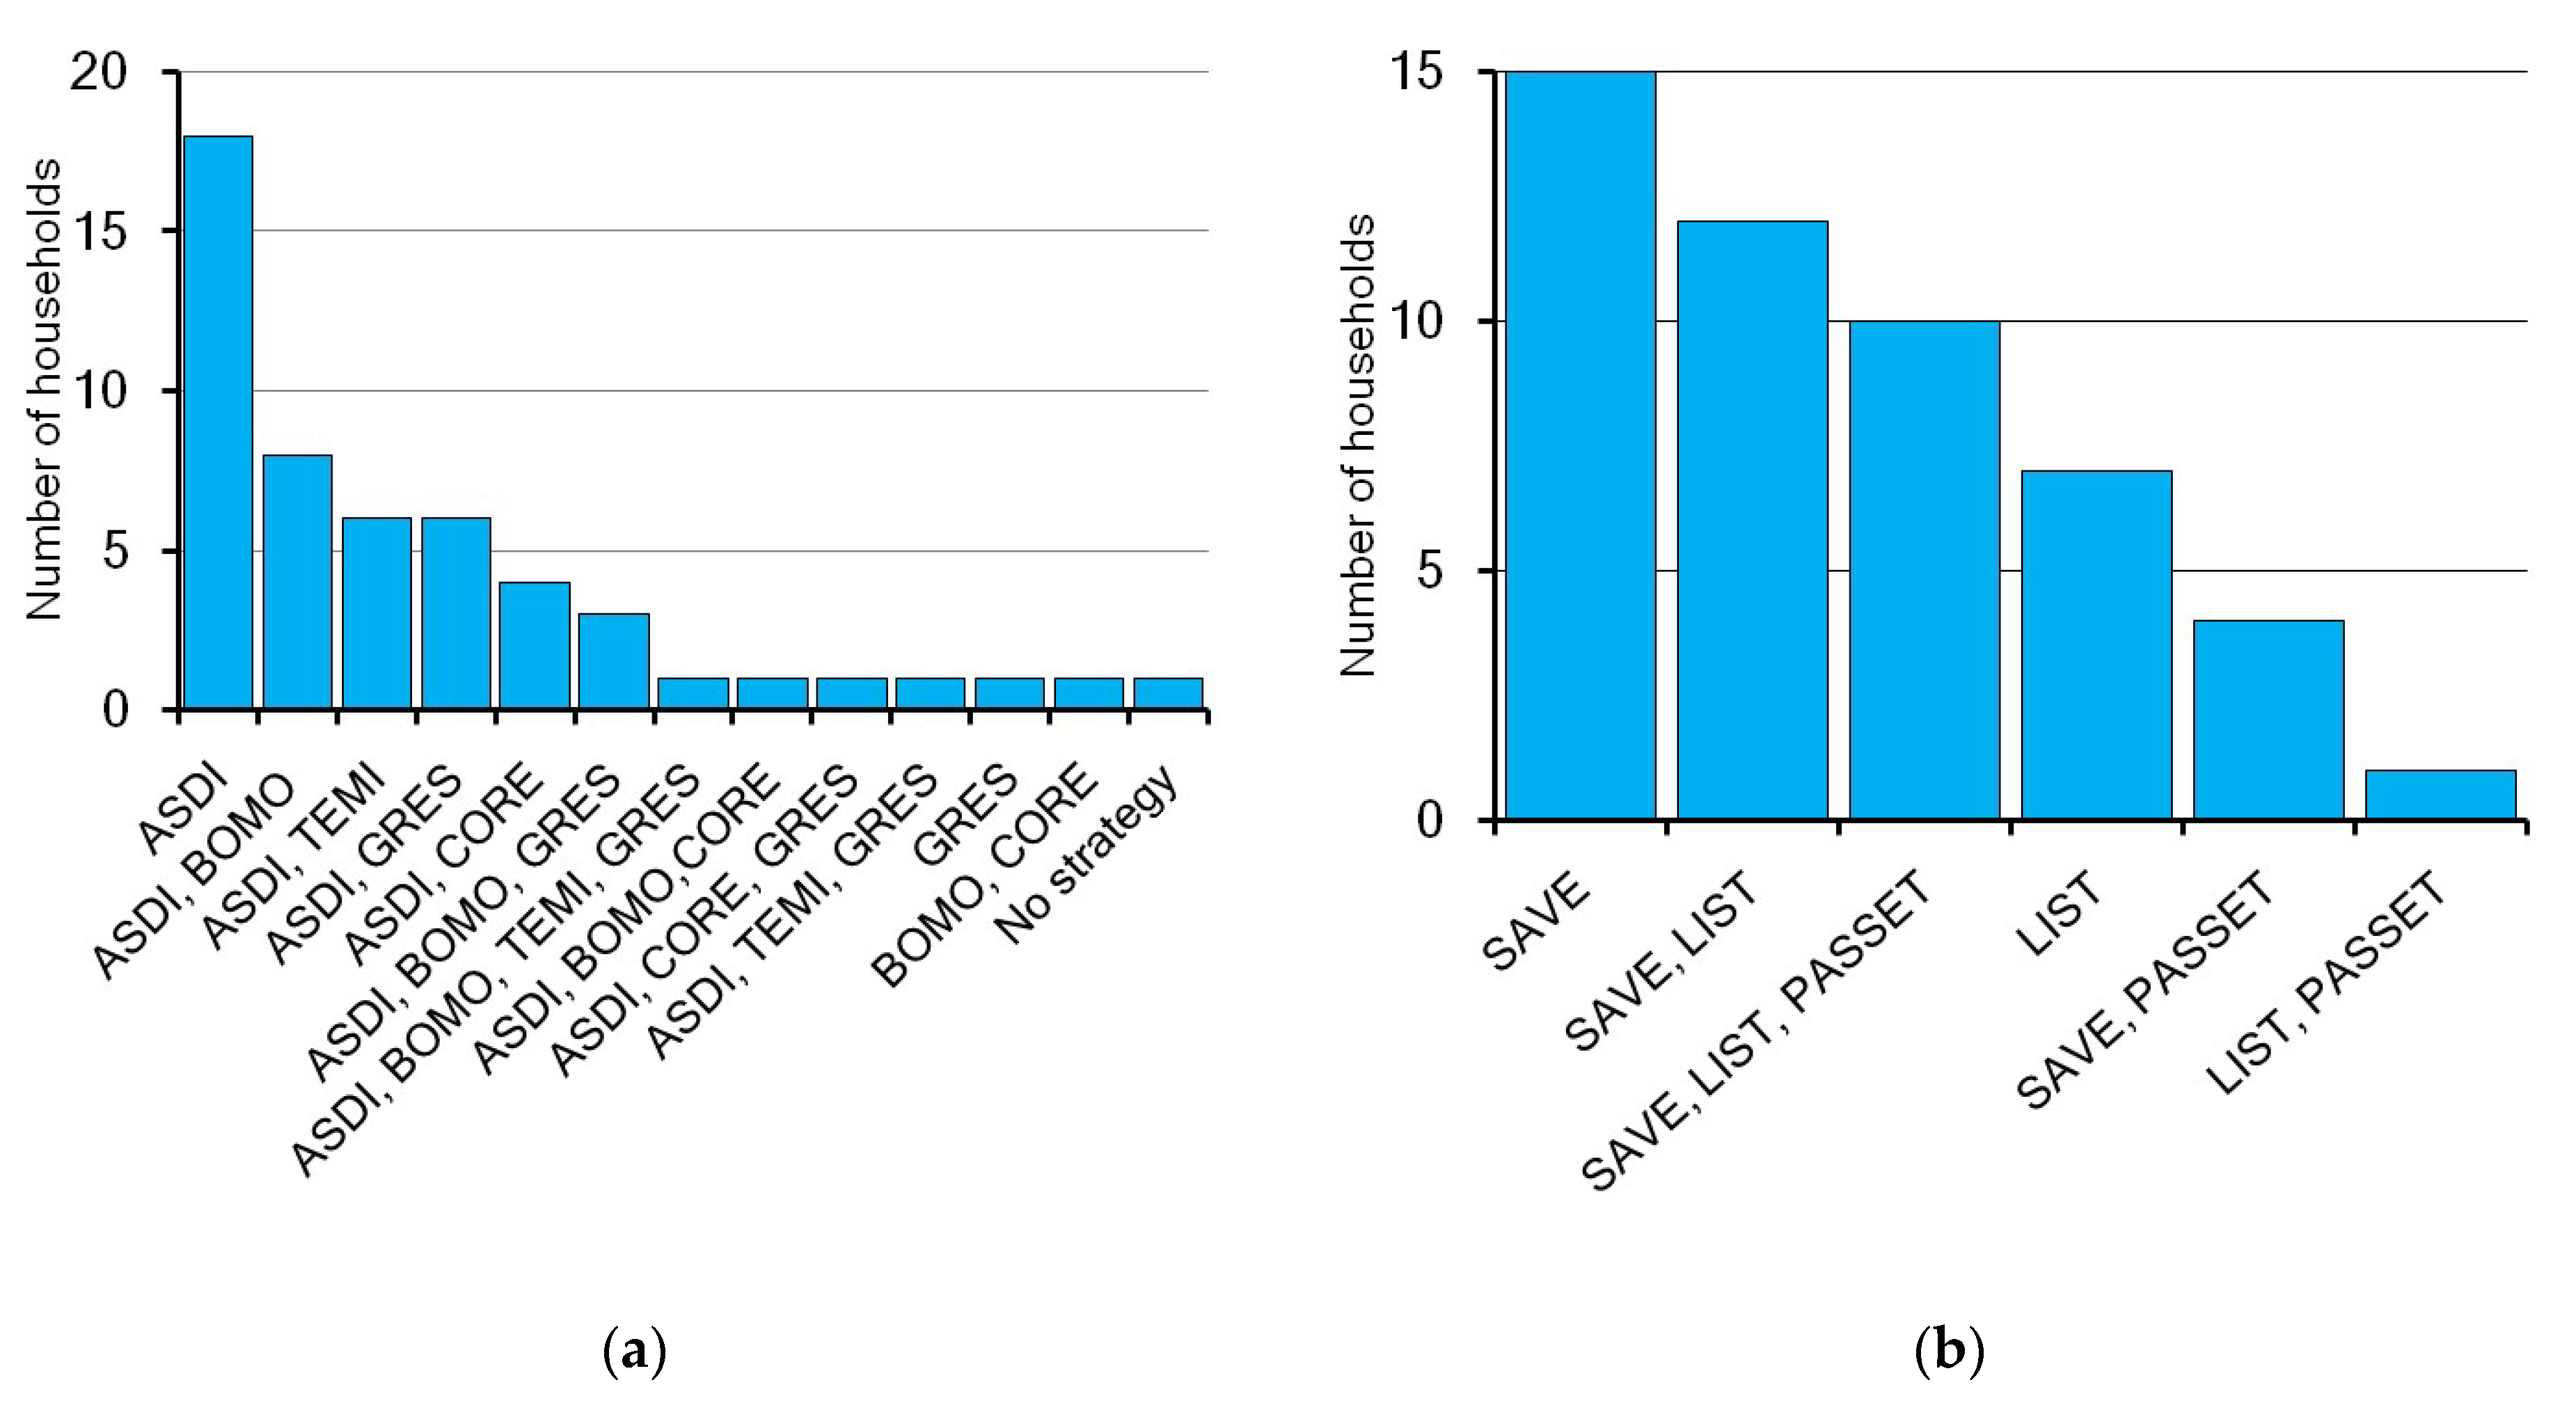
4.2. Household-Level Coping Strategies

Households adopted a mix of coping strategies to respond to flood disaster. Table 3 provides a combination of five major categories of coping strategies employed by households to respond and recover from the impact of the last flood. The majority of the households adopted two or three strategies. Adopting four or five strategies were less common. When adopting one strategy, assets disposal was the most preferred, while temporary migration was the least preferred option. However, households adopt a particular coping strategy based on the impact level of the disaster and the availability of an individual’s networks.
Coping strategies within the borrowing category had mixed outcomes (Figure 2). Among the respondents, 16% borrowed money from formal sources (NGO/bank), 66% took interest-free loans from their friends or relatives, and 27% borrowed money from local money lenders. In extreme situations, some of the households borrowed money either by selling labor in advance (9%), selling crops in advance (9%), or both (2%). Further investigation found that the majority (72 out of 73) of households that adopted these kinds of erosive strategies faced inundation of their houses during the last flood. There is also a sequence of adopting a particular coping strategy [57], as FGD participants from the Belka informed: “we first use up our own savings. When we finish our savings, we try to ask our relatives for help. If we fail to get assistance from our friends, relatives, or neighbors, we then approach the local money lender to borrow money from them. Sometimes, we take loans from NGOs but we rarely seek a bank loan.” Regardless of the source, 85% of the households borrowed money from at least one in order to cope with flood (Table 3). Our findings are consistent with Ref. [14,17], where they found borrowing was the most common coping strategy among flood affected households in Bangladesh.
Around 73% of the households adopted at least one assets disposal strategy to cope with flood (Table 3). In this case, 43% of the households sold their livestock and around 11% sold their productive assets (Figure 2). More than half of the respondents (59%) spent their savings to cope with flood. This result is in the line with the discussion of Ref. [19,57] that reported households dispose of their assets in several phases, with liquid assets (e.g., livestock, personal possessions) disposal first, and productive assets later.
Around 29% of the households reduced their daily consumption through starvation or meal skipping and 34% received grants from external sources (Table 3). However, a higher proportion of households from Purbachhatnai received external support compared to other regions (Figure 2). In the context of temporary migration of male members outside of flood-prone regions, 23% of the households adopted this strategy (Table 3).

4.3. Determinants of Coping Strategies

The results of the logistic regression models are presented in Table 4 (details are in Appendix A Table A2). Prior to the analysis, multicollinearity among the independent variables was verified using a correlation analysis (correlation matrix presented in Appendix A Table A3). Hosemer and Lemeshew chi-square test was non-significant for all models, suggesting that the models are fit for predictions.
The Hazard Component
The results indicated that increasing floodwater depth increases the probability of adopting consumption reduction strategy. This may be due to the reduced livelihood opportunities during flood. Indeed, when floods hit, the ability of a wage laborer household to purchase food decrease as a result of wage reduction [21,58]. Another reason might be related to limited dry places for cooking or to wet firewood, exemplified by the majority of the respondents (72%), who said that their firewood was wet due to floodwater, and by one female respondent from Gajaghanta, who stated “when flood water enters our room, we cannot cook our food due to the unavailability of dry places in our house. Therefore, we need to skip one or two meals a day”. This finding was supported by other studies [15,17,28], which reported that flooded households have to starve, skip meals, or eat less food during flood. However, the relationship between borrowing money and depth of flood was negative and insignificant. Our study findings contradict the results of Ref. [17] which found positive and significant relation between borrowing decisions and height of flood.
The Exposure Component
The results revealed that likelihood of borrowing money was higher for the houses located within 1000 m from the riverbank than those farther away. This may be because proximity to river is associated with an increased level of flood risk, which may result in higher flood damage [21,25]. This finding was partially consistent with Ref. [59], who reported that people living near the riverbank were more prone to borrowing. Apart from borrowing, the probability of receiving grants from external sources increased with the house proximity to the riverbank than their counterparts. The findings were supported by previous research, which indicated that emergency aid was targeted to those households who were exposed to flooding in 1998 in Bangladesh [60]. However, a vast majority of the households in our study were still out for getting grants from external sources during emergency. As one respondent from Belka shared, “My house was flooded for around 15 days, but I did not receive any support either from the government or NGOs.” This may be because road communication systems in the study area are not well-developed and they inundate, causing many places to become hard to reach without a boat. Previous research by Ref. [61] reported that people residing near marketplaces received more external support after a cyclone than those living far away, in the coastal zone of Bangladesh.
On the other hand, disposal of assets was negatively associated with location of house, which implies that households located within 1000 m were less likely to dispose their assets compared to their counterparts. This is because these households had limited cash saving to be used during disaster.
Floods generate a vicious cycle of impacts on the exposed people. For example, in flood-affected areasfood prices increase, while job opportunities for wage laborers reduce. In this complex situation, if a family member suffers from a disease, households have to adopt a variety of coping strategies. The results suggested that having ill members affected by communicable diseases in the family increased the probability of adopting borrowing money and temporary migration than who were not affected. This highlights their risk-averseness, as illness entails the need of immediate cash for the preventive and curative care of people struck by illness. These findings are consistent with Ref. [24] where they reported that household who experienced disease were more likely to adopt current adjustment (e.g., adjustment to meals, migrate to sale labor) and unsecured borrowing (e.g., borrow from relatives/moneylenders) measures. In a study conducted by Ref. [23], on choices of post-earthquake coping responses in Nepal, it was found that household that experienced health damage was engaged in borrowing cash and advance labor sale as a compensation strategy. Our result was also partially supported by Ref. [62], who reported that households with ill members in Uganda tend to borrow money in the face of shocks.
The Vulnerability Component
Age increasing gradually reduces the physical capacity and thus increases the vulnerability of the household. A negative and significant coefficient of age implies that increase in household head’s age reduced the likelihood of borrowing money. Previous studied also reported that borrowing was a less practiced coping option among aged people [16,17,59]. One respondent in his 80s from Gajaghanta shared his experience of why he did not borrow money: “I am an aging person with limited income. Nobody wants to lend me money as I might not be able to return it.” A related finding was also reported by Ref. [4] with reference to flood in rural India, where they found that older people are less willing to depend on monetary transfers from relatives and friends, as compared to younger. Post-disaster temporary migration was also found lower among aged people. This is due to the level of functional fitness, which decreases with age [63], making elderly people very cautious in taking decisions on temporary migration. Moreover, the demand for youths in urban labor markets discourages aged people in making migration decisions in Bangladesh [29]. One respondent in his 70s shared that “when I was young, I went outside of this flood-prone area to find employment. However, now I do not search for jobs outside this area, because my physical conditions do not permit me to go outside for work”.
The negative coefficient of female presented that female headed households (FHH) were less likely to borrow money as compared to male headed households. This may be because majority of FHH in this study had insufficient assets, such as being landless (80% of FHH), unable to save crops (95% of FHH), lacking cooperation from their neighborhood during flood (90% of FHH), and limited access to financial institutions (90% of FHH). Existing literature suggested that FHH rely less on borrowing [17,47,64] since people assess women as having limited capabilities of repayment [28]. Furthermore, FHH were less likely to receive grants from external sources and preferred to reduce their consumption rather than employing asset disposal and temporary migration. However, these relationships were insignificant.
Agricultural land is an important natural asset for rural households. The results indicated that landless had a negative and significant relationship with asset disposal. This is true in the sense that majority of the surveyed household head’s were employed in agricultural sector and thus flood become a way of living for them. This finding was partially supported by Ref. [64] that reported households who owned land were more likely to sell their productive assets to cope better disaster. The probability of consumption reduction and temporary migration were significantly greater for the agricultural landless households than their counterparts. A possible explanation of these findings could be illustrated by the vulnerability of the households. In rural areas of Bangladesh, landless households have limited precautionary money savings and possess fewer productive assets with no cultivable lands. Since rural areas have limited job opportunities, landless people temporarily migrate outside of flood prone areas to provide for their household consumption. These findings were in the line with the finding of Ref. [64], where they reported that agricultural landholders were less likely to migrate to city/town. In a study undertaken by Ref. [16] on cyclones and storm surges in Bangladesh, it was found that landless households reduced their consumption and had fewer assets to dispose. However, this study did not find any significant relation between land ownership and borrowing, as reported by Ref. [4].
The Capacity Component
Precautionary crop-save had a significant positive relation with temporary migration and a negative relation with consumption reduction. This signifies that households that saved crops were less likely to reduce their consumption. One informant narrated, “I faced financial problems after the last flood. However, I could easily recover since I had nuts on the land. After the flood water receded, I harvested nuts and sold them in the market, which provided me with instant cash to purchase food for our family.” However, the likelihood of temporary migration was significantly greater for the households that saved crops than their counterparts, implying that households that saved crops were risk averse. Therefore, instead of reducing consumption, they preferred temporary migration in response to disaster. The findings however contradict the studies of Ref. [15], who claimed that migration is the last option for the flood affected people.
Mobile phone improves information flow and communication among the members of a family or of a social network. In this study, we found ownership of mobile phone had significant positive relationships with borrowing money. This could be because mobile phone seems to be an important factor to keep touch with friends/relatives and ask for financial assistance at the time of disaster. For instance, majority of the households who possess mobile phone borrowed money from their relatives/friends (219 out of 320). Similarly, ownership of mobile phone significantly and positively influenced households’ decision on migration. This may be because mobile phone facilitates to have a social connection with migrants who are living in their targeted destinations [12], which, in turn, helps them take decisions on migration. Consistent with our findings, Ref. [65] reported that mobile phones are helpful to make decisions on migration in a more coordinated way.
Households that undertook mitigation strategies were less likely to reduce their consumption than their counterparts. This may be due to the fact that household who had precautionary crop save they implemented mitigation measures. On the contrary, a positive significant relationship between mitigation strategies and temporary migration indicated that households that implemented mitigation strategies preferred to choose temporary migration. Regardless of the socio-economic status, the majority of the households (78.39%) that suffered damage in the last flood implemented mitigation strategies. This is due to the fact that households living near the riverbank are more prone to implement mitigation strategies.
The results suggested that having income from nonfarm sources reduced a probability of borrowing money and increased a probability of assets disposal. This may be due to the fact that agriculture is likely to be more affected by floods as compared to the non-agricultural income [55], and thus nonfarm income ensures consistent cash flow for the households. Among the surveyed households, nonfarm income was mostly concentrated whose income was more than 10,000 BDT per month. This means nonfarm income is linked with economic well-being and precautionary savings. These findings were partially consistent with Ref. [64] who reported that household’s with income from non-agricultural sources were more prone to sell their livestock during emergency. Previous research by Ref. [58] found that nonfarm income provided effective insurance to the typhoon affected households in Philippines.
The coefficient of location dummies indicated that households from Belka were more likely to adopt assets disposal strategy rather than borrowing money, consumption reduction and temporary migration. This is because majority of the households from Belka have shown their interest to rear livestock which serves as a precautionary saving for liquidity purposes during a flood disaster [11,13]. The results also indicated that if a house was located within 1000 m from the riverbank and in Gajaghanta and/or Belka there was a lower chance to get support from external sources.

4.4. Association between Coping Strategies and Post-Disaster Recovery

This section examined the association between coping strategies and post-disaster recovery. Only 14% of the households (52 out of 377) reported that they were able to recover from the impact of the last flood in 2017. This is because recover from the impacts of recurrent floods are difficult for the riverine people [27].
Findings revealed that the proportion of households who borrowed money was lower among those who recovered than those not recovered (26.9% versus 94.8%) (Table 5). This could be because households that already had debt during the interview (192 out of 204), adopted borrowed money strategy as a mean of coping, thus becoming trapped in a “vicious cycle of borrowing” [16] which, in turn, reduced the capacity to recover from flood disasters. Similarly, 13.5% households who recovered adopted consumption reduction strategy, versus 31.1% in other group (p = 0.008, OR = 0.35). Grants from external sources did not have significant effects on recovery. This finding is consistent with the findings Ref. [48].
Surprisingly, the majority of the households (49 out of 52) reported to have recovered resorting to either assets disposal or a combination of assets disposal with other coping strategies (Figure 3a). It is apparent from Figure 3b that most of the households reporting recovery adopted either SAVE or combination of SAVE and other strategies. However, the households that adopted only the PASSET measure were unable to recover. This may be partly due to the long-term adaptation and accumulative learning to survive with repeated flood events of the surveyed households.One of the informants from Belka shared his strategy to cope with flood: “I used to sell a cow after a flood. I usually purchase cows in Kartik (October to November) and raise them till Joystho (May to June). In Joystho, there is plenty of grass in here, which helps fatten cows. For example, I purchase a cow at BDT 30,000 and, after eight months of fattening, I can sell it for BDT 50,000. Sometimes, I need to sell tress, even nuts and paddy to cope with the flood”. Tran [47] argued that coping strategies often help poor households recover better from the losses.

5. Conclusions

This paper has identified the determinants of post-disaster coping strategies and role household’s coping strategies in recovering from the impact of a severe flood in northern Bangladesh that took place in 2017. The findings indicated that the majority of households adopted a combination of post-disaster coping strategies. While borrowing money was used by the exposed households to cope with floods, they (borrowing money) were not preferred choices by the demographically vulnerable households especially if the head of the household was aged person or female. Assets disposal was preferred by the households who had income from nonfarm sources; however, vulnerable households were less likely to dispose of their assets. Households that recovered from 2017 flood disaster seek insurance through their own savings and available physical assets (e.g., livestock, plants). However, grants from external sources did not have significant effects on household’s recovery from the flood disaster.
This study provided useful recommendation to increase the adaptive capacity of riverine households. The most effective interventions could be related to the diversification of livelihoods via promoting livestock rearing, self-employment in nonfarm activities, which, in turn, will help increase the capacity of households to absorb flood shock, thus recovering from disaster. Targeted interventions are required for the vulnerable group particularly female headed households, aging people, and agricultural landless. Post-disaster relief should be given to those vulnerable households that experience greater losses and are unable to recover without support from external sources. Emphasis should be given to ensure the minimum food intake and provide adequate public health support to the destitute people during the emergency period.
This study has some limitations. It presents one case from the right bank of Teesta River in Bangladesh, which may not be representative for the whole northern region/country. Another limitation is the self-reported measures of the coping strategies and recovery indicator, which may be a potential source for response bias. This is a cross-sectional study and addressed one point of time. There was another flood in 2020. Replication of this study in the same location might provide crucial information about how repeated flooding events influence household’s adaptive capacity.

Author Contributions

Conceptualization, M.S.H.M., T.M. and S.N.; methodology, M.S.H.M. and T.M.; formal analysis, M.S.H.M.; writing—original draft preparation, M.S.H.M.; writing—review and editing, M.S.H.M. and T.M.; visualization, M.S.H.M.; supervision, T.M. and S.N. All authors have read and agreed to the published version of the manuscript.

Funding

This research received no external funding.

Institutional Review Board Statement

This study was approved by the Tokyo Institute of Technology Human Ethics Committee.

Informed Consent Statement

Informed consent was obtained from all subjects involved in the study.

Data Availability Statement

The data presented in this study are available on request from the corresponding author.

Acknowledgments

The first author is supported by the “JICA Innovative Asia” programme, whose support is gratefully acknowledged. The authors are extremely thankful to the respondents and local stakeholders for their support during the entire period of field survey. Special thanks to Shakil Ahmed, Atowar Hossain, Zahid, and Aysha Begum, who helped a lot during the community engagement processes. Further, we would like to thank to our survey team members for conducting interviews during April and May 2019.

Conflicts of Interest

The authors declare no conflict of interest.

Appendix A

Table A1. Coping Strategies Included in the Questionnaire.
Groups Measures
Borrowing moneyBorrowed money from NGOs
Borrowed money from local money lenders
Borrowed money from relatives
Borrowed money from friends
Borrowed money from banks
Borrowed money by selling labor in advance
Borrowed money by selling crops in advance
Assets disposalSold poultry (livestock)
Sold cattle (livestock)
Sold goats (livestock)
Sold household’sgoods (household assets)
Sold/leased out jewelry (household assets)
Sold/leased out lands (household assets)
Sold crops (household assets)
Sold trees (household assets)
Spent previous savings
Consumption reduction Starvation/meal skipping during flood
Temporary migrationTemporary migration for work
Grants from external sources Received emergency support from NGOs
Received emergency support from government
Received emergency support from local elites
Table A2. Details of the Determinants of Post-Disaster Coping Strategies.
Explanatory Variables Dependent Variable: Borrowing MoneyDependent Variable: Assets DisposalDependent Variable: Consumption ReductionDependent Variable: Temporary MigrationDependent Variable: Grants from External Sources
B aExp(B) bB aExp(B) bB aExp(B) bB aExp(B) bB aExp(B) b
Floodwater depth−0.97
(0.70)
0.38
[0.10, 1.48]
−0.94
(0.55)
0.39
[0.13, 1.15]
2.25 ***
(0.58)
9.46
[3.05, 29.36]
−0.26
(0.57)
0.77
[0.25, 2.35]
−0.48
(0.52)
0.62
[0.23, 1.71]
Location of house1.09 ***
(0.39)
2.98
[1.40, 6.36]
−0.86 *
(0.43)
0.42
[0.18, 0.97]
0.35
(0.41)
1.42
[0.64, 3.17]
0.0
6(0.37)
1.06
[0.51, 2.21]
0.85 *
(0.39)
2.34
[1.08, 5.07]
Affected by disease0.99 *
(0.43)
2.68
[1.16, 6.18]
−0.80
(0.46)
0.45
[0.18, 1.11]
0.77
(0.46)
2.15
[0.87, 5.32]
1.28 *
(0.52)
3.59
[1.31, 9.87]
0.53
(0.38)
1.71
[0.82, 3.56]
Age−0.03 *
(0.01)
0.97
[0.95, 1.00]
0.00
(0.01)
1.00
[0.98, 1.02]
−0.01
(0.01)
0.99
[0.97, 1.01]
−0.02 *
(0.01)
0.98
[0.96, 1.00]
0.01
(0.01)
1.01
[0.99, 1.02]
Female−1.62 **
(0.59)
0.20
[0.06, 0.64]
−0.24
(0.52)
0.79
[0.28, 2.19]
0.08
(0.55)
1.08
[0.37, 3.20]
−0.37
(0.70)
0.69
[0.18, 2.75]
−0.16
(0.57)
0.85
[0.28, 2.57]
Agricultural landless0.12
(0.34)
1.13
[0.58, 2.22]
−1.12 ***
(0.28)
0.33
[0.19, 0.56]
1.00 ***
(0.29)
2.71
[1.55, 4.75]
0.95 ***
(0.28)
2.58
[1.49, 4.47]
−0.08
(0.25)
0.93
[0.56, 1.53]
Crop save−0.22
(0.37)
0.80
[0.39, 1.66]
0.48
(0.33)
1.62
[0.84, 3.11]
−1.76 ***
(0.42)
0.17
[0.08, 0.39]
0.84 ***
(0.29)
2.31
[1.31, 4.09]
−0.21
(0.28)
0.81
[0.46, 1.41]
Mobile phone0.89 *
(0.43)
2.44
[1.06, 5.63]
0.28
(0.34)
1.32
[0.67, 2.59]
−0.02
(0.36)
0.98
[0.49, 1.97]
1.07 *
(0.49)
2.92
[1.11, 7.63]
−0.22
(0.36)
0.80
[0.40, 1.62]
Mitigation measures0.08
(0.41)
1.08
[0.49, 2.40]
0.28
(0.31)
1.33
[0.73, 2.42]
−0.80 **
(0.31)
0.45
[0.25, 0.83]
0.92 *
(0.41)
2.50
[1.13, 5.55]
0.46
(0.32)
1.58
[0.84, 2.97]
Nonfarm income−1.06 ***
(0.34)
0.35
[0.18, 0.67]
0.77 **
(0.31)
2.16
[1.19, 3.94]
−0.47
(0.31)
0.63
[0.34, 1.15]
−0.09
(0.29)
0.91
[0.52, 1.61]
−0.20
(0.27)
0.82
[0.49, 1.39]
Gajaghanta−0.36
(0.57)
0.70
[0.23, 2.12]
0.34
(0.37)
1.41
[0.68, 2.92]
−0.53
(0.40)
0.59
[0.27, 1.28]
−0.34
(0.38)
0.71
[0.34, 1.51]
−1.86 ***
(0.36)
0.16
[0.08, 0.31]
Belka−1.05
(0.57)
0.35
[0.12, 1.07]
1.18 ***
(0.40)
3.25
[1.49, 7.08]
−1.53 ***
(0.43)
0.22
[0.09, 0.50]
−0.77
(0.40)
0.47
[0.21, 1.01]
−1.67 ***
(0.36)
0.19
[0.09, 0.38]
Constant2.31 *
(1.10)
10.07
2.20 *
(0.93)
9.03
−1.26
(0.93)
0.28
−3.28 ***
(1.06)
0.04
−0.55
(0.88)
0.58
Log Likelihood266.31317.096345.51354.186421.07
Wald Chi Square46.98165.077105.76748.25260.689
Cox & Snell R Square0.1170.1590.2450.1200.149
Nagelkerke R Square0.2080.2310.3500.1830.206
***, **, * imply significance at 0.1%, 1%, and 5% levels, respectively; a Standard errors in parenthesis; b 95% Confidence Interval for EXP(B) in parenthesis; Source: Authors’ calculations based on Field Survey, 2019 (N = 377).
Table A3. Correlation Matrix of Explanatory Variables.
abcdefghijkl
a. Floodwater depth1−0.0360.196 **−0.0010.0880.1−0.059−0.210 **−0.154 **−0.137 **0.158 **0.058
b. Location of house 1−0.067−0.0360.0680−0.0710.005−0.0310.022−0.115 *−0.027
c. Affected by disease 10.070.0280.0390.006−0.0850.006−0.102 *0.003−0.043
d. Age 10.036−0.0740.038−0.0810.0050.111 *0.136 **−0.164 **
e. Female 10.150 **−0.118 *−0.230 **−0.0880.058−0.033−0.121 *
f. Agricultural landless 1−0.170 **−0.229 **−0.189 **0.0130.062−0.031
g. Crop save 10.174 **0.157 **0.138 **0.015−0.035
h. Mobile phone 10.139 **0.048−0.0020.058
i. Mitigation measures 10.104 *−0.0560.033
j. Nonfarm income 10.093−0.166 **
k. Gajaghanta 1−0.694 **
l. Belka 1
***, **, * imply significance at 0.1%, 1%, and 5% levels, respectively; a Standard errors in parenthesis; b 95% Confidence Interval for EXP(B) in parenthesis; Source: Authors’ calculations based on Field Survey, 2019 (N = 377).

References

  1. Gotham, K.F.; Campanella, R.; Lauve-Moon, K.; Powers, B. Hazard experience, geophysical vulnerability, and flood risk perceptions in a postdisaster city, the case of New Orleans. Risk Anal. 2018, 38, 345–356. [Google Scholar] [CrossRef] [PubMed]
  2. CRED; UNISDR. The Human Cost of Weather-Related Disasters 1995–2015; Centre for Research on the Epidemiology of Disasters (CRED): Brussels, Belgium; United Nations Office for Disaster Risk Reduction (UNISDR): Geneva, Switzerland, 2015. [Google Scholar]
  3. Centre for Research on the Epidemiology of Disasters. The Interantional Disaster Database (EM-DAT). Available online: http://emdat.be (accessed on 14 January 2020).
  4. Patnaik, U.; Narayanan, K. Are traditional coping mechanisms effective in managing the risk against extreme events? Evidences from flood-prone region in rural India. Water Policy 2015, 17, 724–741. [Google Scholar] [CrossRef] [Green Version]
  5. Mondal, M.S.H. The implications of population growth and climate change on sustainable development in Bangladesh. Jàmbá J. Disaster Risk Stud. 2019, 11, 1–10. [Google Scholar] [CrossRef] [PubMed] [Green Version]
  6. NDRCC. Daily Disaster Situation: 12 September 2017; The National Disaster Response Coordination Centre (NDRCC), Department of Disaster Management: Dhaka, Bangladesh, 2017. [Google Scholar]
  7. Philip, S.; Sparrow, S.; Kew, S.; Van Der Weil, K.; Wanders, N.; Singh, R.; Hassan, A.; Mohammed, K.; Javid, H.; Haustein, K.; et al. Attributing the 2017 Bangladesh floods from meteorological and hydrological perspectives. Hydrol. Earth Syst. Sci. 2019, 23, 1409–1429. [Google Scholar] [CrossRef] [Green Version]
  8. Gros, C.; Bailey, M.; Schwager, S.; Hassan, A.; Zingg, R.; Uddin, M.M.; Shahjahan, M.; Islam, H.; Lux, S.; Jaime, C.; et al. Household-level effects of providing forecast-based cash in anticipation of extreme weather events: Quasi-experimental evidence from humanitarian interventions in the 2017 floods in Bangladesh. Int. J. Disaster Risk Reduct. 2019, 41, 101275. [Google Scholar] [CrossRef]
  9. Smith, L.C.; Frankenberger, T.R. Does Resilience Capacity Reduce the Negative Impact of Shocks on Household Food Security? Evidence from the 2014 Floods in Northern Bangladesh. World Dev. 2018, 102, 358–376. [Google Scholar] [CrossRef]
  10. Kamal, A.S.M.M.; Shamsudduha, M.; Ahmed, B.; Hassan, S.M.K.; Islam, M.S.; Kelman, I.; Fordham, M. Resilience to flash floods in wetland communities of northeastern Bangladesh. Int. J. Disaster Risk Reduct. 2018, 31, 478–488. [Google Scholar] [CrossRef] [Green Version]
  11. Mondal, M.S.H.; Murayama, T.; Nishikizawa, S. Assessing the flood risk of riverine households: A case study from the right bank of the Teesta River, Bangladesh. Int. J. Disaster Risk Reduct. 2020, 51, 101758. [Google Scholar] [CrossRef]
  12. Sultana, P.; Thompson, P.M.; Wesselink, A. Coping and resilience in riverine Bangladesh. Environ. Hazards 2019, 19, 70–89. [Google Scholar] [CrossRef]
  13. Siegel, P.B.; Alwang, J. An Asset-Based Approach to Social Risk Management: A Conceptual Framework; The World Bank: Washington, DC, USA, 1999. [Google Scholar]
  14. Del Ninno, C.; Dorosh, P.A.; Smith, L.C. Public policy, markets and household coping strategies in Bangladesh: Avoiding a food security crisis following the 1998 floods. World Dev. 2003, 31, 1221–1238. [Google Scholar] [CrossRef]
  15. Paul, S.K.; Routray, J.K. Flood proneness and coping strategies: The experiences of two villages in Bangladesh. Disasters 2010, 34, 489–508. [Google Scholar] [CrossRef] [PubMed]
  16. Paul, S.K.; Routray, J.K. Household response to cyclone and induced surge in coastal Bangladesh: Coping strategies and explanatory variables. Nat. Hazards 2011, 57, 477–499. [Google Scholar] [CrossRef]
  17. Sultana, N.; Rayhan, M.I. Coping strategies with floods in Bangladesh: An empirical study. Nat. Hazards 2012, 64, 1209–1218. [Google Scholar] [CrossRef]
  18. Adams, A.M.; Cekan, J.; Sauerborn, R. Towards a conceptual framework of household coping: Reflections from rural West Africa. Africa 1998, 68, 263–283. [Google Scholar] [CrossRef]
  19. Frankenberger, T.R. Indicators and data collection methods for assessing household food security. In Household Food Security: Concepts, Indicators, Measurements: A Technical Review; Maxwell, S., Frankenberger, T.R., Eds.; UNICEF: New York, NY, USA; IFAD: Rome, Italy, 1992. [Google Scholar]
  20. Shoji, M. How do the poor cope with hardships when mutual assistance is unavailable? Econ. Bull. 2008, 15, 1–17. [Google Scholar]
  21. Mavhura, E.; Manyena, S.B.; Collins, A.E.; Manatsa, D. Indigenous knowledge, coping strategies and resilience to floods in Muzarabani, Zimbabwe. Int. J. Disaster Risk Reduct. 2013, 5, 38–48. [Google Scholar] [CrossRef]
  22. Balgah, R.A.; Bang, H.N.; Fondo, S.A. Drivers for coping with flood hazards: Beyond the analysis of single cases. Jàmbá J. Disaster Risk Stud. 2019, 11, 1–9. [Google Scholar] [CrossRef]
  23. Rayamajhee, V.; Bohara, A.K. Natural Disaster Damages and Their Link to Coping Strategy Choices: Field Survey Findings from Post-Earthquake Nepal. J. Int. Dev. 2019, 31, 336–343. [Google Scholar] [CrossRef]
  24. Rashid, D.A.; Langworthy, M.; Aradhyula, S. Livelihood Shocks and Coping Strategies An Empirical Study of Bangladesh Households. In Proceedings of the American Agricultural Economics Association Annual Meeting, Long Beach, CA, USA, 23–26 July 2006. [Google Scholar]
  25. Brouwer, R.; Akter, S.; Brander, L.; Haque, E. Socioeconomic vulnerability and adaptation to environmental risk: A case study of climate change and flooding in Bangladesh. Risk Anal. Int. J. 2007, 27, 313–326. [Google Scholar] [CrossRef] [Green Version]
  26. Mondal, S.H.; Islam, S. Chronological trends in maximum and minimum water flows of the Teesta River, Bangladesh, and its implications. Jàmbá J. Disaster Risk Stud. 2017, 9, 1–11. [Google Scholar] [CrossRef] [Green Version]
  27. Ferdous, M.R.; Wesselink, A.; Brandimarte, L.; Slager, K.; Zwarteveen, M.; Di Baldassarre, G. The Costs of Living with Floods in the Jamuna Floodplain in Bangladesh. Water 2019, 11, 1238. [Google Scholar] [CrossRef] [Green Version]
  28. Ferdous, J.; Mallick, D. Norms, practices, and gendered vulnerabilities in the lower Teesta basin, Bangladesh. Environ. Dev. 2019, 31, 88–96. [Google Scholar] [CrossRef]
  29. Hutton, D.; Haque, C.E. Human Vulnerability, Dislocation and Resettlement: Adaptation Processes of River-bank Erosion-induced Displacees in Bangladesh. Disasters 2004, 28, 41–62. [Google Scholar] [PubMed]
  30. Jabeen, H.; Johnson, C.; Allen, A. Built-in resilience: Learning from grassroots coping strategies for climate variability. Environ. Urban. 2010, 22, 415–431. [Google Scholar] [CrossRef] [Green Version]
  31. Haque, A.N.; Dodman, D.; Hossain, M.M. Individual, communal and institutional responses to climate change by low-income households in Khulna, Bangladesh. Environ. Urban. 2014, 26, 112–129. [Google Scholar] [CrossRef]
  32. Mozumder, P.; Bohara, A.K.; Berrens, R.P.; Halim, N. Private transfers to cope with a natural disaster: Evidence from Bangladesh. Environ. Dev. Econ. 2009, 14, 187–210. [Google Scholar] [CrossRef]
  33. Alam, G.M.M.; Alam, K.; Mushtaq, S. Climate change perceptions and local adaptation strategies of hazard-prone rural households in Bangladesh. Clim. Risk Manag. 2017, 17, 52–63. [Google Scholar] [CrossRef]
  34. Sarker, M.N.I.; Wu, M.; Alam, G.M.M.; Shouse, R.C. Life in riverine islands in Bangladesh: Local adaptation strategies of climate vulnerable riverine island dwellers for livelihood resilience. Land Use Policy 2020, 94, 104574. [Google Scholar] [CrossRef]
  35. Alam, G.M.M.; Alam, K.; Mushtaq, S.; Sarker, M.N.I.; Hossain, M. Hazards, food insecurity and human displacement in rural riverine Bangladesh: Implications for policy. Int. J. Disaster Risk Reduct. 2020, 43, 101364. [Google Scholar] [CrossRef]
  36. Islam, M.R. Climate Change, Natural Disasters and Socioeconomic Livelihood Vulnerabilities: Migration Decision Among the Char Land People in Bangladesh. Soc. Indic. Res. 2018, 136, 575–593. [Google Scholar] [CrossRef]
  37. Alam, G.M.M.; Alam, K.; Mushtaq, S.; Clarke, M.L. Vulnerability to climatic change in riparian char and river-bank households in Bangladesh: Implication for policy, livelihoods and social development. Ecol. Indic. 2017, 72, 23–32. [Google Scholar] [CrossRef]
  38. Sarker, M.N.I.; Wu, M.; Alam, G.M.M.; Shouse, R.C. Livelihood Vulnerability of Riverine-Island Dwellers in the Face of Natural Disasters in Bangladesh. Sustainability 2019, 11, 1623. [Google Scholar] [CrossRef] [Green Version]
  39. Alam, G.M.M. Livelihood Cycle and Vulnerability of Rural Households to Climate Change and Hazards in Bangladesh. Environ. Manag. 2017, 59, 777–791. [Google Scholar] [CrossRef] [PubMed]
  40. Sarker, M.N.I.; Wu, M.; Alam, G.M.M.; Shouse, R.C. Livelihood diversification in rural Bangladesh: Patterns and determinants in disaster prone riverine islands. Land Use Policy 2020, 96, 104720. [Google Scholar] [CrossRef]
  41. Sarker, M.N.I.; Wu, M.; Alam, G.M.M.; Shouse, R.C. Livelihood resilience of riverine island dwellers in the face of natural disasters: Empirical evidence from Bangladesh. Land Use Policy 2020, 95, 104599. [Google Scholar] [CrossRef]
  42. Alam, G.M.M.; Alam, K.; Mushtaq, S.; Filho, W.L. How do climate change and associated hazards impact on the resilience of riparian rural communities in Bangladesh? Policy implications for livelihood development. Environ. Sci. Policy 2018, 84, 7–18. [Google Scholar] [CrossRef]
  43. Poussin, J.K.; Botzen, W.J.W.; Aerts, J.C.J.H. Factors of influence on flood damage mitigation behaviour by households. Environ. Sci. Policy 2014, 40, 69–77. [Google Scholar] [CrossRef]
  44. Abramson, D.M.; Stehling-Ariza, T.; Park, Y.S.; Walsh, L.; Culp, D. Measuring individual disaster recovery: A socioecological framework. Disaster Med. Public Health Prep. 2010, 4, S46–S54. [Google Scholar] [CrossRef] [Green Version]
  45. Chacowry, A.; McEwen, L.J.; Lynch, K. Recovery and resilience of communities in flood risk zones in a small island developing state: A case study from a suburban settlement of Port Louis, Mauritius. Int. J. Disaster Risk Reduct. 2018, 28, 826–838. [Google Scholar] [CrossRef]
  46. Akbar, M.S.; Aldrich, D.P. Social capital’s role in recovery: Evidence from communities affected by the 2010 Pakistan floods. Disasters 2018, 42, 475–497. [Google Scholar] [CrossRef]
  47. Tran, V.Q. Household’s coping strategies and recoveries from shocks in Vietnam. Q. Rev. Econ. Financ. 2015, 56, 15–29. [Google Scholar] [CrossRef]
  48. Francisco, J.P. Determinants of property damage recovery time amongst households affected by an extreme flood event in Metro Manila, Philippines. Jàmbá J. Disaster Risk Stud. 2014, 6, 1–10. [Google Scholar] [CrossRef] [Green Version]
  49. BBS. Population & Housing Census—2011: Community Report: Gaibandha/Nilphamari/Rangpur; Bangladesh Bureau of Statistics: Dhaka, Bangladesh, 2013. [Google Scholar]
  50. Davies, S. Are coping strategies a cop out? IDS Bull. 1993, 24, 60–72. [Google Scholar] [CrossRef] [Green Version]
  51. Merz, B.; Kreibich, H.; Schwarze, R.; Thieken, A. Assessment of economic flood damage. Nat. Hazards Earth Syst. Sci. 2010, 10, 1697–1724. [Google Scholar] [CrossRef]
  52. Yankson, P.W.K.; Owusu, A.B.; Owusu, G.; Boakye-Danquah, J.; Tetteh, J.D. Assessment of coastal communities’ vulnerability to floods using indicator-based approach: A case study of Greater Accra Metropolitan Area, Ghana. Nat. Hazards 2017, 89, 661–689. [Google Scholar] [CrossRef]
  53. Huong, N.T.L.; Yao, S.; Fahad, S. Assessing household livelihood vulnerability to climate change: The case of Northwest Vietnam. Hum. Ecol. Risk Assess. Int. J. 2018, 25, 1157–1175. [Google Scholar] [CrossRef]
  54. UNDRR. Terminology on Disaster Risk Reduction; United Nations Office for Disaster Risk Reduction: Geneva, Switzerland, 2017. [Google Scholar]
  55. Hahn, M.B.; Riederer, A.M.; Foster, S.O. The Livelihood Vulnerability Index: A pragmatic approach to assessing risks from climate variability and change—A case study in Mozambique. Glob. Environ. Chang. 2009, 19, 74–88. [Google Scholar] [CrossRef]
  56. Azen, R.; Walker, C.M. Categorical Data Analysis for the Behavioral and Social Sciences; Routledge: New York, NY, USA, 2011. [Google Scholar]
  57. Corbett, J. Famine and household coping strategies. World Dev. 1988, 16, 1099–1112. [Google Scholar] [CrossRef]
  58. Sakai, Y.; Estudillo, J.P.; Fuwa, N.; Higuchi, Y.; Sawada, Y. Do Natural Disasters Affect the Poor Disproportionately? Price Change and Welfare Impact in the Aftermath of Typhoon Milenyo in the Rural Philippines. World Dev. 2017, 94, 16–26. [Google Scholar] [CrossRef] [Green Version]
  59. Hyder, A.; Iqbal, N. Socio-Economic Losses of Flood and Household’s Coping Strategies: Evidence from Flood Prone District of Pakistan; Pakistan Instituteof Development Economics: Islamabad, Pakistan, 2016. [Google Scholar]
  60. Paul, B.K. Relief assistance to 1998 flood victims: A comparison of the performance of the government and NGOs. Geogr. J. 2003, 169, 75–89. [Google Scholar] [CrossRef]
  61. Mallick, B.; Rahaman, K.R.; Vogt, J. Coastal livelihood and physical infrastructure in Bangladesh after cyclone Aila. Mitig. Adapt. Strat. Glob. Chang. 2011, 16, 629–648. [Google Scholar] [CrossRef]
  62. Lawson, D.; Kasirye, I. How the Extreme Poor Cope with Crises: Understanding the Role of Assets and Consumption. J. Int. Dev. 2013, 25, 1129–1143. [Google Scholar] [CrossRef]
  63. Tomás, M.T.; Galán-Mercant, A.; Carnero, E.A.; Fernandes, B. Functional capacity and levels of physical activity in aging: A 3-year follow-up. Front. Med. 2018, 4, 244. [Google Scholar] [CrossRef] [PubMed]
  64. Bhattacharjee, K.; Behera, B. Determinants of household vulnerability and adaptation to floods: Empirical evidence from the Indian State of West Bengal. Int. J. Disaster Risk Reduct. 2018, 31, 758–769. [Google Scholar] [CrossRef]
  65. Boas, I. Social networking in a digital and mobile world: The case of environmentally-related migration in Bangladesh. J. Ethn. Migr. Stud. 2020, 46, 1330–1347. [Google Scholar] [CrossRef]
Figure 1. Map of the study area.
Climate 09 00004 g001
Figure 2. Geographical variations of post-disaster coping strategies in the study area (Source: Field Survey, 2019). Note: + Coping strategies within borrowing money category; * Coping strategies within assets disposal category.
Climate 09 00004 g002
Figure 3. (a) Recovered from last flood and adopted ex-post coping strategies (n = 52). (b) Recovered from last flood and assets disposal category (n = 49). Note: BOMO: Borrowing money; ASDI: Assets disposal; CORE: Consumption reduction; TEMI: Temporary migration; GRES: Grants from external sources; SAVE: Disposal of previous savings; LIST: Sold livestock; PASSET: Sold productive assets (Source: Field Survey, 2019).
Climate 09 00004 g003
Table 1. Study area and population size (Source: Bangladesh Bureau of Statistics [49]).
DistrictUpazilaUnionTotal HouseholdsSample Households
NilphamariDimlaPurbachhatnai343568
RangpurGangacharaGajaghanta7929158
GaibandhaSundarganjBelka7608151
Total18,972377
Table 2. List ofvariables used in this study (Source: Field Survey, 2019).
VariablesDescription MeanSD
Floodwater depth Height of floodwater inside the home (continuous)2.121.03
Location of house Location of home within 1000 m from the riverbank: yes = 1, otherwise = 00.850.36
Affected by diseaseFamily members infected by communicable disease in the last 5 years due to flood: yes = 1, otherwise = 00.860.35
Age Age of household head (in years) 48.9314.15
Female Female headed household: yes = 1, otherwise = 00.050.22
Agricultural landlessHousehold does not have agricultural lands: yes = 1, otherwise = 00.480.50
Crop saveHousehold has precautionary crop savings: yes = 1, otherwise = 00.270.45
Mobile phone Household has informational device at home: yes = 1, otherwise = 00.850.36
Mitigation measures Household has taken at least one structural mitigation measure to prevent a flood disaster: yes = 1, otherwise = 00.800.40
Nonfarm income Household has a non-farm income source: yes = 1, otherwise = 00.330.47
GajaghantaHousehold lived in Gajaghanta: yes = 1, otherwise = 00.420.49
BelkaHousehold lived in Belka: yes = 1, otherwise = 00.400.49
Table 3. Combination of five major ex-post coping strategies (Source: Field Survey, 2019 [N = 377]).
Coping StrategiesNumber of Coping Strategies% of Households
123450
BOMO 🟂🟂🟂🟂🟂 🟂 85%
ASDI 🟂 🟂🟂🟂🟂 73%
CORE 🟂🟂🟂🟂 29%
TEMI 🟂 🟂 🟂🟂 23%
GRES 🟂🟂🟂 🟂🟂 34%
Number of households152242982391147739491282821241291593
Note: BOMO: Borrowing money; ASDI: Assets disposal; CORE: Consumption reduction; TEMI: Temporary migration; GRES: Grants from external sources.
Table 4. Determinants of post-disaster coping strategies.
Explanatory VariablesDependent Variable
Borrowing MoneyAssets DisposalConsumption ReductionTemporary MigrationGrants from External Sources
Floodwater depthn.sn.s(2.25) *** n.sn.s
Location of house(1.09) *** (−0.86) *n.sn.s (0.85) *
Affected by disease(0.99) * n.sn.s(1.28) *n.s
Age(−0.03) *n.sn.s(−0.02) *n.s
Female(−1.62) ** n.sn.sn.sn.s
Agricultural landlessn.s(−1.12) ***(1.00) ***(0.95) ***n.s
Crop saven.sn.s(−1.76) ***(0.84) ***n.s
Mobile phone(0.89) * n.sn.s(1.07) *n.s
Mitigation measuresn.sn.s(−0.80) **(0.92) *n.s
Nonfarm income(−1.06) *** (0.77) **n.sn.sn.s
Gajaghantan.sn.sn.sn.s(−1.86) ***
Belkan.s(1.18) ***(−1.53) ***n.s(−1.67) ***
Constant(2.31) * (2.20) *(−1.26)(−3.28) ***(−0.55)
Note: Unstandardized coefficients in parenthesis. “n.s” denotes non-significant. ***, **, * imply significance at 0.1%, 1%, and 5% levels, respectively. Source: Authors’ calculations based on Field Survey, 2019 (N = 377).
Table 5. Comparison of coping strategies and recovery from flood disaster.
Coping Strategies VariablesRecovered from Last Flood Disaster
Yes (N = 52)No (N = 325)OR [CI] (N = 3377)
% of households borrowed money26.994.80.02 * [0.01–0.05]
% of households disposed assets94.270.26.95 * [2.12–22.84]
% of households reduced consumption13.531.10.35 * [0.15–0.79]
% of households migrated temporarily 15.423.70.60 [0.26–1.30]
% of households received grants from external sources25.035.10.62 [0.32–1.20]
* p value significant (<0.01) using Chi-square test; OR = Odds Ratio; CI = Confidence Interval. However, households who recovered was higher among those who disposed assets (p < 0.001, OR = 6.95).
Publisher’s Note: MDPI stays neutral with regard to jurisdictional claims in published maps and institutional affiliations.

