Article

Independence of Future Changes of River Runoff in Europe from the Pathway to Global Warming

European Commission, Joint Research Centre (JRC), 21027 Ispra, Italy
*
Author to whom correspondence should be addressed.
Climate 2020, 8(2), 22; https://doi.org/10.3390/cli8020022
Submission received: 14 January 2020 / Revised: 23 January 2020 / Accepted: 25 January 2020 / Published: 27 January 2020

Abstract

:
The outcomes of the 2015 Paris Agreement triggered a number of climate impact assessments, such as for floods and droughts, to focus on future time frames corresponding to the years of reaching specific levels of global warming. Yet, the links between the timing of the warming levels and the corresponding greenhouse gas concentration pathways to reach them remain poorly understood. To address this gap, we compared projected changes of annual mean, extreme high, and extreme low river discharges in Europe at 1.5 °C and 2 °C under Representative Concentration Pathways RCP8.5 and RCP4.5 from an ensemble of regional climate model (RCM) simulations. The statistical significance of the difference between the two scenarios for both warming levels was then evaluated. The results show that in the majority of Europe (>95% of the surface area for the annual mean discharge, >98% for high and low extremes), the changes projected in the two pathways were statistically indistinguishable. These results suggest that in studies of changes at global warming levels, the projections of the two pathways can be merged into a single ensemble without major loss of information. With regard to the uncertainty of the unified ensemble, the findings show that the projected changes of annual mean, extreme high, and extreme low river discharge were statistically significant in large portions of Europe.

1. Introduction

River runoff is associated with different types of natural hazards. Extremely high flow regimes are associated with floods, a major natural hazard with considerable human and socio-economic implications [1]. Extreme low discharges are related to dry spells and droughts [2]. Changes in mean river discharge affect the long-term availability of water resources necessary for the sustainability of ecosystems and agricultural activities [3,4].
The past decades saw breakthroughs in atmosphere and precipitation modelling [5] and in our understanding of the complex dynamics of catchment areas [6] as well as in our observational [7] and computational capabilities, allowing an increasingly accurate investigation of large-scale, long-term issues and tendencies [1,8,9,10].
In view of global warming, the scientific community has put significant effort into studying how both mean and extreme river runoff values will change on the basis of climate projections, both at the global scale, such as in the Coupled Model Intercomparison Project 5 (CMIP5, [11]), and at the regional scale, such as in the Coordinated Regional Climate Downscaling Experiment (CORDEX, [12]), as well as to quantify the uncertainty in the projected changes [13]. Several past studies on future river runoff focused on specific periods in time, typically the short (2020s), medium (2050s), and long (2080s) term, in different representative concentration pathway (RCP) scenarios [14]. In such studies, the projected changes clearly depend on the considered pathway in, for example, studies related to river floods [15,16], droughts [17,18,19], and water resources [20,21]. It is worth mentioning the close relationship between the trends in river runoff and those of forcing variables such as precipitation and temperature. The projected changes in such variables have been extensively investigated [22,23] as well as their links with extreme and average river discharge [24,25].
In order to limit the impacts of climate change, the Paris Agreement [26] set the objective of limiting global warming to well below 2 °C and pursuing efforts to limit it to 1.5 °C compared to pre-industrial levels. This prompted scientists to study the changes in climate and hazards at global warming levels (GWL) of 1.5 and 2 °C as well as higher levels of warming to assess the potential consequences of not achieving the targets [27]. For example, this was assessed for floods [28,29,30,31], droughts [32,33], and for water resources [34].
The results of these studies rely on the hypothesis that the pathway to reach a certain greenhouse concentration and corresponding warming level plays a minor role in the change of the physical variables that define the hydrological hazard. The validity of such a hypothesis depends on the specific nature of the variables and on their constraint within a changing climate and should be verified in each case [35]. For example, for variables such as sea level rise, the pathway has been shown to play an important role [35,36] due to the large inertia of the sea masses. For average and extreme temperature and precipitation, there is no agreement on the degree of pathway dependence [35,37]. In particular, the physical mechanisms for precipitation are more complex than for temperature and involve many parameters, such as tropospheric moisture, aerosol concentration, and wind, and current knowledge of the underlying physics can only provide an order-of-magnitude estimation of the consequences of climate change [38]. Within these limitations, past contributions investigated the degree of dependency of temperature and precipitation from the pathway. Some of them suggest little effect of the pathway. For example, two studies analyzing the changes in temperature in Europe at different GWLs found between-scenario differences small compared with the climate model variability [39,40]. A similar study on precipitation found slightly more intense changes in mean precipitation in RCP4.5 than in RCP8.5 and attributed this to the difference in aerosol concentration between the two scenarios [41]. Other studies report significant differences among pathways, especially at the regional scale [42,43].
Whether or not the hypothesis of pathway-dependence to a global warming level is valid for hydrological variables that control riverine flood hazard and are connected with water availability and drought is yet unknown. This topic also relates with the investigation of the uncertainty associated with the emission pathway and of its comparison with other sources of variability. In this respect, this work contributes to the research on the quantification of epistemic uncertainty of modelling hydraulic variables and climate changes impacts and to the debate on the communication of the results [44,45].
In this study, we tested the pathway-dependence of future river runoff across a wide range of hydrological conditions. To this end, we produced a pan-European ensemble of river flow simulations with the Distributed Water Balance and Flood Simulation Model (LISFLOOD) [46,47] forced by a set of EURO-CORDEX [12] climate projections for the scenarios RCP8.5 and RCP4.5. The projected changes of extreme high, extreme low, and annual mean discharge between the baseline present climate and warming levels of 1.5 °C and 2.0 °C were thereby quantified. For each of these variables, the relevance of the between-pathway differences of projected change were evaluated with respect to the ensemble uncertainty. Finally, the two pathways were merged into a single ensemble, as has been previously suggested [48], and the statistical significance of the ensemble projected changes of extreme high, extreme low, and annual mean runoff was thereby quantified.

2. Materials and Methods

Projections of river discharge (Q) at a daily time step were obtained by running the hydrological model LISFLOOD [34,35] over the time horizon 1981–2100. The LISFLOOD represents all the relevant processes related to water dynamics in catchment areas including surface water balance (considering the effects due to the soil type, snow, frost, and vegetation), subsurface and ground water dynamics, river runoff and routing, and water demand for anthropogenic activities. For the sake of results reproducibility [49,50], it is worth mentioning that this model is now open source [51], and that version 2.8 was used in this study. The model domain covers the whole of Europe with a resolution of 5 km. The model parameters were calibrated with the European Flood Awareness System Meteo (EFAS-meteo) dataset from 1995 to 2015, optimizing the model output versus the streamflow data from 750 hydrological stations across Europe [28,52]. The forcing data of temperature, precipitation, radiative forcing, wind, and vapor pressure were provided by 11 bias-corrected [53,54] EURO-CORDEX regional climate models (RCMs) under scenarios RCP8.5 and RCP4.5 [12,53] (Table 1). The input data of potential evapotranspiration were estimated using the Evaporation Pre-Processor for LISFLOOD (LISVAP) model [55] with the Penman–Monteith parameterization [56]. In this study, we used version 0.3.2 of LISVAP which is now open source as well [57]. The simulations were carried out using the present estimations of anthropogenic land use, population, and anthropogenic water demand provided by the Land Use-based Integrated Sustainability Assessment of the Joint Research Centre (JRC LUISA) territorial modelling platform [58].
In order to understand how the emission pathway affects the projected changes in annual mean, and high and low extremes of Q, we analyzed for each model, scenario, and river pixel how these variables changed from the baseline (1981–2010) to the year of warming level (ywl), i.e., the year when a GWL was reached. For each model/scenario, ywl was estimated as the first year when the 30 year moving average of the GCM model’s global warming time series exceeded the GWL (Table 1).
The annual means discharge (QM) was estimated from the daily maps of Q. The extremes (high and low) of Q were computed by means of a non-stationary approach for extreme value analysis (EVA), the transformed-stationary EVA (tsEVA) [59]. This methodology uses discharge data over the whole time-horizon to fit the extreme value distribution (120 years in the present study), rather than data over the 30 year windows typically applied in stationary approaches. This implies that statistical fitting and extrapolation uncertainty is inherently lower which is especially relevant for extreme events with return periods that go beyond 30 years such as the 100 year flood. Furthermore, non-stationary techniques are better able to capture the changing statistics at different warming levels, especially in RCP8.5, where the warming continues after exceeding 2.0 °C. The authors of tsEVA released an open source MATLAB toolbox [59] which was employed in this study.
For high extremes, tsEVA was set-up to fit the peaks of Q beyond a moving 98.5 percentile in 1981–2100 with a non-stationary generalized pareto distribution (GPD) thus estimating the time-varying 100 year return level QH100 and its uncertainty. For each pixel, the input of tsEVA was the daily series of Q, and the algorithm was set-up in order to consider peaks at a distance of at least 30 days from one another.
The analysis of the low extremes was, to some extent, complicated by the fact that Q is low-bounded to 0 and that a 0 runoff condition is met regularly in many points. This can lead to an unreliable fit of the extremes (e.g., GEV distributions with shape parameter < 0.5) and to an estimation of the return values too close/equal to zero which would result in inaccurate projections of relative changes. To solve this problem:
(a)
The daily time series of Q were smoothed with a monthly running mean before fitting an extreme value distribution, guaranteeing that medium-term lows were considered in the fit;
(b)
The generalized extreme value (GEV) distribution was used instead of the GPD, due to the excessive proximity of the GPD threshold to 0 in many pixels;
(c)
The pixels with a fitted GEV shape parameter < 0.5 were excluded from the analysis;
(d)
The time-varying 15 year low return level QL15 was preferred to the 100 year one, due to the excessive proximity of the latter to 0 in many points.
For QH100, QL15, and annual mean discharge QM, the relative projected change ΔQ between the baseline period (from 1981 to 2010) and the thirty years centered in ywl was computed for each scenario, RCM, and warming level:
Δ Q x = Q x , w l Q x , b s l Q x , b s l
where the suffix “x” indicates one of the three considered quantities (QH100, QM, and QL15), and bsl and wl indicate the values at the baseline and at the warming level, respectively.
For each GWL and analyzed variable, the two scenarios were joined into a single 22 model ensemble, following an approach suggested by previous studies [48]. This allows for a better quantification of climate uncertainty that also accounts for the uncertainty associated with the emission pathway. The variance of the ensemble was studied, pixel by pixel, by means of a one-way, two-group analysis of variance (ANOVA, e.g., [60,61]). This approach provides information on the significance of the difference between the two groups, similar to a Welch’s t-test [62], but ANOVA was preferred, as it comes with a decomposition of the variance of the projected change, σ2, into its components due, respectively, to the inner (or intramodal) variability of the two pathways and to the difference between the pathways:
σ 2 = σ w i t h i n 2 +   σ b e t w e e n 2
The importance of the between-scenario difference with respect to σwithin was evaluated by means of an F-test: the pathways are considered as significantly different where the p-value ≤ 0.05. The ANOVA analysis was carried out using the python library scipy.stats version 1.4.1 [63].
Finally, the statistical significance of the ensemble projected change of QH100, QL15, and QM was studied, classifying the change as significant when |ΔQ|>σ as proposed in a previous study on floods [16].

3. Results and Discussion

The ensemble changes projected for QH100, QM, and QL15 at 1.5 °C and 2.0 °C were similar in the two pathways with projected changes generally more intense at 2 °C than at 1.5 °C. Changes of QH100 were in the range 15% to 32% (values at the 99th and the 1st percentiles) at 2 °C with respect to the baseline (Figure S1). The ΔQM values were between 19% and 36%. QL15 was the variable that showed the strongest changes, ranging between <50% to >100% (Figure 1), in line with the fact that small quantities are subject to larger relative variations.
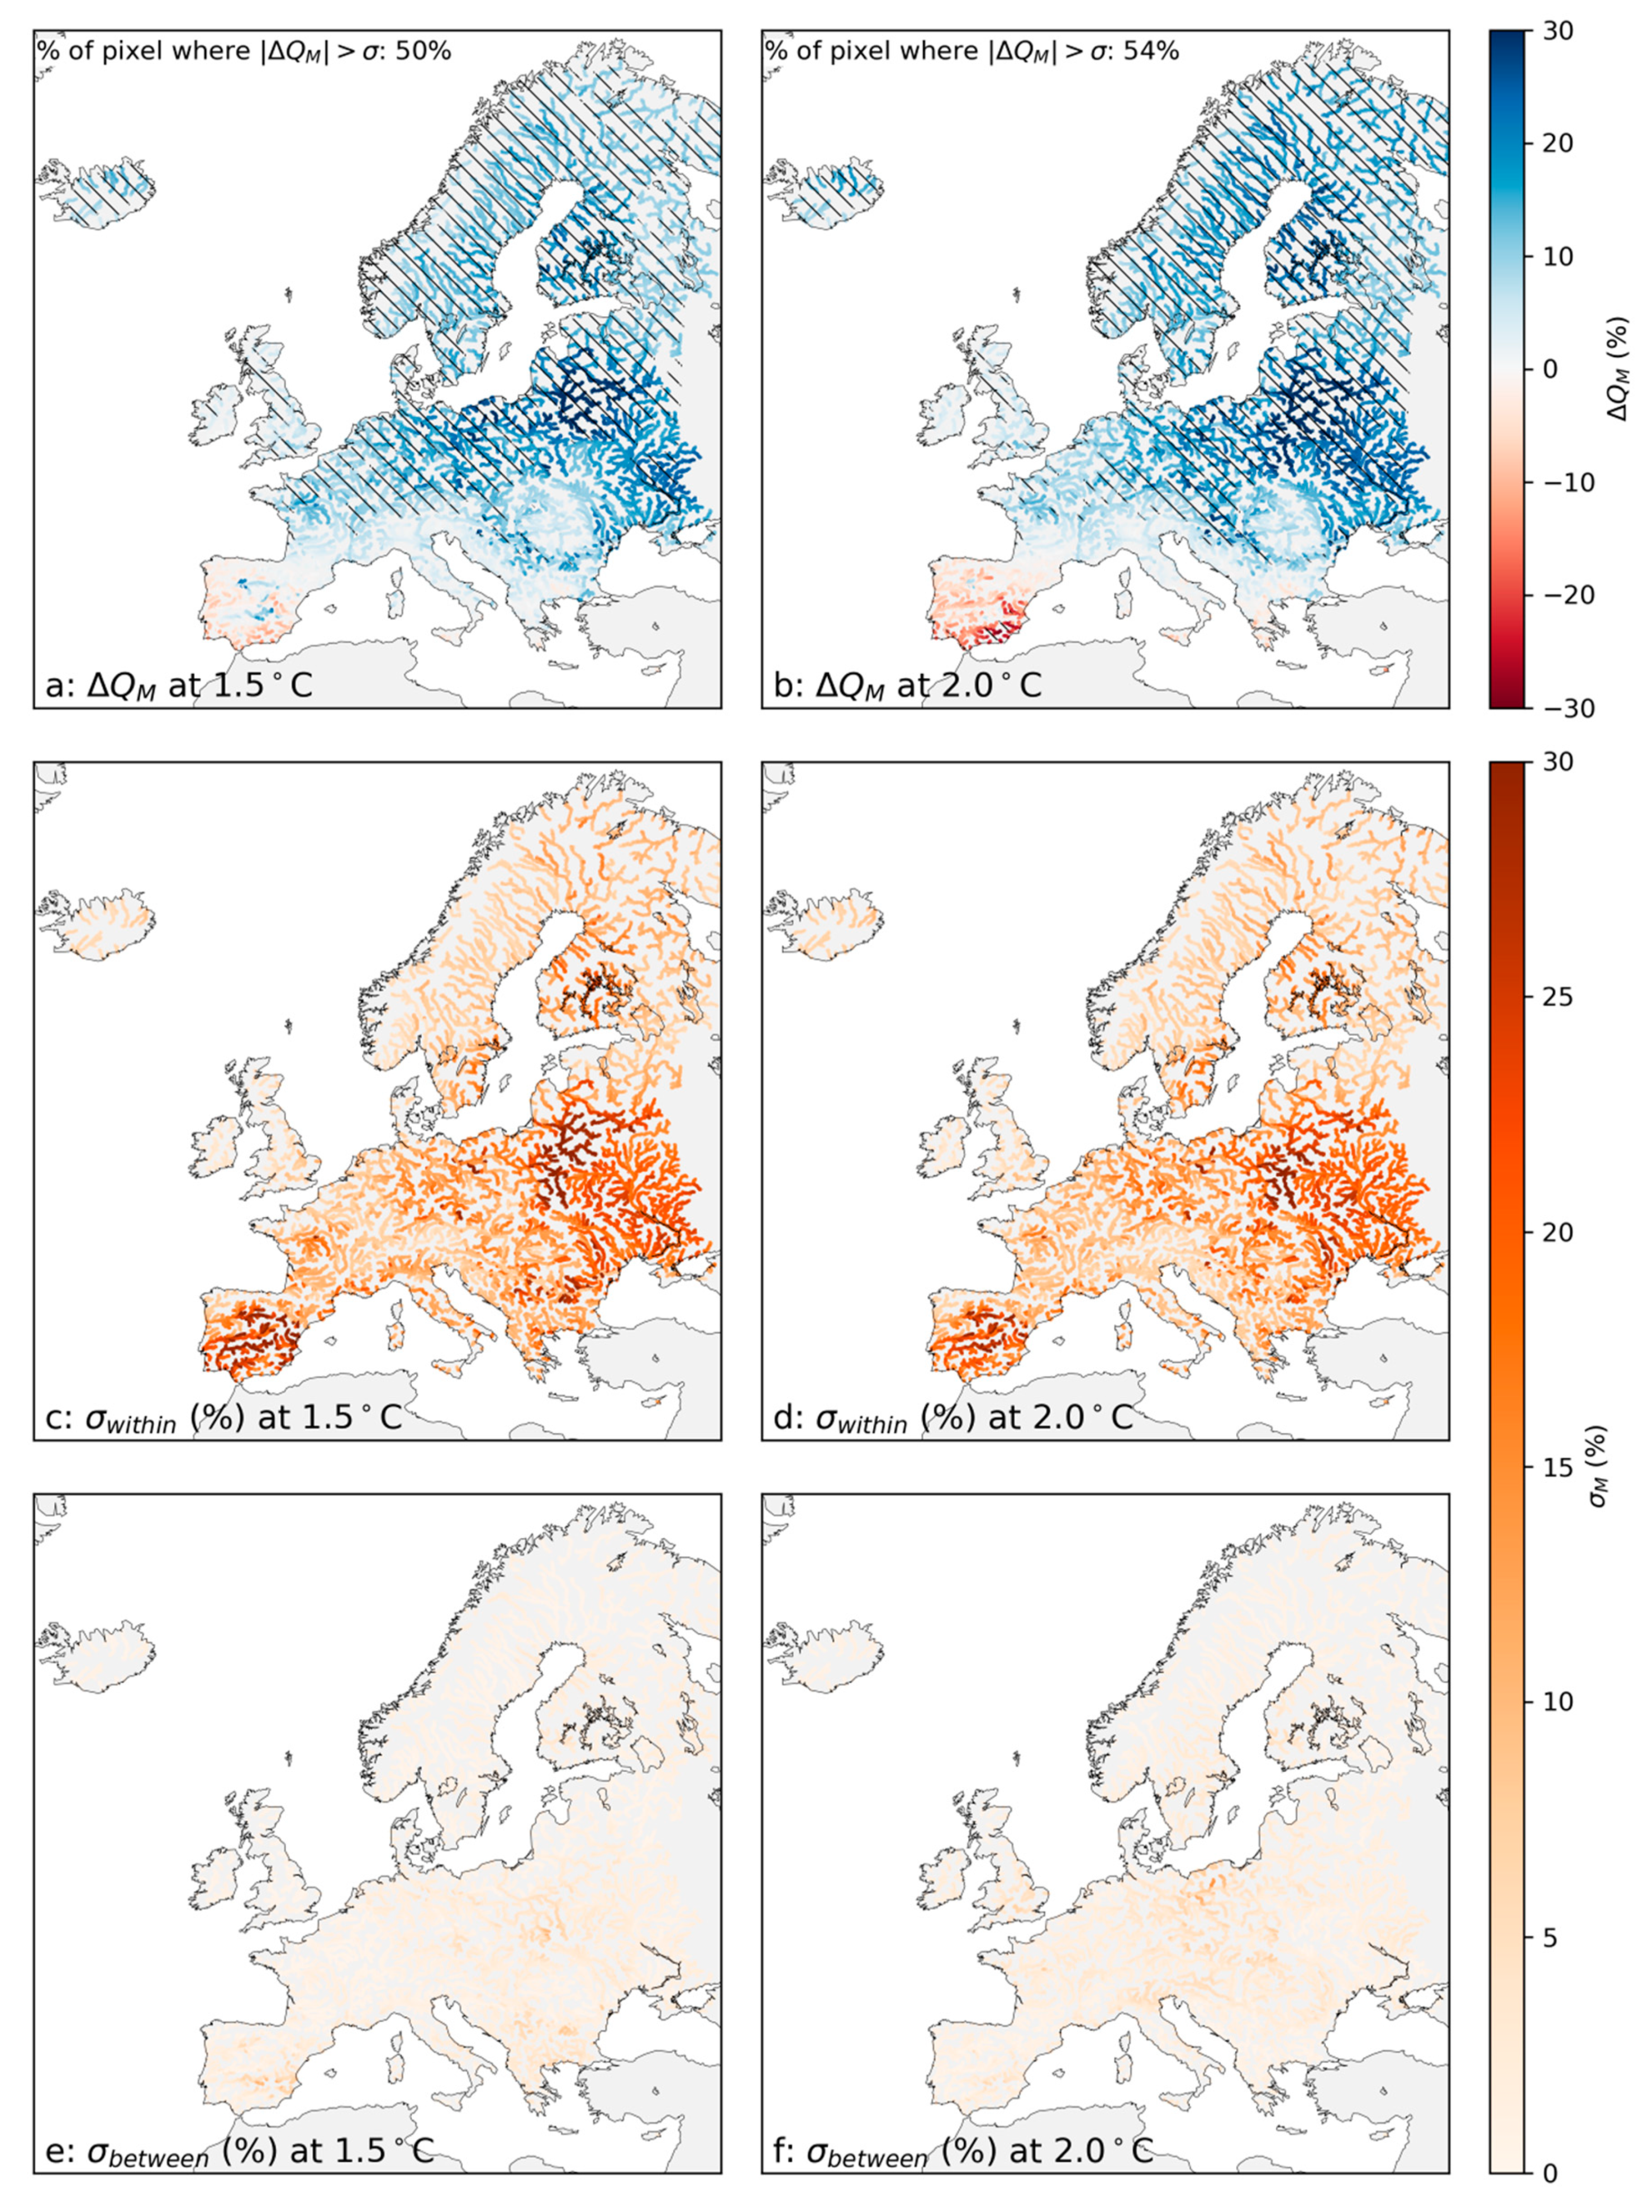
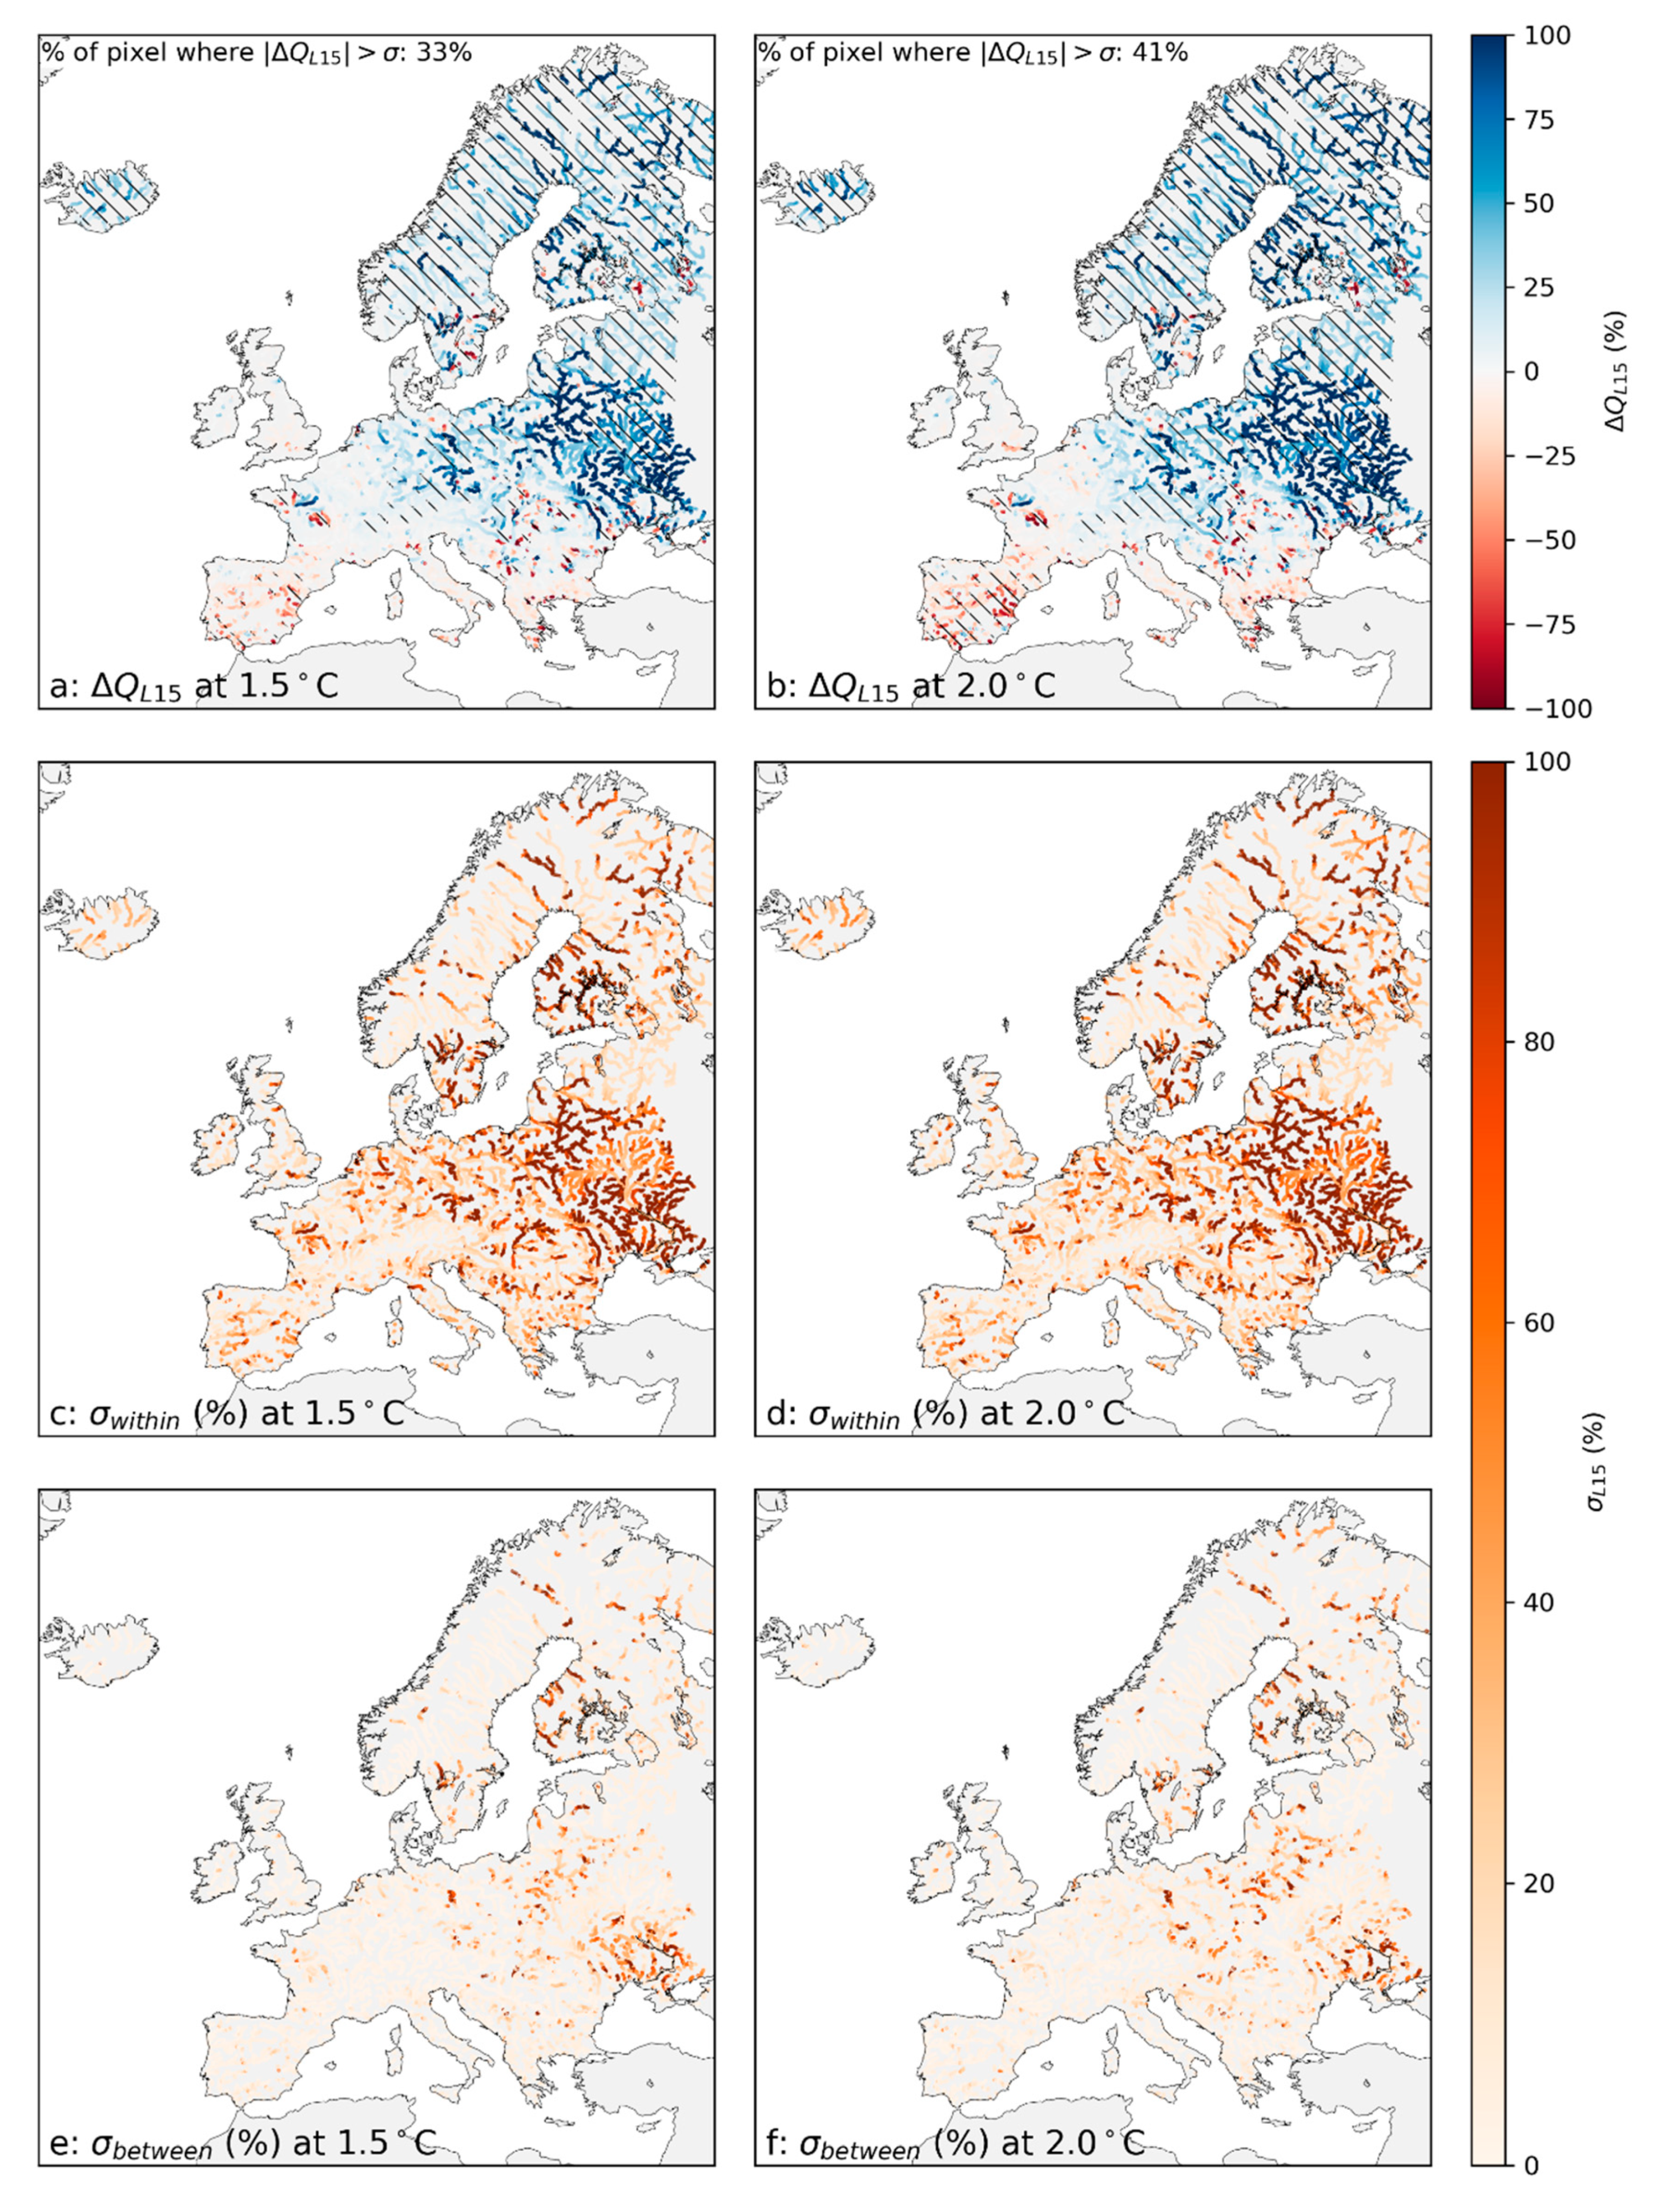
The results of the ANOVA show that the difference between the two pathways is generally small compared with the inter-model variability for all of the three variables. On average, the component of the variance σ2between due to the differences between scenarios explains ≤4% of the total variance for all of the three considered variables (≤3% for high and low extremes) with slightly lower percentages at 1.5 °C than at 2.0 °C (Table 2). For all of the three variables and for both warming levels, the intra-scenario standard deviation σwithin (Figure 2c,d, Figure 3c,d, and Figure 4c,d) generally had the same order of magnitude of the projected change (Figure 2a,b, Figure 3a,b, Figure 4a,b), while σbetween was much smaller (Figure 2e,f, Figure 3e,f, Figure 4e,f). The ANOVA F-test showed that the differences among scenarios were generally statistically non-significant: at 1.5 °C, the p-value was larger than 0.05 in >99% of the points for the three considered variables (99.9% for QH100, 99.8% for QM, and 99.3% for QL15). At 2.0 °C, these percentages decreased, but remained >95% (98% for QH100, 95.6% for QM, and 98.2% for QL15; Table 2). We can further argue that in this ensemble, the inter-model variability was solely related to the CORDEX forcing data, while the setup of LISFLOOD was constant across all the simulations. In other words, we are not taking into account the epistemic uncertainty arising from our lack of knowledge of catchment dynamics [64,65]. Adopting different setups or even using different hydraulic models may result in increased inter-model variability.
The differences between the two scenarios, though generally small, point toward more intense changes in RCP8.5 for all of the three variables, especially at 2 °C. This result is driven by similar patterns of change in precipitations (not shown). However, global studies on precipitation report a more intense increase in precipitation in scenario RCP4.5, explaining it by the fact that the concentration of aerosol is projected to decrease approximately with the same annual rate in the two scenarios. Consequently, when the warming level is reached, the sky is clearer of aerosol in scenario RCP4.5 [41], and this comes with a weaker shortwave radiation absorption and reflection by the atmosphere, an increased amount of shortwave radiation reaching the land surface, an increased top atmosphere radiative cooling and subsequent more intense precipitations [66]. The relevance of aerosol concentration for explaining between-pathway differences in precipitations is remarked upon also by other authors [43,67,68]. The results of these studies are global and, therefore, do not contrast with our finding of slightly more intense precipitations in scenario RCP8.5 over Europe. The projected decreased rate in aerosol concentration is not uniform across the world and across scenarios, and the differences we found in Europe might be associated with a faster depletion of black carbon and sulfur aerosols in RCP8.5 by the end of the century [69].
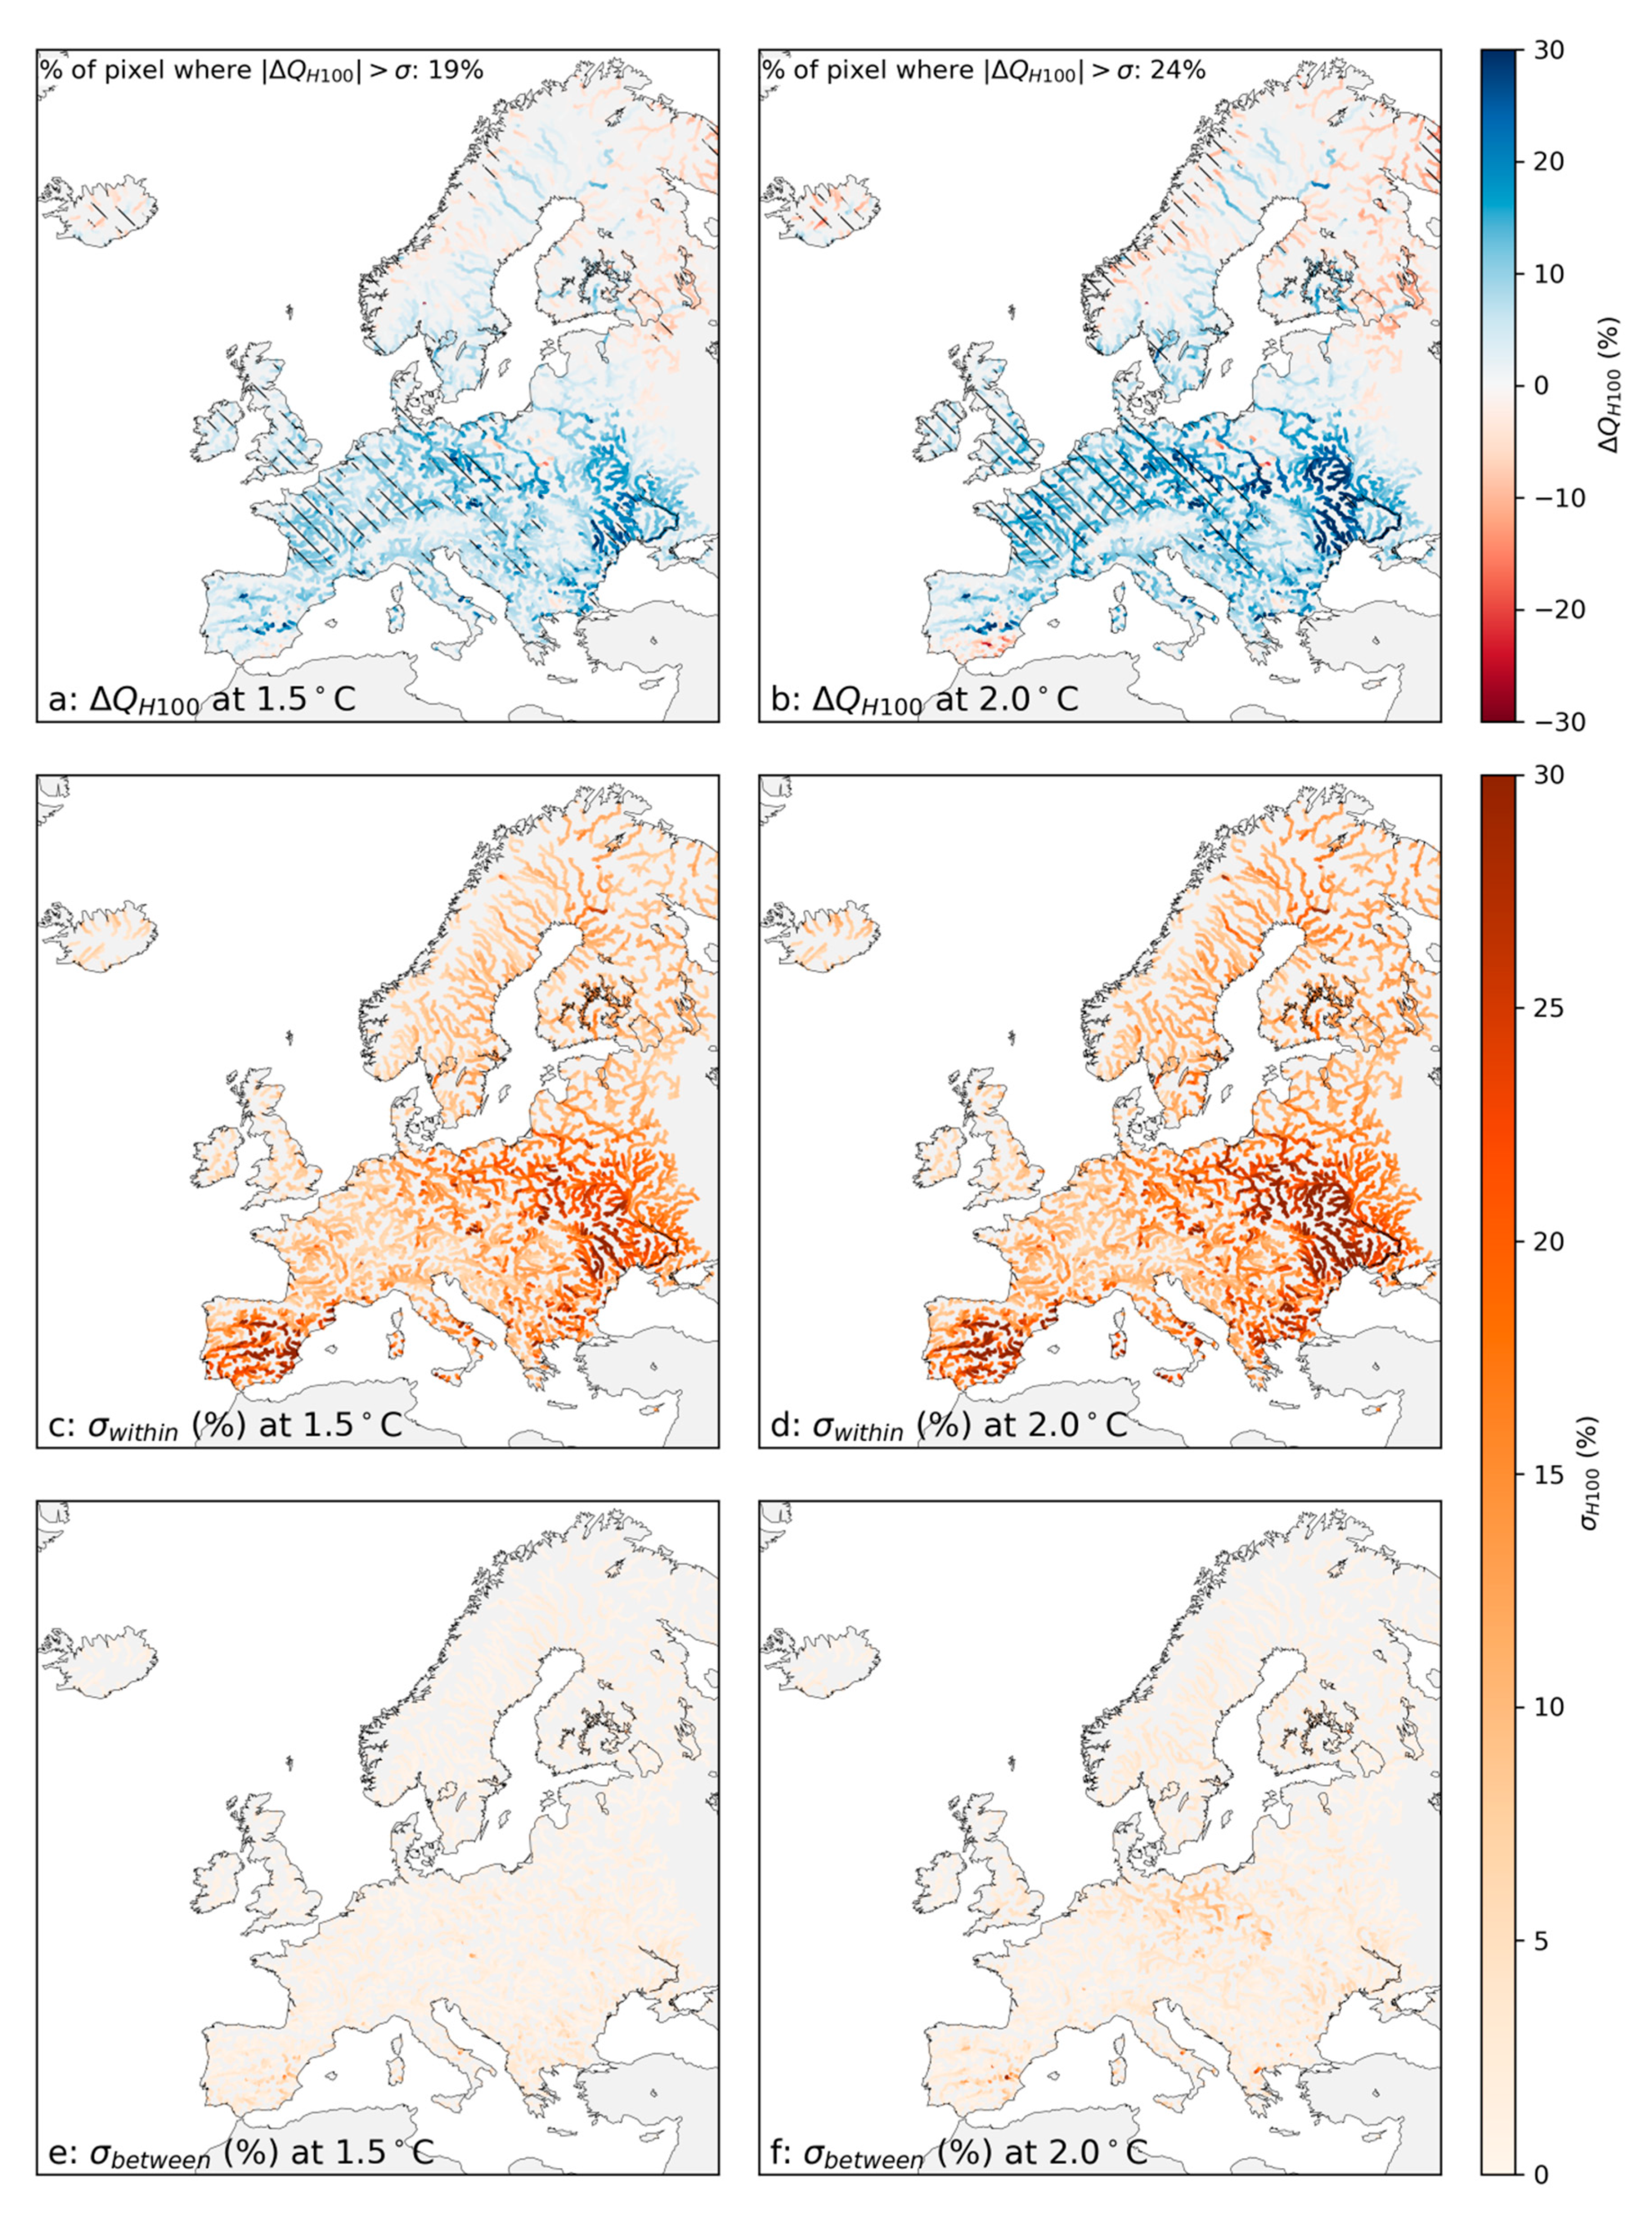
Overall, these results support the assumption for merging the two pathways into a single 22 model ensemble, rather than studying separately the two scenarios, for a more comprehensive estimation of extent and uncertainty of the projected changes at the two warming levels.
In the majority of Europe, the change projected by the merged ensemble was positive for the three variables (i.e., higher extremes and annual means). At 1.5 °C ΔQH100, ΔQM, and ΔQL15 were positive in 83%, 94%, and 77% of the pixels, respectively. At 2 °C, these figures slightly decreased to 80%, 89%, and 73%. Accordingly, the spatial median of the projected change was positive for all of the three quantities: at 1.5 °C the median changes were ~8%, ~10%, and ~15% for QH100, QM, and QL15, respectively. At 2 °C these figures increase up to ~10%, ~14%, and ~38%.
The spatial variability of the changes differs for the three variables. For QH100, the changes were positive in central Europe and in the majority of southern Europe, with the exception of Andalusia, part of the southern Balkans, and Sicily, and which were negative in the majority of Scandinavia (Figure 2a,b). For QM, the changes were positive in central and northern Europe, turning negative in the Iberian Peninsula, and to a lesser extent in the southern part of the Italian Peninsula and Greece (Figure 3a,b). For QL15, the differences between northern and southern Europe were the strongest, with an intense increase in extreme lows in north-eastern Europe and an intense decrease in the south-west, the two regions separated by a slow gradient (Figure 4a,b).
The statistical significance of the projected changes was different for the three variables. ΔQH100 was significant in 19% and 24% of the pixels at 1.5 °C and 2.0 °C, respectively (Figure 2a,b). Significant positive changes of ΔQH100 were estimated for central Europe, covering the larger part of France, Germany, the British Isles, Benelux, Denmark, the northern/central Danube basin, western Poland, and the Po River valley, while the intense changes projected in eastern Europe and in the Dniepr basin were subject to strong uncertainties. Significant negative changes in ΔQH100 were found in Iceland and in part of Scandinavia.
The ΔQM was significant in 50% and 54% of the pixels at 1.5 °C and 2.0 °C, respectively (Figure 3a,b). The area of positive significant changes included the whole central–north–eastern Europe and Iceland, excluding Romania and of part of Ukraine. From 1.5 °C to 2.0 °C, a decrease in the significance of changes in the British Isles and in northern France can be observed, while the positive changes in eastern Europe and the negative changes in Andalusia become more significant.
The ΔQL15 was significant in 33% and 41% of the pixels at 1.5 °C and 2.0 °C, respectively (Figure 4a,b). A significant increase in QL15 can be observed in north-eastern Europe and in Iceland, while a significant decrease is shown in the Iberian Peninsula, parts of France, Italy, and the Balkans with changes more significant at 2.0 °C than at 1.5 °C. The projected changes of annual means QM were significant for a larger area than the extremes QH100 and QL15. A possible explanation for this is that the trend of QM follows that of the annual mean precipitation projected by the pathways. While QH100 and QL15 were associated with extreme meteorological conditions that are inherently more challenging to identify [70].
Overall, the results on the projected changes and on their statistical significance confirm previous results. A study from 2012, carried out with an ensemble of 12 models in the emission scenario SRES A1B, reports similar patterns of change for annual mean runoff, although with stronger negative changes in southern Europe [15]. The main difference in the projection of the 100 year return levels was a reversal of sign in the projected change in eastern Europe. Other authors, using a smaller CORDEX ensemble in scenario RCP8.5, found patterns of change similar to ours for both annual means and high extremes [16]. A further study, carried out with a different CORDEX ensemble with three RCP scenarios, identified patterns of change of low flow similar to the ones found in this study for QL15 [32]. Previously, a study on projected river flow regimes in 2050, carried out with the model WaterGAP3 forced by three GCMs found patterns similar to the ones described in this contribution [71]. Other studies and reviews reporting qualitatively similar results can be mentioned [25,29,72,73,74,75].
Merging the two pathways into a single ensemble comes with a two-fold advantage with respect to the separate treatment of the two scenarios. On the one hand, it improves the estimation of the statistical significance of the projected change by increasing its size from 11 to 22 and by better taking into account the pathway-related uncertainty (the emission pathways are set ex ante as a hypothesis for the CMIP experiment and are generally not considered as a source of uncertainty). On the other hand, a multi-pathway ensemble can simplify the discussion of the projected changes by removing from the analysis the dependency from the emission pathway and making the results clearer and more understandable by a non-scientific public.
On the other hand, a limitation of a multi-scenario ensemble is that each emission pathway reaches similar projected changes at different time frames. But vulnerability and exposure to climate hazard changes over time [76]. Therefore, the application of multi-scenario ensembles to studies that include evolving socio-economic scenarios (e.g., to model the effects of climate extremes) or focusing on mitigation or adaptation would require further assumptions for the quantification of the time available for acting.

4. Conclusions

In this study, we examined the high and low extremes and the annual means of river discharge in a changing climate at warming levels of 1.5 °C and 2.0 °C under greenhouse emission scenarios RCP8.5 and RCP4.5. These three variables were chosen to provide full coverage of different regimes that have impacts on human activities, ecosystems, hazard, and risk. The variance of the projected changes was studied with the ANOVA methodology to investigate the statistical significance of the differences between the two scenarios. Our results indicated that the projected changes were approximately a function of the warming level, as the between-pathway differences were generally much smaller than the within-pathway variability. The projected changes and their uncertainties were thereby studied on the joint two-pathway, 22 model ensemble for both warming levels. The changes in high extreme runoff were found to be generally positive in central Europe and negative in Scandinavia and in Southern Europe. The other two variables exhibited changes mostly positive in Northern Europe and negative in Southern Europe. For all three variables, the changes were generally more intense and statistically significant at 2.0 °C than at 1.5 °C. These results roughly agree with previous single-scenario studies.
A multi-scenario ensemble was thus found to be a viable way to provide additional information on future changes at GWLs compared to analyzing separately the different scenarios. It allows a more reliable evaluation of the total climate uncertainty: the future emission pathway is itself unknown, not only due to the complexity of climate dynamics and the uncertainty therein, but also due to the impossibility of predicting the commitment of the international community in mitigation efforts or the effects of such efforts. A multi-scenario ensemble approach to portray impacts at GWLs is a way to quantify the variability associated with the emission pathway alongside the within-pathway climate variability.
Last but not least, a multi-scenario ensemble can simplify the way future climate change projections and effects of global warming levels are communicated to the public. This is relevant for climate policy [45]. Shortening the discussion on the effects of different emission pathways can contribute to providing a clearer, more compact, and summarized account of the results. It thus facilitates to vehicle the information to stakeholders and a non-scientific public and, therefore, favors the dissemination of knowledge.

Supplementary Materials

The following are available online at https://www.mdpi.com/2225-1154/8/2/22/s1, Figure S1: Baseline maps of QH100 (a), QM (b), QL15 (c).

Author Contributions

This work was conceived by L.M. and L.F., L.M. ran the simulations, carried out the analysis, and drafted the manuscript. L.A., F.D., C.C., L.F., and B.B. provided suggestions and manuscript review–editing. B.B. and A.D.R. provided model input data and support. All authors have read and agreed to the published version of the manuscript.

Funding

The research that led to these results received funding from DG CLIMA of the European Commission as part of the project PESETA IV—Climate Impacts and Adaptation in Europe (N°340202/2017/763714/SER/CLIMA.A.3).

Conflicts of Interest

The authors declare no conflict of interest.

References

  1. Paprotny, D.; Sebastian, A.; Morales-Nápoles, O.; Jonkman, S.N. Trends in flood losses in Europe over the past 150 years. Nat. Commun. 2018, 9, 1985. [Google Scholar] [CrossRef] [PubMed]
  2. Feyen, L.; Dankers, R. Impact of global warming on streamflow drought in Europe. J. Geophys. Res. 2009, 114, D17116. [Google Scholar] [CrossRef]
  3. Calzadilla, A.; Rehdanz, K.; Betts, R.; Falloon, P.; Wiltshire, A.; Tol, R.S.J. Climate change impacts on global agriculture. Clim. Chang. 2013, 120, 357–374. [Google Scholar] [CrossRef]
  4. Jorda-Capdevila, D.; Gampe, D.; Huber García, V.; Ludwig, R.; Sabater, S.; Vergoñós, L.; Acuña, V. Impact and mitigation of global change on freshwater-related ecosystem services in Southern Europe. Sci. Total Environ. 2019, 651, 895–908. [Google Scholar] [CrossRef] [PubMed]
  5. Betts, A.K. Land-Surface-Atmosphere Coupling in Observations and Models. J. Adv. Model. Earth Syst. 2009, 1, 18. [Google Scholar] [CrossRef]
  6. Fenicia, F.; Savenije, H.H.G.; Matgen, P.; Pfister, L. Understanding catchment behavior through stepwise model concept improvement. Water Resour. Res. 2008, 44, 13. [Google Scholar] [CrossRef] [Green Version]
  7. Harris, I.; Jones, P.D.; Osborn, T.J.; Lister, D.H. Updated high-resolution grids of monthly climatic observations - the CRU TS3.10 Dataset. Int. J. Climatol. 2014, 34, 623–642. [Google Scholar] [CrossRef] [Green Version]
  8. Grizzetti, B.; Pistocchi, A.; Liquete, C.; Udias, A.; Bouraoui, F.; Van De Bund, W. Human pressures and ecological status of European rivers. Sci. Rep. 2017, 7, 205. [Google Scholar] [CrossRef] [Green Version]
  9. Blöschl, G.; Hall, J.; Parajka, J.; Perdigão, R.A.P.; Merz, B.; Arheimer, B.; Aronica, G.T.; Bilibashi, A.; Bonacci, O.; Borga, M.; et al. Changing climate shifts timing of European floods. Science (80) 2017, 357, 588–590. [Google Scholar] [CrossRef] [Green Version]
  10. Blöschl, G.; Hall, J.; Viglione, A.; Perdigão, R.A.P.; Parajka, J.; Merz, B.; Lun, D.; Arheimer, B.; Aronica, G.T.; Bilibashi, A.; et al. Changing climate both increases and decreases European river floods. Nature 2019, 573, 108–111. [Google Scholar] [CrossRef]
  11. Taylor, K.E.; Stouffer, R.J.; Meehl, G.A. An overview of CMIP5 and the experiment design. Bull. Am. Meteorol. Soc. 2012, 93, 485–498. [Google Scholar] [CrossRef] [Green Version]
  12. Jacob, D.; Petersen, J.; Eggert, B.; Alias, A.; Christensen, O.B.; Bouwer, L.M.; Braun, A.; Colette, A.; Déqué, M.; Georgievski, G.; et al. EURO-CORDEX: new high-resolution climate change projections for European impact research. Reg. Environ. Chang. 2014, 14, 563–578. [Google Scholar] [CrossRef]
  13. Beven, K. I believe in climate change but how precautionary do we need to be in planning for the future? Hydrol. Process. 2011, 25, 1517–1520. [Google Scholar] [CrossRef]
  14. van Vuuren, D.P.; Edmonds, J.; Kainuma, M.; Riahi, K.; Thomson, A.; Hibbard, K.; Hurtt, G.C.; Kram, T.; Krey, V.; Lamarque, J.F.; et al. The representative concentration pathways: An overview. Clim. Chang. 2011, 109, 5–31. [Google Scholar] [CrossRef]
  15. Rojas, R.; Feyen, L.; Bianchi, A.; Dosio, A. Assessment of future flood hazard in Europe using a large ensemble of bias-corrected regional climate simulations. J. Geophys. Res. Atmos. 2012, 117. [Google Scholar]
  16. Alfieri, L.; Burek, P.; Feyen, L.; Forzieri, G. Global warming increases the frequency of river floods in Europe. Hydrol. Earth Syst. Sci. 2015, 19, 2247–2260. [Google Scholar] [CrossRef] [Green Version]
  17. Forzieri, G.; Feyen, L.; Rojas, R.; Flörke, M.; Wimmer, F.; Bianchi, A. Ensemble projections of future streamflow droughts in Europe. Hydrol. Earth Syst. Sci. 2014, 18, 85–108. [Google Scholar] [CrossRef] [Green Version]
  18. Wanders, N.; Wada, Y.; Van Lanen, H.A.J. Global hydrological droughts in the 21st century under a changing hydrological regime. Earth Syst. Dyn. 2015, 6, 1–15. [Google Scholar] [CrossRef] [Green Version]
  19. Spinoni, J.; Vogt, J.V.; Naumann, G.; Barbosa, P.; Dosio, A. Will drought events become more frequent and severe in Europe? Int. J. Climatol. 2018, 38, 1718–1736. [Google Scholar] [CrossRef] [Green Version]
  20. Arnell, N.W.; Lloyd-Hughes, B. The global-scale impacts of climate change on water resources and flooding under new climate and socio-economic scenarios. Clim. Chang. 2014, 122, 127–140. [Google Scholar] [CrossRef] [Green Version]
  21. Milly, P.C.D.; Dunne, K.A.; Vecchia, A.V. Global pattern of trends in streamflow and water availability in a changing climate. Nature 2005, 438, 347–350. [Google Scholar] [CrossRef] [PubMed]
  22. Sillmann, J.; Kharin, V.V.; Zhang, X.; Zwiers, F.W.; Bronaugh, D. Climate extremes indices in the CMIP5 multimodel ensemble: Part 1. Model evaluation in the present climate. J. Geophys. Res. Atmos. 2013, 118, 1716–1733. [Google Scholar] [CrossRef]
  23. Pfahl, S.; O’Gorman, P.A.; Fischer, E.M. Understanding the regional pattern of projected future changes in extreme precipitation. Nat. Clim. Chang. 2017, 7, 423–427. [Google Scholar] [CrossRef]
  24. Kundzewicz, Z.W.; Lugeri, N.; Dankers, R.; Hirabayashi, Y.; Döll, P.; Pińskwar, I.; Dysarz, T.; Hochrainer, S.; Matczak, P. Assessing river flood risk and adaptation in Europe-review of projections for the future. Mitig. Adapt. Strateg. Glob. Chang. 2010, 15, 641–656. [Google Scholar] [CrossRef]
  25. Madsen, H.; Lawrence, D.; Lang, M.; Martinkova, M.; Kjeldsen, T.R. Review of trend analysis and climate change projections of extreme precipitation and floods in Europe. J. Hydrol. 2014, 519, 3634–3650. [Google Scholar] [CrossRef] [Green Version]
  26. United Nations Convention on Climate Change. Paris Agreement; United Nations Convention on Climate Chang: New York, NY, USA, 2015. [Google Scholar]
  27. Mitchell, D.; James, R.; Forster, P.M.; Betts, R.A.; Shiogama, H.; Allen, M. Realizing the impacts of a 1.5 °C warmer world. Nat. Clim. Chang. 2016, 6, 735–737. [Google Scholar] [CrossRef] [Green Version]
  28. Hirpa, F.A.; Salamon, P.; Beck, H.E.; Lorini, V.; Alfieri, L.; Zsoter, E.; Dadson, S.J. Calibration of the Global Flood Awareness System (GloFAS) using daily streamflow data. J. Hydrol. 2018, 566, 595–606. [Google Scholar] [CrossRef]
  29. Donnelly, C.; Greuell, W.; Andersson, J.; Gerten, D.; Pisacane, G.; Roudier, P.; Ludwig, F. Impacts of climate change on European hydrology at 1.5, 2 and 3 degrees mean global warming above preindustrial level. Clim. Chang. 2017, 143, 13–26. [Google Scholar] [CrossRef] [Green Version]
  30. Dottori, F.; Szewczyk, W.; Ciscar, J.-C.; Zhao, F.; Alfieri, L.; Hirabayashi, Y.; Bianchi, A.; Mongelli, I.; Frieler, K.; Betts, R.A.; et al. Increased human and economic losses from river flooding with anthropogenic warming. Nat. Clim. Chang. 2018, 8, 781–786. [Google Scholar] [CrossRef]
  31. Thober, S.; Kumar, R.; Wanders, N.; Marx, A.; Pan, M.; Rakovec, O.; Samaniego, L.; Sheffield, J.; Wood, E.F.; Zink, M. Multi-model ensemble projections of European river floods and high flows at 1.5, 2, and 3 degrees global warming. Environ. Res. Lett. 2018, 13, 014003. [Google Scholar] [CrossRef]
  32. Roudier, P.; Andersson, J.C.M.; Donnelly, C.; Feyen, L.; Greuell, W.; Ludwig, F. Projections of future floods and hydrological droughts in Europe under a +2 °C global warming. Clim. Chang. 2016, 135, 341–355. [Google Scholar] [CrossRef] [Green Version]
  33. Naumann, G.; Alfieri, L.; Wyser, K.; Mentaschi, L.; Betts, R.A.; Carrao, H.; Spinoni, J.; Vogt, J.; Feyen, L. Global Changes in Drought Conditions Under Different Levels of Warming. Geophys. Res. Lett. 2018, 45, 3285–3296. [Google Scholar] [CrossRef]
  34. Bisselink, B.; de Roo, A.; Bernhard, J.; Gelati, E. Future Projections of Water Scarcity in the Danube River Basin Due to Land Use, Water Demand and Climate Change. J. Environ. Geogr. 2018, 11, 25–36. [Google Scholar] [CrossRef] [Green Version]
  35. Zickfeld, K.; Arora, V.K.; Gillett, N.P. Is the climate response to CO2 emissions path dependent? Geophys. Res. Lett. 2012, 39. [Google Scholar] [CrossRef]
  36. Schaeffer, M.; Hare, W.; Rahmstorf, S.; Vermeer, M. Long-term sea-level rise implied by 1.5 °C and 2 °C warming levels. Nat. Clim. Chang. 2012, 2, 867–870. [Google Scholar] [CrossRef]
  37. Bärring, L.; Strandberg, G. Does the projected pathway to global warming targets matter? Environ. Res. Lett. 2018, 13, 024029. [Google Scholar] [CrossRef]
  38. Allen, M.R.; Ingram, W.J. Constraints on future changes in climate and the hydrologic cycle. Nature 2002, 419. [Google Scholar] [CrossRef]
  39. Maule, C.F.; Mendlik, T.; Christensen, O.B. The effect of the pathway to a two degrees warmer world on the regional temperature change of Europe. Clim. Serv. 2017, 7, 3–11. [Google Scholar] [CrossRef] [Green Version]
  40. Pfeifer, S.; Rechid, D.; Reuter, M.; Viktor, E.; Jacob, D. 1.5°, 2°, and 3° global warming: visualizing European regions affected by multiple changes. Reg. Environ. Chang. 2019, 19, 1777–1786. [Google Scholar] [CrossRef] [Green Version]
  41. Pendergrass, A.G.; Lehner, F.; Sanderson, B.M.; Xu, Y. Does extreme precipitation intensity depend on the emissions scenario? Geophys. Res. Lett. 2015, 42, 8767–8774. [Google Scholar] [CrossRef] [Green Version]
  42. Good, P.; Booth, B.B.B.; Chadwick, R.; Hawkins, E.; Jonko, A.; Lowe, J.A. Large differences in regional precipitation change between a first and second 2 K of global warming. Nat. Commun. 2016, 7, 13667. [Google Scholar] [CrossRef] [PubMed] [Green Version]
  43. Wang, Z.; Lin, L.; Zhang, X.; Zhang, H.; Liu, L.; Xu, Y. Scenario dependence of future changes in climate extremes under 1.5 °C and 2 °C global warming. Sci. Rep. 2017, 7, 46432. [Google Scholar] [CrossRef] [PubMed]
  44. Beven, K.J.; Aspinall, W.P.; Bates, P.D.; Borgomeo, E.; Goda, K.; Hall, J.W.; Page, T.; Phillips, J.C.; Simpson, M.; Smith, P.J.; et al. Epistemic uncertainties and natural hazard risk assessment – Part 2: What should constitute good practice? Nat. Hazards Earth Syst. Sci. 2018, 18, 2769–2783. [Google Scholar] [CrossRef] [Green Version]
  45. Kundzewicz, Z.W.; Krysanova, V.; Benestad, R.E.; Hov, Ø.; Piniewski, M.; Otto, I.M. Uncertainty in climate change impacts on water resources. Environ. Sci. Policy 2018, 79, 1–8. [Google Scholar] [CrossRef]
  46. Van der Knijff, J.M.; De Roo, A.P.J. LISFLOOD Distributed Water Balance and Flood Simulation Model; European Commission: Ispra, Italy, 2008. [Google Scholar]
  47. Burek, P.; de Roo, A.; van der Knijff, J.M. LISFLOOD—Distributed Water Balance and Flood Simulation Model—Revised User Manual; OPOCE: Luxembourg, 2013. [Google Scholar]
  48. Samaniego, L.; Thober, S.; Kumar, R.; Wanders, N.; Rakovec, O.; Pan, M.; Zink, M.; Sheffield, J.; Wood, E.F.; Marx, A. Anthropogenic warming exacerbates European soil moisture droughts. Nat. Clim. Chang. 2018, 8, 421–426. [Google Scholar] [CrossRef]
  49. Hutton, C.; Wagener, T.; Freer, J.; Han, D.; Duffy, C.; Arheimer, B. Most computational hydrology is not reproducible, so is it really science? Water Resour. Res. 2016, 52, 7548–7555. [Google Scholar] [CrossRef]
  50. Añel, J.A. Comment on “Most computational hydrology is not reproducible, so is it really science?” by Christopher Hutton et al. Water Resour. Res. 2017, 53, 2572–2574. [Google Scholar] [CrossRef] [Green Version]
  51. LISFLOOD Dvlp. Grp. The Distributed Water Balance and Flood Simulation Model (LISFLOOD), Github Repository. 2018. Available online: https://github.com/ec-jrc/lisflood-code (accessed on 13 January 2020).
  52. Ntegeka, V.; Salamon, P.; Gomes, G.; Sint, H.; Lorini, V.; Thielen, J.; Zambrano, H. EFAS-Meteo: A European daily high-resolution gridded meteorological data set for 1990–2011; Publications Office of the European Union: Luxembourg, 2013. [Google Scholar]
  53. Dosio, A. Projections of climate change indices of temperature and precipitation from an ensemble of bias-adjusted high-resolution EURO-CORDEX regional climate models. J. Geophys. Res. 2016, 121, 5488–5511. [Google Scholar] [CrossRef]
  54. Casanueva, A.; Kotlarski, S.; Herrera, S.; Fernández, J.; Gutiérrez, J.M.; Boberg, F.; Colette, A.; Christensen, O.B.; Goergen, K.; Jacob, D.; et al. Daily precipitation statistics in a EURO-CORDEX RCM ensemble: added value of raw and bias-corrected high-resolution simulations. Clim. Dyn. 2016, 47, 719–737. [Google Scholar] [CrossRef] [Green Version]
  55. Burek, P.; van der Knijff, J.M.; Ntegeka, V. LISVAP Evaporation Pre-Processor for the LISFLOOD Water Balance and Flood Simulation Model; Publications Office of the European Union: Luxembourg, 2013. [Google Scholar]
  56. Beven, K. A sensitivity analysis of the Penman-Monteith actual evapotranspiration estimates. J. Hydrol. 1979, 44, 169–190. [Google Scholar] [CrossRef]
  57. LISFLOOD Dvlp. Grp. The Evaporation Pre-Processor for LISFLOOD (LISVAP) Model, Github Repository. 2018. Available online: https://github.com/ec-jrc/lisflood-lisvap (accessed on 13 January 2020).
  58. Batista e Silva, F.; Gallego, J.; Lavalle, C. A high-resolution population grid map for Europe. J. Maps 2013, 9, 16–28. [Google Scholar] [CrossRef]
  59. Mentaschi, L.; Vousdoukas, M.; Voukouvalas, E.; Sartini, L.; Feyen, L.; Besio, G.; Alfieri, L. The transformed-stationary approach: A generic and simplified methodology for non-stationary extreme value analysis. Hydrol. Earth Syst. Sci. 2016, 20, 3527–3547. [Google Scholar] [CrossRef] [Green Version]
  60. Girden, E.R. ANOVA: Repeated Measures; Sage Publications: Thousand Oaks, CA, USA, 1992; ISBN 0-8039-4257-5. (Paperback). [Google Scholar]
  61. Blanca, M.J.; Alarcón, R.; Bendayan, R.; Arnau, J.; Bono, R. Non-normal data: Is ANOVA still a valid option? Psicothema 2017, 29, 552–557. [Google Scholar]
  62. Welch, B.L. THE GENERALIZATION OF ‘STUDENT’S’ PROBLEM WHEN SEVERAL DIFFERENT POPULATION VARLANCES ARE INVOLVED. Biometrika 1947, 34, 28–35. [Google Scholar] [CrossRef]
  63. SciPy Developers Scientific Computing Tools for Python—SciPy.org. Available online: https://www.scipy.org/about.html (accessed on 13 January 2020).
  64. Beven, K. Facets of uncertainty: epistemic uncertainty, non-stationarity, likelihood, hypothesis testing, and communication. Hydrol. Sci. J. 2016, 61, 1652–1665. [Google Scholar] [CrossRef] [Green Version]
  65. Beven, K.; Westerberg, I. On red herrings and real herrings: disinformation and information in hydrological inference. Hydrol. Process. 2011, 25, 1676–1680. [Google Scholar] [CrossRef]
  66. Pendergrass, A.G.; Hartmann, D.L. The atmospheric energy constraint on global-mean precipitation change. J. Clim. 2014, 27, 757–768. [Google Scholar] [CrossRef]
  67. Lin, L.; Wang, Z.; Xu, Y.; Fu, Q. Sensitivity of precipitation extremes to radiative forcing of greenhouse gases and aerosols. Geophys. Res. Lett. 2016, 43, 9860–9868. [Google Scholar] [CrossRef]
  68. Lin, L.; Wang, Z.; Xu, Y.; Fu, Q.; Dong, W. Larger Sensitivity of Precipitation Extremes to Aerosol Than Greenhouse Gas Forcing in CMIP5 Models. J. Geophys. Res. Atmos. 2018, 123, 8062–8073. [Google Scholar] [CrossRef]
  69. Lamarque, J.F.; Kyle, P.P.; Meinshausen, M.; Riahi, K.; Smith, S.J.; van Vuuren, D.P.; Conley, A.J.; Vitt, F. Global and regional evolution of short-lived radiatively-active gases and aerosols in the Representative Concentration Pathways. Clim. Chang. 2011, 109, 191–212. [Google Scholar] [CrossRef]
  70. Tabari, H.; Hosseinzadehtalaei, P.; AghaKouchak, A.; Willems, P. Latitudinal heterogeneity and hotspots of uncertainty in projected extreme precipitation. Environ. Res. Lett. 2019, 14, 124032. [Google Scholar] [CrossRef] [Green Version]
  71. Schneider, C.; Laizé, C.L.R.; Acreman, M.C.; Flörke, M. How will climate change modify river flow regimes in Europe? Hydrol. Earth Syst. Sci. 2013, 17, 325–339. [Google Scholar] [CrossRef] [Green Version]
  72. García-Ruiz, J.M.; López-Moreno, I.I.; Vicente-Serrano, S.M.; Lasanta-Martínez, T.; Beguería, S. Mediterranean water resources in a global change scenario. Earth-Science Rev. 2011, 105, 121–139. [Google Scholar] [CrossRef] [Green Version]
  73. Arnell, N.W. The effect of climate change on hydrological regimes in Europe: A continental perspective. Glob. Environ. Chang. 1999, 9, 5–23. [Google Scholar] [CrossRef]
  74. Gampe, D.; Nikulin, G.; Ludwig, R. Using an ensemble of regional climate models to assess climate change impacts on water scarcity in European river basins. Sci. Total Environ. 2016, 573, 1503–1518. [Google Scholar] [CrossRef]
  75. Dankers, R.; Feyen, L. Climate change impact on flood hazard in Europe: An assessment based on high-resolution climate simulations. J. Geophys. Res. Atmos. 2008, 113. [Google Scholar] [CrossRef]
  76. Formetta, G.; Feyen, L. Empirical evidence of declining global vulnerability to climate-related hazards. Glob. Environ. Chang. 2019, 57, 101920. [Google Scholar] [CrossRef]
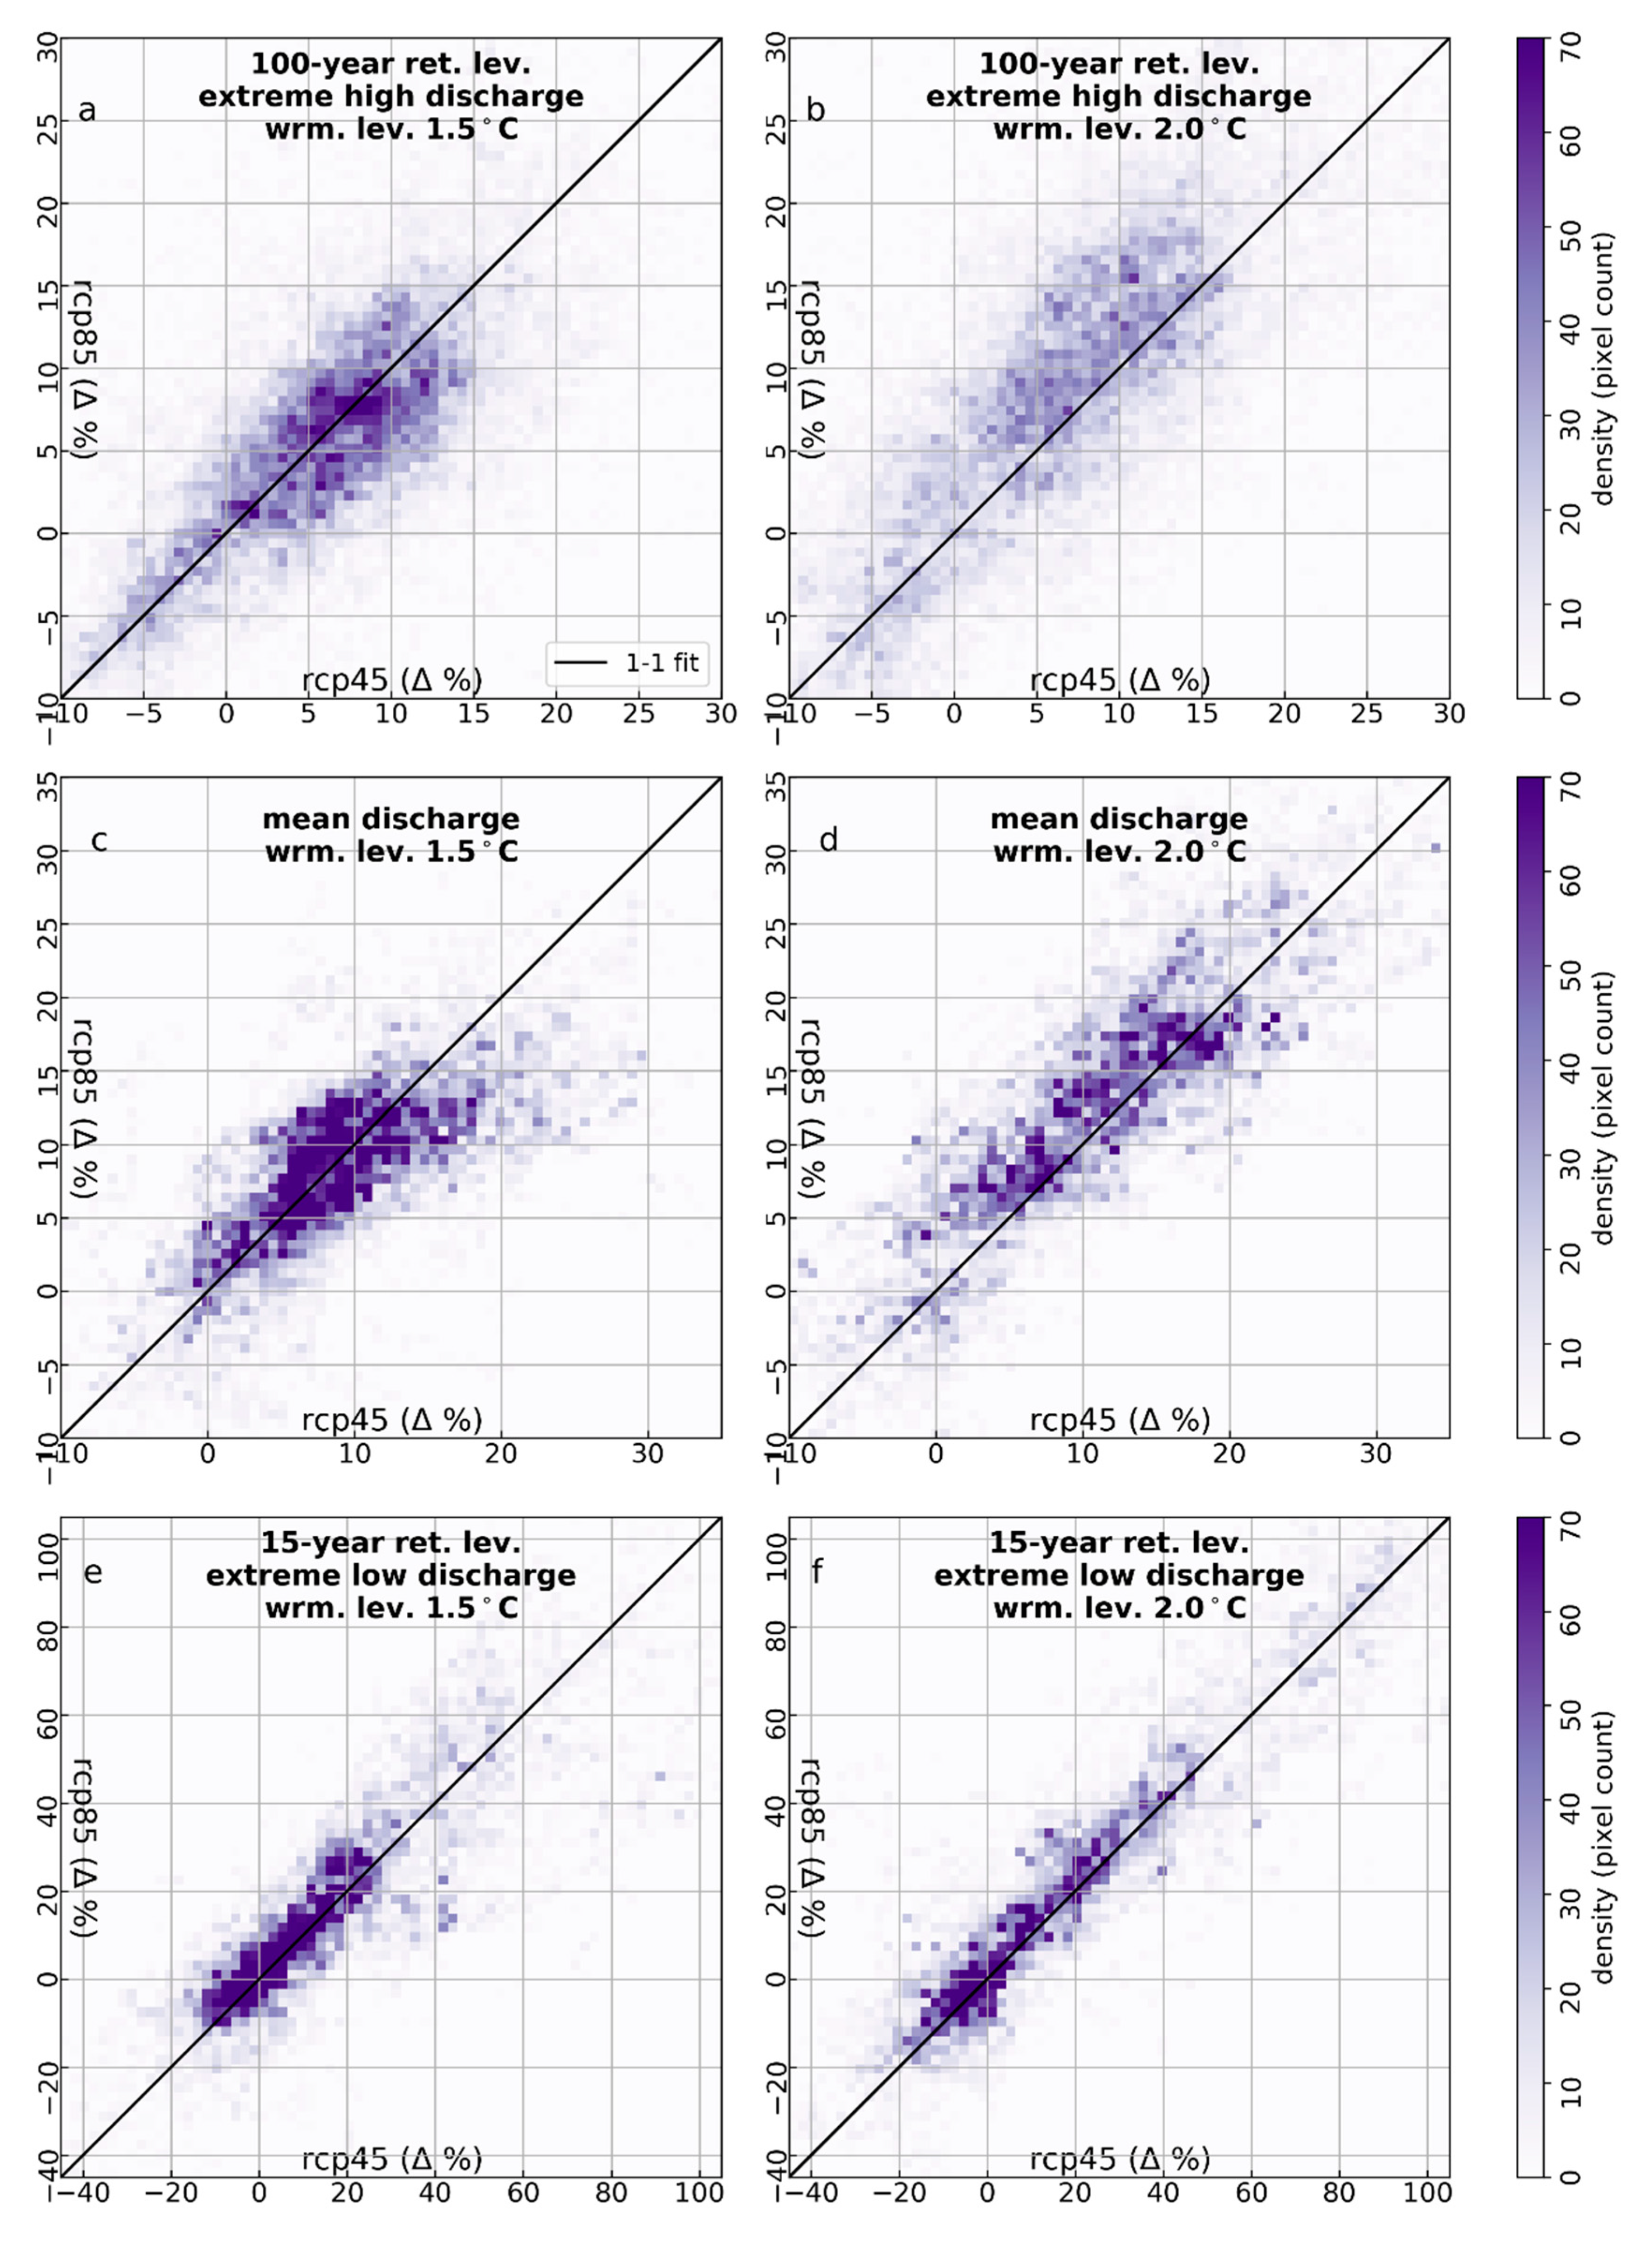
Figure 1. Projected relative changes at 1.5 °C and 2.0 °C warming levels. Density plots RCP8.5 versus RCP4.5 of all the pixels of the map, for high extreme (a,b), mean (c,d), and extreme low discharge (e,f). The color of each dot represents the number of domain pixels with corresponding ensemble changes in RCP8.5 and RCP4.5.
Climate 08 00022 g001
Figure 2. Projected relative change (a,b), within-scenario standard deviation σwithin (c,d), between-scenario standard deviation σbetween (e,f) of extreme high discharge (QH100) at warming levels 1.5 °C and 2.0 °C. In the hatched area in ab, the ensemble projected change was statistically significant. Only network points with an upstream catchment area > 500 km2 are shown.
Climate 08 00022 g002
Figure 3. Same as in Figure 2 for the mean discharge (QM).
Climate 08 00022 g003
Figure 4. Same as in Figure 2 for extreme low discharge (QL15).
Climate 08 00022 g004
Table 1. Ensemble members and related years when a global warming level (1.5 °C or 2 °C) was surpassed under Representative Concentration Pathways RCP8.5 and RCP4.5.
RCP8.5, Year of Warming LevelRCP4.5, Year of Warming Level
CORDEX Model Name1.5 °C2 °C1.5 °C2 °C
CLMcom-CCLM4-8-17_CNRM-CERFACS-CNRM-CM52029 20442035 2057
CLMcom-CCLM4-8-17_ICHEC-EC-EARTH2026204120332056
CLMcom-CCLM4-8-17_MPI-M-MPI-ESM-LR2028204420342064
DMI-HIRHAM5-ICHEC-EC-EARTH2028204320322054
IPSL-INERIS-WRF331F2021203520232042
KNMI-RACMO22E-ICHEC-EC-EARTH2026204220322056
SMHI-RCA4_CNRM-CERFACS-CNRM-CM52029 20442035 2057
SMHI-RCA4_ICHEC-EC-EARTH2026204120332056
SMHI-RCA4_IPSL-IPSL-CM5A-MR2021203520232042
SMHI-RCA4_MOHC-HadGEM2-ES2018203020212037
SMHI-RCA4_MPI-M-MPI-ESM-LR2028204420342064
Table 2. Components of the total standard deviation for the considered ensembles expressed as percentages of explained variance.
% Explained Variance% Points Where p-Value ≤ 0.05
VariableWarming Level σ2withinσ2between
QH1001.5 °C98.6%1.4%0.1%
2.0 °C97.0%3.0%2.0%
QM1.5 °C98.2%1.8%0.2%
2.0 °C96.0%4.0%4.4%
QL151.5 °C97.2%2.8%0.7%
2.0 °C97.1%2.9%1.2%