Article

The Spatiotemporal Patterns of Climate Asymmetric Warming and Vegetation Activities in an Arid and Semiarid Region

1
College of Water and Architectural Engineering, Shihezi University, Shihezi 832021, China
2
USDA-ARS, Genetic and Sustainable Agricultural Research Unit, 810 Hwy 12 East, Mississippi State University, Starkville, MS 39762, USA
3
USDA Forest Service, Center for Bottomland Hardwoods Research, 775 Stone Blvd., Thompson Hall, Room 309, Mississippi State University, Starkville, MS 39762, USA
*
Author to whom correspondence should be addressed.
Climate 2020, 8(12), 145; https://doi.org/10.3390/cli8120145
Submission received: 15 November 2020 / Revised: 3 December 2020 / Accepted: 7 December 2020 / Published: 10 December 2020

Abstract

:
Asymmetric warming was bound to have a major impact on terrestrial ecosystems in arid regions during global warming. Further study was necessary to reveal the spatiotemporal patterns of asymmetric warming in Xinjiang; this study analyzed the climate and normalized difference vegetation index (NDVI) data (2000–2020). The change trends of the day and nighttime warming (DNW), seasonal warming, and the diurnal temperature range in northern Xinjiang (S1) and southern Xinjiang (S2) were determined. The findings indicated that the DNW rate showed a significant (p < 0.05) upward trend, especially in winter. The nighttime warming rate (0.65 °C (decade)−1) was faster than the daytime warming rate (0.4 °C (decade)−1), and the diurnal temperature range between daytime and nighttime exhibited a decreasing trend. The diurnal temperature range was the highest in spring and the lowest in winter. Extreme values of the diurnal temperature range appeared in autumn (48.6 °C) and winter (12.3 °C) and both in S1. The Tmin in S1 had an abruption trend in 2006–2017, the Tmax in S2 had an abruption trend in 2005–2011, and the probability of spatial abruption in S1 was higher than that in S2. The partial correlation between the NDVI and Tmin was significantly higher than that between the NDVI and Tmax in the area where the significance test passed; therefore, asymmetric nighttime warming had a greater impact on the NDVI than the asymmetric daytime warming.

1. Introduction

Since the 1950s, terrestrial ecosystems have experienced a continuous warming process [1,2,3]. With the increase in global average temperature, there is growing evidence suggesting that asymmetric patterns of day and nighttime warming (DNW) and seasonal warming are common in the warming process [4,5,6,7]. This phenomenon is called asymmetric warming [8]. The global average temperature has risen by 0.89 °C over the last 100 years [9], and the rate of temperature increase is 0.13 °C (decade)−1 [10,11]. Average global temperatures are projected to increase by 0.91–2 °C throughout the mid-21st century [12,13]. Located in the eastern part of Eurasia, China is one of the most complex regions experiencing global climate change and is strongly influenced by the eastern continental monsoon climate and the northwest inland arid climate [14,15]. In the past 40 years, the average surface temperature in China has risen by 1.1 °C, which is higher than the global warming rate [16,17,18,19,20]. The persistent enhancement of asymmetric warming will have significant impacts on terrestrial vegetation and even on the whole structure, functions, and services of ecosystems.
The IPCC’s (Intergovernmental Panel on Climate Change) fourth assessment reported that the global nighttime warming rate from 1957 to 2007 was 1.4 times the daytime warming rate [21,22]. Davy et al. [23] showed that the warming rate in summer was faster than that in spring and autumn in the high latitudes of the Northern Hemisphere. As an important part of terrestrial ecosystems, the growth and development of vegetation are bound to be affected by asymmetric warming. These generally relate differences in the temperature trends to regionalized cloud cover, precipitation, or soil moisture. Peng et al. [24] analyzed the interannual covariations of the satellite-derived normalized difference vegetation index (NDVI) with asymmetric warming over the Northern Hemisphere; their study showed that daily maximum temperatures were positively correlated with the NDVI in humid areas and had a significant negative correlation with the NDVI in arid areas. Xu et al. [25] investigated vegetated growth dynamics (annual productivity, seasonality, and the minimum amount of vegetated cover) in China and their relations with climatic factors during 1982–2011, and they believed that vegetation productivity was positively correlated with the nighttime warming rate. Nemani et al. [26] analyzed the climatic data and satellite observations of vegetation activity during 1982–1999 and found that vegetation growth representing the response cycle of asymmetric warming in high-latitude and high-altitude areas was shorter than that in low-latitude and low-altitude areas. Cong et al. [27] showed that asymmetric warming could accelerate respiration in plants and increase the decomposition rate of organic matter. However, little is known about the warming trends in the relationships between NDVI and asymmetric warming and precipitation, and understanding this is crucial for predicting how climate change would affect vegetation activity in the future.
Located in the arid and semiarid region of China, with a temperate continental climate, Xinjiang is a typical “mountain-oasis-desert” ecosystem [28]. As the area is affected by the sea-land distribution and the uplift of the Qinghai-Tibet Plateau, the differences in soil water-thermal status and geographical vegetation differentiation between S1 and S2 have been significant; these differences have led to different sensitivities of the vegetation types to climate factors in Xinjiang [29,30]. At present, research on the responses of vegetation activities to asymmetric warming mainly focuses on the differences in interannual average temperature and the geographic spatial and seasonal changes in vegetation types [31,32,33]. The changing trends of asymmetric warming, abruption characteristics, and the influence of precipitation on the NDVI over different time series have received little attention. Given this, in the context of global asymmetric warming, this paper was based on a global NDVI dataset, monthly minimum (Tmin) and maximum temperature (Tmax) data, and precipitation data in Xinjiang from 2000 to 2020. Least squares linear regression, Yamamoto and Mann–Kendall nonparametric randomization tests, and second-order partial correlation analysis were used to study the spatiotemporal patterns and abruption signatures of daytime and nighttime warming, seasonal warming, the diurnal temperature range, and the response of vegetation activities to asymmetric warming. The goal of this study was to provide a reference for the impacts of asymmetric warming on the vegetation ecosystems in Xinjiang.

2. Materials and Methods

2.1. Site Description

The geomorphological features of Xinjiang (73°40′–96°23′ E and 34°25′–49°10′ N) consist of 3 mountains and 2 basins, with a west-east width of approximately 1950 km, south-north length of approximately 1550 km, and a total area of 1.66 × 10⁶ km2. The mountain and basins, from north to south, are the Altai Mountains, the Junggar Basin, the Tianshan Mountains, the Tarim Basin, and the Karakoram Mountains. The Tianshan Mountains lie across the middle of the region [34]. On the basis of the meteorological definition and geomorphological characteristics of Xinjiang, the study area is further categorized into two regions: northern Xinjiang (S1) and southern Xinjiang (S2), with the Tianshan Mountain as the boundary (Figure 1). The mean annual temperatures in S1 and S2 are 13 and 19 °C, and the annual precipitation values are 180 and 95 mm, respectively; these precipitation values are only 15–28% of the average precipitation level of China (630 mm, 2000–2020).
Meteorological data were obtained from the dataset of monthly surface climate data of the China Meteorological Science Data service network (http://cdc.cma.gov.cn). The weather data are the maximum daytime temperature (Tmax), the minimum nighttime temperature (Tmin), and precipitation. To ensure homogeneity and the longest continuous observation, data from 34 ground-based meteorological stations of the China Meteorological Administration (CMA) were used in the study. The Kriging interpolation method was chosen in ArcGIS 10.4 with the spatial analyst extension and raster images. According to the existing seasonal division method [35], the monthly dataset was further averaged to spring (March, April, and May), summer (June, July, and August), autumn (September, October, and November), winter (December, January, and February), the growing season (April to October), and the non-growing season (November to March of the subsequent year).
The NDVI dataset from 2000 to 2020 was acquired from the MOD13A3 product of Goddard Space Flight Center, LAADS, NASA (https://ladsweb.modaps.eosdis.nasa.gov/), and the spatiotemporal resolution is 1 km, 30 days, respectively. This dataset was synthesized by the maximum value synthesis method (MVS) and processed by cloud, aerosol, water vapor, etc.; it is the longest time series currently acquired by the TERRA satellite.

2.2. Research Methods

The least-square linear regression method was applied to analyze the trend of DNW at the regional and pixel scales [36,37], and the significance of regression coefficients was determined by the t-test (p-values). * indicated significant (p = 0.05). ** indicated extremely significant (p = 0.01). The diurnal warming rate was calculated element-by-element, and the spatiotemporal patterns of the DNW rates in different seasons were analyzed.
C j = 19 × i = 1 19 i · φ i = 1 19 i · i = 1 19 φ 19 i = 1 19 i 2 ( i = 1 19 i ) 2
where i is the time series, ranging from 2000 to 2020; φ is the specified factor, including NDVI, Tmin, and Tmax; C j is the change tendency rate of the φ pixel in 20 years, C j > 0 indicates that the φ factor of pixel j has an increasing trend in the past 20 years, C j < 0 indicates a decreasing trend, and C j =   0 indicates no change.
Mann–Kendall and Yamamoto methods were employed to test the abruption of temperature in each time series [38,39]. Mann–Kendall method is a non-parametric statistical test. It is suitable for both type variable and ordinal variable, with no specific requirements on the distribution of samples, and Pearson correlation results were not dominated by outliers. The major mathematical methods were as follows:
For the time series, a rank s series is constructed:
S k   =   i = 1 k r i   k   =   2 , 3 n
r i   =   { 1   x i > x j 0   x i < x j   j   =   1 , 2 i
where rank series S k is the cumulative number of the i time value greater than j time. The statistics was defined under the assumption that the time series were independent:
U F k   =   | S k E ( S k ) | v a r ( S k )   k   =   1 , 2 n
U B k   =   U F k   k   =   n , n 1 1  
where U F 1 =   0 , E ( S k ) and v a r ( S k ) are the mean and variance of S k . When x 1 ,   x 2 x n were independent of each other and had the same continuous distribution, they were calculated as follows:
{ E ( S k )   =   k ( x 1 ) 4 v a r ( S k )   =   k ( x 1 ) ( 2 k + 5 ) 72     k = 2 , 3 n
Set U F k and U B k as standard normal distribution, given a significance value α = 0.05, critical value U0.05 = ±1.96, and two statistical sequence curves of U F k and U B k and the two critical lines (±1.96) were drawn in one graph.
Yamamoto method explores the abruption characteristics from two parts: climate information and climate noise. In this study, DPS 7.05 (http://www.chinadps.net/) was used to process the abruption data. The specific method was to define a signal-to-noise ratio:
S N   =   | x 1 ¯ x 2 ¯ | S 1 + S 2
where S is the population sample variance, and N is the length of the population sample sequence; x 1 ¯ and x 2 ¯ are average values of 2 sub-sample sets; S 1 and S 2 are variance of sub-sample. Molecular was defined when S / N > 1.0 .
To eliminate the interference of other variables except for temperature and precipitation, the second-order partial correlation analysis was used to investigate the influence of DNW on vegetation NDVI [39,40,41]. First, the second-order partial correlation between Tmax and NDVI was analyzed through limiting the influence of Tmin and precipitation; second, the second-order partial correlation between Tmin and NDVI was analyzed through limiting the influence of Tmax and precipitation. The second-order partial correlation coefficient was calculated based on the first-order partial correlation coefficient, and the first-order correlation coefficient needed to be calculated for Pearson’s correlation coefficient (zero-order). The partial correlation coefficients were calculated as follows:
r α δ   =   i = 1 n ( α i α ¯ ) ( φ i δ ¯ ) i = 1 n ( α i α ¯ ) 2 i = 1 n ( δ i δ ¯ ) 2
r α δ . 1   =   r α δ r α . 1 r δ . 1 1 r α . 1 2 · 1 r δ . 1 2
r α δ . 12   =   r α δ . 1 r α 2.1 r δ 2.1 1 r a 2.1 2 · 1 r δ 2.1 2
where   α and φ are principal variables by partial correlation coefficients; 1 and 2 are control variables; r α δ is correlation coefficient;   r α δ . 1 is the first-order partial correlation coefficient; r α δ . 12 is the second-order partial correlation coefficient. t-test was used to test the significance of the calculated second-order partial correlation coefficient. The formula is as follows:
t   =   r n q 1 1 r 2
where r is correlation coefficient; n and q are the number of samples and degrees of freedom.

3. Results

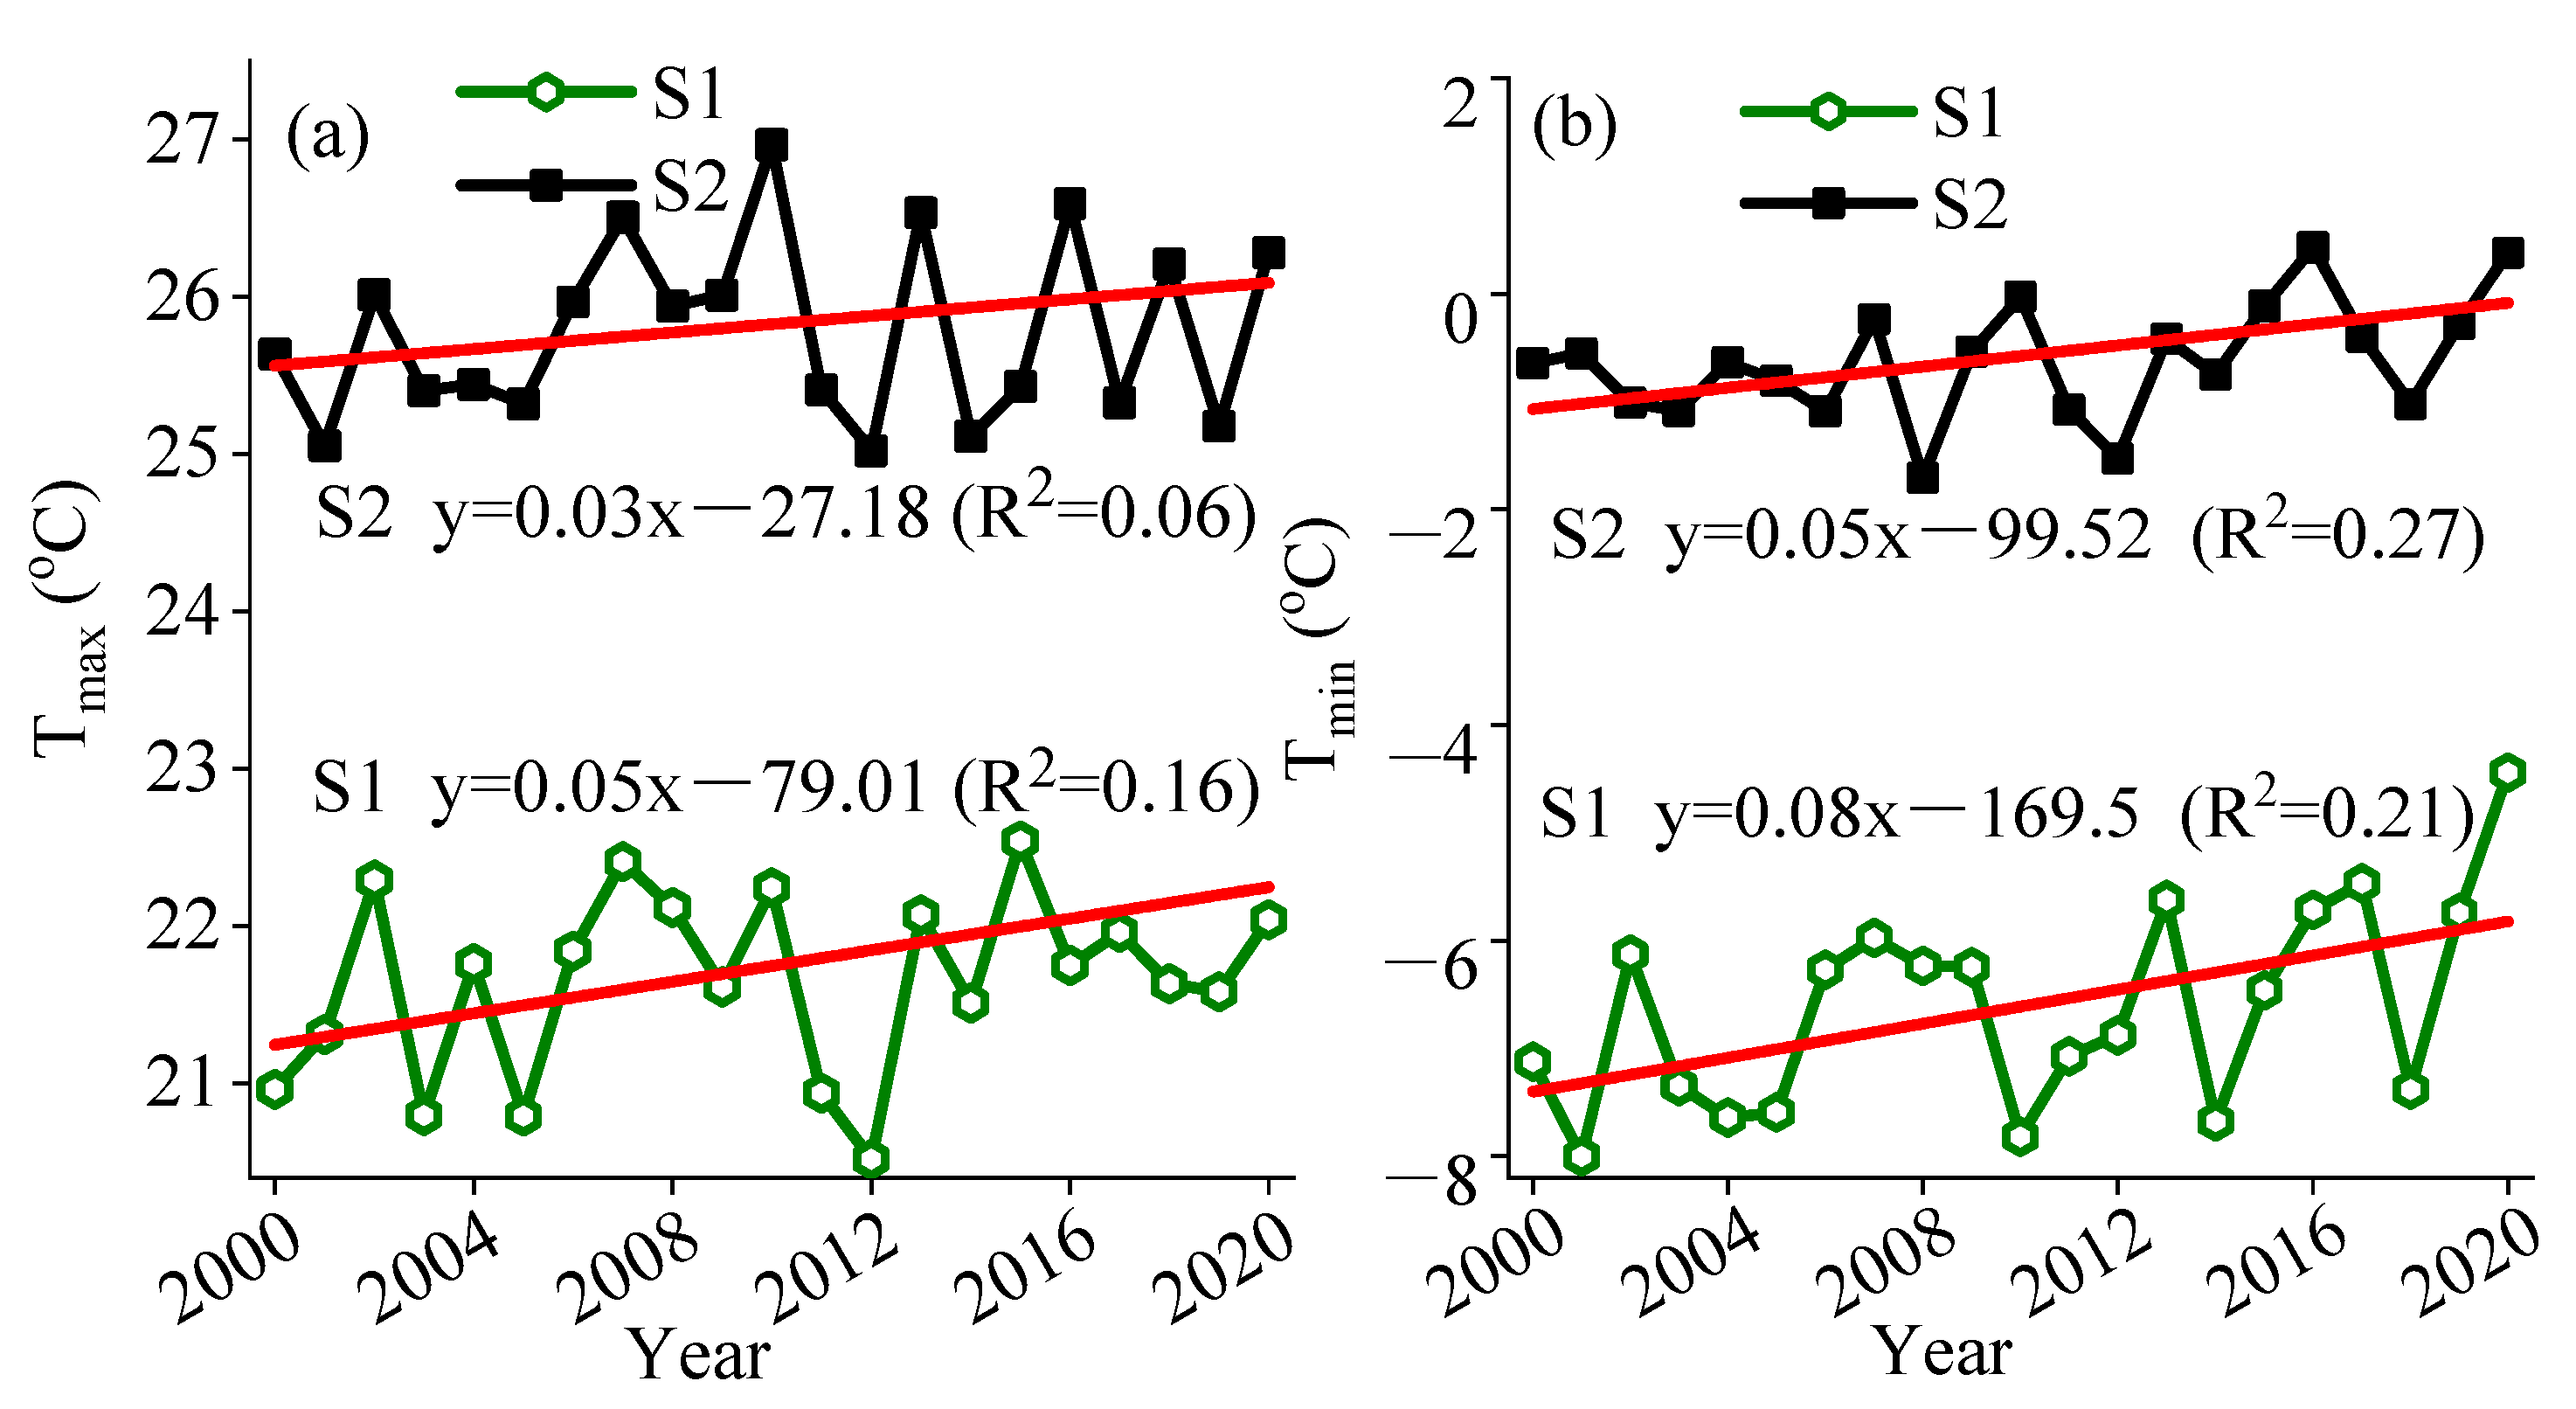
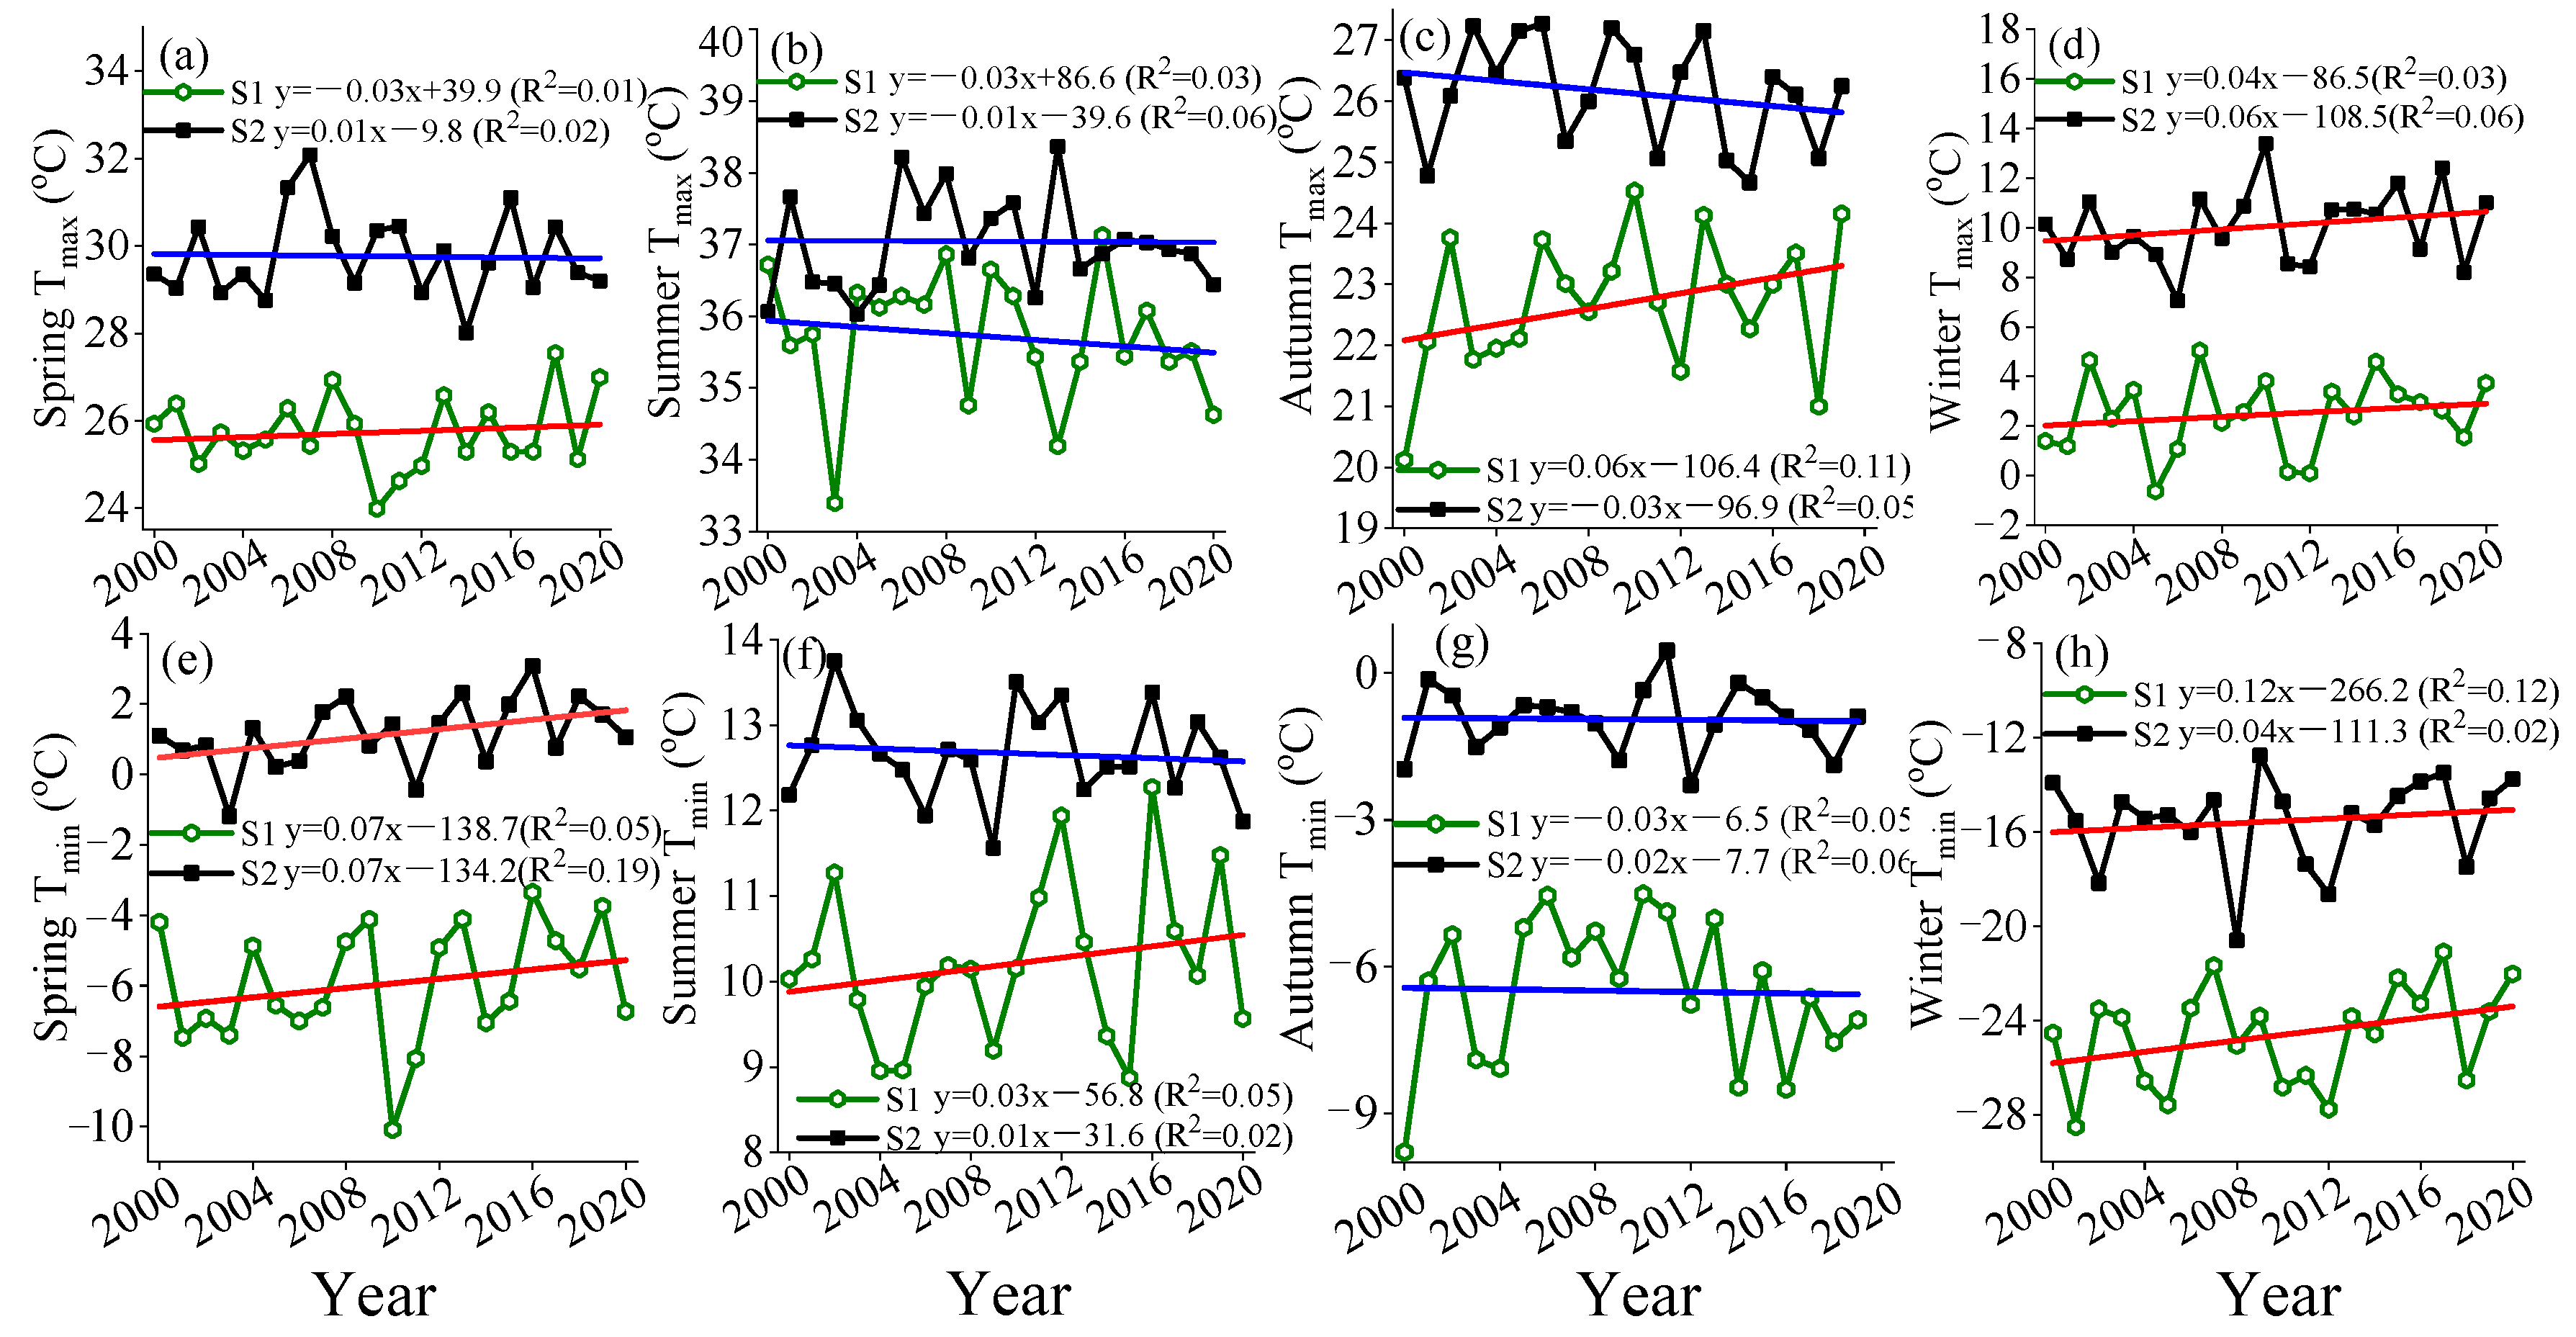
3.1. Interpreting Trends in Asymmetric Warming over Time

The interannual variation trend of DNW was calculated by a linear regression equation (Figure 2). Over the past 20 years, Tmax and Tmin in Xinjiang showed different degrees of warming trends. DNW had a local response period, i.e., cooling down every 2–3 years. The warming rates of Tmax in S1 and S2 were 0.5 and 0.3 °C (decade)−1, respectively, but the overall Tmax in S1 was 3–5 °C lower than that in S2 (p   < 0.01 ). The warming rates of Tmin in S1 and S2 were 0.8 and 0.5 °C (decade)−1, respectively. From 2000–2020, the interannual Tmin in S1 increased from −7.1 to −4.3 °C, and the Tmin in S2 increased from −0.8 to 1.4 °C. Therefore, the interannual Tmax and Tmin in both S1 and S2 presented asymmetrical daytime and nighttime temperature warming, i.e., the nighttime warming rates (0.65 °C (decade)−1) were faster than the daytime warming rates (0.40 °C (decade)−1).
There was considerable variation in the trends of seasonal Tmax and Tmin warming in S1 and S2 (Figure 3). The Tmax in S1 showed a cooling downward trend in summer and significant warming in other seasons. The Tmax in S2 showed a warming trend only in winter and a cooling down trend in other seasons. The Tmin in S1 showed a cooling down trend in autumn and significant increases in other seasons. The Tmin in S2 showed cooling downward trends in summer and autumn and significant warming trends in spring and winter. In addition, S1 and S2 had opposite temperature trends in spring Tmax, summer Tmin, and autumn Tmax; in these three seasons, the Tmax and Tmin in S1 both showed a warming trend, while the temperatures in S2 showed a cooling trend. This phenomenon is mainly due to the latitude differences between S1 and S2, which further supports the significant warming trend in higher latitudes in the northern hemisphere.
The DNW rates in S1 and S2 were asymmetrical in the four seasons. The warming rates of Tmin in winter and spring in S1 were 3 and 3.5 times those of Tmax, respectively; S1 had higher nighttime warming trends than daytime warming trends in spring, summer, and winter, while the opposite trend was seen for autumn. The warming rates of Tmin in spring and autumn in S2 were higher than the Tmax warming trend; inversely, for the daytime warming trend, the warming rate of Tmax was higher than the Tmin warming trend in winter, and the warming rate of Tmin in winter in S2 was 0.6 times that of Tmax. In addition, the warming rates of Tmin and Tmax were −0.1 °C (decade)−1 in summer, which failed to pass the significance test at the 0.05 level; thus, the cooling trend was not significant. Comparing the DNW rates of the two study areas, the warming rates of Tmax in autumn in S1 and Tmax in winter in S2 were the same (0.6 °C (decade)−1) and were significantly higher than those in other seasons (p <   0.01 ). The Tmin warming rate in S1 was fastest in winter (1.2 °C (decade)−1), and the Tmin warming rate in S2 was fastest in spring (0.7 °C (decade)−1).
There were regional differences in the diurnal temperature ranges in S1 and S2 in the four seasons (Figure 4). From 2000 to 2020, the diurnal temperature ranges in spring, summer, autumn, and winter in Xinjiang were 30.2, 25.3, 28.6, and 24.4 °C, respectively. The interannual diurnal temperature range showed a trend of spring > autumn > summer > winter. The diurnal temperature range in S1 was significantly higher than that in S2 in the spring and summer seasons in the second part of the time series (2013–2020); the trends in other seasons were not significant. The maximum and minimum diurnal temperature ranges appeared in autumn (48.6 °C) and winter (12.3 °C) in Xinjiang, and both appeared in S1 areas. The maximum diurnal temperature range in S2 appeared in the winter of 2008 (47.8 °C).

3.2. Spatial Distribution Characteristics of Asymmetric Warming

The warming rates of Tmax and Tmin in Xinjiang from 2000 to 2020 were spatially inconsistent (Figure 5a,b). Specifically, the Tmax warming rate was between −0.04 and 2.19 °C (decade)−1, and the Tmin warming rate was between −3.4 and 4.38 °C (decade)−1. The DNW rates in S1 and S2 both showed asymmetric warming trends, and the DNW rate in S1 was significantly higher than that in S2. The Tmax and Tmin in S2 showed cooling trends in the southwest and central regions, and the proportions of cooling trends were 5.3% and 2.9%, respectively.
The warming rate of the diurnal temperature range in the growing season in Xinjiang showed asymmetric warming trends of −2.07 and 2.15 °C (decade)−1 appeared in the western and eastern regions (Figure 5c), i.e., the trend was high in the eastern parts of the province, while in the western parts, the trend was low. The warming rate of the diurnal temperature range in the nongrowing season showed south- and north-low, middle-high trend (Figure 5d). In general, the diurnal temperature range in S2 showed a downtrend in the growing season, while that in S1 only showed a downtrend during the nongrowing season of vegetation.

3.3. Abruption Characteristics of DNW Warming

The abruption of DNW in Xinjiang was analyzed by the Yamamoto test (Figure 6). The changing point of Tmax warming in S1 and S2 occurred in 2006. The warming of Tmin in S1 had a strong abruption in 2006 and a weak abruption in 2010, but the warming of Tmin in S2 did not reach the detection standard of abruption. Therefore, the probability of S1 abruption was overall higher than that of S2.
The Mann–Kendall abruption test curve of DNW in Xinjiang was analyzed (Figure 7). Taking the critical value at the ( ± ) 95% confidence level (Zα/2 = 1.96) and a 5% degree of precision, it could be found from the UF and UB curves of the reverse time series, as well as their intersection point, that the warming trends of Tmin in S1 and S2 showed upward trends since 2003. Among the abruption results, S1 only presented a point abruption in 2017 (p   < 0.01 ); the first intersection point of the UF and UB curves appeared in 2006, and this intersection point was within the confidence interval. Therefore, it was determined that the first abruption year of Tmin warming in S1 was 2006; the abruption then reached an extremely significant level in 2017. The warming trend of Tmax in S1 was not significant (p for the trend = 0.103), while the warming trend of Tmax in S2 showed an upward trend in 2005–2011. The S2 region presented a point abruption in 2011 (p   < 0.01 ); the first intersection point of the UF and UB curves also appeared in 2006, and this intersection point was within the confidence interval. Similarly, the abruption of Tmax warming in S2 started in 2005 and reached an extremely significant level in 2011.

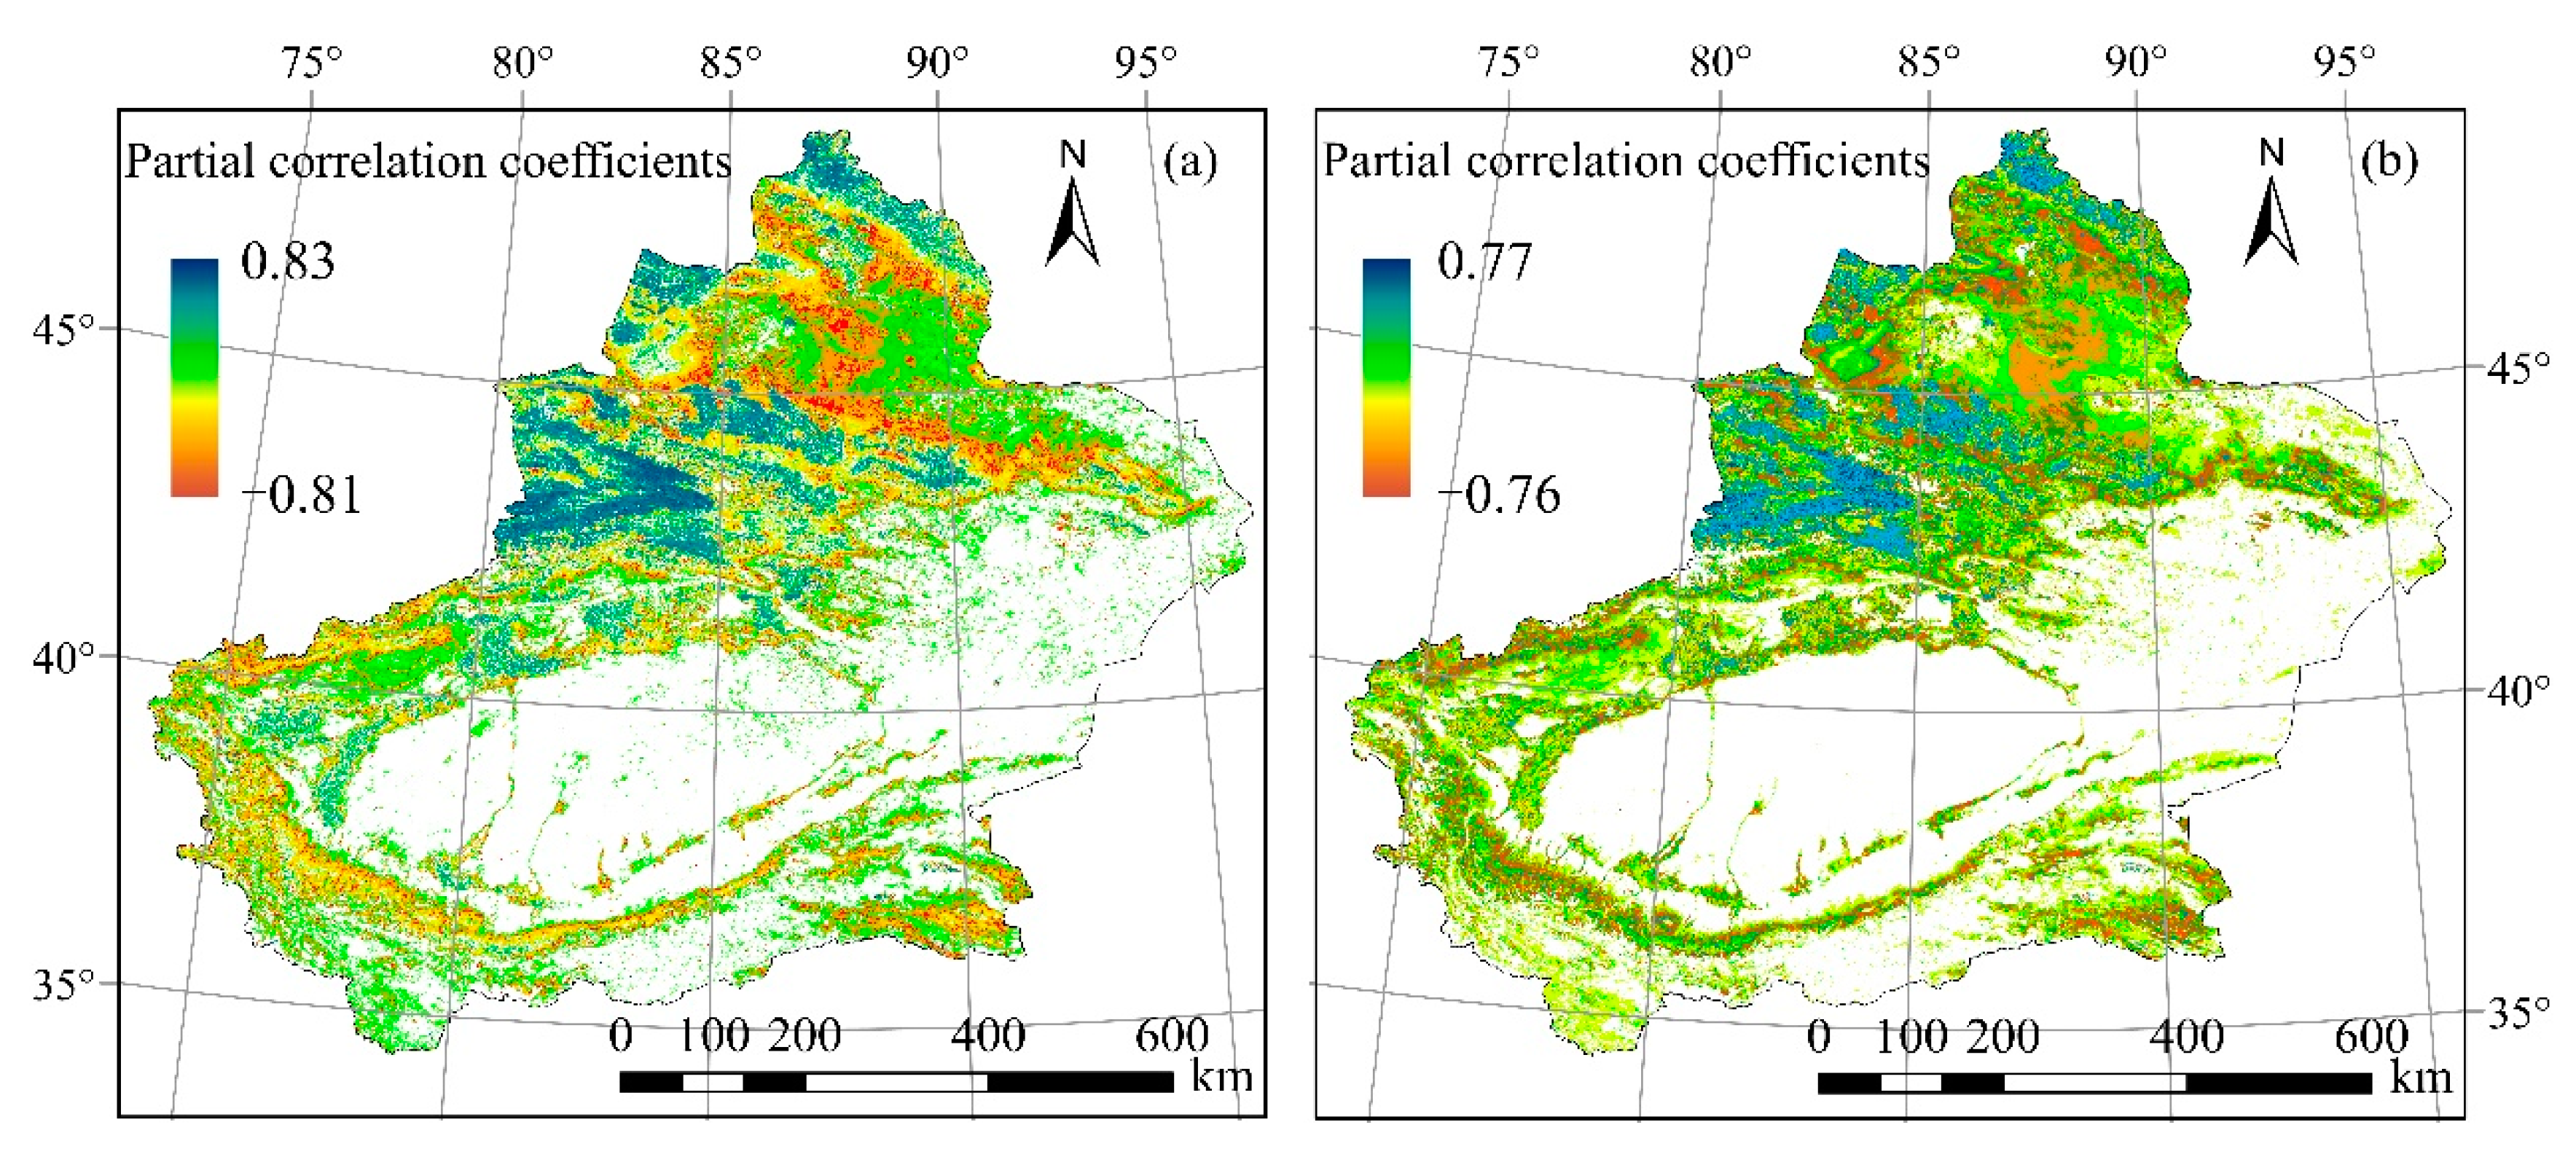
3.4. Partial Correlation Analysis between Vegetation Activity and Asymmetric DNW in Xinjiang

Precipitation was included as a control variable, and partial correlation analysis of NDVI and DNW was carried out at 34 meteorological stations in Xinjiang (Figure 8). The area of a positive correlation between the NDVI and Tmax accounted for approximately 32.8% of the total pixels, of which 7.7% showed a significant positive correlation (p < 0.05). Approximately 68.1% of the studied area and Tmax were negatively correlated, and 4.7% of those pixels were significantly negatively correlated (p < 0.05). The negative correlation areas were mainly distributed in the central part of the S1 area (Junggar Basin).
The distribution pattern of the correlation between NDVI and Tmin was opposite to that of NDVI and Tmax; approximately 60.7% of the studied area and Tmin were positively correlated, of which 10.2% showed a significant positive correlation (p < 0.05). Approximately 39.1% of the studied area and Tmin were negatively correlated, and 6.1% of those pixels were significantly negatively correlated (p < 0.05). The negative correlation areas were mainly distributed in the north-central part of the S1 area (Gurbantünggüt Desert plain). Thus, the effect of nighttime warming on vegetation in Xinjiang was more extensive than the effect of daytime warming. From the spatial distribution of DNW, the distribution trend of the partial correlation coefficient between NDVI and DNW was basically consistent in the S2 area.

4. Discussion

4.1. Causes of Asymmetric Warming

The warming rates of Tmax and Tmin in Xinjiang from 2000 to 2020 showed significant upward trends. The warming rate of Tmin was 1.6 times (S1) to 1.67 times (S2) that of Tmax. Li et al. [10] found that the summer Tmax and Tmin warming trends in Xinjiang from 1961 to 2005 were significant and that the interannual warming rate was 0.28 °C. The results of this study showed that the warming rates of Tmax and Tmin in the S2 area were 0.3 and 0.5 °C (decade)−1, respectively, which were higher than those reported by Li et al. [10]. The warming rates of Tmax and Tmin further corroborated the research results. Tan et al. [5] showed that the global land surface temperature in the past 50 years increased significantly faster at nighttime than in the daytime and that the nighttime warming rate was 1.4 times that of the daytime. The DNW trends in S1 and S2 in this study had global coherence, and the warming rates in these areas were higher than the world average. However, the DNW was asymmetric; i.e., the nighttime warming rate (0.65 °C (decade)−1) was faster than the daytime warming rate (0.4 °C (decade)−1). The S1 study area has a temperate continental arid and semiarid climate with a large basin area, while S2 has a warm temperate continental arid climate and the world’s second-largest mobile desert. The atmospheric inverse radiation in S2 is higher than that in S1, and the average annual precipitation in S1 is twice that in S2. These climate differences affect the atmospheric circulation of the two regions; thus, the difference in climate types was the main reason that the nighttime warming rate was higher than the daytime warming rate [42,43]. Another possible explanation for this is the impact of human activities on DNW [44,45].

4.2. Abruption Trend Analysis of Asymmetric Warming

In Xinjiang, Tmax and Tmin experienced sudden warming in 2011 and 2017, respectively, and the warming trend of Tmin after 2005 was significant. There were also asymmetric changes in the abruption times of Tmax and Tmin. The Yamamoto and Mann–Kendall tests indicated good consistency of the abruption test results over time; i.e., the abruption probability in S1 was higher than that in S2, and the abruptions occurred mainly in nighttime trends in S1 and daytime trends in S2. The S1 study area showed an abruption trend in Tmin from 2006 to 2017, and S2 also showed an abruption trend in Tmax from 2005 to 2011; both study areas experienced upward trends. This showed that the duration of warming abruption of the extreme Tmin values in S1 was longer than that of the extreme Tmax values in S2, and the duration of warming abruption in S1 was twice as long as that of S2 for extreme Tmax values. At the same time, this result indicated that the temperature difference of DNW in Xinjiang would show a decreasing trend in the future.

4.3. Effects of Asymmetric Warming on Vegetation NDVI

The NDVI is an indicator of vegetation growth change, and the responses of NDVI to Tmax and Tmin reflect the effects of DNW asymmetric warming on terrestrial ecology. However, the DNW was asymmetric, i.e., the effect of nighttime (0.65 °C (decade)−1) warming on vegetation activity was more significant than that of daytime warming. A possible reason for this result is that plants fix carbon (C) by photosynthesis during the day, while respiration takes place all the time (day- and nighttime). The imbalanced DNW rate leads to an increase in the respiration of plants at nighttime and prompts an increase in the soil organic matter decomposition rate [25]. The growth of vegetation must rely on environmental temperatures for energy to regulate internal biochemical processes and further regulate growth in the phenological period. Nemani et al. [26] found that the limiting factor for vegetation growth in high-latitude and high-altitude areas was temperature. High-altitude vegetation was more sensitive to the asymmetry of DNW; this result was in line with the results obtained in the current study. Xinjiang is located in an arid and semiarid area, and water shortage is the main limiting factor for vegetation growth. The NDVI values were positively correlated with Tmax and Tmin in S1 (Junggar Basin desert steppe) and S2 (Taklimakan Desert basin); this correlation is largely attributable to the physiological regulation mechanism of vegetation, which enhances the water absorption capacity of plant roots experiencing drought stress. Peng et al. [22] suggested that DNW both enhanced and inhibited vegetation growth through different disturbance mechanisms. The western area of S1 has sufficient precipitation compared with that of S2; Tmax warming has a more significant positive effect on coniferous forests, broad-leaved forests, and meadow grasslands. When Tmax warms continuously and exceeds the optimal temperature required for vegetation growth, vegetation growth will be inhibited; previously, vegetation growth was mainly limited by precipitation. In addition, continuous warming of Tmax accelerates the evaporation of soil water in the daytime and aggravates the drought stress of the soil. In this situation, the vegetation cannot obtain the necessary moisture from the soil; therefore, the response of vegetation growth to increasing Tmax in S1 was mostly negatively correlated, and the response of grassland vegetation to increasing Tmax was significant. In contrast, S2 has scarce precipitation all year, a dry climate, and a high-altitude vegetation water supply that mostly comes from alpine meltwater. The NDVI was weakly correlated with Tmax in S2. To better explain the response mechanisms of vegetation activity and vegetation growth stress to extreme climate events and climate change, human activities and vegetation physiological characteristics should be comprehensively considered in future research.

5. Conclusions

This study analyzed monthly Tmax, Tmin, precipitation, and NDVI datasets (2000–2020) and determined the change trends of DNW, seasonal warming, and the diurnal temperature range in S1 and S2. The conclusions are as follows.
During the study period between 2000 and 2020, the DNW in S1 and S2 of Xinjiang showed warming trends, and the warming rates were higher than the world average. However, DNW, seasonal warming, and the diurnal temperature range in S1 and S2 were asymmetrical, and the nighttime warming rate (0.65 °C (decade)−1) was faster than the daytime warming rate (0.4 °C (decade)−1). The S1 area had higher nighttime warming trends than daytime warming trends in spring, summer, and winter, while the opposite trend was identified in autumn. The nighttime warming trend in S2 in spring and autumn was higher than the daytime warming trend, and the opposite trend was observed in winter. The interannual diurnal temperature range showed a trend of spring > autumn > summer > winter. The positive partial correlation between NDVI and Tmin was significantly higher than that between NDVI and Tmax in the area where the significance test passed. The abruption probability in S1 was higher than that in S2, and the abruptions mainly occurred in nighttime warming in S1 and daytime warming in S2. The S1 area showed an abruption trend in Tmin from 2006 to 2017, and S2 also showed an abruption trend in Tmax from 2005 to 2011; both exhibited upward trends. The responses of vegetation activities to DNW in Xinjiang had significant spatial differences, especially between the Junggar Basin (S1) and Gurbantünggüt Desert plain (S2).

Author Contributions

Formal analysis, data curation, writing—original draft, conceptualization, methodology, T.H.; conceptualization, methodology, writing, revision, supervision, G.F.; editing, Y.O.; editing, X.H. All authors have read and agreed to the published version of the manuscript.

Funding

This research was funded by the National Natural Science Foundation of China [grant number 51969027, U1803244] and the China Scholarship Council.

Acknowledgments

The authors are grateful to the anonymous reviewers and the corresponding editor for their helpful and constructive comments and suggestions for improving the manuscript.

Conflicts of Interest

The authors declare no conflict of interest.

References

  1. Sévellec, F.; Drijfhout, S.S. A novel probabilistic forecast system predicting anomalously warm 2018-2022 reinforcing the long-term global warming trend. Nat. Commun. 2018, 9, 1–12. [Google Scholar] [CrossRef]
  2. Hui, C.; Zheng, X. Uncertainty in Indian Ocean Dipole response to global warming: The role of internal variability. Clim. Dyn. 2018, 51, 3597–3611. [Google Scholar] [CrossRef]
  3. Wills, R.C.J.; Schneider, T.; Wallace, J.M.; Dbattisti, D.S.; Hartmann, D.L. Disentangling Global Warming, Multidecadal Variability, and El Niño in Pacific Temperatures. Geophys. Res. Lett. 2018, 45, 2487–2496. [Google Scholar] [CrossRef] [Green Version]
  4. Donat, M.G.; Alexander, L.V. The shifting probability distribution of global daytime and night-time temperatures. Geophys. Res. Lett. 2012, 39. [Google Scholar] [CrossRef] [Green Version]
  5. Tan, J.; Piao, S.; Chen, A.; Zeng, Z.; Ciais, P.; Janssens, I.A.; Mao, J.; Myneni, R.B.; Peng, S.; Peñuelas, J.; et al. Seasonally different response of photosynthetic activity to daytime and night-time warming in the Northern Hemisphere. Glob. Chang. Biol. 2014, 21, 377–387. [Google Scholar] [CrossRef] [PubMed]
  6. Clark, J.S.; Melillo, J.; Mohan, J.; Salk, C. The seasonal timing of warming that controls onset of the growing season. Glob. Chang. Biol. 2013, 20, 1136–1145. [Google Scholar] [CrossRef]
  7. Jansen, M.F.; Ferrari, R.; Mooring, T.A. Seasonal versus permanent thermocline warming by tropical cyclones. Geophys. Res. Lett. 2010, 37. [Google Scholar] [CrossRef]
  8. Karl, T.R.; Jones, P.D.; Knight, R.W.; George, K.; Thomas, C.P. A New Perspective on Recent Global Warming: Asymmetric Trends of Daily Maximum and Minimum Temperature. Bull. Am. Meteor. Soc. 1993, 74, 1007–1024. [Google Scholar] [CrossRef] [Green Version]
  9. Yan, T.; Song, H.; Zeng, H. Spring phenophases of larch are more sensitive to spring warming than to year-round warming: Results of a seasonally asymmetric warming experiment. For. Ecol. Manag. 2020, 474, 118368. [Google Scholar] [CrossRef]
  10. Li, Q.; Chen, Y.; Shen, Y.; Li, X.; Xu, J. Spatial and temporal trends of climate change in Xinjiang, China. J. Geogr. Sci. 2011, 21, 1007–1018. [Google Scholar] [CrossRef]
  11. Chou, C.; Neelin, J.D. Mechanisms of Global Warming Impacts on Regional Tropical Precipitation. J. Clim. 2004, 17, 2688–2701. [Google Scholar] [CrossRef] [Green Version]
  12. Vicente-Serrano, S.M.; Beguería, S.; López-Moreno, J.I. A Multiscalar Drought Index Sensitive to Global Warming: The Standardized Precipitation Evapotranspiration Index. J. Clim. 2010, 23, 1696–1718. [Google Scholar] [CrossRef] [Green Version]
  13. Xie, S.-P.; Deser, C.; Vecchi, G.A.; Ma, J.; Teng, H.; Wittenberg, A.T. Global Warming Pattern Formation: Sea Surface Temperature and Rainfall. J. Clim. 2010, 23, 966–986. [Google Scholar] [CrossRef]
  14. Dong, W.; Jiang, Y.; Yang, S. Response of the starting dates and the lengths of seasons in Mainland China to global warming. Clim. Chang. 2009, 99, 81–91. [Google Scholar] [CrossRef]
  15. Zhu, C.; Wang, B.; Qian, W. Why do dust storms decrease in northern China concurrently with the recent global warming? Geophys. Res. Lett. 2008, 35. [Google Scholar] [CrossRef] [Green Version]
  16. He, W.P.; Feng, G.; Wang, L.; Wang, C.J.; Zhou, G.H.; Wan, S.Q. Potential impacts of global warming on extreme warm month events in China. Acta Phys. Sin. 2009, 58, 5083–5090. [Google Scholar]
  17. Zhang, A.; Bian, R.; Hussain, Q.; Li, L.; Pan, G.; Zheng, J.; Zhang, X.; Zheng, J. Change in net global warming potential of a rice-wheat cropping system with biochar soil amendment in a rice paddy from China. Agric. Ecosyst. Environ. 2013, 173, 37–45. [Google Scholar] [CrossRef]
  18. Sun, W.; Mu, X.; Song, X.; Wu, D.; Cheng, A.; Qiu, B. Changes in extreme temperature and precipitation events in the Loess Plateau (China) during 1960–2013 under global warming. Atmos. Res. 2016, 168, 33–48. [Google Scholar] [CrossRef]
  19. Li, L.; Zha, Y. Satellite-based regional warming hiatus in China and its implication. Sci. Total. Environ. 2019, 648, 1394–1402. [Google Scholar] [CrossRef]
  20. Zhou, M.; Zhou, G.; Lv, X.; Zhou, L.; Ji, Y. Global warming from 1.5 to 2 °C will lead to increase in precipitation intensity in China. Int. J. Clim. 2019, 39, 2351–2361. [Google Scholar] [CrossRef]
  21. Li, H.; Chen, H.; Wang, H.; Yu, E. Future precipitation changes over China under 1.5 °C and 2.0 °C global warming targets by using CORDEX regional climate models. Sci. Total. Environ. 2018, 641, 543–554. [Google Scholar] [CrossRef] [PubMed]
  22. Hans, M.F. An updated assessment of the risks from climate change based on research published since the IPCC Fourth Assessment Report. Clim. Chang. 2009, 97, 469–482. [Google Scholar] [CrossRef]
  23. Davy, R.; Esau, I.; Chernokulsky, A.; Outten, S.; Zilitinkevich, S. Diurnal asymmetry to the observed global warming. Int. J. Clim. 2017, 37, 79–93. [Google Scholar] [CrossRef] [Green Version]
  24. Peng, S.; Piao, S.; Ciais, P.; Myneni, R.B.; Chen, A.; Chevallier, F.; Dolman, A.J.; Janssens, I.A.; Peñuelas, J.; Zhang, G.; et al. Asymmetric effects of daytime and night-time warming on Northern Hemisphere vegetation. Nat. Cell Biol. 2013, 501, 88–92. [Google Scholar] [CrossRef]
  25. Xu, G.; Zhang, H.; Chen, B.; Zhang, H.; Innes, J.L.; Wang, G.; Yan, J.; Zheng, Y.; Zhu, Z.; Myneni, R.B. Changes in Vegetation Growth Dynamics and Relations with Climate over China’s Landmass from 1982 to 2011. Remote. Sens. 2014, 6, 3263–3283. [Google Scholar] [CrossRef] [Green Version]
  26. Nemani, R.R.; Keeling, C.D.; Hashimoto, H. Climate-driven increases in global terrestrial net primary production from 1982 to 1999. Science 2003, 300, 1560–1563. [Google Scholar] [CrossRef] [Green Version]
  27. Cong, N.; Shen, M.; Yang, W.; Yang, Z.; Zhang, G.; Piao, S. Varying responses of vegetation activity to climate changes on the Tibetan Plateau grassland. Int. J. Biometeorol. 2017, 61, 1433–1444. [Google Scholar] [CrossRef]
  28. Xu, C.; Li, J.; Zhao, J.; Gao, S.; Chen, Y. Climate variations in northern Xinjiang of China over the past 50 years under global warming. Quat. Int. 2015, 358, 83–92. [Google Scholar] [CrossRef]
  29. Shi, Y.; Shen, Y.; Kang, E.; Li, D.; Ding, Y.; Zhang, G.; Hu, R. Recent and Future Climate Change in Northwest China. Clim. Chang. 2007, 80, 379–393. [Google Scholar] [CrossRef]
  30. Tao, H.; Fischer, T.; Su, B.; Mao, W.; Jiang, T.; Fraedrich, K. Observed changes in maximum and minimum temperatures in Xinjiang autonomous region, China. Int. J. Clim. 2017, 37, 5120–5128. [Google Scholar] [CrossRef]
  31. Su, T.; Feng, G.; Zhou, J.; Ye, M. The response of actual evaporation to global warming in China based on six reanalysis datasets. Int. J. Clim. 2014, 35, 3238–3248. [Google Scholar] [CrossRef]
  32. Zhang, L.; Yu, D.; Shi, X.; Weindorf, D.C.; Zhao, L.; Ding, W.; Wang, H.; Pan, J.; Li, C. Simulation of global warming potential (GWP) from rice fields in the Tai-Lake region, China by coupling 1:50,000 soil database with DNDC model. Atmos. Environ. 2009, 43, 2737–2746. [Google Scholar] [CrossRef]
  33. Zhao, P.; Yang, S.; Yu, R. Long-Term Changes in Rainfall over Eastern China and Large-Scale Atmospheric Circulation Associated with Recent Global Warming. J. Clim. 2010, 23, 1544–1562. [Google Scholar] [CrossRef]
  34. Feng, Y.; Coleman, R.G.; Tilton, G.; Xiao, X. Tectonic evolution of the West Junggar Region, Xinjiang, China. Tectonics 1989, 8, 729–752. [Google Scholar] [CrossRef]
  35. Woods, P.R.; Bailey, K.R.; Wood, C.M.; Johnson, B.D. Submaximal exercise gas exchange is an important prognostic tool to predict adverse outcomes in heart failure. Eur. J. Hear. Fail. 2011, 13, 303–310. [Google Scholar] [CrossRef] [Green Version]
  36. Decundo, J.; Susana, N.; Diéguez, G.M.; Agustina, R.; Alejandro, L.S. Impact of water hardness on oxytetracycline oral bioavailability in fed and fasted piglets. Vet. Med. Sci. 2019, 5. [Google Scholar] [CrossRef]
  37. Liu, L.; Guo, Z.; Huang, G.; Wang, R. Water Productivity Evaluation under Multi-GCM Projections of Climate Change in Oases of the Heihe River Basin, Northwest China. Int. J. Environ. Res. Public Heal. 2019, 16, 1706. [Google Scholar] [CrossRef] [Green Version]
  38. Liu, Z.; Wang, R.; Tian, X.; Zhong, X.; Gangopadhyay, J.; Cole, R.; Ikemoto, N.; Chen, S.R.W.; Wagenknecht, T. Dynamic, inter-subunit interactions between the N-terminal and central mutation regions of cardiac ryanodine receptor. J. Cell Sci. 2010, 123, 1775–1784. [Google Scholar] [CrossRef] [Green Version]
  39. Suh, W.W.; Cho, S.H.; Yoo, J.Y.; Kim, H.S.; Song, H.R.; Kim, W.J.; Lee, S.M.; Hong, M. Relationship between Psychological Correlates and Empathy in Medical Students: A Cross-Sectional Study. Psychiatry Investig. 2019, 16, 766–772. [Google Scholar] [CrossRef]
  40. Wj, J.; Chen, X.; Khaytin, I.; Bonds, A.B.; Casagrande, V.A. Relationship between spontaneous and evoked spike-time correlations in primate visual cortex. J. Neurophysiol. 2009, 101, 2279–2289. [Google Scholar] [CrossRef] [Green Version]
  41. Buermann, W.; Forkel, M.; O’Sullivan, M.; Sitch, S.; Friedlingstein, P.; Haverd, V.; Jain, A.K.; Kato, E.; Kautz, M.; Lienert, S.; et al. Widespread seasonal compensation effects of spring warming on northern plant productivity. Nature 2018, 562, 110–114. [Google Scholar] [CrossRef] [Green Version]
  42. Karl, T.R.; Kukla, G.; Razuvayev, V.N.; Changery, M.J.; Quayle, R.G.; Heim, R.R.; Easterling, D.R.; Bin Fu, C. Global warming: Evidence for asymmetric diurnal temperature change. Geophys. Res. Lett. 1991, 18, 2253–2256. [Google Scholar] [CrossRef]
  43. Jiang, S.; Wang, K.; Mao, Y. Rapid Local Urbanization around Most Meteorological Stations Explain the Observed Daily Asymmetric Warming Rates across China from 1985 to 2017. J. Clim. 2020, 33, 1–57. [Google Scholar] [CrossRef]
  44. Che, R.; Deng, Y.; Wang, W.; Rui, Y.; Cui, X.; Tahmasbian, I.; Tang, L.; Wang, S.; Wang, Y.; Xu, Z.; et al. Long-term warming rather than grazing significantly changed total and active soil procaryotic community structures. Geoderma 2018, 316, 1–10. [Google Scholar] [CrossRef]
  45. Thakuri, S.; Dahal, S.; Shrestha, D.; Guyennon, N.; Romano, E.; Colombo, N.; Salerno, F. Elevation-dependent warming of maximum air temperature in Nepal during 1976–2015. Atmos. Res. 2019, 228, 261–269. [Google Scholar] [CrossRef]
Figure 1. Distribution of meteorological stations in the studied region.
Climate 08 00145 g001
Figure 2. Tmax (a) and Tmin (b) trends in the S1 and S2 regions with arid and semiarid climate, 2000–2020.
Climate 08 00145 g002
Figure 3. Seasonal Tmax and Tmin temperature trends in the studied regions S1 and S2, (a): spring Tmax, (b): summer Tmax, (c): autumn Tmax, (d): winter Tmax, (e): spring Tmin, (f): summer Tmin, (g): autumn Tmin, (h): winter Tmin. S1 and S2 represent two regions of the study area.
Climate 08 00145 g003
Figure 4. Seasonal variation trend of diurnal temperature range, (a): spring, (b): summer, (c): autumn, (d): winter. The red and blue scatter points represent the maximum and minimum of the daily range; S1 and S2 represent two regions of the study area.
Climate 08 00145 g004
Figure 5. The spatial distribution of averaged Tmax and Tmin over 20 years in the arid and semiarid region, (a): the trend of Tmax, (b): the trend of Tmin, (c): diurnal range in the growing season of vegetations, (d): diurnal range in the non-growing season of vegetations. S1 and S2 represent two regions of the study area.
Climate 08 00145 g005
Figure 6. Abrupt change detection for (a): Tmax, (b): Tmin, Yamamoto test. S1 and S2 represent two regions of the study area.
Climate 08 00145 g006
Figure 7. Mann–Kendall test for monotonic trend of (a) Tmax over S1 region, (b) Tmax over S1 region, (c) Tmin over S1 region, and (d) Tmin over S1 region. S1 and S2 represent two regions of the study area, UF and UB are statistics about temperature series, which obeys standard normal distribution. If UF and UB intersect, they represent the start time of an abrupt change.
Climate 08 00145 g007
Figure 8. The partial correlation coefficient of vegetation NDVI (normalized difference vegetation index) with Tmax (a) and Tmin (b) in the arid and semiarid regions.
Climate 08 00145 g008
Publisher’s Note: MDPI stays neutral with regard to jurisdictional claims in published maps and institutional affiliations.

