Article

A Model to Assess Eastern Cottonwood Water Flow Using Adjusted Vapor Pressure Deficit Associated with a Climate Change Impact Application

1
USDA Forest Service, Center for Bottomland Hardwoods Research, 775 Stone Blvd., Thompson Hall, Room 309, Mississippi State, MS 39762, USA
2
USDA Forest Service, Center for Bottomland Hardwoods Research, 432 Stoneville Road, Stoneville, MS 38776, USA
3
Department of Forestry, Mississippi State University, Hood Road, MS 39762, USA
4
School of Forestry and Wildlife Sciences, Auburn University, Auburn, AL 36849, USA
*
Author to whom correspondence should be addressed.
Climate 2021, 9(2), 22; https://doi.org/10.3390/cli9020022
Submission received: 11 December 2020 / Revised: 29 December 2020 / Accepted: 19 January 2021 / Published: 23 January 2021

Abstract

:
Short-rotation woody crops have maintained global prominence as biomass feedstocks for bioenergy, in part due to their fast growth and coppicing ability. However, the water usage efficiency of some woody biomass crops suggests potential adverse hydrological impacts. Monitoring tree water use in large-scale plantations would be very time-consuming and cost-prohibitive because it would typically require the installation and maintenance of sap flux sensors and dataloggers or other instruments. We developed a model to estimate the sap flux of eastern cottonwood (Populus deltoides. Bartr. ex Marsh.)) grown in bioenergy plantations. This model is based on adjusted vapor pressure deficit (VPD) using Structural Thinking and Experiential Learning Laboratory with Animation (STELLA) software (Architect Version 1.8.2), and is validated using the sap flux data collected from a 4-year-old eastern cottonwood biomass production plantation. With R2 values greater than 0.79 and Nash Sutcliffe coefficients greater than 0.69 and p values < 0.001, a strong agreement was obtained between measured and predicted diurnal sap flux patterns and annual sap flux cycles. We further validated the model using eastern cottonwood sap flux data from Aiken, South Carolina, USA with a good agreement between method predictions and field measurements. The model was able to predict a typical diurnal pattern, with sap flux density increasing during the day and decreasing at night for a 5-year-old cottonwood plantation. We found that a 10% increase in VPD due to climate change increased the sap flux of eastern cottonwood by about 5%. Our model also forecasted annual sap flux characteristics of measured cycles that increased in the spring, reached a maximum in the summer, and decreased in the fall. The model developed here can be adapted to estimate sap flux of other trees species in a time- and cost-effective manner.

1. Introduction

Fossil fuel consumption has been strongly tied to various sources of environmental degradation. Climate change, in particular, is attributed in part to CO2 emissions, and this issue has motivated continuing efforts to identify sustainable alternatives to fossil fuels [1,2,3,4]. Various types of biomass have been identified as renewable bioenergy feedstocks of global significance [4,5,6,7,8,9]. Algae, agronomic crops, grasses, trees, municipal wastes, and other biological materials can be sourced for biomass, and biomass can be converted to solid, liquid, or gaseous fuels to yield energy for industrial, commercial, and domestic uses. The US Department of Energy is promoting an increased usage of biofuels in the United States by targeting the creation of a biomass supply of 1 billion dry tons per year by 2030 [4].
Tree and shrub cultivation in short-rotation (2–15 years) provides for high-yielding bioenergy feedstock production. Over the past several decades, researchers have refined improvements in short-rotation tree and shrub species such as eastern cottonwood (Populus deltoides Bartr. ex Marsh.), willow (Salix spp. L.), and eucalyptus (E. globulus Labill.) by selecting for rapid growth, pest tolerance, and site suitability [10,11]. Eastern cottonwood is a fast-growing poplar and one of the largest native North American broadleaf trees [12]. Eucalyptus is among the fastest growing hardwood plantation species utilized around the world. Its suitability to plantation culture is driving current research and development towards application to large-scale biomass production in the southern United States [11,13]. Shrub willows have been selected for short-rotation intensive culture in the northeastern, north–central, and mid-Atlantic regions of the United States [14].
There are, however, concerns about the water use of trees in short-rotation bioenergy systems, especially in regard to the potential adverse environmental impacts of excessive water use [15,16,17,18,19]. Scott and Lesch [20] reported a 90 to 100% reduction in stream flow for eucalyptus and a 40 to 60% reduction in stream flow for pines (Pinus spp. L.) in the first 8 years or so after planting. Morris et al. [21] studied water use in the eucalyptus plantations of southern China and noted that annual water use by these plantations is about 550 mm, but potential annual water use could reach 865 mm where soil water was not limiting. Flanagan et al. [19] used the eddy covariance measurement of evapotranspiration (ET) to estimate water use in a riparian cottonwood ecosystem in Alberta, Canada. They found a comparatively high water use driven by relatively warm summer temperatures and high vapor pressure deficit ((VPD) which is the difference between the amount of moisture in the air and the maximum (saturated) amount of moisture the air can hold) and supported by sufficient availability of alluvial groundwater. In regard to VPD, Weih [22] reported that fast-growing hybrid willows are generally more sensitive to water stress and have lower water use efficiency than slower-growing wild clones. Though the studies cited above provide valuable insights into water use by trees in short-rotation bioenergy systems, the long-term, continuous, and real-time monitoring of water use by trees in biomass production plantations has rarely been conducted.
Sap flux measurement is currently the most widely used method for assessing individual tree water use. Its advantages include a well-established technology, the ability to continuously monitor trees for lengthy time periods, and the fact that instrumentation does not modify the ambient environment [23,24]. However, for commercially sized biomass production plantations, it would be very time-consuming and costly to install and maintain a sufficient number of sensors and dataloggers to accurately and continuously assess tree water use with real-time resolution. Therefore, there is a need to develop practical and reliable methods for estimating tree water use in intensively managed short-rotation woody crop systems.
This problem may be addressed with an understanding of the relationships between sap flux and its driving environmental variables [24,25,26,27,28,29]. Hogg et al. [25] compared the sap flux and eddy flux of water vapor in a boreal deciduous forest and found that the sap flux response lagged behind eddy flux measurements by about 1 hour diurnally—presumably because of water storage within the trees. Nadezhdina [26], who studied sap flux in apple trees (Malus domestica Borkh.) over one growing season, found correlations to the diurnal patterns of leaf water potential, air temperature, relative humidity, and solar radiation. Wilson et al. [27] compared forest evapotranspiration with sap flux, VPD, soil water budget, and eddy covariance. Reasonably good agreement was observed between sap flux and VPD as well as sap flux and eddy covariance based on annual data. Liu et al. [29] studied the sap flux of sawtooth oak (Quercus acutissima Carruth) and china-fir (Cunninghamia lanceolate (LAMB) Hook.) relative to photosynthetically active radiation (PAR), air temperature, relative humidity, VPD, precipitation, and soil water content. Significant linear correlations were found between sap flux and PAR, air temperature, and VPD, but not soil water content. These studies establish mechanistic relationships between tree water flux and certain environmental variables based on the response of stomata to environmental drivers, but most of the reported relationships were obtained using annual data that provided low correlation coefficients. Diurnal sap flux patterns are typically not distinctly parallel to the diurnal patterns of environmental variables. Therefore, it is difficult and inaccurate to simply predict diurnal sap flux directly from environmental variables.
Climate change is a natural phenomenon. However, anthropogenic activities such as fossil fuel burning, industrial pollution, deforestation, and population growth have greatly accelerated greenhouse gas emissions and resulted in extremely abnormal climate change patterns [30]. Climate change over the last several decades has been linked to atmospheric water vapor content increase, precipitation pattern shifts, snow cover reduction and ice melt, and surficial hydrological cycle changes [30]. Lasch et al. [31] investigated the impacts of short-rotation coppice plantation with aspen (P. tremula L.) in Eastern Germany under changing climate conditions. These authors found that the aspen plantations contributed to regional CO2 mitigation and carbon sequestration, but had negative on the regional water budget due to climate change. Griffiths et al. [32] reviewed the environmental effects on short-rotation woody crop production. They cited long-term water use, C dynamics, and soil quality studies as being needed to evaluate the potential effects of climate change. Currently, our understanding of climate change effects upon the sap flux of eastern cottonwood in short-rotation plantations is basically unknown.
The goal of this study was to develop a novel model for estimating diurnal and annual sap flux of trees in short-rotation biomass production plantations associated with climate change impacts. To accomplish this goal, we based our model on adjusted VPD using Structural Thinking and Experiential Learning Laboratory with Animation (STELLA) software, and used eastern cottonwood as the plantation tree species. We investigated the relationship between adjusted VPD and eastern cottonwood sap flux to address the following objectives: (1) establish a model using diurnal patterns and annual cycles of adjusted VPD to predict those of measured eastern cottonwood sap flux; (2) validate the model using an independent sap flux dataset collected from sensor measurements; and (3) apply the model to predict eastern cottonwood sap flux in the absence of measured sap flux data under a changing climate. It should be noted that we approached the problem of predicting sap flux with the variable VPD because VPD data are easy to obtain from local weather stations, and sap flux tends to follow VPD more closely than other environmental variables such as air temperature and PAR. The model developed here provides a new paradigm for estimating the sap flux of trees in short-rotation bioenergy plantations in a time- and cost-effective manner.

2.1. Study Site

This work is based on sap flux measurements collected at a biomass production plantation located near Hollandale, Washington County, Mississippi, US (see Figure 1). The plantation was established in 2012 to study eastern cottonwood and black willow (S. nigra L.) biomass production under several planting densities and harvest regimens.
The plantation is situated on a site with Sharkey clay soil that is poorly drained, and the site was previously used for rice (Oryza sativa) production. For this study, we instrumented six representative eastern cottonwood trees (each 3 years old) with a planting density of 1 m × 1 m and a plot area of 1.01 hectare, with 2 cm long laboratory made heat dissipation type sensors [33] to collect sap flux measurements from September 2015 to September 2016. One constructed sensor pair consists of a reference and heated sensor, each containing thermocouples within hypodermic needles. Each sensor was installed radially in the xylem of each tree at a height of 120 cm, where the diameter at breast height (DBH) was measured. The sensors were about 10 cm apart vertically, and the immediate area of the stem was covered with insulated aluminum shielding that prevented solar radiation from impacting readings. All sensors were connected to a CR1000 datalogger and AM 16/32/B multiplexer (Campbell Scientific Inc., Logan UT, USA) and the instrumentation was powered by rechargeable marine deep cycle batteries connected to a solar panel (Figure 1b). The system was programmed to measure voltage differences between sensors corresponding to thermocouple temperature differences every 30 s, and data were averaged every 30 min. As water flows through the xylem, it cools the heated sensor relative to the reference sensor and, therefore, temperature differences between sensors can be used to infer sap flux rates. Collected data were transmitted to an office computer through a wireless carrier (Verizon Inc.). This real-time system enabled periodic monitoring for malfunctions and quick troubleshooting. Meanwhile, time series VPD data with the same collection interval (i.e., every 30 min) were downloaded from an on-site weather station (https://www.hobolink.com). Missing data from the on-site station were replaced with data from the nearest weather station, which was located about 40 km north of the study site (https://www.wunderground.com/history /airport/KGLH/). The VPD data were calculated using the following formula [34]:
D v p = [ 1 ( R H 100 ) ] * 610.7 * 10 7.5 T a i r 237.3 + T a i r
where Dvp is the vapor pressure deficit (Pa), RH is the relative humidity (%), and Tair is the air temperature (oC). Differences in sap flux sensor temperature were converted to sap flux densities (g/m2/s) with the widely accepted empirical equation developed by Granier [33] using the software program Baseliner version 4. Data were scaled to the tree level (g/s) with DBH measurements on the assumption that the entire cross-sectional area was conductive sapwood.

2.2. Adjusted VPD and its Correlation with Sap Flux

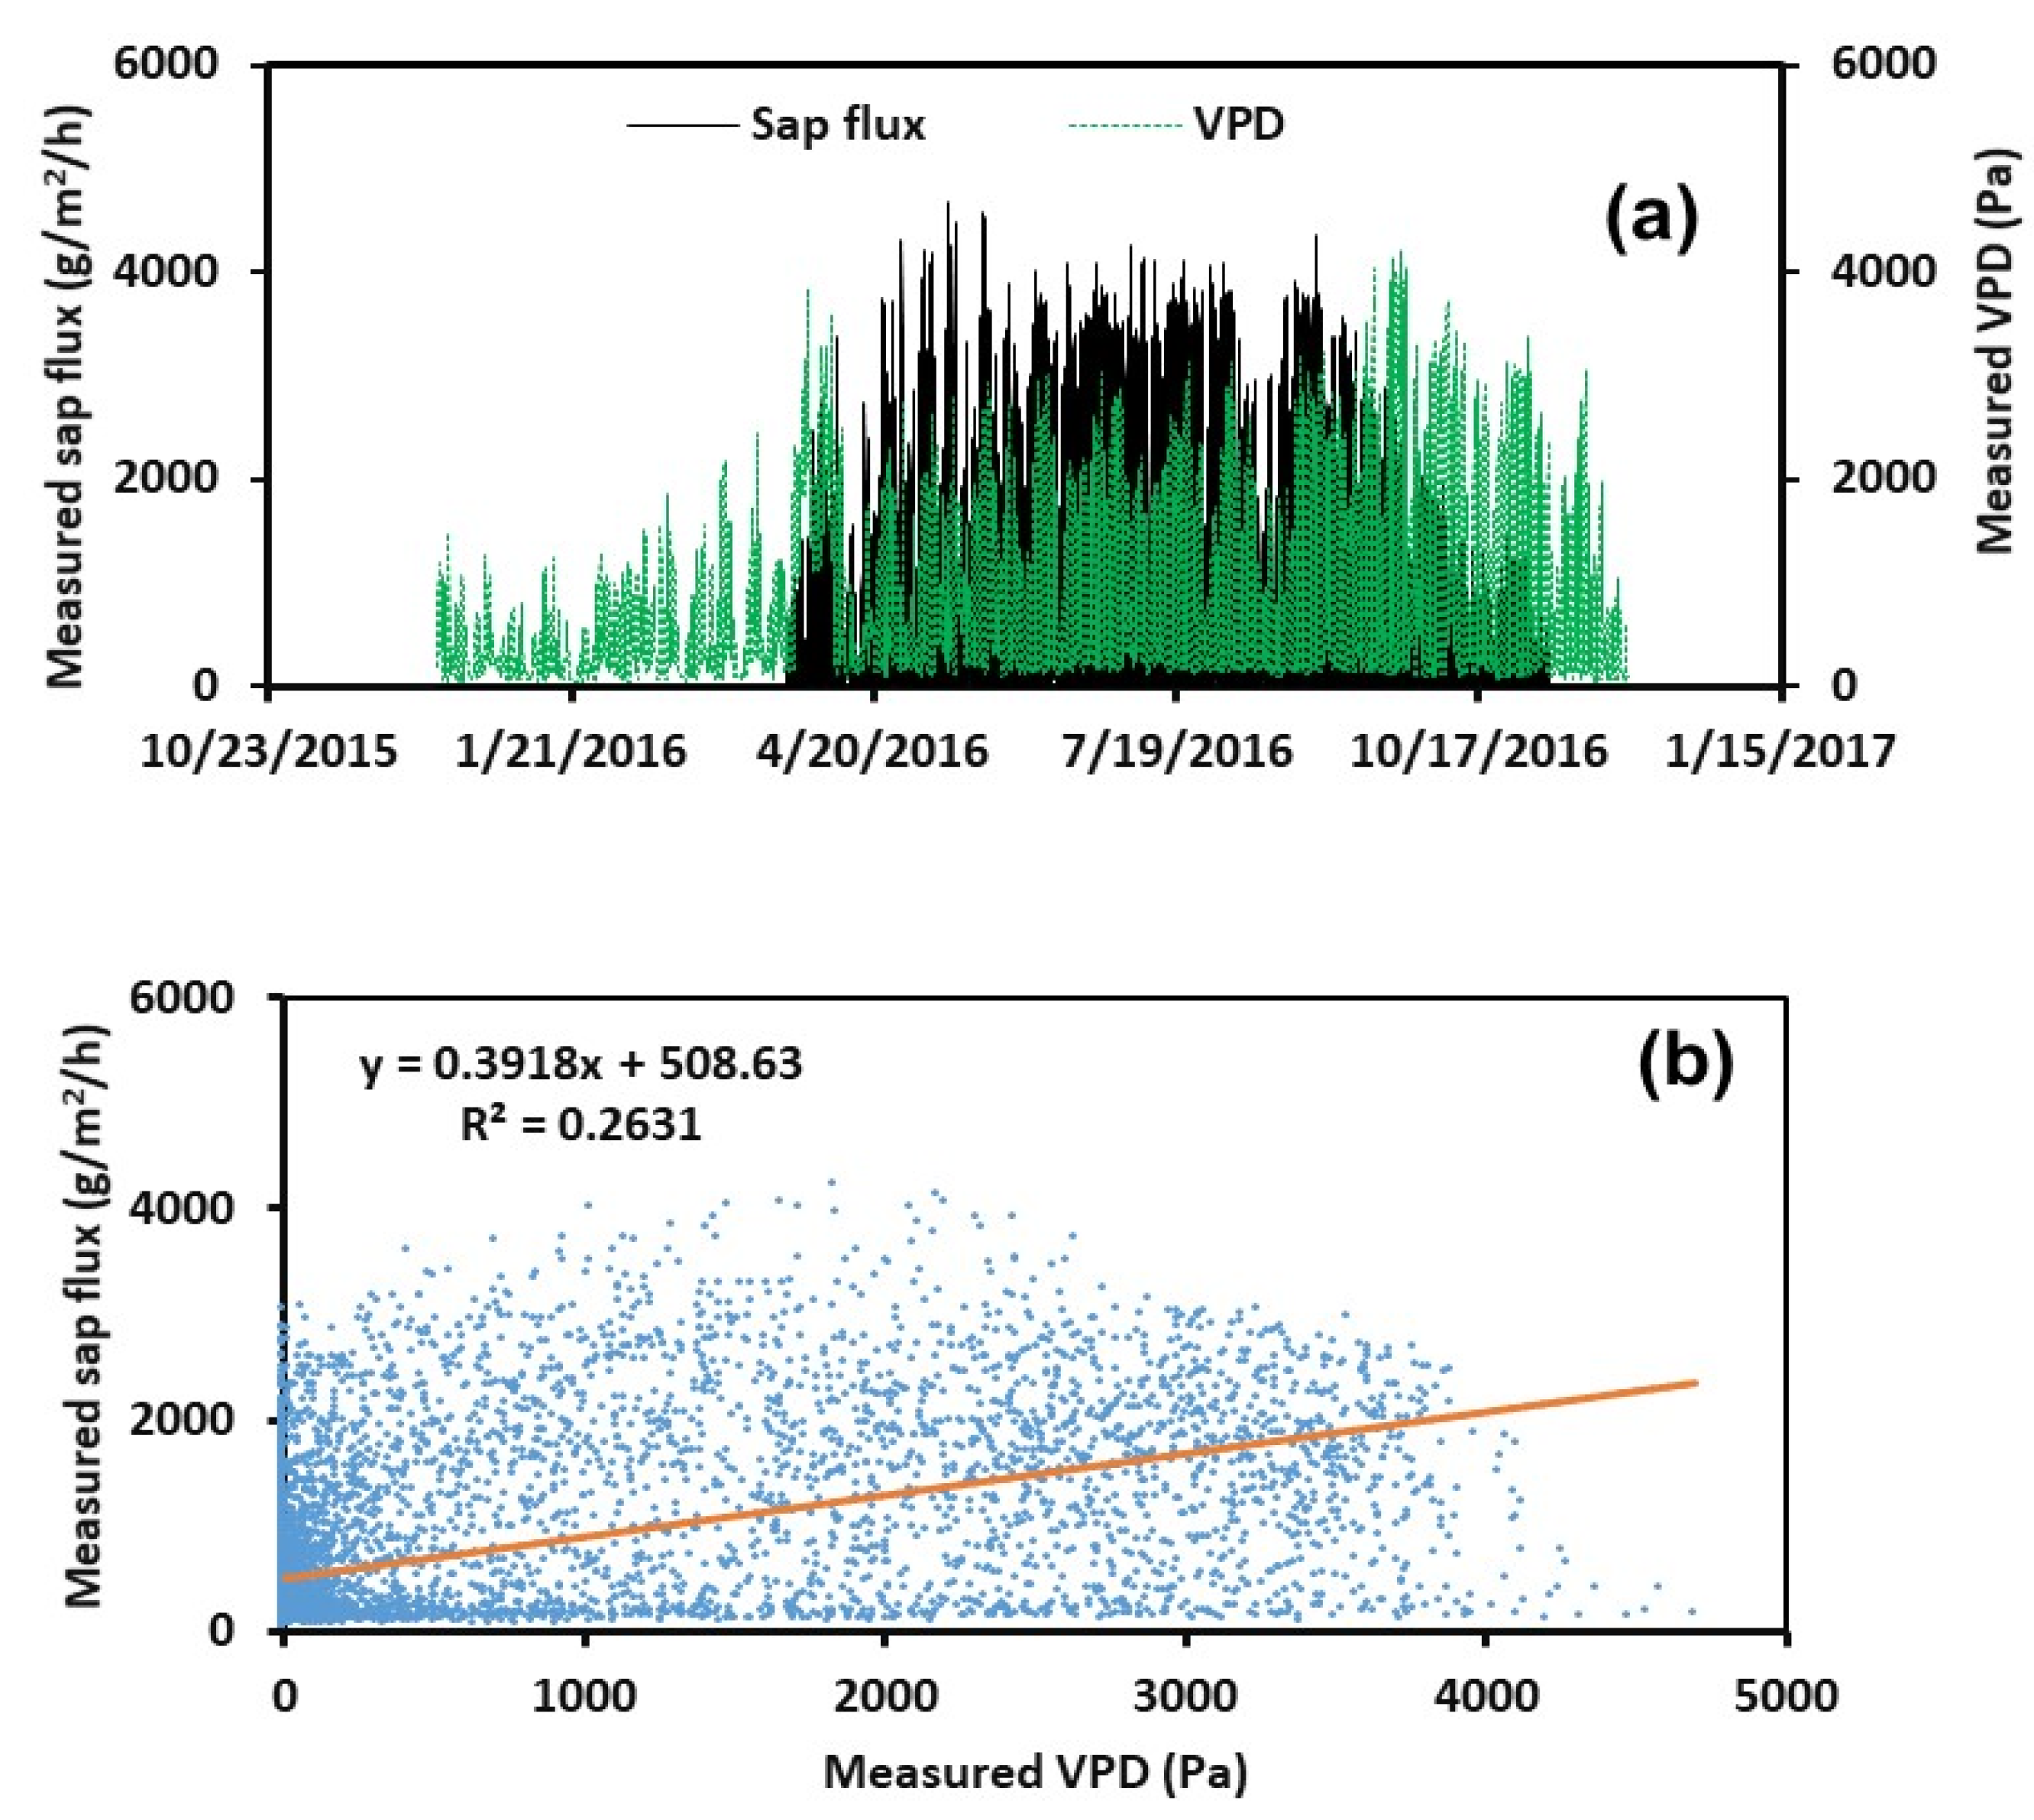
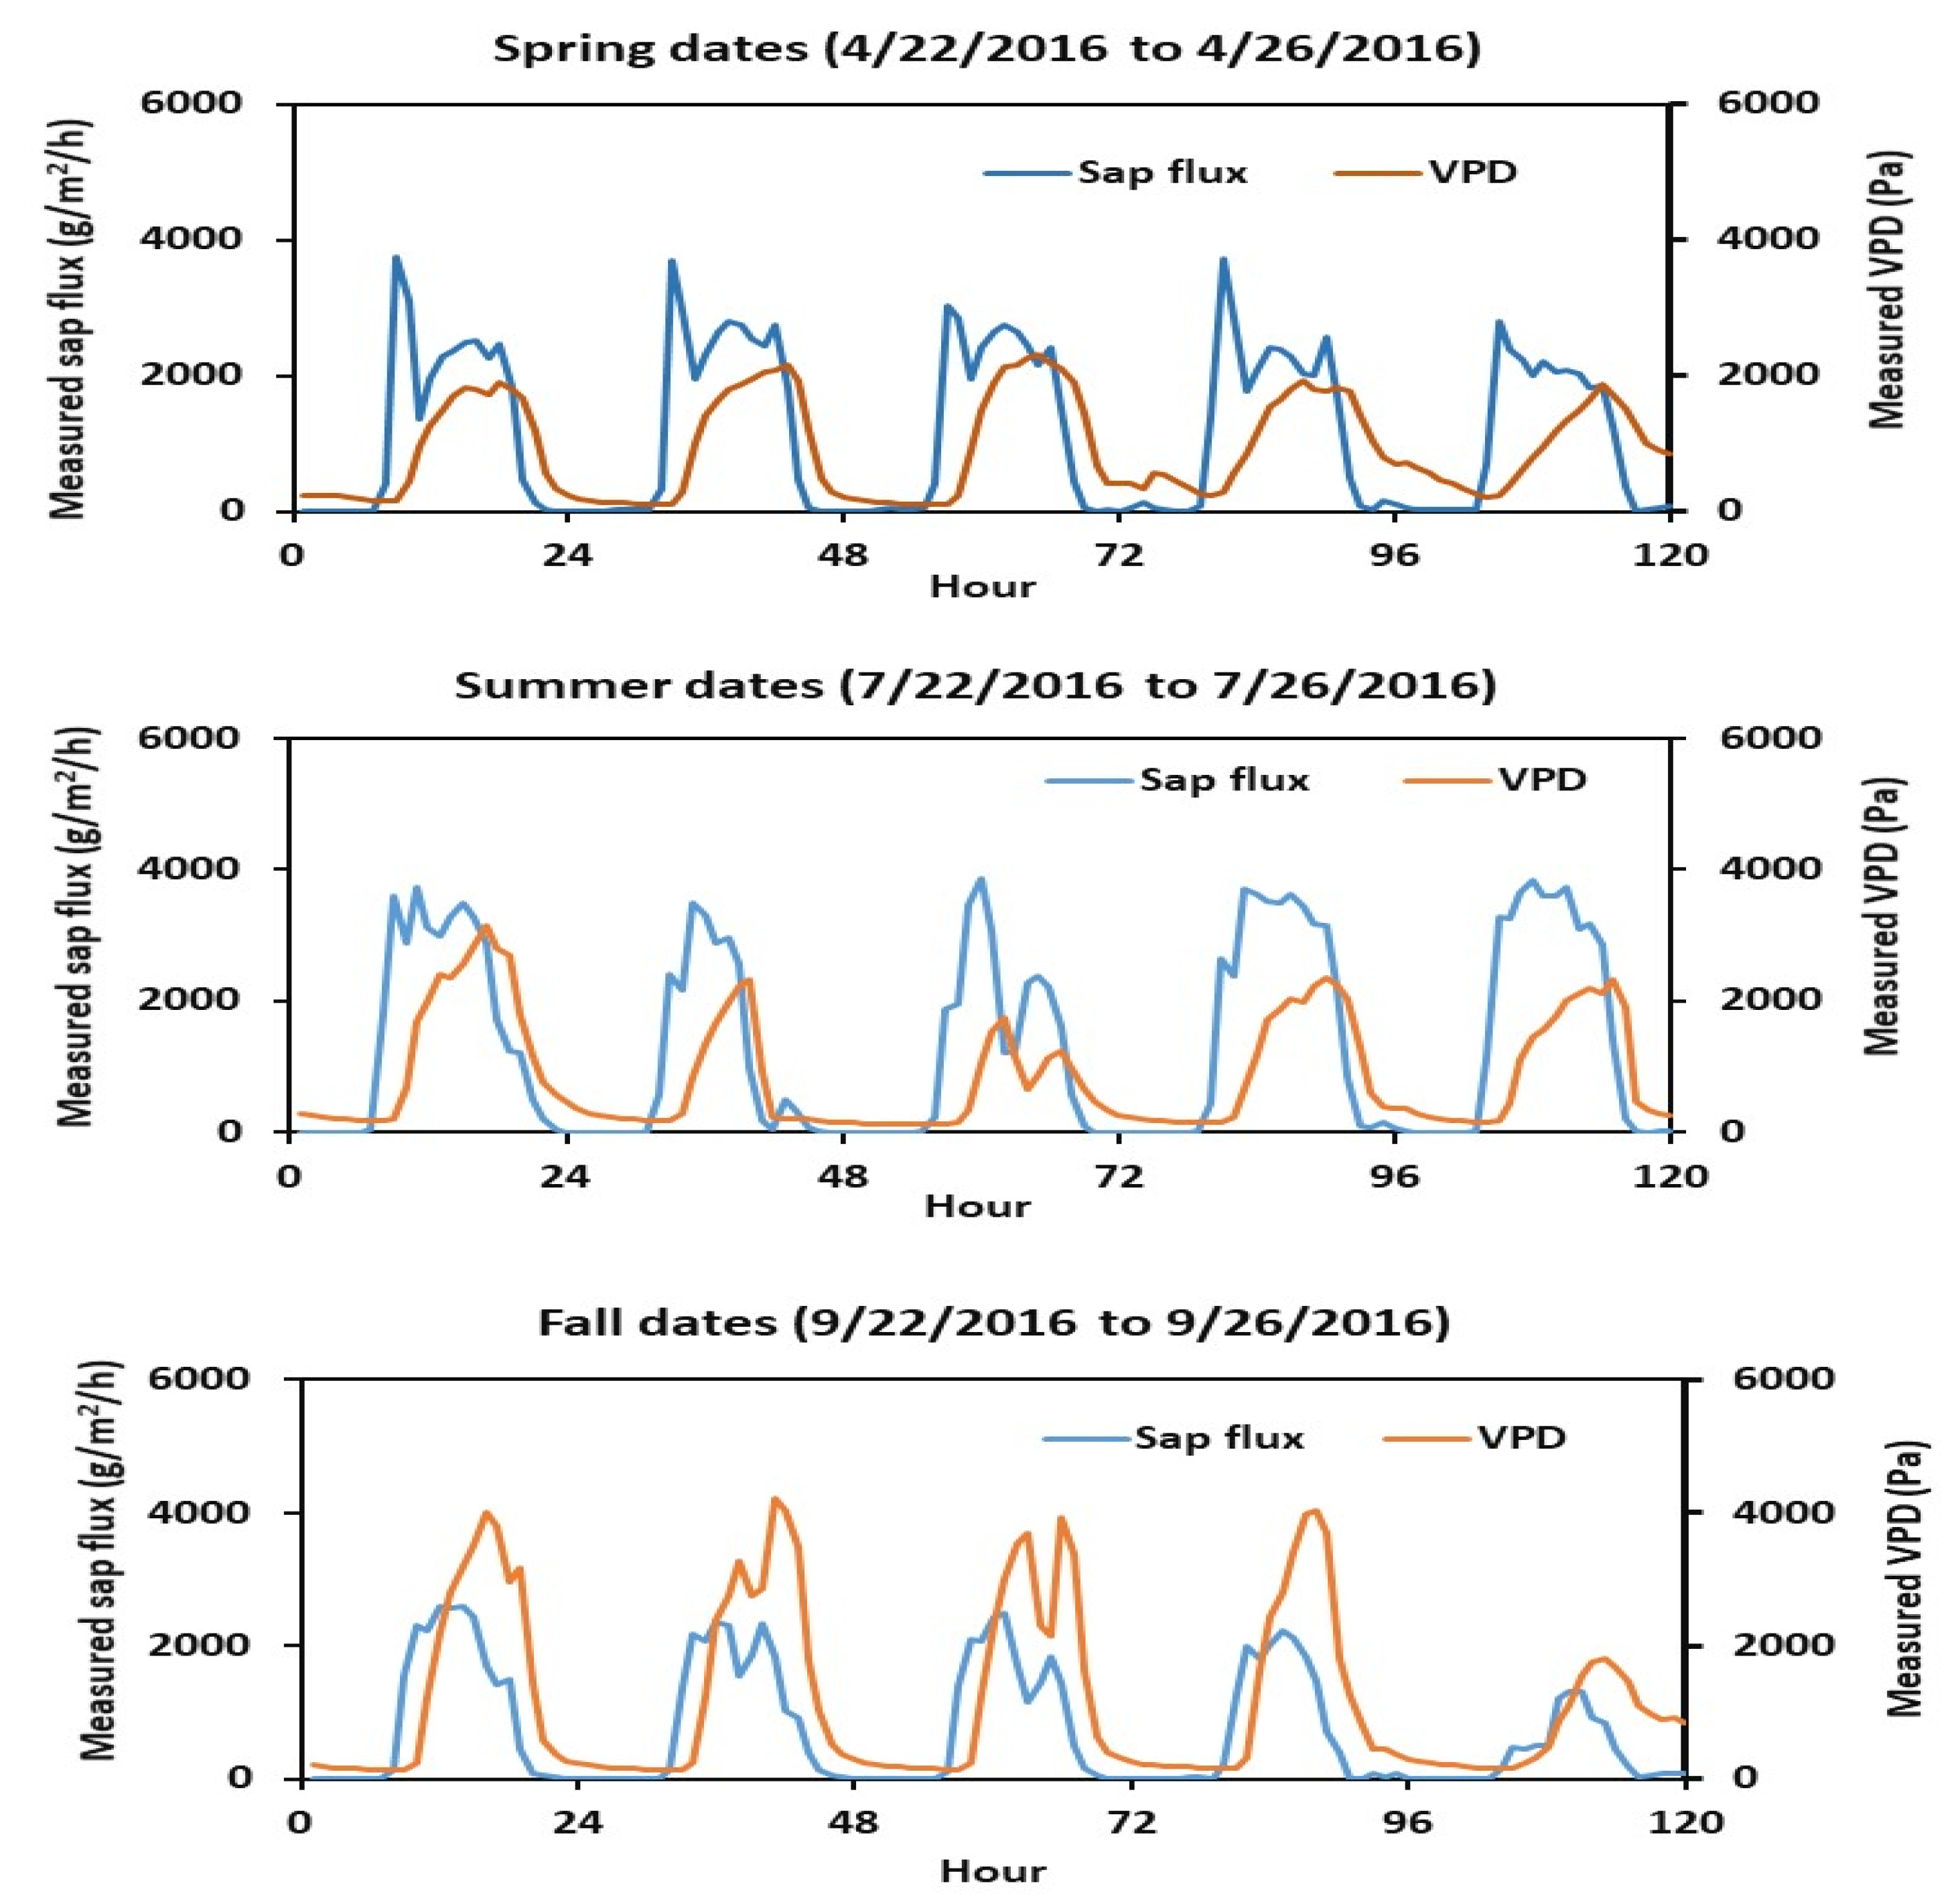
The measured hourly sap flux and VPD over the study period illustrated that the highest diurnal peaks for these two variables were not aligned (Figure 2a). That is, the highest peaks for hourly sap flux occurred mostly in the summer, whereas the highest peaks for hourly VPD were observed in the early fall. Analysis of hourly measured sap flux and VPD over the one-year study period (Figure 2b) revealed a very weak relationship between these variables (R2 = 0.263). Further examination of measured sap flux and VPD at diurnal scales in spring, summer, and fall (there are no leaves in winter) revealed the following three distinct patterns (Figure 3): (1) sap flux peaked around 10:00 a.m. under normal conditions; (2) peak VPD typically lagged about 3 hours behind peak sap flux; and (3) sap flux maintained a constant value close to zero from 9:00 p.m. at night to 6:00 a.m. the next morning, while VPD remained above zero during the same period. Based on these observations, unadjusted diurnal VPD would be unsuitable for predicting diurnal sap flux. However, VPD could be adjusted to develop a stronger correlation with sap flux.
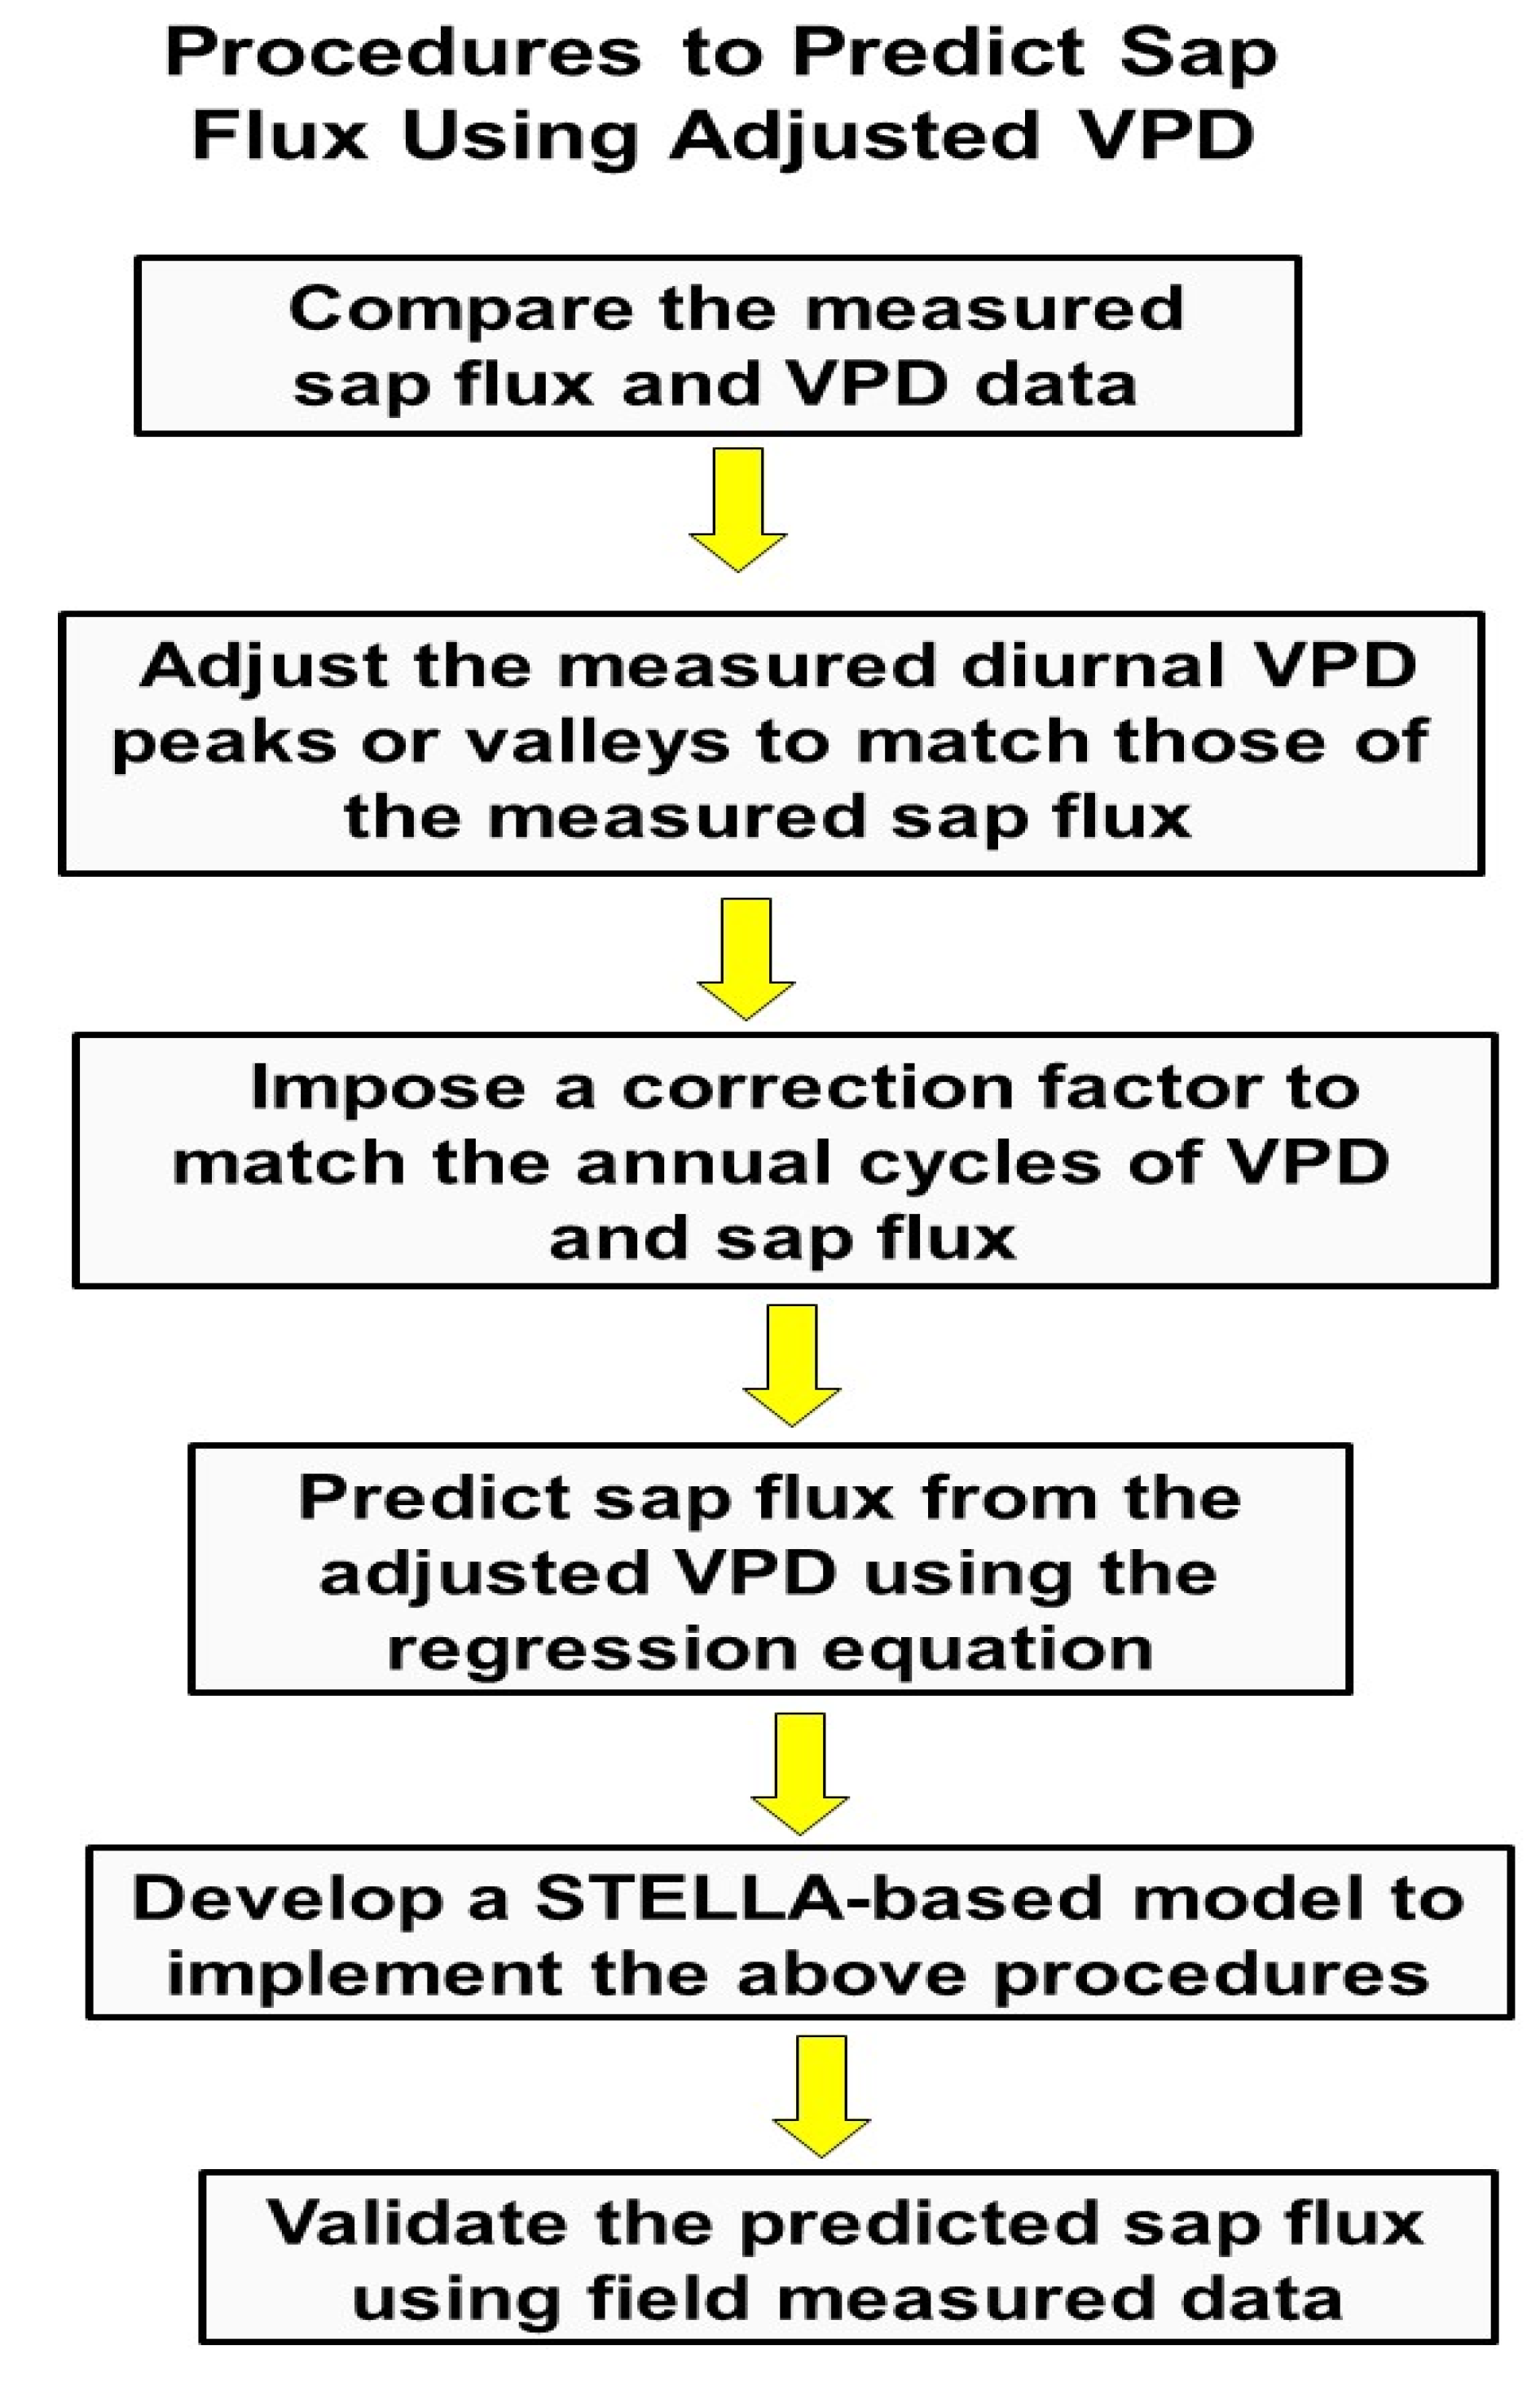
We employed the following eight steps (Figure 4) to adjust measured VPD and develop a mathematical relationship between sap flux and adjusted VPD.
  • Measured VPD was shifted about 3 hours ahead so that diurnal VPD peaks corresponded to diurnal sap flux peaks (Figure 5). Such adjustment is needed for a better prediction of sap flux behaviors using VPD. The 3-hour time shift ahead was only for this study site and could be varied with sites and tree species.
  • VPD was adjusted to a minimum value at night. This adjustment was necessary because eastern cottonwood sap flux was typically lowest from 9:00 p.m. at night to 6:00 a.m. the next morning.
  • Measured VPD was increased by a factor of 2.4 at 10:00 a.m. so that the adjusted VPD peak was coincident with measured sap flux. The adjustment factor “2.4” was estimated from our experimental data, and this value can be changed for different tree species or sites.
  • A correction factor was imposed to adjust the annual cycle of VPD to match the annual sap flux cycle. This correction factor (F) was calculated with Equation (2) below.
F = 1.1 * E X P ( ( 0.3 ) * ( t β α ) 2 )
where t is the hour of year, β is a time constant that specifies the hour of year when maximum sap flux occurs (5100 h in this example), and α is a constant characterizing the shape of the annual sap flux cycle (1500 in this example). This constant was obtained from measured annual eastern cottonwood sap flux.
5.
VPD was adjusted to near zero for the dormant season. Our measurements confirmed no sap flux during the late fall, winter, and early spring months when the deciduous eastern cottonwood bores no leaves.
6.
We assumed soil water availability did not limit sap flux based on our field observations during the study period.
7.
Regression analysis was used to develop a function to predict measured sap flux from adjusted VPD. Equation (3) below was developed for this study.
  Q s a p f l o w = 5 E 08 V P D a d j u s t e d 3 0.0006 V P D a d j u s t e d 2 + 2.5167 V P D a d j u s t e d 16.45
where Q is the sap flux (g/m2/h) and VPDadjusted is the adjusted VPD (Pa). A detailed discussion of Equation (3) is provided in the Results and Discussion Section.
8.
Because eastern cottonwood sap flux is affected by age (which is correlated to DBH), we accounted for the age effect with Equation (4):
F a g e = 0.038 e 0.0431 D B H
where Fage is the age factor and DBH (cm) increases as time elapses. Equation (4) was developed from data reported by Schaeffer et al. [35], who measured the sap flux and DHB of eastern cottonwood growing in the San Pedro River system of southeastern Arizona. Combining Equations (3) and (4) yields the following equation:
      Q s a p f l o w a d j u s t e d = ( 1 + F a g e ) * Q s a p f l o w
where Q s a p f l o w a d j u s t e d is the age-adjusted sap flux (g/m2/h). Equation (5) is used to predict age-adjusted eastern cottonwood sap flux in this study.

2.3. STELLA Model

The eight steps listed above were applied to the development of a STELLA model. STELLA is a software package used to develop system dynamic models by creating a pictorial diagram of a system and assigning appropriate values and functions to it (http://www.iseesystems.com). System dynamic models created with STELLA have been widely used [36,37,38,39]. Figure 6 provides the STELLA modeling map, which illustrates the conditions and equations (in the dashed boxes) established for this study. The STELLA model (with an hourly time step) we created is further described below. Referring to Figure 6, data for Step 1 is stored as input data in the converter (or a circle) labeled “Measured VPD with shifting 3 hours ahead.” Steps 2, 3, and 5 are completed in the converter labeled “Adjusted VPD” according to the conditions in the dashed box.
The routine first determines if time of year (in hours) is less than 2500 h or greater than 7950 h (representing the winter period). If either condition is true, adjusted VPD is set to zero. Then, if time of a day is <7 h or >21 h (representing the nocturnal period), adjusted VPD is set to the minimum value for a site—the value for our study site is 33 Pa. If the time of day is 10 am, the VPD, after having been shifted 3 hours, was adjusted by multiplying it by 2.4 (as explained in Step 3). Step 4 and Equation (1) are processed in the converter labeled “Annual correction factor.” It should be noted that we initiated simulation at the beginning of winter (i.e., 12 December 2015) and terminated simulation at the end of the following fall (i.e., 11 December 2016), but start and end times can be changed as appropriate. It should also be noted that our field experiment started in September 2015 and the collection of sap flux data began in December 2015. After adjusted VPD was calculated, predicted sap flux was estimated with Equation (5) in the converter labeled “Predicted sap flow.”

3. Results and Discussion

3.1. Measured Sap Flux, Adjusted VPD, and Model Validation

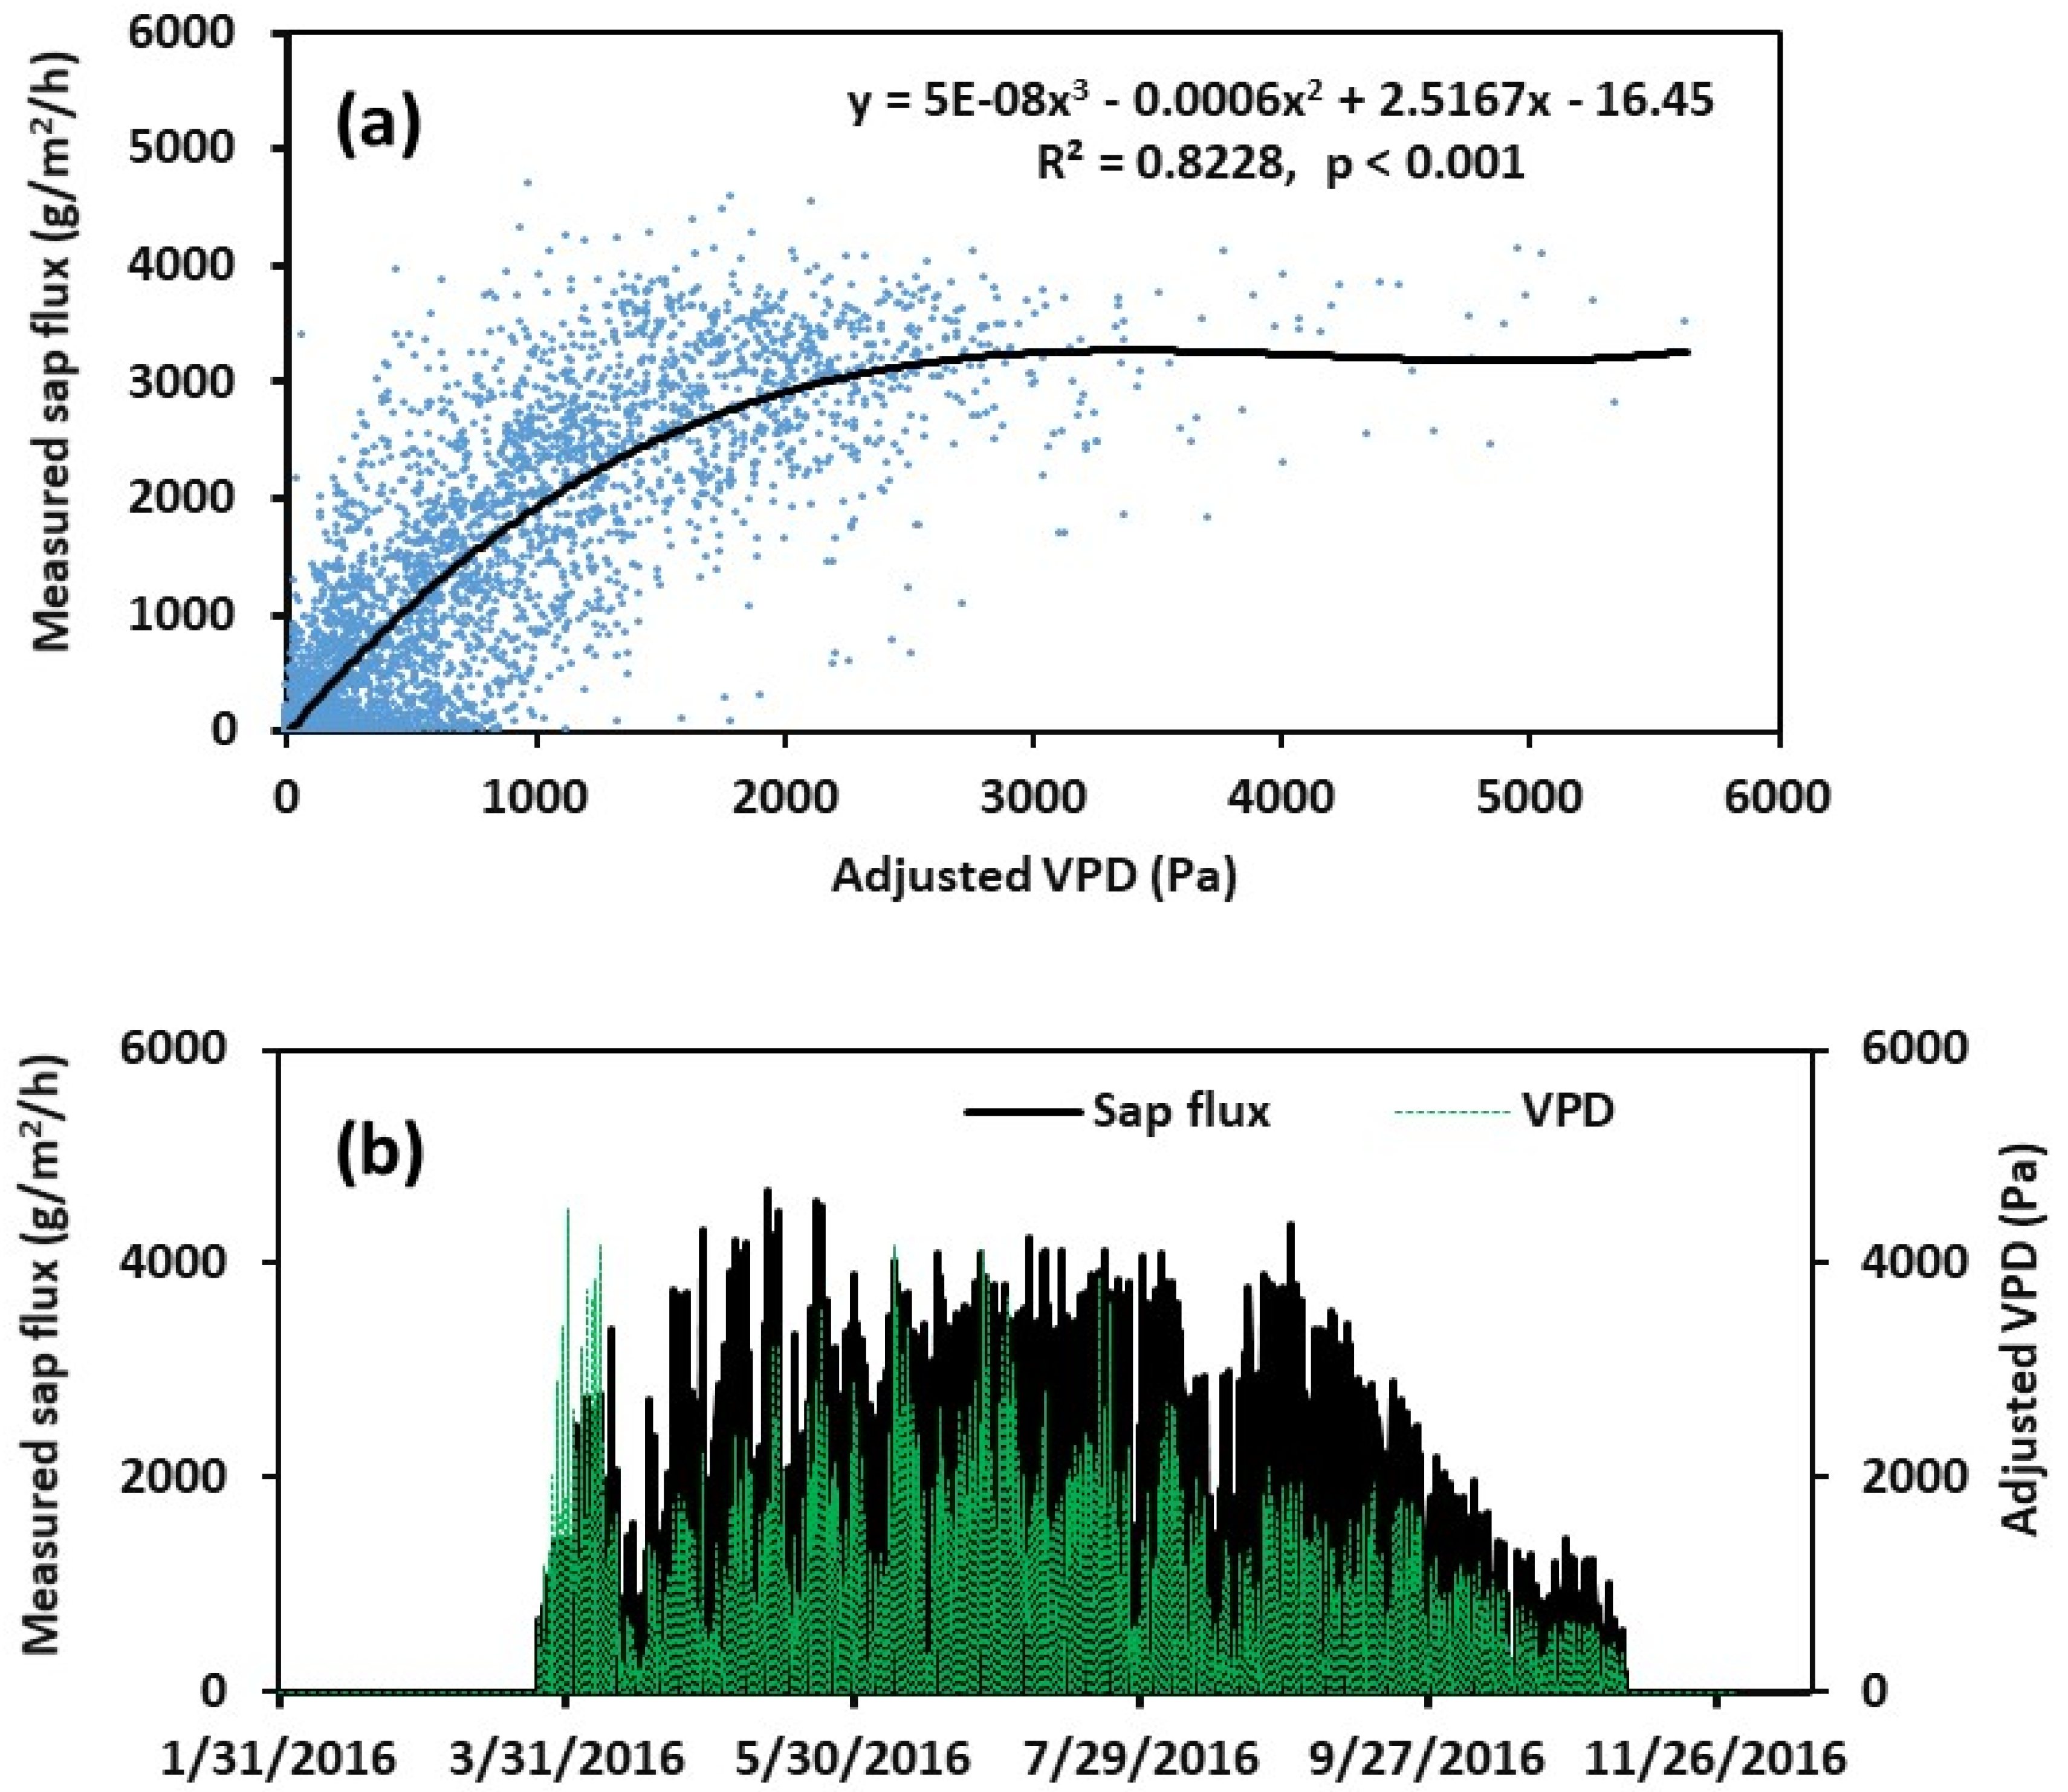
The relationship between measured sap flux and adjusted VPD for the one-year study period is illustrated in Figure 7. The values of R2 = 0.823 and p < 0.001 (Figure 7a) indicate that sap flux can be reliably predicted from adjusted VPD. This was further confirmed in Figure 7b, which shows that the diurnal peaks of these two variables shared a relatively similar annual cycle. Though the results above show that measured sap flux correlated well with adjusted VPD, they do not confirm if sap flux predicted by the STELLA model accurately matches measured sap flux. Therefore, model validation is necessary prior to its application. It should be pointed out that sap flux measurements collected from three of the six eastern cottonwood trees instrumented in this study were used to develop Equation (3) and perform initial validation of the model, while sap flux data from the three remaining trees were used as an independent dataset for additional validation of the model. The initial validation of predicted sap flux against measured sap flux from the first three trees is provided in Figure 8. The validation was measured using statistical parameters such as R2, the Nash Sutcliffe coefficient (NSE), and normalized root mean square error (nRMSE). The nRMSE is calculated as follows [40]:
nRMSE = 1 O a v e ( i = 1 n ( O i S i ) 2 n   )
where Oi is the field observation, Si is the model prediction, Oave is the average number of field observations, and n is the total number of field observations.
The NSE is given as [41]
NSE = 1 i = 1 n ( O i S i ) 2 i = 1 n ( O i O ¯ ) 2
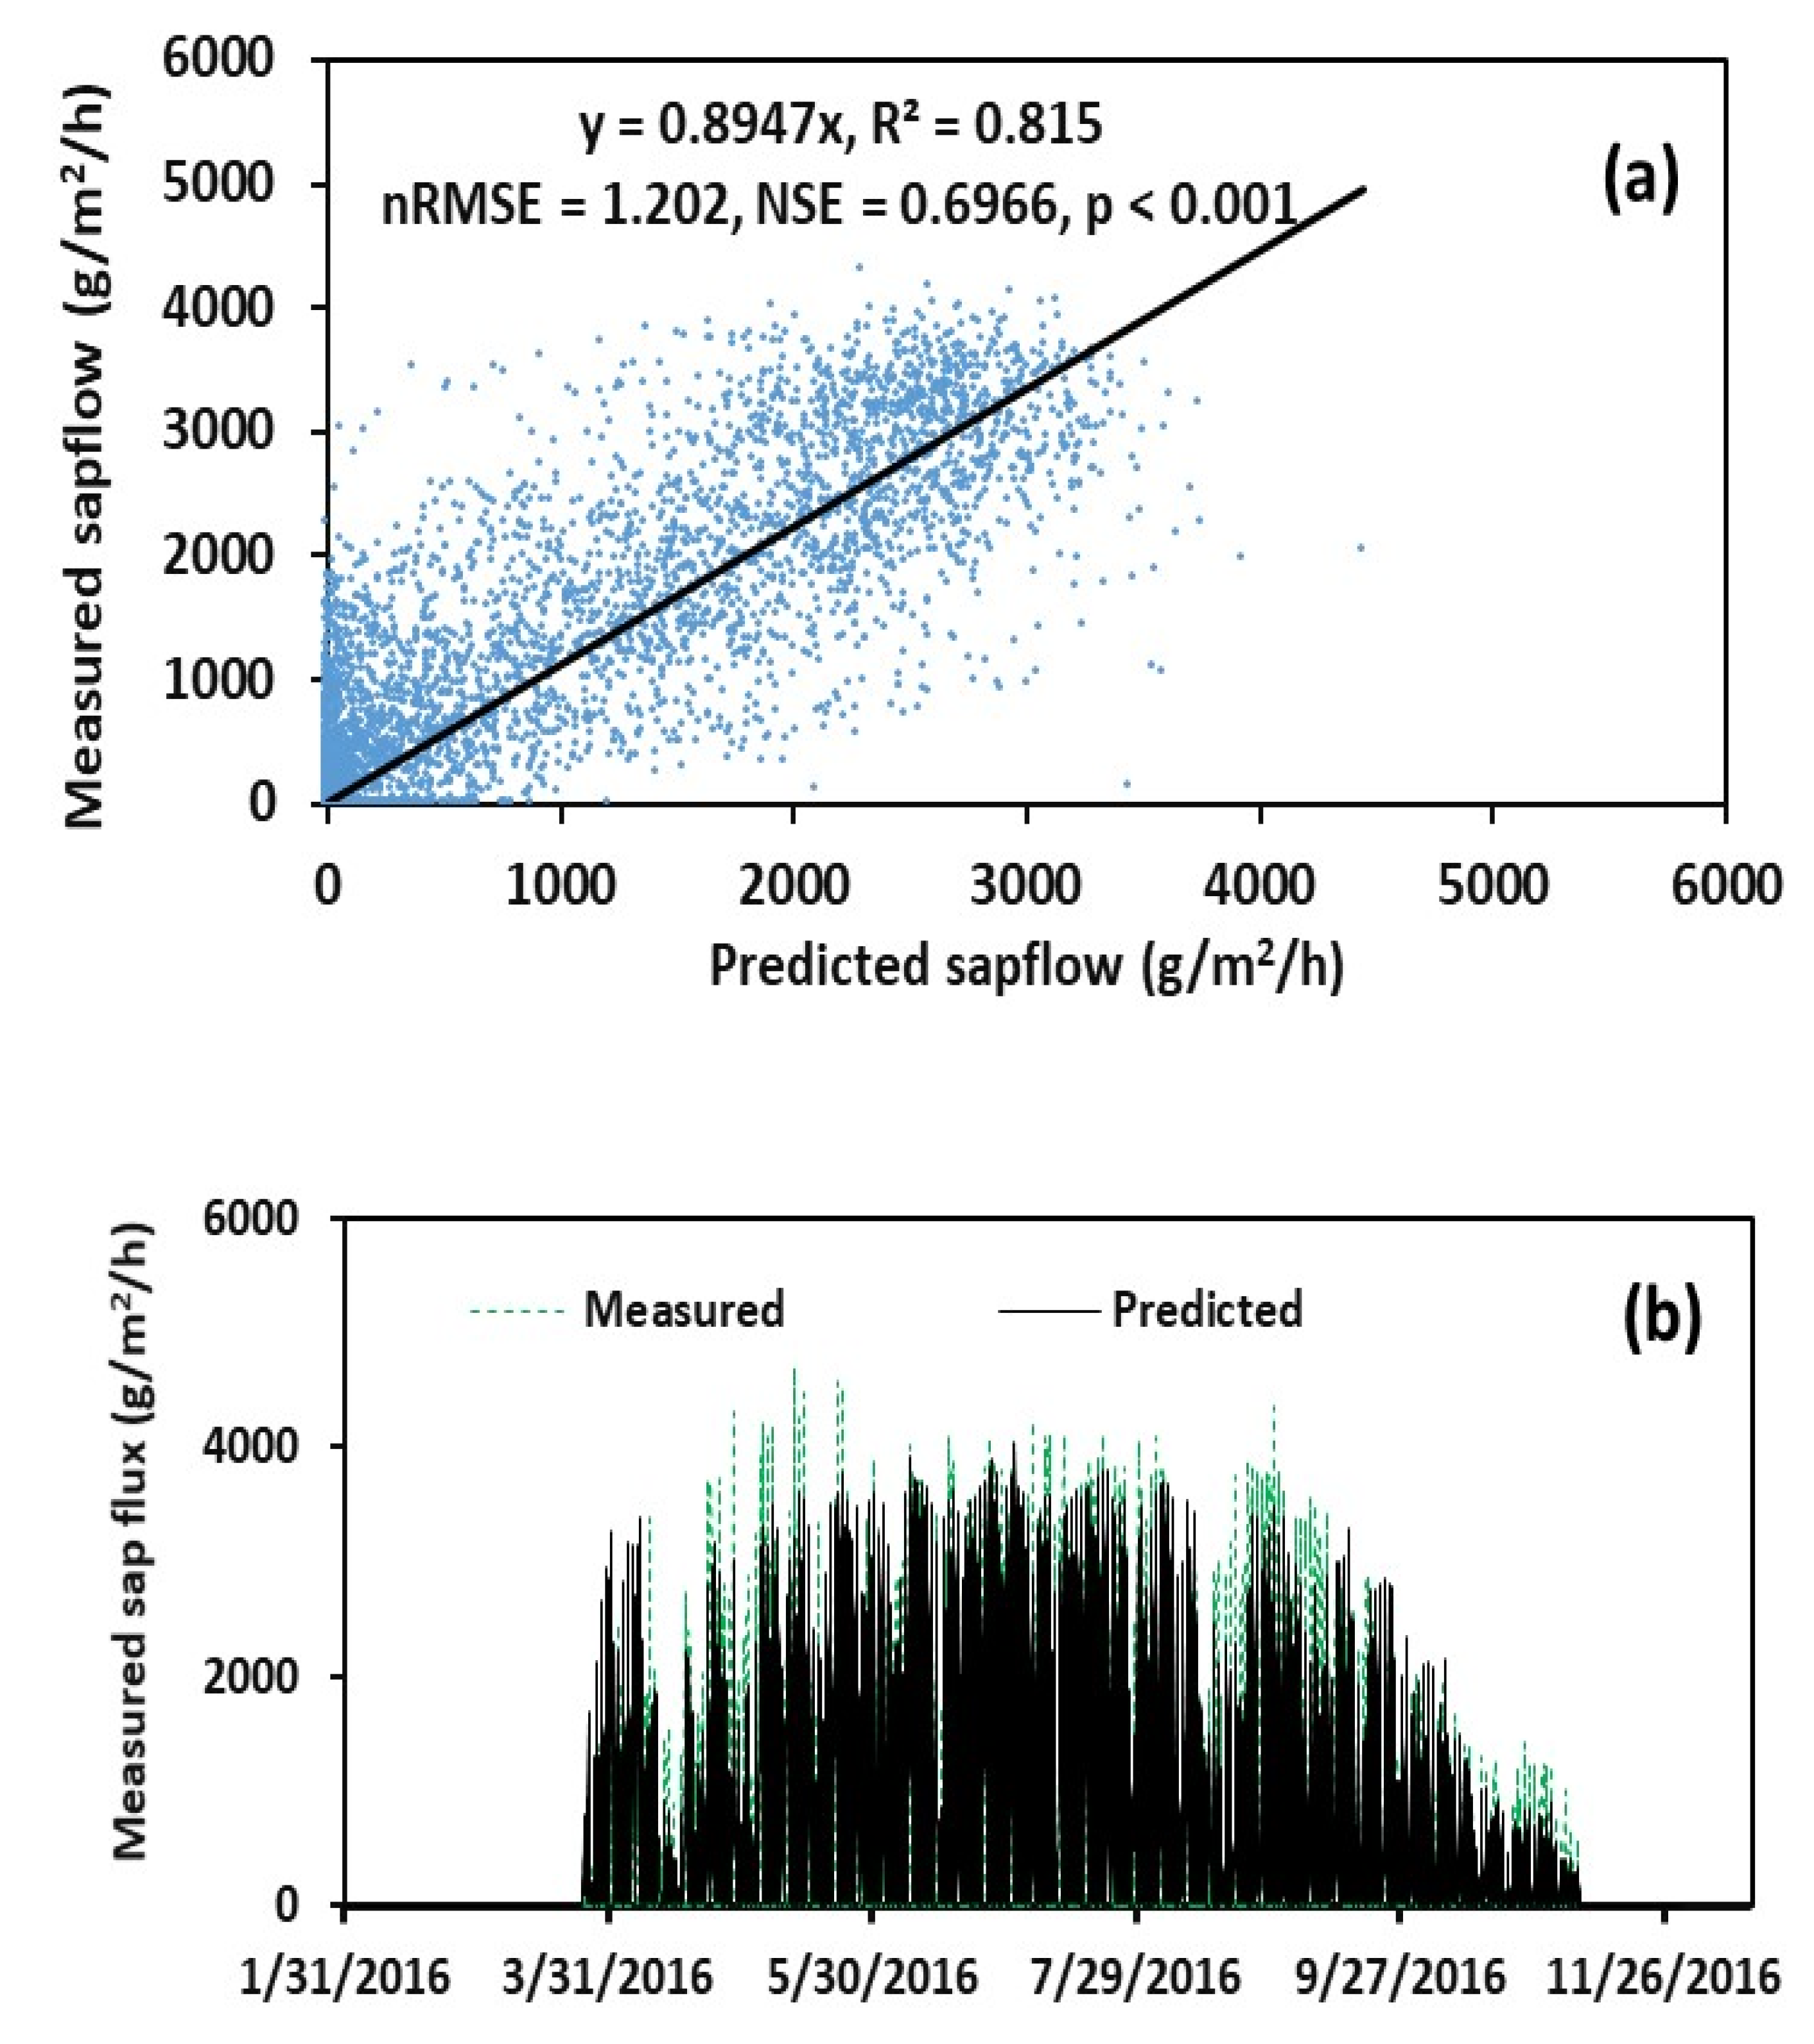
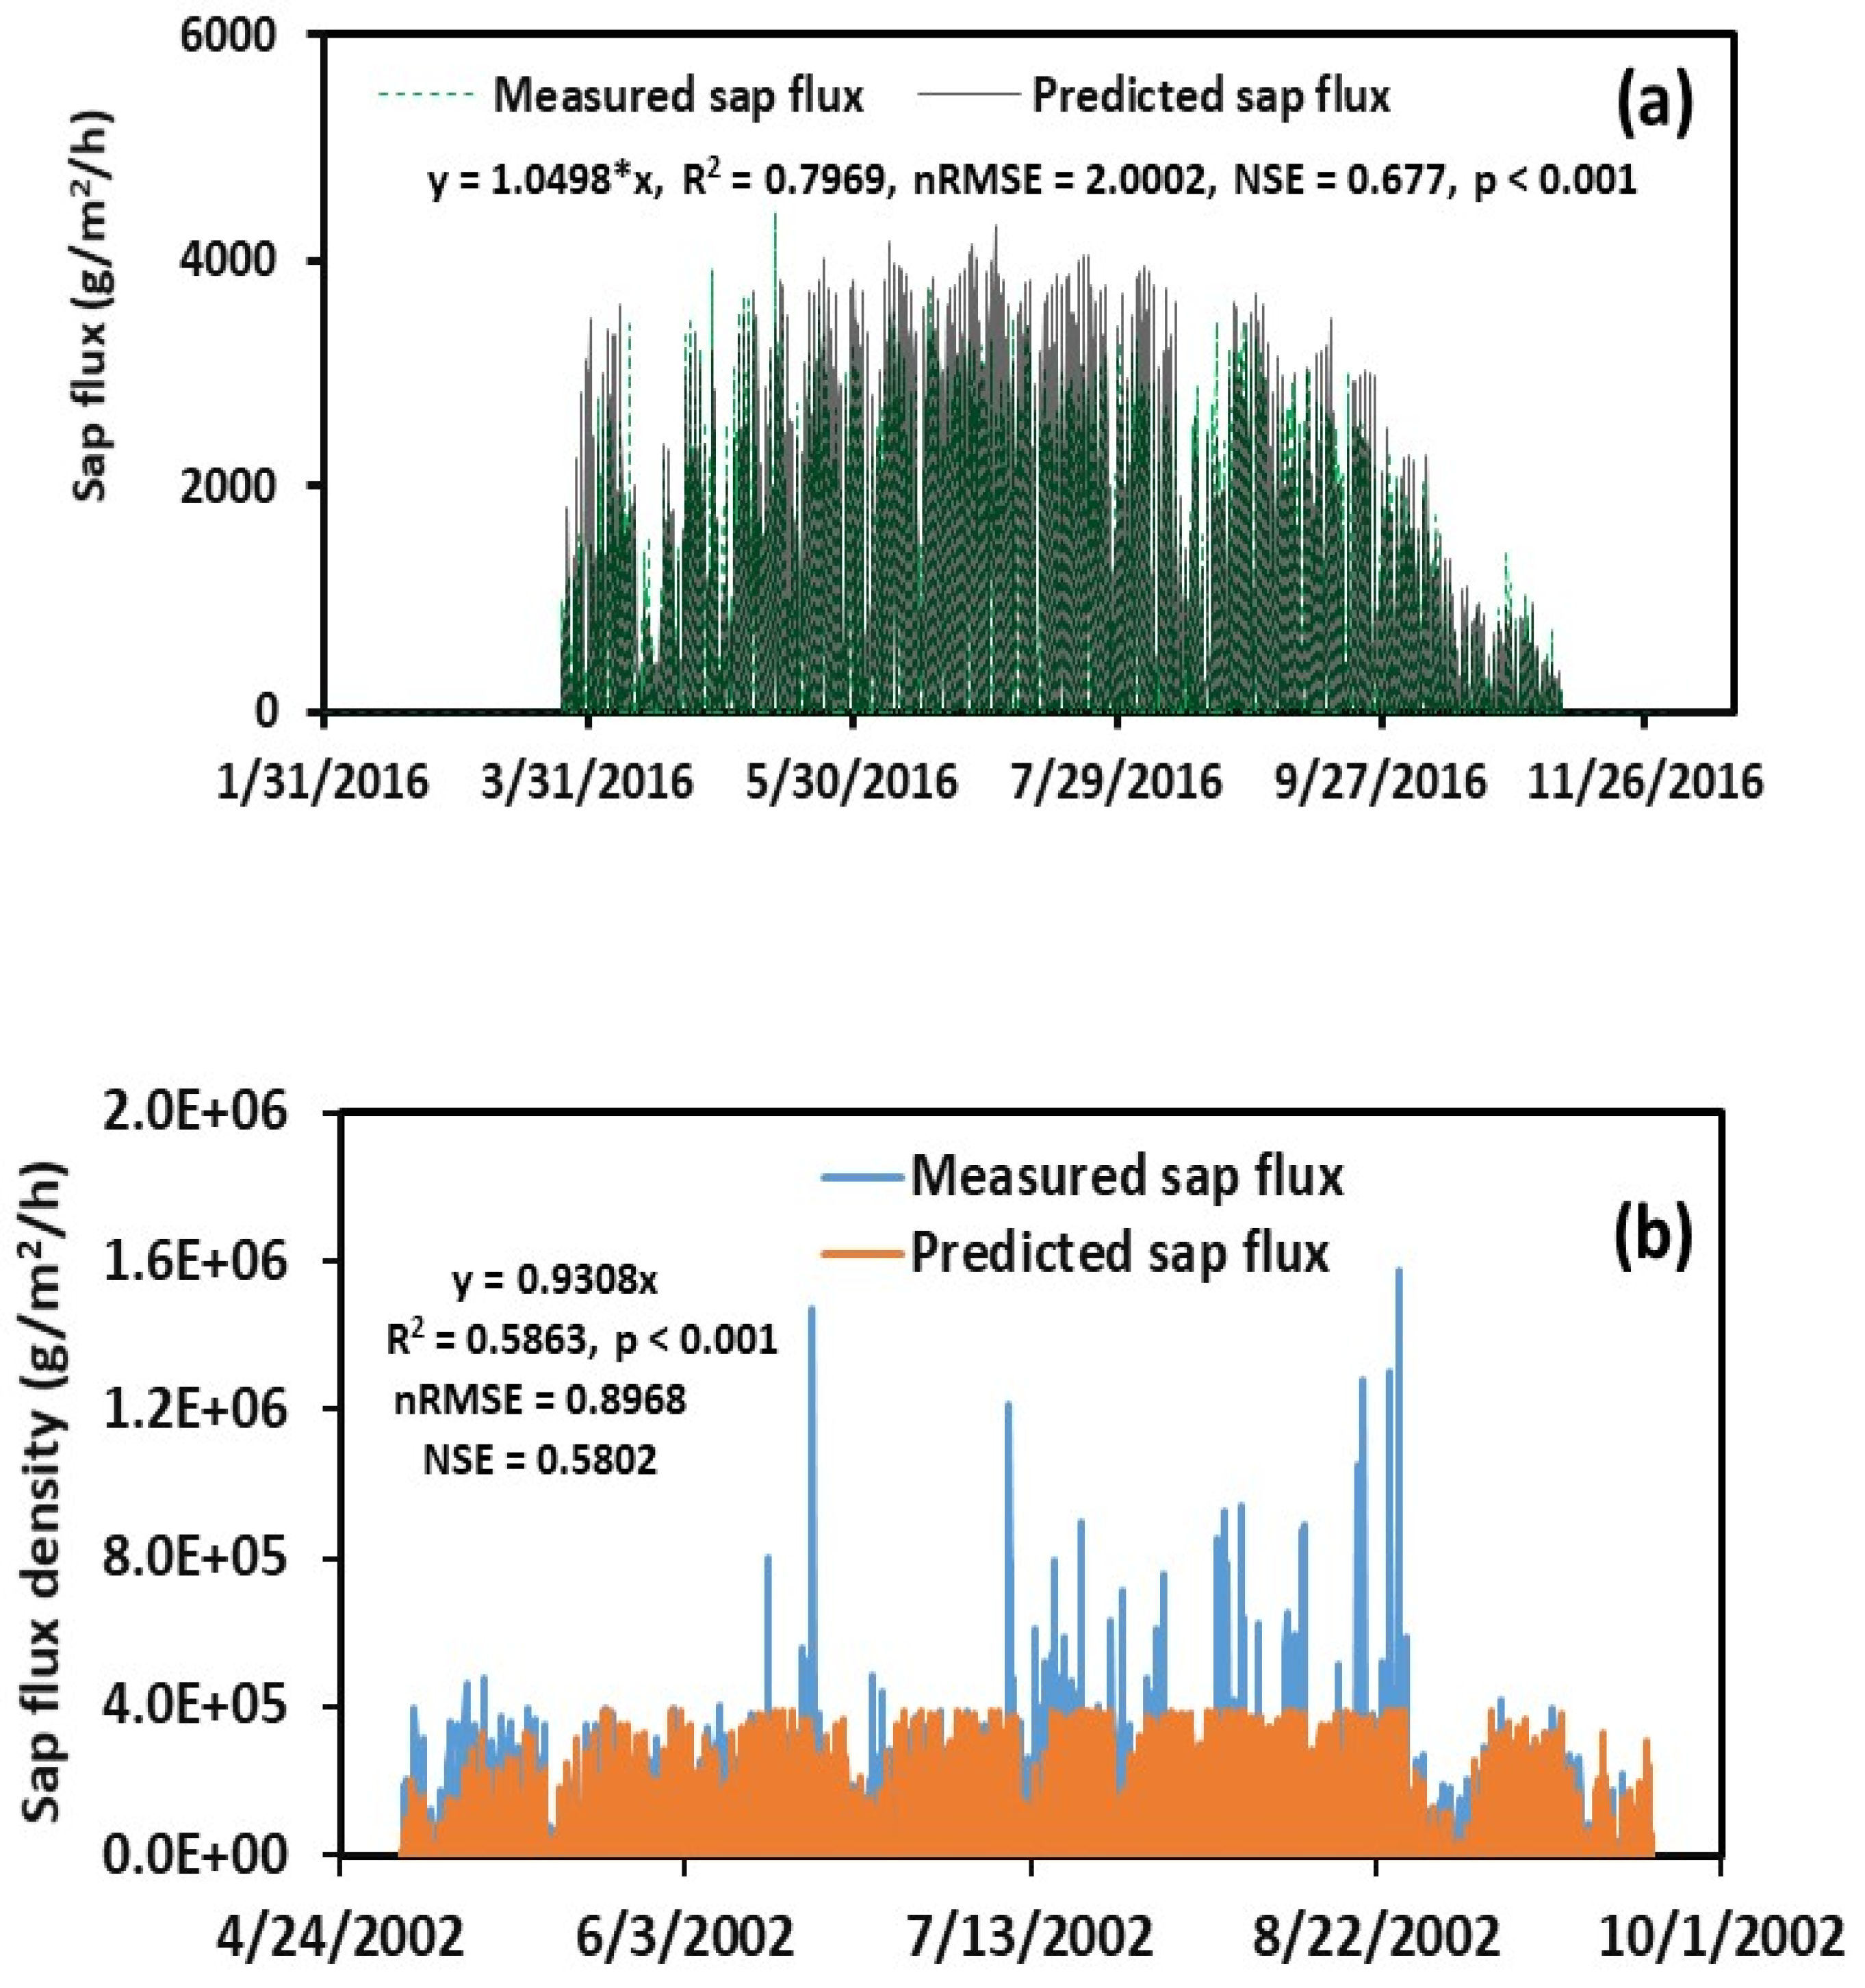
The NSE ranges from -∞ to 1, with the values of 1 representing a perfect fit, >0.75 representing a very good fit, between 0.36 and 0.75 representing a reasonable fit, and <0.36 representing an unsatisfied fit to the model. With R2 = 0.815, NSE = 0.697, nRMSE = 1.202 (g/m2/h), and p value < 0.001 (Figure 8a), we suggest that the model developed in this study performed well in predicting eastern cottonwood sap flux. This conclusion was further supported by data presented in Figure 8b, which illustrate diurnal peaks and seasonal trends of predicted sap flux to coincide with those of measured sap flux. For additional validation of the model, we compared predicted sap flux to the measured sap flux from trees in the independent dataset. This second validation confirmed that the developed model predicted sap flux reasonably similar to the measured sap flux based on the relatively high R2 (0.797) and NSE (0.677) as well as the low nRMSE (2.002) and p value (<0.001) and its conformation to measured sap flux peaks (Figure 9a).
To develop users’ confidence, we further validated the model by comparing the measured sap flux from a different study site to the predicted sap flux from our model. The measured sap flux data were obtained from Samuelson et al. [42]. These authors conducted an experiment to estimate the influence of irrigation and fertilization on transpiration and hydraulic properties of the 3-year-old eastern cottonwood. Their study used marsh clones at a 24.4 ha experimental plantation on the U.S. Department of Energy Savannah River Site located near Aiken, SC. In this validation process, we used the measured sap flux data from Block 2 of their experiment along with the VPD data calculated from local weather variables (i.e., air temperature and relative humidity). A closer look at the measured sap flux data revealed that the maximum sap flux from Samuelson et al. [42] was 5716.8 kg/m2/s in Aiken, SC but was 586.8 kg/m2/s in our experiment in Hollandale, MS. The former was about 10 times greater than the latter. Since the sap flux, weather conditions, and eastern cottonwood clones in Aiken, SC are different from those in Hollandale, MS, we have modified Equation (3) for the Aiken study site as follows:
Q s a p f l o w = 1 E 06 V P D a d j u s t e d 2 + 1.119   V P D a d j u s t e d + 12789
It should be noted that other input values from Equations (2), (4), and (5) were not changed during this validation process. A comparison of sap flux densities between model prediction and experimental measurement is given in Figure 9b. The model predicted most of sap flux densities very well, except for several unusually high measured sap flux densities. With R2 = 0.586, NSE = 0.580, nRMSE = 0.897, and p < 0.01, we concluded that the model predicted sap flux density reasonably well.

3.2. Model application

The model was applied to predict eastern cottonwood sap flux at the same study site for a simulation period beginning on 30 November 2016 and ending on 30 October 2017. Input data were the same as for model validation except for measured DBH and VPD. Average DBH was changed to 7.2 cm for this simulation period. This number was based on the measured growth in the plantation. Data to calculate VPD for the simulation period were downloaded from the on-site weather station.
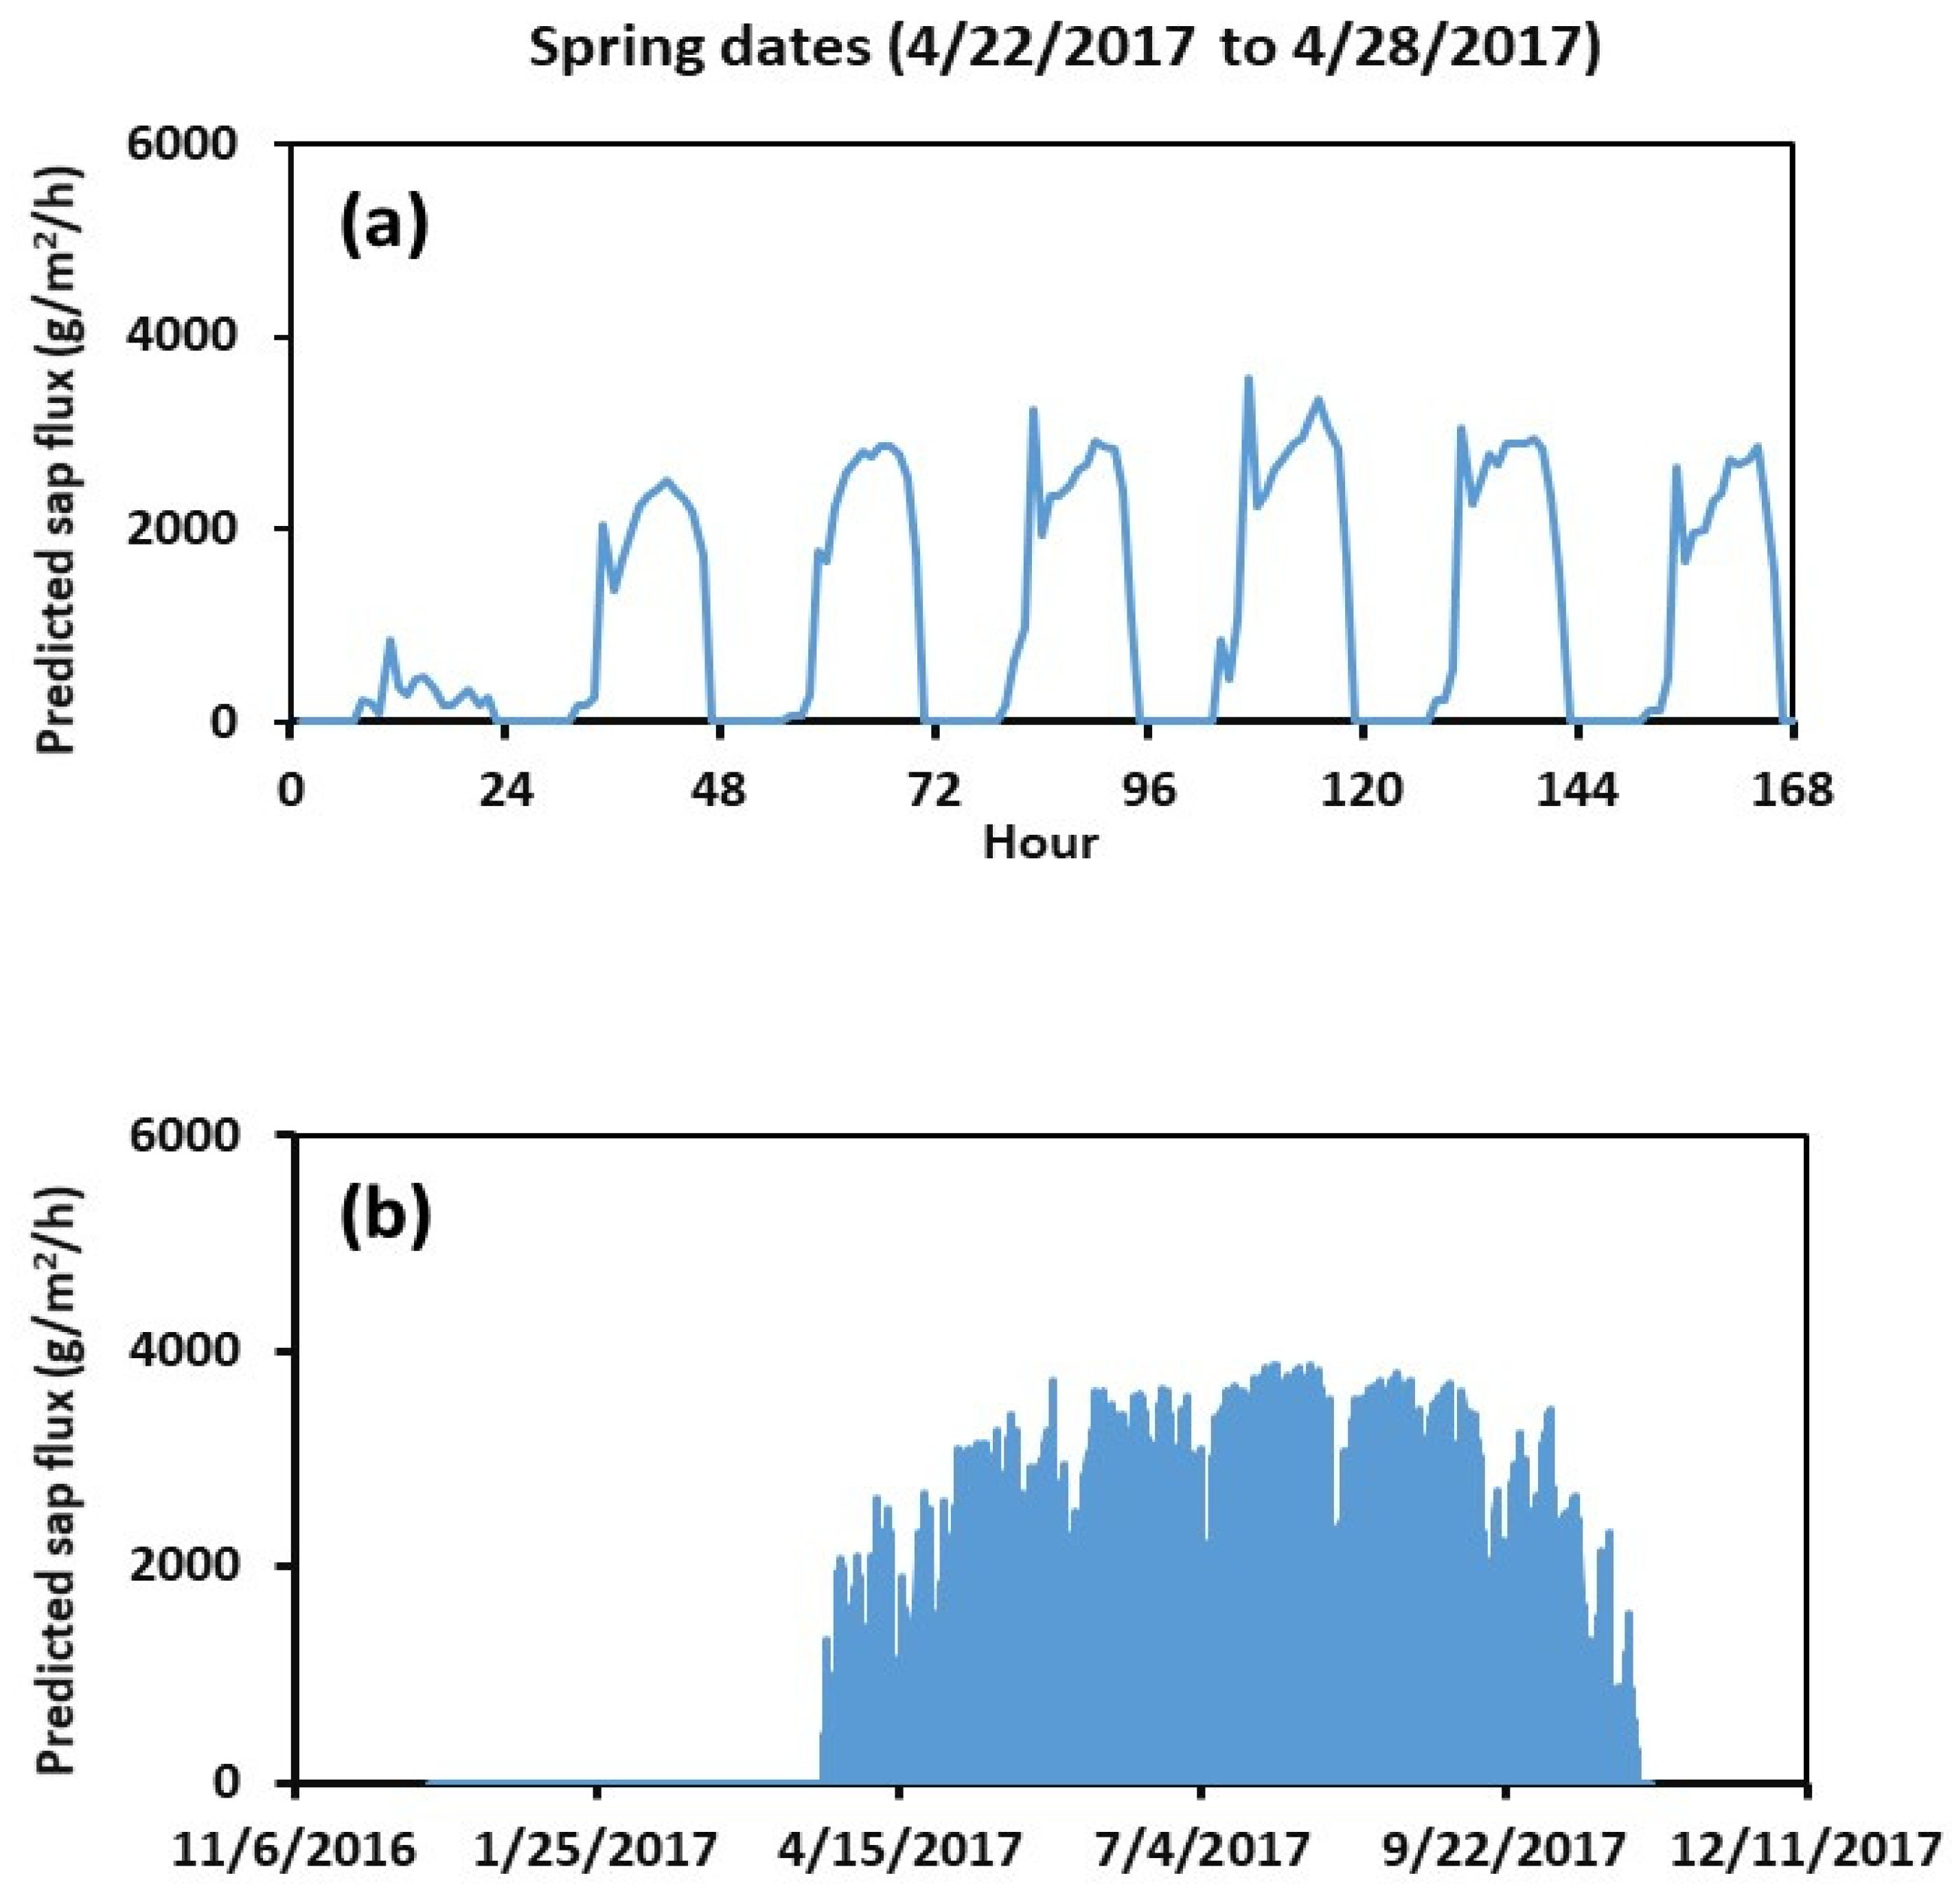
The diurnal pattern of predicted sap flux by eastern cottonwood between 22 April and 28 April 2017 is shown in Figure 10a. This projection conforms to the expectations for the diurnal sap flux volume and the pattern of eastern cottonwood. Relatively low sap flux on the first day (0 to 24 h) was a result of low VPD, normally observed on cloudy or rainy days. When higher VPD prevailed, such as a VPD between 72 and 96 h, we observed predicted sap flux in a pattern similar to previous measurements of sap flux. Maximum sap flux during this time period was 3577 g/m2/h, or 16 g/h for the 7.2 cm DBH tree. This rate was within the range reported by Schaeffer et al. (2000), who found that eastern cottonwood sap flux in the spring averaged about 20 g/h. Results indicated that the model provided for reasonable prediction of diurnal sap flux by eastern cottonwood grown in a biomass plantation.
An annual cycle of predicted eastern cottonwood sap flux is presented in Figure 10b. The simulation estimated total annual sap flux at 6,369,309 g/m2/y. Converting this value to be representative of a tree with a DBH of 7.2 cm yields an annual water use of 25,919.52 g/year.
We assumed soil water content did not limit eastern cottonwood sap flux in this study. Soil water dynamics and hydrological processes would need to be included in the STELLA model if this factor were to be considered important. While we developed this model by studying eastern cottonwood sap flux, it could be adapted to estimate the sap flux of other tree species in short-rotation biomass production plantations. This would be done by revising values outlined in the aforementioned eight steps (Section 2.2) to reflect the tree species of interest and the site.

3.3. Impact of Climate Change on Sap Flux

To estimate the impact of climate change on sap flux, a simulation scenario was developed by increasing the VPD by 10% from the original VPD. Up to date, no effort has been devoted to estimating the impact of climate change on VPD and sap flux in our study area. The 10% increase in VPD was considered as an extreme case based on the study reported by Yuan et al. [43]. These authors studied the global VPD and reported that the mean VPD in the growing season from 2011 to 2015 was 11.26% higher than that from 1982 to 1986.
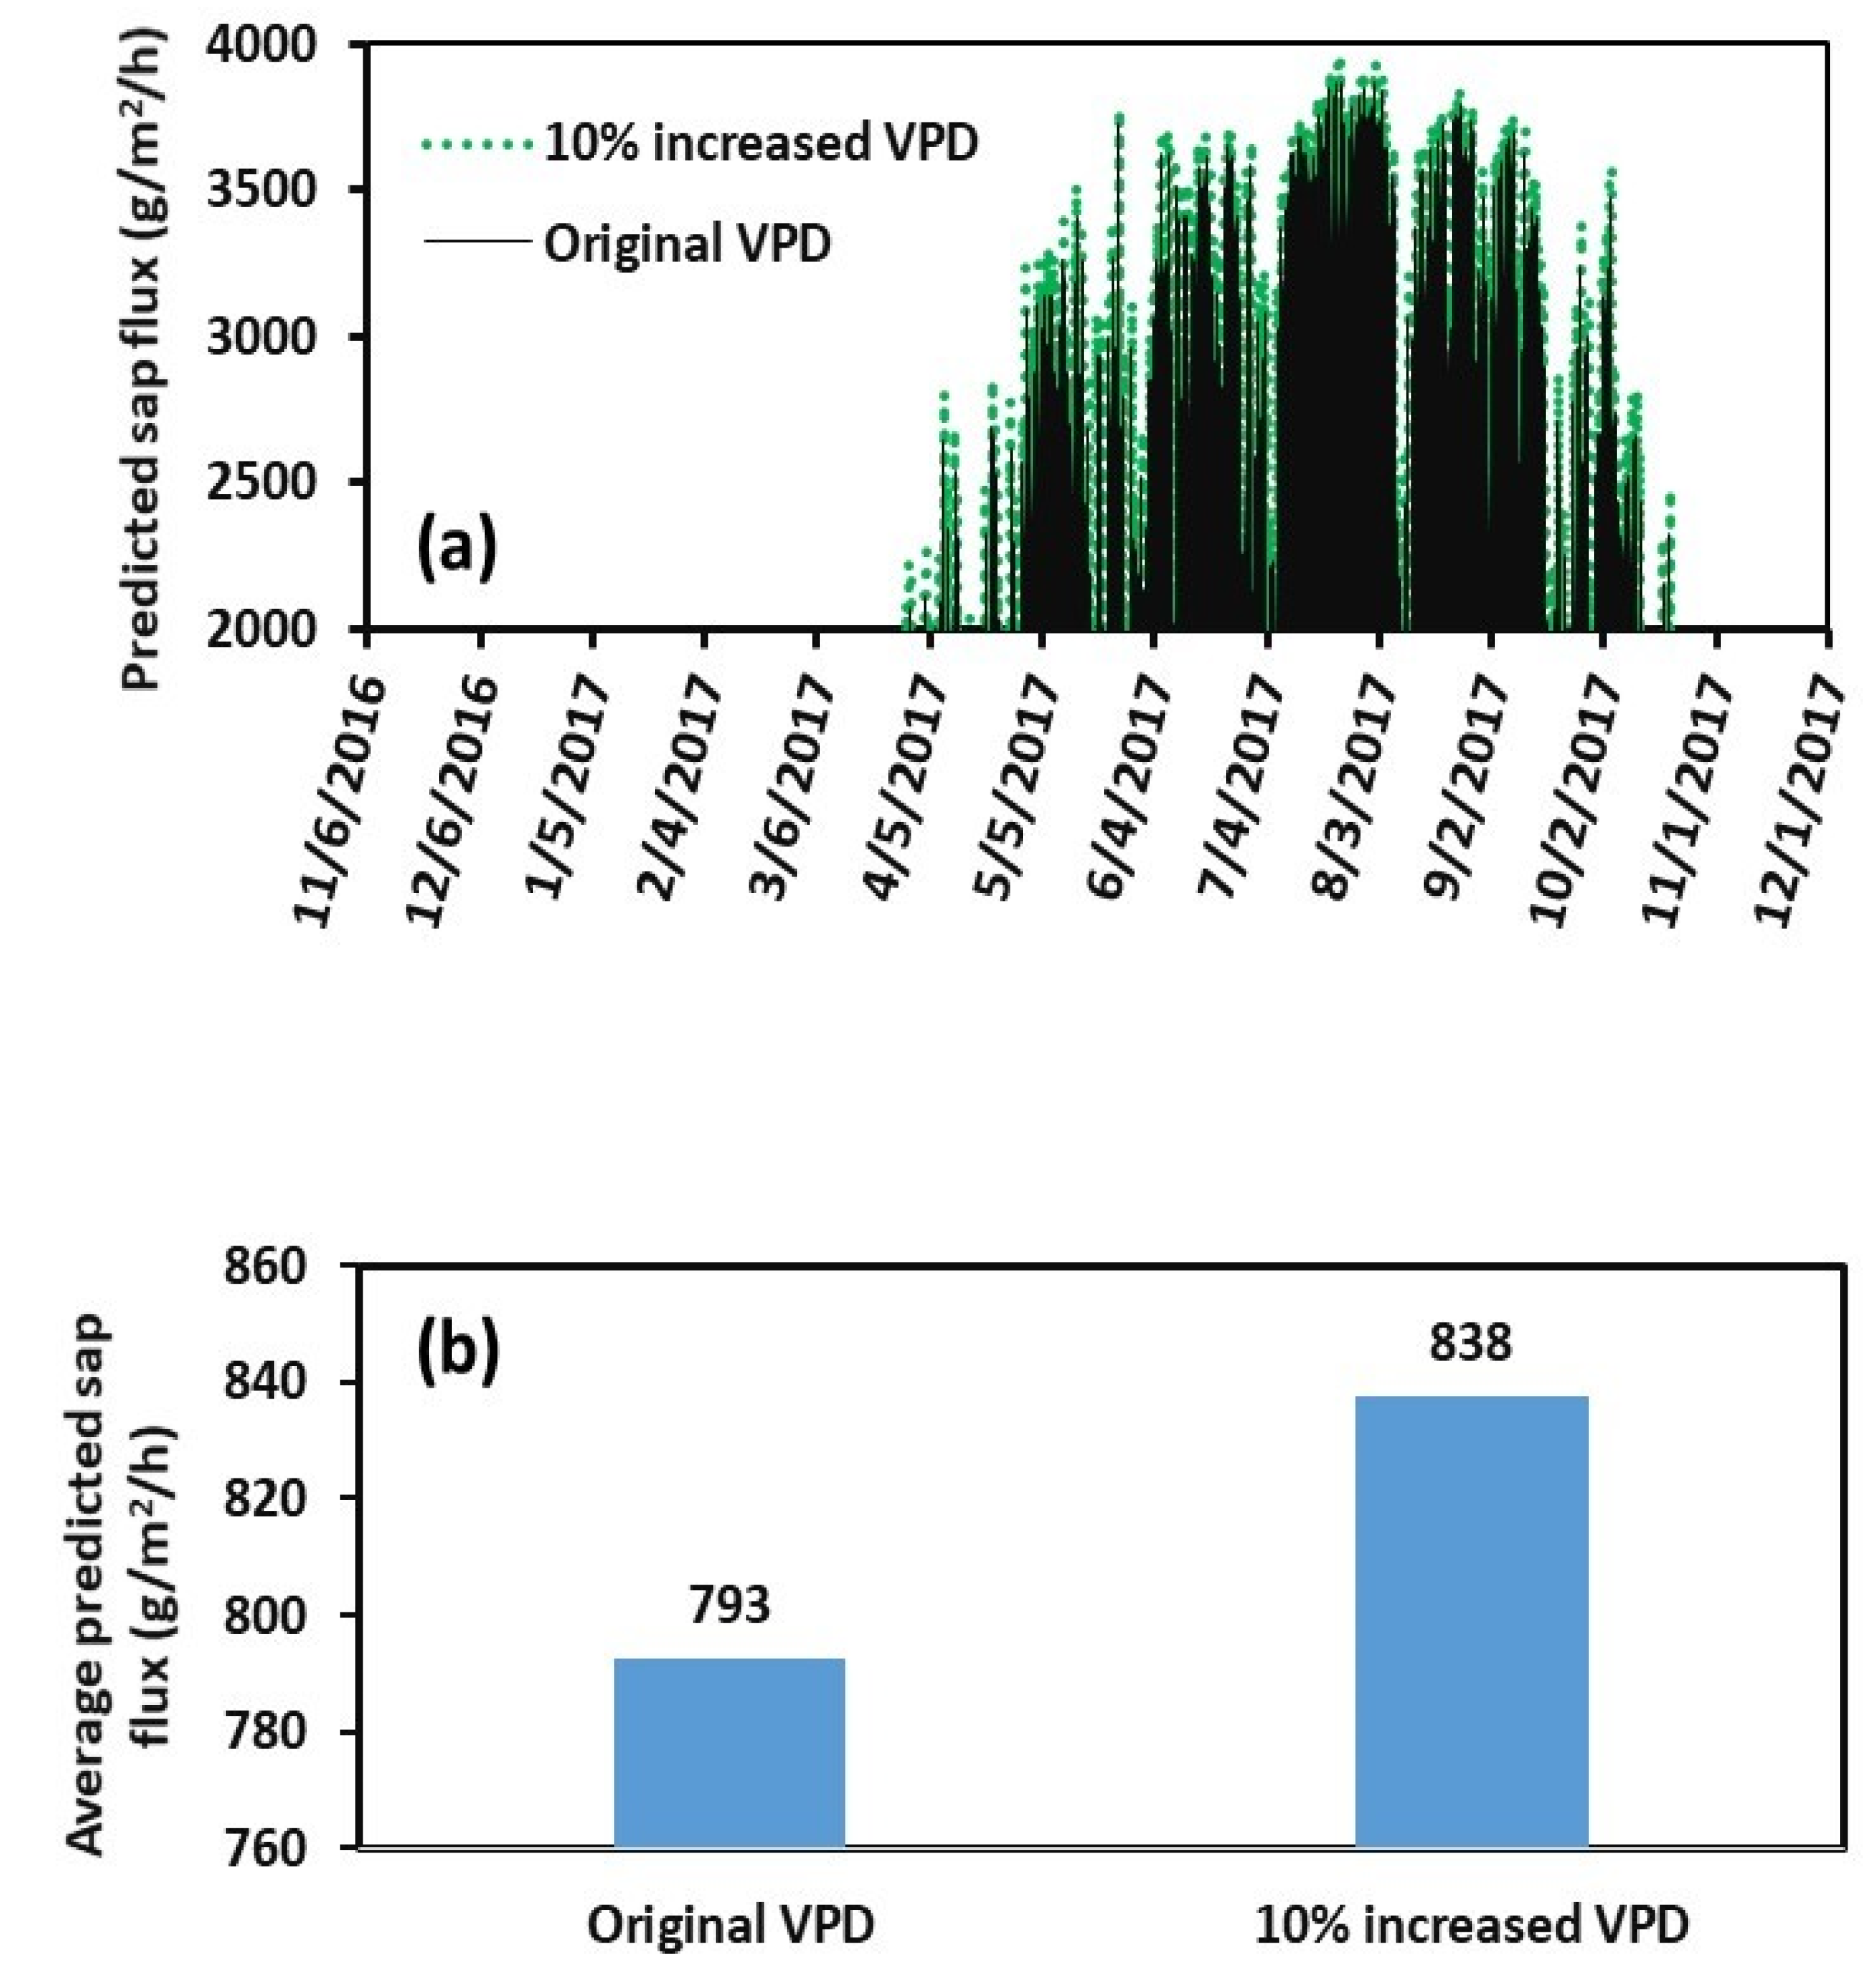
Comparisons of the predicted daily and overall average hourly sap flux of eastern cottonwood between the original VPD and the 10% increased VPD are shown in Figure 11. In general, an increase in VPD resulted in an increase in sap flux (Figure 11a). The results indicate that as the VPD increased due to the air temperature increase and the precipitation decrease under the changing climate, the sap flux of eastern cottonwood increased. Overall, the hourly average sap flux for the simulation period from 6 November 2016 to 1 December 2017 was 793 g/m2/h with the original VPD but was 838 g/m2/h with the 10% increased VPD (Figure 11b). The latter was 5.67% greater than the former.

4. Conclusions

This study provides a model to estimate the sap flux of eastern cottonwood grown in short-rotation biomass production plantations. Sap flux was predicted from adjusted VPD, as modeled with STELLA software. The model was validated using two different sap flux datasets collected with sensors between 1 December 2015 and 30 November 2016. Very good agreement was found between predicted and measured sap flux. More specifically, predicted diurnal patterns and annual sap flux cycles matched those of measured sap flux.
The model was then applied to predict eastern cottonwood sap flux for a year-long simulation period (30 November 2016 to 30 October 2017). The model appeared to predict reasonable diurnal patterns and annual cycles of eastern cottonwood sap flux. Overall, a 10% increase in VPD increased the sap flux of eastern cottonwood by about 5%. The model provides a new approach for estimating the sap flux of cottonwood in short-rotation bioenergy plantations in a time-saving and cost-effective manner.
The major limitations of the model were that soil water availability is not a limiting factor for sap flux and the very high sap flux peaks were not easily predicted. Therefore, further study is warranted to include soil water dynamics, hydrological processes, and high sap flux peak accommodations into the STELLA model. Additionally, the response of VPD to sap flux is tree species dependent. Although the model was developed for eastern cottonwood, it can be adapted to estimate the sap flux of other tree species with moderate effort.

Author Contributions

Conceptualization, Y.O.; methodology, Y.O. and H.R.; software, Y.O.; validation, Y.O., T.D.L., H.R., E.S.G., L.S.; formal analysis, Y.O.; resources, Y.O. and L.S.; data curation, Y.O. and L.S.; writing—original draft preparation, Y.O.; writing—review and editing, Y.O., T.D.L., H.R., E.S.G., and L.S.; visualization, Y.O. All authors have read and agreed to the published version of the manuscript.

Funding

This research received no external funding.

Institutional Review Board Statement

Not applicable.

Informed Consent Statement

Not applicable.

Data Availability Statement

Data available upon request.

Acknowledgments

Matt Moran for help in collecting the sap flux data.

Conflicts of Interest

The authors declare no conflict of interest.

Abbreviations

ETevapotranspiration
PARphotosynthetically active radiation
VPDvapor pressure deficit
STELLAStructural Thinking and Experiential Learning Laboratory with Animation

References

  1. McKendry, P. Energy production from biomass (Part 1): Overview of biomass. Bioresour. Technol. 2002, 83, 37–46. [Google Scholar] [CrossRef]
  2. Gable, M.; Zacchi, G. A review of the production of ethanol from softwood. Appl. Microbiol. Biotechnol. 2002, 59, 618–628. [Google Scholar]
  3. Berndes, G.; Hoogwijk, M.; van den Broek, R. The contribution of biomass in the future global energy supply: A review of 17 studies. Biomass Bioenergy 2003, 25, 1–28. [Google Scholar] [CrossRef]
  4. US-DOE (US Department of Energy). 2016 Billion-Ton Report, Advancing Domestic Resources for a Thriving Bioeconomy; UT-Battelle LLC.: Oak Ridge, TN, USA, 2016; Volume 1. [Google Scholar]
  5. Hall, D.O. Biomass energy in industrialized countries-a view of the future. For. Ecol. Manag. 1997, 91, 17–45. [Google Scholar] [CrossRef]
  6. Kartha, S.; Larson, E.D. A Bioenergy Primer: Modernized Biomass Energy for Sustainable development; United Nations Development Programme: New York, NY, USA, 2000. [Google Scholar]
  7. Gelfand, I.; Sahajpal, R.; Zhang, X.S.; Izaurralde, R.C.; Gross, K.L.; Robertson, G.P. Sustainable bioenergy production from marginal lands in the US Midwest. Nature 2013, 493, 514–517. [Google Scholar] [CrossRef]
  8. Hauk, S.; Knoke, T.; Wittkopf, S. Economic evaluation of short rotation coppice systems for energy from biomass—A review. Renew. Sustain. Energy Rev. 2014, 29, 435–448. [Google Scholar] [CrossRef]
  9. Pereira, S.; Costa, M. Short rotation coppice for bioenergy: From biomass characterization to establishment—A review. Renew. Sustain. Energy Rev. 2017, 74, 1170–1180. [Google Scholar] [CrossRef]
  10. Coleman, M.D.; Stanturf, J.A. Biomass feedstock production systems: Economic and environmental benefits. Biomass Bioenergy 2006, 30, 693–695. [Google Scholar] [CrossRef]
  11. Zalesny, J.A.; Zalesny, R.S., Jr.; Coyle, D.R.; Hall, R.B. Growth and biomass of Populus irrigated with landfill leachate. For. Ecol. Manag. 2007, 248, 143–152. [Google Scholar] [CrossRef]
  12. Kline, K.L.; Coleman, M.D. Woody energy crops in the southeastern United States: Two centuries of practitioner experience. Biomass Bioenergy 2010, 34, 1655–1666. [Google Scholar] [CrossRef] [Green Version]
  13. Gonzalez, R.; Treasure, T.; Wright, J.; Saloni, D.; Phillips, R.; Abtb, R.; Jameel, H. Exploring the potential of eucalyptus for energy production in the Southern United States: Financial analysis of delivered biomass. Part I. Biomass Bioenergy 2011, 35, 755–766. [Google Scholar] [CrossRef]
  14. Volk, T.A.; Abrahamson, L.P.; White, E.H.; Downing, M. Developing a Willow Biomass Crop Enterprise in the United States. In Proceedings of the IEA Task 17 Short-rotation Woody Crops Meeting, Auburn, GA, USA, 6–9 September 1999. [Google Scholar]
  15. Dye, P.J. Estimating Water Use by Eucalyptus Grandis With the Penman-Monteith Equation. In Proceedings of the Vancouver Symposium of Forest Hydrology and Watershed Management; Swanson, R.H., Bernier, P.Y., Woodard, P.D., Eds.; IAHS Publication: Oxfordshire, UK, 1987; pp. 329–337. [Google Scholar]
  16. Olbrich, B.W.; Le Roux, D.; Poulter, A.G.; Bond, W.J.; Stock, W.D. Variation in water use efficiency and 𝛿 13C levels in Eucalyptus grandis clones. J. Hydrol. 1993, 150, 615–633. [Google Scholar] [CrossRef]
  17. Soares, J.V.; Almeida, A.C. Modeling the water balance and soil water fluxes in a fast-growing Eucalyptus plantation in Brazil. J. Hydrol. 2001, 253, 130–147. [Google Scholar] [CrossRef]
  18. Albaugh, J.M.; Dye, P.J.; King, J.S. Eucalyptus and water use in South Africa. Int. J. Forestry Research. 2013, 2013, 11. [Google Scholar] [CrossRef] [Green Version]
  19. Flanagan, L.B.; Orchard, T.E.; Logieb, G.S.J.; Coburn, C.A.; Rood, S.B. Water use in a riparian cottonwood ecosystem: Eddy covariance measurements and scaling along a river corridor. Agric. For. Meteorol. 2017, 232, 332–348. [Google Scholar] [CrossRef]
  20. Scott, D.F.; Lesch, W. Streamflow responses to afforestation with Eucalyptus grandis and Pinus patula and to felling in the Mokobulaan experimental catchments, South Africa. J. Hydrol. 1997, 199, 360–377. [Google Scholar] [CrossRef]
  21. Morris, J.; Zhang, N.N.; Yang, Z.J.; Collopy, J.; Xu, D.P. Water use by fast-growing Eucalyptus urophylla plantations in southern China. Tree Physiol. 2004, 24, 1035–1044. [Google Scholar] [CrossRef] [Green Version]
  22. Weih, M. Evidence for increased sensitivity to nutrient and water stress in a fast-growing hybrid willow compared with a natural willow clone. Tree Physiol. 2001, 21, 1141–1148. [Google Scholar] [CrossRef]
  23. Zalesny, R.S., Jr.; Wiese, A.H.; Bauer, E.O.; Riemenschneider, D.E. Sap flux of hybrid poplar (Populus nigra L. P. maximowiczii A. Henry ‘NM6’) during phytoremediation of landfill leachate. Biomass Bioenergy 2006, 30, 784–793. [Google Scholar] [CrossRef]
  24. Wieser, G.; Gruber, A.; Oberhuber, W. Sap flow characteristics and whole-tree water use of Pinus cembra across the treeline ecotone of the central Tyrolean. Alps Eur. J. Forest. Res. 2013, 133, 287–295. [Google Scholar] [CrossRef]
  25. Hogg, E.H.; Hurdle, P.A. Sap flow in trembling aspen: Implications for stomatal responses to vapour pressure deficit. Tree Physiol. 1997, 17, 501–509. [Google Scholar] [CrossRef] [PubMed] [Green Version]
  26. Nadezhdina, N.; Cermak, J.; Ceulemans, R. Radial patterns of sap flow in woody stems of dominant and understory species: Scaling errors associated with positioning of sensors. Tree Physiol. 2002, 22, 907–918. [Google Scholar] [CrossRef] [PubMed] [Green Version]
  27. Wilson, K.B.; Hanson, P.J.; Mulholland, K.J.; Baldocchi, D.D.; Wullschleger, S.D. A comparison of methods for determining forest evapotranspiration and its components: Sap-flow, soil water budget, eddy covariance and catchment water balance. Agric. For. Meteorol. 2001, 6, 153–168. [Google Scholar] [CrossRef]
  28. Deng, J.F.; Ding, G.D.; Gao, G.L.; Wu, B.; Zhang, Y.Q.; Qin, S.G.; Fan, W.H. The sap flow dynamics and response of Hedysarum scoparium to environmental factors in semiarid northwestern China. PLoS ONE 2015, 10, e0131683. [Google Scholar] [CrossRef] [PubMed] [Green Version]
  29. Liu, X.; Zhang, B.; Zhuang, J.Y.; Han, C.; Zhai, L.; Zhao, W.R.; Zhang, J.C. The relationship between sap flow density and environmental factors in the Yangtze River delta region of China. Forests 2017, 8, 74. [Google Scholar] [CrossRef]
  30. IPCC. Managing the Risks of Extreme Events and Disasters to Advance Climate Change Adaptation. In Special Report of Working Groups I and II of the Intergovernmental Panel on Climate Change; Field, C.B., Barros, V., Stocker, T.F., Qin, D., Eds.; Cambridge University Press: Cambridge, UK, 2012. [Google Scholar]
  31. Lasch, P.; Kollas, C.; Rock, J.; Suckow, F. Potentials and impacts of short-rotation coppice plantation with aspen in Eastern Germany under conditions of climate change. Reg. Environ. Change 2010, 10, 83–94. [Google Scholar] [CrossRef]
  32. Griffiths, N.A.; Rau, B.M.; Vaché, K.B.; Starr, G.; Bitew, M.M.; Aubrey, D.P.; Martin, J.A.; Benton, E.; Jackson, C.R. Environmental effects of short-rotation woody crops for bioenergy: What is and isn’t known. GCB Bioenergy 2019, 11, 554–572. [Google Scholar] [CrossRef] [Green Version]
  33. Granier, A. Une nouvelle méthode pour la mesure de flux de sève brute dans le tronc des arbres. Ann. For. Sci. 1985, 42, 193–200. [Google Scholar] [CrossRef]
  34. Murray, F.W. On the computation of saturation vapor pressure. J. Appl. Meteorol. 1967, 6, 203–204. [Google Scholar] [CrossRef]
  35. Schaeffer, S.M.; Williams, D.G.; Goodrich, D.C. Transpiration of cottonwood/willow forest estimated from sap flux. Agric. For. Meteorol. 2000, 105, 257–270. [Google Scholar] [CrossRef]
  36. Forrester, J.W. System dynamics—The next fifty years. Syst. Dyn. Rev. 2007, 23, 359–370. [Google Scholar] [CrossRef]
  37. Ouyang, Y.; Zhang, J.E.; Lin, D.; Liu, G.D. A STELLA model for the estimation of atrazine runoff, leaching, adsorption, and degradation from an agricultural land. J. Soils Sediments 2010, 10, 263–271. [Google Scholar] [CrossRef]
  38. Ouyang, Y.; Leininger, T.D.; Hatten, J.; Parajuli, P. A STELLA model to estimate soil CO2 emissions from a short-rotation woody crop. Water Air Soil Pollut. 2012, 224, 1392. [Google Scholar] [CrossRef] [Green Version]
  39. Ouyang, Y.; Zhang, J.E.; Leininger, T.D.; Frey, B. A STELLA model to estimate water and nitrogen dynamics in a short-rotation woody crop plantation. J. Environ. Qual. 2015, 44, 200–209. [Google Scholar] [CrossRef] [PubMed]
  40. Taebi, A.; Mansy, H.A. Time-Frequency Distribution of Seismocardiographic Signals: A Comparative Study. Bioengineering 2017, 4, 32. [Google Scholar] [CrossRef]
  41. Nash, J.E.; Sutcliffe, J.V. River flow forecasting through conceptual models part I—A discussion of principles. J. Hydrol. 1970, 10, 282–290. [Google Scholar] [CrossRef]
  42. Samuelson, L.J.; Stokes, T.A.; Coleman, M.D. Influence of irrigation and fertilization on transpiration and hydraulic properties of Populus deltoides. Tree Physiol. 2007, 27, 765–774. [Google Scholar] [CrossRef] [Green Version]
  43. Yuan, W.; Zheng, Y.; Piao, S.; Ciais, P.; Lombardozzi, D.L.; Wang, Y.-P.; Ryu, Y.; Chen, G.; Dong, W.; Hu, Z.; et al. Increased atmospheric vapor pressure deficit reduces global vegetation growth. Sci. Adv. 2019, 5, eaax1396. [Google Scholar] [CrossRef] [Green Version]
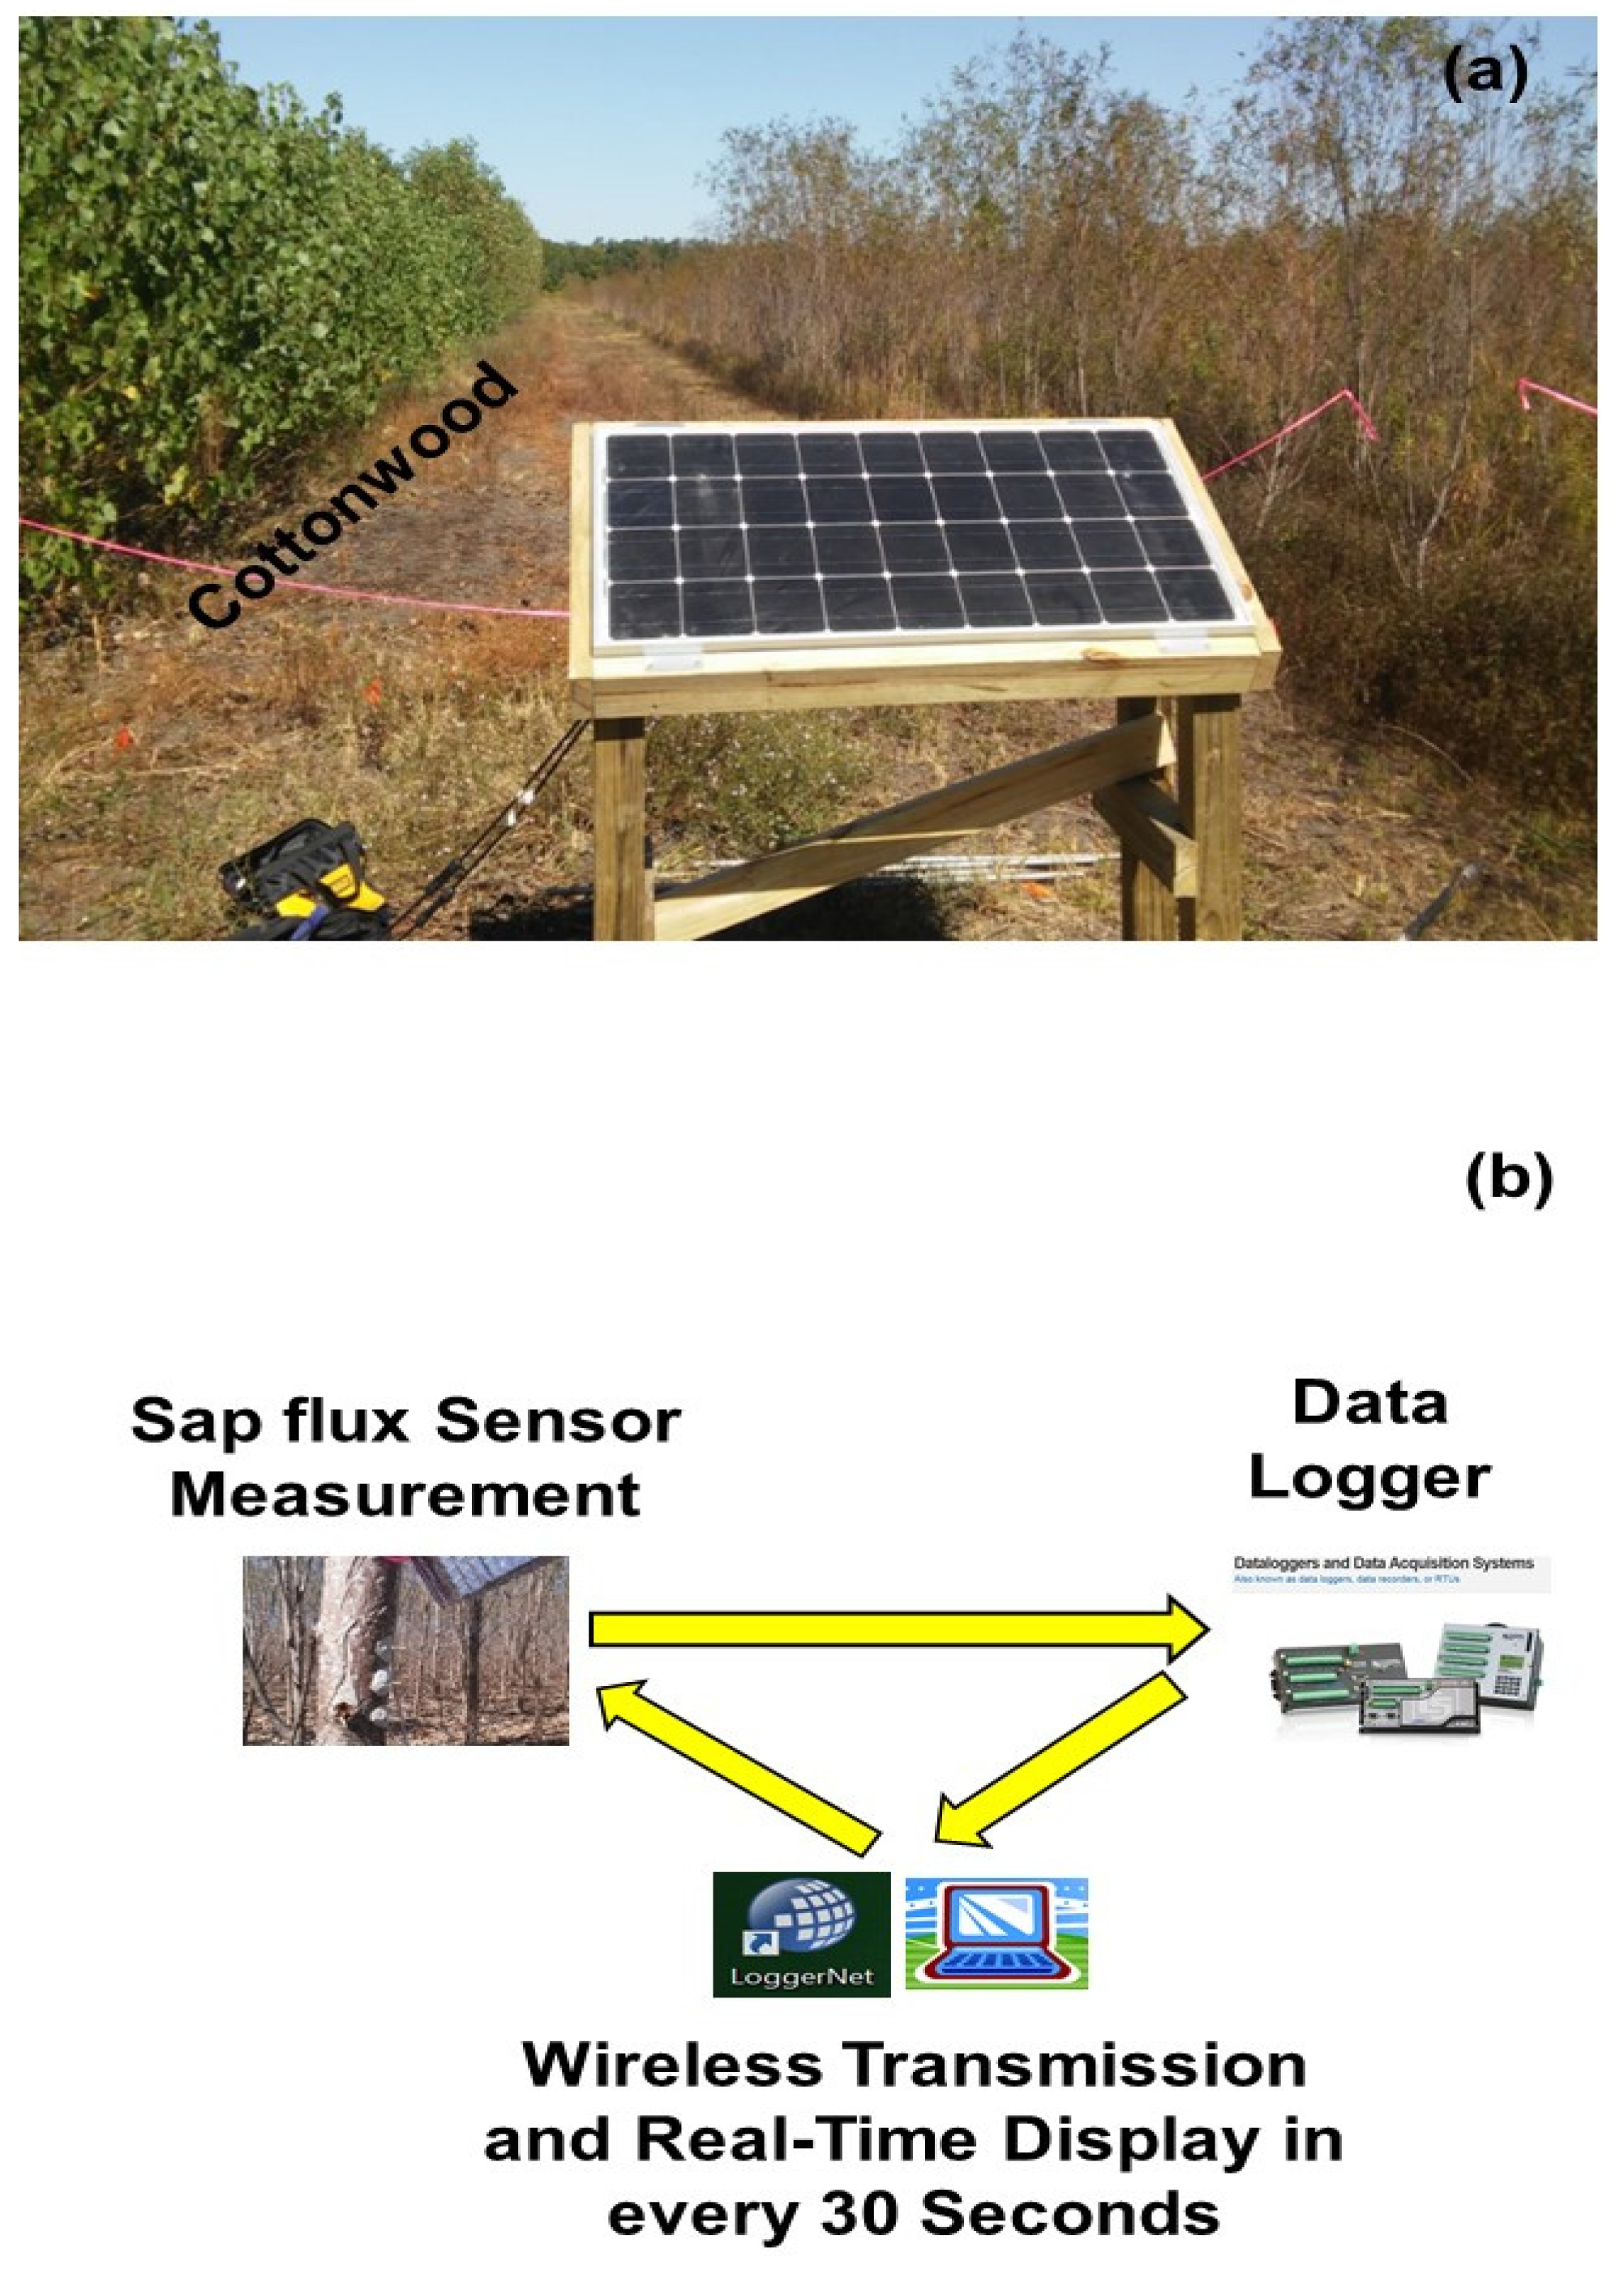
Figure 1. A short-rotation woody crop plantation used in this study near Hollandale, Mississippi, USA (a) and real-time monitoring of sap flux from eastern cottonwood using the sensor–datalogger system (b).
Climate 09 00022 g001
Figure 2. Time series plots of the measured sap flux and the measured vapor pressure deficit (VPD) (a) and their correlation (b) for eastern cottonwood in a biomass production plantation near Hollandale, Mississippi, USA.
Climate 09 00022 g002
Figure 3. Diurnal sap flux and VPD as measured on selected spring, summer, and fall dates for eastern cottonwood in a biomass production plantation near Hollandale, Mississippi, USA.
Climate 09 00022 g003
Figure 4. A flowchart showing the procedures used to develop a Structural Thinking and Experiential Learning Laboratory with Animation (STELLA)-based model for predicting sap flux using the adjusted VPD.
Climate 09 00022 g004
Figure 5. Measured sap flux and adjusted VPD for selected dates in spring, summer, and fall for eastern cottonwood in a biomass production plantation near Hollandale, MS, USA.
Climate 09 00022 g005
Figure 6. A STELLA modeling map for estimating the sap flux of eastern cottonwood from adjusted VPD.
Climate 09 00022 g006
Figure 7. The relationship between measured sap flux and adjusted VPD (a) and the time series plots of measured sap flux and the adjusted VPD (b) for eastern cottonwood in a biomass production plantation near Hollandale, MS, USA.
Climate 09 00022 g007
Figure 8. A comparison of the measured and predicted sap flux (a) and their time series plots (b) during the model validation process for eastern cottonwood in a biomass production plantation near Hollandale, Mississippi, USA.
Climate 09 00022 g008
Figure 9. A comparison of the measured and predicted sap flux for eastern cottonwood in a biomass production plantation near Hollandale, MS, USA (a) and an experimental plantation near Aiken, SC, USA (b).
Climate 09 00022 g009
Figure 10. Predicted diurnal (a) and annual (b) sap flux of eastern cottonwood in a biomass production plantation near Hollandale, Mississippi, USA.
Climate 09 00022 g010
Figure 11. Comparisons of the predicted daily (a) and overall average hourly (b) sap flux of eastern cottonwood between the original VPD and the 10% increased VPD.
Climate 09 00022 g011
Publisher’s Note: MDPI stays neutral with regard to jurisdictional claims in published maps and institutional affiliations.