Long-Term Trend Analysis in Annual and Seasonal Precipitation, Maximum and Minimum Temperatures in the Southwest United States
Abstract
1. Introduction
2. Materials and Methods
2.1. Study Sites, Precipitation, and Temperature Data Collected
2.2. Temporal Trend Analysis
3. Results and Discussion
3.1. Trend Analysis in Annual and Crop Growing Season Precipitation
3.2. Trend Analysis in Annual Maximum and Minimum Temperatures
3.3. Trend Analysis in Crop Growing Season Maximum and Minimum Temperatures
4. Conclusions
Author Contributions
Funding
Acknowledgments
Conflicts of Interest
References
- IPCC. Climate Change 2013: The Physical Science Basis; Stocker, T.F., Qin, D., Plattner, G.K., Tignor, M., Allen, S.K., Boschung, J., Nauels, A., Xia, Y., Bex, C., Midgley, P.M., Eds.; Contribution of Working Group I to the Fifth Assessment Report of the Intergovernmental Panel on Climate Change; Cambridge University Press: Cambridge, UK, 2016; 1535p.
- Zhao, P.; Jones, P.; Cao, L.; Yan, Z.; Zha, S.; Zhu, Y.; Yu, Y.; Tang, G. Trend of surface air temperature in Eastern China and associated large-scale climate variability over the last 100 years. Am. Meteorol. Soc. 2014, 27, 4693–4703. [Google Scholar] [CrossRef]
- Ceppi, P.; Scherrer, S.C.; Fischer, A.M.; Appenzeller, C. Revisiting Swiss temperature trends 1959–2008. Int. J. Climatol. 2012, 32, 203–213. [Google Scholar] [CrossRef]
- Nawaz, A.; Waqar, A.; Shah, S.A.R.; Sajid, M.; Khalid, M.I. An Innovative Framework for Risk Management in Construction Projects in Developing Countries: Evidence from Pakistan. Risks 2019, 7, 24. [Google Scholar] [CrossRef]
- Karmeshu, N. Trend Detection in Annual Temperature & Precipitation Using the Mann Kendall Test—A Case Study to Assess Climate Change on Select States in the Northeastern United States. Master’s Thesis, University of Pennsylvania, Philadelphia, PA, USA, 2012. [Google Scholar]
- Martinez, J.C.; Maleski, J.J.; Miller, F.M. Trends in precipitation and temperature in Florida, USA. J. Hydrol. 2012, 452–453, 259–281. [Google Scholar] [CrossRef]
- IPCC. Climate Change 2014: Synthesis Report; Core Writing Team, Pachauri, R.K., Meyer, L.A., Eds.; Contribution of Working Groups I, II and III to the Fifth Assessment Report of the Intergovernmental Panel on Climate Change; IPCC: Geneva, Switzerland, 2014; 151p.
- Singh, H.; Pirani, F.J.; Najafi, M.R. Characterizing the temperature and precipitation covariability over Canada. Theor. Appl. Climatol. 2020, 139, 1543–1558. [Google Scholar] [CrossRef]
- Bonsal, B.R.; Aider, R.; Gachon, P.; Lapp, S. An assessment of Canadian prairie drought: Past, present, and future. Clim. Dyn. 2013, 41, 501–516. [Google Scholar] [CrossRef]
- Djaman, K.; Balde, A.B.; Rudnick, D.R.; Ndiaye, O.; Irmak, S. Long-term trend analysis in climate variables and agricultural adaptation strategies to climate change in the Senegal River Basin. Int. J. Climatol. 2016, 37, 2873–2888. [Google Scholar] [CrossRef]
- Men, B.; Wu, Z.; Liu, H.; Tian, W.; Zhao, Y. Spatio-temporal analysis of precipitation and temperature: A case of study over the Beijing-Tianjin-Hebei region, China. Pure Appl. Geophys. 2020. [Google Scholar] [CrossRef]
- Sibanda, S.; Grab, S.; Ahmed, F. Long-term rainfall characteristics in the Mzingwane catchment of south-western Zimbabwe. Theor. Appl. Climatol. 2020, 139, 935–948. [Google Scholar] [CrossRef]
- Gajbhiye, S.; Meshram, C.; Mirabbasi, R.; Sharma, S.K. Trend analysis of rainfall time series for Sindh River basin in India. Theor. Appl. Climatol. 2016, 125, 593–608. [Google Scholar] [CrossRef]
- Kumar, V.; Jain, S.K.; Singh, Y. Analysis of long term rainfall trends in India. Hydrol. Sci. J. 2010, 55, 484–496. [Google Scholar] [CrossRef]
- Karpouzos, D.K.; Kavalieratou, S.; Babajimopoulos, C. Trend analysis of precipitation data in Pieria Region (Greece). Eur. Water 2010, 30, 31–40. [Google Scholar]
- Wang, X.; Zhuo, L.; Li, C.; Engel, B.A.; Sun, S.; Wang, Y. Temporal and spatial evolution trends of drought in northern Shaanxi of China: 1960–2100. Theor. Appl. Climatol. 2020, 139, 965–979. [Google Scholar] [CrossRef]
- Gao, X.; Zhao, Q.; Zhao, X.; Wu, P.; Pan, W.; Gao, X.; Sun, M. Temporal and spatial evolution of the standardized precipitation evapotranspiration index (SPEI) in the loess plateau under climate change from 2001 to 2050. Sci. Total Environ. 2017, 595, 191–200. [Google Scholar] [CrossRef]
- Valdés-Pineda, R.; Valdes, J.B.; Diaz, H.F.; Pizarro-Tapia, R. Analysis of spatio-temporal changes in annual and seasonal precipitation variability in South America-Chile and related ocean–atmosphere circulation patterns. Int. J. Climatol. 2015, 36. [Google Scholar] [CrossRef]
- Wolock, D.M.; McCabe, G.J. Estimates of Runoff using Water-Balance and Atmospheric General Circulation Models. J. Am. Water Resour. Assoc. 1999, 35, 1341–1350. [Google Scholar] [CrossRef]
- Mann, H.B. Nonparametric tests against trend. Econom. J. Econom. Soc. 1945, 13, 245–259. [Google Scholar] [CrossRef]
- Kendall, M.G. Rank Correlation Method, 4th ed.; Charles Griffin: London, UK, 1975. [Google Scholar]
- Caloiero, T.; Coscarelli, R.; Ferrari, E.; Mancini, M. Trend detection of annual and seasonal rainfall in Calabria (Southern Italy). Int. J. Climatol. 2011, 31, 44–56. [Google Scholar] [CrossRef]
- Mavromatis, T.; Stathis, D. Response of the Water Balance in Greece to Temperature and Precipitation Trends. Theor. Appl. Climatol. 2011, 104, 13–24. [Google Scholar] [CrossRef]
- Tabari, H.; Marofi, S.; Aeini, A.; Talaee, P.H.; Mohammadi, K. Trend analysis of reference evapotranspiration in the western half of Iran. Agric. Forest. Meteorol. 2011, 151, 128–136. [Google Scholar] [CrossRef]
- Yue, S.; Wang, C.Y. The Mann-Kendall Test Modified by Effective Sample Size to Detect Trend in Serially Correlated Hydrological Series. Water Resour. Manag. 2004, 18, 201–218. [Google Scholar] [CrossRef]
- Djaman, K.; Ganyo, K.K. Trend analysis in reference evapotranspiration and aridity index in the context of climate change in Togo. J. Water Clim. Chang. 2015, 6, 848–864. [Google Scholar] [CrossRef]
- Tabari, H.; Grismer, M.E.; Trajkovic, S. Comparative analysis of 31 reference evapotranspiration methods under humid conditions. Irrig. Sci. 2011, 1–11. [Google Scholar] [CrossRef]
- Some’e, B.S.; Ezani, A.; Tabari, H. Spatiotemporal Trends of Aridity Index in Arid and Semi-Arid Regions of Iran. Theor. Appl. Climatol. 2013, 111, 149–160. [Google Scholar] [CrossRef]
- Sen, P.K. Estimates of the regression coefficient based on Kendall’s tau. J. Am. Stat. Assoc. 1968, 63, 1379–1389. [Google Scholar] [CrossRef]
- Theil, H. A rank-invariant method of linear and polynomial regression analysis. Proc. Kon. Ned. Akad. Wetensch. 1950, A53, 386–392. [Google Scholar]
- Arriaga-Ramírez, S.; Cavazos, T. Regional trends of daily precipitation indices in northwest Mexicoand southwest United States. J. Geophys. Res. 2010, 115, D14111. [Google Scholar] [CrossRef]
- Diffenbaugh, N.S.; Giorgi, F.; Pal, J.S. Climate change hot spots in the United States. Geophys. Res. Lett. 2008, 35, L16709. [Google Scholar] [CrossRef]
- Easterling, D.R.; Kunkel, K.E.; Arnold, J.R.; Knutson, T.; LeGrande, A.N.; Leung, L.R.; Vose, R.S.; Waliser, D.E.; Wehner, M.F. Precipitation change in the United States. In Climate Science Special Report: Fourth National Climate Assessment; Wuebbles, D.J., Fahey, D.W., Hibbard, K.A., Dokken, D.J., Stewart, B.C., Maycock, T.K., Eds.; U.S. Global Change Research Program: Washington, DC, USA, 2017; Volume I, pp. 207–230. [Google Scholar] [CrossRef]
- Kunkel, K.E.; Stevens, L.E.; Stevens, S.E.; Sun, L.; Janssen, E.; Wuebbles, D.; Redmond, K.T.; Dobson, J.G. Regional Climate Trends and Scenarios for the U.S. National Climate Assessment; Part 5. Climate of the Southwest U.S., NOAA Technical Report NESDIS; NOAA: Washington, DC, USA, 2013; pp. 142–145. [Google Scholar]
- Mock, C.J. Climatic controls and spatial variations of precipitation in the western United States. J. Clim. 1996, 9, 1111–1125. [Google Scholar] [CrossRef]
- Stahle, D.W.; Cook, E.R.; Villanueva Diaz, J.; Fye, F.K.; Burnette, D.J.; Griffin, R.D.; Acuña Soto, R.; Seager, R.; Heim, R.R., Jr. Early 21st-century drought in Mexico. Eos Trans. AGU 2009, 90, 89–100. [Google Scholar] [CrossRef]
- Gershunov, A.; Barnett, T.P. ENSO influence on intraseasonal extreme rainfall and temperature frequencies in the contiguous United States: Observations and model results. J. Clim. 1998, 11, 1575–1586. [Google Scholar] [CrossRef]
- Cayan, D.R.; Dettinger, M.D.; Diaz, H.F.; Graham, N. Decadal variability of precipitation over western North America. J. Clim. 1998, 11, 3148–3166. [Google Scholar] [CrossRef]
- Philander, S.G. El Niño, La Niña, and the Southern Oscillation; Academic Press: San Diego, CA, USA, 1989; 293p. [Google Scholar]
- D’Odorico, P.; Yoo, J.C.; Over, T.M. An assessment of ENSO-induced patterns of rainfall erosivity in the southwestern United States. J. Clim. 2001, 14, 4230–4242. [Google Scholar] [CrossRef]
- Jia, L.; Yang, X.; Vecchi, G.A.; Gudgel, R.G.; Delworth, T.L.; Rosati, A.; Stern, W.F.; Wittenberg, A.T.; Krishnamurthy, L.; Zhang, S. Improved Seasonal Prediction of Temperature and Precipitation over Land in a High-Resolution GFDL Climate Model. J. Clim. 2015, 28, 2044–2062. [Google Scholar] [CrossRef]
- Yang, X.; DelSole, T. Systematic comparison of ENSO teleconnection patterns between models and observations. J. Clim. 2012, 25, 425–446. [Google Scholar] [CrossRef]
- Corringham, T.W.; Cayan, D.R. The Effect of El Niño on Flood Damages in the Western United States. Weather Clim. Soc. 2019, 11, 489–504. [Google Scholar] [CrossRef]
- Yang, X.; Jia, L.; Kapnick, S.B.; Jia, L.; Delworth, T.L.; Vecchi, G.A.; Gudgel, R.; Underwood, S.; Zeng, F. On the seasonal prediction of the western United States El Niño precipitation pattern during the 2015/16 winter. Clim. Dyn. 2018, 51, 3765–3783. [Google Scholar] [CrossRef]
- Ropelewski, C.F.; Halpert, M.S. Global and Regional Scale Precipitation Patterns Associated with the El Niño/Southern Oscillation. Mon. Weather Rev. 1987, 115, 1606–1626. [Google Scholar] [CrossRef]
- Halpert, M.S.; Ropelewski, C.F. Surface Temperature Patterns Associated with the Southern Oscillation. J. Clim. 1992, 5, 577–593. [Google Scholar] [CrossRef]
- Changnon, S.A. Present and future economic impacts of climate extremes in the United States. Glob. Environ. Chang. Part B Environ. Hazards 2003, 5, 47–50. [Google Scholar] [CrossRef]
- Ahmed, M.K.; Alam, M.S.; Yousuf, A.H.M.; Islam, M.M. A long-term trend in precipitation of different spatial regions of Bangladesh and its teleconnections with El Niño/Southern Oscillation and Indian Ocean Dipole. Theor. Appl. Climatol. 2017, 129, 473–486. [Google Scholar] [CrossRef]
- Barros, V.; Doyle, M.; Camilloni, I. Precipitation trends in southeastern South America: Relationship with ENSO phases and with low-level circulation. Theor. Appl. Climatol. 2008, 93, 19–33. [Google Scholar] [CrossRef]
- Wilson, B. An empirical seasonal prediction model of the East Asian summer monsoon using ENSO and NAO. J. Geophys. Res. 2009, 114, D18120. [Google Scholar] [CrossRef]
- Zhou, L.T.; Wu, R. Respective impacts of the East Asianwinter monsoon and ENSO on winter rainfall in China. J. Geophys. Res. 2010, 115, D02107. [Google Scholar] [CrossRef]
- Jiang, F.; Zhang, W.; Geng, X.; Stuecker, M.F.; Liu, C. Impacts of Central Pacific El Niño on Southern China Spring Precipitation Controlled by its Longitudinal Position. J. Clim. 2019, 32, 7823–7836. [Google Scholar] [CrossRef]
- Ng, C.H.J.; Vecchi, G.A.; Muñoz, A.G.; Murakami, H. An asymmetric rainfall response to ENSO in East Asia. Clim. Dyn. 2019, 52, 2303–2318. [Google Scholar] [CrossRef]
- Sheppard, P.R.; Hughes, M.K.; Connie, A.C.; Packin, G.D.; Angersbach, K. The climate of the US Southwest. Clim. Res. 2002, 21, 219–238. [Google Scholar] [CrossRef]
- Schmitz, J.T.; Mullen, S. Water vapor transport associatedwith the summertime North American monsoon as depicted byECMWF analyses. J. Clim. 1996, 9, 1621–1634. [Google Scholar] [CrossRef]
- Alexander, L.V.; Zhang, X.; Peterson, T.C.; Caesar, J.; Gleason, B.; Tank, A.; Haylock, M.; Collins, D.; Trewin, B.; Rahimzadeh, F.; et al. Global observed changes in daily climate extremes of temperature and precipitation. J. Geophys. Res. Atmos. 2006, 111, D05109. [Google Scholar] [CrossRef]
- Gil-Alana, L.A. Maximum and minimum temperatures in the United States: Time trends and persistence. Atmos. Sci. Lett. 2018, 19, e810. [Google Scholar] [CrossRef]
- Türkes, M.; Sümer, U.M. Spatial and temporal patterns of trends and variability in diurnal temperature ranges of Turkey. Theor. Appl. Climatol. 2004, 77, 195–227. [Google Scholar] [CrossRef]
- Arora, M.; Goel, N.K.; Singh, P. Evaluation of temperature trends over India/Evaluation de tendances de température en Inde. Hydrol. Sci. J. 2005, 50, 1–93. [Google Scholar] [CrossRef]
- Gil-Alana, L.A.; Sauci, L. US temperatures: Time trends and persistence. Int. J. Climatol. 2019, 39, 5091–5103. [Google Scholar] [CrossRef]
- Siddik, M.A.Z.; Rahman, M. Trend analysis of maximum, minimum, and average temperatures in Bangladesh: 1961–2008. Theor. Appl. Climatol. 2014, 116, 721–730. [Google Scholar] [CrossRef]
- Tabari, H.; Talaee, P. Analysis of trends in temperature data in arid and semi-arid regions of Iran. Glob. Planet. Chang. 2011, 79, 1–10. [Google Scholar] [CrossRef]
- Vose, R.S.; Easterling, D.R.; Kunkel, K.E.; LeGrande, A.N.; Wehner, M.F. Temperature changes in the United States. In Climate Science Special Report: Fourth National Climate Assessment; Wuebbles, D.J., Fahey, D.W., Hibbard, K.A., Dokken, D.J., Stewart, B.C., Maycock, T.K., Eds.; U.S. Global Change Research Program: Washington, DC, USA, 2017; pp. 185–206. [Google Scholar] [CrossRef]
- Mix, K.; Lopes, V.L.; Rast, W. Annual and Growing Season Temperature Changes in the San Luis Valley, Colorado. Water Air Soil Pollut. 2011, 220, 189–203. [Google Scholar] [CrossRef]
- IPCC. Climate Change 2001: The Scientific Basis; Houghton, J.T., Ding, Y., Griggs, D.J., Noguer, M., van der Linden, P.J., Dai, X., Maskell, K., Johnson, C.A., Eds.; Contribution of Working Group I to the Third Assessment Report of the Intergovernmental Panel on Climate Change; Cambridge University Press: Cambridge, UK, 2001; 881p. [Google Scholar]
- Ghasemi, A.R. Changes and trends in maximum, minimum and mean temperature series in Iran. Atmos. Sci. Lett. 2015, 16, 366–372. [Google Scholar] [CrossRef]
- Folland, C.K.; Karl, T.R. Observed Climate Variability and Change. The Scientific Basis; Cambridge University Press: Cambridge, UK, 2001. [Google Scholar]
- Peng, S.; Huang, J.; Sheehy, J.E.; Laza, R.C.; Visperas, R.M.; Zhong, X.; Centeno, G.S.; Khush, G.S.; Cassman, K.G. Rice yields decline with higher night temperature from global warming. Proc. Natl. Acad. Sci. USA 2004, 101, 9971–9975. [Google Scholar] [CrossRef]
- Quian, B.; Gameda, S.S.; Zhang, X.; De Jong, R. Changing growing season observed in Canada. Clim. Chang. 2012, 112, 339–353. [Google Scholar] [CrossRef]
- Bonsal, B.R.; Zhang, X.; Vincent, L.A.; Hogg, W.D. Characteristics of daily and extreme temperatures over Canada. J. Clim. 2001, 14, 1923–1936. [Google Scholar] [CrossRef]
- Zhang, X.; Vincent, L.A.; Hogg, W.D.; Niitsoo, A. Temperature and precipitation trends in Canada during the 20th century. Atmos. Ocean. 2000, 38, 395–429. [Google Scholar] [CrossRef]
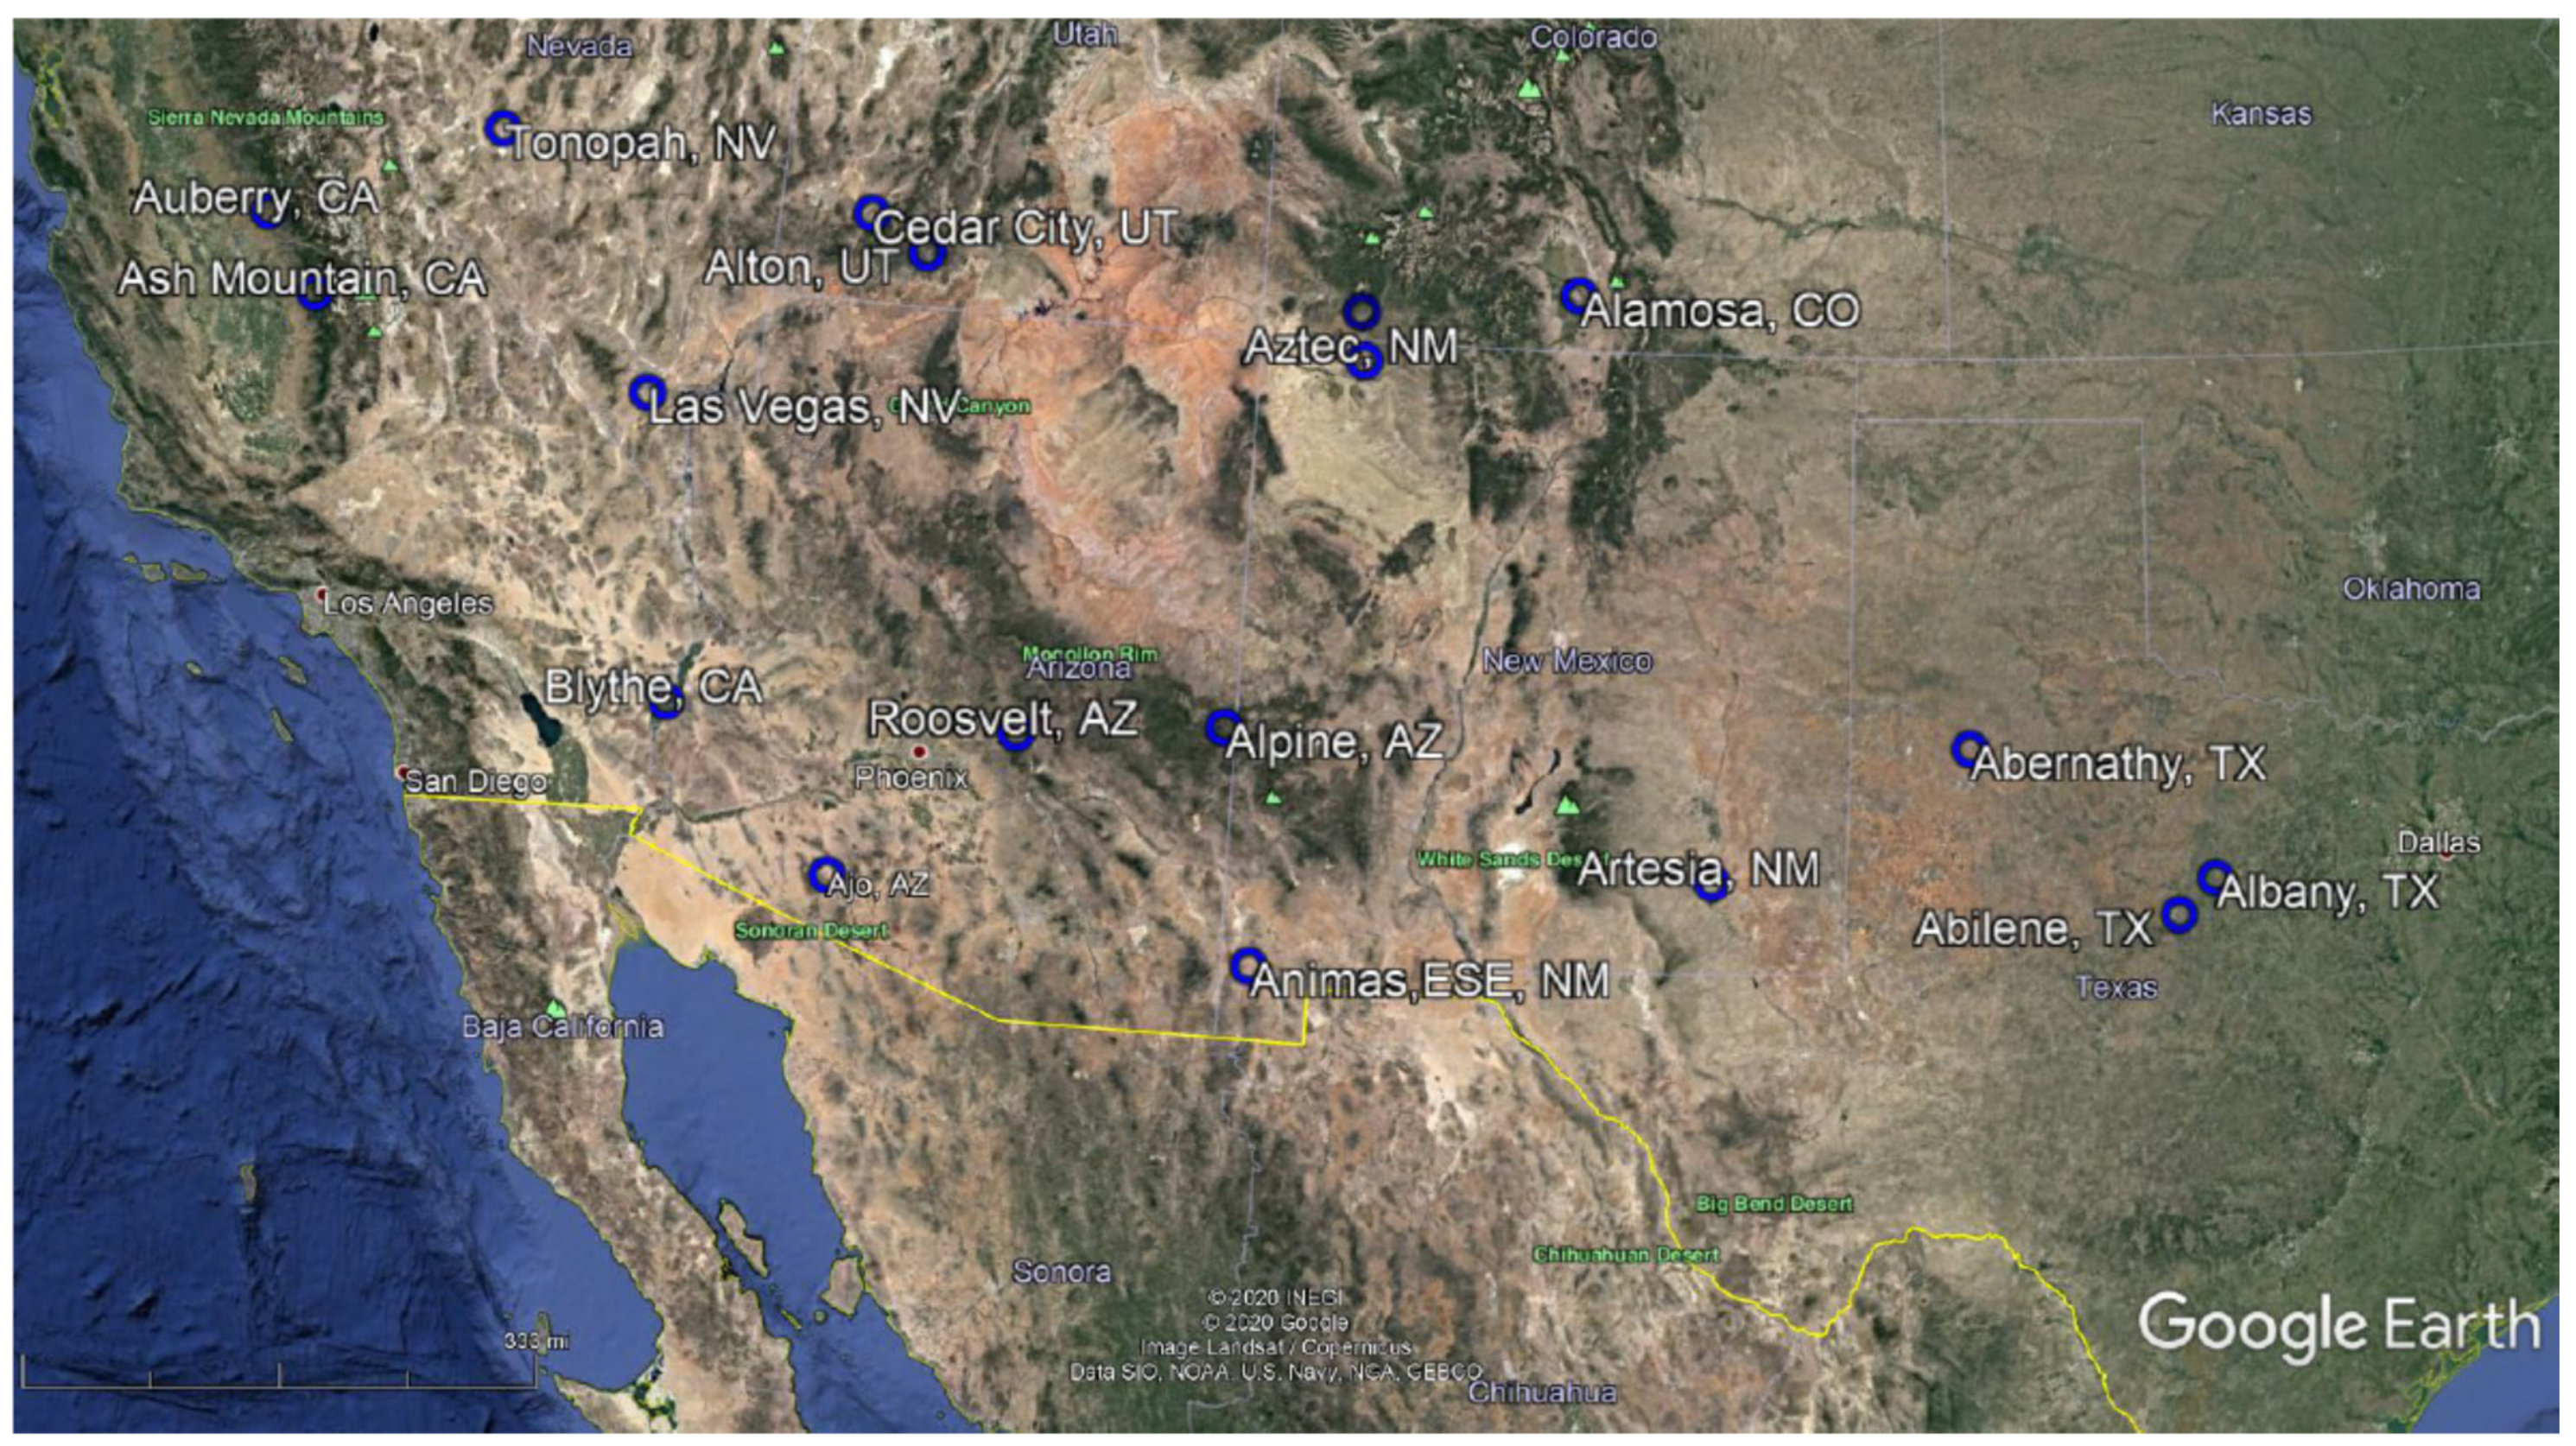
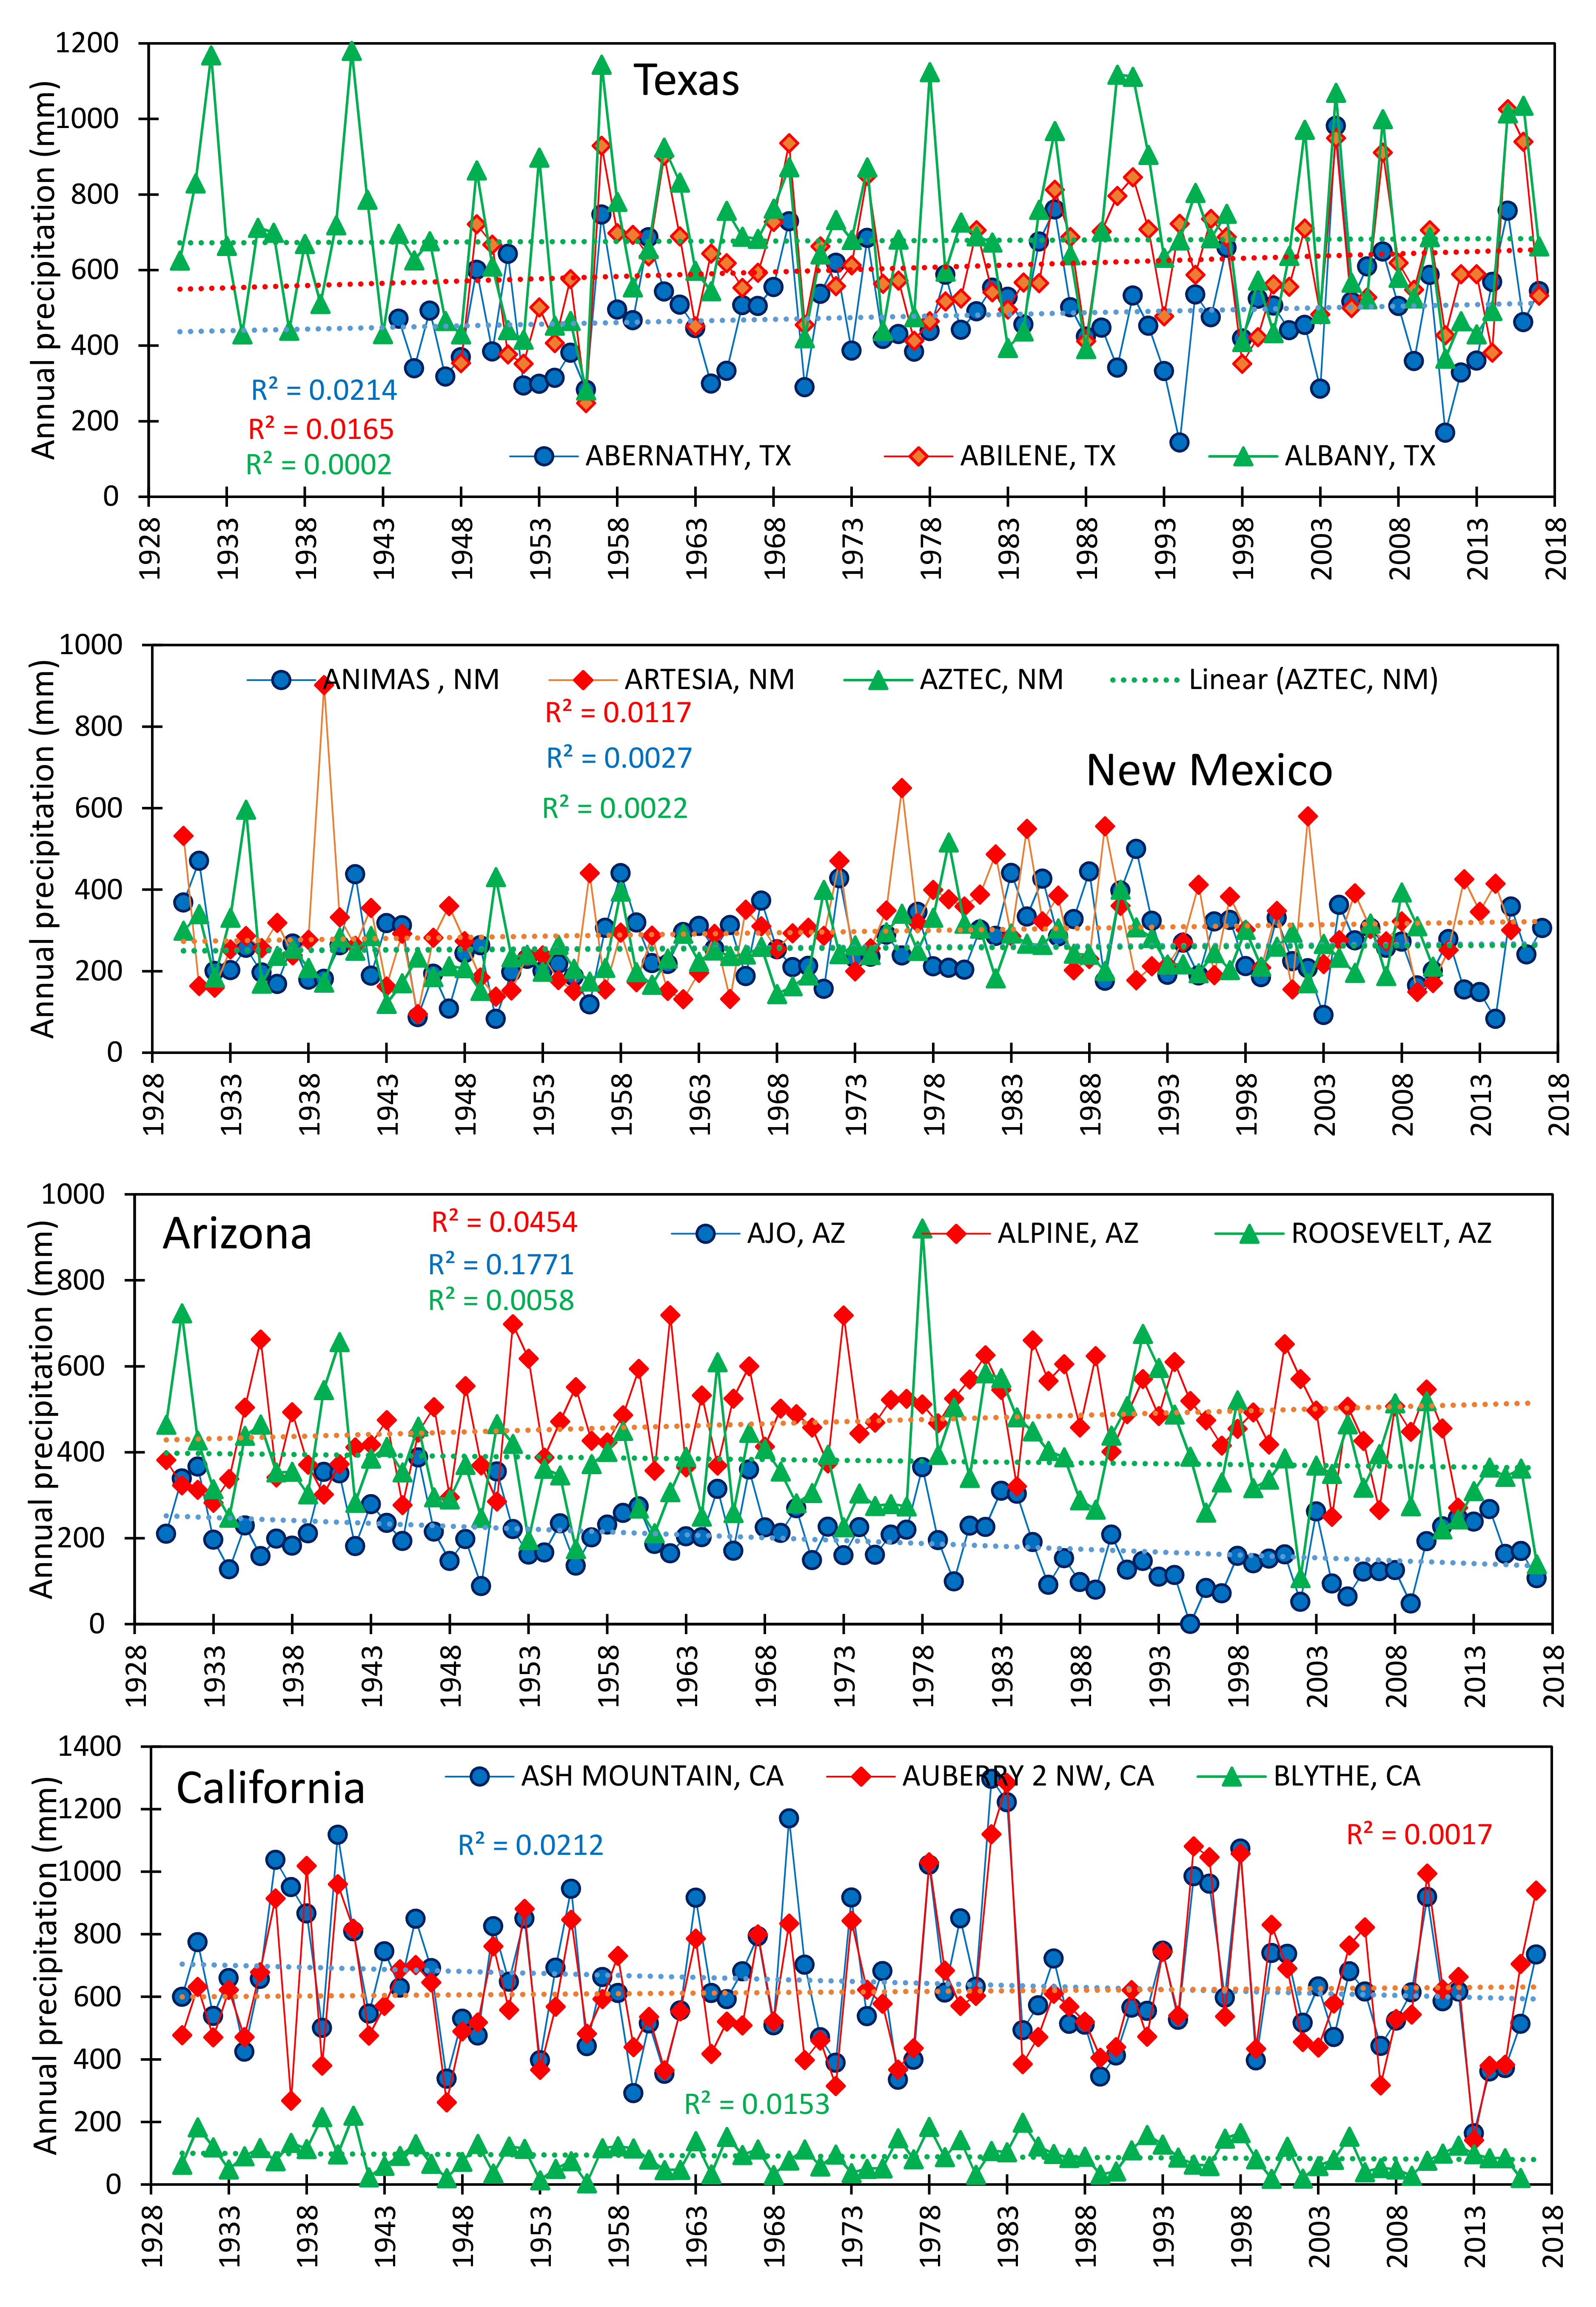
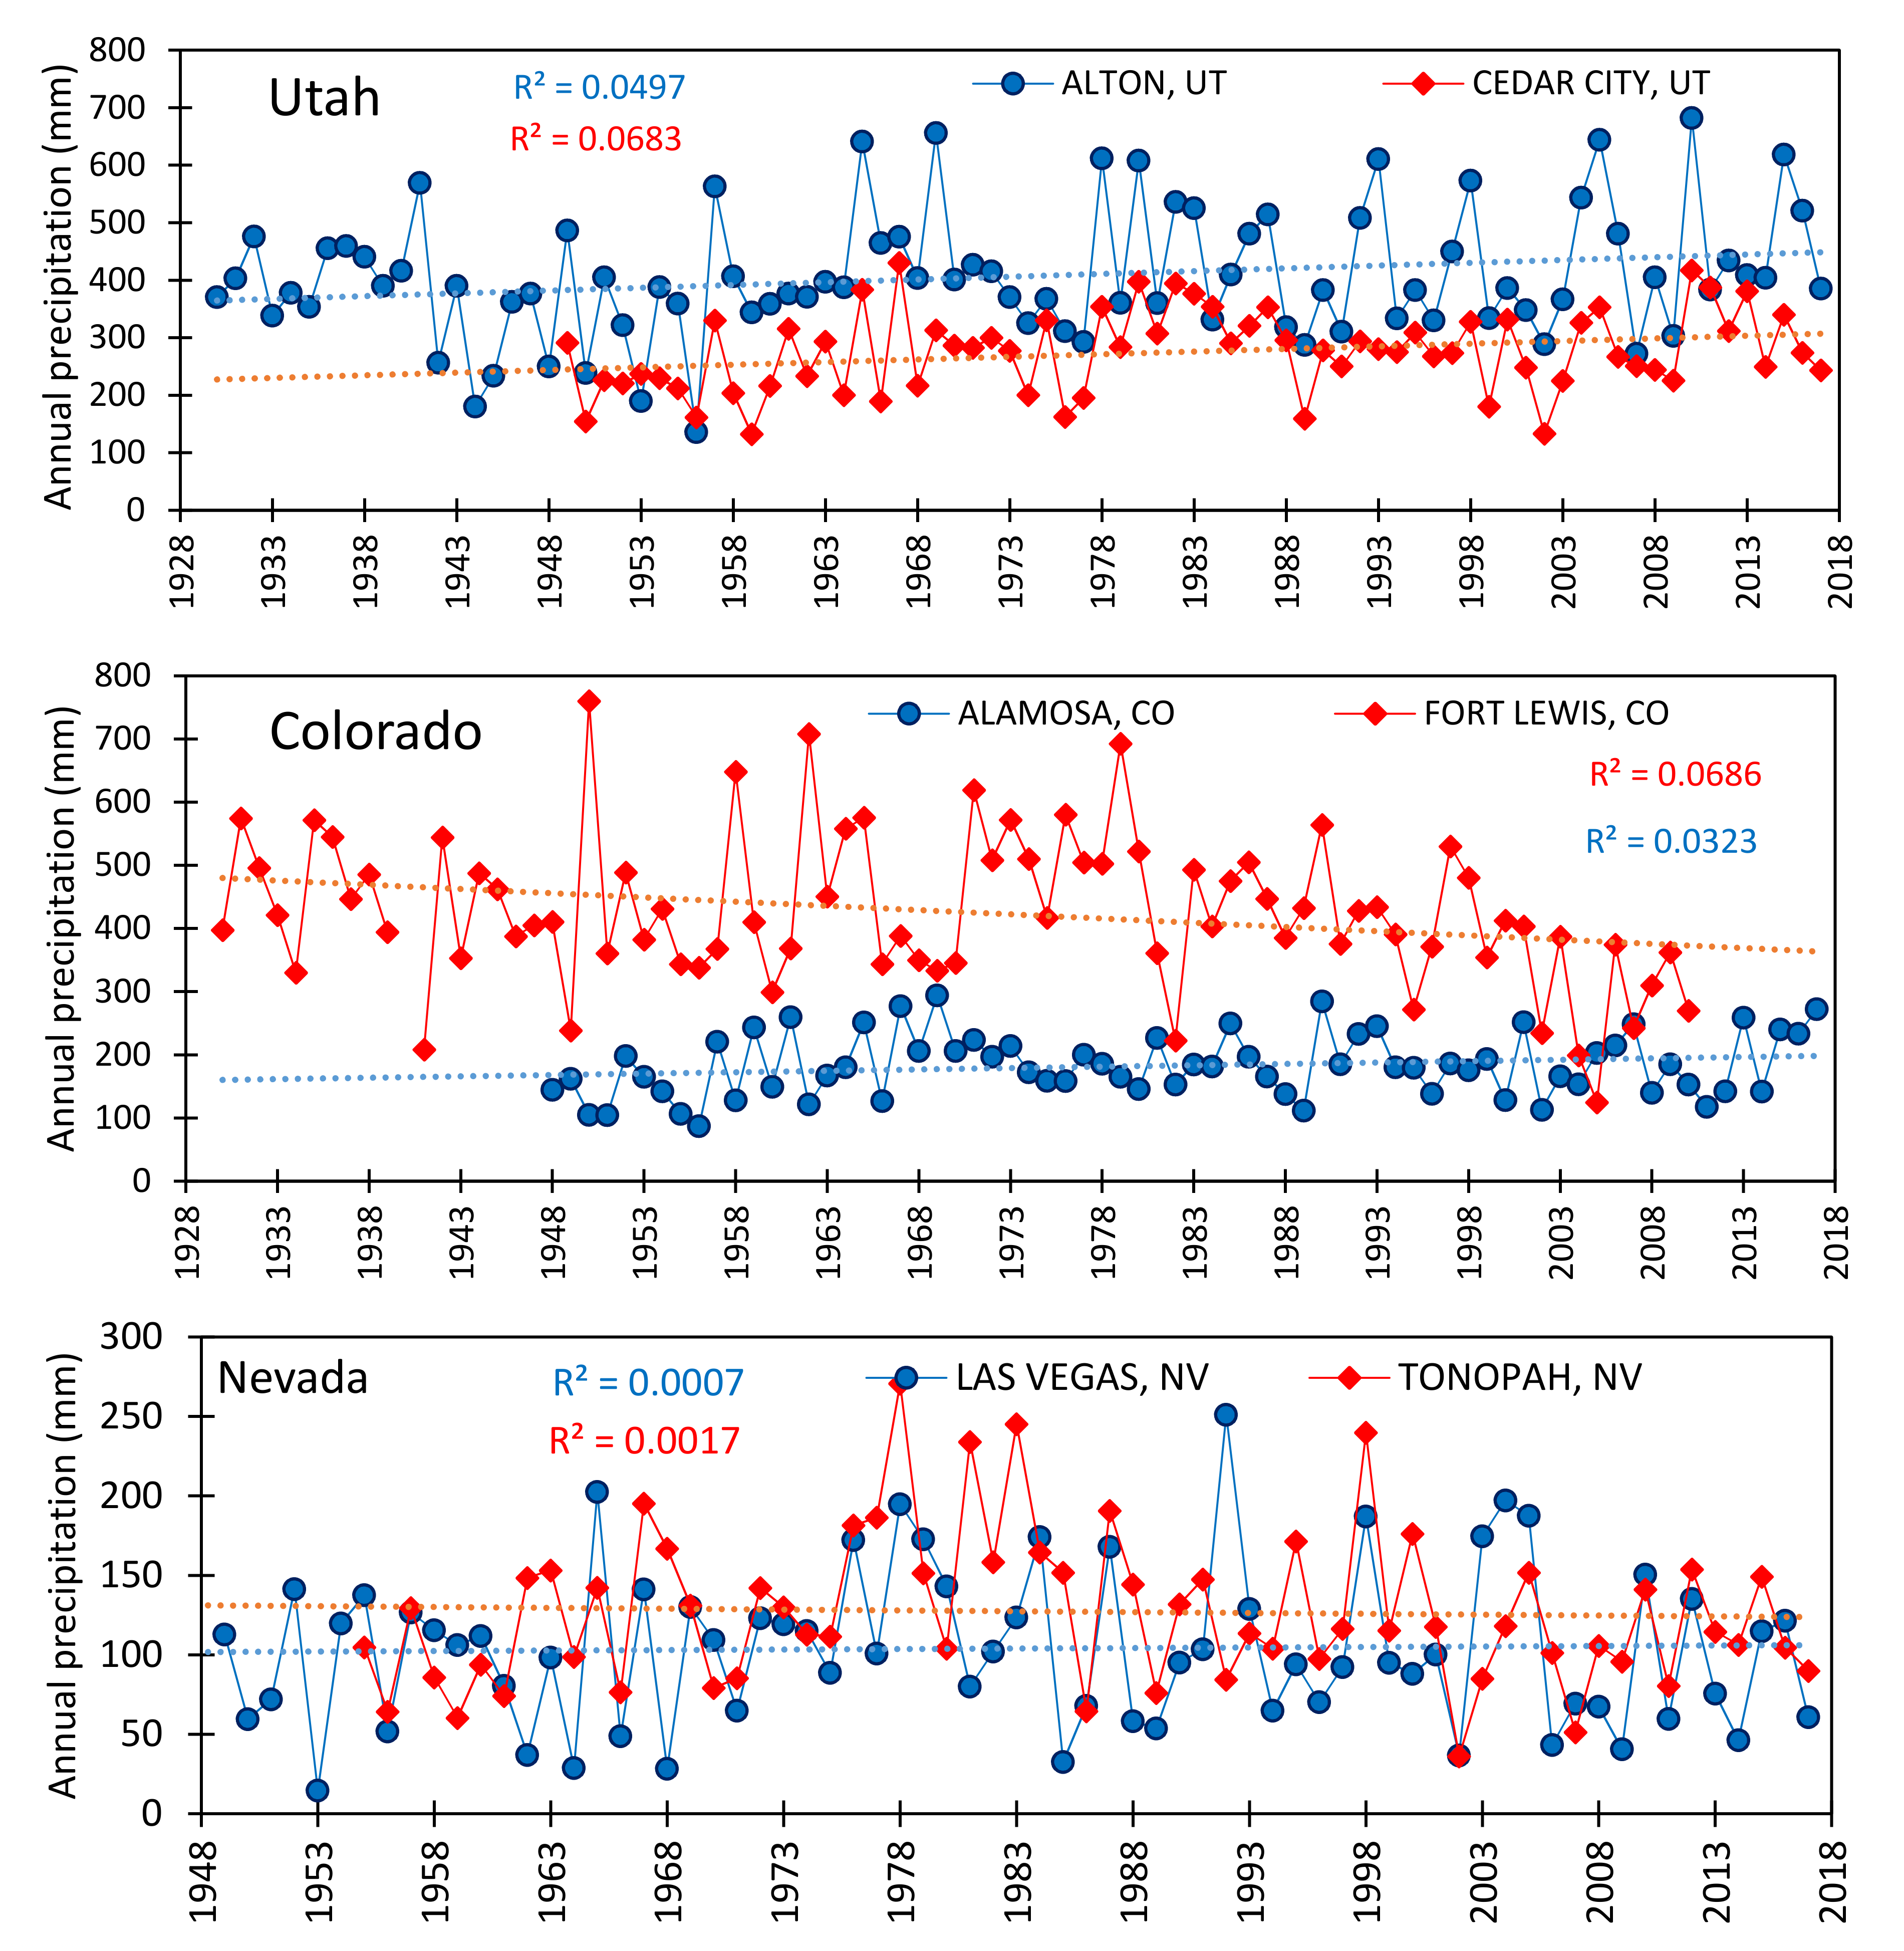
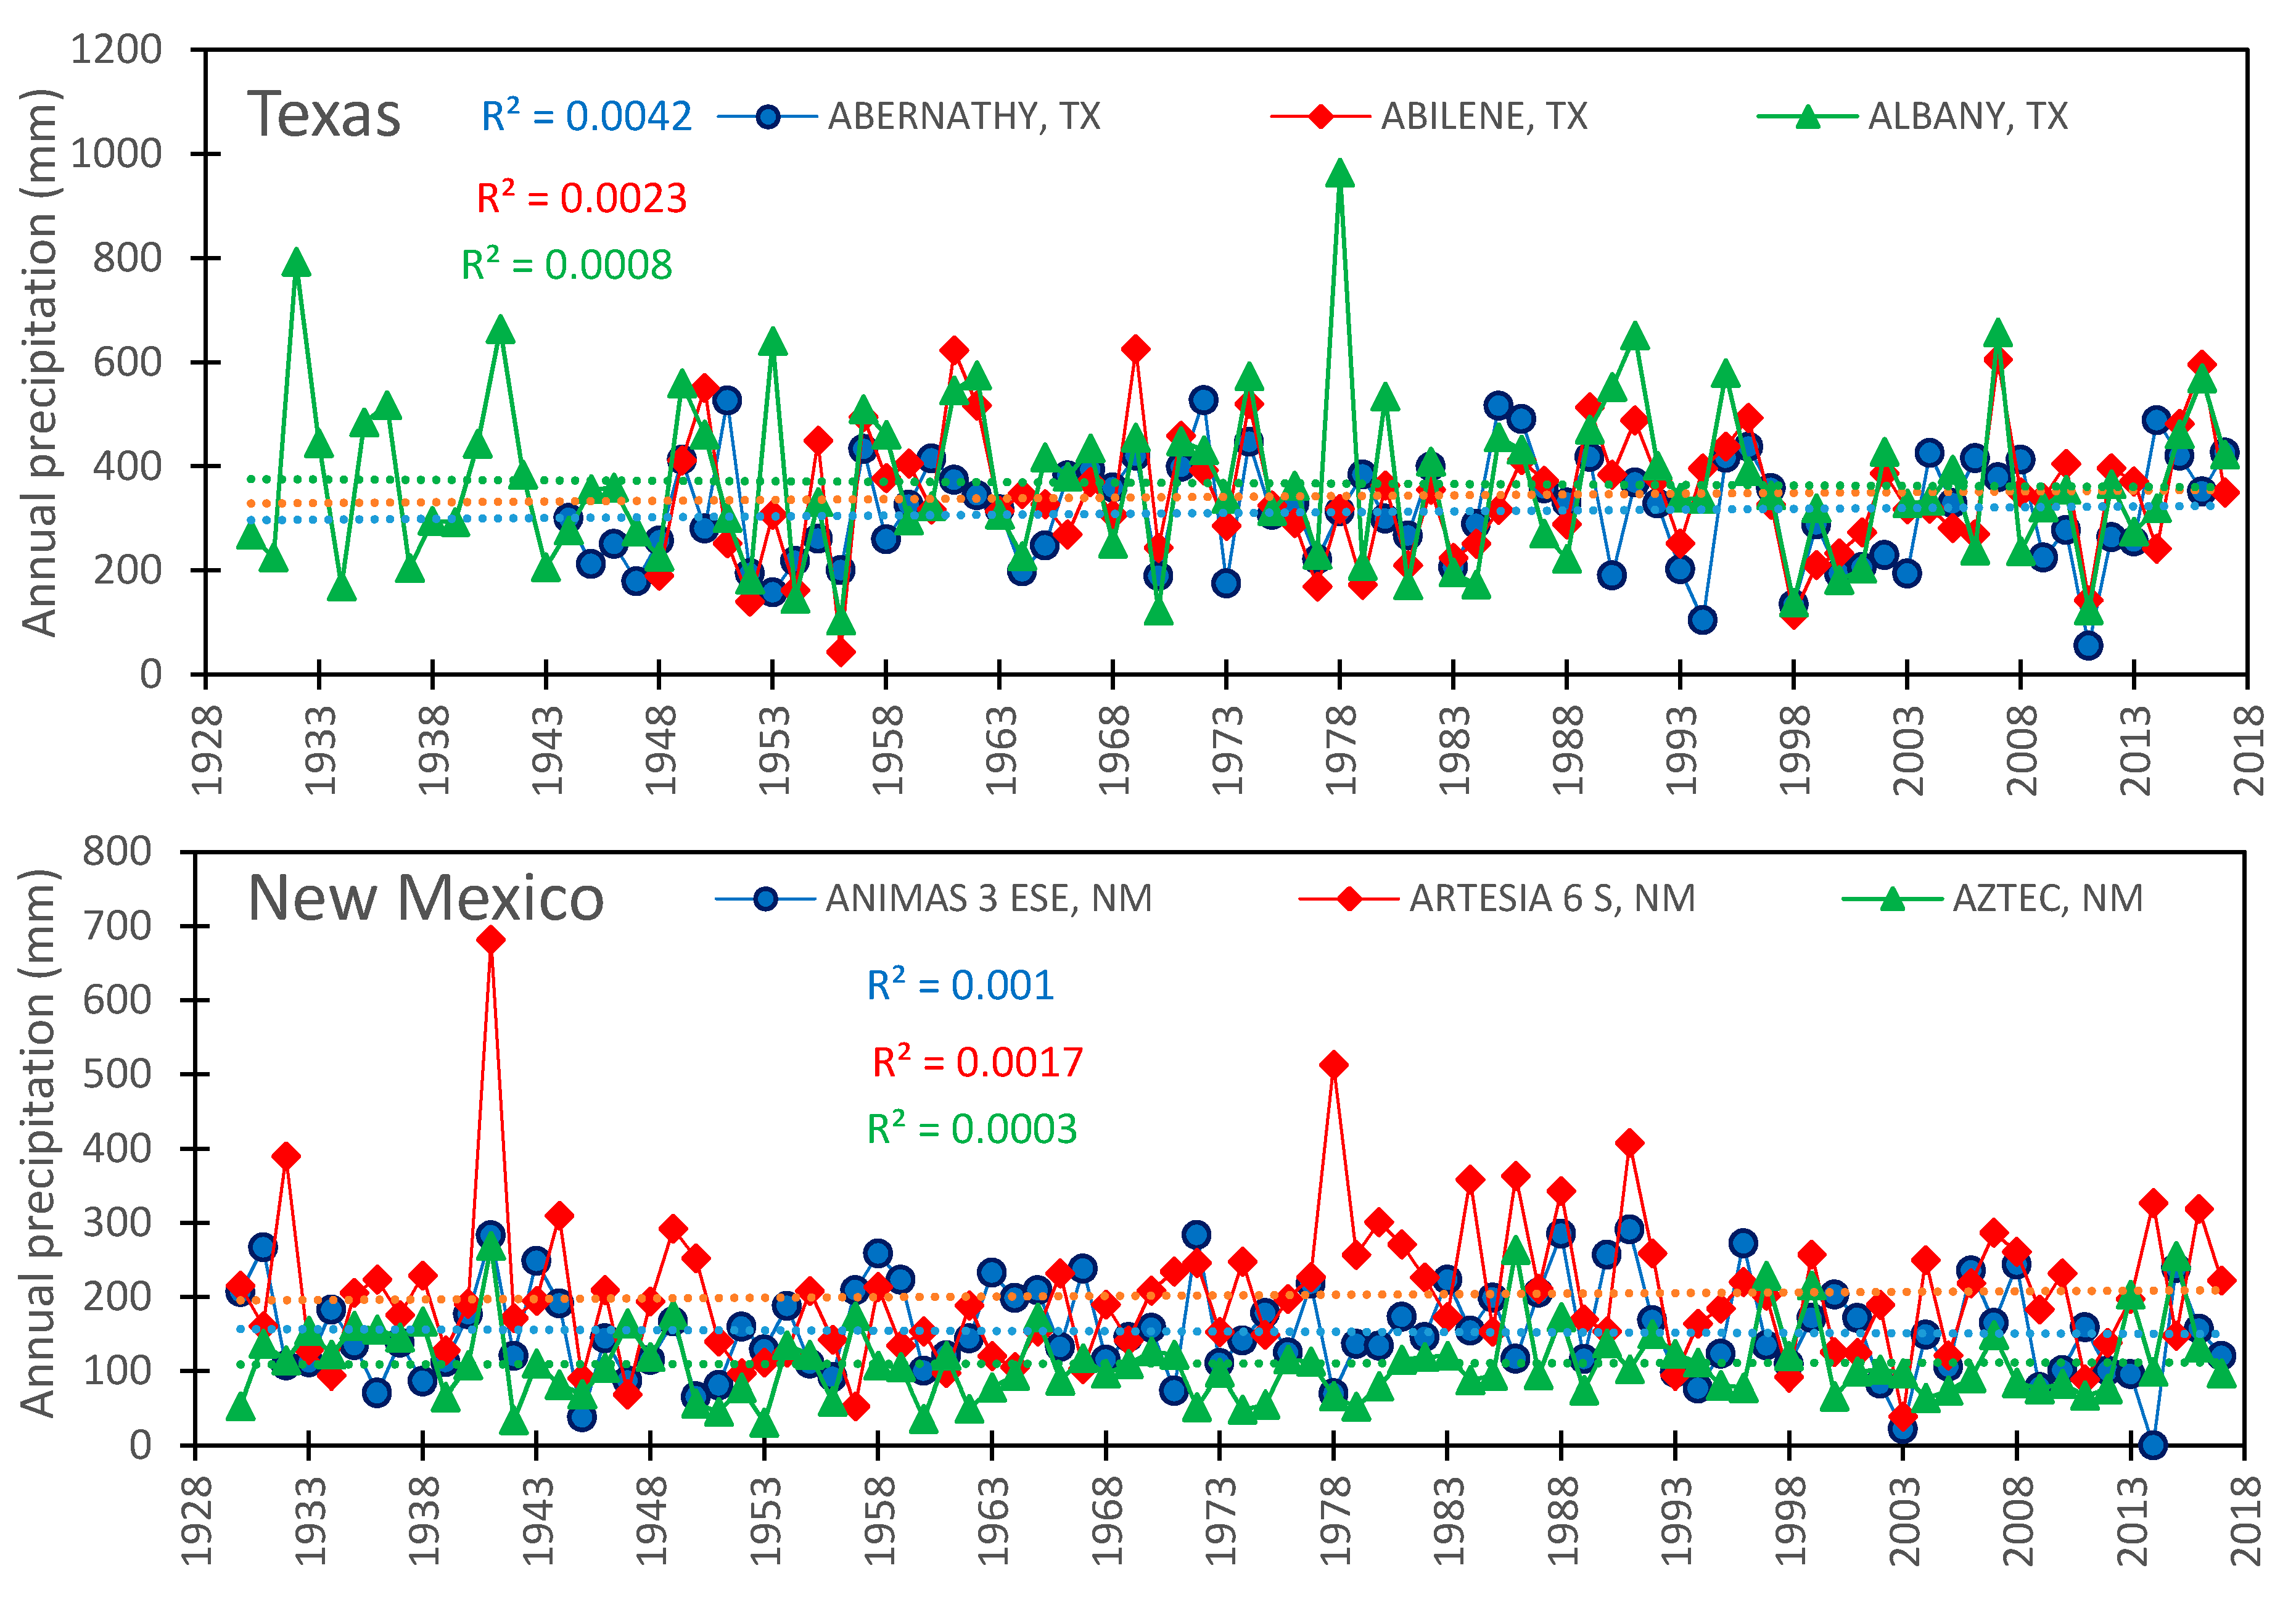
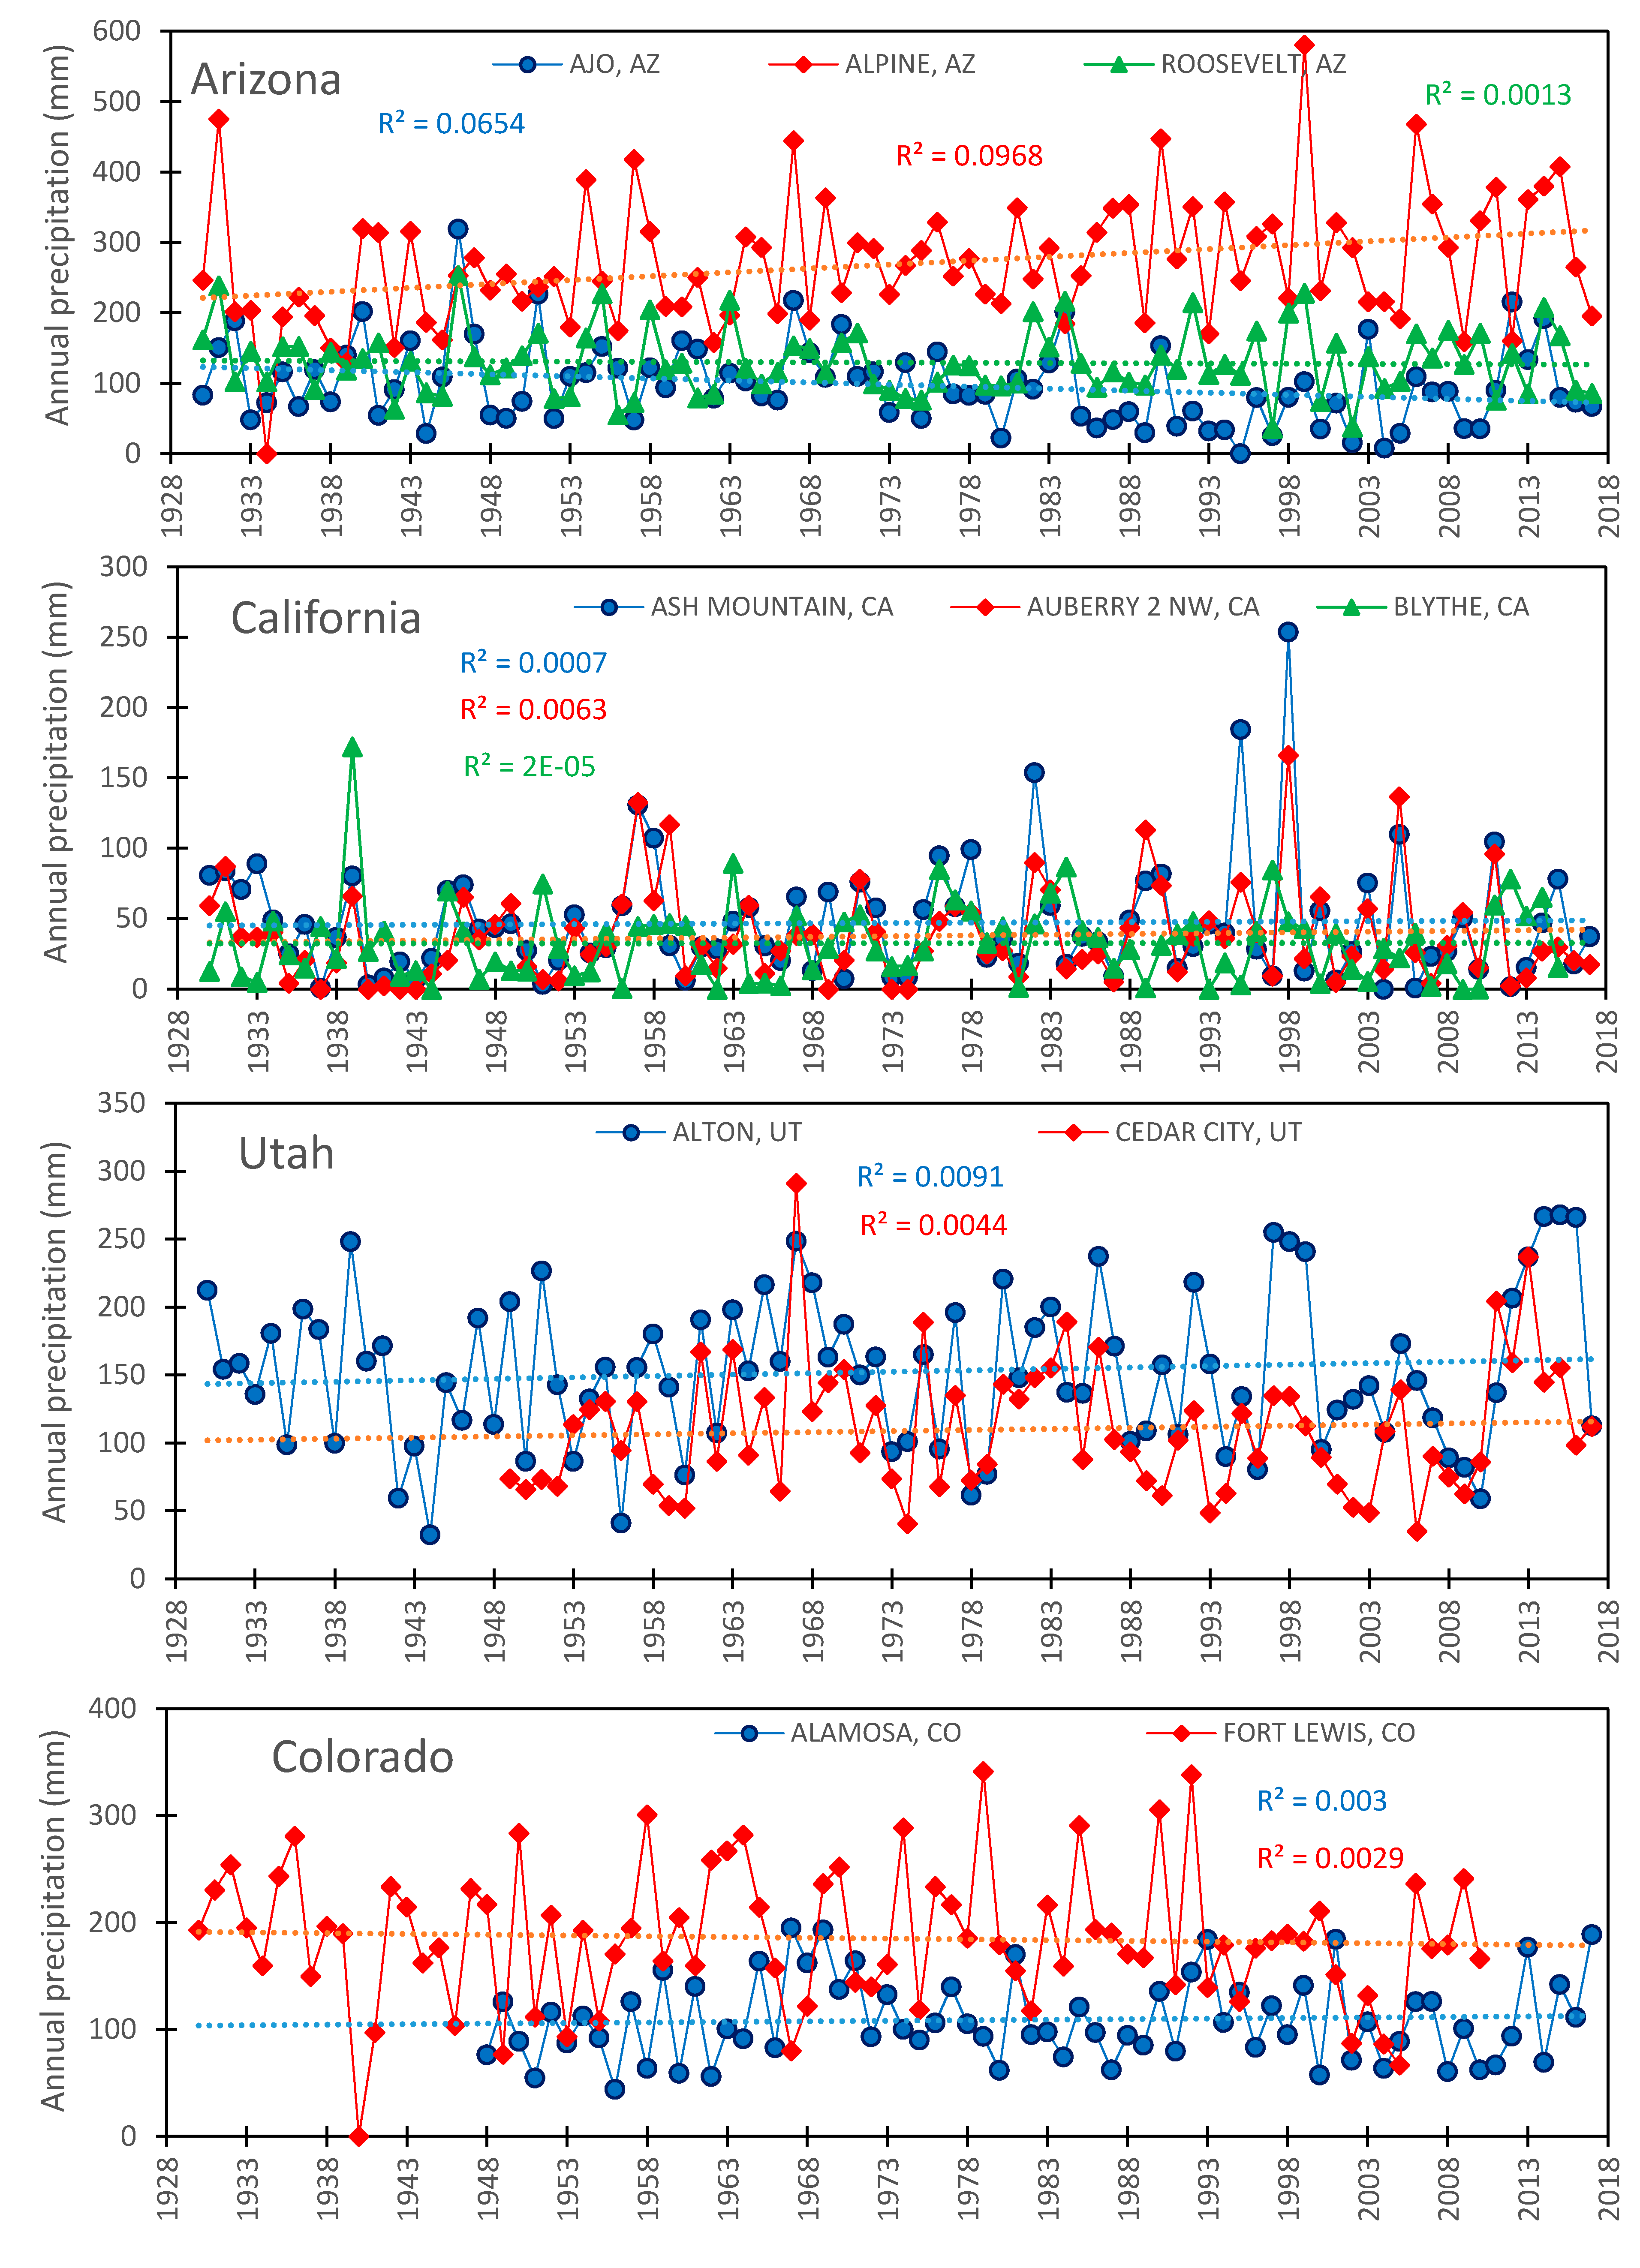
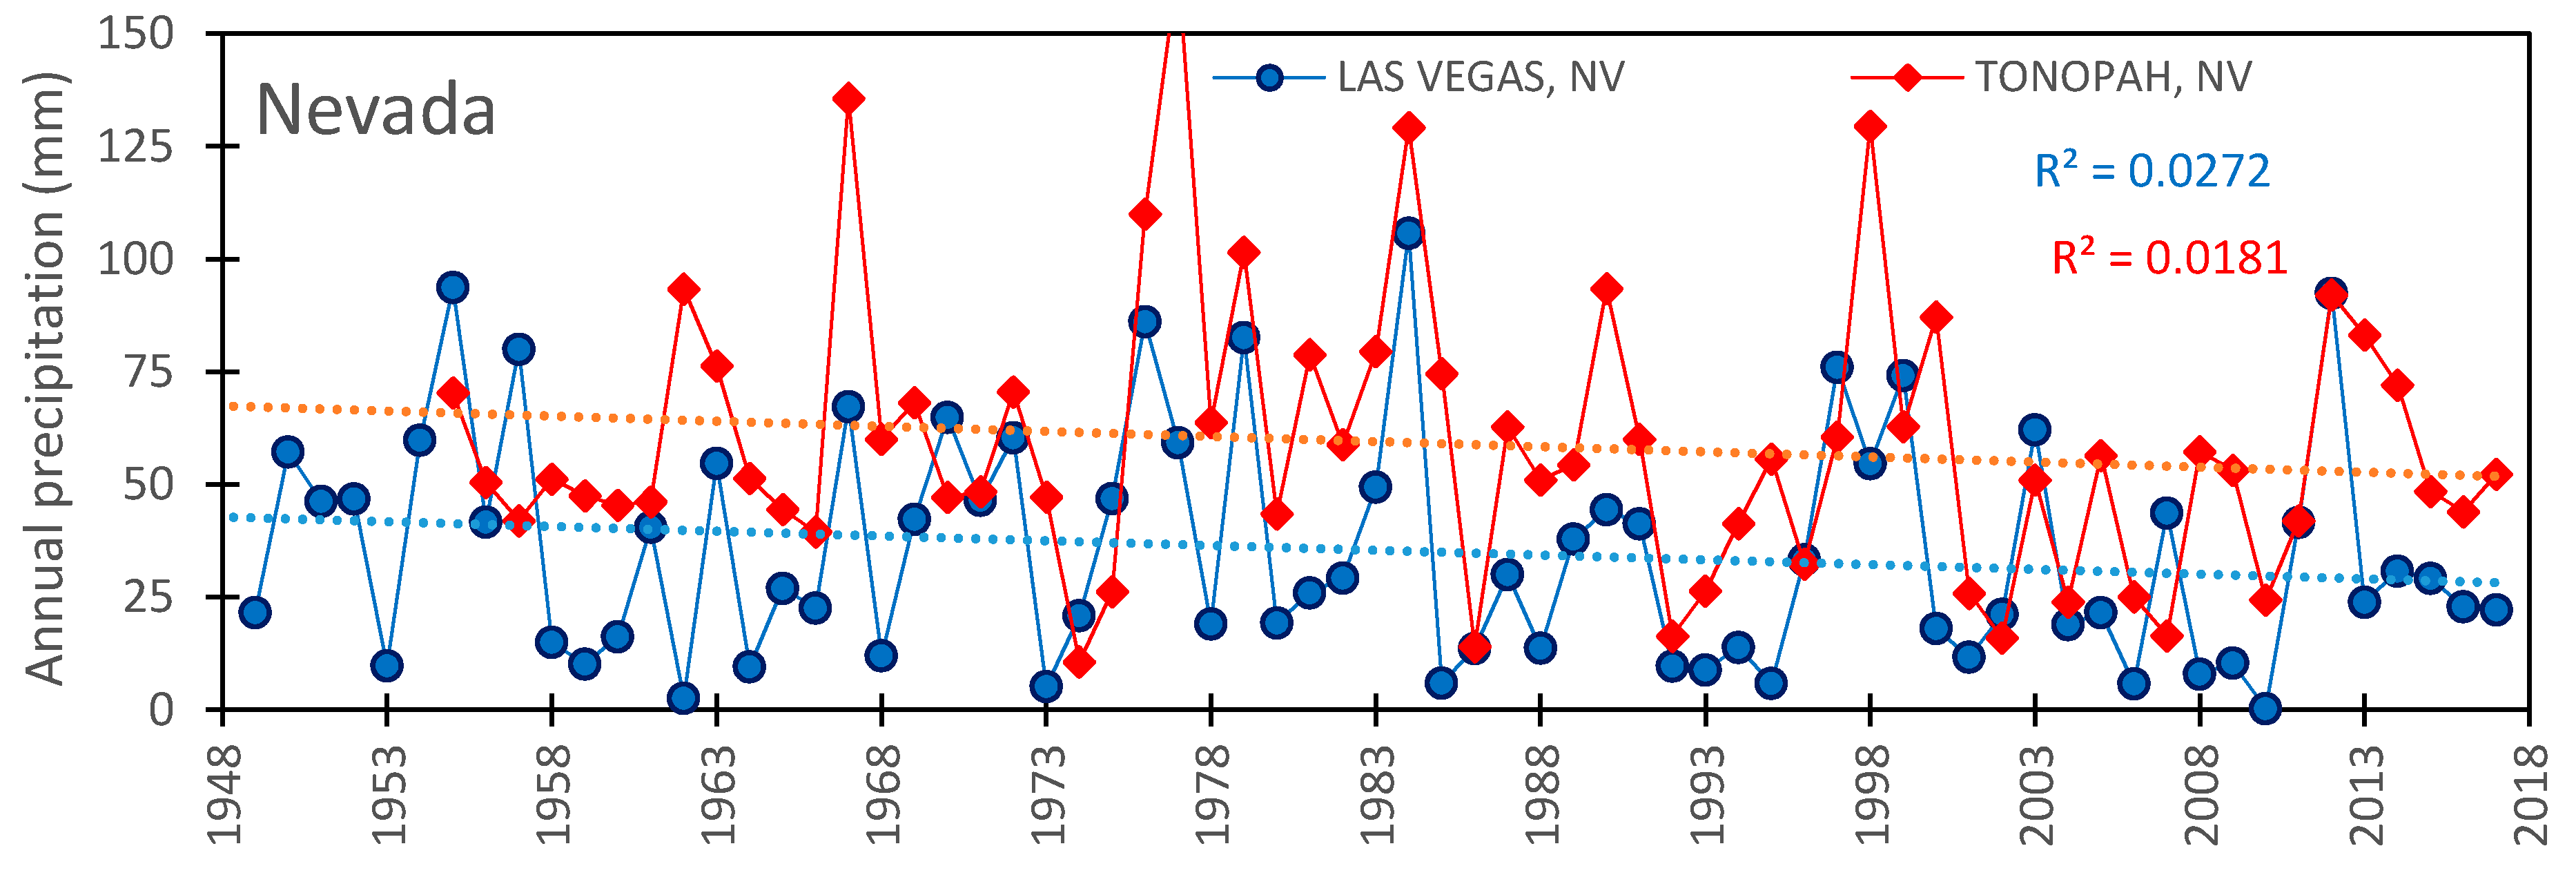
| Locations | Latitude (degrees) | Longitude (degrees) | Elevation (m) | Precipitation | Air Temperature | ||
|---|---|---|---|---|---|---|---|
| First Year | Last Year | First Year | Last Year | ||||
| Abernathy, TX | 33.83 | −101.84 | 1026.6 | 1944 | 2017 | - | - |
| Abilene R.A., TX | 32.41 | −99.68 | 545.6 | 1948 | 2017 | 1948 | 2017 |
| Albany, TX | 32.70 | −99.30 | 439.2 | 1930 | 2017 | 1902 | 2017 |
| Animas ESE, NM | 31.94 | −108.77 | 1371.9 | 1930 | 2017 | 1930 | 2017 |
| Artesia S, NM | 32.75 | −104.38 | 1026 | 1930 | 2015 | 1910 | 2017 |
| Aztec R.N.M., NM | 36.84 | −108.00 | 1720.3 | 1930 | 2010 | 1930 | 2010 |
| Ajo, AZ | 32.37 | −112.86 | 533.7 | 1930 | 2017 | 1915 | 2017 |
| Alpine, AZ | 33.85 | −109.15 | 2453.6 | 1930 | 2012 | - | - |
| Roosevelt W.N.W, AZ | 33.67 | −111.15 | 672.1 | 1930 | 2017 | 1906 | 2017 |
| Ash Mountain, CA | 36.49 | −118.83 | 520.6 | 1930 | 2017 | 1927 | 2017 |
| Auberry NW, CA | 37.09 | −119.51 | 637 | 1930 | 2017 | 1913 | 2017 |
| Blythe, CA | 33.61 | −114.60 | 81.7 | 1930 | 2016 | 1913 | 2017 |
| Alton, UT | 37.44 | −112.48 | 2163.5 | 1930 | 2017 | 1917 | 2017 |
| Cedar City M.A., UT | 37.71 | −113.09 | 1702.6 | 1949 | 2017 | 1949 | 2017 |
| Alamosa S.L.V.R.A.,CO | 37.44 | −105.86 | 2296.1 | 1948 | 2017 | 1948 | 2017 |
| Fort Lewis, CO | 37.23 | −108.05 | 2320.7 | 1930 | 2010 | 1917 | 2017 |
| Las Vegas M.I.A., NV | 36.07 | −115.16 | 664.5 | 1949 | 2017 | 1949 | 2017 |
| Tonopah Airport, NV | 38.05 | −117.09 | 1644.4 | 1955 | 2017 | 1955 | 2017 |
| Locations | First Year | Last Year | Annual Precipitation | Crop Season Precipitation | ||||||
|---|---|---|---|---|---|---|---|---|---|---|
| Test Z | Signific. | β | B | Test Z | Signific. | β | B | |||
| Abernathy, TX | 1944 | 2017 | 1.27 | n.s. | 0.99 | 432.6 | 0.96 | n.s | 0.51 | 291.6 |
| Abilene R.A., TX | 1948 | 2017 | 0.79 | n.s. | 0.75 | 538.6 | 0.4 | n.s. | 0.31 | 315.4 |
| Albany, TX | 1930 | 2017 | −0.17 | n.s. | −0.14 | 677.3 | −0.03 | n.s. | 0 | 344.6 |
| Animas ESE, NM | 1930 | 2017 | 0.8 | n.s. | 0.27 | 237.5 | −0.05 | n.s. | 0 | 144.1 |
| Artesia S, NM | 1930 | 2015 | 1.91 | + | 0.87 | 252.5 | 1.23 | n.s. | 0.45 | 173.3 |
| Aztec R.N.M., NM | 1930 | 2010 | 1.23 | n.s. | 0.35 | 228.1 | −0.43 | n.s. | −0.1 | 107.5 |
| Ajo, AZ | 1930 | 2017 | −3.65 | *** | −1.27 | 236.2 | −2.56 | * | −0.6 | 118.8 |
| Alpine, AZ | 1930 | 2012 | 2.29 | * | 1.38 | 399.9 | 3 | ** | 1.11 | 214.4 |
| Roosevelt W.N.W, AZ | 1930 | 2017 | −0.64 | n.s. | −0.37 | 379.7 | −0.26 | n.s. | −0.1 | 125.7 |
| Ash Mountain, CA | 1930 | 2017 | −1.43 | n.s. | −1.35 | 670.1 | −0.55 | n.s. | −0.1 | 40.8 |
| Auberry NW, CA | 1930 | 2017 | 0.23 | n.s. | 0.19 | 562.9 | 0.5 | n.s. | 0.05 | 25.5 |
| Blythe, CA | 1930 | 2016 | −0.95 | n.s. | −0.22 | 98.3 | 0.49 | n.s. | 0.04 | 26.2 |
| Alton, UT | 1930 | 2017 | 1.39 | n.s. | 0.58 | 367.0 | 0.39 | n.s. | 0.11 | 147.5 |
| Cedar City M.A., UT | 1949 | 2017 | 1.7 | + | 0.82 | 228.7 | 0.61 | n.s. | 0.15 | 92.8 |
| Alamosa, CO | 1948 | 2017 | 1.34 | n.s. | 0.41 | 155.2 | 0.49 | n.s. | 0.1 | 94.5 |
| Fort Lewis, CO | 1930 | 2010 | −1.99 | * | −1.18 | 464.6 | −0.97 | n.s. | −0.3 | 196.8 |
| Las Vegas M.I.A., NV | 1949 | 2017 | −0.23 | n.s. | −0.08 | 105.9 | −1.29 | n.s. | −0.2 | 40.7 |
| Tonopah Airport, NV | 1955 | 2017 | −0.07 | n.s. | −0.02 | 117.8 | −0.84 | n.s. | −0.2 | 64.3 |
| Locations | First Year | Last Year | Annual Maximum Temperature | Crop Season Max. Temperature | ||||||
|---|---|---|---|---|---|---|---|---|---|---|
| Test Z | Signific. | β | B | Test Z | Signific. | β | B | |||
| Abilene, TX | 1948 | 2017 | 0.94 | n.s. | 0.006 | 24.1 | −0.6 | n.s. | −0.005 | 32.8 |
| Albany, TX | 1918 | 2017 | −2.85 | ** | −0.01 | 26.2 | −4.61 | *** | −0.024 | 35.0 |
| Animas, NM | 1930 | 2017 | −1.2 | n.s. | −0.005 | 25.6 | −1.94 | + | −0.01 | 33.6 |
| Artesia, NM | 1918 | 2017 | −0.91 | n.s. | −0.003 | 25.3 | −1.24 | n.s. | −0.006 | 33.3 |
| Aztec, NM | 1930 | 2017 | 4.39 | *** | 0.018 | 18.8 | 4.21 | *** | 0.019 | 28.5 |
| Alamosa, CO | 1948 | 2017 | 2.83 | ** | 0.019 | 13.8 | 3.61 | *** | 0.019 | 23.4 |
| Fort Lewis, CO | 1918 | 2017 | 1.5 | n.s. | 0.006 | 14.2 | 2.25 | * | 0.008 | 23.2 |
| Alton, UT | 1918 | 2017 | 7.39 | *** | 0.031 | 13.8 | 7.63 | *** | 0.035 | 22.3 |
| Cedar, UT | 1949 | 2017 | 1.93 | + | 0.01 | 17.6 | 2.1 | * | 0.012 | 27.2 |
| Ajo, AZ | 1918 | 2017 | 4.24 | *** | 0.013 | 28.4 | 2.4 | * | 0.007 | 36.6 |
| Roosevelt, AZ | 1918 | 2017 | 3.91 | *** | 0.013 | 26.6 | 3.77 | *** | 0.013 | 35.3 |
| Ash Mountain, CA | 1927 | 2017 | 3.72 | *** | 0.013 | 23.8 | 2.8 | ** | 0.012 | 32.0 |
| Auberry, CA | 1918 | 2017 | −0.52 | n.s. | −0.002 | 23.3 | −0.25 | n.s. | −0.001 | 31.5 |
| Blythe, CA | 1918 | 2017 | 1.25 | n.s. | 0.004 | 31.1 | 3.55 | *** | 0.011 | 39.3 |
| Las Vegas, NV | 1949 | 2017 | 3.35 | *** | 0.016 | 25.4 | 2.29 | * | 0.01 | 35.6 |
| Tonopah, NV | 1955 | 2017 | 3.51 | *** | 0.022 | 17.5 | 3.45 | *** | 0.023 | 27.0 |
| Locations | First Year | Last Year | Annual Minimum Temperature | Crop Season Min. Temperature | ||||||
|---|---|---|---|---|---|---|---|---|---|---|
| Test Z | Signific. | β | B | Test Z | Signific. | β | B | |||
| Abilene, TX | 1948 | 2017 | 2.14 | * | 0.008 | 11.0 | 0.24 | n.s. | 0.001 | 19.8 |
| Albany, TX | 1918 | 2017 | 0.81 | n.s. | 0.003 | 10.6 | −1.38 | n.s. | −0.004 | 19.2 |
| Animas, NM | 1930 | 2017 | 4.24 | *** | 0.028 | 4.5 | 3.99 | *** | 0.027 | 12.6 |
| Artesia, NM | 1918 | 2017 | −0.42 | n.s. | 0 | 6.7 | 1.99 | * | 0.007 | 14.9 |
| Aztec, NM | 1930 | 2017 | 4.8 | *** | 0.021 | 0.5 | 4.19 | *** | 0.016 | 9.2 |
| Alamosa, CO | 1948 | 2017 | 1.2 | n.s. | 0.006 | −4.9 | −0.1 | n.s. | 0 | 4.9 |
| Fort Lewis, CO | 1918 | 2017 | 2.8 | ** | 0.013 | −2.8 | 3.65 | *** | 0.014 | 5.0 |
| Alton, UT | 1918 | 2017 | 2.06 | * | 0.006 | −0.8 | −0.56 | n.s. | −0.002 | 6.7 |
| Cedar, UT | 1949 | 2017 | 0.24 | n.s. | 0.001 | 2.0 | −0.64 | n.s. | −0.003 | 10.5 |
| Ajo, AZ | 1918 | 2017 | 7.25 | *** | 0.027 | 13.8 | 6.66 | *** | 0.022 | 21.4 |
| Roosevelt, AZ | 1918 | 2017 | 4.99 | *** | 0.017 | 11.9 | 3.26 | ** | 0.012 | 20.2 |
| Ash Mountain, CA | 1927 | 2017 | 0.64 | n.s. | 0.002 | 10.1 | 0.34 | n.s. | 0.002 | 16.4 |
| Auberry, CA | 1918 | 2017 | 7.34 | *** | 0.046 | 5.7 | 6.67 | *** | 0.052 | 11.5 |
| Blythe, CA | 1918 | 2017 | 7.06 | *** | 0.028 | 11.3 | 6.83 | *** | 0.025 | 19.3 |
| Las Vegas, NV | 1949 | 2017 | 9.66 | *** | 0.08 | 6.6 | 8.96 | *** | 0.078 | 15.5 |
| Tonopah, NV | 1955 | 2017 | 6.14 | *** | 0.03 | 0.2 | 5.02 | *** | 0.035 | 7.7 |
| Locations | First Year | Last Year | Annual Temp. Amplitude | Crop Season Temp. Amplitude | ||||||
|---|---|---|---|---|---|---|---|---|---|---|
| Test Z | Signific. | β | B | Test Z | Signific. | β | B | |||
| Abilene, TX | 1948 | 2017 | −1.11 | n.s. | −0.005 | 13.4 | −0.91 | n.s. | −0.004 | 12.9 |
| Albany, TX | 1918 | 2017 | −3.56 | *** | −0.014 | 16.0 | −3.8 | *** | −0.018 | 15.8 |
| Animas, NM | 1930 | 2017 | 0.05 | n.s. | 0 | 15.4 | −4.72 | *** | −0.036 | 20.9 |
| Artesia, NM | 1918 | 2017 | 0.66 | n.s. | 0.002 | 18.5 | −2.16 | * | −0.008 | 18.0 |
| Aztec, NM | 1930 | 2017 | −0.37 | n.s. | −0.002 | 18.4 | 0.76 | n.s. | 0.004 | 19.3 |
| Alamosa, CO | 1948 | 2017 | 1.67 | + | 0.008 | 19.2 | 3.09 | ** | 0.02 | 18.3 |
| Fort Lewis, CO | 1918 | 2017 | −1.98 | * | −0.008 | 17.0 | −0.73 | n.s. | −0.003 | 18.1 |
| Alton, UT | 1918 | 2017 | 5.46 | *** | 0.023 | 14.5 | 6.93 | *** | 0.037 | 15.5 |
| Cedar, UT | 1949 | 2017 | 1.95 | + | 0.012 | 15.3 | 2.95 | ** | 0.015 | 16.9 |
| Ajo, AZ | 1918 | 2017 | −3.62 | *** | −0.012 | 14.6 | −5.72 | *** | −0.014 | 15.2 |
| Roosevelt, AZ | 1918 | 2017 | −0.82 | n.s. | −0.003 | 14.4 | 0.14 | n.s. | 0.001 | 15.2 |
| Ash Mountain, CA | 1927 | 2017 | 2.52 | * | 0.011 | 13.6 | 2.54 | * | 0.013 | 15.4 |
| Auberry, CA | 1918 | 2017 | −5.97 | *** | −0.051 | 18.0 | −5.53 | *** | −0.055 | 20.5 |
| Blythe, CA | 1918 | 2017 | −5.13 | *** | −0.021 | 19.6 | −4 | *** | −0.016 | 19.8 |
| Las Vegas, NV | 1949 | 2017 | −9.26 | *** | −0.065 | 19.1 | −9.57 | *** | −0.07 | 20.3 |
| Tonopah, NV | 1955 | 2017 | −2.51 | * | −0.012 | 17.5 | −2.55 | * | −0.014 | 19.7 |
| Parameters | Latitude | Longitude | Elevation | ||||
|---|---|---|---|---|---|---|---|
| Regression Equation | R2 | Regression Equation | R2 | Regression Equation | R2 | ||
| Annual precipitation | Test Z | y = 0.0703x − 2.2524 | 0.0104 | y = 0.0837x + 9.4206 | 0.1122 | y = 0.0009x − 0.8825 | 0.2007 |
| Slope β | y = −0.0271x + 1.0619 | 0.0059 | y = 0.051x + 5.7224 | 0.1592 | y = 0.0004x − 0.3171 | 0.1167 | |
| B | y = −11.732x + 753.43 | 0.0196 | y = 7.0354x + 1115.6 | 0.0533 | y = −0.0496x + 401.9 | 0.0407 | |
| Growing season precipitation | Test Z | y = −0.056x + 2.0252 | 0.0114 | y = 0.0557x + 6.1866 | 0.0853 | y = 0.0005x − 0.5242 | 0.0984 |
| Slope β | y = −0.0316x + 1.182 | 0.0374 | y = 0.021x + 2.3791 | 0.1244 | y = 0.0001x − 0.1017 | 0.0902 | |
| B | y = −22.836x + 943.62 | 0.2697 | y = 14.247x + 1709.5 | 0.7949 | y = 0.0073x + 133.63 | 0.0032 | |
| Average annual Tmax | Test Z | y = 0.5461x − 17.151 | 0.2372 | y = −0.1807x − 17.888 | 0.182 | y = 0.0012x + 0.73 | 0.1136 |
| Slope β | y = 0.0029x − 0.0916 | 0.3699 | y = −0.0007x − 0.0631 | 0.1357 | y = 7e−06x + 0.0015 | 0.2201 | |
| B | y = −1.8529x + 87.49 | 0.6151 | y = −0.016x + 20.429 | 0.0003 | y = −0.0069x + 30.122 | 0.8655 | |
| Average growing season Tmax | Test Z | y = 0.7442x − 24.387 | 0.3472 | y = −0.2341x − 24.045 | 0.2407 | y = 0.0016x − 0.0458 | 0.1713 |
| Slope β | y = 0.0043x − 0.1431 | 0.4835 | y = −0.0012x − 0.1242 | 0.2632 | y = 1e−05x − 0.0036 | 0.2584 | |
| B | y = −1.6826x + 90.32 | 0.5657 | y = −0.016x + 29.258 | 0.0004 | y = −0.0065x + 38.518 | 0.8627 | |
| Average annual Tmin | Test Z | y = −0.0053x + 3.9961 | 2 × 10⁻⁵ | y = −0.2588x − 24.801 | 0.2699 | y = −0.0014x + 5.3891 | 0.1104 |
| Slope β | y = 0.0007x − 0.0064 | 0.0067 | y = −0.0016x − 0.1604 | 0.2271 | y = −8e−06x + 0.0284 | 0.0717 | |
| B | y = −1.8415x + 70.278 | 0.5446 | y = 0.0085x + 6.3253 | 8 × 10⁻⁵ | y = −0.0074x + 13.864 | 0.8881 | |
| Average growing season Tmin | Test Z | y = −0.0659x + 5.3938 | 0.0023 | y = −0.2707x − 26.856 | 0.2686 | y = −0.0014x + 4.639 | 0.0991 |
| Slope β | y = 0.001x − 0.0182 | 0.011 | y = −0.0019x − 0.1945 | 0.2755 | y = −8e−06x + 0.0266 | 0.0669 | |
| B | y = −1.9291x + 81.401 | 0.6165 | y = 0.1156x + 26.197 | 0.0155 | y = −0.0071x + 21.569 | 0.846 | |
| Average annual temperature amplitude | Test Z | y = 0.2935x − 11.719 | 0.035 | y = 0.1058x + 10.315 | 0.0319 | y = 0.0027x − 4.4474 | 0.2951 |
| Slope β | y = 0.0004x − 0.0209 | 0.0013 | y = 0.0011x + 0.108 | 0.0834 | y = 1e−05x − 0.025 | 0.2221 | |
| B | y = 0.243x + 7.9584 | 0.0706 | y = −0.0312x + 13.069 | 0.0082 | y = 0.0004x + 16.072 | 0.0186 | |
| Average growing season temperature amplitude | Test Z | y = 0.7772x − 28.843 | 0.188 | y = 0.0671x + 5.9679 | 0.0098 | y = 0.0032x − 5.1767 | 0.3316 |
| Slope β | y = 0.003x − 0.114 | 0.0643 | y = 0.0009x + 0.093 | 0.0436 | y = 2e−05x − 0.03 | 0.2401 | |
| B | y = 0.2779x + 7.8162 | 0.0727 | y = −0.1468x + 1.3808 | 0.142 | y = 0.0006x + 16.975 | 0.029 | |
Publisher’s Note: MDPI stays neutral with regard to jurisdictional claims in published maps and institutional affiliations. |
© 2020 by the authors. Licensee MDPI, Basel, Switzerland. This article is an open access article distributed under the terms and conditions of the Creative Commons Attribution (CC BY) license (http://creativecommons.org/licenses/by/4.0/).
Share and Cite
Djaman, K.; Koudahe, K.; Bodian, A.; Diop, L.; Ndiaye, P.M. Long-Term Trend Analysis in Annual and Seasonal Precipitation, Maximum and Minimum Temperatures in the Southwest United States. Climate 2020, 8, 142. https://doi.org/10.3390/cli8120142
Djaman K, Koudahe K, Bodian A, Diop L, Ndiaye PM. Long-Term Trend Analysis in Annual and Seasonal Precipitation, Maximum and Minimum Temperatures in the Southwest United States. Climate. 2020; 8(12):142. https://doi.org/10.3390/cli8120142
Chicago/Turabian StyleDjaman, Koffi, Komlan Koudahe, Ansoumana Bodian, Lamine Diop, and Papa Malick Ndiaye. 2020. "Long-Term Trend Analysis in Annual and Seasonal Precipitation, Maximum and Minimum Temperatures in the Southwest United States" Climate 8, no. 12: 142. https://doi.org/10.3390/cli8120142
APA StyleDjaman, K., Koudahe, K., Bodian, A., Diop, L., & Ndiaye, P. M. (2020). Long-Term Trend Analysis in Annual and Seasonal Precipitation, Maximum and Minimum Temperatures in the Southwest United States. Climate, 8(12), 142. https://doi.org/10.3390/cli8120142


