Article

Mesoscale Convective Systems: A Case Scenario of the ‘Heavy Rainfall’ Event of 15–20 January 2013 over Southern Africa

by
Modise Wiston
* and
Kgakgamatso Marvel Mphale
Department of Physics, University of Botswana, Private Bag UB00704 Gaborone, Botswana
*
Author to whom correspondence should be addressed.
Climate 2019, 7(6), 73; https://doi.org/10.3390/cli7060073
Submission received: 4 April 2019 / Revised: 18 May 2019 / Accepted: 21 May 2019 / Published: 28 May 2019

Abstract

:
Southern east Africa is prone to some extreme weather events and interannual variability of the hydrological cycle, including tropical cyclones and heavy rainfall events. Most of these events occur during austral summer and are linked to shifts in the intertropical convergence zone, changes in El Niño Southern Oscillation signatures, sea surface temperature and sea level pressure. A typical example include mesoscale convective systems (MCSs) that occur between October and March along the eastern part, adjacent to the warm waters of Mozambique Channel and Agulhas Current. In this study we discuss a heavy rainfall event over southern Africa, focusing particularly on the period 15–20 January 2013, the period during which MCSs were significant over the subcontinent. This event recorded one of the historic rainfalls due to extreme flooding and overflows, loss of lives and destruction of economic and social infrastructure. An active South Indian Convergence Zone was associated with the rainfall event sustained by a low-level trough linked to a Southern Hemisphere planetary wave pattern and an upper-level ridge over land. In addition, also noteworthy is a seemingly strong connection to the strength of the African Easterly Jet stream. Using rainfall data, satellite imagery and re-analysis (model processed data combined with observations) data, our analysis indicates that there was a substantial relation between rainfall totals recorded/observed and the presence of MCSs. The low-level trough and upper-level ridge contributed to moisture convergence, particularly from tropical South East Atlantic Ocean, which in turn contributed to the prolonged life span of the rainfall event. Positive temperature anomalies favored the substantial contribution of moisture fluxes from the Atlantic Ocean. This study provides a contextual assessment of rainfall processes and insight into the physical control mechanisms and feedback of large-scale convective interactions over tropical southern Africa.

1. Introduction

Southern Africa experiences considerable spatial and temporal variability in climate [1,2,3]. The subcontinent is susceptible to a wide range of weather phenomena including cut-off lows, thunderstorms, warm fronts (narrow transition boundaries between air masses), mesoscale convective systems (MCSs), subtropical lows, mid- to upper-tropospheric troughs, cloud bands and tropical cyclones [4,5]. An MCS is a cluster of storm cells that organize into a large individual cell. The subcontinent is generally characterized by two distinct seasons: a wet season running from October to March and a dry season running from April to September. Maximum precipitable water content occurs between December and March when the low-level winds are more easterly, corresponding to the southwards displacement of the intertropical convergence zone (ITCZ) (maximum displacement occurs in January). On the other hand, a dry season occurs when the ITCZ retreats northward (maximum displacement occurs in July). The most influential climate factors include ocean currents, ITCZ and the quasi-stationary high-pressure systems (St. Helena High in the South Atlantic and Mascarene High in the Indian Ocean) [6]. These are pressure systems with little or no horizontal air movement. ITCZ is the region within the Hadley cell zone where the air converges near the equator, then rises and diverges in the tropopause where heat is transported poleward. High precipitation totals are also associated with the wet El Niño Southern Oscillation (ENSO) phase —La Niña, when it is fully developed and the summer circulation systems such as the ITCZ migrating south of the equator [7], sometimes characterized by convective clouds [8]. These synoptic phenomena sometimes result in tropical cyclones or hurricanes, depending on their magnitude and organization. The South Atlantic and Indian Oceans also play important roles in the southern sub continental climate. For example, the eastern part is influenced by the southward-flowing Mozambique Current (part of the Indian Ocean positioned between Comoros, Madagascar and Mozambique) that brings warm water and humid air from the equator, creating a humid warm climate. The channel forms an active anticyclonic offshore system that sometimes flows directly southwards/northwards along the coast, drawing in warm water from equatorial Africa, significantly influencing the climate over southeastern Africa. Contrastingly, the western side is influenced by the cold Benguela Current (eastern boundary current of the South Atlantic subtropical gyre that flows northward off the southwest coast of Africa from Cape of Goodhope to southern Angola), which produces a drier climate. As the Benguela Current draws in cold moisture from the southern ocean and carries it northwards, rain clouds rarely develop, hence contributes to the dry/arid climate along the southwest.
Southern Africa’s geographic location, steep orography, contrasting oceanic surroundings and atmospheric dynamics are conducive to such extreme weather events and interannual variability of the hydrological cycle [9]. Consequently, climate anomalies are often devastating to humankind, animals and property. For example, the February 2000 floods resulted in 600 lives lost and 200 bridges damaged in northern South Africa, Mozambique and Zimbabwe, and 1000 km of road destroyed in South Africa [10]. In Natal (South Africa), a record-breaking rainfall of 600–900 mm in September 1987 resulted in flooding—causing 300 deaths and about 1 billion US dollars in damage [11]. Just recently, another devastating cyclone Idai developed over the Indian Ocean in March 2019, resulting in a very catastrophic effect in Mozambique, Malawi and Zimbabwe. A lot of infrastructure has been destroyed, with an estimated $1 billion in damage and more than 100,000 homes destroyed according to the United Nations (https://www.worldvision.org/disaster-relief-news-stories/2019-cyclone-idai-facts). With such high vulnerability to weather and climate hazards associated with the growing population and increased pressure on natural water systems and artificial water storage capabilities, this renders southern Africa one of the target regions with potential changes in the hydrological cycle due to global warming leading to extreme negative impacts on the society [12].
Rainfall regime is very dependent on seasonal changes in the air circulations controlling the local atmosphere and sea surface temperature (SST) changes from the adjacent oceans [13,14]. This involves the large-scale air movement, together with oceanic circulation through which thermal energy is distributed across the globe. Usually, the eastern coast experiences extreme rainfall associated with tropical cyclone episodes [15].
The purpose of this paper is to understand the ‘heavy rainfall event’ that occurred over southern Africa in January 2013 and relate its evolution to the climatology of MCSs. The overall objective is to understand the extent to which MCSs could influence or initiate different rainfall patterns and the resulting impacts on the weather. To address this objective, we look at some parameters useful in assessing heavy rain potential such as sea level pressure, geopotential height, cloud cover and precipitable water over the domain. Statistical rainfall, reanalysis data and satellite imagery are analyzed to study this rainfall event.

2. Mesoscale Convective Systems

2.1. Structure and Climatology

Mesoscale convective systems are weather phenomena that exhibit deep moist convective overturning contiguous with- or embedded within a mesoscale circulation that is at least partially driven by the convective process [14]. These are large convective storms forming when clouds occur in response to convective instability, then amalgamate and organize into a single cloud system with a very large upper cirriform cloud structure and rainfall covering large areas [16,17]. Convective systems are an important link between atmospheric convection and large-scale atmospheric circulation. They are associated in various ways with large-scale wave motions [18], some of which occur over the Pacific Ocean pool as a fundamental ingredient of inter-seasonal and interannual climate variation [19]. They have regions of both convective and stratiform precipitation and develop mesoscale circulations as they mature [16]. A full description of these systems is given by Houze [16], Cotton et al. [20], Yang et al. [21], Feng et al. [22] and Huang et al. [23]. Many MCSs develop a mesoscale convective vortex (MCV) in the stratiform region on their poleward end. The vortex prolongs and maintains the MCS [24] and may contribute to a tropical cyclone development. The horizontal scale of an MCS may be controlled either by the balance between the formation rate of convective precipitation and dissipation of stratiform precipitation or by the Rossby radius of the MCV.
MCSs are of special interest in the science of climatology as they can be found all over the world and give rise to different weather patterns [23]. Notwithstanding, a lot research that has been conducted over Africa focused on the Sahel [25,26,27], a region which can influence hurricane development in the tropical Atlantic [28]. Although a significant amount of research has been devoted to MCSs and weather phenomena associated with them, there still remain several unanswered questions about these systems regarding their evolution and the environments in which they develop. They are more intense over land than over oceans, and the most intense MCSs occur in tropical central Africa [23]. Not only is there a lack of understanding of MCSs [29], but there is also limited skill in their prediction [30]. Previous studies focusing on the global distribution of severe weather environment [31] or the global distribution of intense thunderstorms have identified eastern and southeastern Africa as a convective hotspot for such systems [32].

2.2. Convective Systems and Southern African Rainfall

Over southern Africa, MCSs commonly occur during the austral summer months, clustered along the eastern regions adjacent to the warm waters of the Mozambique Channel and Agulhas Current [33] and sometimes move inland [14]. They are usually accompanied with changes in the rainfall pattern and climate variability. Although these systems predominantly occur during the months of November to February, maximum activity occurs between November and December. Due to the similarities in the properties of mesoscale convective complexes (MCC) environments worldwide [34], this also suggests that southern Africa contains a favorable setting for these systems to develop [5]. For example, a common synoptic-scale feature during austral summer is the cloud bands that evolve from tropical-extratropical interactions [5,34]. According to the authors, few of them develop over Botswana and Namibia during the warm season. The circulation associated with the Angolan low is the key factor in moisture flow into the cloud bands which may play a role in enhancing local convection. An MCC is a large long-lived convective cloud system that exhibits a quasi-circular cloud shield [33]. Typically, it can extend more than 350,000 km2 area and can last for over 10 hours [35]. It is a well-organized subset of an MCS and well known for producing severe weather and copious rainfall. Severe weather impacts are likely to be enhanced in environmentally and socioeconomically vulnerable regions although they can provide vital rainfall to semiarid regions like southern Africa [5,36].
However, there have been challenges in determining the annual average of MCCs in some places due to the considerable variability from month to month and from year to year [37]. For example, Blamey and Reason [36] suggest that there is variability in MCC populations in other regions as they tend to follow the nocturnal life cycle. Due to the limited research over southern Africa, there are only a few climatological studies of MCSs [5]. Blamey and Reason [5] provide a general description of MCSs in the region, whereas Blamey and Reason [36] provided analyses of individual case studies of large MCSs over southern Africa. The latter also analyzed one large MCS that produced almost two-thirds of monthly rainfall total at some stations in eastern South Africa for the period between 1998 and 2006. According to Singleton and Reason [38,39], severe weather-producing systems include cut-off lows and thunderstorms ranging from single cell storms through to MCSs, and tropical cyclones in the South West Indian Ocean (SWIO), particularly over Madagascar [10].
Another study by Laing and Fritsch [34], also suggest that southern Africa has favorable conditions for development of MCSs over land. Similarly, Washington and Todd [40] observed the cloud bands that form over tropical temperate troughs (TTTs), which seem to typically extend diagonally from the northwest to the southeast throughout the continent as well as the adjacent SWIO. These are recognized as the main rain-producing synoptic mechanisms during summer over southern Africa ([41], and references therein). However, not only are TTTs responsible for a large portion of the southern African summer rainfall [42,43], they are also known to produce heavy rainfall events [44]. Other systems that can also lead to substantial summer rainfall over southern Africa include tropical depressions and cyclones [8,45]. Cook [46] and Manhique et al. [41] describe the area over southern east Africa where tropical-extratropical interaction takes place as the South Indian Convergence Zone (SICZ). A zone which displays similarities to two other Southern Hemisphere convergence zones: the South Pacific Convergence Zone and the South Atlantic Convergence Zone (SPCZ and SACZ) respectively, but it exhibits higher synoptic variability and only occurs during austral summer. According to Blamey and Reason [5], the SICZ reflects the aggregated expression of the synoptic TTT events which tend to be located here rather than farther west and the global distribution of MCCs often coincides with these three convergence zones, suggesting that one may find MCCs embedded in the cloud bands or that process favoring TTT development may also facilitate MCC production. The heaviest convective rainfall usually occurs in regions of high moisture, maximum ambient/elevated instability, mesoscale uplift and slow system movement [47]. However, it is important to note patterns of recognition for these systems. For example, a good assessment and quantitative forecasting of precipitation starting with understanding historical parameters producing heavy rainfall in particular locations. Additionally, forecasters must understand atmospheric processes that may lead to heavy rainfall; important processes can occur on synoptic or mesoscale scale that can alter precipitation distribution and amounts from those expected.

3. The Heavy Rainfall of January 2013

Here we describe the rainfall event and its evolution over southern Africa during January 2013, captured and reported by the University at Albany (State University of New York)’s radar system (http://www.atmos.albany.edu/daes/atmclasses/atm401/disco_1-Feb-13.pdf) and also reported in literature [6,41,48,49]. However, we shall restrict ourselves to the period 15–20 January, the period during which MCSs appeared more significant over the subcontinent. This period benefits the amount of observational data and literature report. January 2013 had the subcontinent affected by widespread heavy rains that caused flooding in many places, accompanied with devastating impacts [41]. Most parts of southern Africa were impacted by very heavy rains from mid January to late February from what was called a "Botswana landphoon" that had the appearance of an almost synoptic-scale MCV in infrared (IR) satellite imagery (Figure 1). The figure depicts an organized convection over southern Africa on 10 January, most notably over DR Congo, Angola, Zambia, Zimbabwe, Malawi and Mozambique, with a trailing band extending offshore into the SWIO below Madagascar. The University at Albany reported that this convection moved over Botswana-Namibia in the next day, but weakened within the next few days. This reorganized again between 15 and 16 January as it extended into South Africa on 17 January, continuing into an almost synoptic-scale MCV over most countries by 19 January. The continental tropical low moved across Botswana-Namibia on 18 January towards Mozambique by 21 January. The system appeared as a cyclonic curvature in the lower troposphere and the anticyclonic circulation in cold cirrus clouds stretching into the Indian Ocean.
Precipitation variability over the subcontinent in the later summer of 2013 is also highlighted in various studies in literature. For example, the World Meteorological Organization (WMO) report of 2015 indicate heavy rainfall and floods recorded in January, particularly Mozambique which ranked amongst the 10 most severe flooding events globally (Table 1). In some places, the heavy rains led to extreme river flows, leading to severe floods in towns, farm/agricultural loss, loss of life and destruction of economic and social infrastructure [41]. According to the authors, ‘during January 2013, very heavy rainfall over central and southern Mozambique led to severe flooding with more than 100 deaths, and the displacement of about 200,000 people.’ Heavy and above average precipitation totals were also reported in other parts of the world. For example, the Global Climate Report of 2013 (https://www.ncdc.noaa.gov/sotc/global/201313) indicate that a tropical low caused major flooding along much of the eastern coast of Queensland and northern new South Wales in Australia; the Burnett river catchment had the most severe flooding and received nearly 70% of rainfall above the previous record, and many residential areas inundated. Floods hit various regions across Africa, with Mozambique experiencing severe flooding during January 12–31. Table 1 also highlights how the region was impacted by these heavy showers.

4. Data and Methods

Mesoscale convective systems are usually studied by using remote sensing, navigation or scanning instruments such as Maximum Spatial Correlation or the Spinning Enhanced Visible Infrared Imager (SEVIRI), Jason, Metop etc. SEVIRI is a line-by-line scanning radiometer that provides data in visible near infrared channels, and is commonly used because of its unique capabilities in cloud imaging and tracking [50]. Several methods and techniques are implored in analyzing and studying MCSs; one typical example is the Maximum Spatial Correlation technique (MASCOTTE)—an automated method developed by Carvalho and Jones [51]. MASCOTTE has the ability to identify and track MCCs, MCSs and convective clusters. The process is based on IR images converted into brightness temperature (Tb) as the input, identifying systems based on a set of predefined criteria (for example, cloud-top temperature, size and duration of the convective systems).
To date, these systems are studied by either visually inspecting satellite data and then subjectively identifying systems [37,52] or applying an automated method that is objectively able to classify the systems within the images [53] and more efficient in tracking convective systems [5]. Additionally, the analyses tracked are consistently performed and time efficient [54]. However, the former is thought to be time consuming and may lead to inconsistencies in identification, whereas the latter is thought to be more efficient and allows for a larger and more complete climatology to be developed. Meanwhile, it has been documented that the evolution of MCSs identified in automated methods can be misleading, particularly in cases of splitting and merging systems ([5], and references therein). For example, when different cloud systems merge, the smaller cloud system lifecycle is considered to terminate at the merge while the other is considered active, a procedure that needs proper handling [54].
Satellites and radar observations have increased our understanding of mesoscale convection and precipitation [55]. Weather satellites are used to monitor environmental/atmospheric events and have broad areal coverage; wildfires, dust storms, cyclones, snow cover, ocean temperatures etc. They are particularly useful in regions with sparse observations or those with scarce data to access such as southern Africa. Here, we adopt a similar approach to Blamey and Reason [5], where the systems are first identified and then their evolution is visually inspected to try analyze their climatological cycles over a given time. As meteorological conditions belong to the most important elements of the geographical environment, they have direct influence on numerous activities [56]; both atmospheric, environmental and real situations. For example, meteorologists can use visible satellites to view/forecast convective activity, precipitation, smoke plumes and volcanic eruptions.
We use statistical rainfall data obtained from the Department of Meteorological Services (DMS) in Botswana together with satellite imagery obtained from the Dundee dataset (http://www.sat.dundee.ac.uk/geobrowse/geobrowse.php), the National Aeronautic and Space Administration (NASA) platform—Tropical Rainfall Measuring Mission (TRMM) and the Reanalysis data from the Asian-Pacific Data-Research Center (APDRC) dataset (http://apdrc.soest.hawaii.edu/las/v6/constrain?var=16121) as well as the National Center for Environmental Prediction (NCEP) archived at the National Oceanic and Atmospheric Administration (NOAA) database (https://www.esrl.noaa.gov/psd/data/composites/hour/). Reanalysis data is produced from different model studies around the world, ingesting all available observations containing atmospheric estimates of parameters (e.g., air, pressure, wind, rainfall, soil moisture content and sea surface pressure) for an ample time period. Estimates produced for all locations across the globe, spanning over a long time (e.g., decades or more). It provides a dynamically consistent estimate of the climate state for each time step. The NCEP reanalysis data is available from as far as 1948 to present.
Since it was not possible to obtain synoptic station rainfall data across the subcontinent, we only used data from Botswana, in conjunction with satellite imagery from the University at Albany website. A bar graph of rainfall amount was plotted for some five selected stations in Botswana in 2003, 2008 and 2013 respectively. Similarly, an NCL (National Center for Atmospheric Research Command Language) code was written to plot the annual rainfall amount/distribution from five other stations in 2012, 2013 and 2014 respectively. Satellites provide estimates of area coverage of weather events such as clouds or precipitation (e.g., cloud-top temperature and column-integrated optical thickness). Clouds also provide some information concerning the likelihood of moisture source for the heavy rains observed. To assess atmospheric circulation (large-scale air movement), outputs are shown for geopotential height, wind, air temperature, sea level pressure (SLP), omega, outgoing longwave radiation (OLR), clouds and columnar precipitable water. This method is similar to that used in other studies [36,41,57] to study these systems and associated circulations.

5. Results and Discussion

5.1. Rainfall Distribution

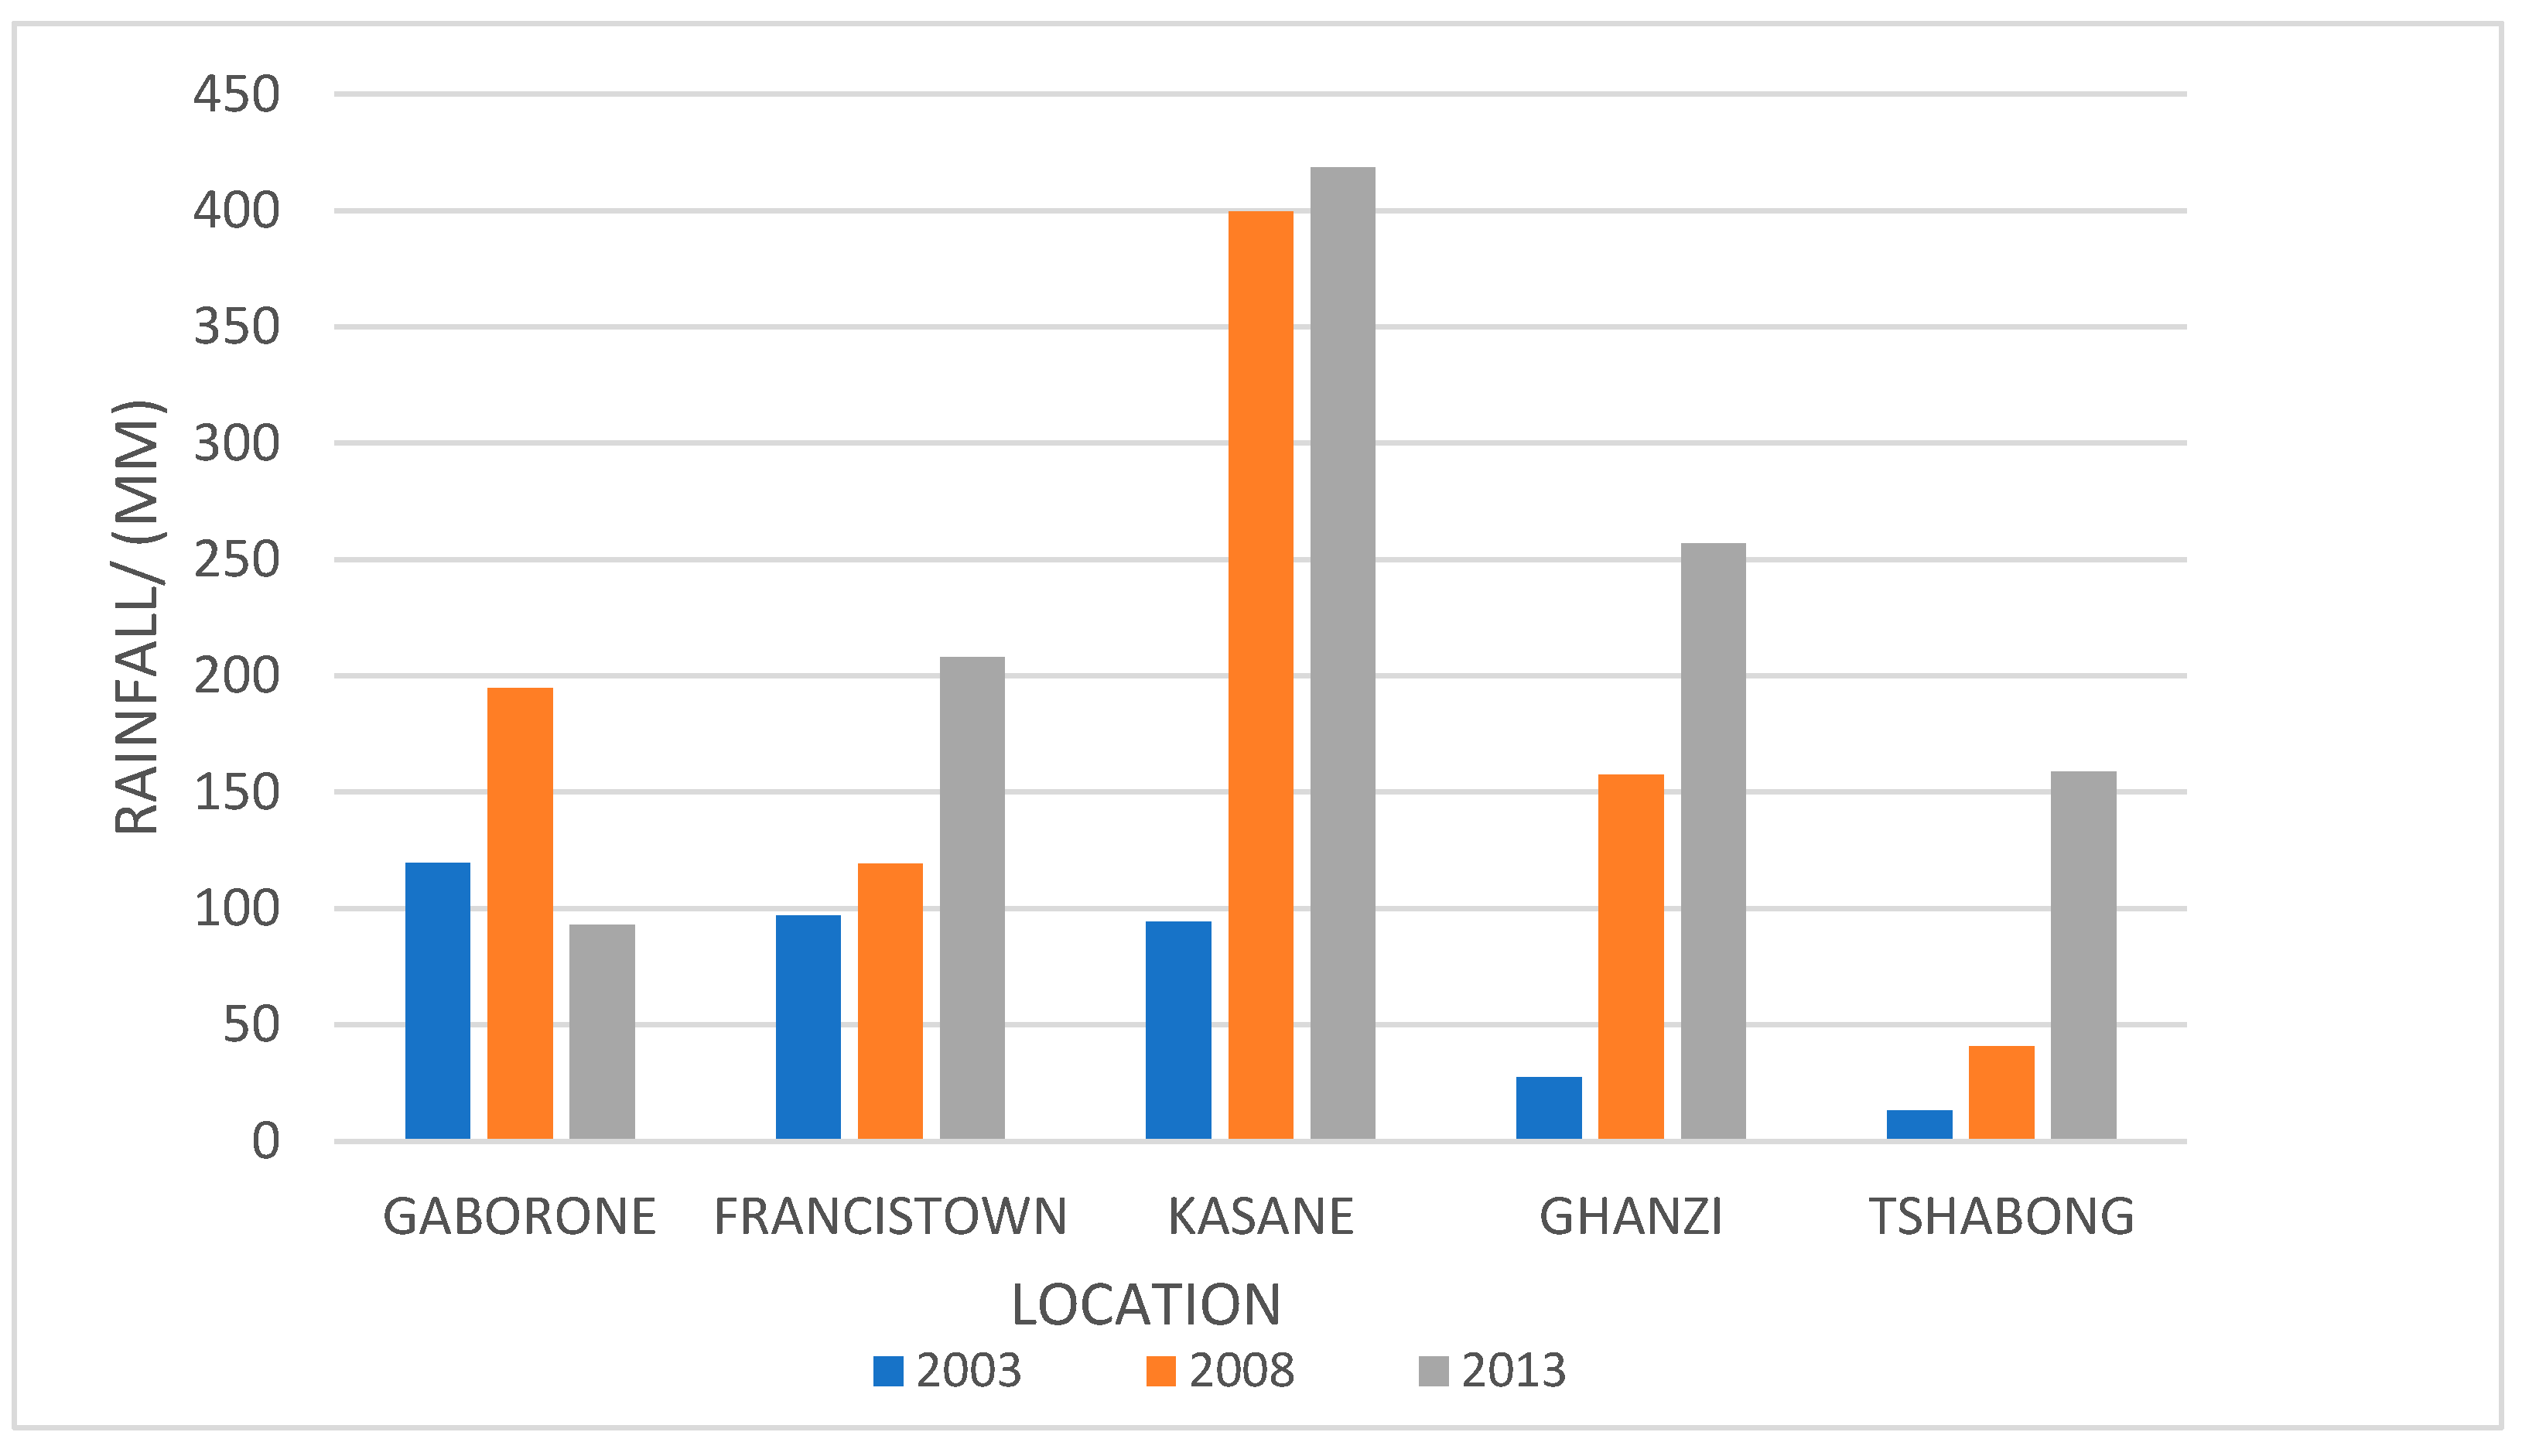
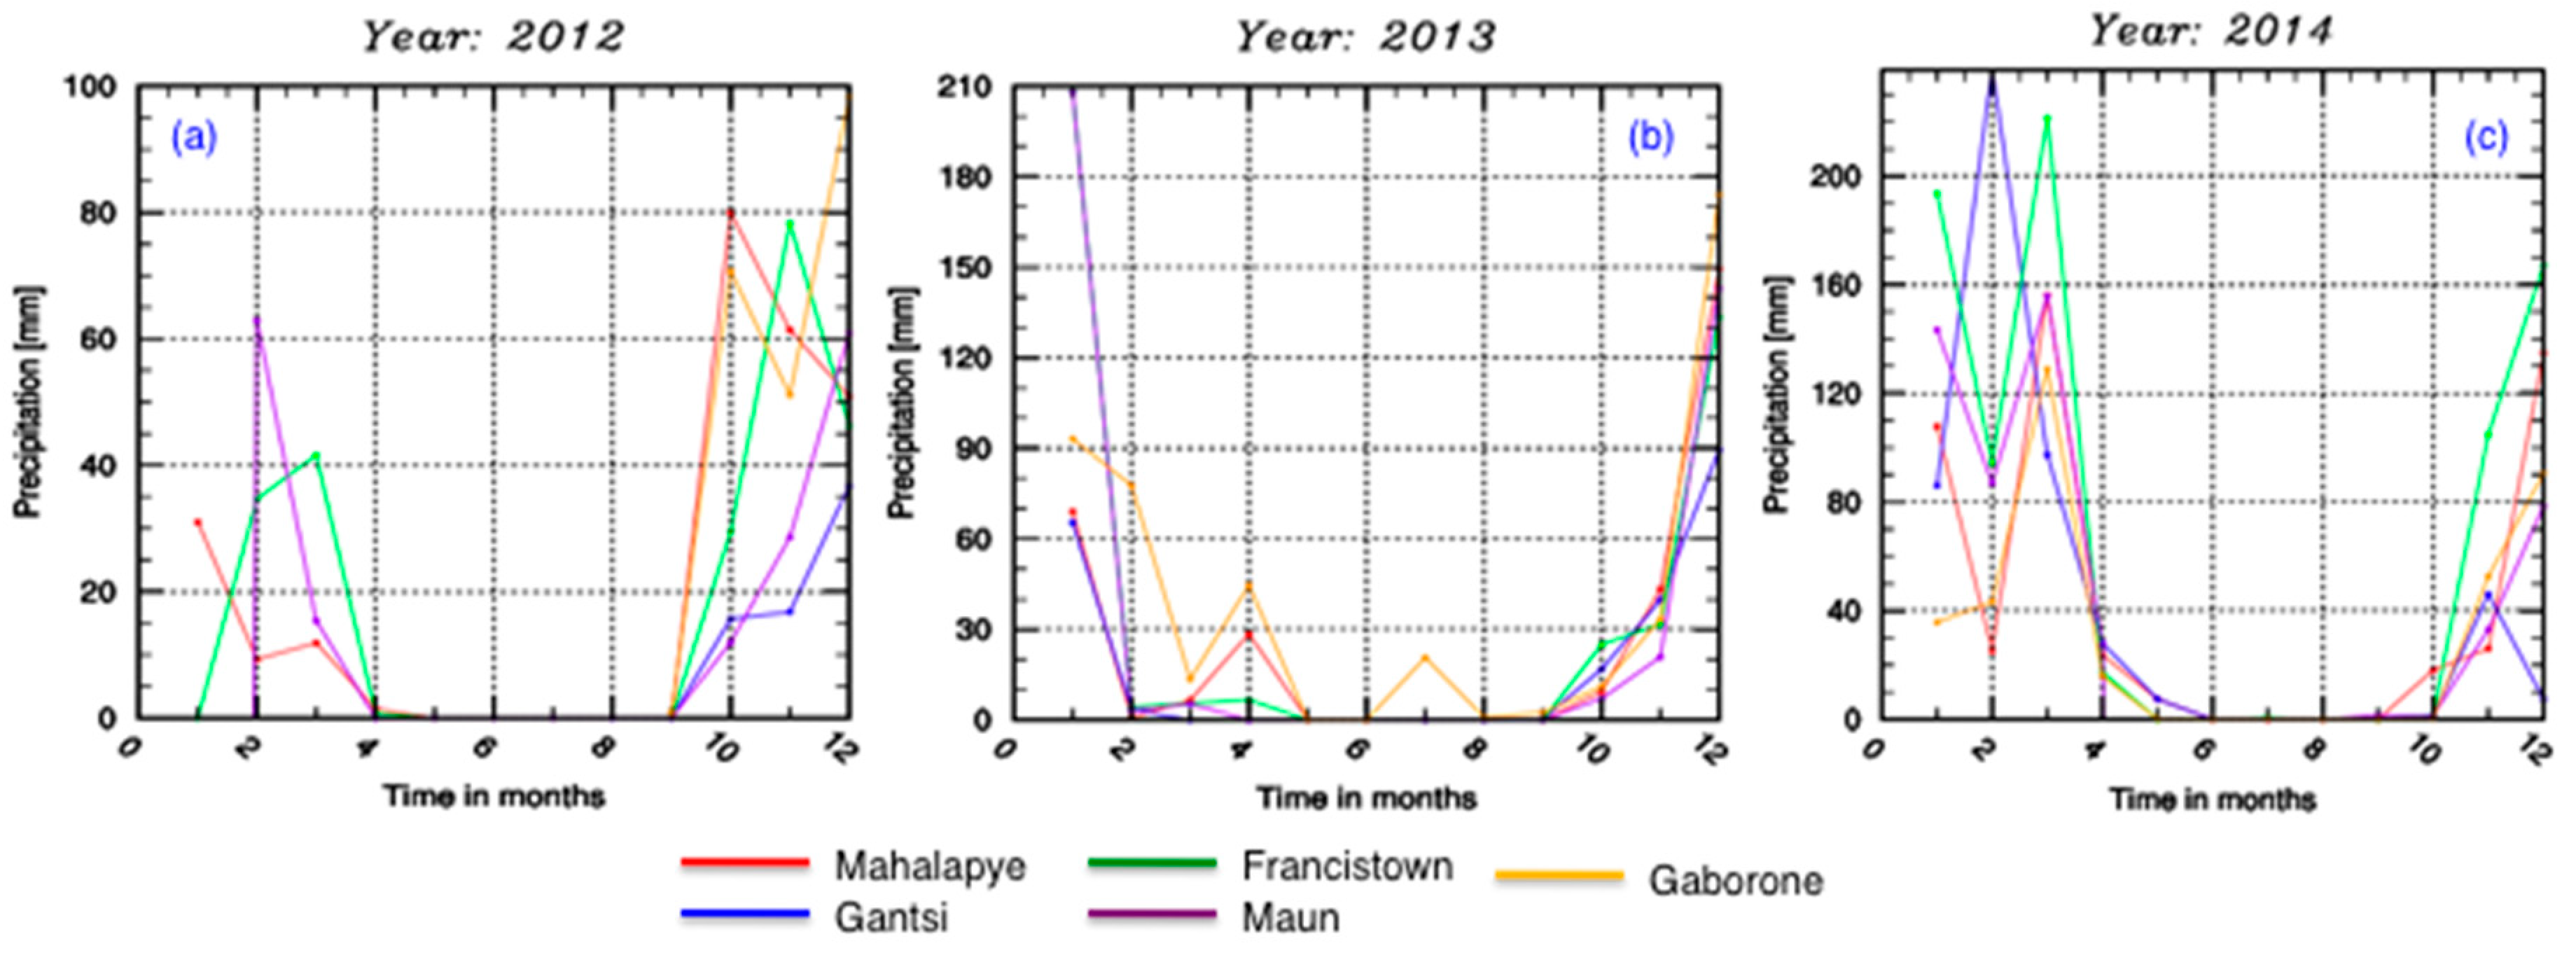
First, we look at the rainfall distribution and precipitation amount from different stations in Botswana in different years. Figure 2 shows a bar graph of annual rainfall from five selected weather stations in Botswana (Gaborone, Francistown airport, Kasane airport, Ghanzi and Tshabong airport). The stations are selected spread so as to have a representation of rainfall distribution across the country. The graph is a 10-year period (2003–2013) with five-year intervals chosen to cover a reasonably longer period and more variation in the distribution. The years depicted are 2003, 2008 and 2013 respectively. Although our focus is on 2013, we compare with other years to identify the year with the heaviest rainfall within the past decade prior to 2013. As shown, it is evident that there was more rainfall in 2013 across all the stations, except the trend shown for Gaborone, which received less rainfall in 2013 than other years. Perhaps the systems were not intense in the southeast, since the region generally has low rainfall. Additionally, we show monthly precipitation from some stations across the country between 2011, 2012 and 2013 (Figure 3).
Next, we also look at precipitation amount from five different stations across the country, showing total rainfall (monthly) for the years 2012–2014. As observed, maximum wetness occurred between October and March. The rest of the year was dry, with the exception of 2013, but not as much as other months. Additionally, one notices that January 2013 had more rainfall (e.g., Maun recorded over 210 mm) than in 2012 or 2014. The rainfall maximum is also inconsistent with latter part of 2012 (Oct–Dec), which then dropped between February and March in 2013. These results indicate that 2013 was generally wetter than other years across the subcontinent.
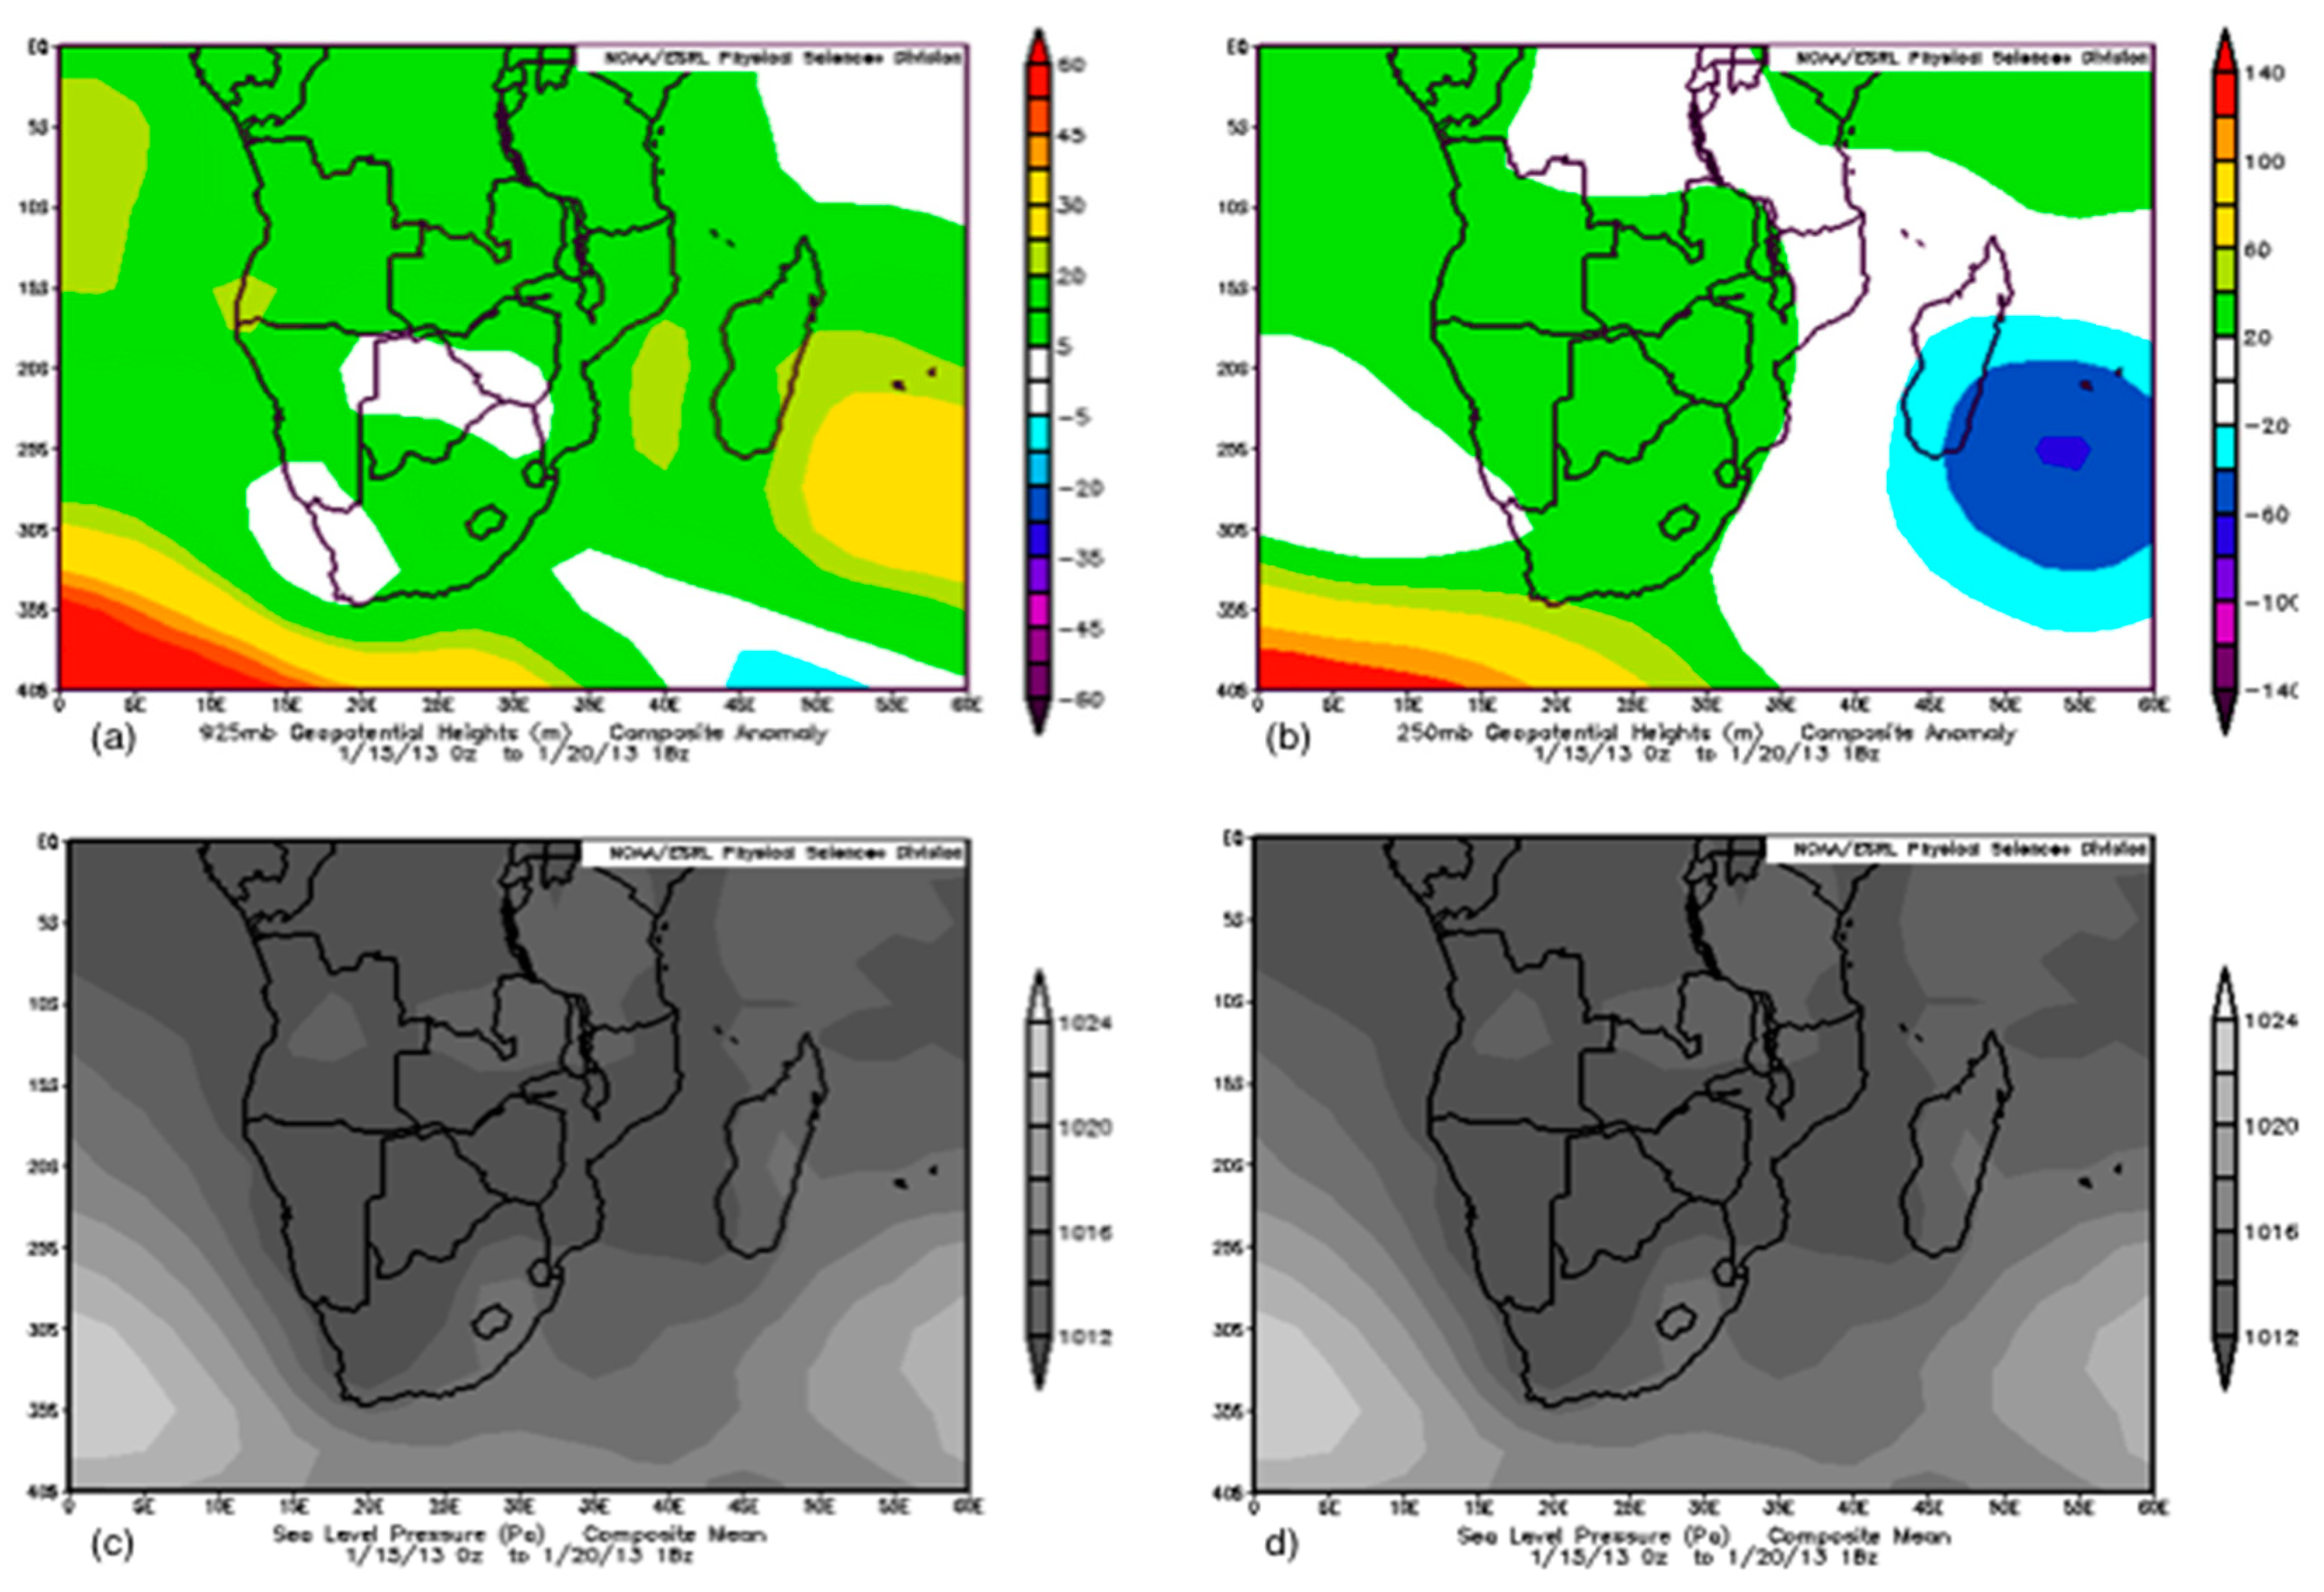
Now, we look at geopotential height and SLP over the domain between 15 and 20 January (Figure 4) at 925 mb and 250 mb. Geopotential height approximates the actual pressure surface height above mean sea level and can be considered a gravity-adjusted height. SLP indicate regions of equal surface pressure on the earth, which varies with elevation into the atmosphere. Left panels represent 925 mb composites whereas the right panels represent 250 mb composites. Composites of geopotential height anomalies show a somewhat low-level ridge centered over the SWIO (east of Madagascar), at 250 mb (Figure 4b) whereas the 925 mb level shows a positive anomaly at the same location. However, both levels indicate positive anomalies in the bottom left corner of the domain. Southern Africa is characterized by a moderately elevated plateau; a greater part rises to over 1000 m above sea level and more than 1500 m over extensive areas. While the region is not close to the highland areas, topography may also play a role as convective activity could commence near/beneath the elevated landmass.
There is a tendency for convective initiation to be favored within the highland regions [44,58,59,60,61]. For example, a study by Laing et al. [58] on the propagation of characteristics of organized convection in Africa indicate that convective episodes tend to initiate in the lee of high terrain, consistent with thermal forcing from elevated heat sources. Once convection is initiated, the movement of the cells could bring them southwards. Meanwhile, pressure does not vary in both levels across the domain (Figure 4c,d), as compared to geopotential height. However, there were notable changes especially over the marine environment, going into the next few days. Persistent positive anomalies at the upper levels (not shown) may have contributed to enhance the low-level convergence associated with low-level trough and strong uplift across land. Surface pressure fields in the post-trough stages can produce a strong onshore flow along the southeastern/western coast of the subcontinent. A strong high-pressure circulation developing over southern Angola could promote the influx of cold dry air flow through the Namib-Kalahari desert into most parts of the subcontinent [62]. These features could help sustain convection over southern Africa and favorable for uplift of moisture through the lower troposphere, leading to the heavy rains, especially over tropical central Africa. Interactions between convective cells and outflow boundaries may also play role in the initiation of large storm complexes.
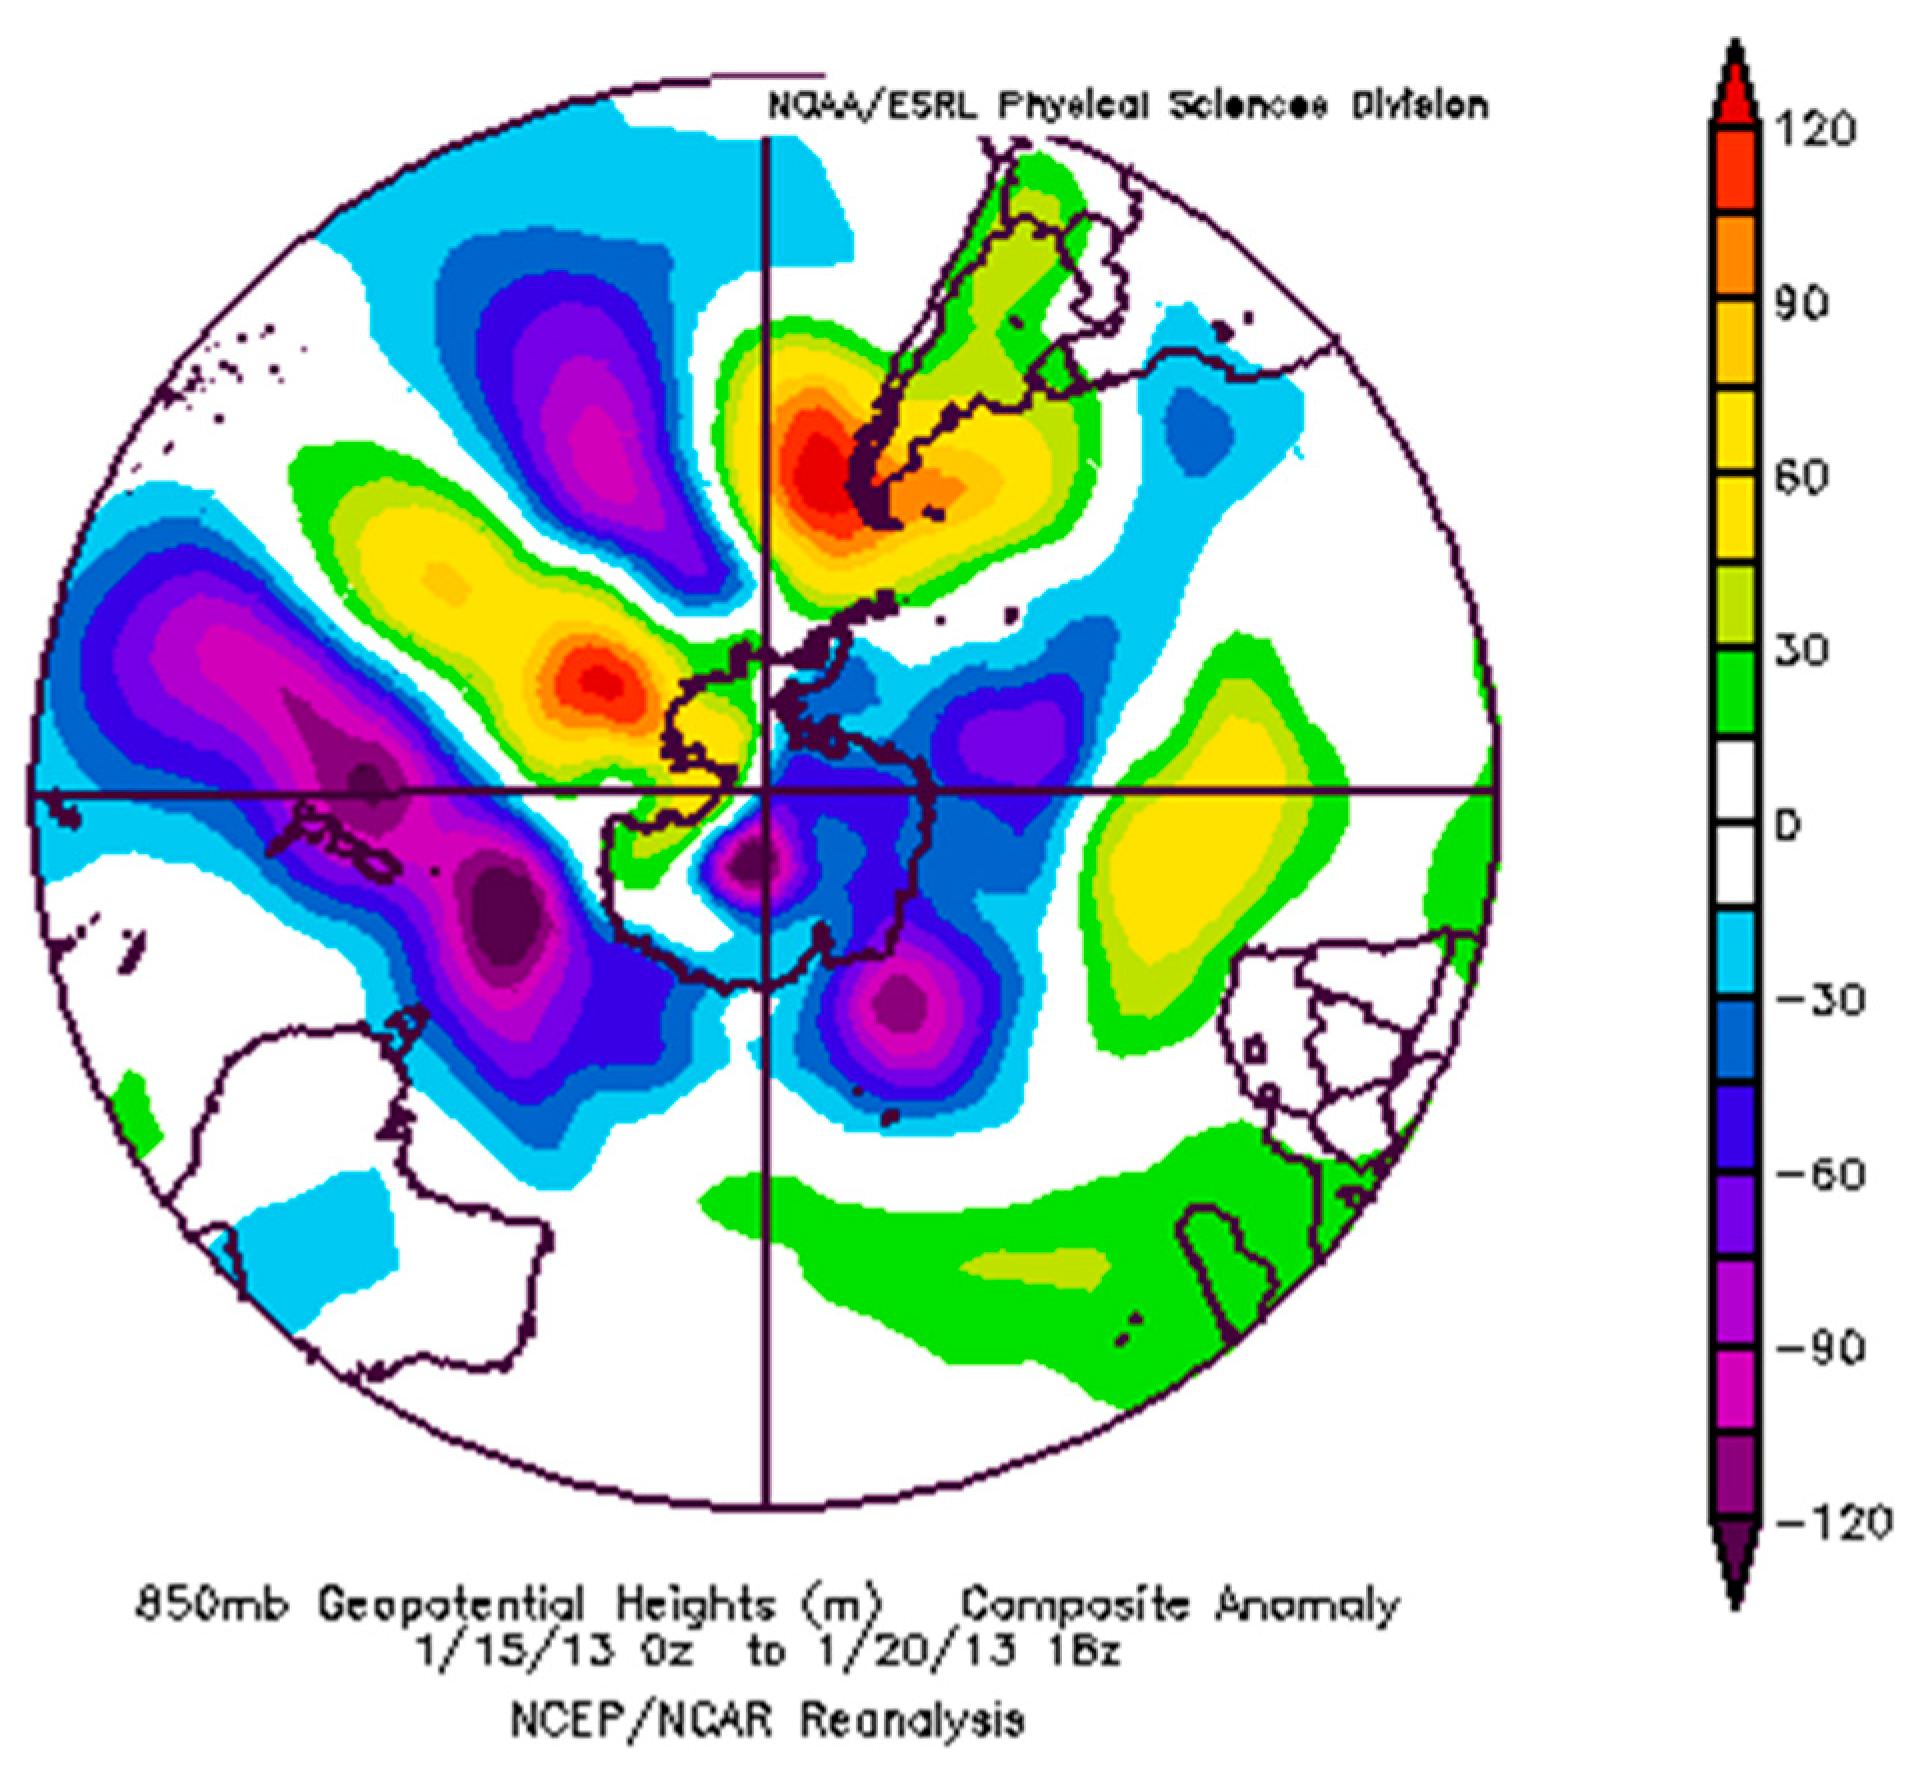
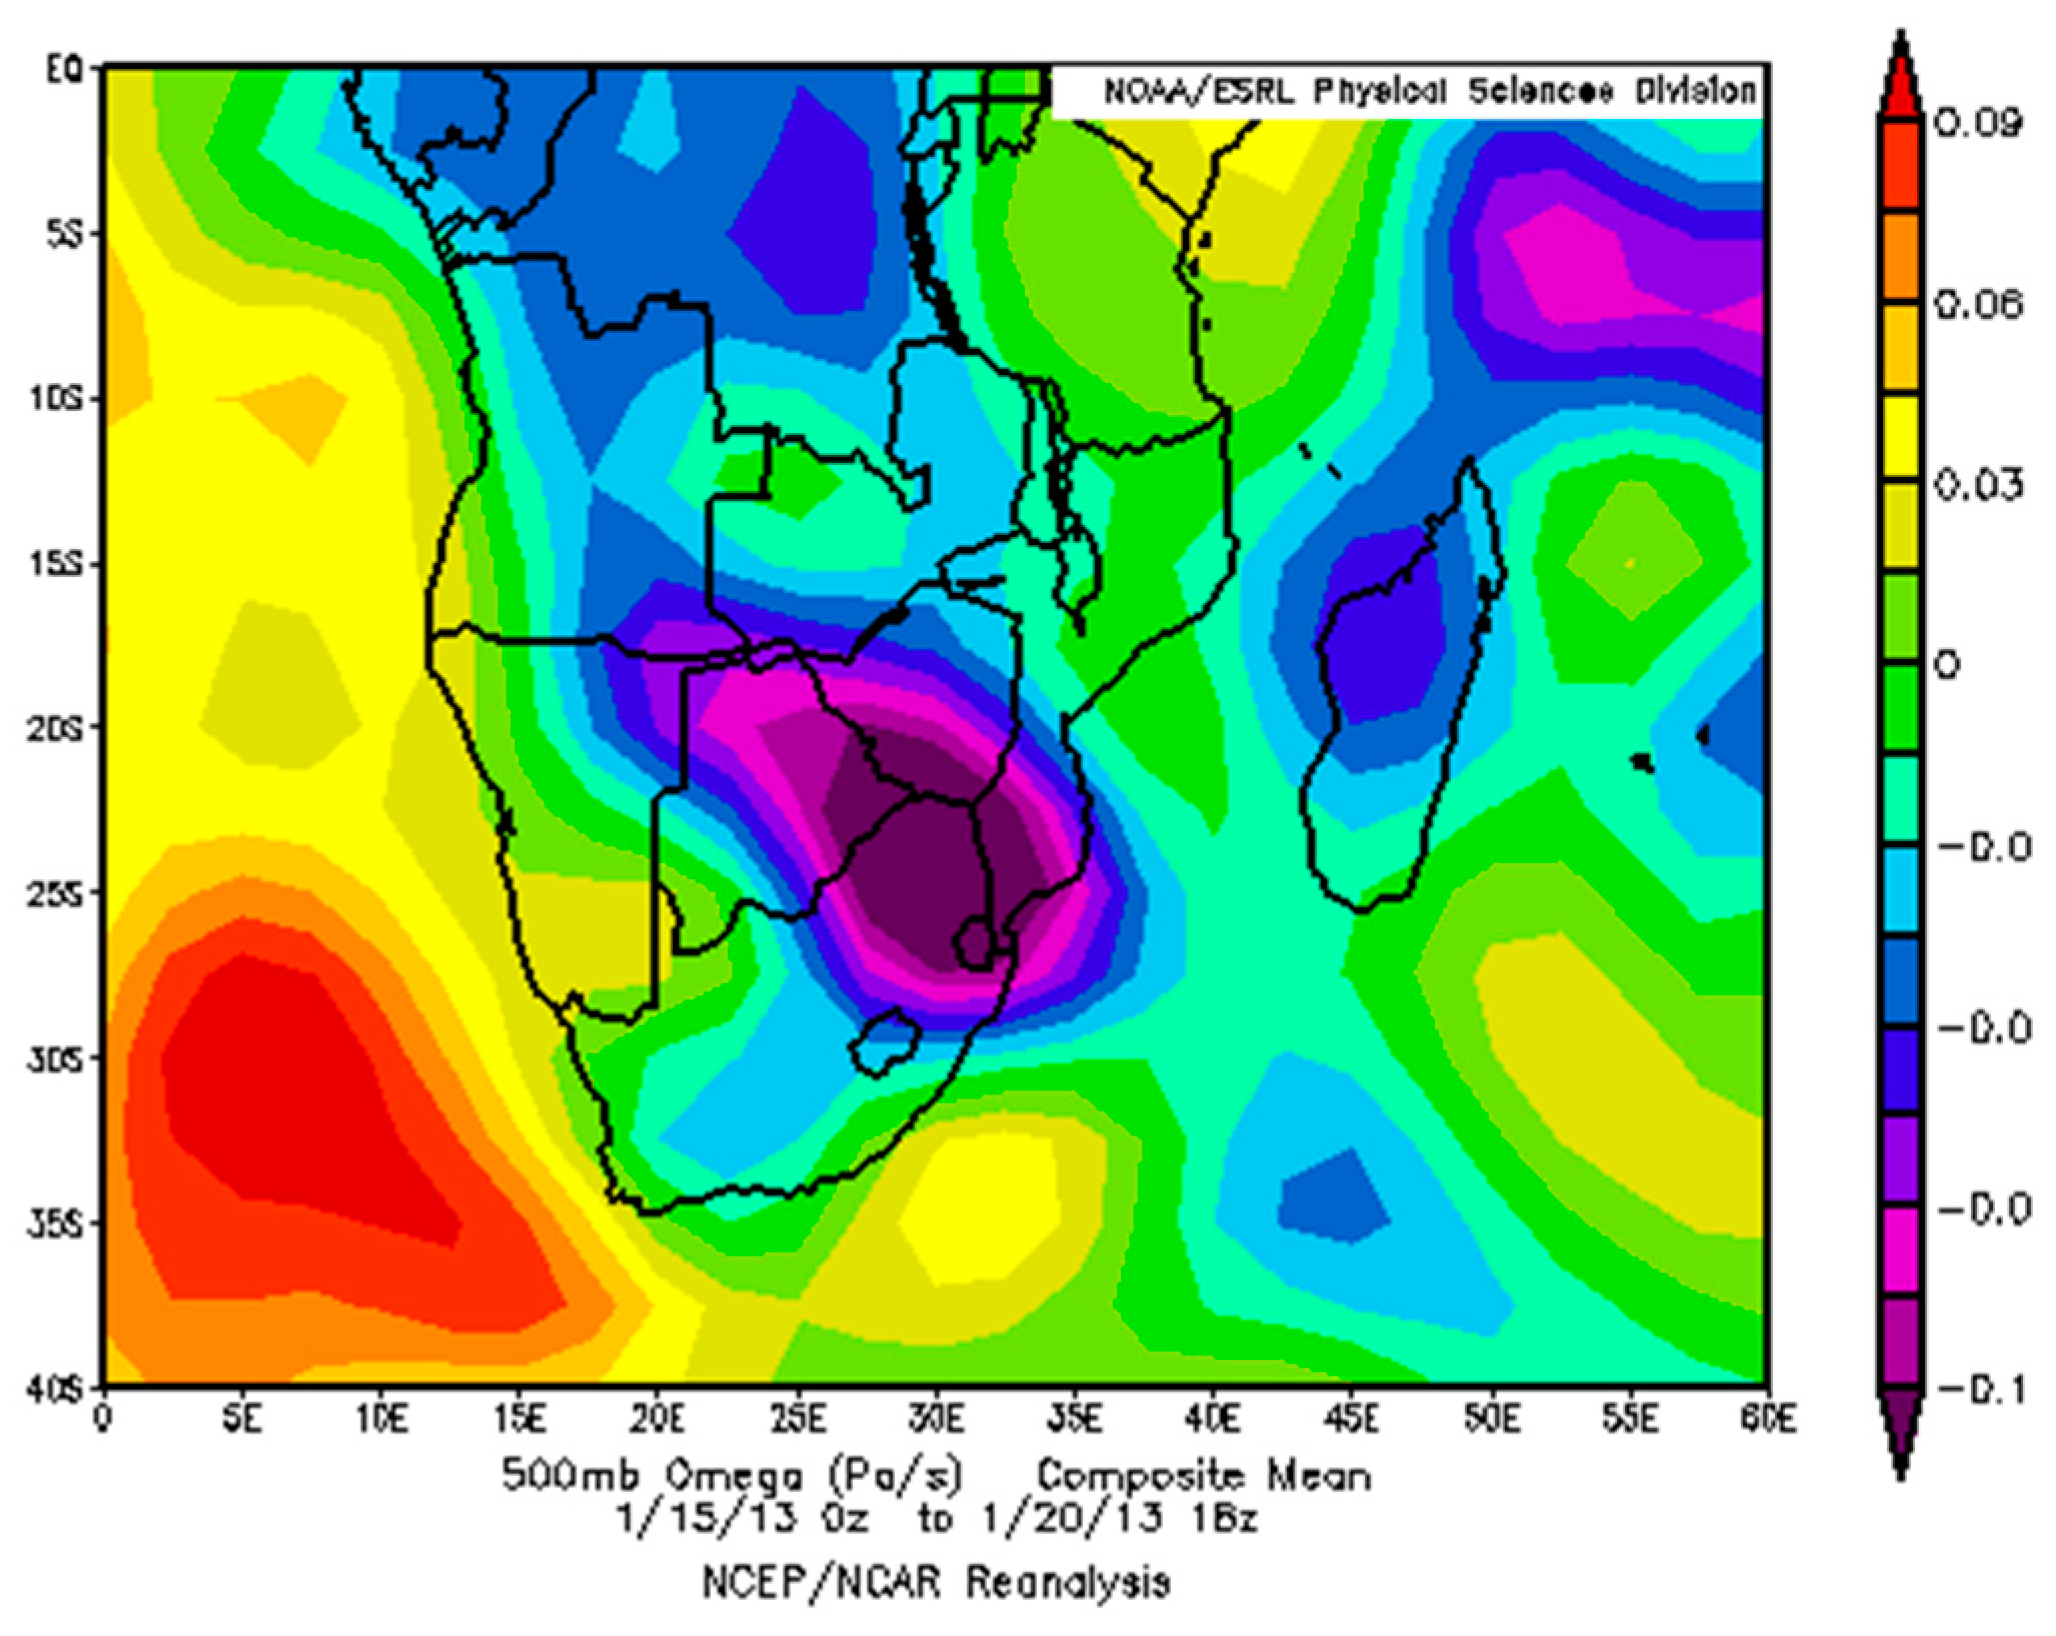
Figure 5 also shows geopotential height anomalies on the southern hemispheric scale, depicting the low-level troughs at 850 mb. As shown, low-level troughs are common in the SWIO, particularly between Antarctica and southern east Africa-through-Australia. Additionally, upper-level troughs are observed offshore southwestern Chile and northwestern Antarctica. These regions are within circulations associated with enhanced summer rainfall over subtropical southern Africa. Figure 6 shows the NCEP/NCAR omega (inverse of vertical velocity) composites between 15 and 20 January 2013, plotted at 500 mb. This is the pressure tendency field that can be used to indicate the presence of the large-scale uplift. Omega is plotted at the upper level so as to assess the ascent (i.e., ascending motion) through the troposphere. Strongest negative omega anomalies are located over eastern Botswana, southern Zimbabwe-Mozambique and northeastern South Africa (including Lesotho). Meanwhile, positive omega anomalies occur over much of the domain, with the strongest occurring in the SACZ —offshore in the southwest and consistent with Figure 4a,c.

5.2. Temperature and Wind Pattern

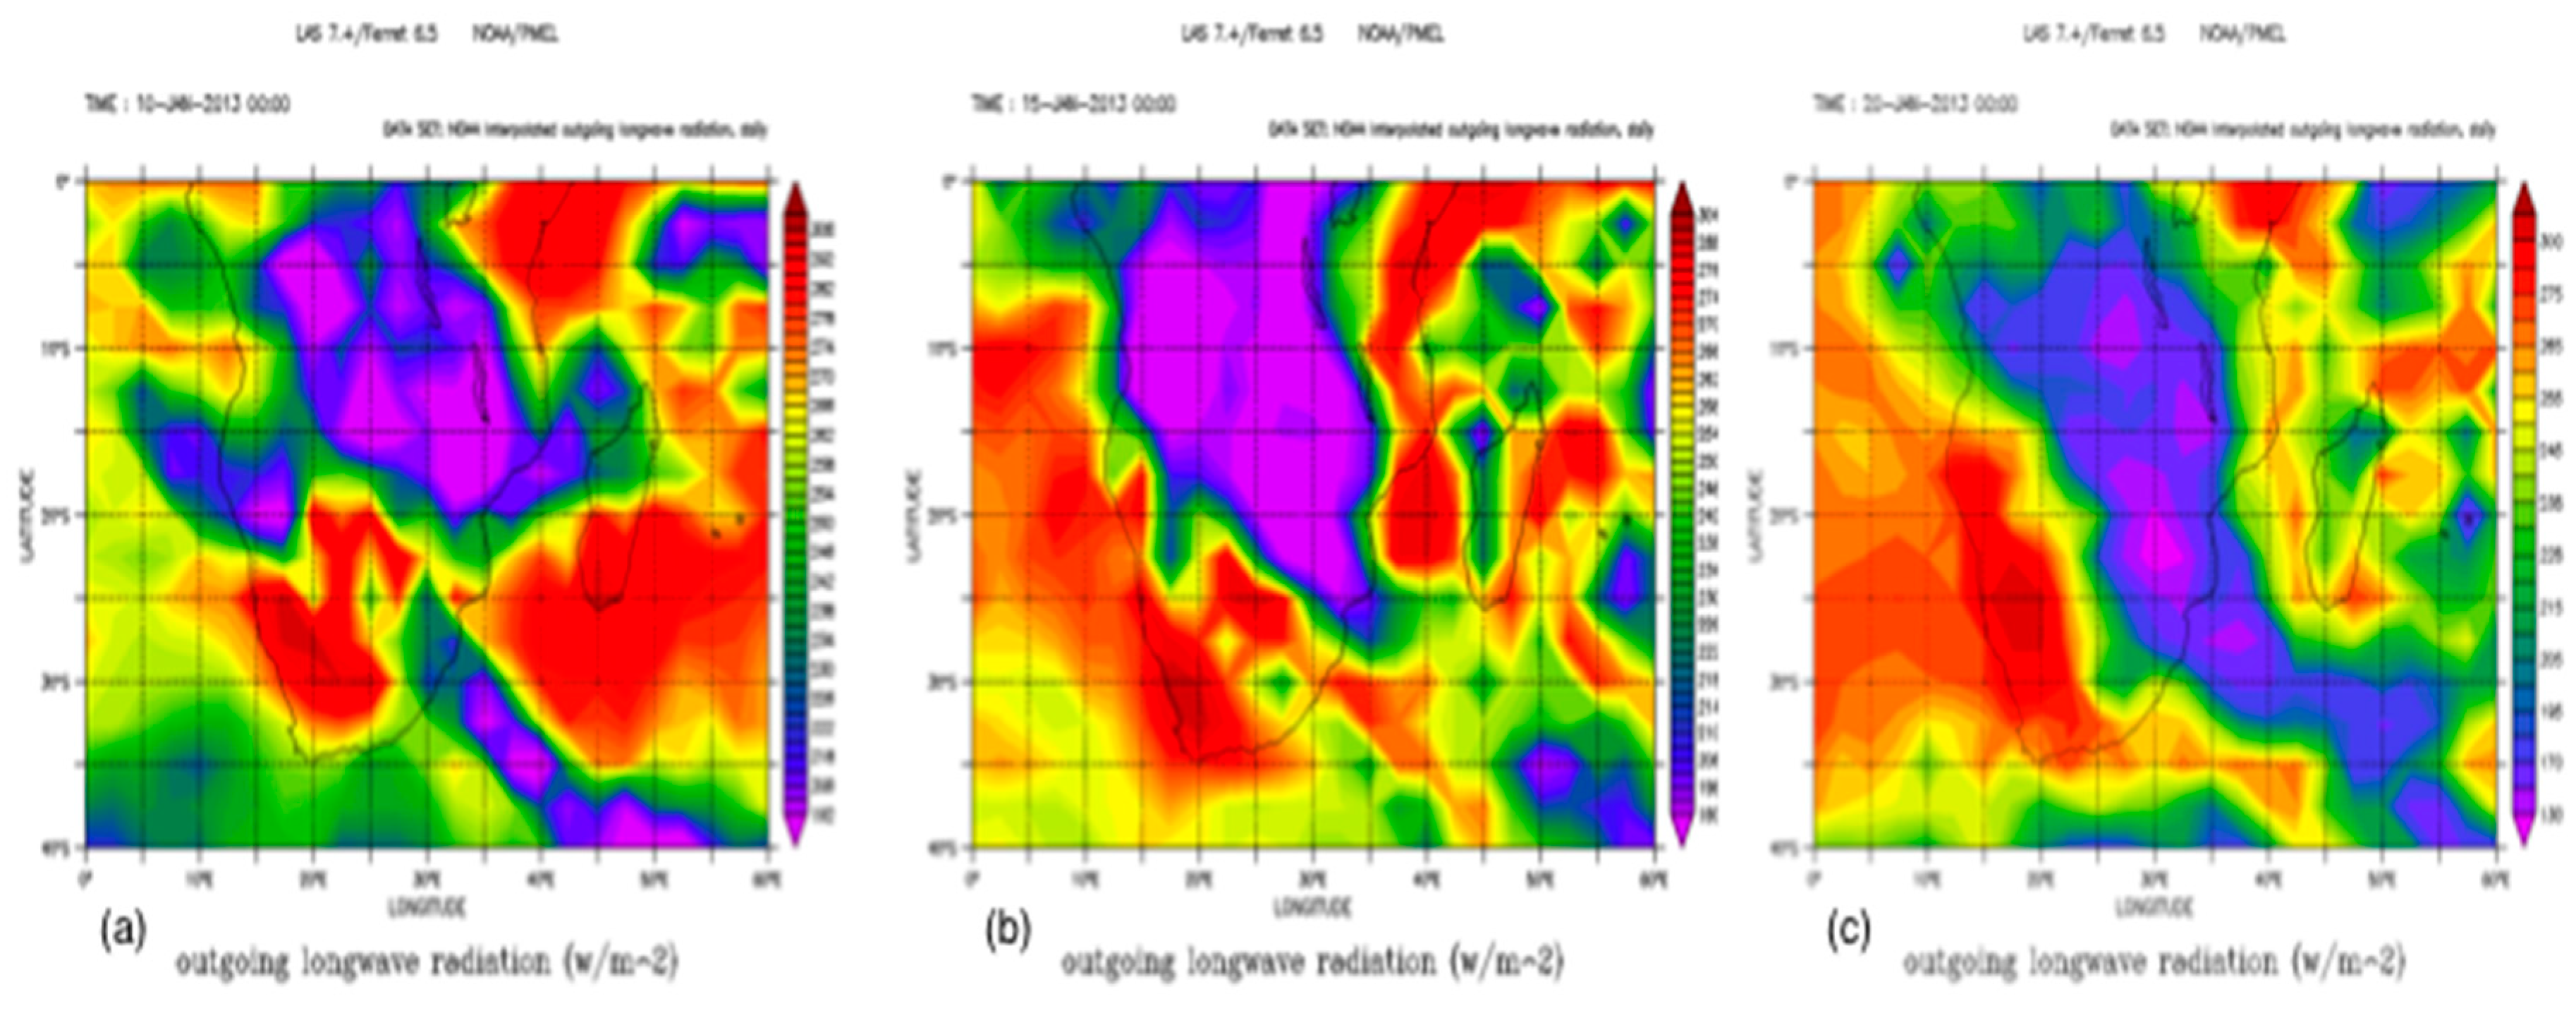
Figure 7 shows OLR on 10, 15 and 20 January 2013 (obtained from APRDC dataset). This quantity is inversely related to deep convective cloudiness and wave motions in the tropics and higher rainfall rates [63]. Deep convective clouds are often typified by thick large cumulonimbus clouds which can extend from near the earth surface up to more than 10 km high. Deep convection and heavy rainfall over southern Africa are often supported by continental heating and orographic forcing along the cloud bands. As observed, regions of strong heating are located over central South Africa, SWIO and offshore in the west. These are typical of the active SACZ and SICZ respectively.
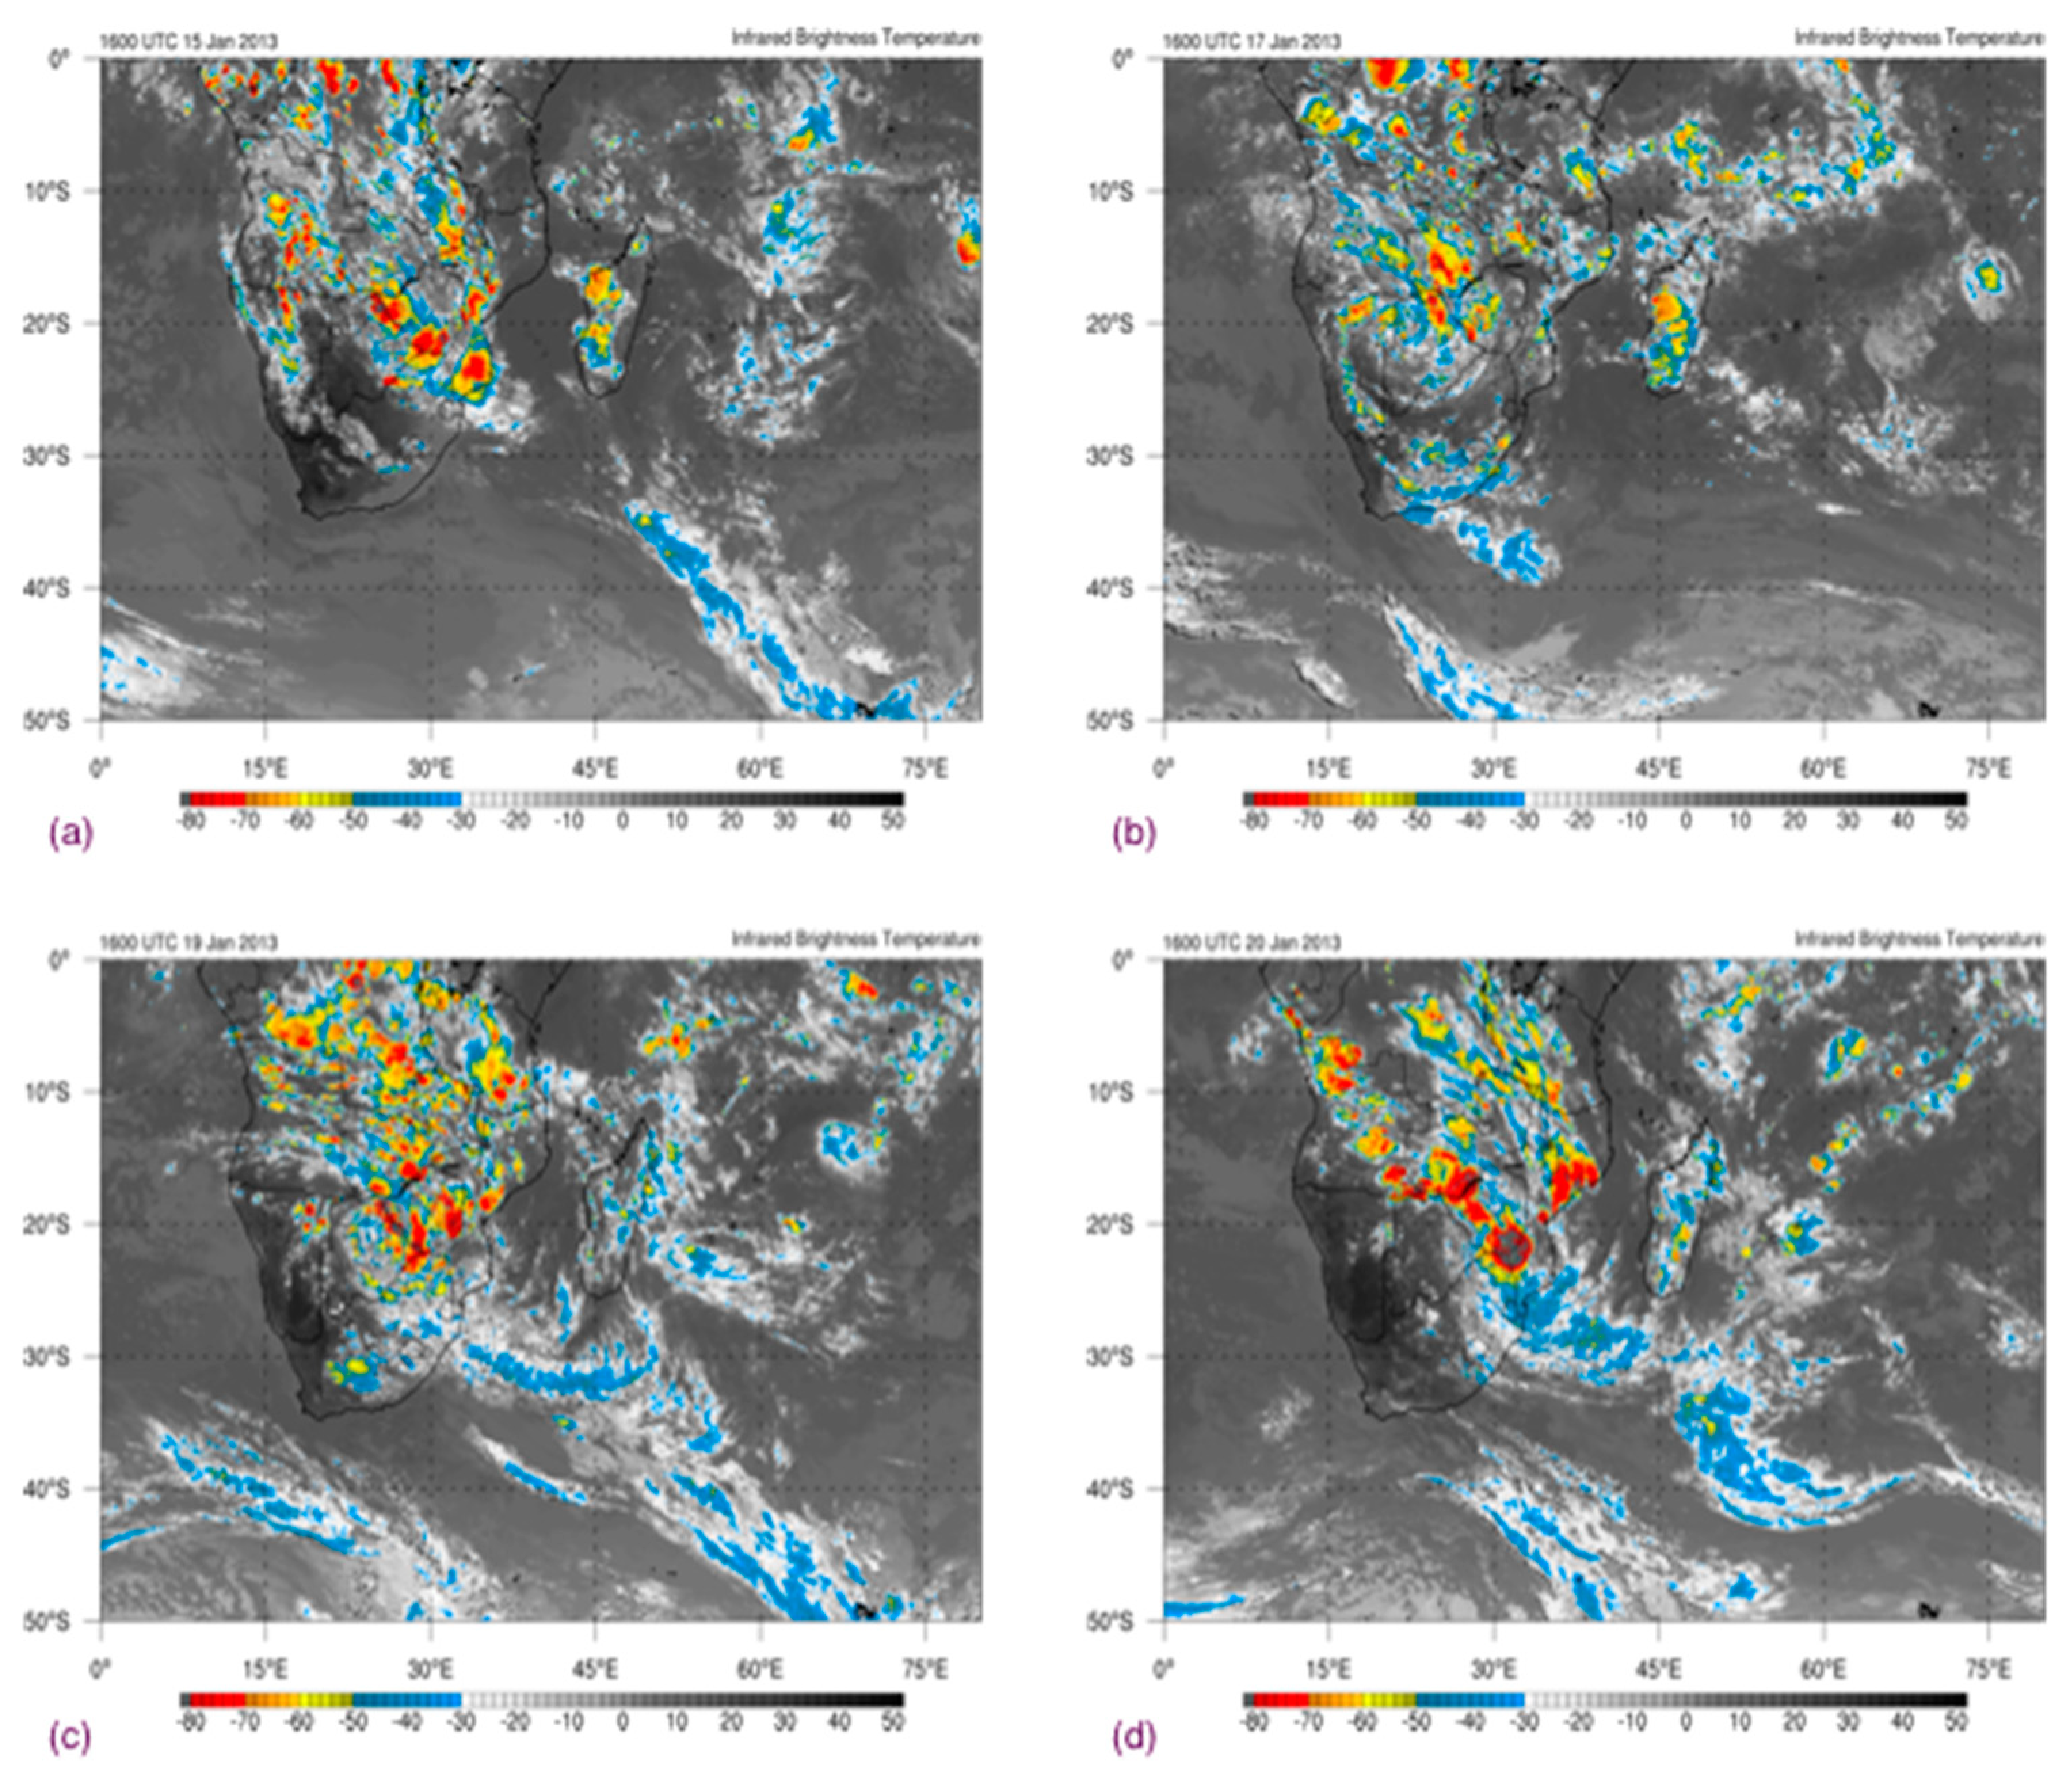
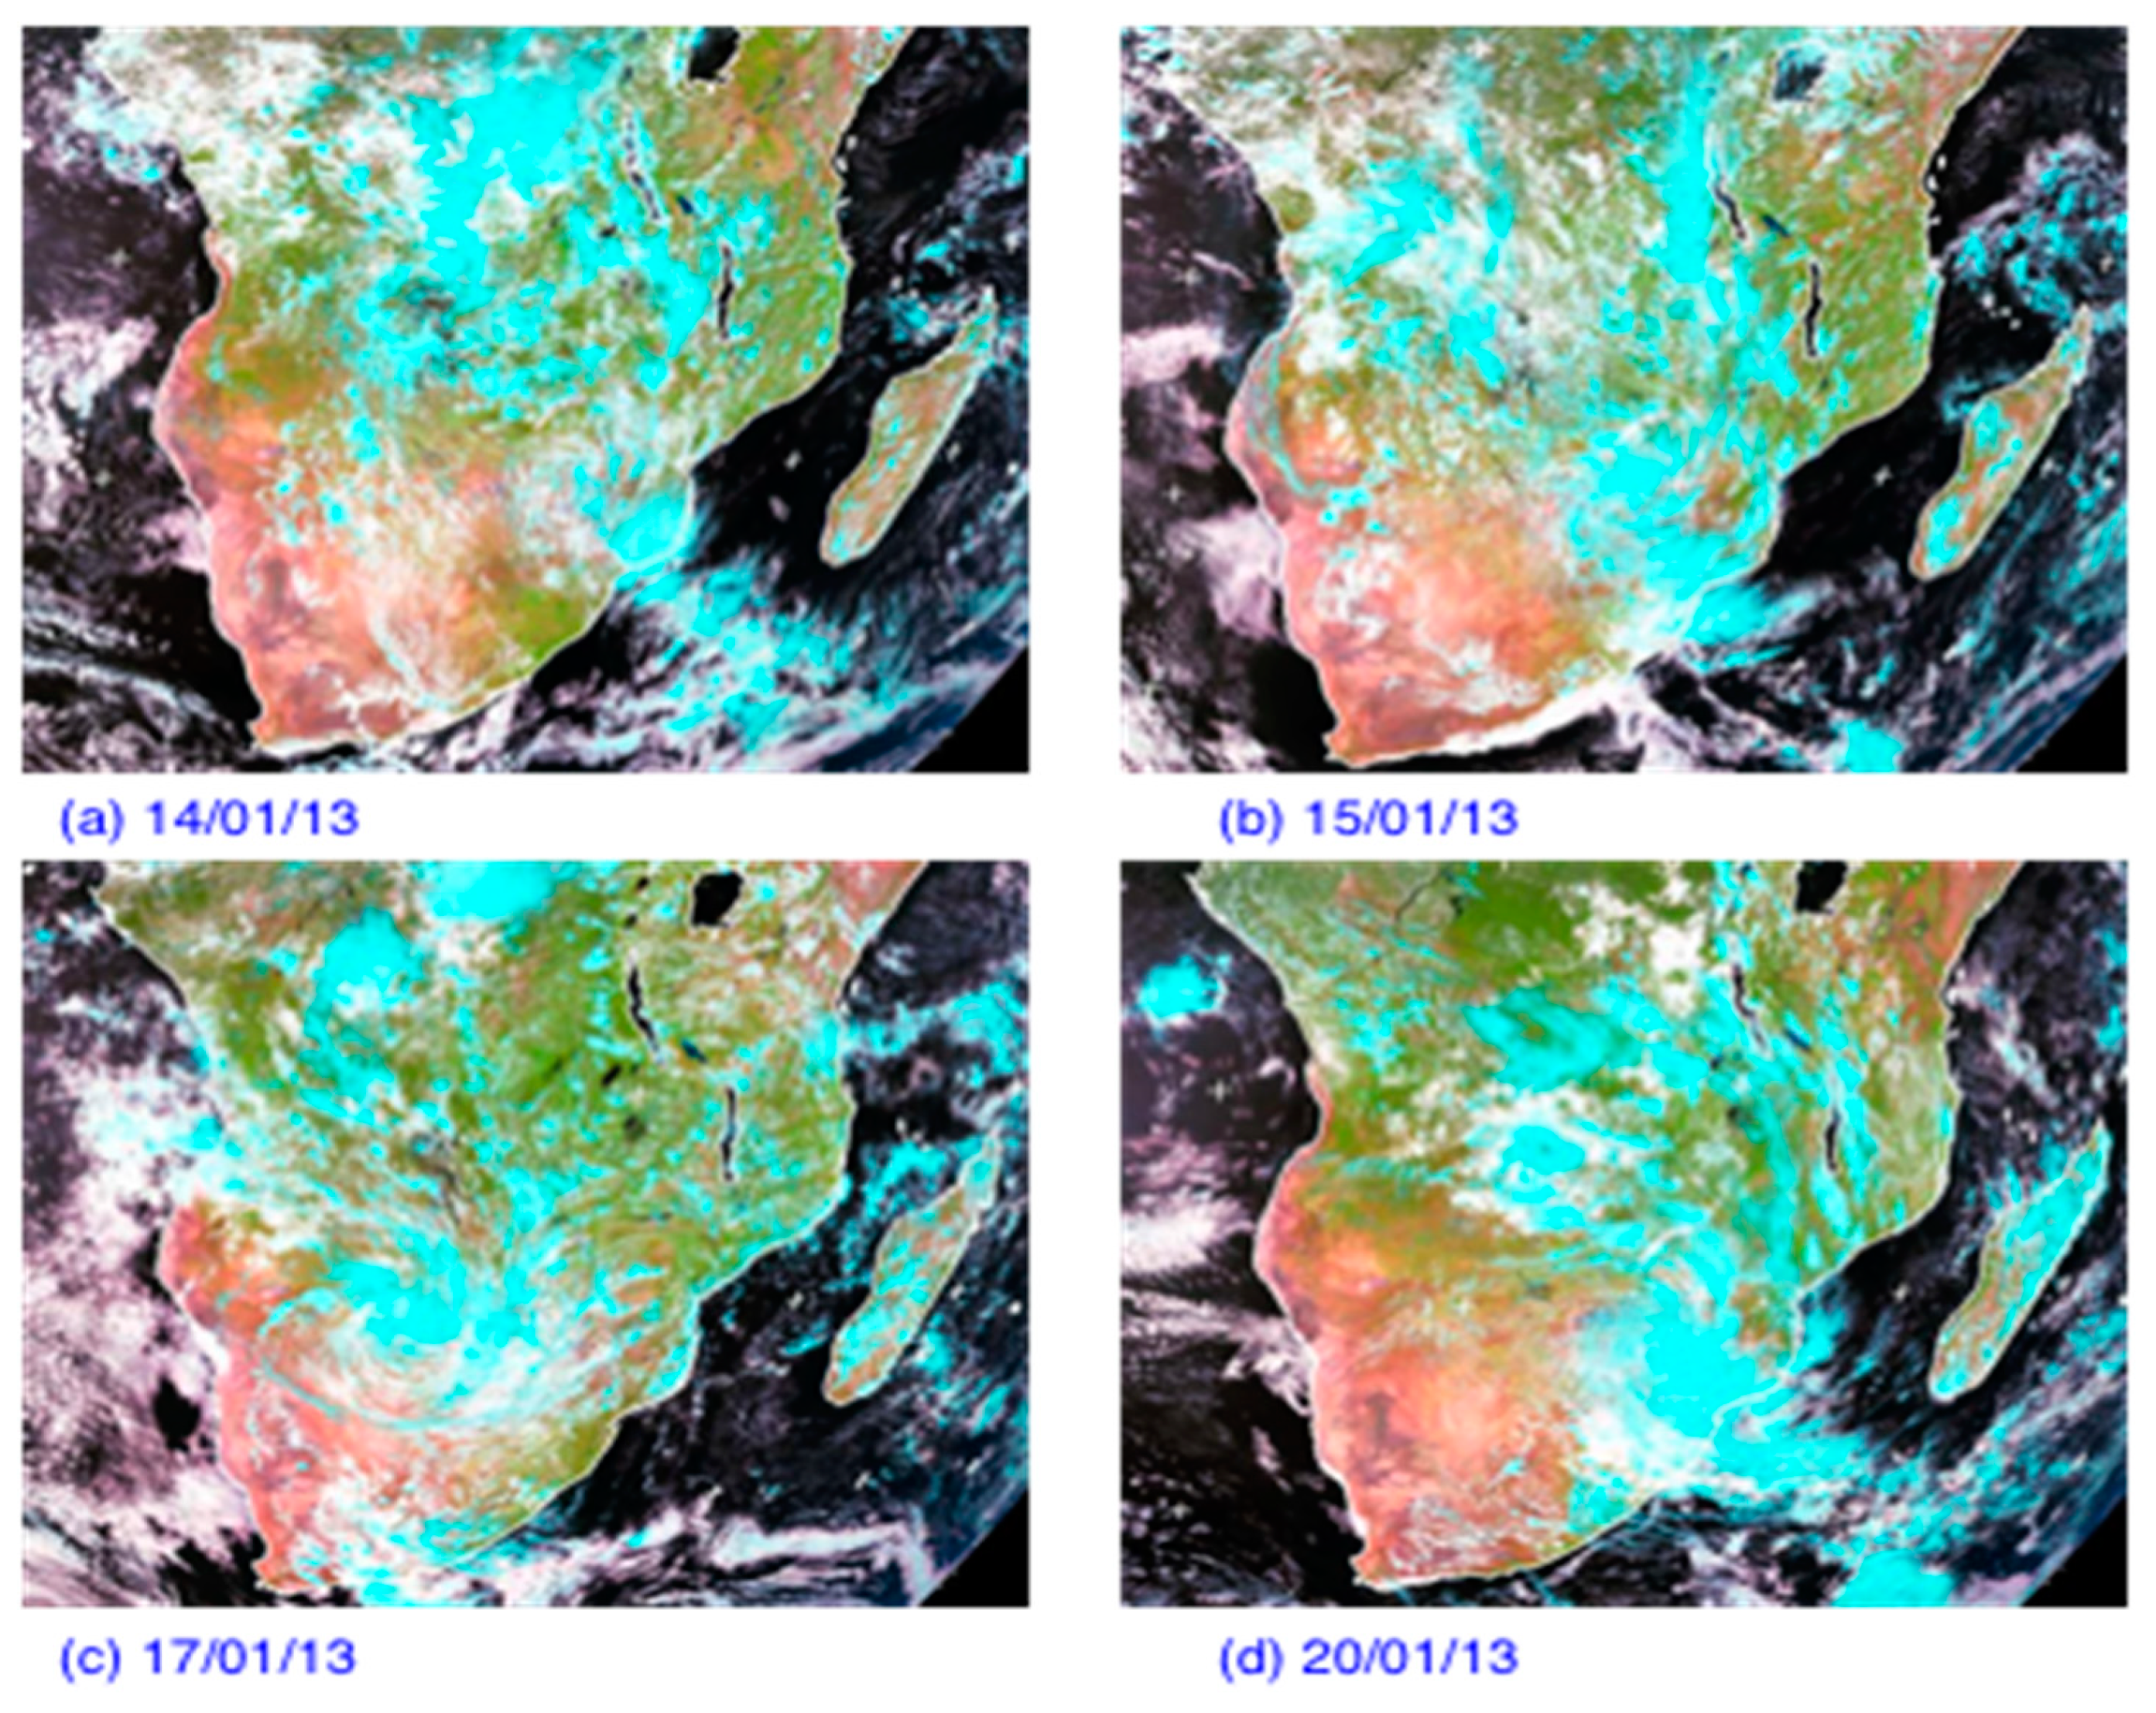
Consistent with Figure 1, Figure 8 also shows IR brightness temperature between 15 and 20 January. Brightness temperature is one established proxy for discerning the intensity of convective updrafts and the precipitation potential on the ground ([64], and references therein). Much of the landmass was characterized by negative temperature anomalies with some trail bands over the SWIO. Active and fast developing convective cells are present over tropical central Africa, mostly centered over Botswana/Zimbabwe (Figure 8a–c), becoming more pronounced over southern Zimbabwe and Mozambique on 20 January (Figure 8d). These features possibly suggest a weakly warm MCV disturbance over the subcontinent, although the moisture could become trapped beneath the upper-level anticyclone—a situation favorable for formation of deep convection due to strongly heated moist below as shown in Figure 7.
Generally, a channel of warm moist air and associated deep convection extends from the northwest to the southeast, as illustrated in Figure 8d. As highlighted earlier, heavy summer rainfall over southern Africa is often associated with tropical-extratropical interactions attributed to the elongated cloud bands that stretch from the tropics poleward and eastward to the midlatitudes. The breadth, location and movement of the axis of stronger moisture flux convergence would appear to play a role in modulating precipitation [15]. Consequently, successive streams moved eastward, in conjunction with progressive east-moving Rossby wave trains, thus enabling moisture flow. The east-moving waves eventually decay over the Atlantic Ocean, while re-development takes places over the Mozambique Channel.
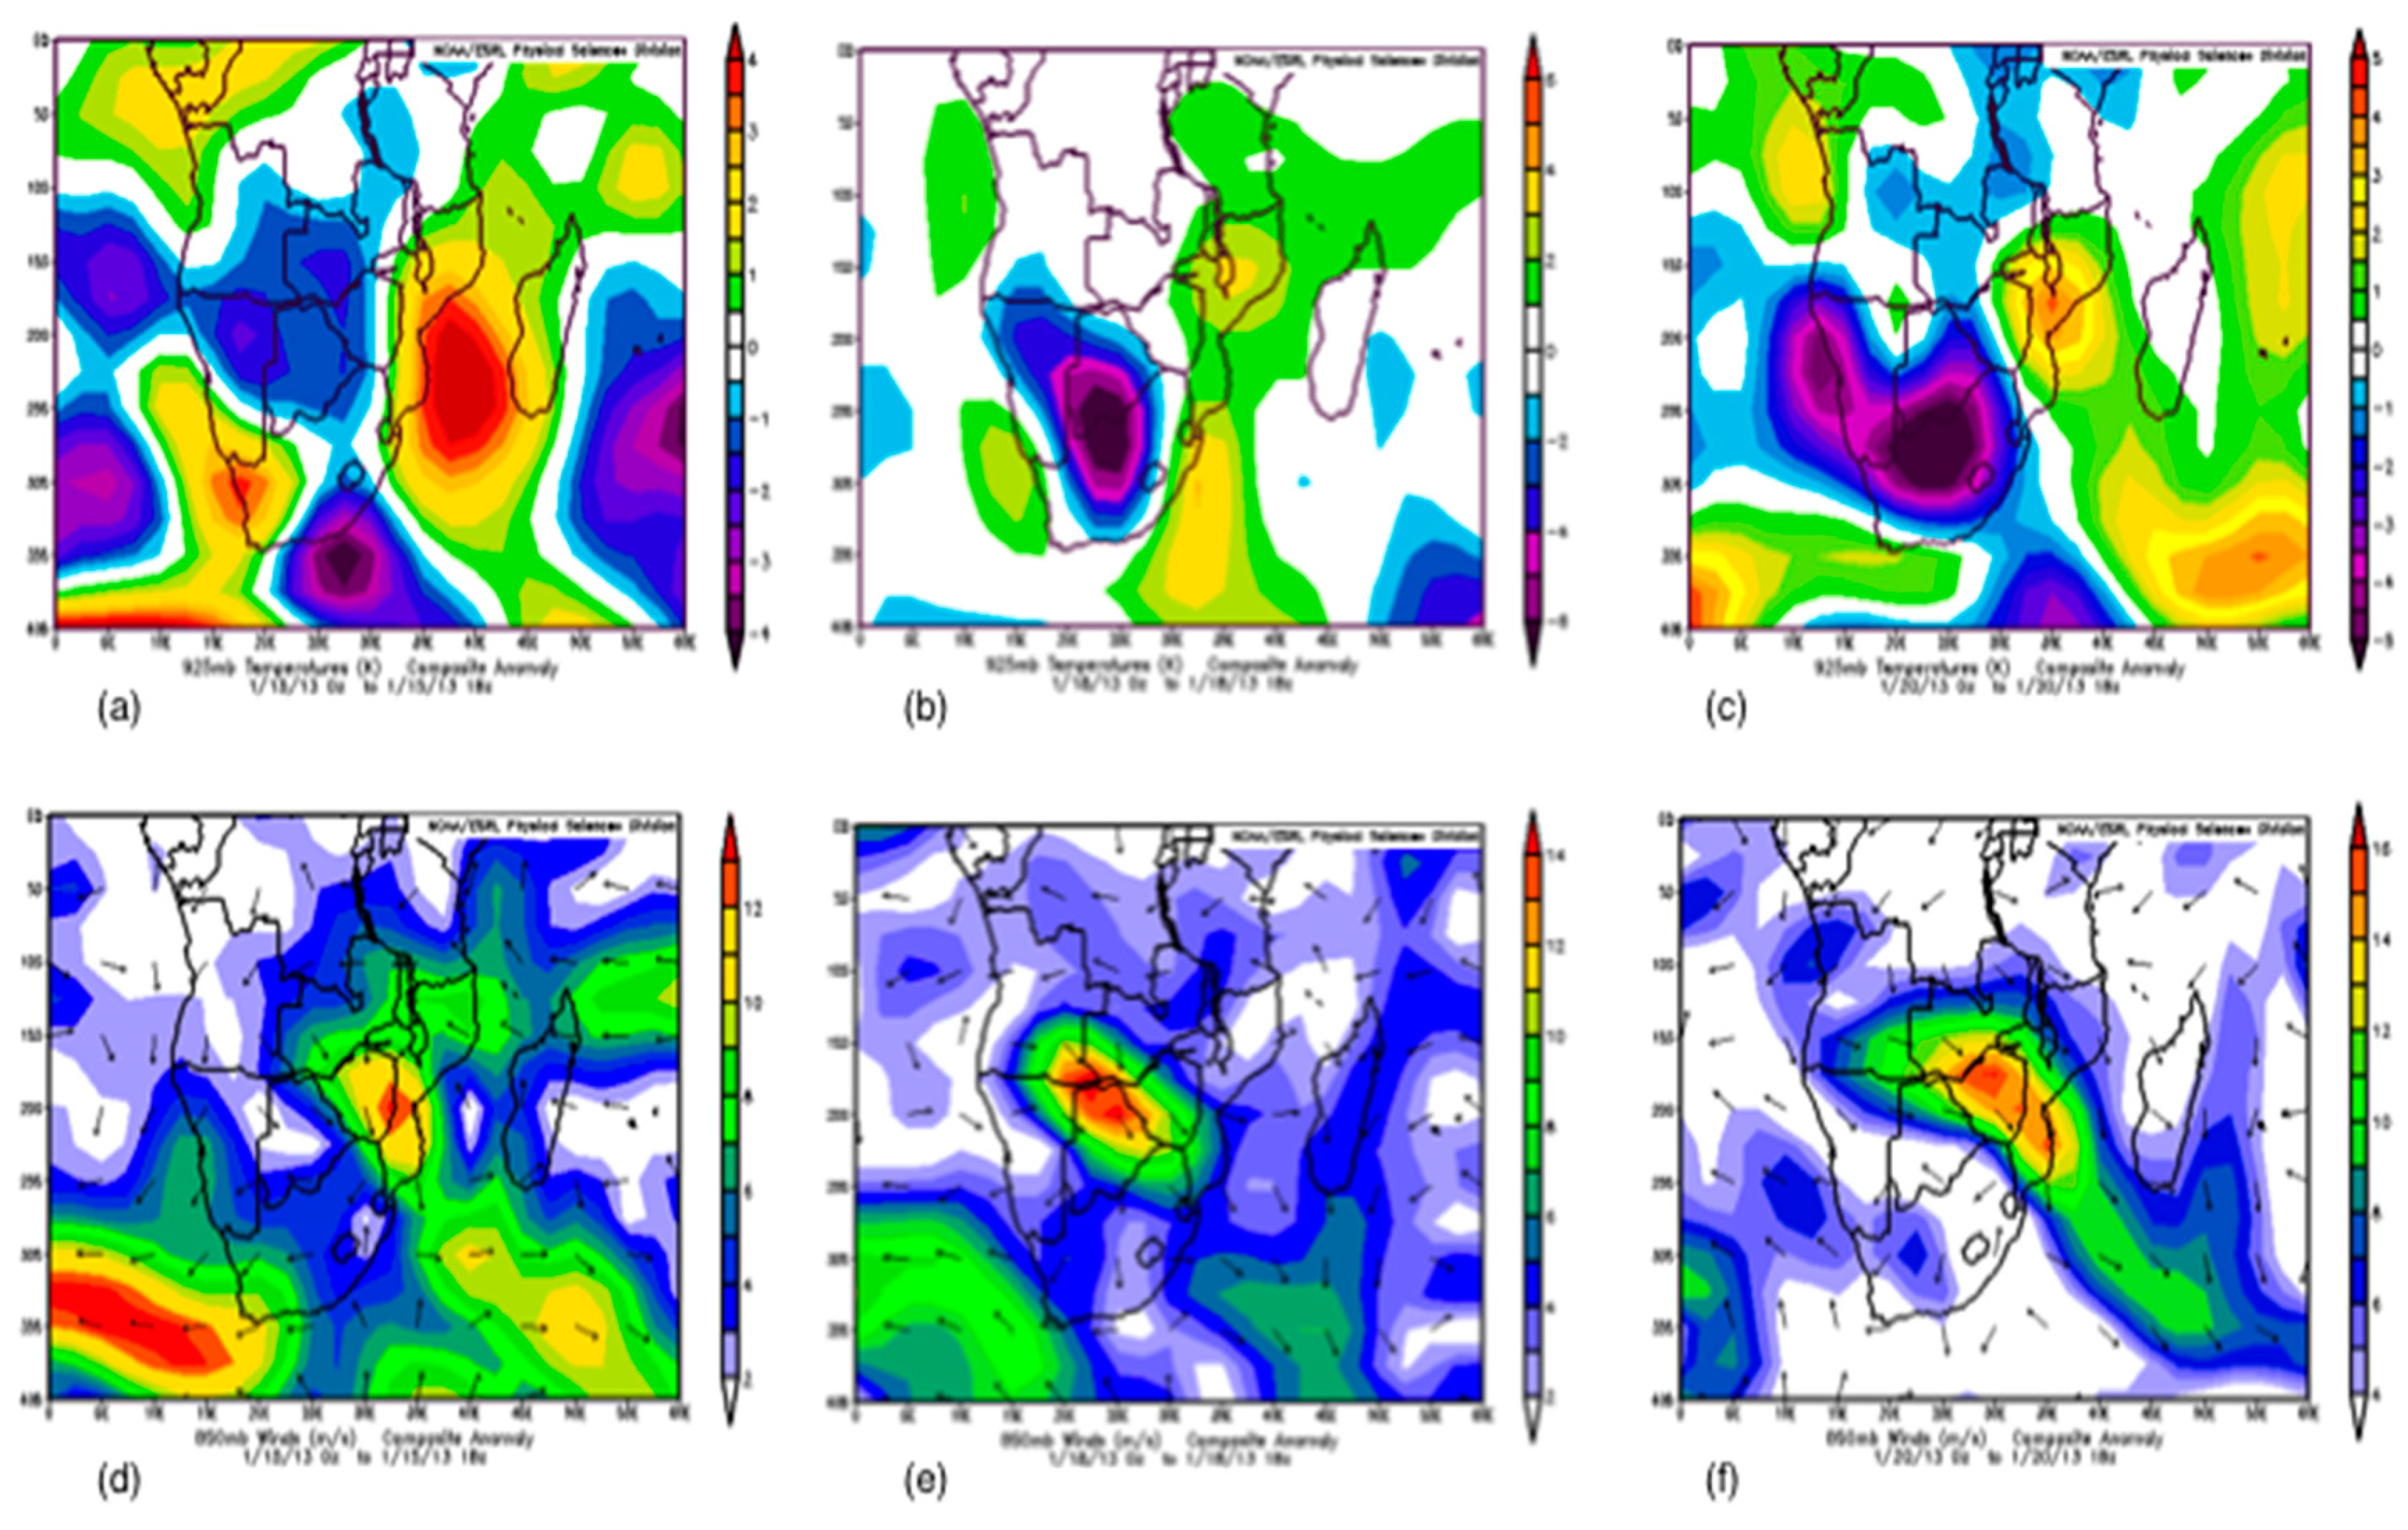
To further compliment our case, we also show NCEP/NCAR re-analysis temperature and wind field over the same period (Figure 9). The temperature is plotted at 925 mb while the wind is plotted at 850 mb to assess the air motion through the troposphere. Negative temperature anomalies (below 4 K) are observed south of the landmass, over the marine environment (Figure 9a) and southern Botswana/northern South Africa (Figure 9b,c). High temperature anomalies (over 4 K) are observed offshore, east of Mozambique on 15 January; the pattern re-developed again between 18 and 20 January. On the other hand, the wind was prevailingly easterly in the south, becoming slack over land.
Wind speed increases in the southwestern corner (Figure 9d) and northern Botswana/southern Angola, moving into southern Zimbabwe and central Mozambique by 20 January. High easterly to northwesterly 850-hPa wind and moisture transport and strong upper-level divergence over land also favored the formation of MCSs. This zone of increased wind speed coincides with cloudy and precipitation areas as shown in Figure 10 and Figure 11 below.

5.3. Clouds and Precipitation

To facilitate interpretation of results, we also look at characteristics of clouds over the domain. The reason behind this is to identify the cloud field as homogeneous or dominant over the area of interest. Figure 10 shows cloud imagery obtained from the Dundee satellite website (http://www.sat.dundee.ac.uk) between 14 and 20 January. While the homogeneity of cloud field is the main criterion for the characterization, clouds can succumb to natural variation of their micro- and macro structural characteristics. For example, clouds adjustments to aerosol perturbations depend on aerosol properties [65]. However, although the satellite imagery does not show pressure and wind patterns, clouds are within areas where convective cells are captured, and the temperature drops and wind speed increases (see Figure 8 and Figure 9). Similarly, this also coincides with precipitable zones shown in Figure 10. Inspection of the satellite imagery also shows cloud patches over central southern Africa and the SWIO. Tropical central Africa is the global third most extensive region of deep convection after the west Pacific warm pool and Amazonia. For example, Diaz et al. [66] outline different generations of cloud types over southern Africa from deep convective (associated with the ITCZ) to marine stratocumulus formed off the coast of Namibia [67]. Stratus clouds are often observed over southern Africa, especially near oceanic areas. These are the most common of the three main stratiform clouds characterized by large spatial coverage with distinctly organized patterns [67]. Over the Indian Ocean, common clouds appear to be related to thick convective clouds.
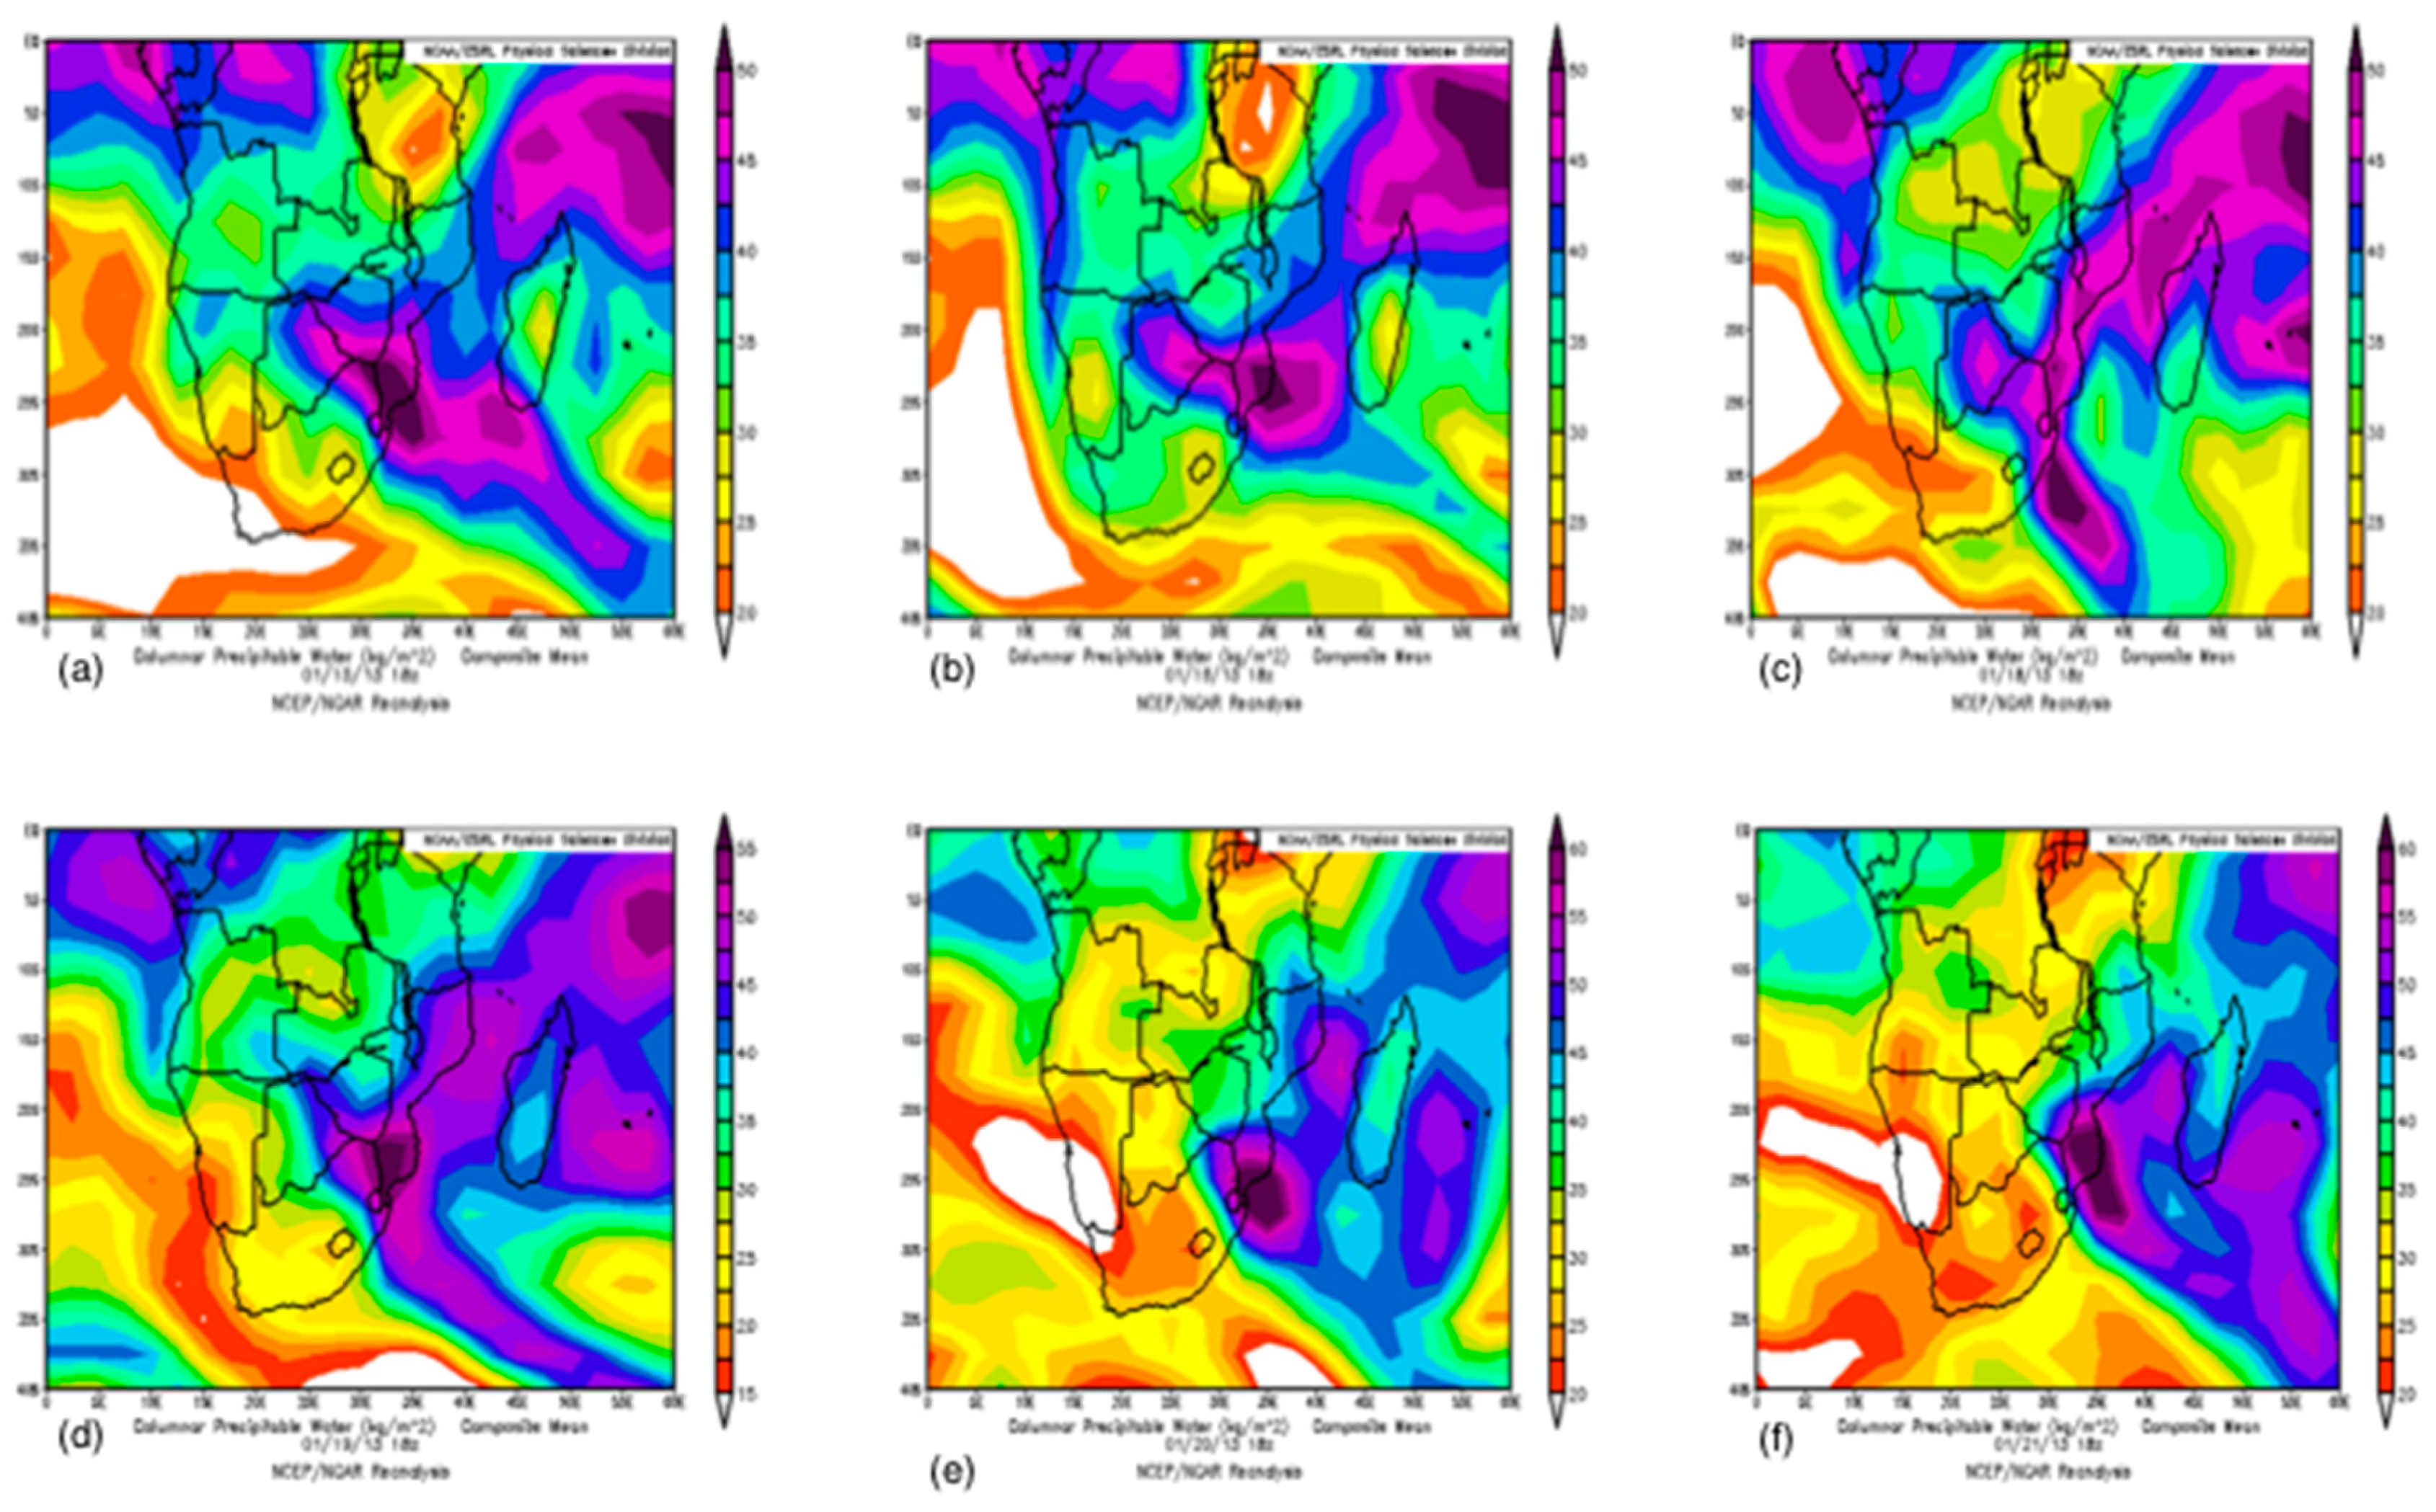
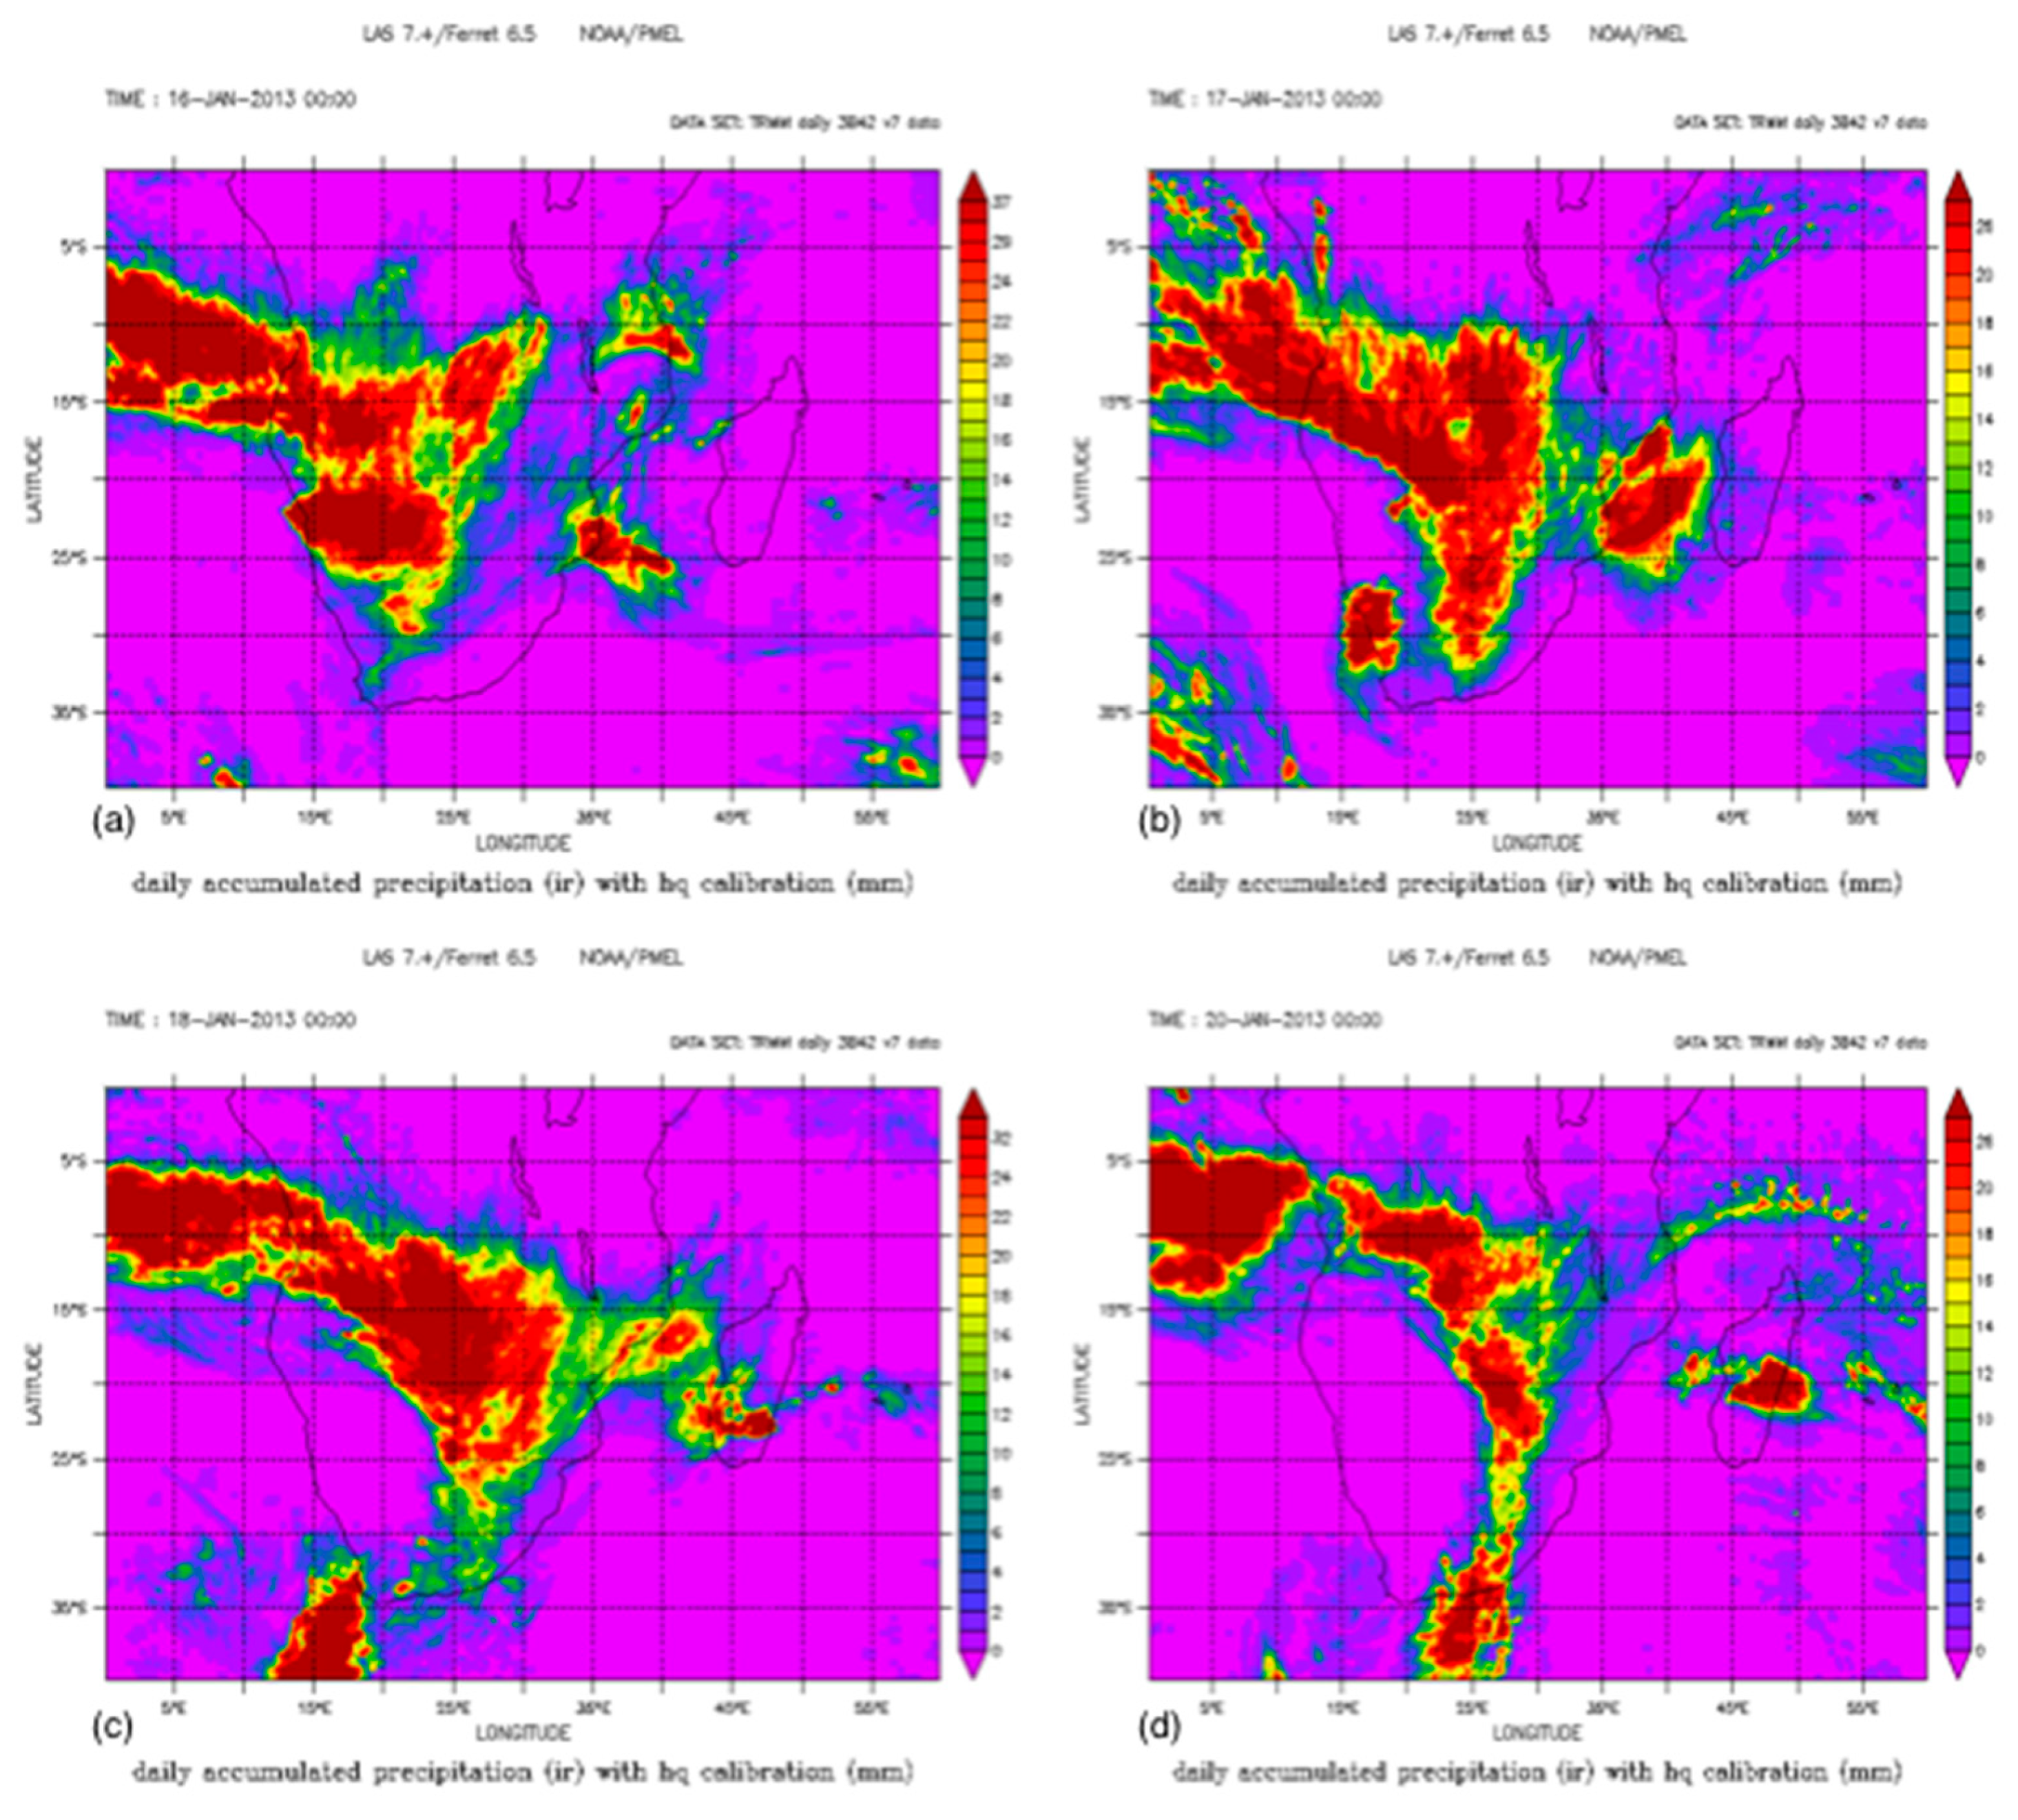
Finally, it is also important to look at the precipitation field (Figure 11 and Figure 12) over the study period. Figure 11 shows surface precipitable water from NCEP/NCAR between 15 and 21 January, whereas Figure 12 shows TRMM daily accumulated precipitation between 16 and 20 January respectively. Deep precipitation cells are observed over the upper west corner and the eastern part of the domain (Figure 11), where precipitation maximum reaches up to 50 kg m−2. However, the amount decreases on 20 January (Figure 11e) but peaks the following day. Comparison between Figure 10 and Figure 11 shows that precipitation lies within cloudy areas on the satellite imagery. Notwithstanding, the TRMM plot (Figure 12) shows a slightly different pattern in precipitation, even for the same days in Figure 11. There is more precipitation (deep convection) reaching over 37 mm, from the Atlantic Ocean across the central-to-the south of the landmass, compared to the surface precipitable water. Precipitable water is often used to determine atmospheric moisture content; it is the total water mass contained in a vertical atmospheric column, if all the water vapor condenses. Values of precipitable water above 20 mm indicate a tropical system. Most parts of the oceanic areas have less precipitation than the landmass. Few cloud cover over some precipitation areas may be related to a reduction in cloud lifetime with the more rapid cycling of water over the mainland, especially due to the surface temperatures and boundary layer winds being higher.
Synoptic features controlling airflow and precipitation include convergence zones superimposed upon regional factors (e.g., topography, maritime air). Convective development over most of Africa extends much further south, and is partially caused by the ITCZ and other factors. The major oceanographic feature of the SWIO is the warm Agulhus Current that flows along the east and south coasts of South Africa and is the most intense western boundary current in the Southern Hemisphere [15]. Common weather phenomena include amongst others, the northeast and southeast monsoons and the southwesterly humid air from the Congo [68].
Analyses of atmospheric patterns described above, and circulations associated with the extreme rains observed over land suggest that they were associated, or linked with a number of systems, particularly TTTs and strong westerly moisture fluxes from the tropical South East Atlantic Ocean. Substantial positive (negative) temperature anomalies in some places could also have contributed to the regional instabilities during January. The low-level moisture flux, particularly from the Atlantic Ocean plays an important role in strengthening the Angolan low source region of the TTTs, which in turn contributes to strengthen the SICZ [41]. Results indicate that there is a positive correlation between the rainfall totals and variability and the presence of MCSs over southern east Africa. In addition, also noteworthy is the possible connection between the African easterly jet (AEJ) stream and the cold Benguela Current in the west, which contributes to moisture convergence and lifespan of moisture flux. To assess the synoptic scale such as heavy rainfall potential, there must be a clear association between large scale forcing mechanism (e.g., jet streams, troughs etc.) and convection. Although these may not initiate convective heavy rainfall, they may help to promote moisture transport, affect temperature and wind shear. Although this is not a modeling study, we assess this at relatively smaller picture by performing meso analyses of brightness temperature, surface pressure, wind and precipitable water estimate from satellite and reanalysis data. This also helps in identifying surface boundaries, convergence zones and their relationship to changing moisture fields. Integrated analysis can help to assess the possible causes of convective precipitation and enhance the ability to for feature forecasts and/or mitigation measures. Reanalysis data also provides a more consistent estimate of the earth systems as the data is assimilated from multiple sources and numerical model predictions to produce a continually updated, gridded data set at different points in space and time.
One limitation of this study, however, is due to unavailability of data and resources over southern Africa. It should be emphasized that results presented here are based on a limited time and sample portion. A much longer study period would be required to conduct thorough research and/or acquire more data to enable one to make a detailed analysis of MCSs. Additionally, there is still limited research over Africa in general, and not enough data archived. Subsequent work may be required to focus on the contributions of these systems in the seasonal rainfall, as well as outlining the synoptic and mesoscale features that are important for their initiation and evolution, or a link with the AEJ stream with respect to rainfall over southern Africa.

6. Conclusions

Southern Africa is an austral summer rainfall region, with exception of the small winter rainfall area in the southwest, and a narrow all-year rainfall zone along the south coast [4]. The Indian Ocean is the primary source of moisture in summer, together with the southward penetration of the ITCZ that plays a significant role in the production of rainfall [69]. However, the long-term precipitation changes in both the northern and southern regions of Africa are linked to the monsoon circulations and thought to be governed by precessional variations in summer insolation ([70], and reference therein). This study discussed a rainfall event over southern Africa in January 2013, focusing particularly on the period 15–20 January. It attempts to contribute towards the knowledge of MCSs and their influence on the heavy rainfall events over tropical southern Africa. There are very few studies of MCSs over southern Africa, compared to other places around the world, despite the frequent occurrence of these systems.
These systems are predominantly an austral summer phenomenon (Blamey and Reason 2012). They tend to cluster in preferred locations, particularly along the eastern regions adjacent to the warm waters of the Mozambique Channel and Agulhas Current and sometimes move westwards into the mainland. One potential mechanism for their propagation and distribution is through gravity waves driven by diurnal heating over the elevated terrain [71].
Since the frequency of heavy rainfall events appears to be increasing, sometimes leading to loss of life and destruction to infrastructure and high over flows above the alert level, it is therefore important to understand the atmospheric patterns associated with these events and their potential forcing mechanisms for forecasting and mitigation purposes. The heavy rainfall received across the subcontinent suggests that the MCV caused the heavy rainfall as shown in the results. For example, 2013 was significantly wetter than other years during that decade.

Author Contributions

M.W. had the original idea for the study and carried out the design and manuscript drafting. K.M.M. helped with acquisition of statistical rainfall data from DMS and helped in the manuscript revising and editing. Both authors read and approved the final manuscript.

Acknowledgments

The authors acknowledge the Department of Meteorological Services (DMS) for providing with rainfall data used in the study. Thanks also to NOAA/NCEP and Dundee datasets for providing data in their websites: https://www.esrl.noaa.gov/psd/data/composites/hour/ and http://www.sat.dundee.ac.uk. We thank the anonymous reviewers for their careful reading of our manuscript and their many insightful comments and suggestions.

Conflicts of Interest

The authors declare no conflict of interest.

References

  1. Hulme, M.; Doherty, R.; Ngara, T.; New, M.; Lister, D. African climate change: 1900–2100. Clim. Res. 2001, 17, 145–168. [Google Scholar] [CrossRef]
  2. Jury, M.R. Climate trends in southern Africa. South Afr. J. Sci. 2013, 109, 1–2. [Google Scholar] [CrossRef]
  3. Usman, M.; Reason, C.J.C. Dry spell frequencies and their variability over southern Africa. Clim. Res. 2004, 26, 199–211. [Google Scholar] [CrossRef] [Green Version]
  4. Bellprat, O.; Lott, F.C.; Guliza, C.; Parker, H.R.; Pampuch, L.A.; Pinto, I.; Ciavarella, A.; Stott, P.A. Unusual past dry and wet rainy seasons over Southern Africa and South America from a climate perspective. Weather and Climate Extremes. Weather Clim. Extremes 2015, 9, 36–46. [Google Scholar] [CrossRef]
  5. Blamey, R.C.; Reason, C.J.C. Mesoscale Convective Complexes over southern Africa. J. Clim. 2012, 25, 753–766. [Google Scholar] [CrossRef]
  6. World Meteorological Organization. (WMO-No. 1147). The Climate in Africa: 2013. 2015. Available online: http://www.wmo.int/pages/prog/wcp/wcdmp/documents/1147_EN.pdf. (accessed on 15 August 2018).
  7. Lyon, B.; Mason, S.J. The 1997–98 Summer Rainfall Season in Southern Africa. Part I: Observations. J. Clim. 2006, 20, 5134–5148. [Google Scholar] [CrossRef]
  8. Dyson, L.L.; van Heerden, J. A model for the identification of tropical weather systems over South Africa. Water SA 2002, 28, 249–258. [Google Scholar] [CrossRef]
  9. Fauchereau, N.; Trzaska, S.; Rouault, M.; Richard, Y. Rainfall Variability and Changes in Southern Africa during the 20th Century in the Global Warming Context. Nat. Hazards 2002, 29, 139–154. [Google Scholar] [CrossRef]
  10. Dyson, L.L.; van Heerden, J. The heavy rainfall and floods over the north-eastern interior of South Africa during February 2000. S. Afr. J. Sci. 2001, 97, 80–86. [Google Scholar]
  11. Triegardt, D.O.; Van Heerden, J.; Steyn, P.C.L. Anomalous Precipitation and Floods During February 1988; Technical Paper No. 23; South African Weather Service: Pretoria, South Africa, 1988. [Google Scholar]
  12. Shulze, R.; Meigh, J.; Horan, M. Present and potential future vulnerability of Eastern and Southern Africa hydrology and water resources. South Afr. J. Sci. 2001, 67, 150–160. [Google Scholar]
  13. Washington, R.; Preston, A. Extreme wet year over southern Africa: Role of Indian Ocean sea surface temperatures. J. Geophys. Res. 2006, 111, D15104. [Google Scholar] [CrossRef]
  14. Zipser, E.J. Use of a Conceptual Model of the Life Cycle of Mesoscale Convective Systems to Improve Very-Short-Range Forecasts. In Nowcasting (191-204); Browning, K.A., Ed.; Academic Press: New York, NY, USA, 1982; pp. 191–204. [Google Scholar]
  15. Buque, S.L.M. A Study of Heavy Rainfall Events During The 2006/2007 Southern Africa Summer. 2007. Available online: https://www.wmo.int/pages/prog/www/DPFS/Reports/Buque%20Case%20Study2006-2007pdf.pdf (accessed on 10 May 2019).
  16. Houze, R.A., Jr. Mesoscale convective systems. Rev. Geophys. 2004, 42, RG4003. [Google Scholar] [CrossRef]
  17. Trismidianto, Y.E.; Satyawardhana, H.; Nugroho, J.T.; Ishida, S. The Contribution of the Mesoscale Convective Complexes (MCCs) to total rainfall over Indonesian Maritime Continent. IOP Conf. Ser. Earth Environ. Sci. 2017, 54, 012027. [Google Scholar] [CrossRef] [Green Version]
  18. Houze, R.A., Jr.; Chen, S.S.; Kingsmill, D.E.; Serra, Y.; Yuter, S.E. Convection over the Pacific Warm Pool in relation to the Atmospheric Kelvin-Rossby Wave. J. Atmos. Sci. 2000, 57, 3058–3089. [Google Scholar] [CrossRef]
  19. Nakazawa, T. Tropical Super Clusters within Intraseasonal Variations over the Western Pacific. J. Meteorol. Soc. Jpn. 1988, 66, 823–839. [Google Scholar] [CrossRef] [Green Version]
  20. Cotton, W.R.; Bryan, G.; van den Heever, S.C. Chapter 9: Mesoscale Convective Systems. Int. Geophys. 2011, 99, 455–526. [Google Scholar]
  21. Yang, X.; Fei, J.; Huang, X.; Cheng, X. Characteristics of Mesoscale Convective Systems over China and Its Vicinity Using Geostationary Satellite FY2. J. Clim. 2015, 28, 4890–4907. [Google Scholar] [CrossRef]
  22. Feng, Z.; Leung, L.R.; Houze, R.A., Jr.; Hagos, S.; Hardin, J.; Yang, Q.; Han, B.; Fan, J. Structure and Evolution of Mesoscale Convective Systems: Sensitivity to Cloud Microphysics in Convection-Permitting Simulations Ovre the United States. J. Adv. Model. Earth Syst. 2018, 10. [Google Scholar] [CrossRef]
  23. Huang, X.; Hu, C.; Huang, X.; Chu, Y.; Tseng, Y.; Zhang, G.J.; Lin, Y. A long-term tropical mesoscale convective systems dataset based on a novel objective automatic algorithm. Clim. Dyn. 2018. [Google Scholar] [CrossRef]
  24. Conzemius, R.J.; Moore, R.W.; Montgomery, M.T.; Davis, C.A. Mesoscale Covective Vortex Formation in a Weakly Sheared Moist Neutral Environment. J. Atmos. Sci. 2016. [Google Scholar] [CrossRef]
  25. Laing, A.G.; Fritsch, J.M.; Negri, A.J. Contribution of Mesoscale Convective Complexes to Rainfall in Sahelian Africa: Estimates from Geostationary Infrared and Passive Microwave Data. J. Appl. Meteorol. 1999, 38, 957–964. [Google Scholar] [CrossRef]
  26. Laurent, H.; D’Amato, N.; Lebel, T. How important is the contribution of mesoscale convective complexes to the Sahelian rainfall. Phys. Chem. Earth 1998, 23, 629–633. [Google Scholar] [CrossRef]
  27. Mathon, V.; Laurent, H.; Lebel, T. Mesoscale convective system rainfall in the Sahel. J. Appl. Meteor. 2002, 41, 1081–1092. [Google Scholar] [CrossRef]
  28. Sall, A.M.; Sauvagoet, H.; Gaye, A.T.; Viltard, A.; Felice, P. Acyclogenesis index for tropical Atlantic off the African coast. Atmos. Res. 2005, 79, 123–147. [Google Scholar] [CrossRef]
  29. Rohbein, A.; Ambrizzi, T.; Mechoso, C.R. Mesoscale convective systems over the Amazon basin. Part I: climatological aspects. Int. J. Climatol. 2017, 38. [Google Scholar] [CrossRef]
  30. Ziegler, C.L. Issues in forecasting mesoscale convective systems: An observational and modelling perspective. In Proceedings of the Symposium on the Challenges of Severe Convective Storms, Orlando, FL, USA, 11–15 September 2000; Pielke, R.A., Jr., Pielke, R.A., Sr., Eds.; Routledge: London, UK, 2000; pp. 26–42. [Google Scholar]
  31. Brooks, H.E.; Lee, J.W.; Craven, J.P. The spatial distribution of severe thunderstorm and tornado environments from global reanalysis data. Atmos Res. 2003, 67–68, 73–94. [Google Scholar] [CrossRef]
  32. Zipser, E.J.; Cecil, D.J.; Liu, C.; Nesbitt, S.W.; Yorty, D.P. Where are the most intense thunderstorms on Earth? Bull. Am. Meteor. Soc. 2006, 87, 1057–1071. [Google Scholar] [CrossRef]
  33. Maddox, R.A. Mesoscale convective complexes. Bull. Am. Meteor. Soc. 1980, 61, 1374–1387. [Google Scholar] [CrossRef]
  34. Laing, A.G.; Fritsch, J.M. The large-scale environments of the global populations of mesoscale convective complexes. Mon. Wea. Rev. 2000, 128, 2756–2776. [Google Scholar] [CrossRef]
  35. Laing, A.G.; Fritsch, J.M. The global population of mesoscale convective complexes. Quart. J. Roy. Meteor. Soc. 1997, 123, 389–405. [Google Scholar] [CrossRef]
  36. Blamey, R.C.; Reason, C.J.C. Numerical simulation of a mesoscale convective system over the east coast of South Africa. Tellus 2009, 61A, 17–34. [Google Scholar] [CrossRef]
  37. Velasco, I.; Fritsch, J.M. Mesoscale convective complexes in the Americas. J. Geophys. Res. 1987, 92, 9591–9613. [Google Scholar] [CrossRef]
  38. Singleton, A.T.; Reason, C.J.C. Numerical simulations of a severe rainfall event over the Eastern Cape coast of South Africa: Sensitivity to sea surface temperature and topography. Tellus 2006, 58A, 355–367. [Google Scholar]
  39. Singleton, A.T.; Reason, C.J.C. A numerical model study of an intense cutoff low-pressure system over South Africa. Mon. Wea. Rev. 2007, 135, 1128–1150. [Google Scholar] [CrossRef]
  40. Washington, R.; Todd, M.C. Tropical-temperate links in southern Africa and southwest Indian Ocean satellite-derived daily rainfall. Int. J. Climatol. 1999, 19, 1601–1616. [Google Scholar] [CrossRef]
  41. Manhique, A.J.; Reason, C.J.C.; Silinto, B.; Zucula, J.; Raiva, I.; Congolo, F.; Mavume, A.F. Extreme rainfall and floods in southern Africa in January 2013 and associated circulations. Nat. Hazards 2015, 77, 679–691. [Google Scholar] [CrossRef]
  42. Harrison, M.S.J. A generalized classification of South African rain-bearing synoptic systems. Int. J. Climatol. 1984, 4, 547–560. [Google Scholar] [CrossRef]
  43. Todd, M.C.; Palmer, P.I. Water vapour transport associated with tropical-temperate trough systems over southern Africa and the southwest Indian Ocean. Int. J. Climatol. 2004, 24, 555–568. [Google Scholar] [CrossRef]
  44. Hart, N.C.G.; Reason, C.J.C.; Faucereau, N. Tropical-extratropical interactions over southern Africa: Three cases of heavy summer season rainfall. Mon. Wea. Rev. 2010, 138, 2608–2623. [Google Scholar] [CrossRef]
  45. Reason, C.J.C.; Keibel, A. Tropical Cyclone Eline and its unusual penetration and impacts over the southern African mainland. Wea. Forecast. 2004, 19, 789–805. [Google Scholar] [CrossRef]
  46. Cook, K.H. The South Indian convergence zone and interannual rainfall variability over southern Africa. J. Clim. 2000, 13, 3789–3804. [Google Scholar] [CrossRef]
  47. Funk, T. Heavy Convective Rainfall Forecasting: A Comprehensive Look at Parameters, Processes, Patterns and Rules of Thumb. 2003. Available online: ttps://www.weather.gov/media/lmk/soo/heavy_rainfall_forecasting.pdf. (accessed on 10 May 2019).
  48. Hanlon, J. Serious floods in southern Mozambique. 2015. Available online: https://www.open.ac.uk/...ac.../Mozambique_211_floods%20-%2024Jan2013.pdf. (accessed on 10 May 2019).
  49. Mosase, E.; Ahiablame, L. Rainfall and Temperature in the Limpopo River Basin, Southern Africa: Means, Variations, and Trends form 1979 to 2013. Water 2018, 10, 364. [Google Scholar] [CrossRef]
  50. Schmid, J. The SEVIRI Instrument. In Proceedings of the 2000 EUMETSAT Meteorological Satellite. Data User’s Conference, Bologna, Italy, 29 May–2 June 2000; EUMETSAT: Darmstadt, Germany, 2000; pp. 13–32. [Google Scholar]
  51. Carvalho, L.M.V.; Jones, C. A satellite method to identify structural properties of mesoscale convective systems based on the maximum spatial correlation tracking technique (MASCOTTE). J. Appl. Meteor. 2001, 40, 1683–1701. [Google Scholar] [CrossRef]
  52. Garcia-Herrera, E.; Hernandez, D.; Paredes, D.; Barriopedro, J.F.; Correoso, L.P. A MASCOTTE-based characterization of MCSs over Spain, 2000–2002. Atmos. Res. 2015, 73, 261–282. [Google Scholar] [CrossRef]
  53. Laing, A.G.; Fritsch, J.M. Mesoscale convective complexes in Africa. Mon. Wea. Rev. 1993, 121, 2254–2263. [Google Scholar] [CrossRef]
  54. Durkee, J.D.; Mote, T.L. A climatology of warm-season mesoscale convective complexes in subtropical South America. Int. J. Climatol. 2010, 30, 418–431. [Google Scholar] [CrossRef]
  55. Laing, A.G.; Carbone, R.E.; Levizzani, V. Cycles and Propagation of Deep Convection over Equatorial Africa. Mon. Wea. Rev. 2011, 139, 2832–2853. [Google Scholar] [CrossRef]
  56. Jasinski, I.W.; Pietrek, K.K.S. Hazardous Meteorological Phenomena Forecasting Using Remote Sensing Data and Products of numerical Weather Prediction Models. In Proceedings of the International Archives of the Photogrammetry, Remote Sensing and Spatial Information Sciences, Beijing, China, 3–11 July 2008. [Google Scholar]
  57. Driver, P.; Reason, C.J.C. Variability in the Botswana High and its relationships with rainfall and temperature characteristics over southern Africa. Int. J. Climatol. 2017, 37 (Suppl. 1), 570–581. [Google Scholar] [CrossRef]
  58. Laing, A.G.; Carbone, R.E.; Levizzani, V.; Tuttle, J. The propagation and diurnal cycles of deep convection in northern tropical Africa. QJR Meteorol. Soc. 2008, 134, 93–109. [Google Scholar] [CrossRef]
  59. Tucker, D.F.; Crook, N.A. The generation of a mesoscale convective system from mountain convection. Mon. Wea. Rev. 1999, 127, 1259–1273. [Google Scholar] [CrossRef]
  60. Tucker, D.F.; Crook, N.A. Favoured Regions of Convective Initiation in the Rocky Mountains. Available online: ams.confex.com/ams/pdfpapers/22784.pdf (accessed on 15 May 2019).
  61. Tucker, D.F.; Crook, N.A. Flow over Heated Terrain. Part II: Generation of Convective Precipitation. Mon. Wea. Rev. 2005, 133, 2565–2582. [Google Scholar] [CrossRef] [Green Version]
  62. Mphale, K.M.; Adedoyin, J.A.; Nkoni, G.; Ramaphane, G.; Wiston, M.; Chimidza, O. Analysis of temperature data over semi-arid Botswana: trends and break points. Meteorol. Atmos. Phys. 2017. [Google Scholar] [CrossRef]
  63. Poveda, G.; Waylen, P.R.; Pulwarty, R.S. Annual and inter-annual variability of the present climate in northern South America and southern Mesamerica. Paleoclimatol. Paleoclimatol. Paleoclimatol. 2006, 234, 3–27. [Google Scholar] [CrossRef]
  64. Mohr, K.I.; Molinari, J.; Thorncroft, C.D. The Interannual Stability of Cumulative Frequency Distributions for Convective System Size and Intensity. J. Clim. 2009, 22, 5218–5231. [Google Scholar] [CrossRef]
  65. Sorooshian, A.; Feingold, G.; Lebsock, M.D.; Jiang, H.; Stephens, G.L. On the precipitation susceptibility of clouds to aerosol perturbations. Geophys. Res. Lett. 2009, 36, L13803. [Google Scholar] [CrossRef]
  66. Diaz, J.P.; González, A.; Expósito, F.J.; Pérez, J.C.; Fernández, J.; Garcia-Díezal, M.; Taima, D. WRF-multi-physics simulation of clouds in the African region. QJR Meteorol. Soc. 2015. [Google Scholar] [CrossRef]
  67. Klein, S.A.; Hartman, D.L. The Seasonal Cycle of Low Stratiform Clouds. J. Clim. 1993, 6, 1587–1606. [Google Scholar] [CrossRef] [Green Version]
  68. Nicholson, S.E. A Review of Climate Dynamics and Climate Variability in Eastern Africa. In The Limnology, Climatology and Paleoclimatology of the East African Lakes; Johnson, T.C., Odada, E.O., Eds.; Gordon and Breach: Amsterdam, The Netherlands, 1996; pp. 25–56. [Google Scholar]
  69. Dyson, L.L. A heavy rainfall sounding climatology over Gauteng, South Africa, using self-organizing maps. Clim. Dynamics 2015, 45, 3051–3065. [Google Scholar] [CrossRef]
  70. Schefub, E.; Schouten, S.; Schneider, R. Climatic controls on central African hydrology during the past 200, 000 years. Nat. Publ. Group 2005, 437. [Google Scholar] [CrossRef]
  71. Mapes, B.E.; Warner, T.T.; Xu, M. Diurnal patterns of rainfall in northwestern South America. Part III: Diurnal gravity waves and nocturnal convection offshore. Mon. Wea. Rev. 2003, 131, 830–844. [Google Scholar] [CrossRef]
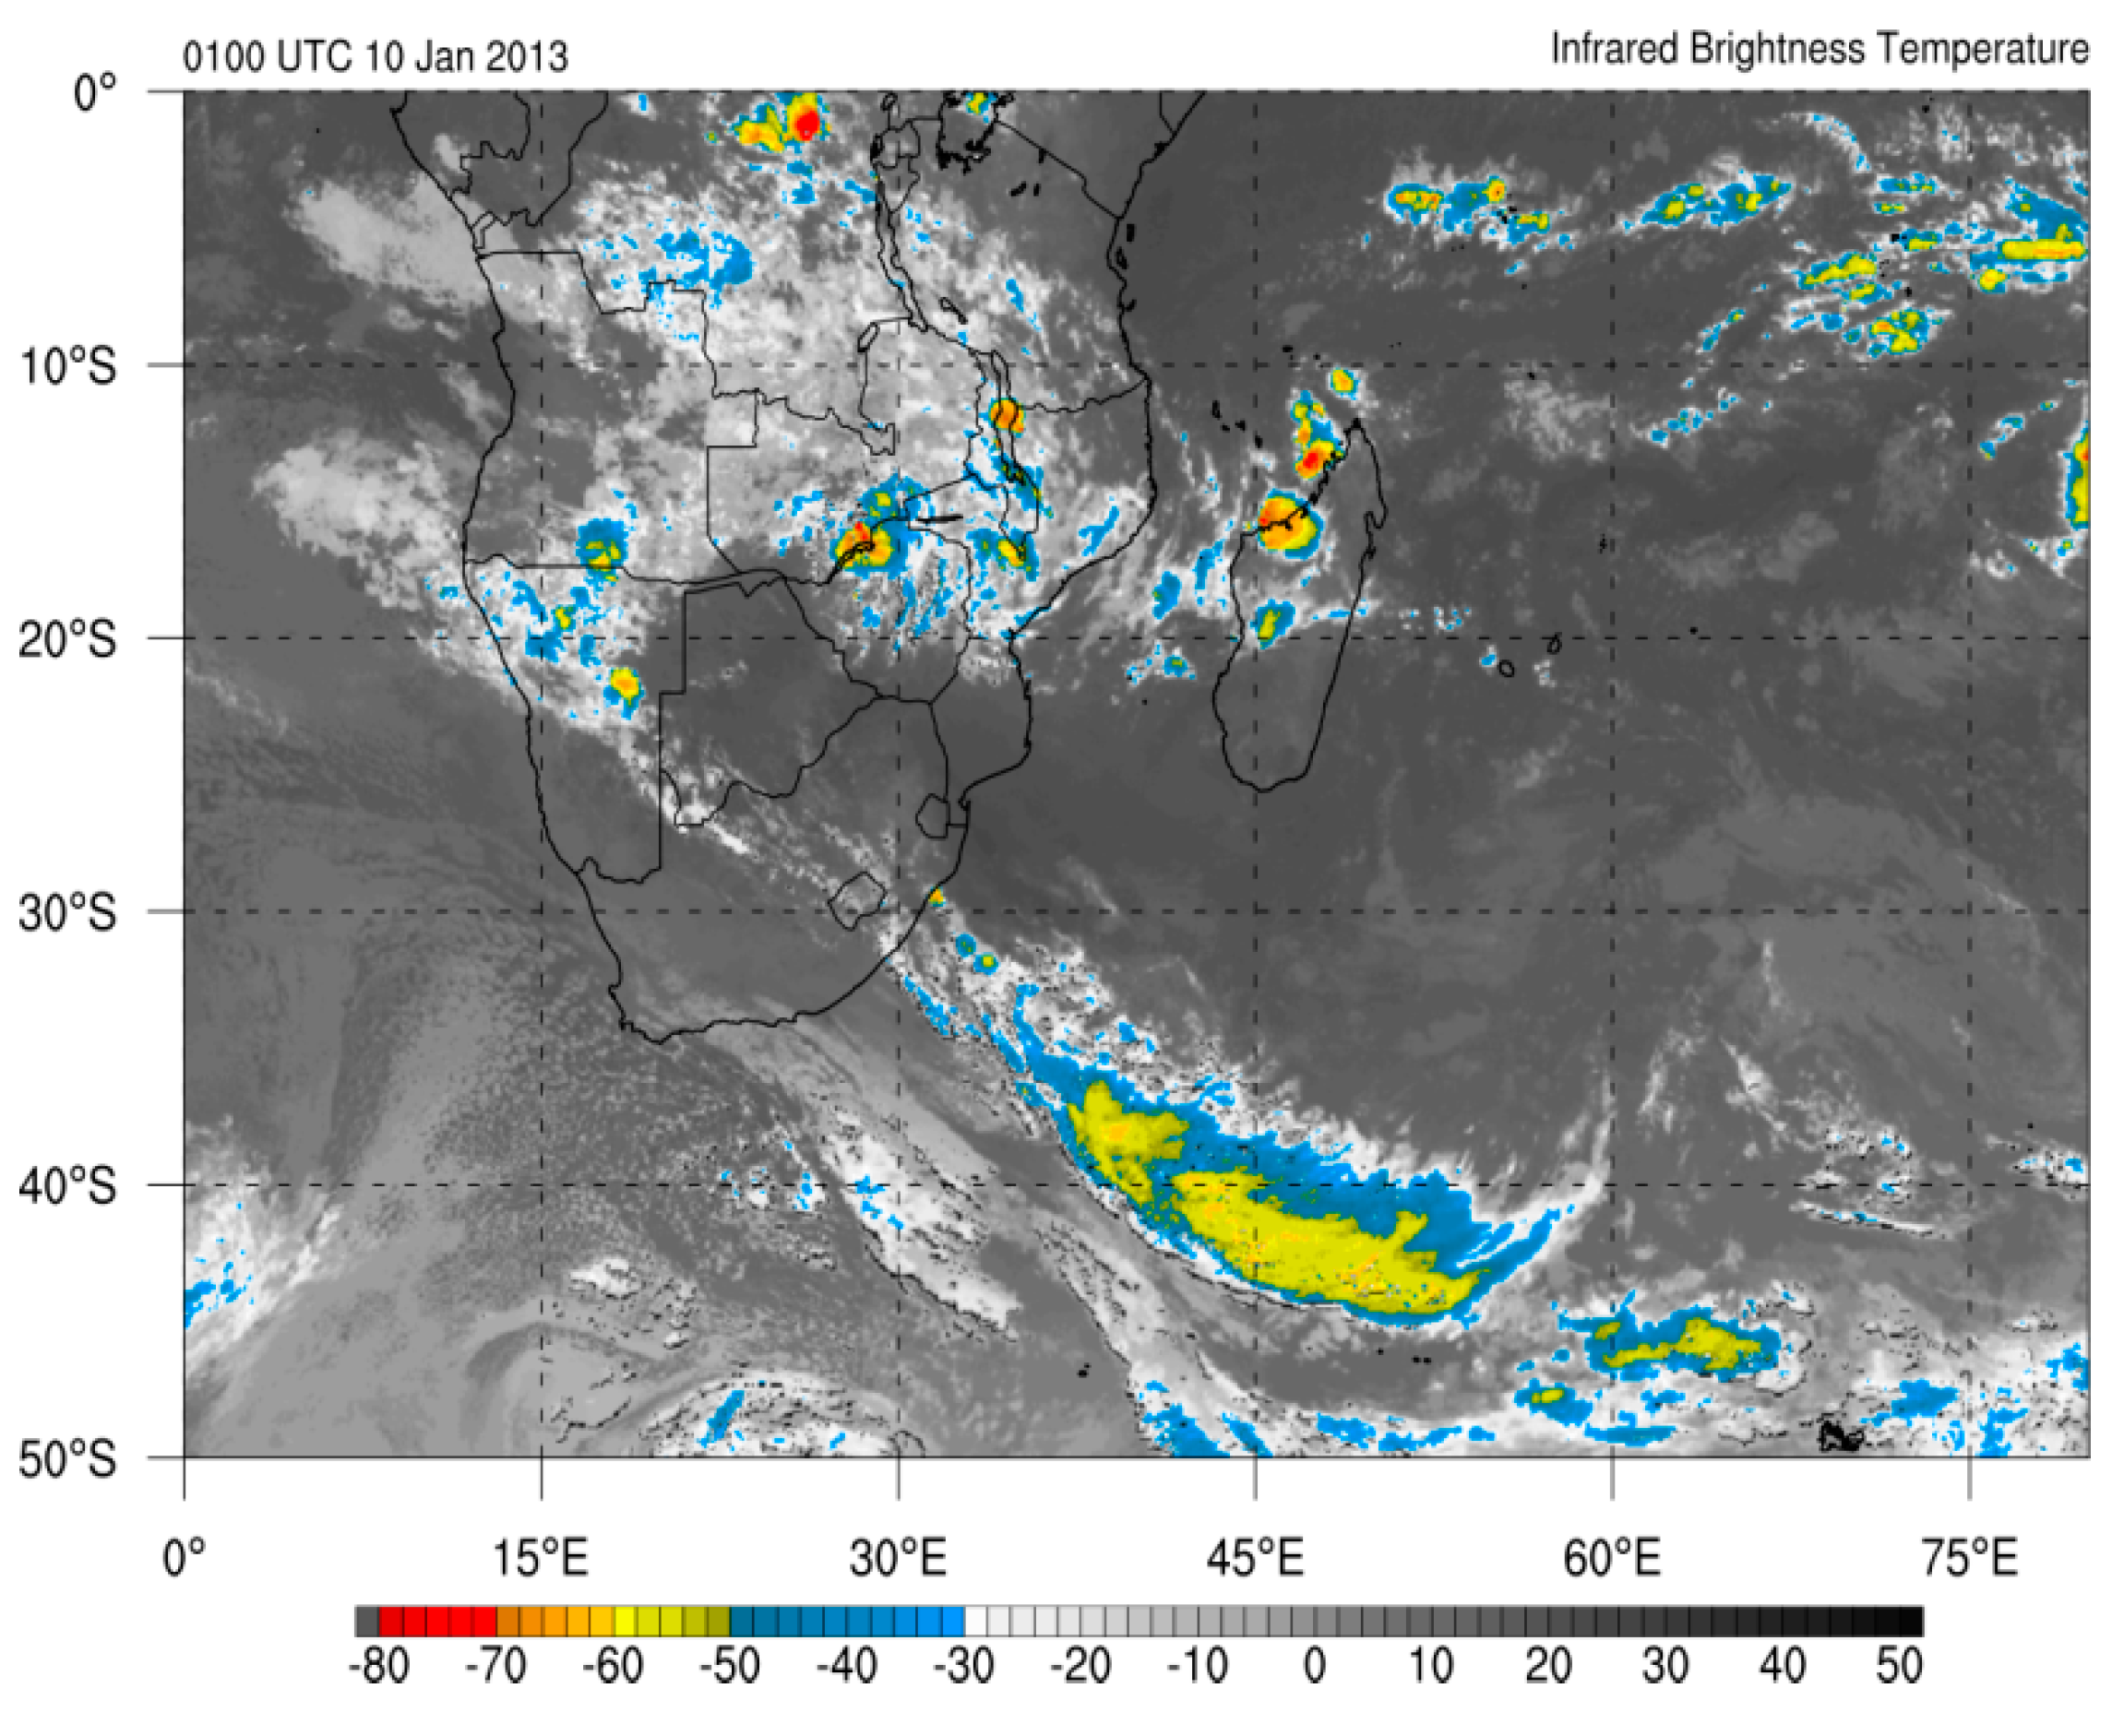
Figure 1. Infrared brightness temperature (°C) over southern Africa on 10 January 2013. (http://www.atmos.albany.edu/student/papin/mapdisco/20130201/images/ir_africa.html).
Climate 07 00073 g001
Figure 2. Rainfall amount (mm) in Botswana over five stations between 2003, 2008 and 2013 (Source: DMS).
Climate 07 00073 g002
Figure 3. Monthly rainfall data (mm) in Botswana between 2012 (a), 2013 (b) and 2014 (c) for some selected stations.
Climate 07 00073 g003
Figure 4. Geopotential height anomalies (m) and mean sea level pressure (Pa) at 925 mb (a,c) and at 250 mb (b,d). (https://www.esrl.noaa.gov/psd/data/composites/hour/).
Climate 07 00073 g004
Figure 5. Southern Hemisphere geopotential height anomalies at 850 hPa.
Climate 07 00073 g005
Figure 6. National Center for Environmental Prediction/National Center for Atmospheric Research (NCEP/NCAR) re-analysis Omega at 500 mb (https://www.esrl.noaa.gov/psd/data/composites/hour/). Omega composites between 15 and 20 January 2013. Strongest negative anomalies can increase vertical shear favorable for formation of convection over land.
Climate 07 00073 g006
Figure 7. Outgoing longwave radiation (W m−2) (http://apdrc.soest.hawaii.edu/las/v6/constrain?var=16121). Outgoing longwave radiation over southern Africa on 10 (a), 15 (b) and 20 (c) January 2013.
Climate 07 00073 g007
Figure 8. Infrared (IR) brightness temperature (°C) (http://www.atmos.albany.edu/student/ppapin/mapdisco/20130201/images/ir_africa.html). Infrared brightness temperature over southern Africa on 15 (a), 17 (b), 19 (c) and 20 (d) January 2013.
Climate 07 00073 g008
Figure 9. NCEP/NCAR re-analysis 925-mb temperature (K) and wind (ms−1). Mean temperature (ac) and wind (df) over southern Africa.
Climate 07 00073 g009
Figure 10. Cloud imagery over southern Africa on 14 (a), 15 (b), 17 (c) and 20 (d) in January 2013. (http://www.sat.dundee.ac.uk).
Climate 07 00073 g010
Figure 11. NCEP/NCAR re-analysis surface precipitable water (kg m−2) at 925 mb (https://www.esrl.noaa.gov/psd/data/composites/hour/). Precipitable water composites on 15 (a), 16 (b), 18 (c), 19 (d), 20 (e) and 21(f) January 2013.
Climate 07 00073 g011
Figure 12. Tropical Rainfall Measuring Mission (TRMM) daily-accumulated precipitation (mm) (http://apdrc.soest.hawaii.edu/las/v6/constrain?var=16121). Accumulated daily precipitation on 16 (a), 17 (b), 18 (c) and 20 (d) over southern Africa in January 2013. In all the days, maximum precipitation is observed from west through central-to-south of the mainland.
Climate 07 00073 g012
Table 1. Summary of the floods reported over southern Africa during 2013. (Source: WMO, 2015).
CountryRainfall PatternImpacts Due to Flooding
BotswanaHeavy rains caused extensive flooding in the Central Province between 16–23 January At least 842 families (4210 people) affected. Torrential rains destroyed homes, road, livestock, livelihoods; flooded dams and fields.
MalawiHeavy rains recorded from mid December 2012 to mid January 2013; flooding in several districts, with Magochi District in the southern part being the most affected. Houses collapsed and roads rendered impassable; livestock and crops washed away. Total of 16,370 people affected; the country faced acute food shortage, exacerbating the situation for the flood-affected communities.
MozambiqueAuthorities declared an orange alert due to heavy rains on 12 January; another institutional alert declared on 22 January. At least 113 people killed and over 185,000 people temporarily displaced.
NamibiaHeavy rains and rising river levels in the Zambezi River catchment since early January, causing flooding in the Caprivi region. Community houses, infrastructure and crop fields were flooded. Up to 2500 families (11,000 people) evacuated.
ZambiaHeavy rains caused flooding from 17 January to 13 February, with Mumbwa District in the central province being the most affected. Agricultural fields, infrastructure and property were damaged and destroyed. Drinking water contaminated by floodwaters. About 1800 people affected.
MadagascarHeavy precipitation affected the central and south-western part around 15 FebruaryEight people killed, and 2146 people displaced or left homeless
La Réunion IslandA 1 h rainfall above 100 mm in a short time recorded at Fond du Sac on 13 February Houses and schools were flooded.