Characterization of Meteorological Droughts Occurrences in Côte d’Ivoire: Case of the Sassandra Watershed

Abstract
:1. Introduction
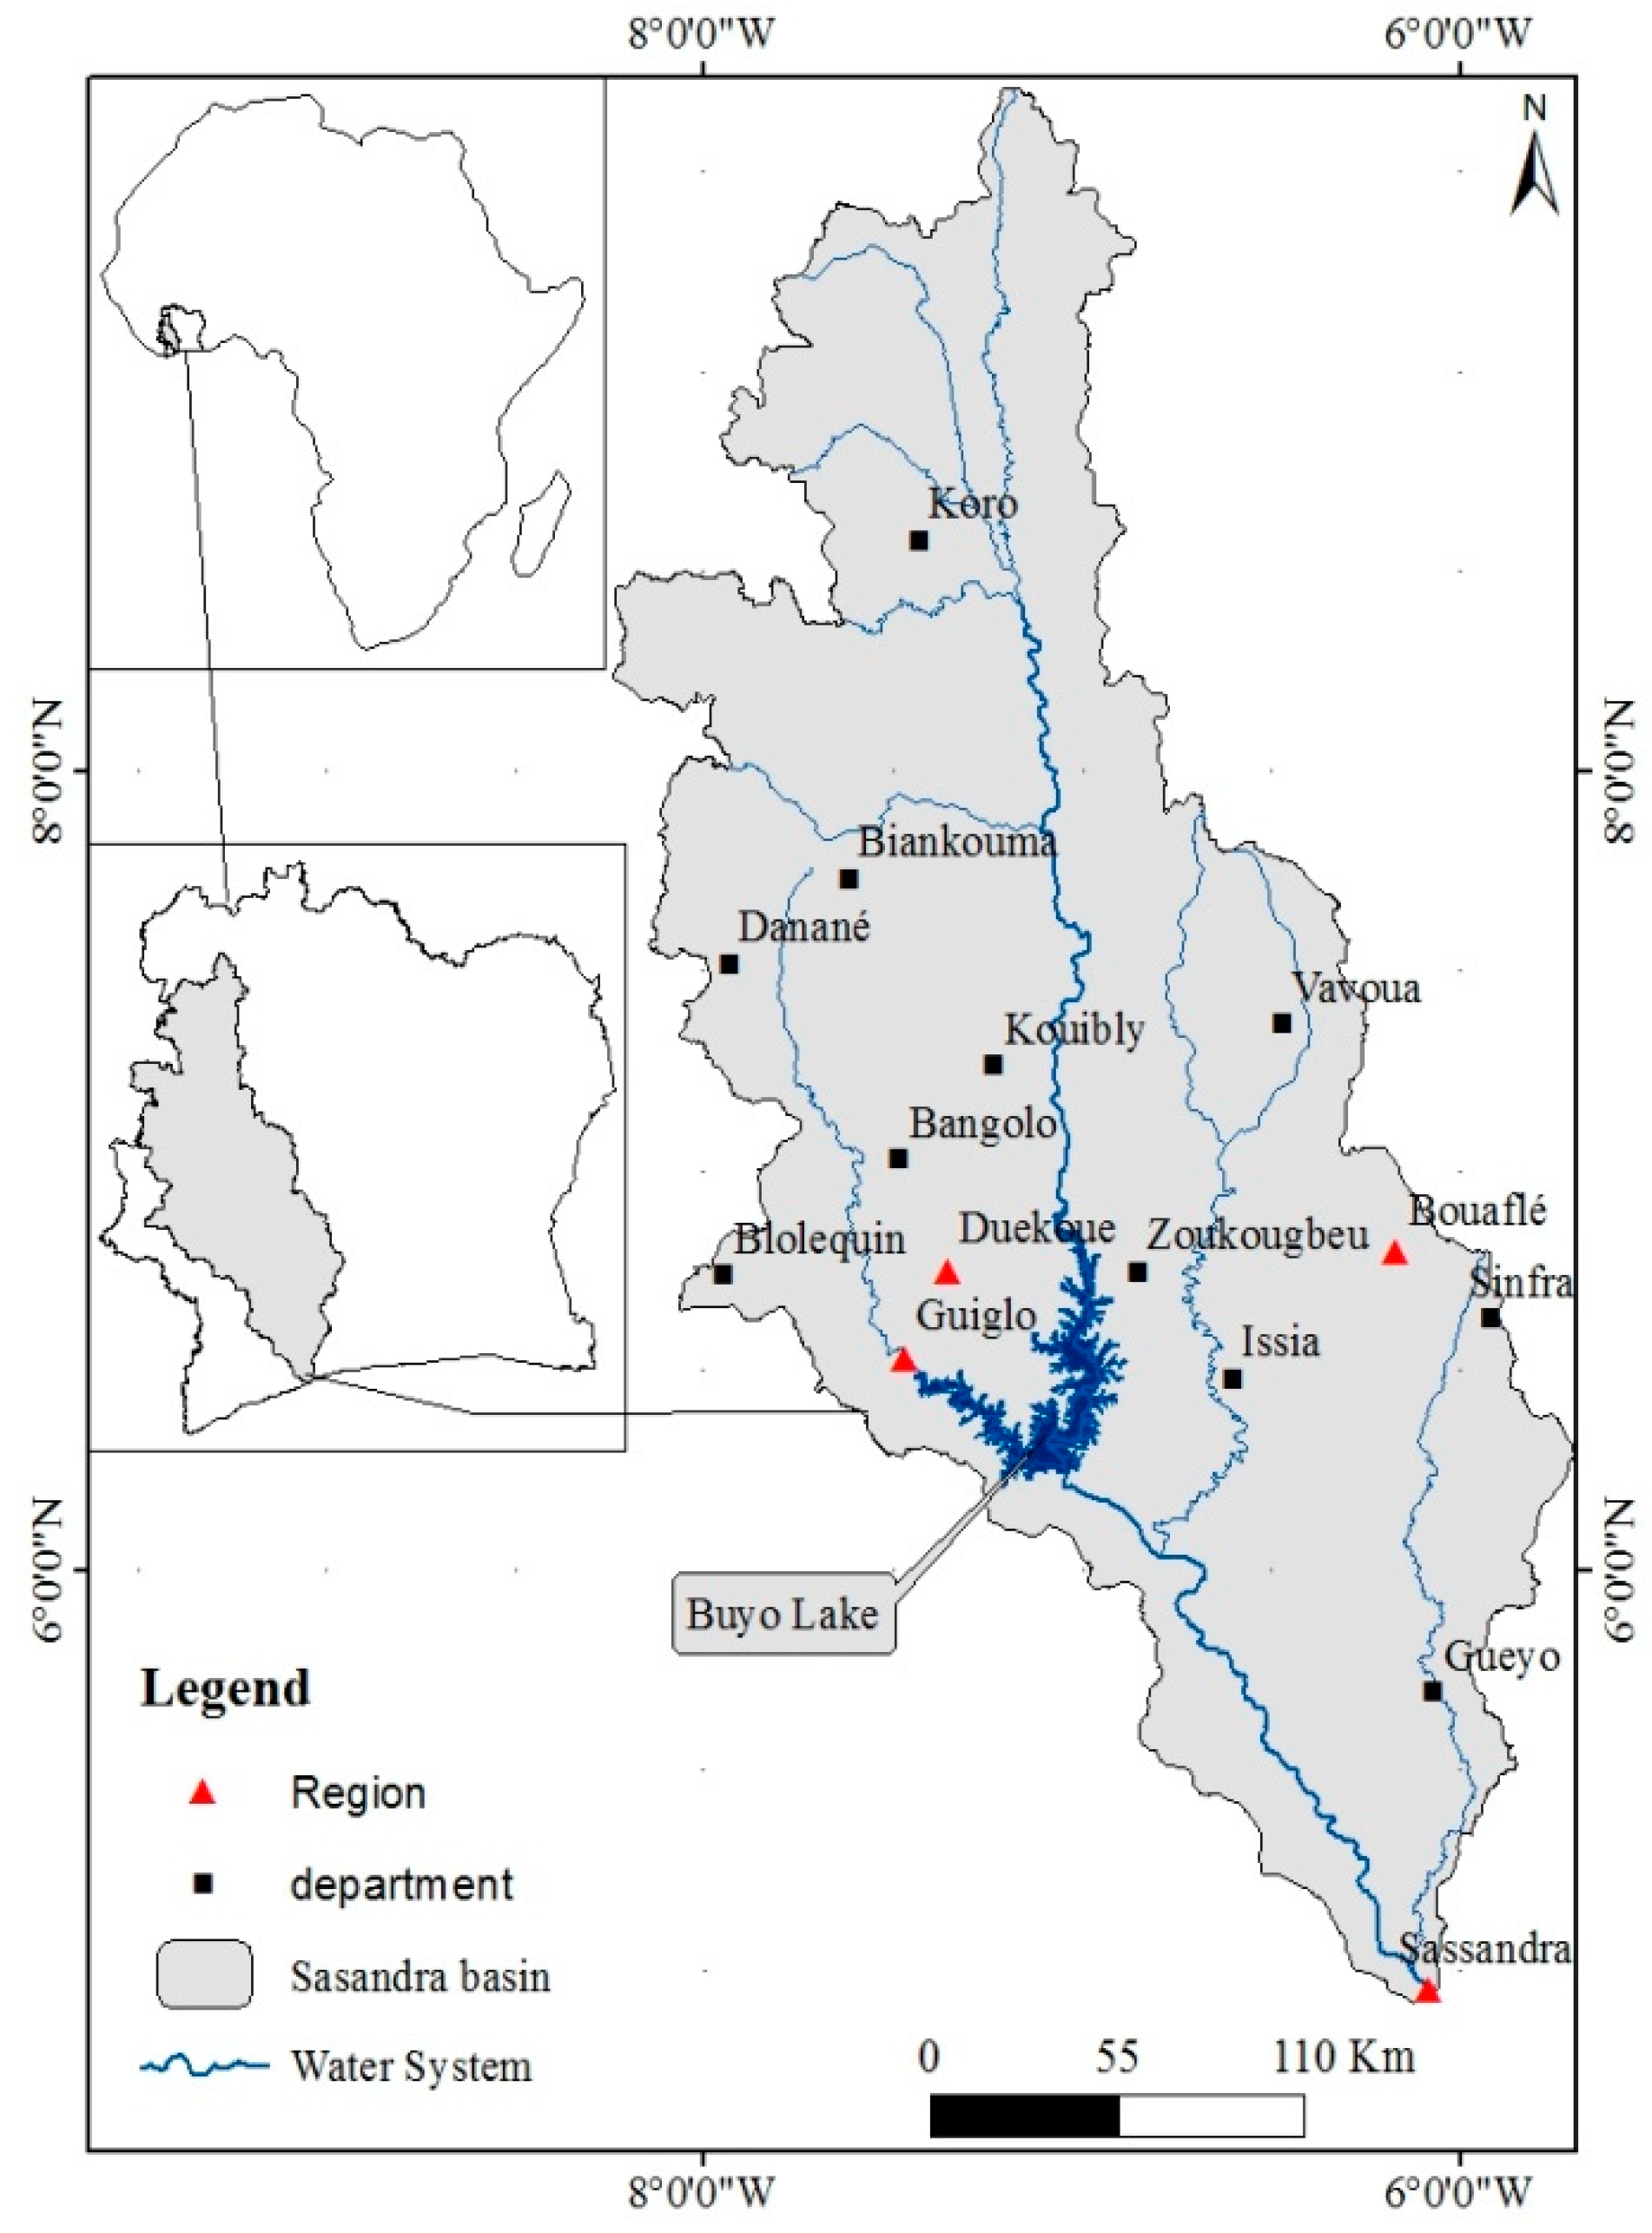
2. Study Area
3. Data and Methods
3.1. Historical Time Series Data
3.2. Methodology
3.2.1. Characterization of Meteorological Drought Sequences
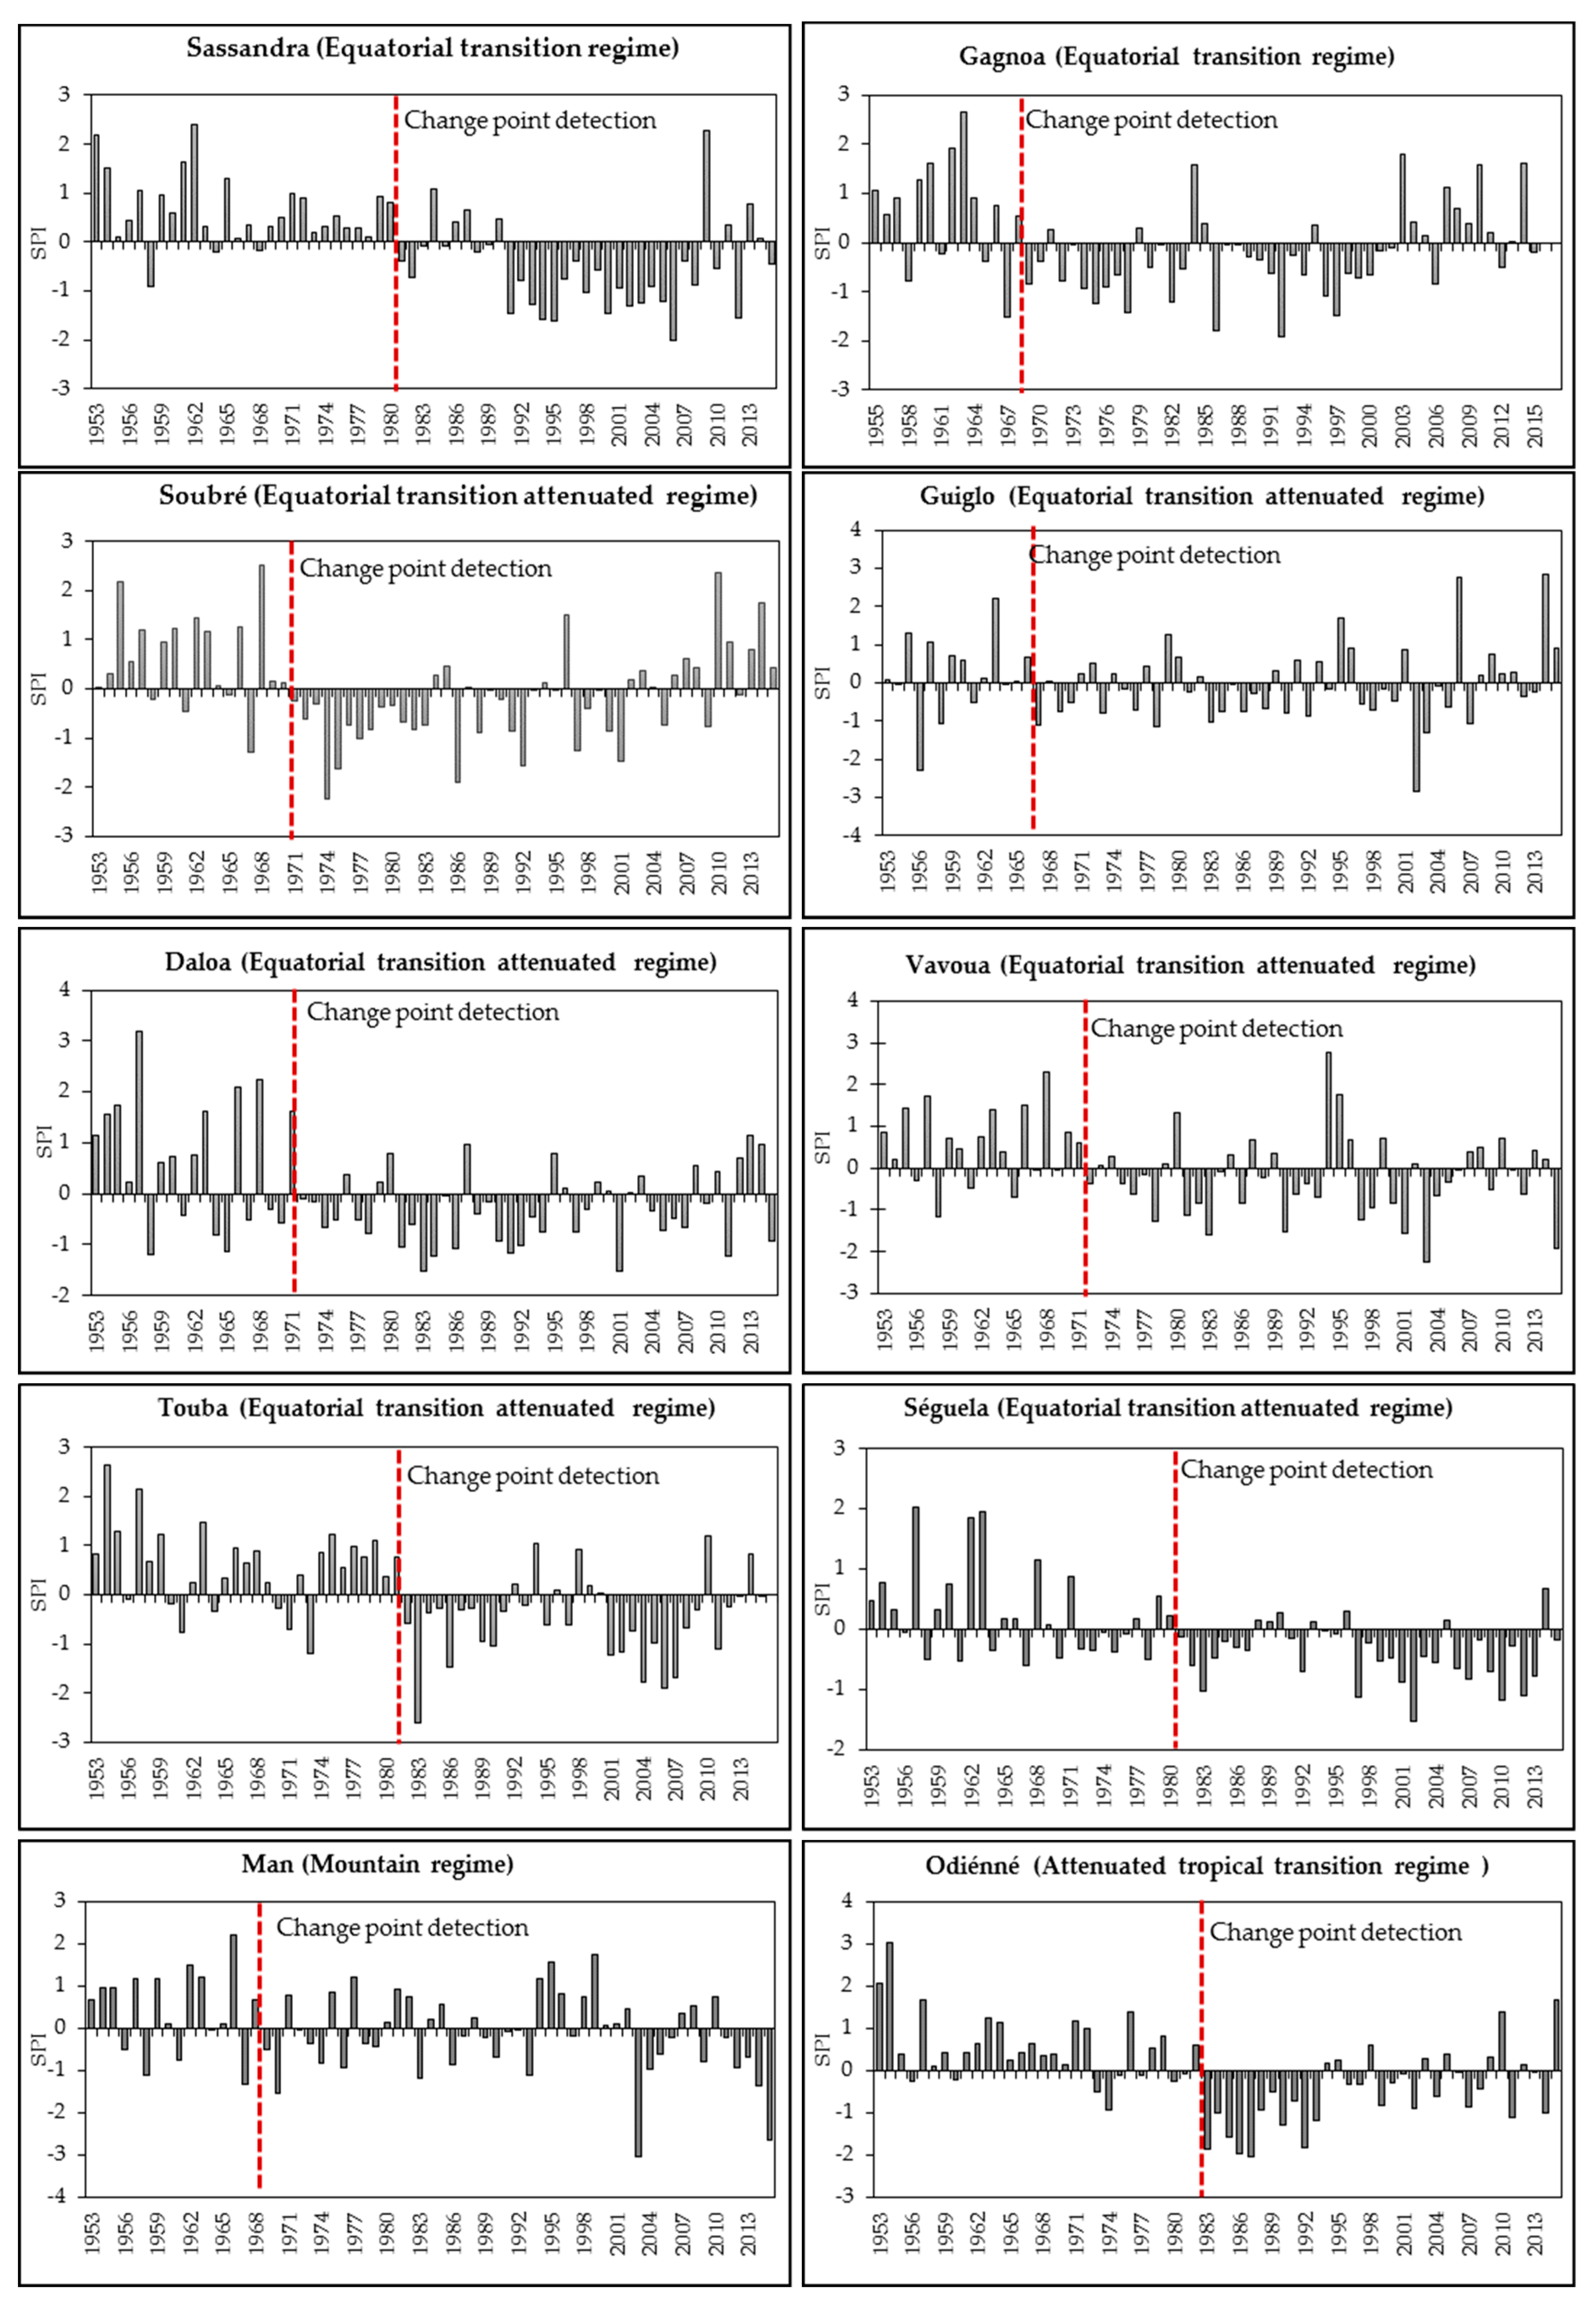
3.2.2. Time Series Change Detection
3.2.3. Characterization of Meteorological Droughts Occurrence by Markov Chains
P01 = pr(E(t + 1) = 1 | (E(t) = 0))
P10 = pr(E(t + 1) = 0 | (E(t) = 1))
P11 = pr(E(t + 1) = 1| (E(t) = 1))
4. Results
4.1. Analysis of Meteorological Drought Sequences
4.2. Intensity and Duration Parameter Analysis
4.3. Analysis of the Meteorological Droughts Occurrence
4.3.1. Transition States Probability of Markov Chains 1
4.3.2. Transition States Probability of Markov Chains 2
4.4. Analysis of the Spatial Variability of Drought Occurrence
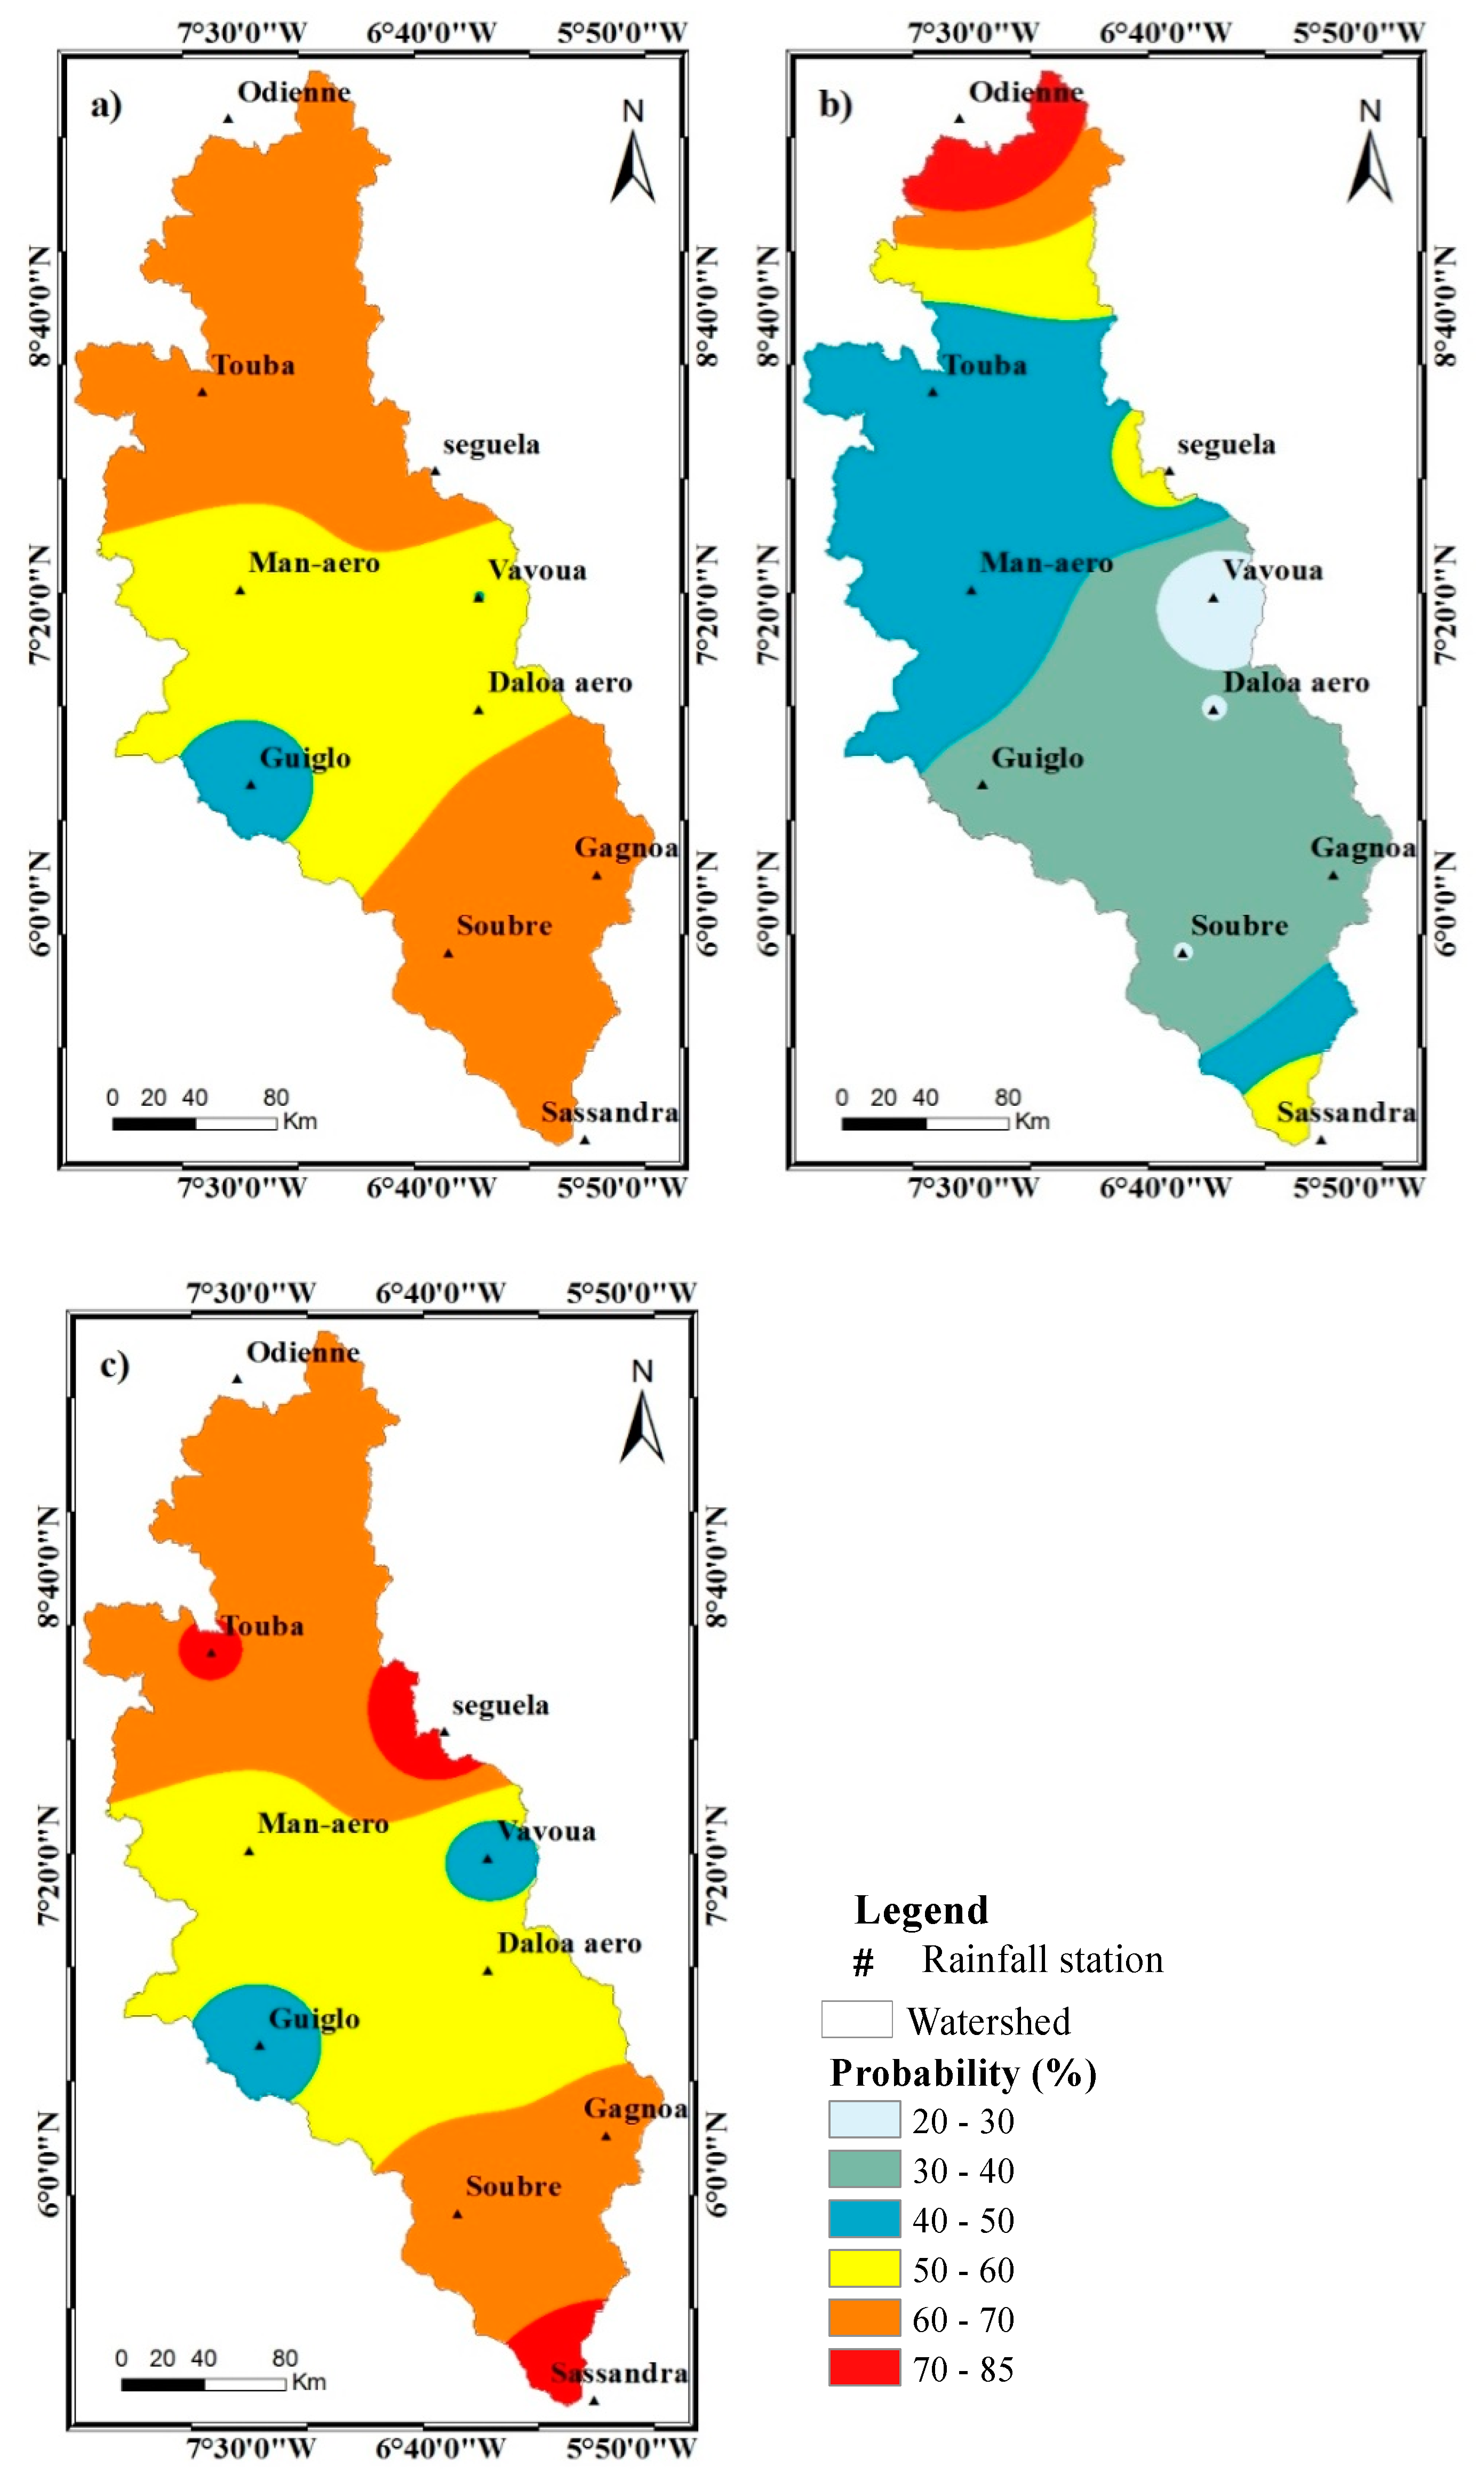
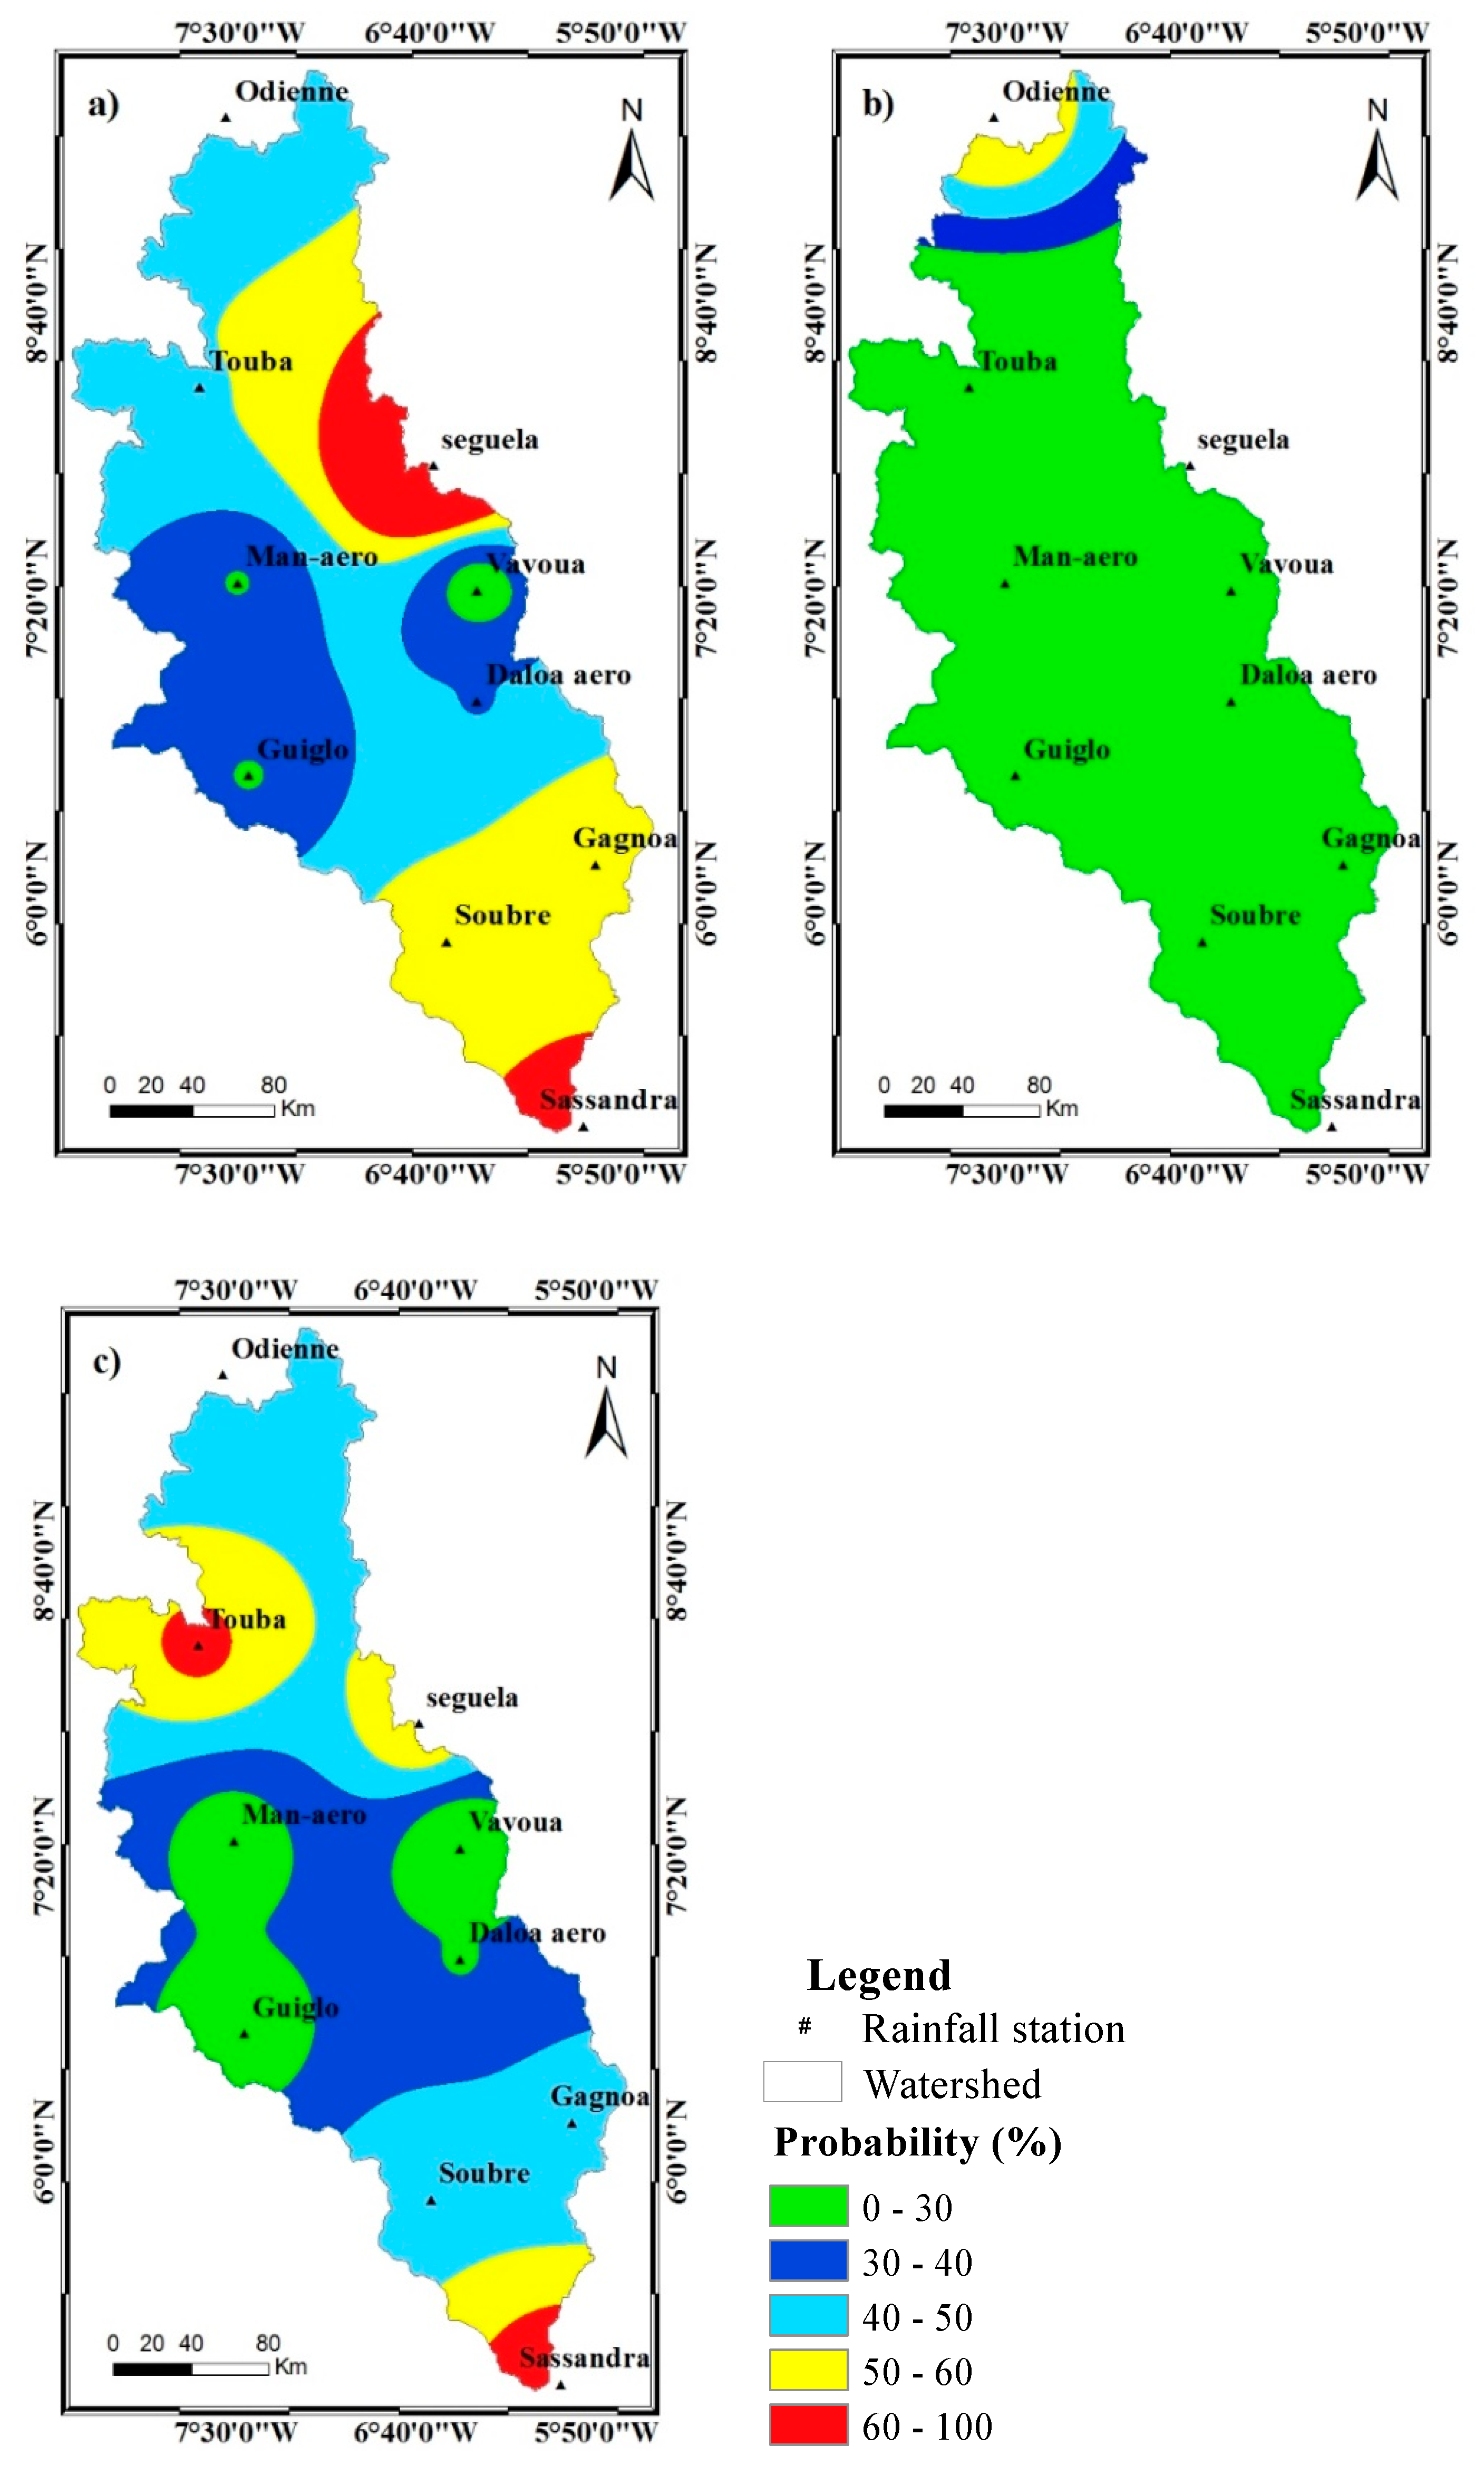
4.4.1. Spatial Variability of the Probability for Two Successive Dry Years
4.4.2. Spatial Variability of Probabilities for Three Consecutive Dry Years
5. Discussion
6. Conclusions
Author Contributions
Funding
Acknowledgments
Conflicts of Interest
References
- Lécuyer, C. Evolution de la Désertification en Afrique de L’ouest; Rapport de Stage de Master 1 à l’Institut de Recherche pour le Développement (IRD): Bondy, France-Nord, 2012; 101p. [Google Scholar]
- Nicholson, S.E. Climatic and environmental change in Africa during the last two centuries. Clim. Res. 2001, 17, 123–144. [Google Scholar] [CrossRef]
- Kouassi, A. Caractérisation d’une Modification Éventuelle de la Relation Pluie-débit et ses Impacts sur les Ressources en eau en Afrique de l’Ouest: Cas du Bassin Versant du N’Zi (Bandama) en Côte d’Ivoire. Ph.D. These, Université de Cocody, Abidjan, Côte d’Ivoire, 2008; 217p. [Google Scholar]
- Bedoum, A.; Bouka, B.C.; Alladoum, M.; Adoumi, I.; Baohoutoul, L. Impact de la variabilité pluviométrique et de la sécheresse au Sud du Tchad: Effet du changement climatique. Rev. Ivoir. Sci. Technol. 2014, 23, 13–20. [Google Scholar]
- BAD. Banque Africaine de Développement. Lutte Contre la Sécheresse en Afrique de l’Ouest et Australe, 2016. La BAD Octroie une Enveloppe de 549 Millions. Available online: https://www.afdb.org/fr/news-and-southern-africa-15547 (accessed on 20 March 2019).
- Goula, B.T.A.; Savané, I.; Konan, B.; Fadika, V.; Gnamien, K.B. Impact de la variabilité climatique sur les ressources hydriques des bassins de N’Zo et N’Zi en Côte d’Ivoire (Afrique tropicale humide). Vertigo 2006, 7, 1–12. [Google Scholar] [CrossRef]
- Noufé, D.; Lidon, B.; Mahé, G.; Servat, E.; Brou, T.; Koli Bi, Z. Variabilité climatique et production de maïs en culture pluviale dans l’Est ivoirien. J. Sci. Hydrol. 2011, 56, 152–167. [Google Scholar] [CrossRef]
- Otchoumou, K.F.; Saley, M.B.; Aké, G.E.; Savane, I.; Djê, K.B. Variabilité climatique et production de café et cacao dans la zone tropicale humide: Cas de la région de Daoukro (Centre-Est de la Côte d’Ivoire). Int. J. Innov. Appl. Stud. 2012, 1, 194–215. [Google Scholar]
- Sorokoby, V.M.; Saley, M.B.; Kouamé, K.F.; Djagoua, E.M.V.; Affian, K.; Biemi, J. Variabilité spatio-temporelle des paramètres climatiques et son incidence sur le tarissement dans les bassins versants de Bô et Debo (département de Soubré au Sud-Ouest de la Côte d’Ivoire). Int. J. Innov. Appl. Stud. 2013, 2, 287–299. [Google Scholar]
- Yao, F.Z.; Reynard, E.; Ouattara, I.; N’Go, Y.A.; Fallet, J.M.; Savané, I. A new statistical approach to assess climate variability in the white Bandama watershed, Northern Cote d’Ivoire. Atmos. Clim. Sci. 2018, 8, 410–430. [Google Scholar]
- Savané, I.; Coulibaly, K.; Gion, P. Variabilité climatique et ressources en eaux souterraines dans la région semi-montagneuse de Man. Sécheresse 2001, 12, 231–237. [Google Scholar]
- Kouadio, B.H.; Kouamé, K.F.; Saley, M.B.; Biémi, J.; Ibrahima, T. Insécurité climatique et géorisques en Côte d’Ivoire: Étude du risque d’érosion hydrique des sols dans la région semi-montagneuse de Man (Ouest de la Côte d’Ivoire). Sécheresse 2007, 18, 29–37. [Google Scholar]
- FAO. Situation des Forêts Dans le Monde; FAO: Rome, Italy, 1999; 154p. [Google Scholar]
- Brou, Y.T. Variabilité climatique, déforestation et dynamique agro-démographique en Côte d’Ivoire. Sécheresse 2010, 21, 1–6. [Google Scholar]
- N’go, Y.A.; Ama-Abina, J.T.; Kouadio, A.Z.; Kouassi, H.K.; Savané, I. Environmental Change in Agricultural Land in Southwest Cote d’Ivoire: Driving Forces and Impacts. J. Environ. Prot. 2013, 4, 1373–1382. [Google Scholar] [CrossRef]
- Yao, A.B.; Goula, B.T.A.; Kouadio, Z.A.; Kouakou, K.E.; Kanté, A.; Sambou, S. Analyse de la variabilité climatique et quantification des ressources en eau en zone tropicale humide: Cas du bassin versant de la Lobo au Centre-Ouest de la Cote d’Ivoire. Rev. Ivoir. Sci. Technol. 2012, 19, 136–157. [Google Scholar]
- N’go, Y.A. Hydrologie et Dynamique de L’état de Surface des Terres Dans le sud-Ouest de la Côte d’Ivoire: Impacts et Moteurs de Dégradation. Ph.D. These, Université Nangui Abrogoua, Abidjan, Côte d’Ivoire, 2015. [Google Scholar]
- Watson, W.E.; Kumar, K.; Michaelsen, L.K. Cultural diversity’s impact on interaction process and performance: Comparing homogeneous and diverse task groups. Acad. Manag. J. 1993, 36, 590–602. [Google Scholar]
- Doudja, S.G.; Nour, E.D.; Abd, E.M.B. Simulation de la pluviométrie journalière en zone semi-aride par l’analyse en composantes principales. Sécheresse 2007, 18, 97–105. [Google Scholar]
- Eldin, M. Le climat de la Côte d’Ivoire. In Le Milieu Naturel de la Côte d’Ivoire; Mémoires de l’ORSTOM: Paris, France, 1971; Volume 50, pp. 73–108. [Google Scholar]
- Savané, I. Contribution à L’étude Géologique et Hydrogéologique des Aquifères Discontinues du socle Cristallin d’Odienné (Nord- Ouest de la Côte D’ivoire). Apport de la Télédétection et d’un Système D’information Hydrogéologique à Référence Spatiale. Ph.D. These, Université de Cocody, Abidjan, Côte d’Ivoire, 1997. [Google Scholar]
- Mckee, T.B.; Doesken, N.J.; Kliest, J. The relationship of drought frequency and duration of time scale. In Proceedings of the Eight Conference on Applied Climatology, Anaheim, CA, USA, 7–22 January 1993; American Meteorological Society: Boston, MA, USA, 1993; pp. 179–184. [Google Scholar]
- Mirabbasia, R.; Anagnostoub, E.N.; Fakheri-Farda, A.; DInpashoha, Y.; Eslamianc, S. Analysis of meteorological drought in northwest Iran using the Joint Deficit Index. J. Hydrol. 2013, 492, 35–48. [Google Scholar] [CrossRef]
- Hayes, M.J.; Svoboda, M.D.; Wilhite, D.A.; Vanyarkho, O.V. Monitoring the 1996 drought using the standardized precipitation index. Bull. Am. Meteorol. Soc. 1999, 80, 429–438. [Google Scholar] [CrossRef]
- Soro, G.E.; Anouman, D.G.L.; Goula Bi, T.A.; Srohorou, B.; Savané, I. Caractérisation des séquences de sécheresse météorologique à diverses échelles de temps en climat de type Soudanais: Cas de l’extrême nord-ouest de la Côte d’Ivoire. LARHYSS J. 2014, 18, 107–124. [Google Scholar]
- Renard, C.; Garreta, V.; Lang, M. An application of Bayesian analysis and Markov chain Monte Carlo methods to the estimation of a regional trend in annual maxima. Water Resour. Res. 2006, 42, W12422. [Google Scholar] [CrossRef]
- Kouakou, K.E.; Goula, B.T.A.; Savané, I. Impacts de la variabilité climatique sur les ressources en eau de surface en zone tropicale humide: Cas du bassin versant transfrontalier de la Comoé (Côte d’Ivoire-Burkina Faso). Eur. J. Sci. Res. 2007, 16, 31–43. [Google Scholar]
- Chiew, F.H.S.; Mc Mahon, T.A. Assessing the adequacy of catchment stream flow yield estimates. Aust. J. Soil Res. 1993, 31, 665–680. [Google Scholar] [CrossRef]
- Javier, M.V.; Lidia, G. Regionalization of peninsular Spain based on the length of dry spells. Int. J. Climatol. 1999, 19, 537–555. [Google Scholar]
- Mark, T.; George, K.A. Hidden Markov model for modelling long-term persistence in multi-site rainfall time series 1. Model calibration using a Bayesian approach. J. Hydrol. 2003, 275, 12–26. [Google Scholar]
- Lazri, M.; Ameur, S.; Haddad, B. Analyse des données de précipitations par approche Markovienne. LARHYSS J. 2007, 6, 7–20. [Google Scholar]
- Jan, L.; Anastassia, B.; Deliang, C. Modelling precipitation in Sweden using multiple step Markov chains and a composite model. J. Hydrol. 2008, 363, 42–59. [Google Scholar]
- Justin, G.M. Markov chain modeling of sequences of lagged Numerical Weather Prediction ensemble probability forecasts: An exploration of model properties and decision support applications. Mon. Weather Rev. 2008, 136, 3655–3669. [Google Scholar]
- Alam, J.A.T.M.; Sayedur, M.R.; Saadat, A.H.M. Monitoring meteorological and agricultural drought dynamics in Barind region Bangladesh using standard precipitation index and Markov chain model. Int. J. Geomat. Geosci. 2013, 3, 511–524. [Google Scholar]
- Meledje, N.D.H.; Kouassi, K.L.; N’Go, Y.A.; Savane, I. Caractérisation des occurrences de sécheresse dans le bassin hydrologique de la Bia transfrontalier entre la Côte d’Ivoire et le Ghana: Contribution des chaînes de Markov. Cah. Agric. 2015, 24, 186–197. [Google Scholar]
- Khadr, M. Forecasting of meteorological drought using Hidden Markov Model (case study: The upper Blue Nile river basin, Ethiopia). Ain Shams Eng. J. 2016, 7, 47–56. [Google Scholar] [CrossRef]
- Radu, S.S. Modélisation Probabiliste et Inférence Statistique pour L’analyse des Données Spatiales; Habilitation à Diriger des Recherches (HDR) de l’Université de Lille: Lille, France, 2014; Volume 1, 232p. [Google Scholar]
- Kanohin, F.; Saley, M.B.; Savané, I. Impacts de la variabilité climatique sur les ressources en eau et les activités humaines en zone tropicale humide: Cas de la région de Daoukro en Côte d’Ivoire. Eur. J. Sci. Res. 2009, 26, 209–222. [Google Scholar]
- Kouassi, A.M.; Kouamé, K.F.; Koffi, Y.B.; Djé, K.B.; Paturel, J.E.; Oularé, S. Analyse de la variabilité climatique et de ses influences sur les régimes pluviométriques saisonniers en Afrique de l’Ouest: Cas du bassin versant du N’zi (Bandama) en Côte d’Ivoire. Cybergeo Eur. J. Geogr. 2010, 513, 29. [Google Scholar] [CrossRef]
- Soro, D.T.; Soro, N.; OGA, M.S.; Lasm, T.; Soro, G.; Ahoussi, E.K. La variabilité climatique et son impact sur les ressources en eau dans le degré carré de Grand-Lahou (Sud-Ouest de la Côte d’Ivoire). Physio-Géo 2011, 5, 55–73. [Google Scholar] [CrossRef]
- Kouakou, E.; Koné, B.; N’Go, A.; Cissé, G.; Ifejika, S.C.; Savané, I. Groundwater Sensitivity to Climate Variability in the White Bandama Basin, Ivory Coast. SpringerPlus 2014, 3, 226. [Google Scholar] [CrossRef]
- Masih, I.; Maskey, S.; Mussá, F.E.F.; Trambauer, P.A. Review of droughts on the African continent: A geospatial and long-term perspective. Hydrol. Earth Syst. Sci. 2014, 18, 3635–3649. [Google Scholar] [CrossRef]
- Ouassou, A.; Ameziane, T.; Ziyad, A.; Belghiti, M. Application of the drought management guidelines in Morocco. Options Méditerr. Ser. B 2007, 58, 343–372. [Google Scholar]
- Kasei, R.; Diekkrüger, B.; Leemhuis, C. Drought frequency in the Volta Basin of West Africa. Sustain. Sci. 2010, 5, 89–97. [Google Scholar] [CrossRef]
- Lebel, T.; Cappelaere, B.; Galle, S.; Hanan, N.; Kergoat, L.; Levis, S.; Vieux, B.; Descroix, L.; Gosset, M.; Mougin, E.; et al. Studies in the Sahelian region of West-Africa: An overview. J. Hydrol. 2009, 375, 3–13. [Google Scholar] [CrossRef]
- Dai, A.; Lamb, P.J.; Trenberth, E.K.; Hulme, M.; Jones, D.P.; Xie, P. The Recent Sahel Drought Is Real. Int. J. Clim. 2004, 24, 1323–1331. [Google Scholar] [CrossRef]
- Nicholson, S.E. The West African Sahel: A Review of Recent Studies on the Rainfall Regime and Its Interannual Variability. ISRN Meteorol. 2013, 2013, 453521. [Google Scholar] [CrossRef]


| Climatic Area | Name | Latitude North | Longitude West | Code |
|---|---|---|---|---|
| Attiean climate | Sassandra | 4°57’ | 6°50’ | 1090017200 |
| Gagnoa | 6°07’ | 5°56’ | 1090010300 | |
| Baoulean climate | Soubré | 5°47’ | 6°36’ | 1090018100 |
| Guiglo | 6°32’ | 7°28’ | 1090011200 | |
| Vavoua | 7°22’ | 6°28’ | 1090021400 | |
| Seguéla | 7°57’ | 6°40’ | 1090017500 | |
| Daloa | 6°53’ | 6°27’ | 1090008200 | |
| Touba | 8°17’ | 7°41’ | 1090020500 | |
| Mountain climate | Man | 7°24’ | 7°31’ | 1090014200 |
| Sudanese climate | Odienné | 9°30’ | 7°34’ | 1090016000 |
| SPI Value | Drought Sequence |
|---|---|
| −0.99 to 0.99 | Near the Normal |
| −1.00 to –1.49 | Moderately dry |
| −1.50 to –1.99 | Severely dry |
| −2.00 and under | Extremely dry |
| State at Day k−1 and k−2 | State at Day k−1 and k | |||
|---|---|---|---|---|
| 00 | 01 | 10 | 11 | |
| 00 | P000 | P001 | 0 | 0 |
| 01 | 0 | 0 | P010 | P011 |
| 10 | P100 | P101 | 0 | 0 |
| 11 | 0 | 0 | P110 | P111 |
| Stations | Intensity (SPI) | Type | Maximum Duration | Date of Occurrence |
|---|---|---|---|---|
| Daloa | −1.53 | Severely dry | 7 | 2001 |
| Vavoua | −2.26 | Extremely dry | 4 | 2003 |
| Man | −3.06 | Extremely dry | 5 | 2003 |
| Guiglo | −2.86 | Extremely dry | 6 | 2002 |
| Seguéla | −1.53 | Severely dry | 8 | 2002 |
| Touba | −2.61 | Extremely dry | 10 | 1983 |
| Odienné | −2.05 | Extremely dry | 11 | 1987 |
| Gagnoa | −1.90 | Severely dry | 7 | 1992 |
| Soubré | −2.25 | Extremely dry | 13 | 1974 |
| Sassandra | −1.87 | Severely dry | 18 | 1998 |
| Climate Regimes | Stations | Probability (%) | |||
|---|---|---|---|---|---|
| W-W | D-W | W-D | D-D | ||
| Attiean climate | Sassandra | 68 | 30 | 30 | 70 |
| Gagnoa | 54 | 32 | 46 | 70 | |
| Baoulean climate | Soubré | 57 | 36 | 40 | 64 |
| Guiglo | 43 | 55 | 57 | 45 | |
| Vavoua | 40 | 52 | 60 | 50 | |
| Seguéla | 46 | 31 | 54 | 70 | |
| Daloa | 44 | 40 | 56 | 60 | |
| Touba | 62 | 30 | 38 | 70 | |
| Mountain climate | Man | 55 | 45 | 45 | 55 |
| Soudanese climate | Odienné | 60 | 38 | 40 | 63 |
| Period | Climate Regimes | Stations | Probability (%) | |||
|---|---|---|---|---|---|---|
| W-W | D-W | W-D | D-D | |||
| 1953−1970 | Attiean climate | Sassandra | 28 | 36 | 71 | 60 |
| Gagnoa | 38 | 50 | 63 | 50 | ||
| Baoulean climate | Soubré | 25 | 70 | 75 | 30 | |
| Guiglo | 38 | 60 | 63 | 40 | ||
| Vavoua | 11 | 78 | 67 | 22 | ||
| Seguéla | 29 | 40 | 71 | 55 | ||
| Daloa | 40 | 63 | 60 | 23 | ||
| Touba | 44 | 45 | 60 | 45 | ||
| Mountain climate | Man | 40 | 56 | 55 | 44 | |
| Soudanese climate | Odienné | 50 | 15 | 50 | 85 | |
| 1971−2015 | Attiean climate | Sassandra | 77 | 20 | 23 | 80 |
| Gagnoa | 55 | 39 | 45 | 61 | ||
| Baoulean climate | Soubré | 61 | 36 | 40 | 64 | |
| Guiglo | 35 | 54 | 65 | 46 | ||
| Vavoua | 41 | 50 | 59 | 45 | ||
| Seguéla | 61 | 22 | 39 | 78 | ||
| Daloa | 48 | 45 | 52 | 55 | ||
| Touba | 70 | 30 | 30 | 71 | ||
| Mountain climate | Man | 58 | 43 | 42 | 55 | |
| Soudanese climate | Odienné | 55 | 39 | 41 | 61 | |
| Climate Regimes | Stations | Probability (%) | |||
|---|---|---|---|---|---|
| W-D-W | W-D-D | D-D-W | D-D-D | ||
| Attiean climate | Sassandra | 15 | 6 | 7 | 67 |
| Gagnoa | 23 | 20 | 11 | 59 | |
| Baoulean climate | Soubré | 30 | 10 | 10 | 55 |
| Guiglo | 40 | 17 | 20 | 30 | |
| Vavoua | 35 | 25 | 21 | 25 | |
| Seguéla | 25 | 25 | 15 | 51 | |
| Daloa | 22 | 32 | 22 | 40 | |
| Touba | 14 | 21 | 18 | 50 | |
| Mountain climate | Man | 22 | 25 | 23 | 30 |
| Soudanese climate | Odienné | 16 | 23 | 22 | 41 |
| Period | Climate Regimes | Stations | Probability (%) | |||
|---|---|---|---|---|---|---|
| W-D-W | W-D-D | D-D-W | D-D-D | |||
| 1953−1970 | Attiean climate | Sassandra | 29 | 43 | 20 | 30 |
| Gagnoa | 38 | 25 | 10 | 20 | ||
| Baoulean climate | Soubré | 50 | 25 | 20 | 0 | |
| Guiglo | 50 | 13 | 20 | 20 | ||
| Vavoua | 60 | 22 | 25 | 0 | ||
| Seguéla | 14 | 57 | 30 | 20 | ||
| Daloa | 40 | 20 | 20 | 0 | ||
| Touba | 22 | 33 | 30 | 15 | ||
| Mountain climate | Man | 33 | 33 | 30 | 0 | |
| Soudanese climate | Odienné | 0 | 60 | 20 | 60 | |
| 1971−2015 | Attiean climate | Sassandra | 10 | 10 | 10 | 70 |
| Gagnoa | 25 | 20 | 17 | 43 | ||
| Baoulean climate | Soubré | 20 | 20 | 20 | 50 | |
| Guiglo | 40 | 30 | 21 | 25 | ||
| Vavoua | 30 | 30 | 30 | 20 | ||
| Seguéla | 11 | 25 | 15 | 60 | ||
| Daloa | 20 | 30 | 30 | 30 | ||
| Touba | 20 | 10 | 8 | 63 | ||
| Mountain climate | Man | 17 | 25 | 0 | 25 | |
| Soudanese climate | Odienné | 20 | 23 | 22 | 40 | |
© 2019 by the authors. Licensee MDPI, Basel, Switzerland. This article is an open access article distributed under the terms and conditions of the Creative Commons Attribution (CC BY) license (http://creativecommons.org/licenses/by/4.0/).
Share and Cite
Santé, N.; N’Go, Y.A.; Soro, G.E.; Meledje, N.H.; Goula, B.T.A. Characterization of Meteorological Droughts Occurrences in Côte d’Ivoire: Case of the Sassandra Watershed. Climate 2019, 7, 60. https://doi.org/10.3390/cli7040060
Santé N, N’Go YA, Soro GE, Meledje NH, Goula BTA. Characterization of Meteorological Droughts Occurrences in Côte d’Ivoire: Case of the Sassandra Watershed. Climate. 2019; 7(4):60. https://doi.org/10.3390/cli7040060
Chicago/Turabian StyleSanté, Natacha, Yao Alexis N’Go, Gneneyougo Emile Soro, N’Diaye Hermann Meledje, and Bi Tié Albert Goula. 2019. "Characterization of Meteorological Droughts Occurrences in Côte d’Ivoire: Case of the Sassandra Watershed" Climate 7, no. 4: 60. https://doi.org/10.3390/cli7040060
APA StyleSanté, N., N’Go, Y. A., Soro, G. E., Meledje, N. H., & Goula, B. T. A. (2019). Characterization of Meteorological Droughts Occurrences in Côte d’Ivoire: Case of the Sassandra Watershed. Climate, 7(4), 60. https://doi.org/10.3390/cli7040060