Thermal Environment Design of Outdoor Spaces by Examining Redevelopment Buildings Opposite Central Osaka Station


Abstract
1. Introduction
2. Calculation of Thermal Element Distribution
3. Relationship between MRT, Wind Velocity, and SET*
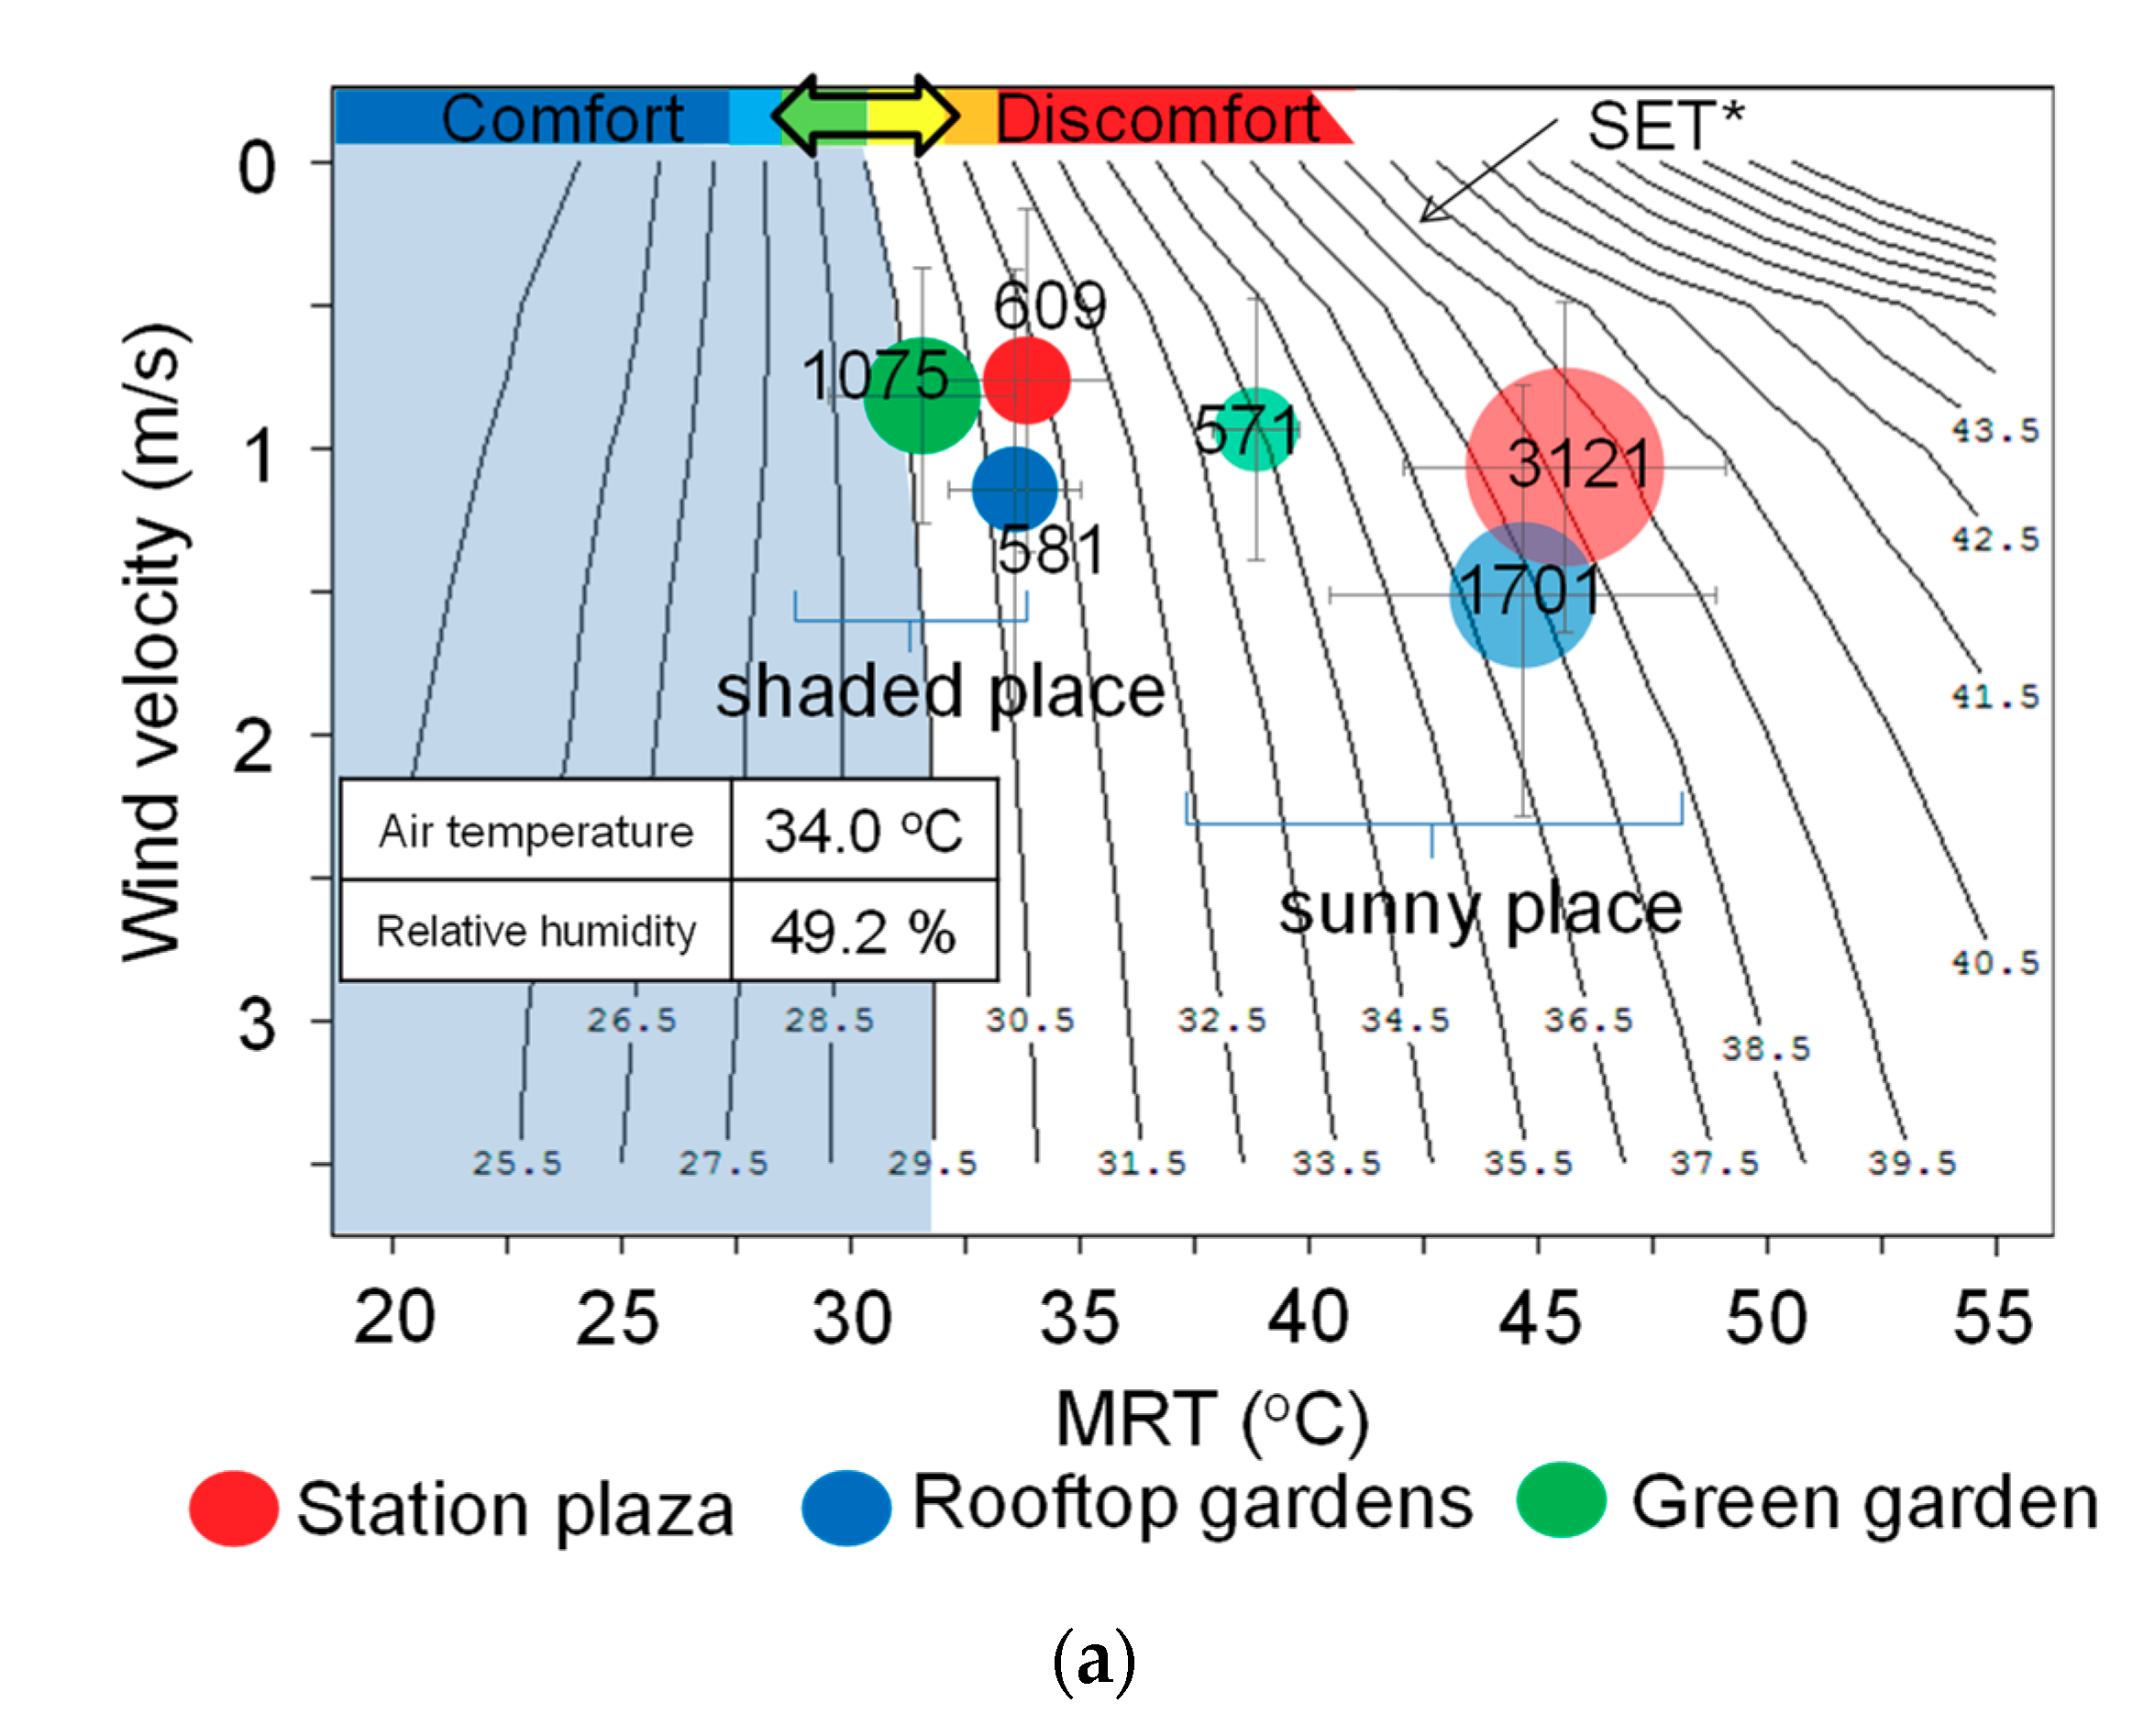
3.1. Evaluation under Various Conditions
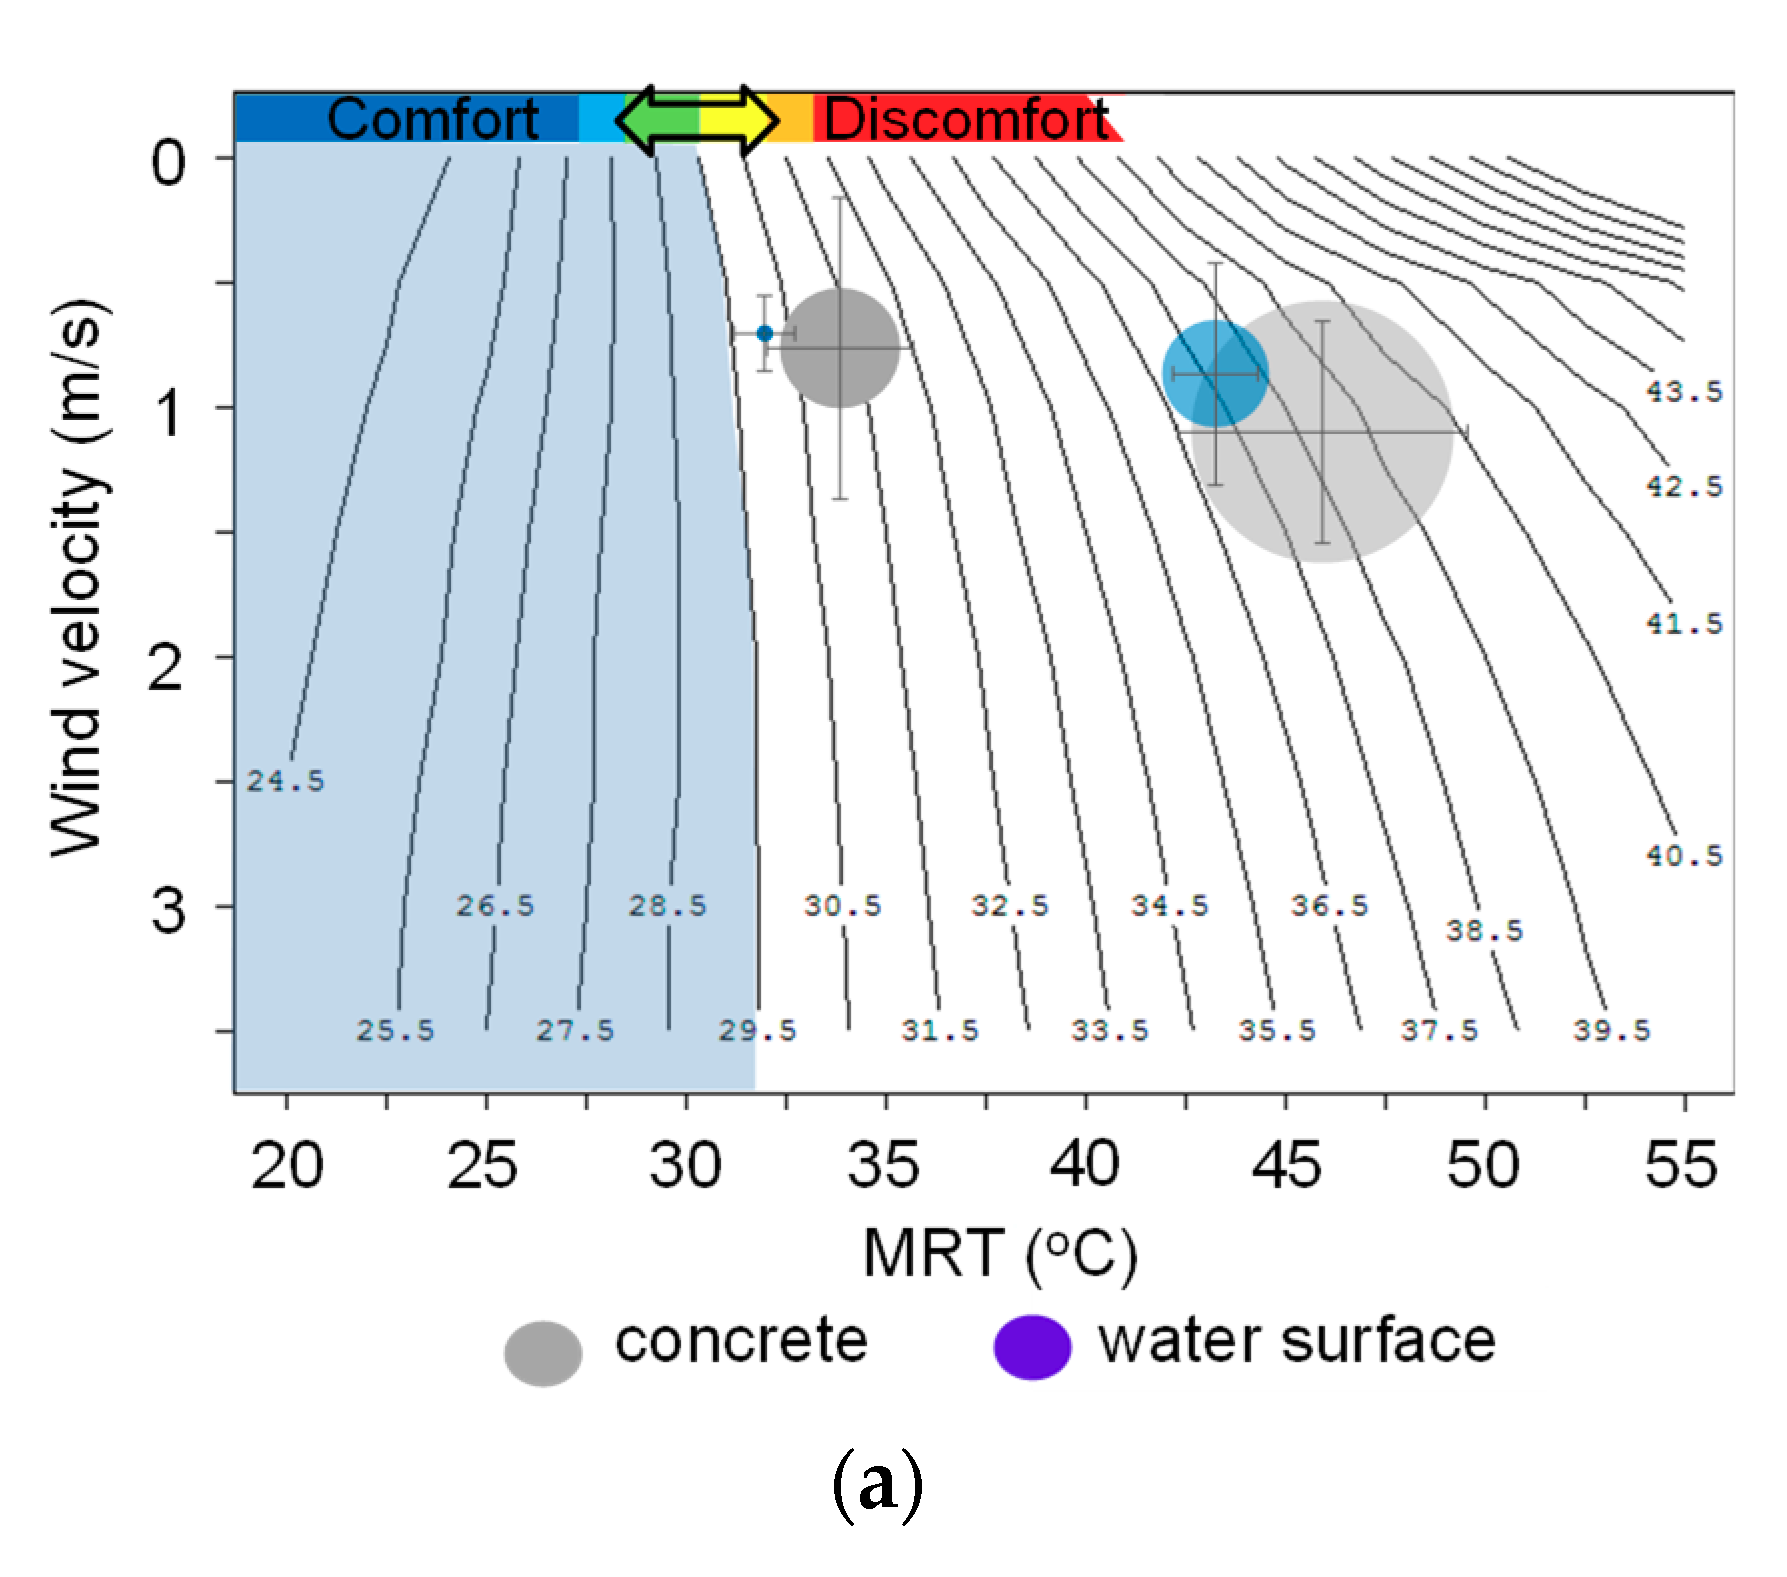
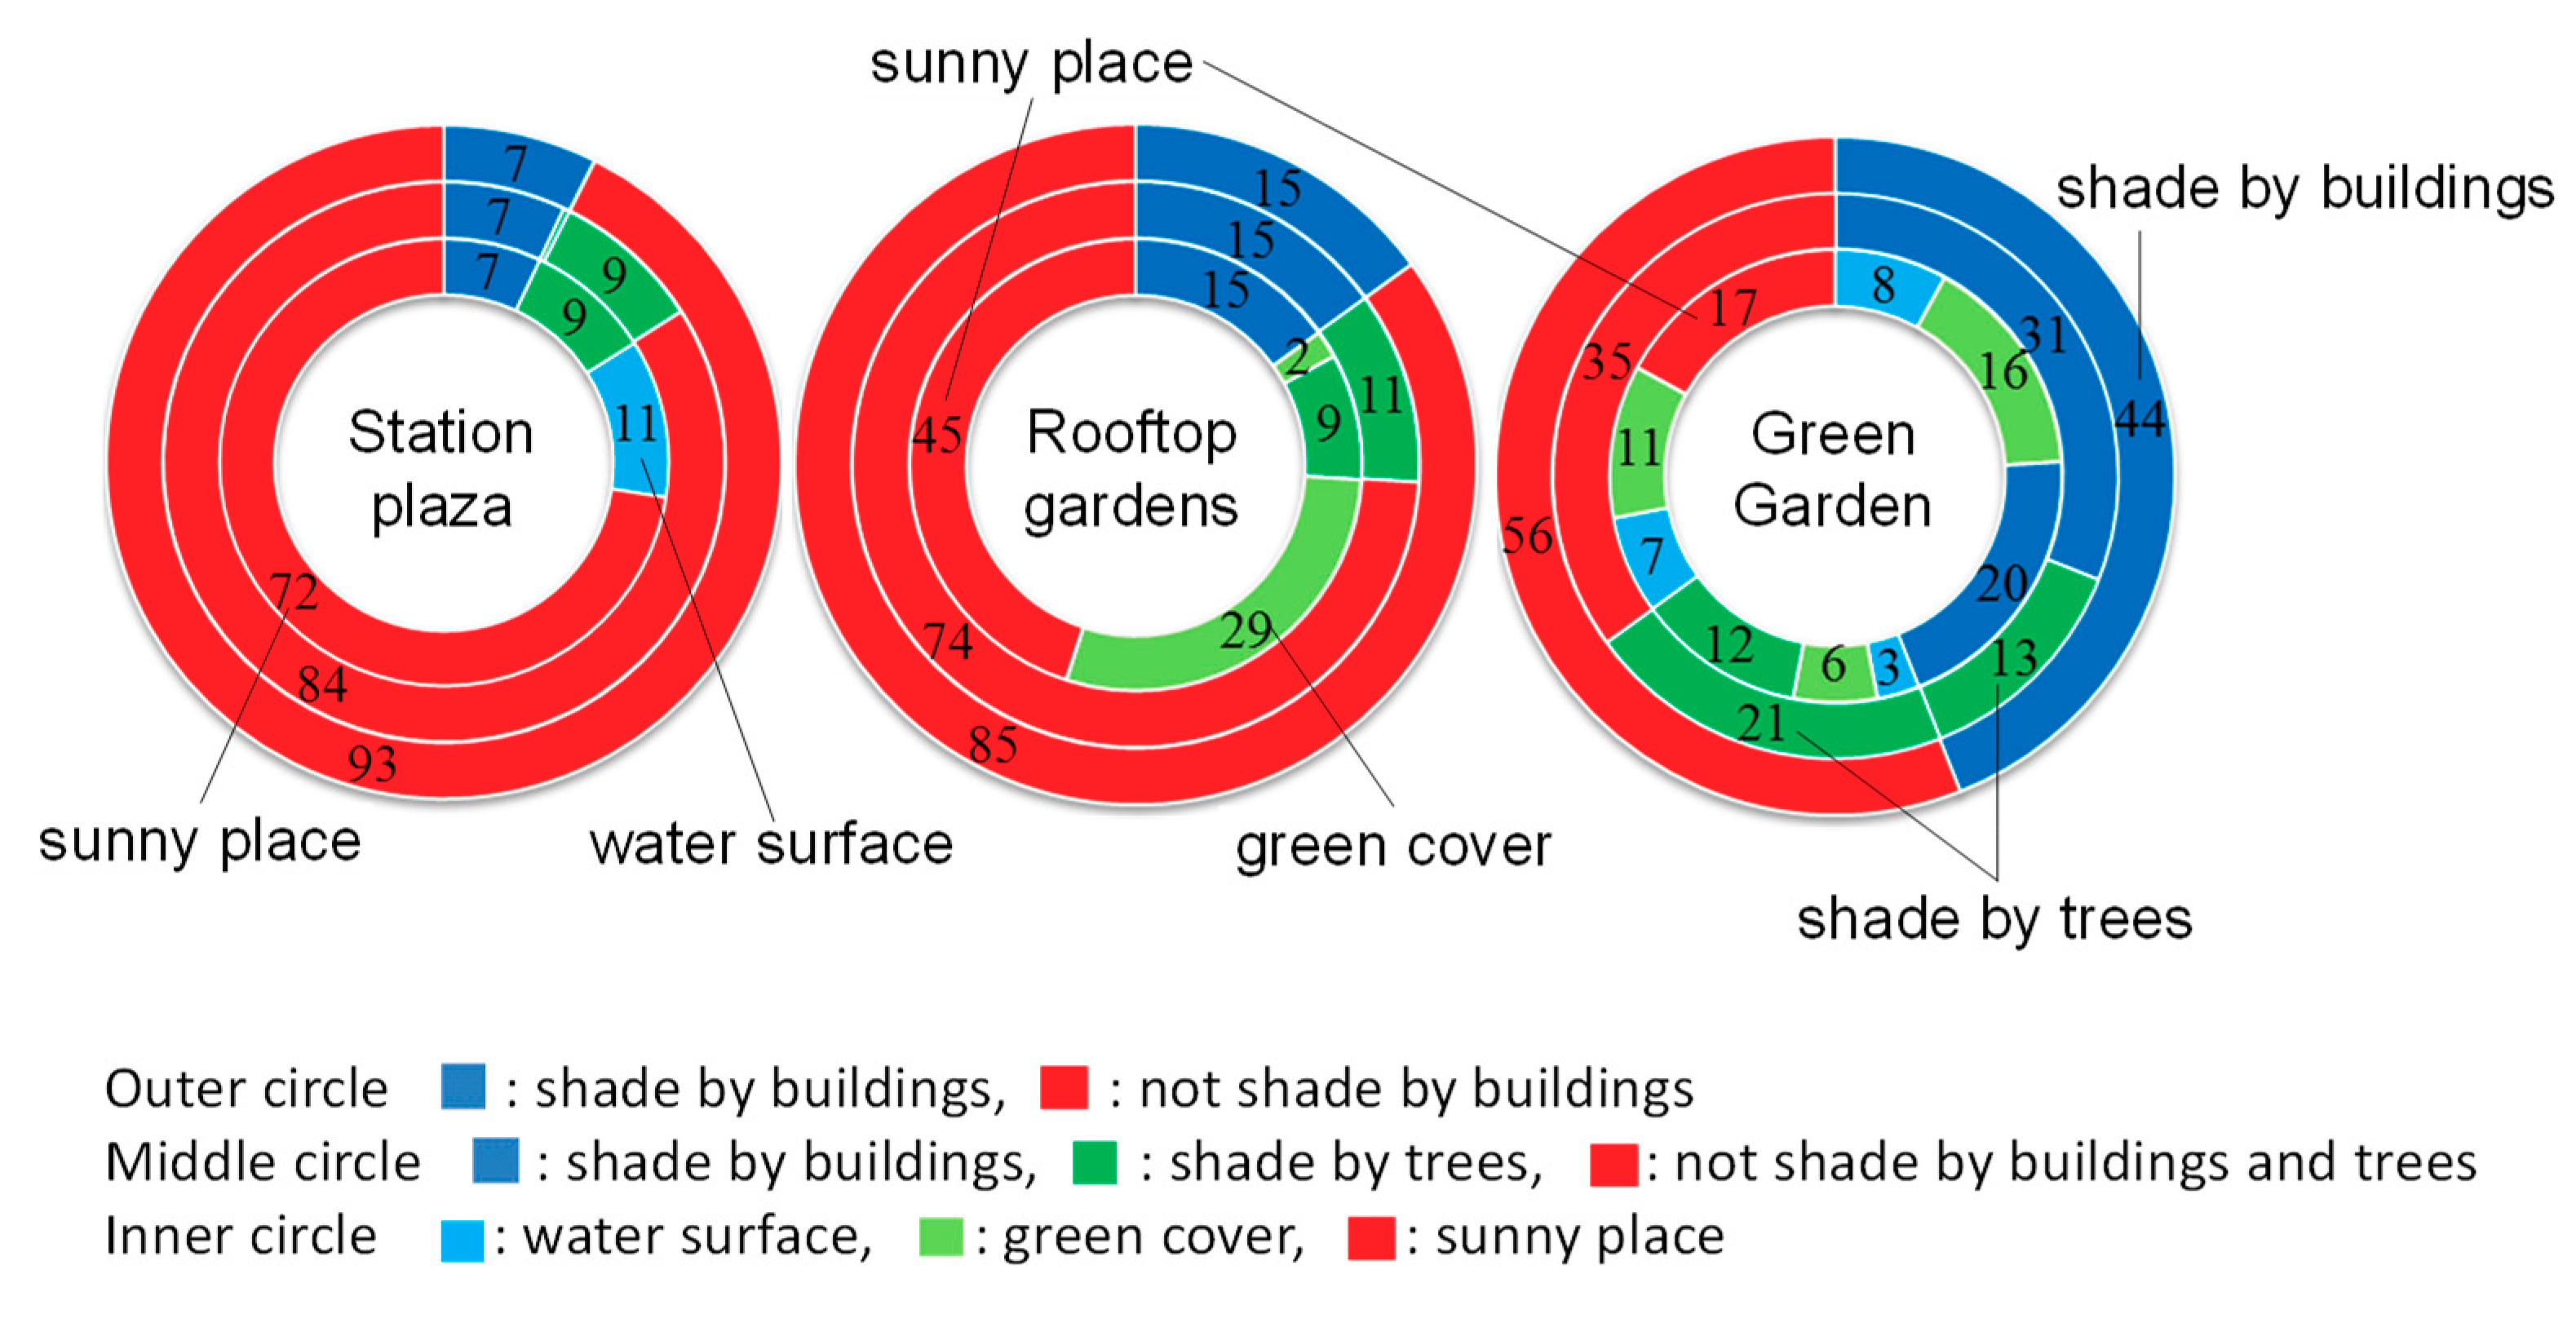
3.2. Influence of Surface Materials
4. Discussion
5. Conclusions
Author Contributions
Funding
Acknowledgments
Conflicts of Interest
References
- Takebayashi, H.; Kasahara, M.; Tanabe, S.; Kouyama, M. Analysis of Solar Radiation Shading Effects by Trees in the Open Space around Buildings. Sustainability 2017, 9, 1398. [Google Scholar] [CrossRef]
- Takebayashi, H.; Kyogoku, S. Thermal Environmental Design in Outdoor Space Focusing on Radiation Environment Influenced by Ground Cover Material and Solar Shading, through the Examination on the Redevelopment Buildings in Front of Central Osaka Station. Sustainability 2018, 10, 337. [Google Scholar] [CrossRef]
- Grand Front Osaka. Available online: http://umeda-connect.jp/special/vol10/part01.html (accessed on 9 October 2019).
- Tominaga, Y.; Mochida, A.; Yoshie, R.; Kataoka, H.; Nozu, T.; Yoshikawa, M.; Shirasawa, T. AIJ guidelines for practical applications of CFD to pedestrian wind environment around buildings. J. Wind Eng. Ind. Aerodyn. 2008, 96, 1749–1761. [Google Scholar] [CrossRef]
- Takebayashi, H.; Ishii, E.; Moriyama, M.; Sakaki, A.; Nakajima, S.; Ueda, H. Study to examine the potential for solar energy utilization based on the relationship between urban morphology and solar radiation gain on building rooftops and wall surfaces. Sol. Energy 2015, 119, 362–369. [Google Scholar] [CrossRef]
- Gagge, A.; Fobelets, P.; Bergland, L. A standard predictive index of human response to thermal environment. Ashrae Trans. 1986, 92, 709–731. [Google Scholar]
- Gagge, A.P.; Stolwik, J.A.J.; Nishi, Y. An effective temperature scale based on a simple model of human physiological regulatory response. Ashrae Trans. 1971, 77, 247–257. [Google Scholar]
- Ishii, A.; Katayama, T.; Shiotsuki, Y.; Yoshimizu, H.; Abe, Y. Experimental study on comfort sensation of people in the outdoor environment. J. Archit. Plan. Environ. Eng. 1988, 386, 28–37. [Google Scholar]
- Ali-Toudert, F.; Mayer, H. Numerical study on the effects of aspect ratio and orientation of an urban street canyon on outdoor thermal comfort in hot and dry climate. Build. Environ. 2006, 41, 94–108. [Google Scholar] [CrossRef]
- Ali-Toudert, F.; Mayer, H. Effects of asymmetry, galleries, overhanging façades and vegetation on thermal comfort in urban street canyons. Sol. Energy 2007, 81, 742–754. [Google Scholar] [CrossRef]
- Algeciras, J.A.R.; Consuegra, L.G.; Matzarakis, A. Spatial-temporal study on the effects of urban street configurations on human thermal comfort in the world heritage city of Camagüey-Cuba. Build. Environ. 2016, 101, 85–101. [Google Scholar] [CrossRef]
- Liang, X.; Tian, W.; Li, R.; Niu, Z.; Yang, X.; Meng, X.; Jin, L.; Yan, J. Numerical investigations on outdoor thermal comfort for built environment: Case study of a Northwest campus in China. Energy Procedia 2019, 158, 6557–6563. [Google Scholar] [CrossRef]
- Zhao, Q.; Sailor, D.; Wentz, E. Impact of tree locations and arrangements on outdoor microclimates and human thermal comfort in an urban residential environment. Urban For. Urban Green. 2018, 32, 81–91. [Google Scholar] [CrossRef]
- Lee, H.; Mayer, H.; Chen, L. Contribution of trees and grasslands to the mitigation of human heat stress in a residential district of Freiburg, Southwest Germany. Landsc. Urban Plan. 2016, 148, 37–50. [Google Scholar] [CrossRef]
- Chen, L.; Yu, B.; Yang, F.; Mayer, H. Intra-urban differences of mean radiant temperature in different urban settings in Shanghai and implications for heat stress under heat waves: AGIS-based approach. Energy Build. 2016, 130, 829–842. [Google Scholar] [CrossRef]


| Site | Concrete | Wood Deck | Grass | Water Surface | Asphalt |
|---|---|---|---|---|---|
| Station Plaza | 79% | 0% | 0% | 10% | 11% |
| Rooftop Gardens | 37% | 25% | 38% | 0% | 0% |
| Green Garden | 40% | 0% | 26% | 15% | 19% |
| Total | 52% | 5% | 12% | 6% | 25% |
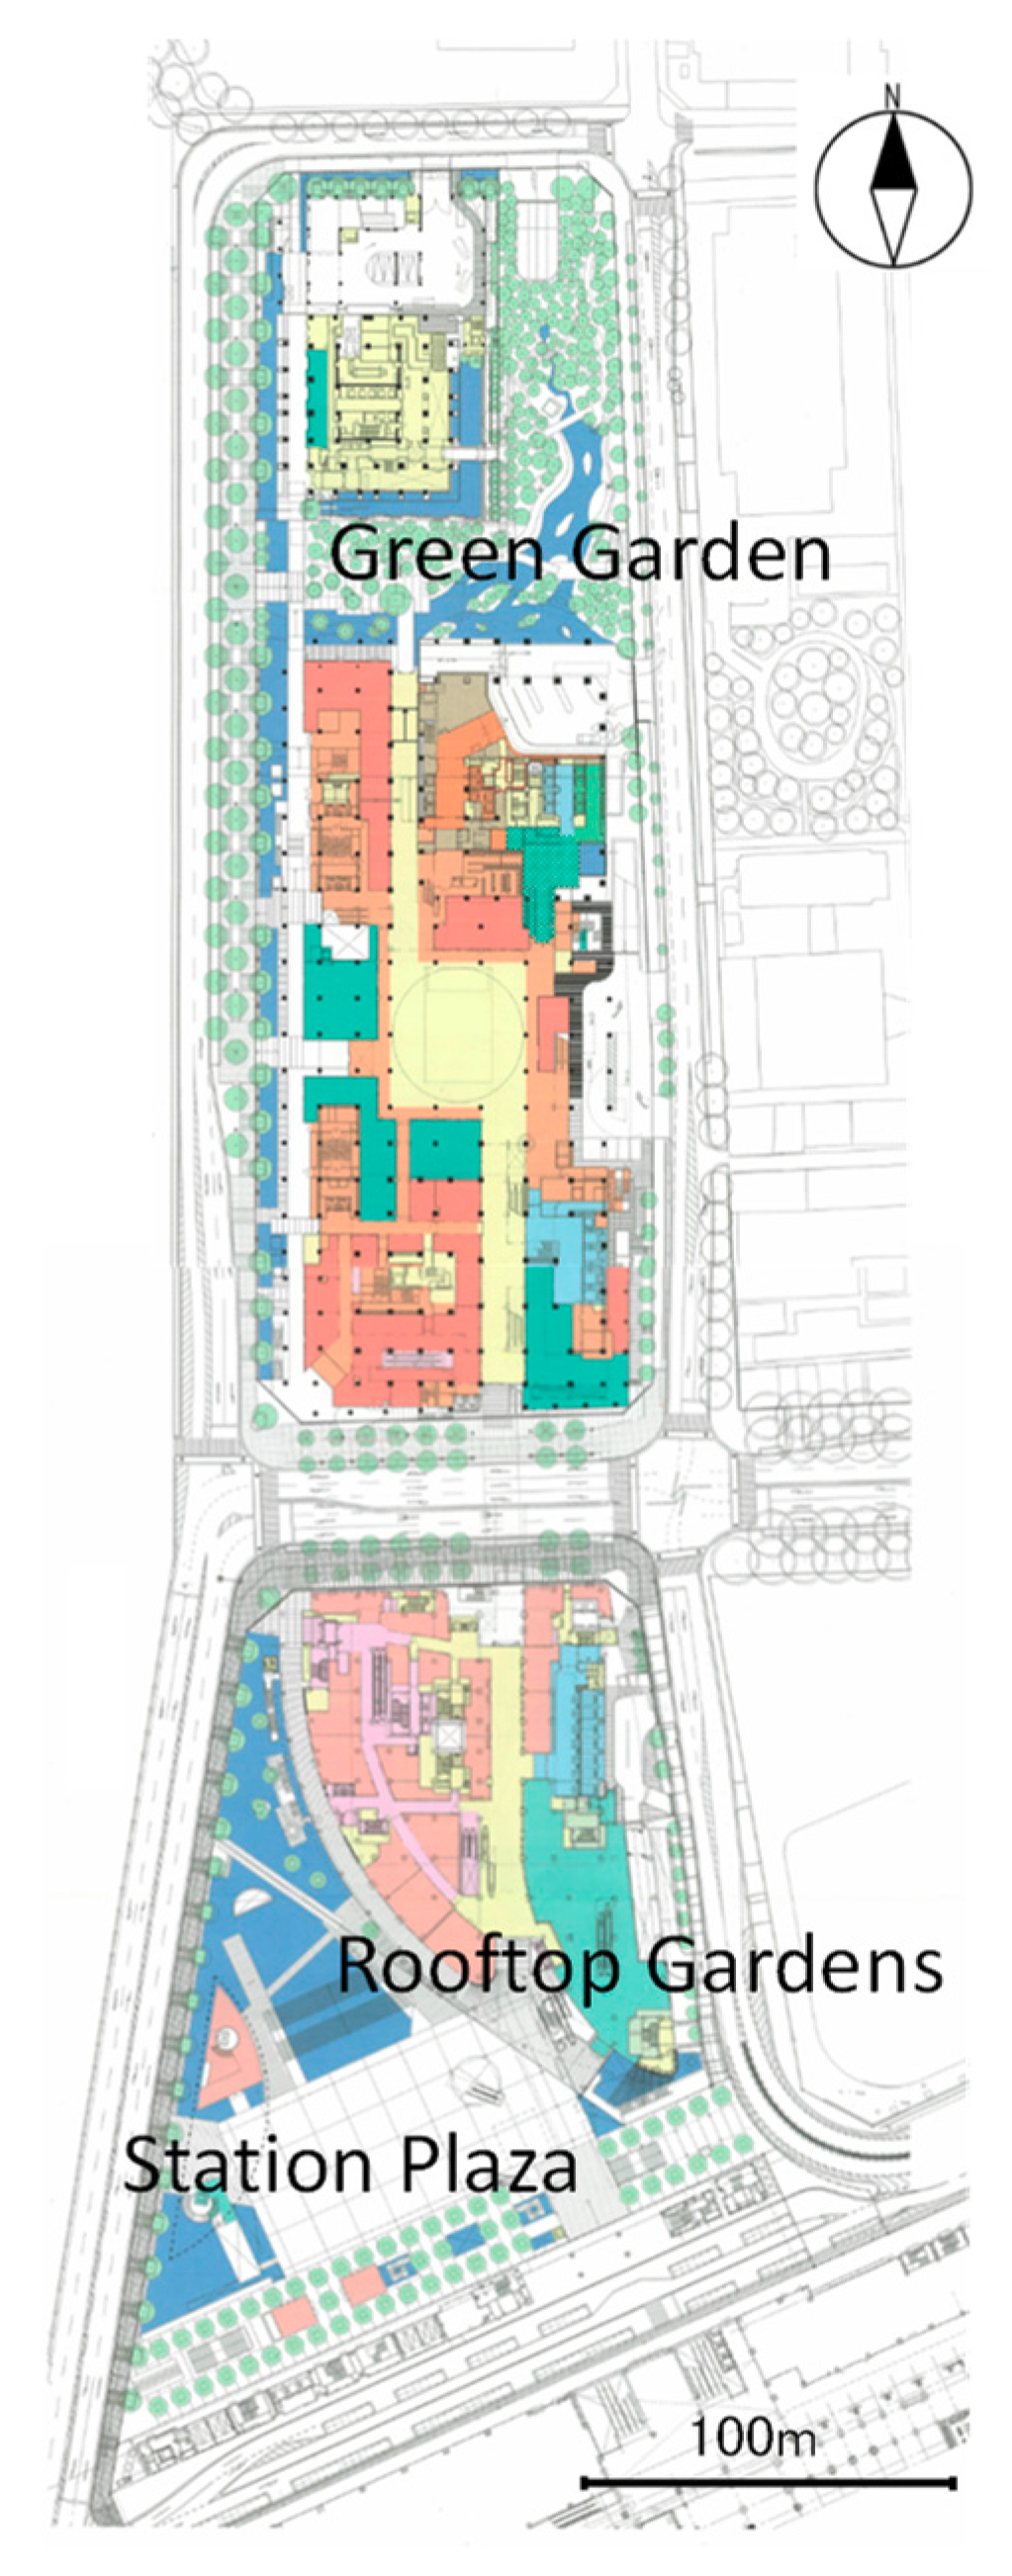
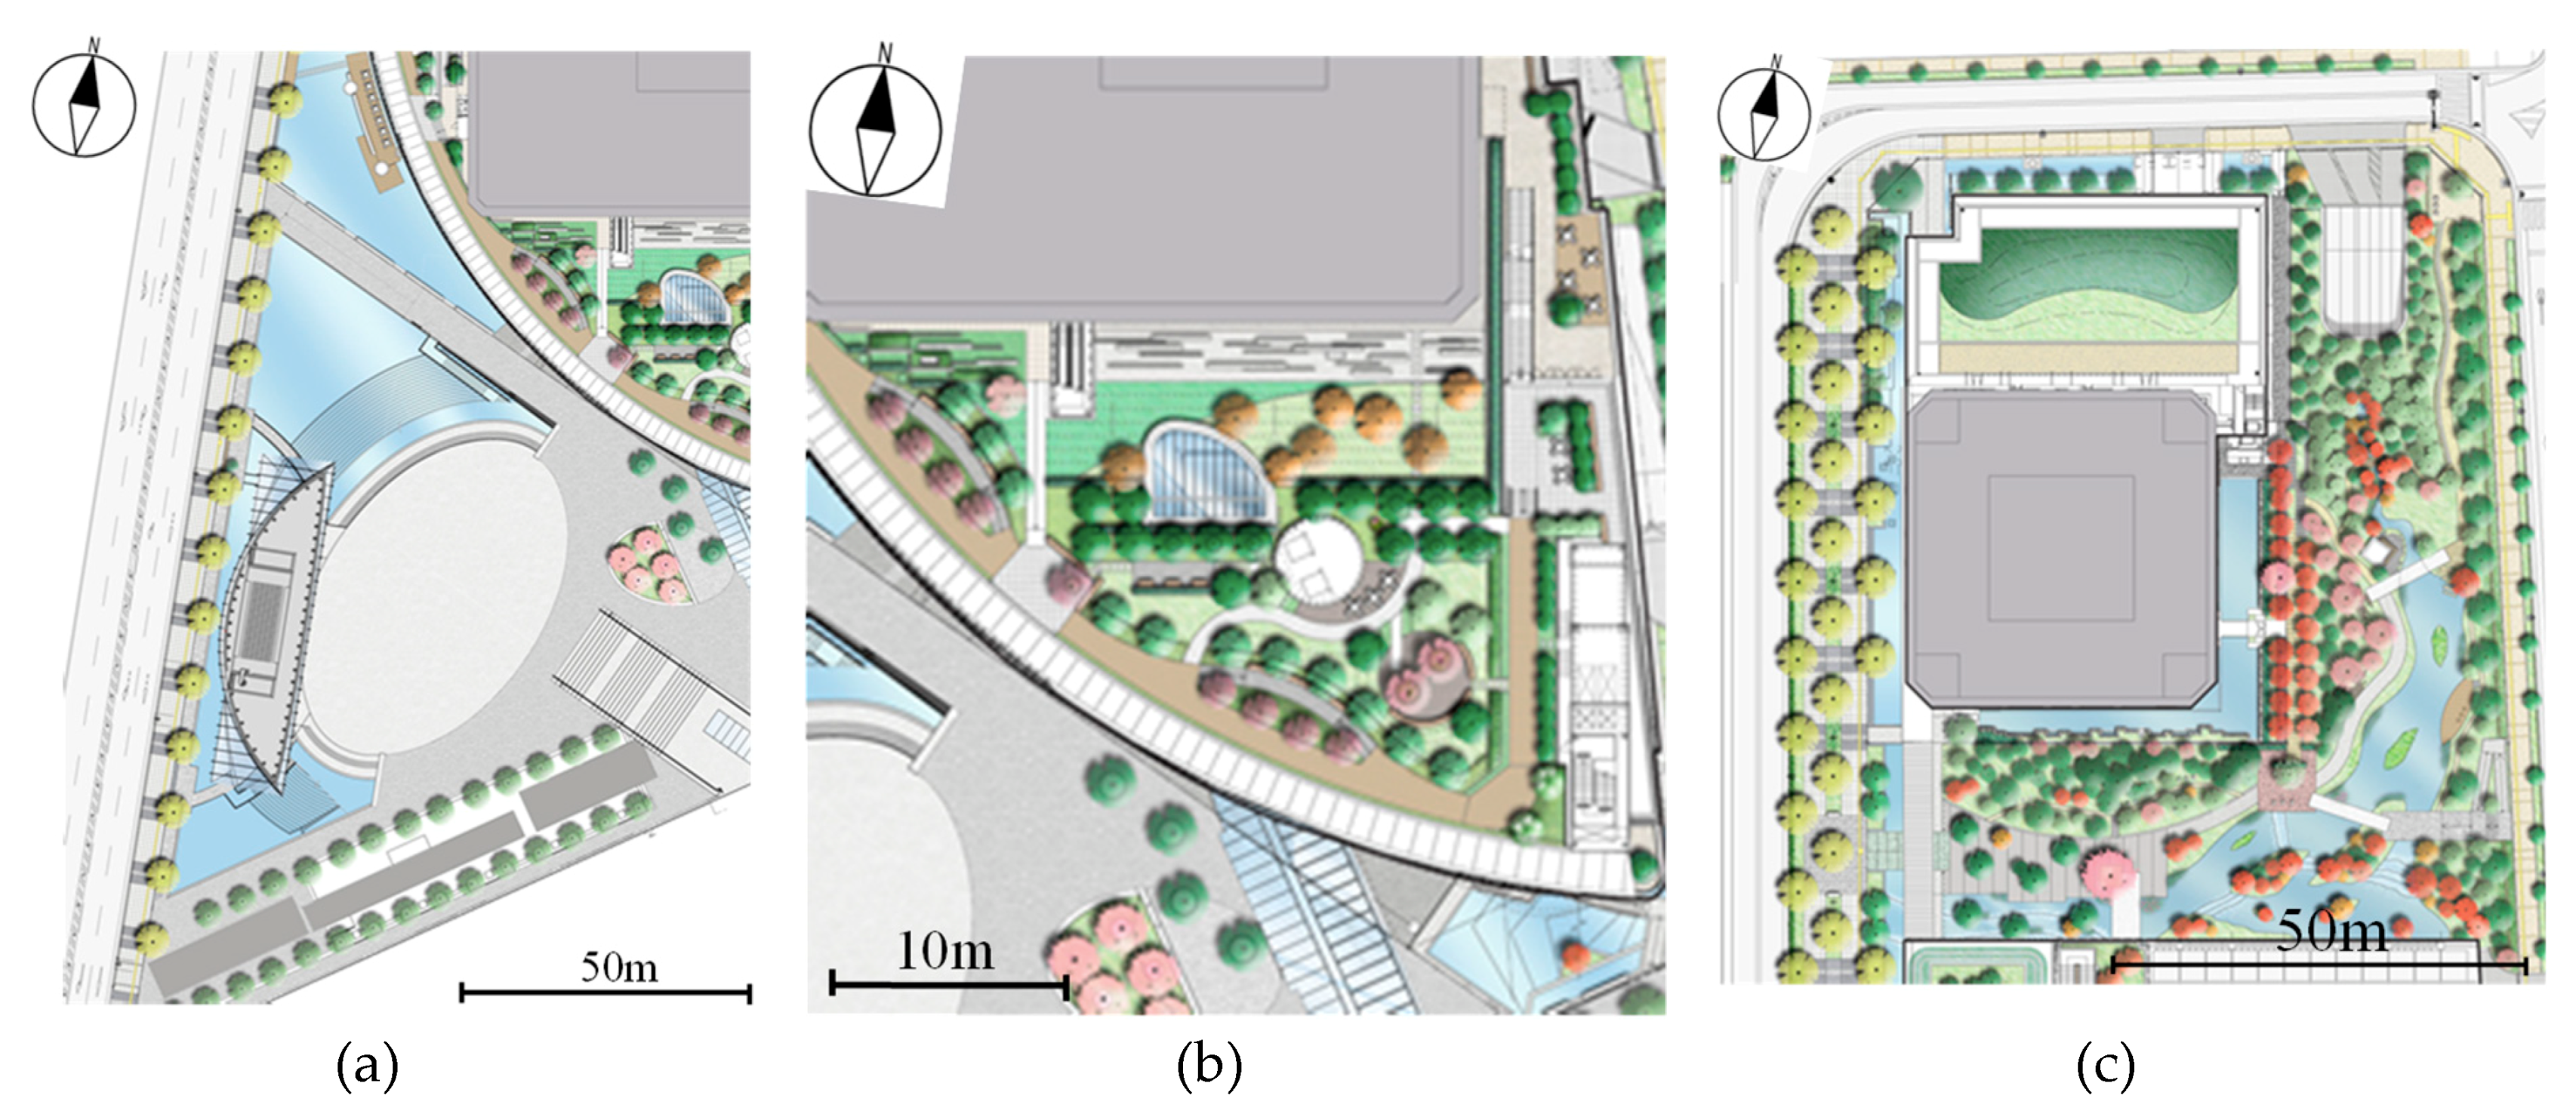
| Study Sites | Location | Land Cover Characteristics |
|---|---|---|
| Station Plaza | The site is beside the north-eastern (180 m high) and the southern (150 m high) high-rise buildings. | There is little vegetation cover, and open spaces (concrete surfaces) and water surfaces dominate. |
| Rooftop Gardens | The site is on the southern (45 m high) and the central (43 m high) middle-rise buildings. | The ratios of concrete, wood deck, and grass are similar, ~30%. |
| Green Garden | The site is between the northern (174 m high) and the central (154 m high) high-rise buildings. | The site features green grassy areas, water surfaces, medium-height trees, and concrete walkways. |
| Element | Method |
|---|---|
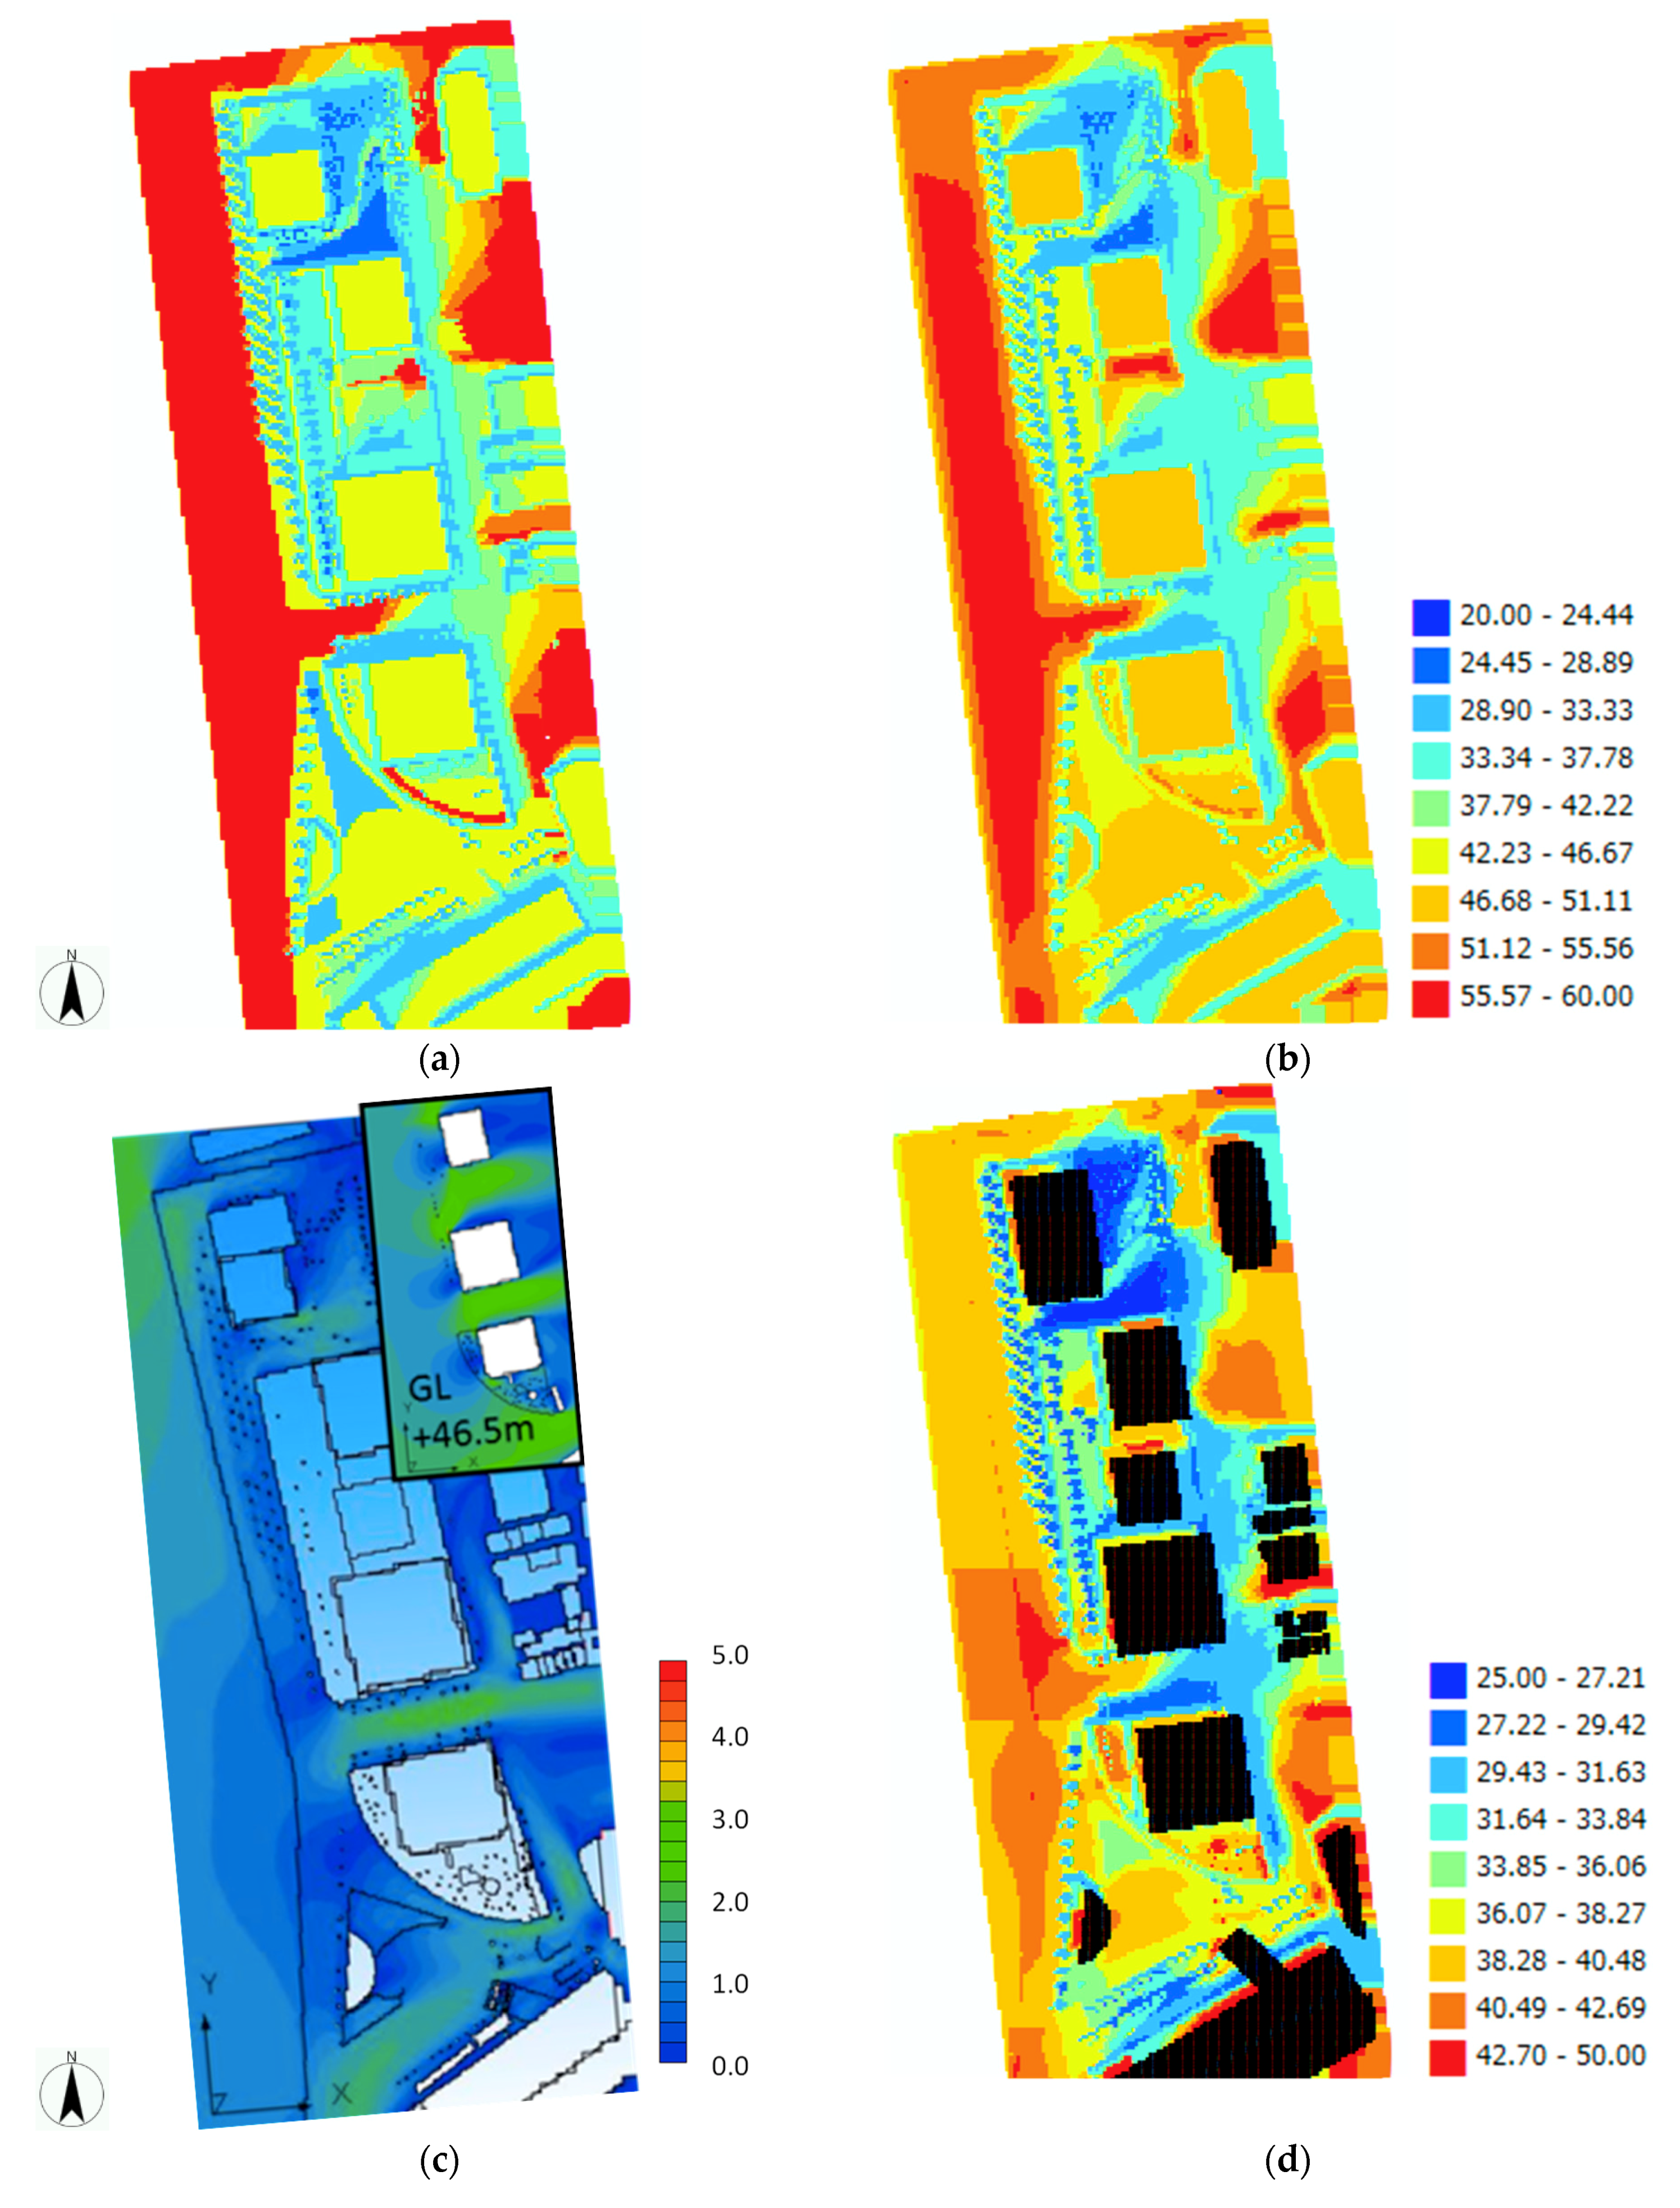
| Surface temperature | It is calculated based on the surface heat budget equation in each 2 m size mesh of the ground and building wall. Air temperature, air absolute humidity, underground temperature, convection heat, and moisture transfer coefficients of the function of wind velocity are set by the observation values as boundary conditions. |
| Incident solar radiation | It is calculated using ArcGIS and building shape data, as per the method described by Takebayashi et al. [5]. The visible area of the upper hemisphere is calculated by ArcGIS tool considering the influence of the adjacent buildings. The visible area is then overlain with the sun-map and sky-map raster to calculate the diffuse and direct solar radiation received from each direction. |
| Mean Radiant Temperature | MRT of the human body is calculated using surface temperature and incident solar radiation. The human body is assumed to be a sphere, and solar radiation absorption ratio of the human body is assumed to be 0.5, considering the clothing conditions in summer. |
| Wind velocity | It is calculated by computational fluid dynamics (CFD) reproducing buildings, obstacles, trees, and the surroundings. The standard k-ε turbulence model (one of the Reynolds–Averaged Navier–Stokes equation (RANS) models) is selected for use in the simulation. A general purpose CFD software (STREAM, version 9, Software Cradle Co. Ltd., Osaka, Japan) is used for calculation. The Navier–Stokes equations are discretized using a finite volume method, and the SIMPLE algorithm is used to handle pressure-velocity coupling. Inflow boundary conditions are given based on weather conditions. |
| Software | STREAM ver. 9 |
|---|---|
| Turbulence model | Standard k-ε model |
| Advection term | Up-wind difference scheme |
| Inflow boundary | Power low, 3.9 m/s, WSW at 50.9 m high, power: 0.27 |
| Outflow boundary | Zero gradient condition |
| Up, side boundary | Free-slip condition |
| Wall, ground surface | Generalized log-low |
| Convergence criterion | 10−5 |
| SET* Reduction | Station Plaza | Rooftop Gardens | Green Garden |
|---|---|---|---|
| Solar radiation shading | 8.0 °C | 6.0 °C | 6.0 °C |
| Surface materials change from concrete | to water surface 2.0 °C (sunny) 1.0 °C (shade) | to green cover 0 °C (sunny) 1.5 °C (shade) | to green cover 2.5 °C (sunny) 1.0 °C (shade) to water surface 2.5 °C (sunny) 1.5 °C (shade) |
| Ventilation | 0.3 °C | 0.5–1.5 °C | 0 °C |
© 2019 by the author. Licensee MDPI, Basel, Switzerland. This article is an open access article distributed under the terms and conditions of the Creative Commons Attribution (CC BY) license (http://creativecommons.org/licenses/by/4.0/).
Share and Cite
Takebayashi, H. Thermal Environment Design of Outdoor Spaces by Examining Redevelopment Buildings Opposite Central Osaka Station. Climate 2019, 7, 143. https://doi.org/10.3390/cli7120143
Takebayashi H. Thermal Environment Design of Outdoor Spaces by Examining Redevelopment Buildings Opposite Central Osaka Station. Climate. 2019; 7(12):143. https://doi.org/10.3390/cli7120143
Chicago/Turabian StyleTakebayashi, Hideki. 2019. "Thermal Environment Design of Outdoor Spaces by Examining Redevelopment Buildings Opposite Central Osaka Station" Climate 7, no. 12: 143. https://doi.org/10.3390/cli7120143
APA StyleTakebayashi, H. (2019). Thermal Environment Design of Outdoor Spaces by Examining Redevelopment Buildings Opposite Central Osaka Station. Climate, 7(12), 143. https://doi.org/10.3390/cli7120143