Opportunities for Green Energy through Emerging Crops: Biogas Valorization of Cannabis sativa L. Residues


Abstract
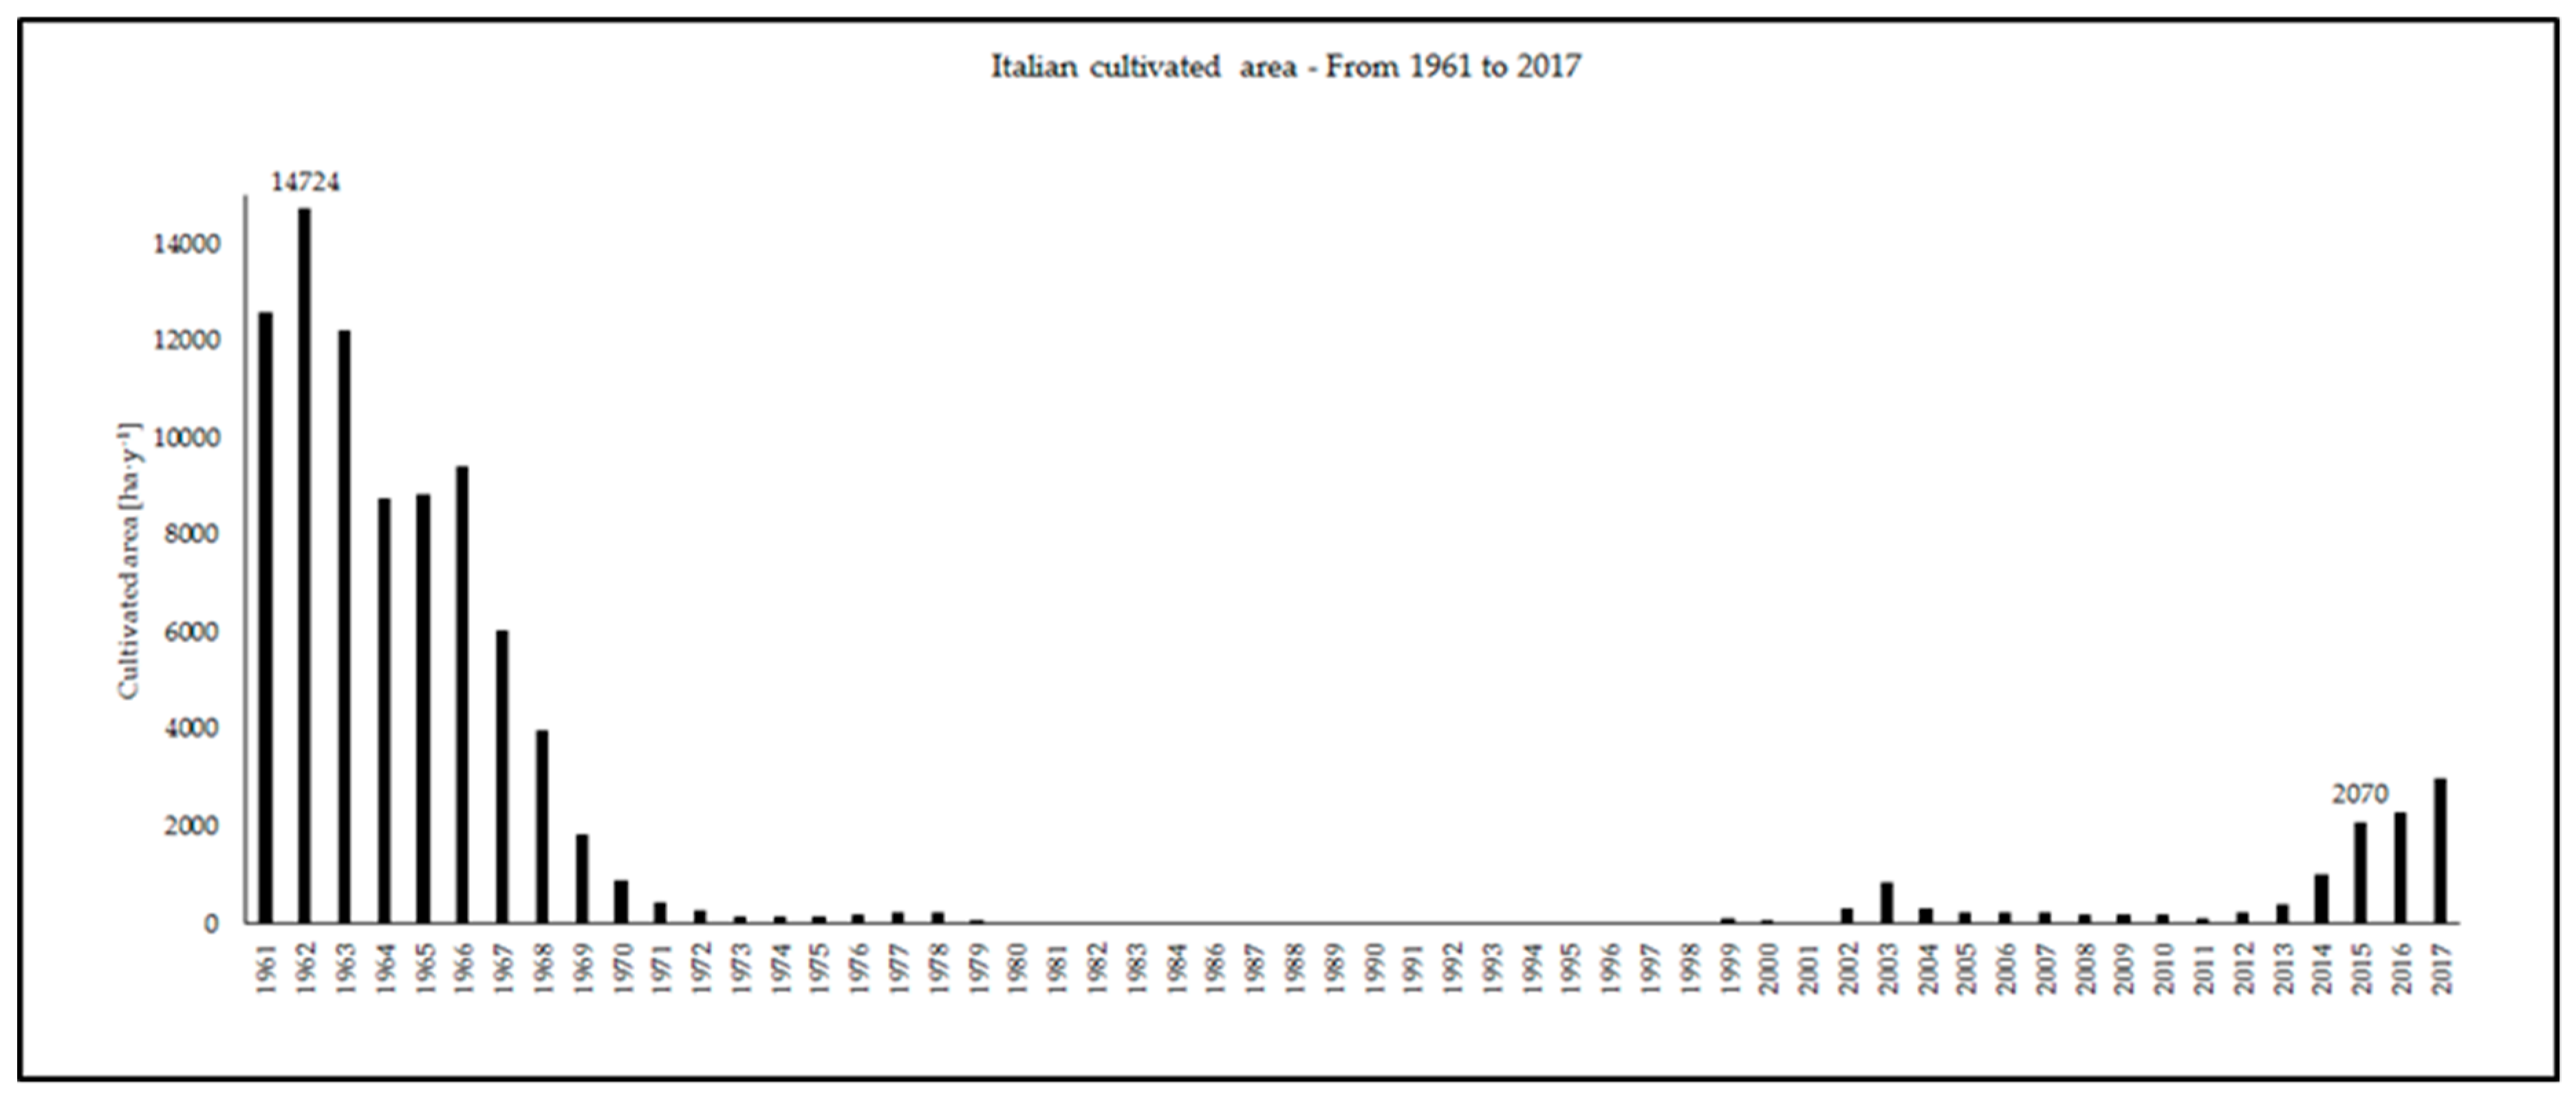
1. Introduction
2. Materials and Methods
2.1. Feedstock Characterization and Pre-Treatment, Admixture Preparation, and Pilot Plant
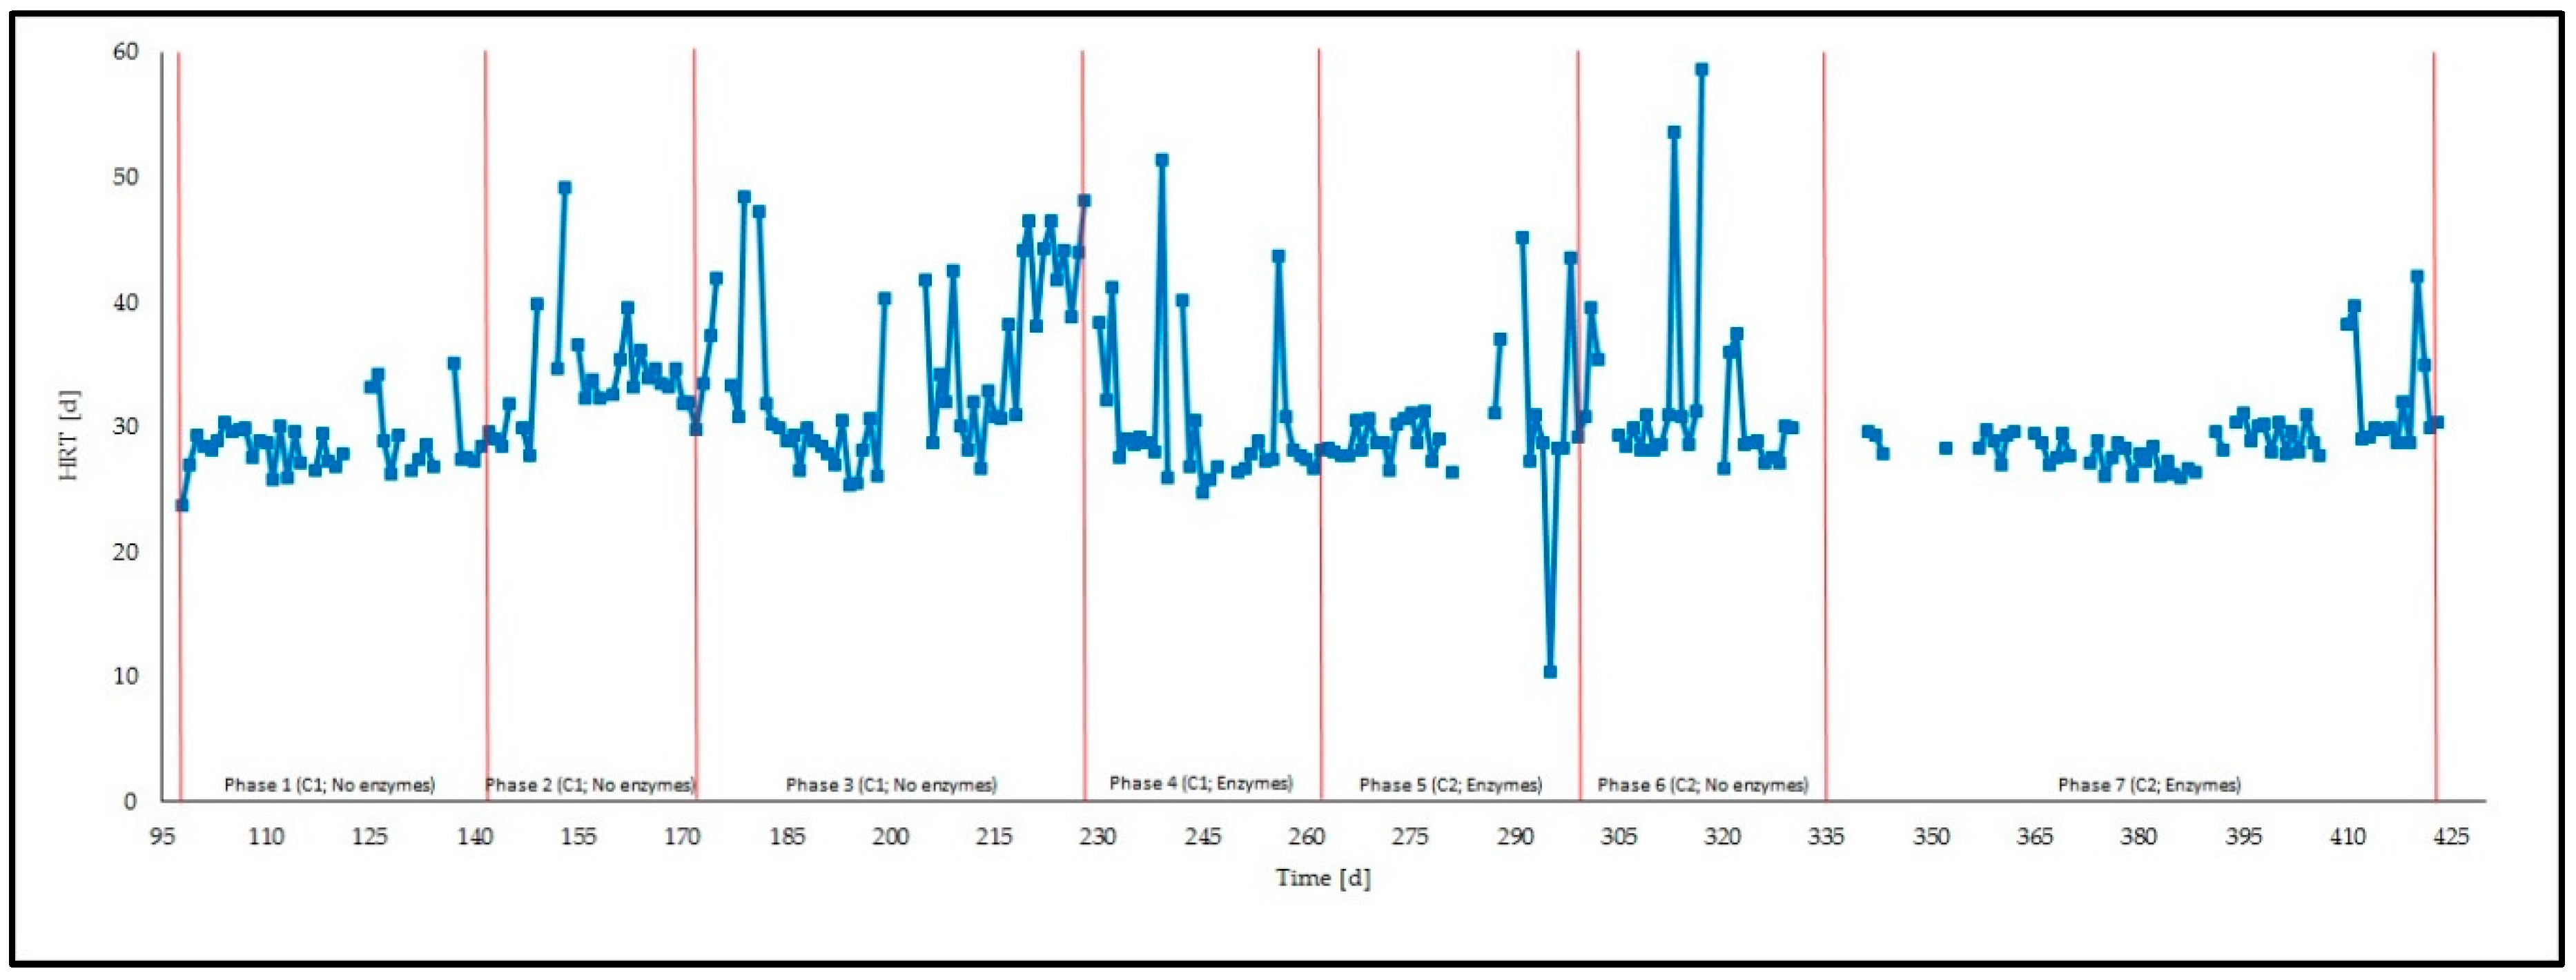
2.2. Feeding Phases
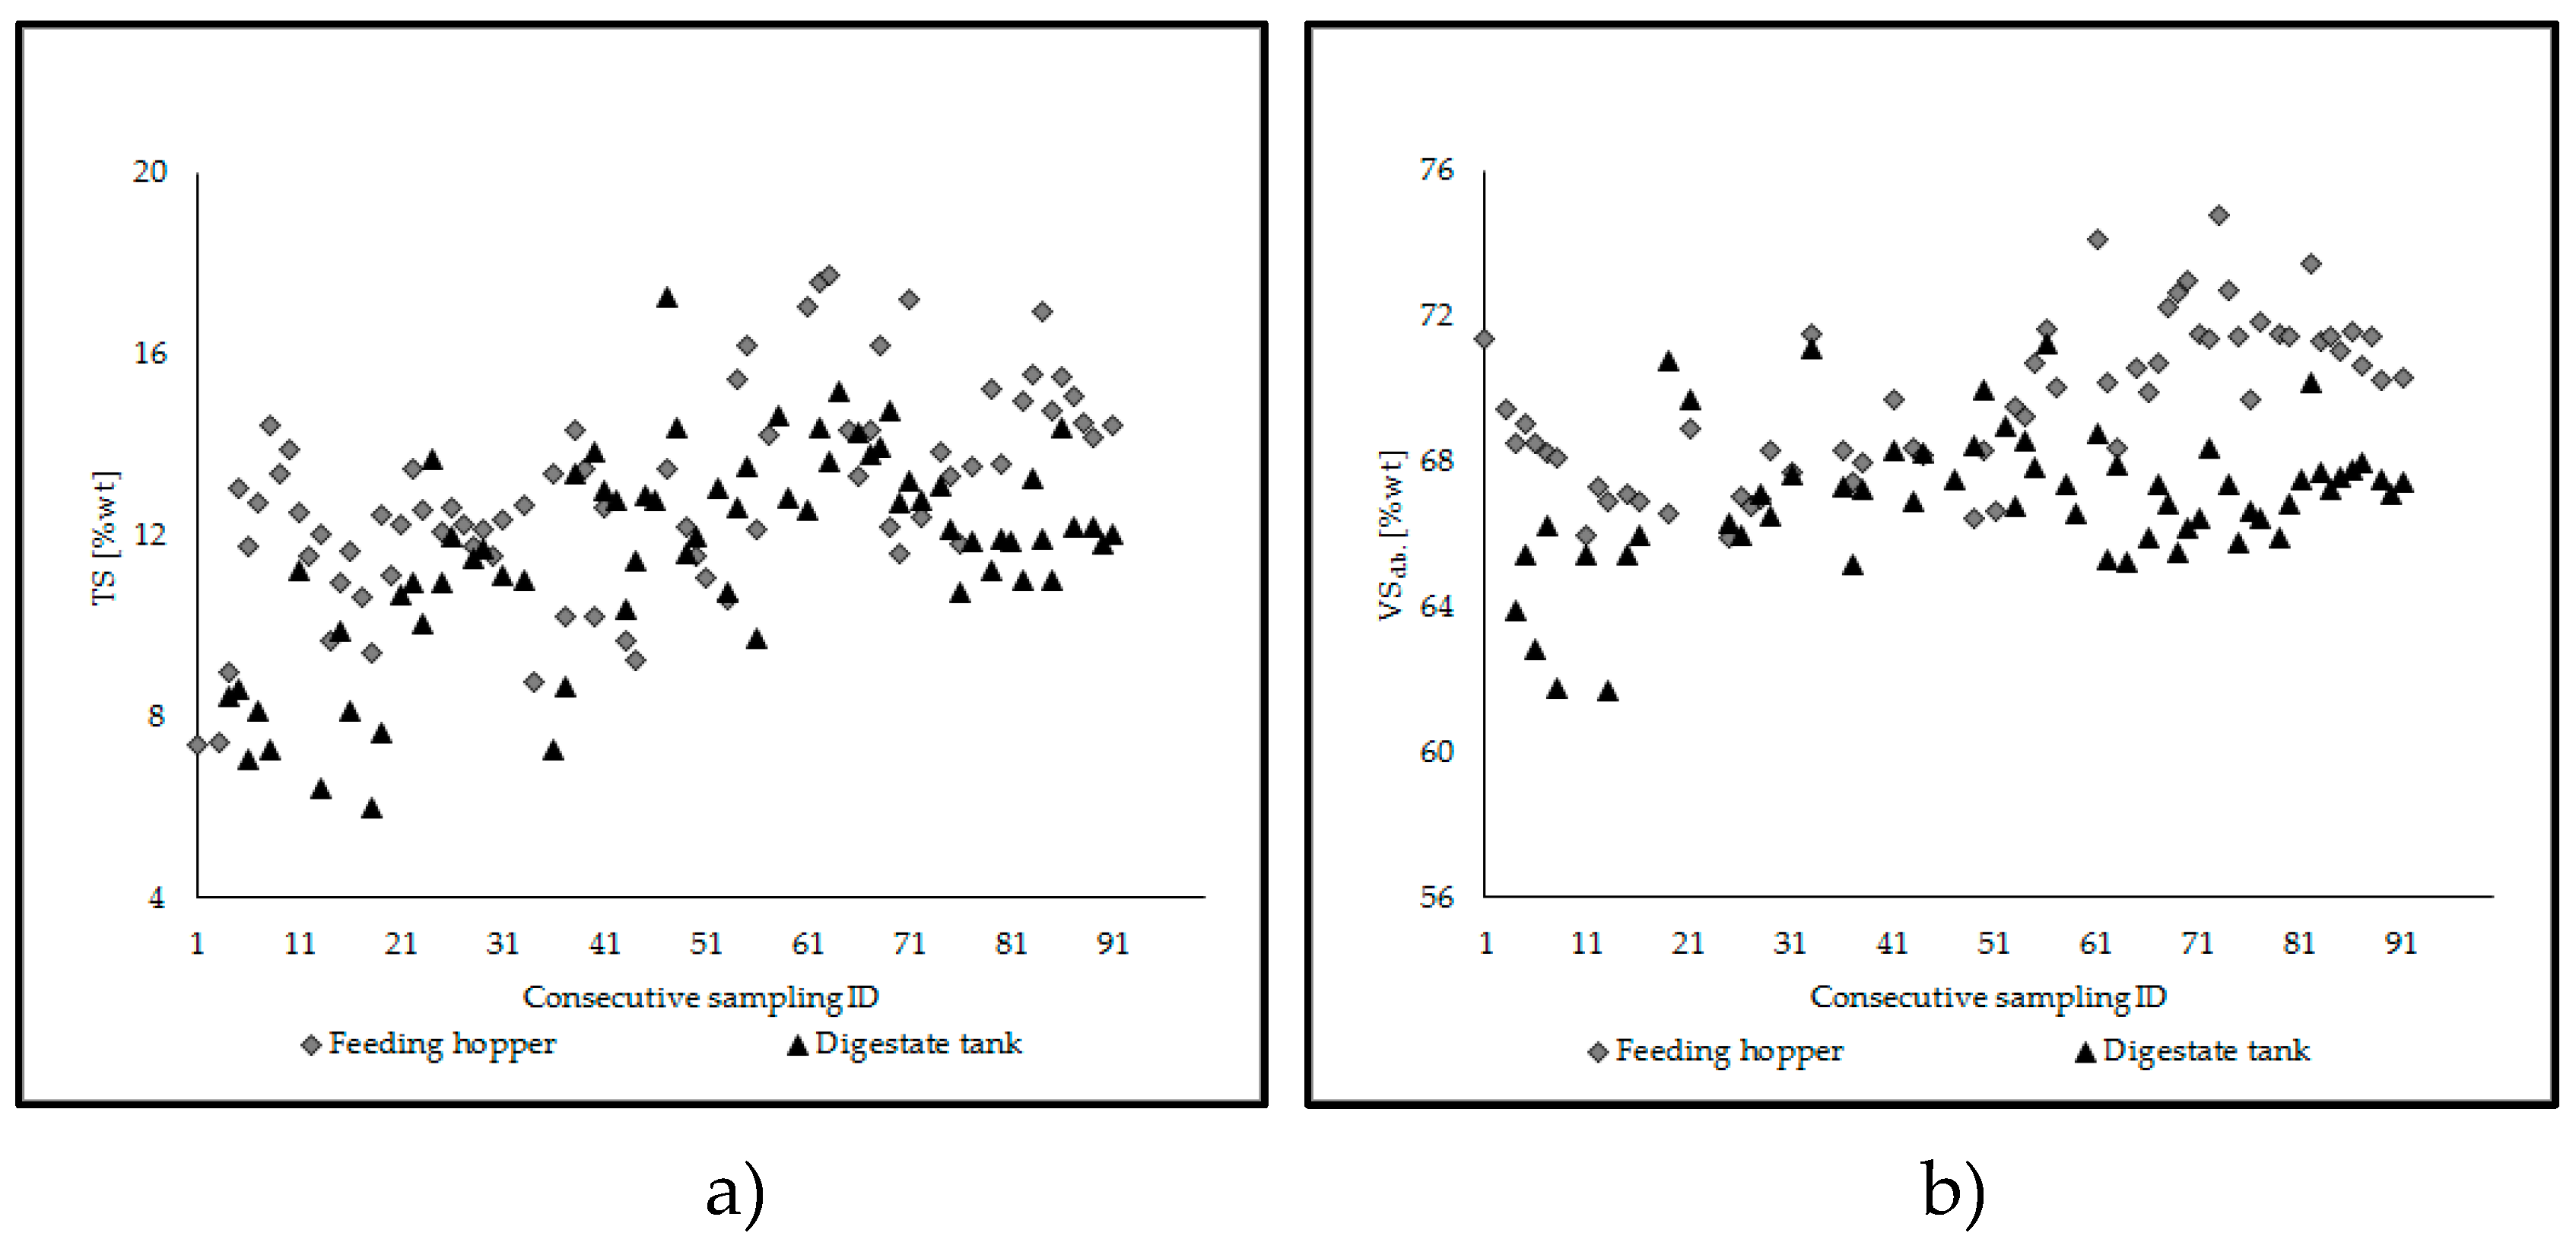
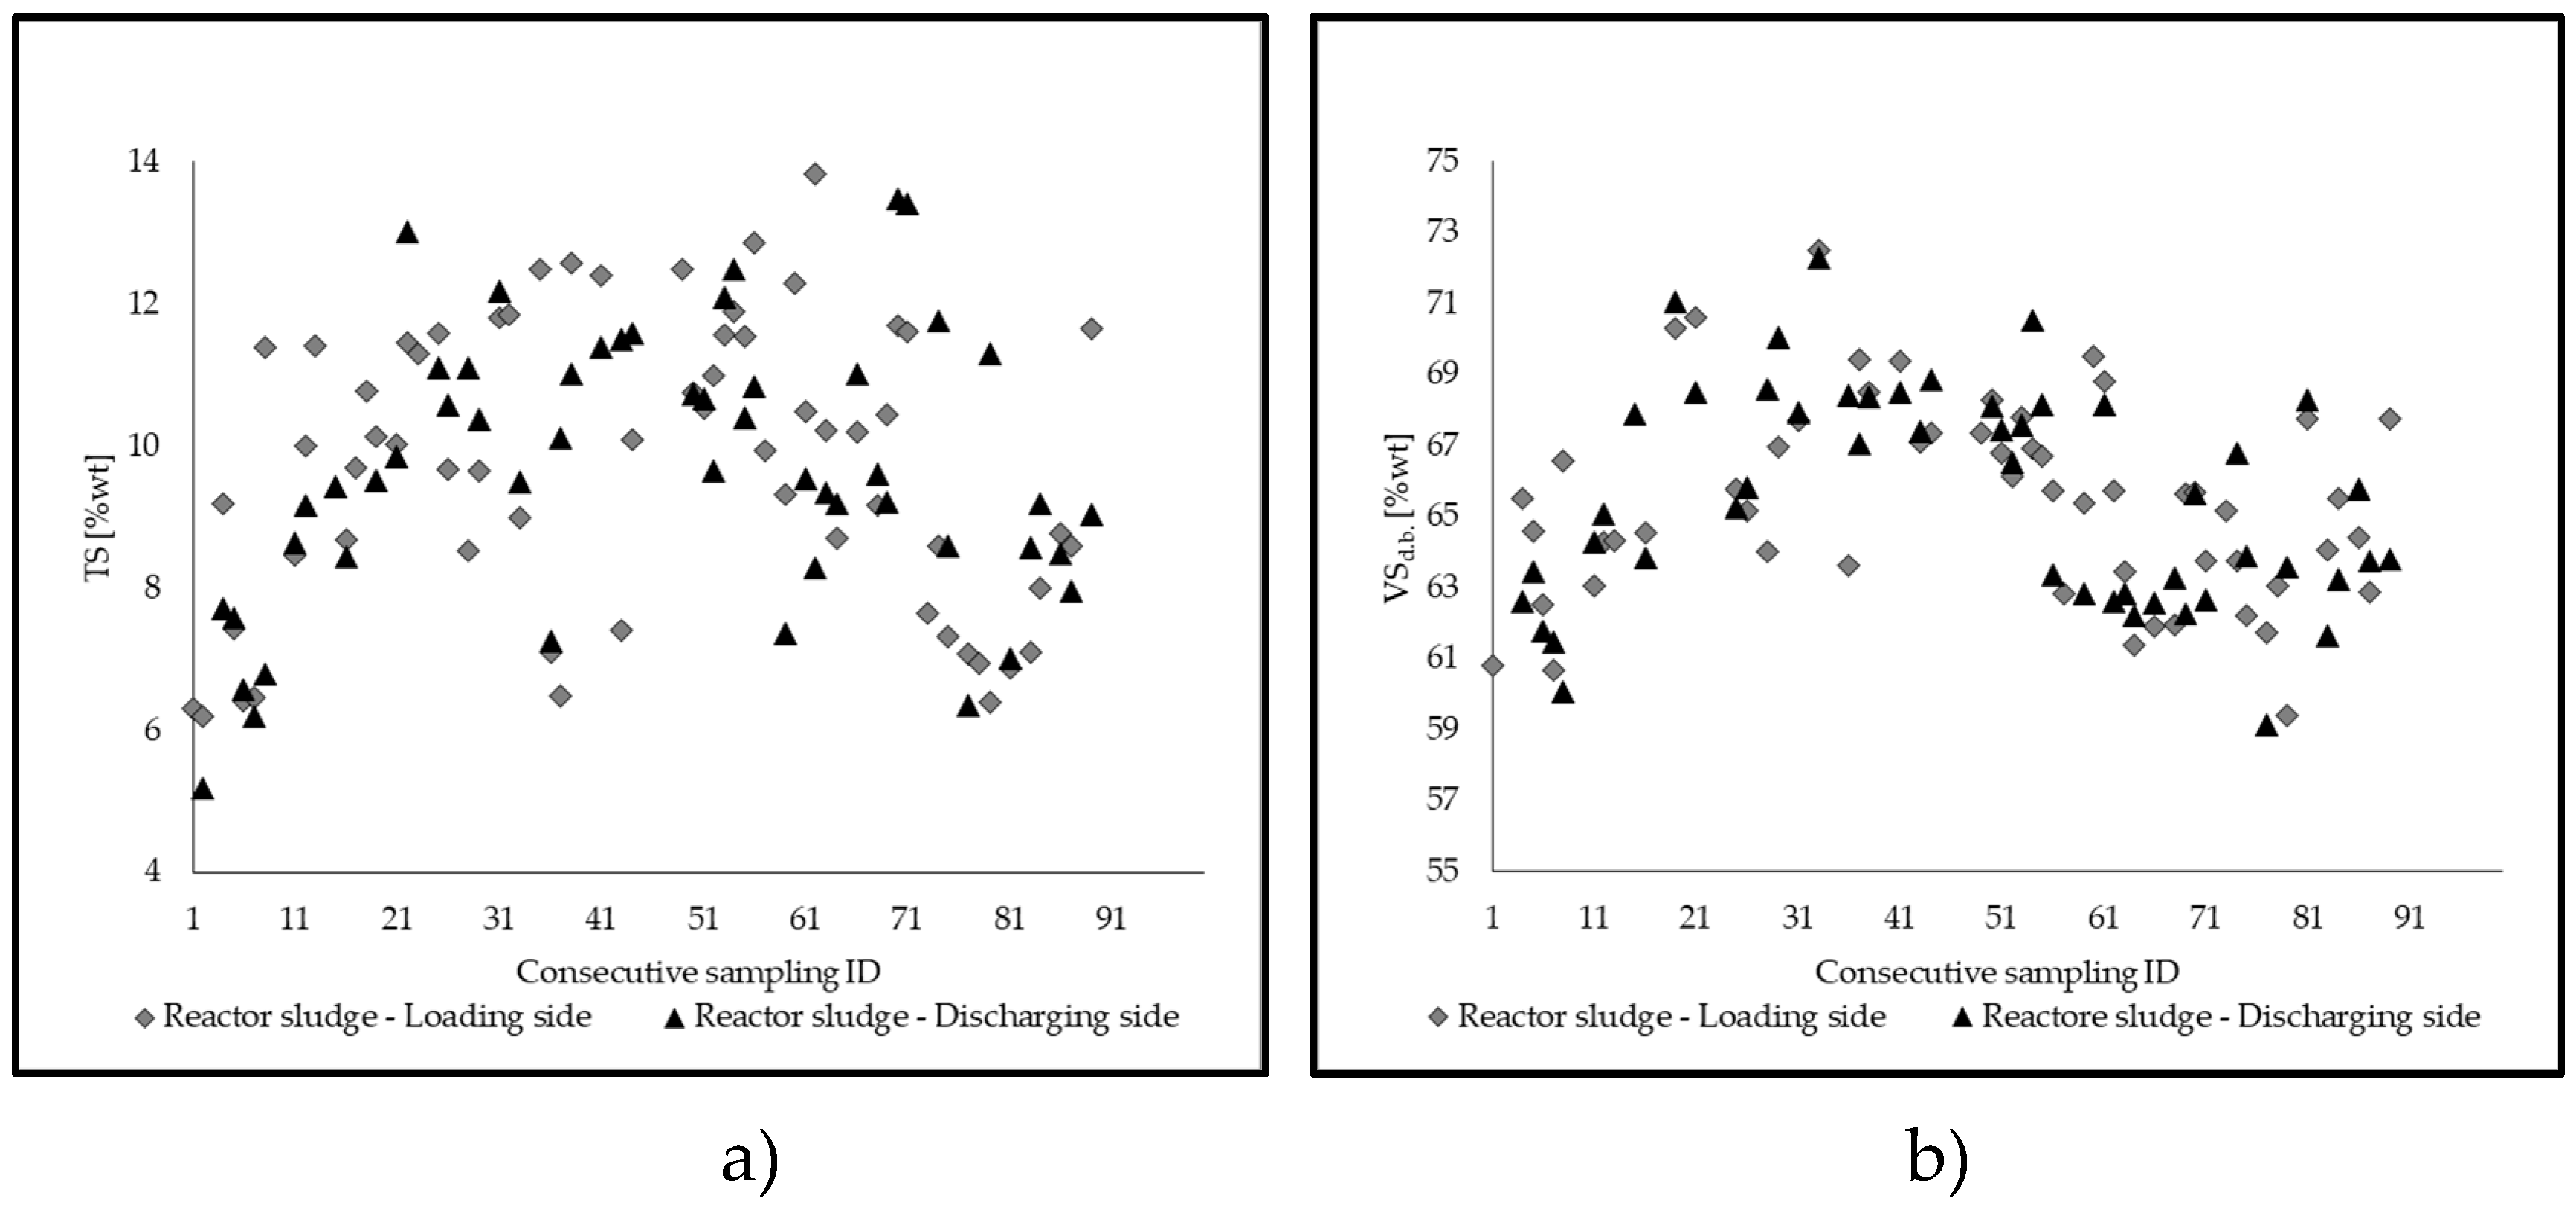
2.3. Management of the Reactor and Process Stability
- TS (total solids), VSd.b., determined via proximate analysis on a weekly/sub-weekly basis for the new admixture introduced into the feeding hopper, the material in the hopper/in the digestate tank, and the sludge inside the reactor;
- HRT [d], calculated as:where V is the total digester volume [m3reactor] and Q is the daily feeding rate [m3substrate·d−1];
- OLR ([kgVS·(m3reactor·d)−1]), calculated as:where S is the VS concentration on a wet basis in the feeding admixtures [%wtw.b.].
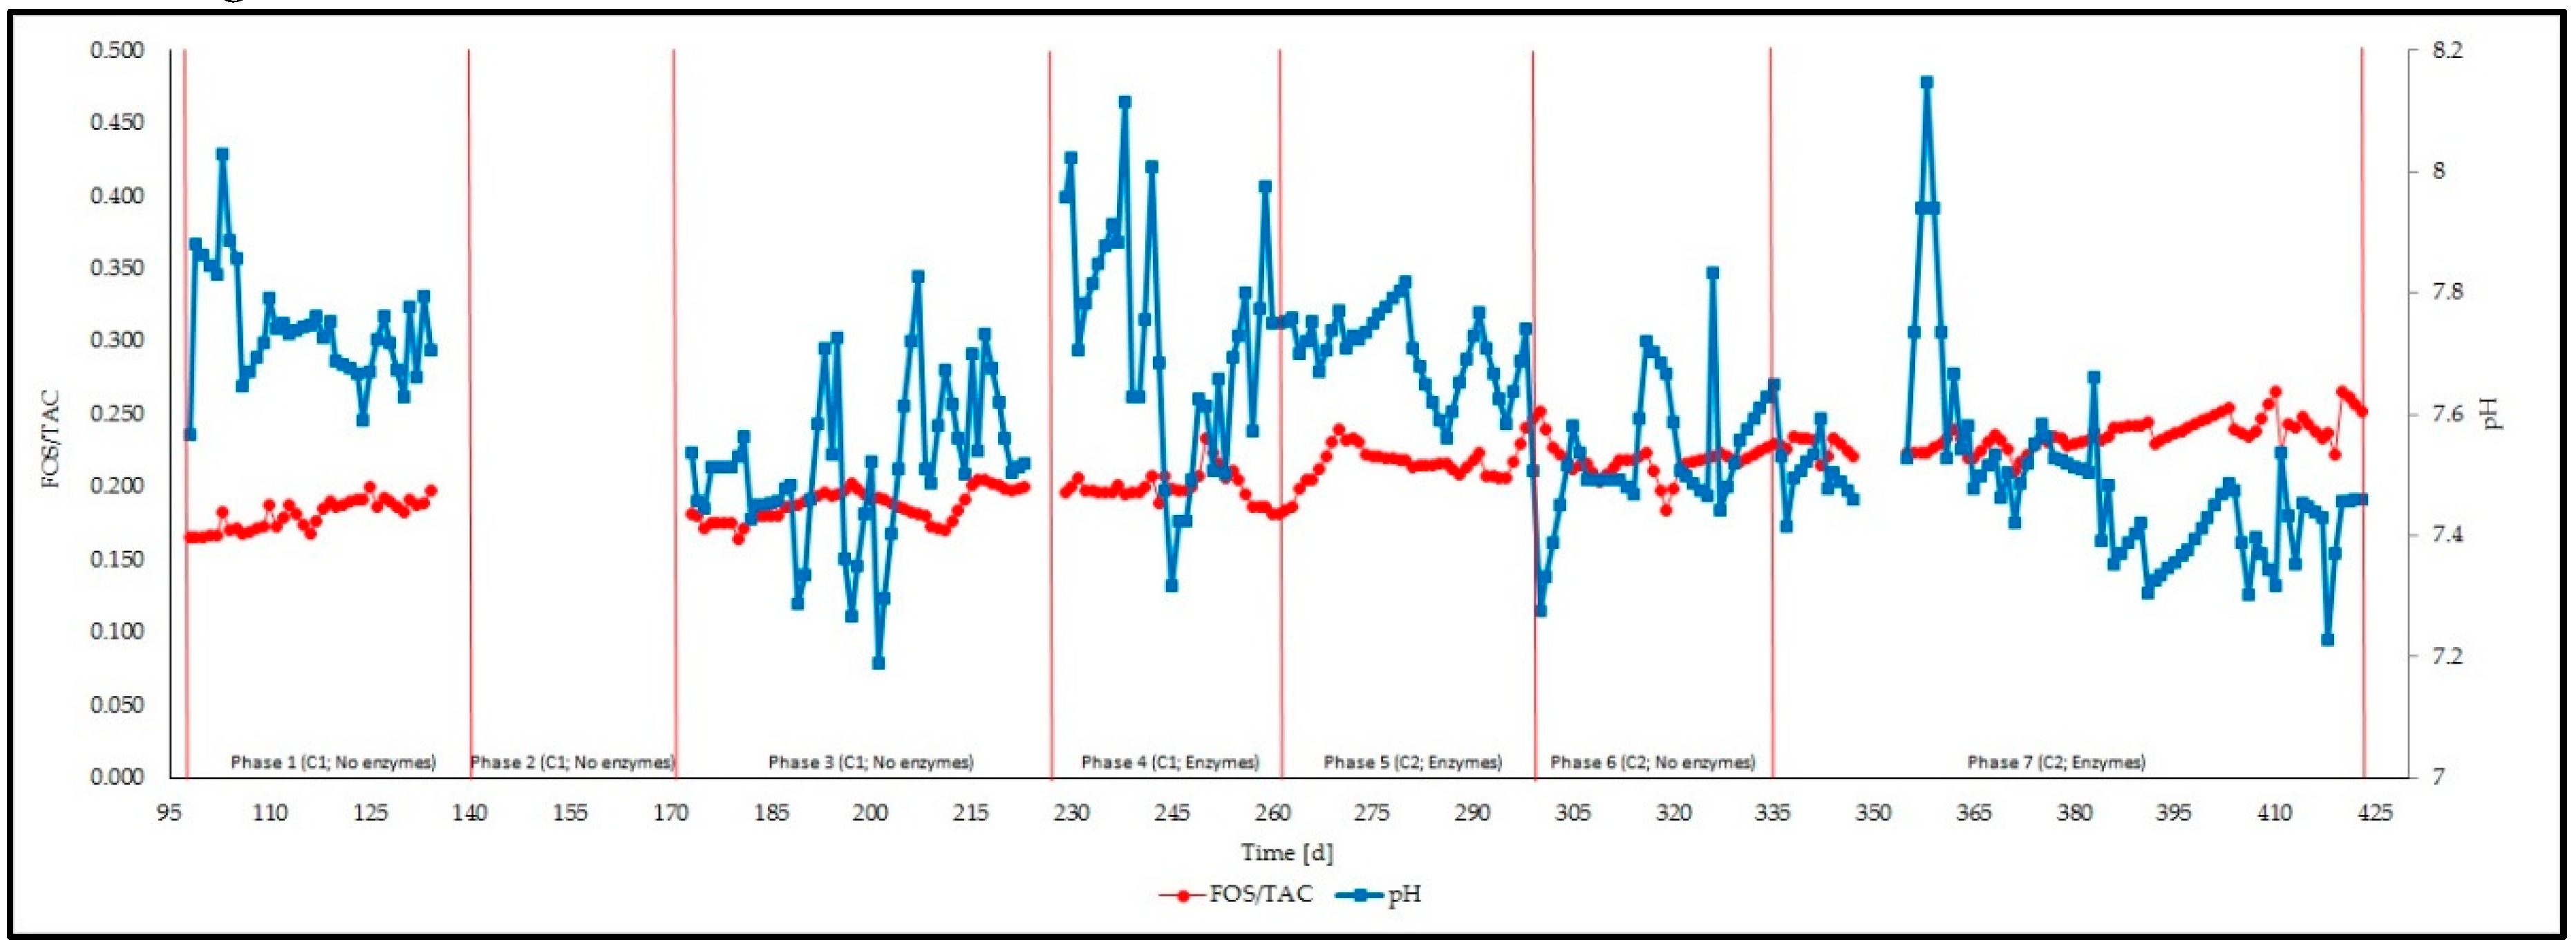
- pH and FOS/TAC ratio (volatile fatty acids content/buffer capacity) of the reactor sludge (daily measures by means of, respectively, a multi-parametric analyzer Orion Versa Star (ThermoScientific Inc., Waltham, MA, USA) and an automatic titrator T70 (Mettler Toledo International Inc., Columbus, OH, USA));
- Biogas production [m3 biogas·d−1] (daily values provided by a biogas flow meter);
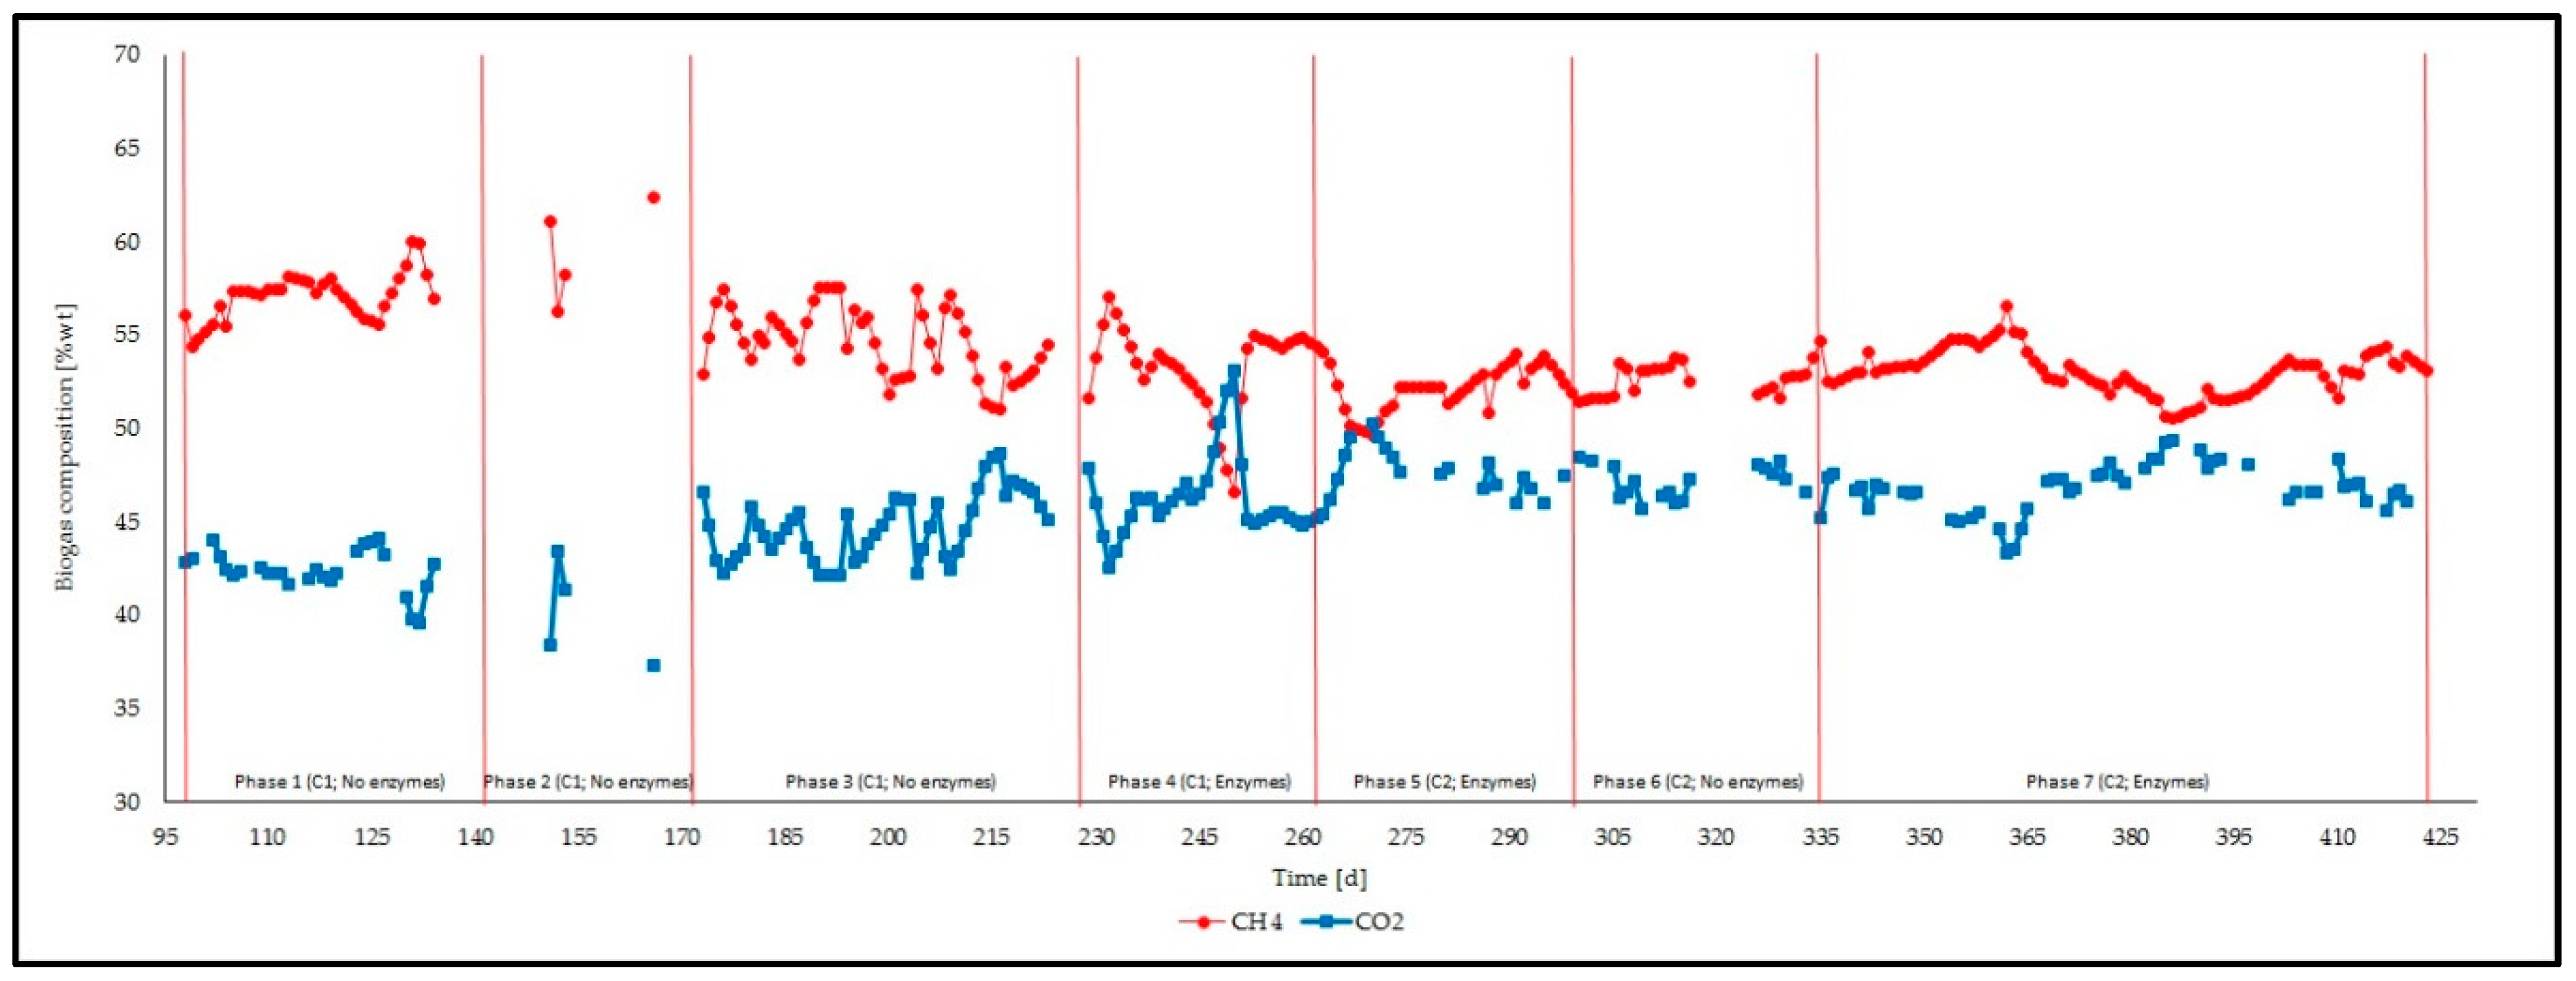
- Biogas composition daily (CH4, CO2, O2 [%wt]; NH3, and H2S [ppm]), determined using a portable gas analyzer GA2000 (Geotechnical Instruments UK Ltd., Coventry, UK). Biogas composition is strictly related to SGP and GPR;
- Temperature of the reactor sludge, measured through three temperature probes located in the center, the loading, and discharging sides of the reactor, and monitored through the PLC.
- SGP [Nm3biogas or methane·kgVS−1], calculated as:where Q and S were already described, G is the daily production of biogas/methane [m3biogas or methane·d−1];
- GPR ([Nm3biogas or methane·(m3reactor·d)−1]), calculated as the daily production of biogas/methane per m3 of sludge accumulated in the reactor.
- C (percentage of new hemp in the admixture, [% wt/wt]), calculated as:where: Masshemp, Massdigestate, and Masswater are the mass of the hemp, digestate, and water composing the admixtures;
- R (digestate recirculation ratio, adimentional), following Equation (5):where ΣiMasshemp and ΣiMassdigestate [g·103] are the cumulative amounts of new hemp or digestate composing hemp-digestate admixtures in a specific time window.
2.4. Statistical Analyses
3. Results and Discussion
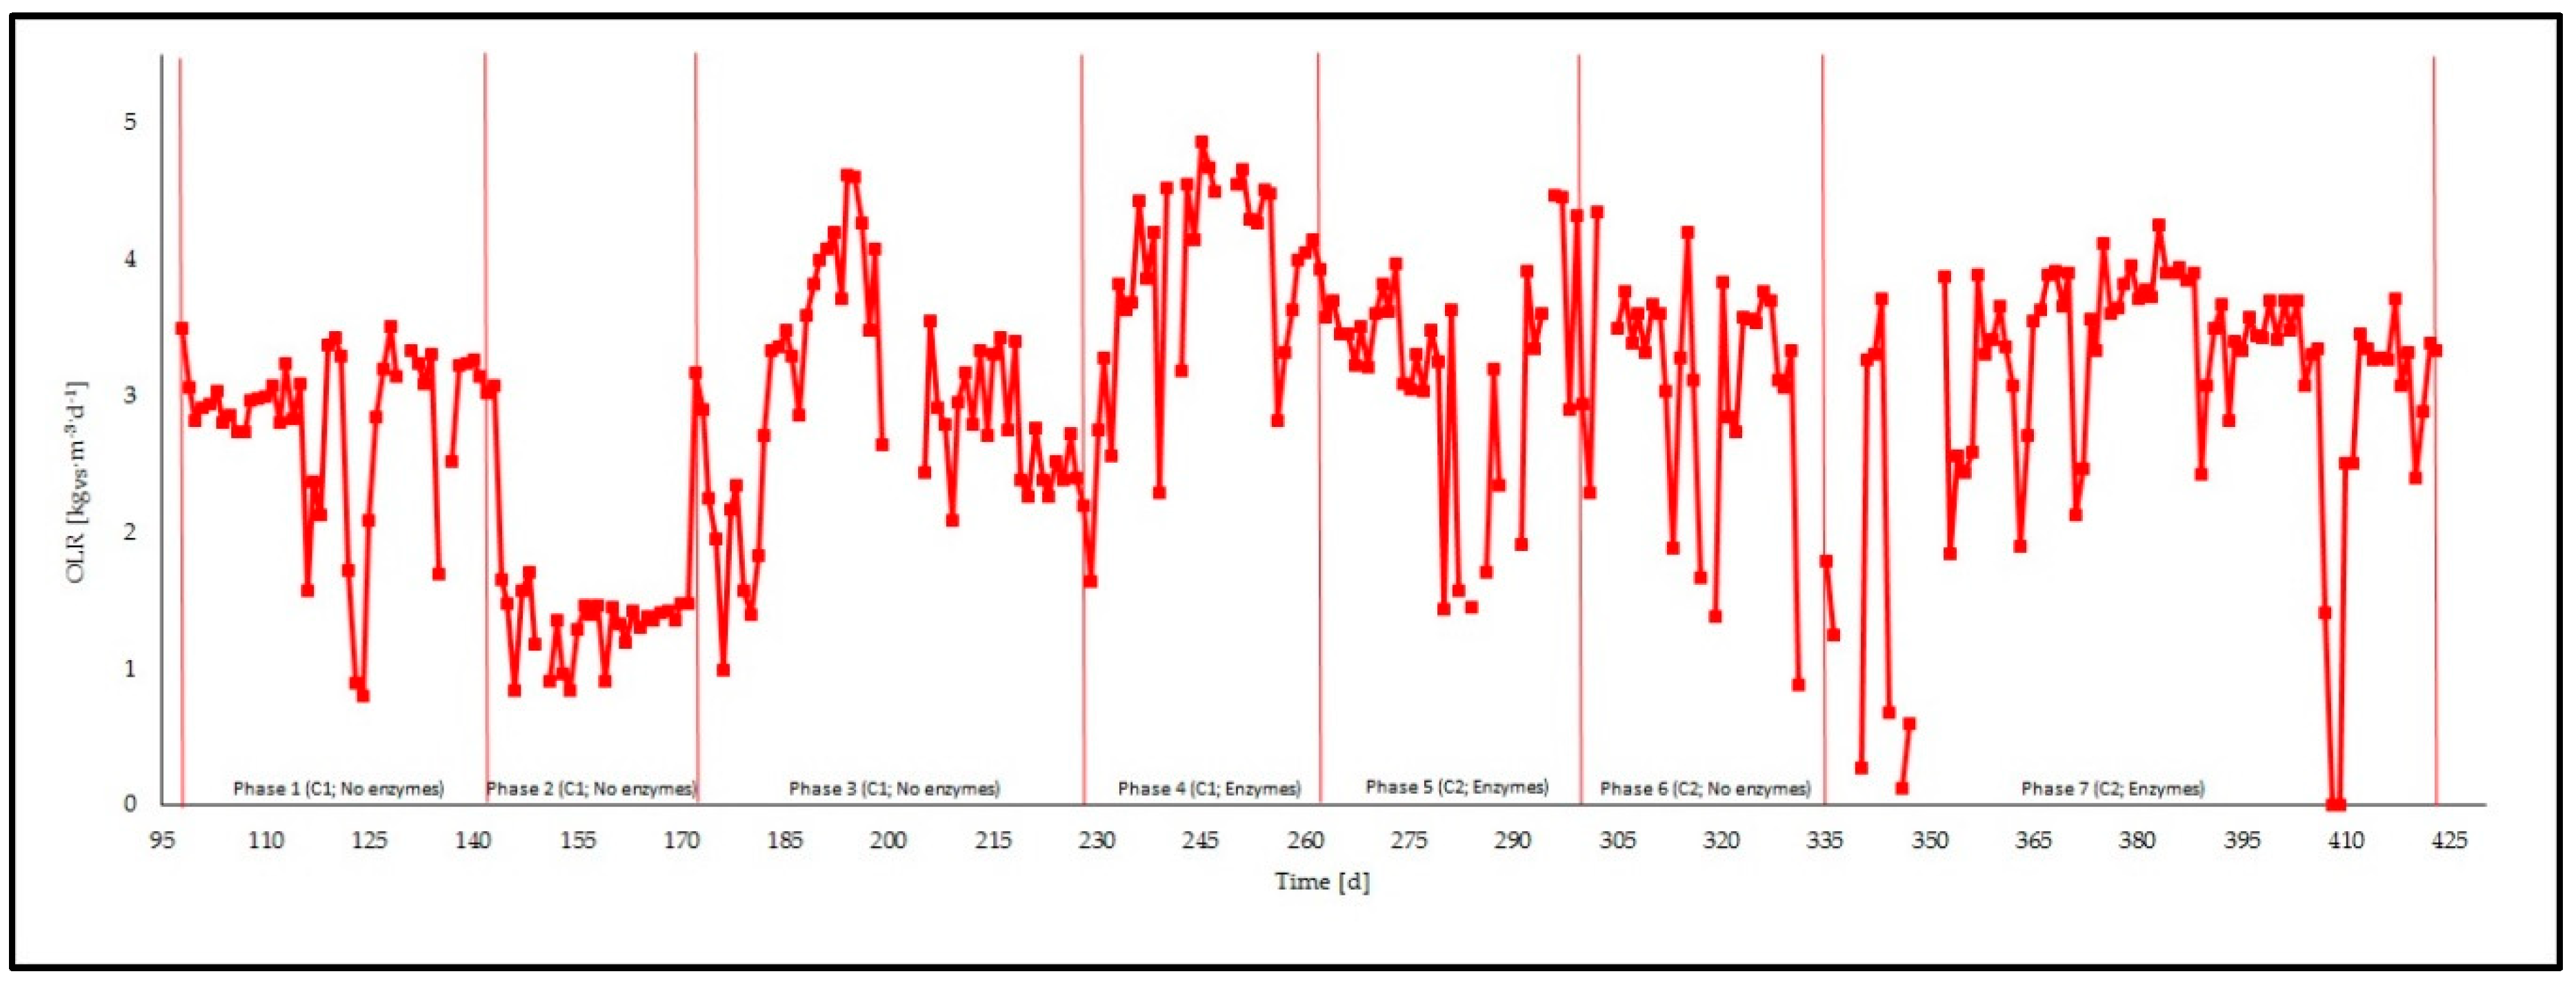
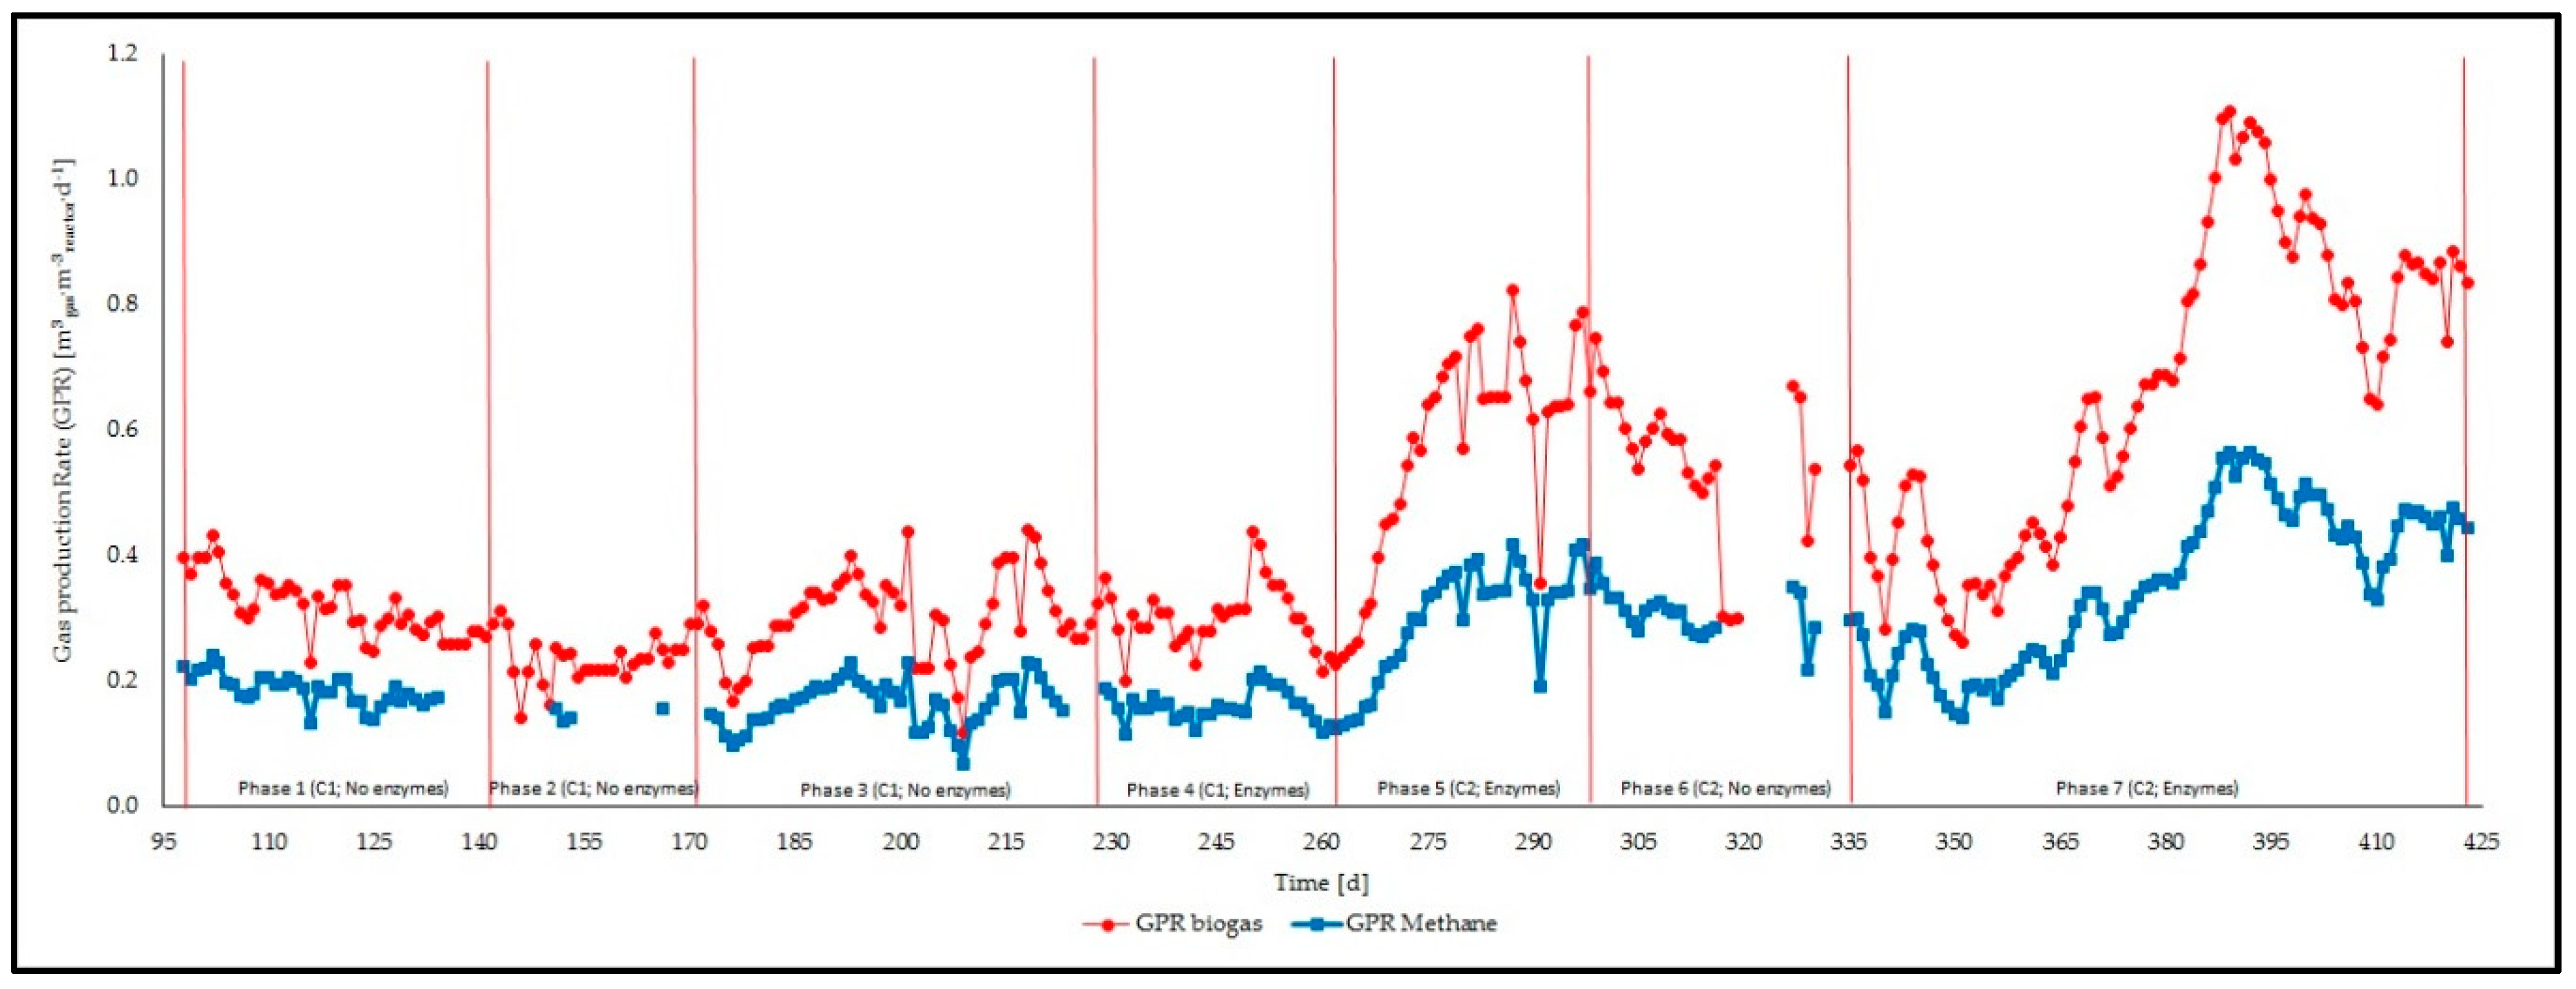
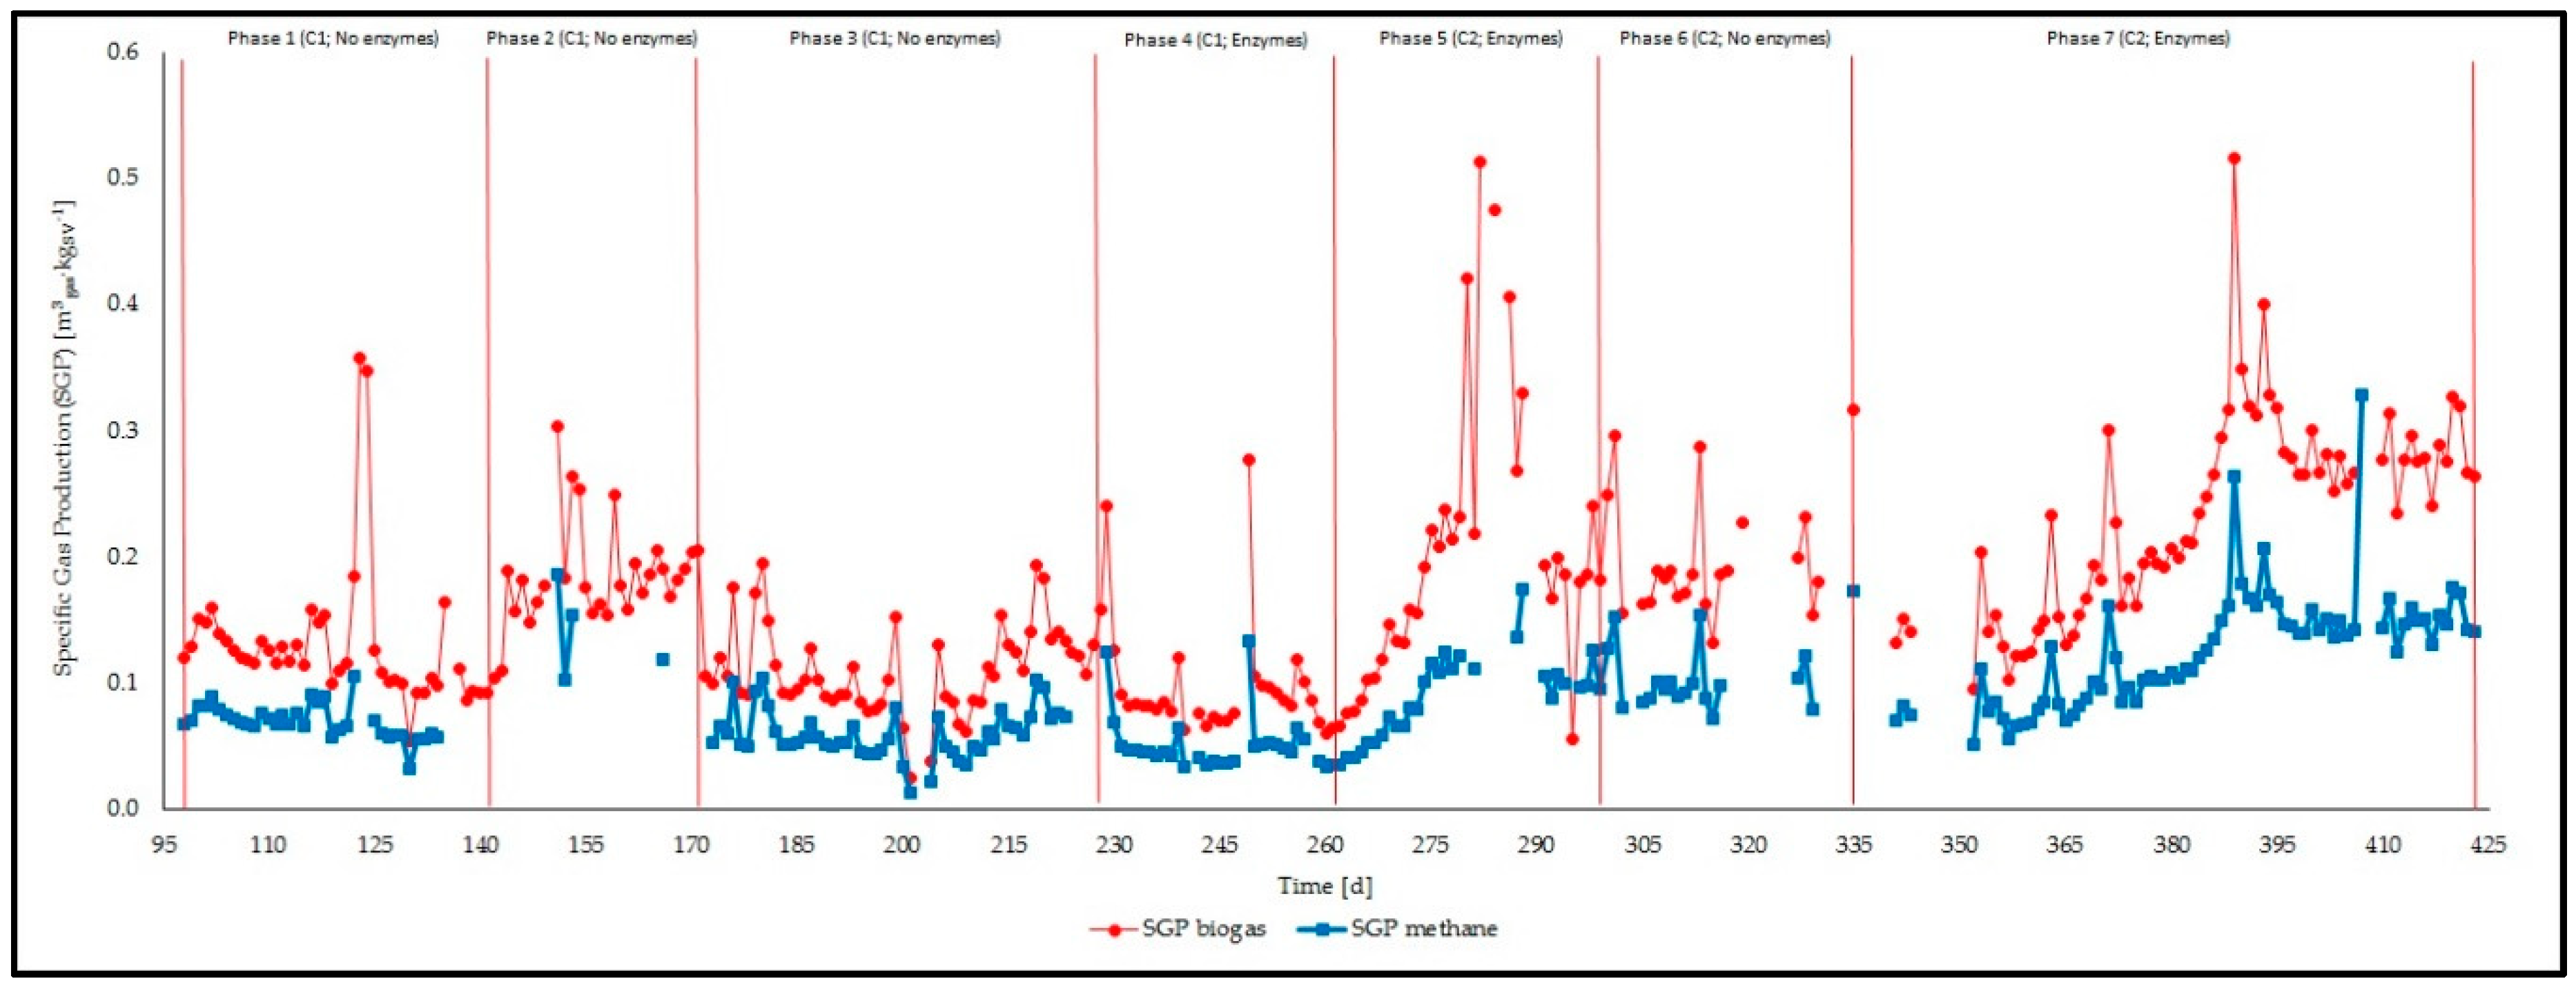
3.1. Feeding Phases
3.2. Management of the Reactor and Process Stability
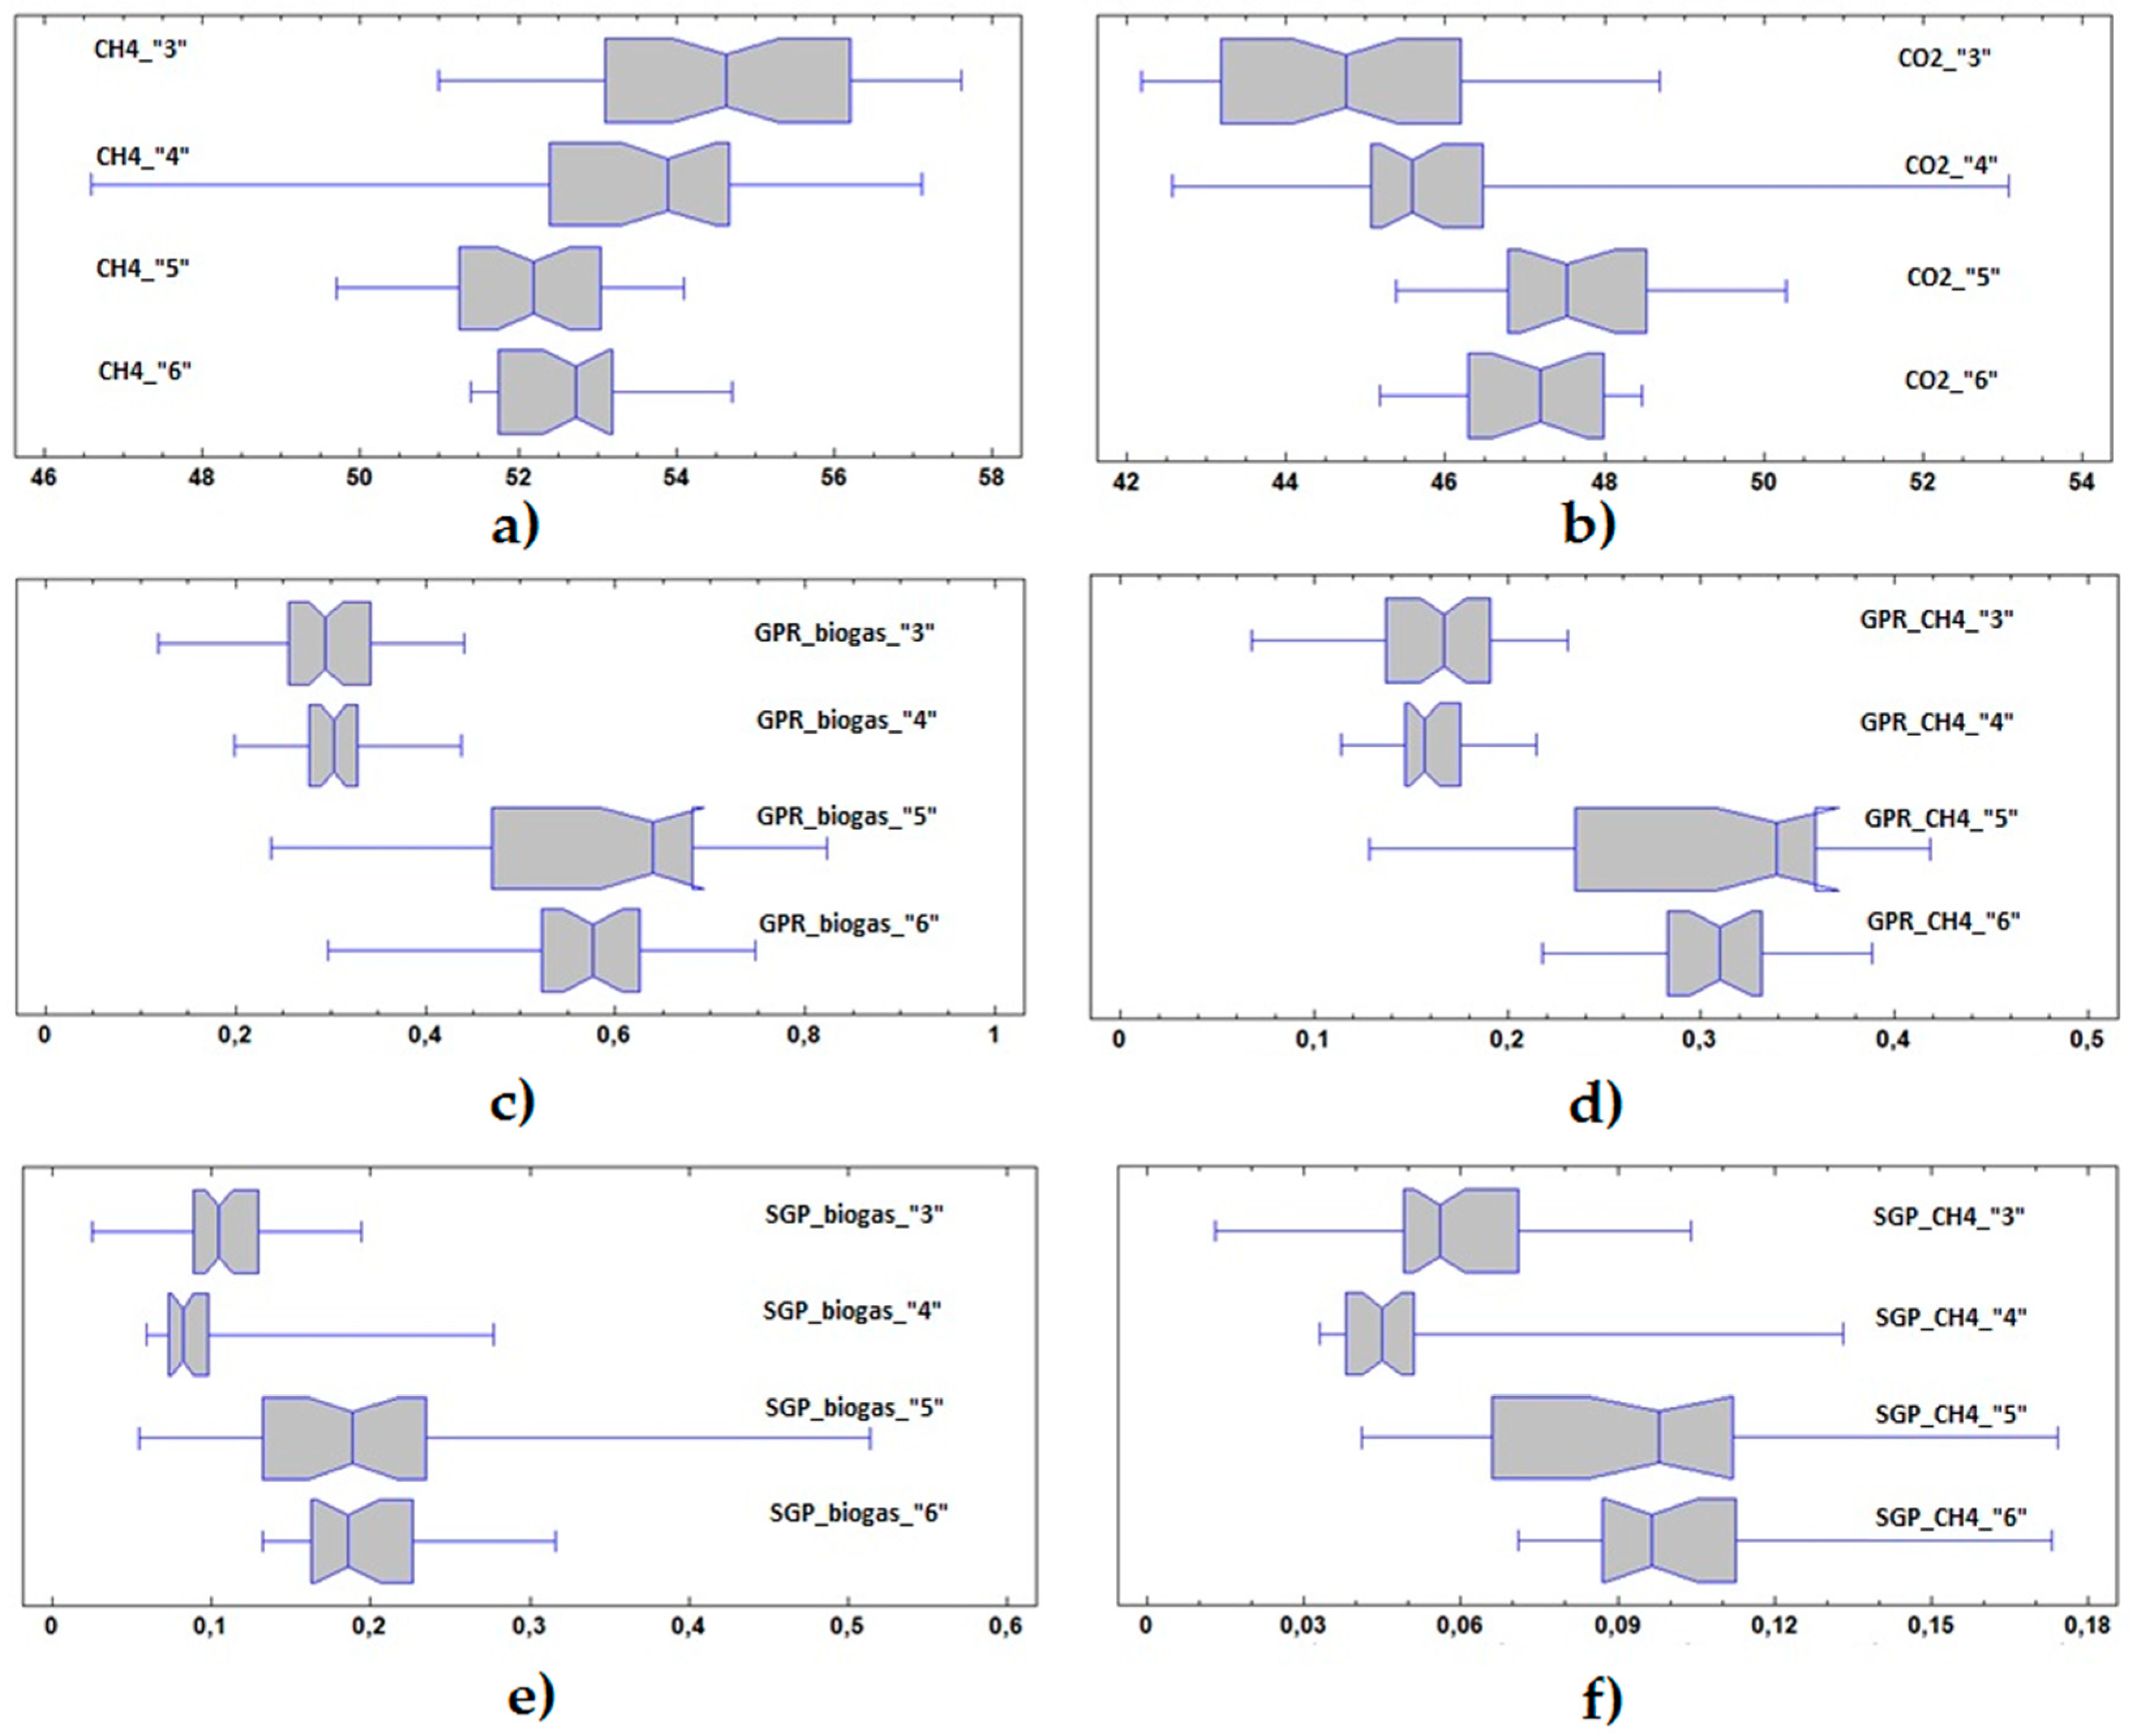
3.3. Statistical Analysis
4. Conclusions
Author Contributions
Funding
Acknowledgments
Conflicts of Interest
References
- Carus, M.; Sarmento, L. The European Hemp Industry: Cultivation, Processing and Applications for Fibres, Shivs, Seeds and Flowers; Report 2016–05; European Industrial Hemp Association: Brussels, Belgium, 2016; p. 9. Available online: eiha.org/media/2016/05/16-05-17-European-Hemp-Industry-2013.pdf (accessed on 1 April 2019).
- Carus, M. The European Hemp Industry: Cultivation, Processing and Applications for Fibres, Shivs, Seeds and Flowers; Report 2017–03-26; European Industrial Hemp Association: Brussels, Belgium, 2017; p. 9. Available online: eiha.org/media/2017/12/17-03_European_Hemp_Industry.pdf (accessed on 1 April 2019).
- Johnson, R. Hemp as an Agricultural Commodity; CRS Report; Congressional Research Service: Washington, DC, USA, 2014; p. 34. [Google Scholar]
- Carus, M.; Karst, S.; Kauffmann, A.; Hobson, J.; Bertucelli, S. The European Hemp Industry: Cultivation, Processing and Applications for Fibres, Shivs and Seeds; European Hemp Industry Association: Brussels, Belgium, 2013; Available online: www.votehemp.com/wp-content/uploads/2018/09/13-03_European_Hemp_Industry.pdf (accessed on 1 April 2019).
- Żuk-Gołaszewska, K.; Gołaszewski, J. Cannabis sativa L.—Cultivation and quality of raw material. J. Elem. 2018, 23, 971–984. [Google Scholar] [CrossRef]
- Tang, K.; Struik, P.C.; Yin, X.; Thouminot, C.; Bjelková, M.; Stramkale, V.; Amaducci, S. Comparing hemp (Cannabis sativa L.) cultivars for dual-purpose production under contrasting environments. Ind. Crops Prod. 2016, 87, 33–44. [Google Scholar] [CrossRef]
- Amaducci, S.; Scordia, D.; Liuc, F.H.; Zhang, Q.; Guo, H.; Testa, G.; Cosentino, S.L. Key cultivation techniques for hemp in Europe and China. Ind. Crops Prod. 2015, 68, 2–16. [Google Scholar] [CrossRef]
- Struik, P.C.; Amaducci, S.; Bullard, M.J.; Stutterheim, N.C.; Venturi, G.; Cromack, H. Agronomy of fibre hemp (Cannabis sativa L.) in Europe. Ind. Crops Prod. 2000, 11, 107–118. [Google Scholar] [CrossRef]
- Amaducci, S.; Amaducci, M.T.; Benati, R.; Venturi, G. Crop yield and quality parameters of four annual fibre crops (hemp, kenaf, maize and sorghum) in the North of Italy. Ind. Crops Prod. 2000, 11, 179–186. [Google Scholar] [CrossRef]
- Cosentino, S.L.; Riggi, E.; Testa, G.; Scordia, D.; Copani, V. Evaluation of European developed fibre hemp genotypes (Cannabis sativa L.) in semi-arid Mediterranean environment. Ind. Crops Prod. 2013, 50, 312–324. [Google Scholar] [CrossRef]
- Di Bari, V.; Campi, P.; Colucci, R.; Mastrorilli, M. Potential productivity of fibre hemp in southern Europe. Euphytica 2004, 140, 25–32. [Google Scholar] [CrossRef]
- Vantreese, V.L. Hemp Support. J. Ind. Hemp 2002, 7, 17–31. [Google Scholar] [CrossRef]
- Italian Republic. Law n. 242, 2 December 2016. Disposizioni Per la promozione della Coltivazione e della Filiera Agroindustriale della Canapa; General Series n. 304; Gazzetta Ufficiale della Repubblica Italiana: Rome, Italy, 30 December 2016. [Google Scholar]
- Di Candilo, M.; Ranalli, P.; Liberalato, D. Gli interventi necessari per la reintroduzione della canapa in Italia. Agroindustria 2003, 2, 27–36. [Google Scholar]
- FAOSTAT. Available online: www.fao.org/faostat (accessed on 23 April 2019).
- ISTAT. Available online: www.agri.istat.it (accessed on 23 April 2019).
- European Industrial Hemp Association (EIHA). Available online: www.eiha.org (accessed on 29 November 2019).
- MultiHemp Project. Available online: www.multihemp.eu (accessed on 29 November 2019).
- GRACE Project. Available online: www.grace-bbi.eu (accessed on 29 November 2019).
- Tedeschi, A.; Tedeschi, P. The potential of hemp to produce bioenergy. In Proceedings of the 2nd World Conference on Biomass for Energy, Industry and Climate Protection, Rome, Italy, 10–14 May 2004; pp. 148–152. [Google Scholar]
- González-García, S.; Luo, L.; Moreira, M.T.; Feijoo, G.; Huppes, G. Life cycle assessment of hemp hurds use in second generation ethanol production. Biomass Bioenergy 2012, 36, 268–279. [Google Scholar] [CrossRef]
- Kuglarz, M.; Gunnarsson, I.B.; Svensson, S.-E.; Prade, T.; Johansson, E.; Angelidaki, I. Ethanol production from industrial hemp: Effect of combined dilute acid/steam pretreatment and economic aspects. Bioresour. Technol. 2014, 163, 236–243. [Google Scholar] [CrossRef]
- Ragit, S.S.; Mohapatra, S.K.; Gill, P.; Kundu, K. Brown hemp methyl ester: Transesterification process and evaluation of fuel properties. Biomass Bioenergy 2012, 41, 14–20. [Google Scholar] [CrossRef]
- Branca, C.; Di Blasi, C.; Galgano, A. Experimental analysis about the exploitation of industrial hemp (Cannabis sativa) in pyrolysis. Fuel Process. Technol. 2017, 162, 20–29. [Google Scholar] [CrossRef]
- Rice, B. Hemp as a feedstock for biomass-to-energy conversion. J. Ind. Hemp 2008, 13, 145–156. [Google Scholar] [CrossRef]
- Burczyk, H.; Grabowska, L.; Kołodziej, J.; Strybe, M. Industrial Hemp as a Raw Material for Energy Production. J. Ind. Hemp 2008, 13, 37–48. [Google Scholar] [CrossRef]
- Finnan, J.; Styles, D. Hemp: A more sustainable annual energy crop for climate and energy policy. Energy Policy 2013, 58, 152–162. [Google Scholar] [CrossRef]
- Hanegraaf, M.C.; Biewinga, E.E.; van der bijl, G. Assessing the ecological and economic sustainability of energy crops. Biomass Bioenergy 1998, 15, 345–355. [Google Scholar] [CrossRef]
- Rehman, M.S.U.; Rashid, N.; Saif, A.; Mahmood, T.; Han, J.-I. Potential of bioenergy production from industrial hemp (Cannabis sativa): Pakistan perspective. Renew. Sustain. Energy Rev. 2013, 18, 154–164. [Google Scholar] [CrossRef]
- Kreuger, E.; Prade, T.; Escobar, F.; Svensson, S.-E.; Englund, J.-E.; Björnsson, L. Anaerobic digestion of industrial hemp–Effect of harvest time on methane energy yield per hectare. Biomass Bioenergy 2011, 35, 893–900. [Google Scholar] [CrossRef]
- Heiermann, M.; Ploechl, M.; Linke, B.; Schelle, H.; Herrmann, C. Biogas Crops-Part I: Specifications and Suitability of Field Crops for Anaerobic Digestion. Agric. Eng. Int. CIGR J. 2009, 11, 1–17. [Google Scholar]
- Adamovics, A.; Dubrovskis, V.; Platace, R. Productivity of industrial hemp and its utilisation for anaerobic digestion. In Energy Production and Management in the 21st Century, Vol. 2. WIT Trans. Ecol. Environ. 2014, 190, 1045–1055. [Google Scholar]
- Mallik, M.K.; Singh, U.K.; Ahmad, N. Batch digester studies on biogas production from Cannabis sativa, water hyacinth and crop wastes mixed with dung and poultry litter. Biol. Wastes 1990, 31, 315–319. [Google Scholar] [CrossRef]
- Kaiser, F.; Diepolder, M.; Eder, J.; Hartmann, S.; Prestele, H.; Gerlach, R.; Ziehfreund, G.; Gronauer, A. Biogas yields from various renewable raw materials. In Proceedings of the 7th FAO/SREEN Workshop, Uppsala, Sweden, 30 November–2 December 2005. [Google Scholar]
- Dumas, C.; Silva Ghizzi Damasceno, G.; Barakat, A.; Carrere, H.; Steyer, J.-P.; Rouau, X. Effects of grinding processes on anaerobic digestion of wheat straw. Ind. Crops Prod. 2015, 74, 450–456. [Google Scholar] [CrossRef]
- Lynd, L.R.; Weimer, P.J.; Van Zyl, W.H.; Pretorius, I.S. Microbial cellulose utilization: Fundamentals and biotechnology. Microbiol. Mol. Biol. Rev. 2002, 66, 506–577. [Google Scholar] [CrossRef] [PubMed]
- Merlin Christy, P.; Gopinath, L.R.; Divya, D. A review on anaerobic decomposition and enhancement of biogas production through enzymes and microorganisms. Renew. Sustain. Energy Rev. 2014, 34, 167–173. [Google Scholar] [CrossRef]
- Xu, N.; Liu, S.; Xin, F.; Zhou, J.; Jia, H.; Xu, J.; Jiang, M.; Dong, W. Biomethane production from lignocellulose: Biomass recalcitrance and its impacts on anaerobic digestion. Front. Bioeng. Biotechnol. 2019, 1–12. [Google Scholar] [CrossRef]
- Čater, M.; Zorec, M.; Marinšek Logar, R. Methods for improving anaerobic lignocellulosic substrates degradation for enhanced biogasp. Springer Sci. Rev. 2014, 2, 51–61. [Google Scholar] [CrossRef]
- Herrero Garcia, N.; Benedetti, M.; Bolzonella, D. Effects of enzymes addition on biogas production from anaerobic digestion of agricultural biomasses. Waste Biomass Valor. 2019, 10, 3711–3722. [Google Scholar] [CrossRef]
- ASTM D7582-15. Standard Test Methods for Proximate Analysis of Coal and Coke by Macro Thermogravimetric Analysis. Available online: https://www.astm.org/Standards/D7582.htm (accessed on 30 June 2017).
- ASTM D5373-16. Standard Test Methods for Determination of Carbon, Hydrogen and Nitrogen in Analysis Samples of Coal and Carbon in Analysis Samples of Coal and Coke. Available online: https://www.astm.org/Standards/D5373.htm (accessed on 2 January 2018).
- Van Sœst, P.J.; Robertson, J.B.; Lewis, B.A. methods for dietary fiber, Neutral Detergent Fiber, and nonstarch polysaccharides in relation to animal nutrition. J. Dairy Sci. 1991, 74, 3583–3597. [Google Scholar] [CrossRef]
- ANKOM Technologies. Acid Detergent Fiber in Feeds—Filter Bag Technique (for A200 and A200I); ANKOM Technologies: Macedon, NY, USA, 2011. [Google Scholar]
- ANKOM Technologies. Method 8—Determining Acid Detergent Lignin in Beakers; ANKOM Technologies: Macedon, NY, USA, 2005. [Google Scholar]
- ANKOM Technologies. Neutral Detergent Fiber in Feeds—Filter Bag Technique (for A200 and A200I); ANKOM Technologies: Macedon, NY, USA; Available online: www.ankom.com/sites/default/files/document-files/Method_6_NDF_A200.pdf (accessed on 29 November 2019).
- Jung, H.-J.G. Analysis of forage fiber and cell walls in ruminant nutrition. J. Nutr. 1997, 127, 810S–813S. [Google Scholar] [CrossRef]
- Theander, O.; Aman, P.; Westerlund, E.; Andersson, R.; Pettersson, D. Total dietary fiber determined as neutral sugar residues, uronic acid residues, and Klason lignin (the Uppsala method). J. Assoc. Anal. Chem. Int. 1995, 78, 1030–1044. [Google Scholar]
- Statgraphics. Available online: www.statgraphics.com (accessed on 15 September 2019).
- Kruskal, W.H. Historical Notes on the Wilcoxon Unpaired Two-Sample Test. J. Am. Stat. Assoc. 1957, 52, 356–360. [Google Scholar] [CrossRef]
- Neuhäuser, M. Wilcoxon–Mann–Whitney Test. In International Encyclopedia of Statistical Science; Springer: Berlin/Heidelberg, Germany, 2011. [Google Scholar]
- Kruskal, W.H.; Wallis, W.A. use of ranks in one-criterion variance analysis. J. Am. Stat. Assoc. 1952, 47, 583–621. [Google Scholar] [CrossRef]
- Pistis, A.; Asquer, C.; Scano, E.A. Anaerobic digestion of potato industry by-products on a pilot-scale plant under thermophilic conditions. Environ. Eng. Manag. J. 2013, 12, 93–96. [Google Scholar]
- Asquer, C.; Pistis, A.; Scano, E.A.; Cocco, D. Energy-oriented optimization of an anaerobic digestion plant for the combined treatment of solid and liquid wastes in a potato chips industrial plant. In Proceedings of the 22nd EUBCE, Hamburg, Germany, 23–26 June 2014. [Google Scholar]
- Scano, E.A.; Asquer, C.; Pistis, A.; Ortu, L.; Demontis, V.; Cocco, D. Biogas from anaerobic digestion of fruit and vegetable wastes: Experimental results on pilot-scale and design of a full-scale power plant. Energy Convers. Manag. 2014, 77, 22–30. [Google Scholar] [CrossRef]
- Scano, E.A. Trattamento di Biomasse Vegetali e Algali Finalizzato All’Ottenimento di Energia. Potenziali Sviluppi in Sardegna. Ph.D. Thesis, University of Cagliari, Cagliari, Italy, 2016. Available online: http://hdl.handle.net/11584/266883 (accessed on 29 November 2019).
- Frigon, J.-C.; Guiot, S. Biomethane production from starch and lignocellulosic crops: A comparative review. Biofuels Bioprod. Bioref. 2010, 4, 447–458. [Google Scholar] [CrossRef]
- International Energy Agency. Biogas from Crop Digestion. Bioenergy Task 32. 2011. Available online: http://www.ieabioenergy.com/publications/biogas-from-energy-crop-digestion/ (accessed on 27 September 2019).
- Ghosh, S.; Henry, M.P.; Christopher, R.W. Hemicellulose conversion by anaerobic digestion. Biomass 1985, 6, 257–269. [Google Scholar] [CrossRef]
- Brodeur, G.; Yau, E.; Badal, K.; Collier, J.; Ramachandran, K.B.; Ramakrishnan, S. Chemical and physicochemical pretreatment of lignocellulosic biomass: A review. Enzyme Res. 2011, 2011, 17. [Google Scholar] [CrossRef]
- Fortenbery, T.R.; Bennett, M. Opportunities for Commercial Hemp Production. Rev. Agric. Econ. 2004, 26, 97–117. [Google Scholar] [CrossRef]


| Experiment | Hemp Cultivar | Country | Thermal Conditions | HRT | Specific Biogas Yield | Specific Methane Yield | Methane Content |
|---|---|---|---|---|---|---|---|
| [30] | Futura75 | Sweden | 50 °C | 30 days | - | 234 ± 35 m3∙t−1 VS (mean ± std.dev. 1) | - |
| [31] | Fedora19 | Germany | 35 °C | 35 days | 453 ÷ 567 LN∙kg−1 VS | 259 ÷ 301 LN∙kg−1 VS 2 | 53 ÷ 57 (%vol) |
| [32] | Futura75 (among other cultivars) | Latvia | 38 ± 1 °C | 53 days | 0.357 ÷ 0.370 L∙g−1 VS (coarse particles); 0.470 ÷ 0.530 L∙g−1 VS (fine particles) | 0.172 ÷ 0.185 L∙g−1 VS (coarse particles); 0.240 ÷ 0.270 L∙g−1 VS (fine particles) | - |
| Proximate Analysis | |
|---|---|
| [%wt] | |
| M1d.b. | 7.71 ± 0.01 |
| VS2d.b. | 81.37 ± 0.08 |
| Ashd.b. | 2.50 ± 0.25 |
| FC3d.b. | 16.13 ± 0.35 |
| Ultimate Analysis | |
|---|---|
| [%wt] | |
| Carbond.b. | 47.41 ± 0.04 |
| Hydrogend.b. | 6.52 ± 0.10 |
| Nitrogend.b. | 1.64 ± 0.02 |
| Sulphurd.b. | 0.18 ± 0.00 |
| Chopped Hemp, Reproductive Stage | ||
|---|---|---|
| ADL 1 [%wt] | NDF 2 [%wt] | ADF 3 [%wt] |
| 7.87 | 59.16 | 44.40 |
| Phase | Description | Duration | OLR 1 | HRT 2 | C 3 | R 4 |
|---|---|---|---|---|---|---|
| [-] | [-] | [d] | [kgVS·m−3·d−1] | [d] | [% wt/wt] | [-] |
| 1 | No enzymatic treatment | 45 (day 98–day 143) | 2.8 ± 0.6 | 29 ± 2 | 2.3 ± 0.0 | 16.3 ± 1.1 |
| 2 | No enzymatic treatment | 27 (day 144–day 171) | 1.3 ± 0.2 | 34 ± 4 | 3.0 ± 0.9 | 18.9 ± 0.4 |
| 3 | No enzymatic treatment | 55 (day 172–day 227) | 2.9 ± 0.8 | 34 ± 7 | 2.9 ± 1.8 | 20.7 ± 0.8 |
| 4 | Enzymatic treatment | 34 (day 228–day 262) | 3.8 ± 0.8 | 31 ± 7 | 2.5 ± 1.7 | 22.0 ± 0.3 |
| 5 | Enzymatic treatment | 35 (day 263–day 298) | 3.2 ± 0.8 | 30 ± 6 | 5.1 ± 0.2 | 22.0 ± 0.4 |
| 6 | No enzymatic treatment | 36 (day 299–day 335) | 3.1 ± 0.9 | 33 ± 9 | 5.2 ± 1.0 | 20.9 ± 0.3 |
| 7 | Enzymatic treatment | 87 (day 336–day 423) | 3.1 ± 1.0 | 29 ± 3 | 4.4 ± 2.0 | 20.3 ± 0.2 |
| Process Parameter | Variable | Unit | Feeding Phase | No. of Values | Mean ± Std.dev. | Minimum | Maximum |
|---|---|---|---|---|---|---|---|
| Biogas composition | CH4 | [%wt] | 1 | 37 | 57.1 ± 1.2 | 54.4 | 60.0 |
| 2 | 4 | 59.5 ± 2.8 | 56.3 | 62.4 | |||
| 3 | 51 | 54.7 ± 1.9 | 51.0 | 57.6 | |||
| 4 | 34 | 53.3 ± 2.3 | 46.6 | 57.1 | |||
| 5 | 36 | 52.1 ± 1.2 | 49.7 | 54.1 | |||
| 6 | 28 | 52.6 ± 0.9 | 51.4 | 54.7 | |||
| 7 | 88 | 53.0 ± 1.2 | 50.5 | 56.6 | |||
| CO2 | [%wt] | 1 | 27 | 42.4 ± 1.1 | 39.6 | 44.2 | |
| 2 | 3 | 41.1 ± 2.6 | 38.4 | 43.5 | |||
| 3 | 51 | 44.7 ± 1.8 | 42.2 | 48.7 | |||
| 4 | 34 | 46.2 ± 2.2 | 42.6 | 53.1 | |||
| 5 | 20 | 47.7 ± 1.3 | 45.4 | 50.3 | |||
| 6 | 19 | 47.0 ± 1.0 | 45.2 | 48.5 | |||
| 7 | 52 | 46.8 ± 1.3 | 43.4 | 49.4 | |||
| GPR | GPR Biogas | [Nm3·d−1] | 1 | 46 | 0.317 ± 0.047 | 0.228 | 0.433 |
| 2 | 28 | 0.232 ± 0.035 | 0.140 | 0.291 | |||
| 3 | 56 | 0.299 ± 0.070 | 0.119 | 0.441 | |||
| 4 | 35 | 0.301 ± 0.052 | 0.199 | 0.438 | |||
| 5 | 36 | 0.581 ± 0.162 | 0.238 | 0.238 | |||
| 6 | 26 | 0.552 ± 0.115 | 0.297 | 0.297 | |||
| 7 | 88 | 0.668 ± 0.036 | 0.262 | 1.109 | |||
| GPR CH4 | [Nm3·d−1] | 1 | 37 | 0.186 ± 0.025 | 0.132 | 0.241 | |
| 2 | 4 | 0.147 ± 0.010 | 0.135 | 0.155 | |||
| 3 | 51 | 0.164 ± 0.038 | 0.068 | 0.231 | |||
| 4 | 34 | 0.160 ± 0.025 | 0.114 | 0.215 | |||
| 5 | 36 | 0.303 ± 0.086 | 0.129 | 0.418 | |||
| 6 | 23 | 0.307 ± 0.036 | 0.218 | 0.388 | |||
| 7 | 88 | 0.353 ± 0.123 | 0.141 | 0.424 | |||
| SGP | SGP Biogas | [Nm3·kgVS−1] | 1 | 45 | 0.129 ± 0.054 | 0.054 | 0.358 |
| 2 | 27 | 0.191 ± 0.037 | 0.148 | 0.304 | |||
| 3 | 54 | 0.110 ± 0.035 | 0.025 | 0.194 | |||
| 4 | 33 | 0.097 ± 0.047 | 0.059 | 0.277 | |||
| 5 | 32 | 0.207 ± 0.113 | 0.055 | 0.514 | |||
| 6 | 23 | 0.198 ± 0.048 | 0.132 | 0.316 | |||
| 7 | 75 | 0.250 ± 0.119 | 0.095 | 0.825 | |||
| SGP CH4 | [Nm3·kgVS−1] | 1 | 35 | 0.069 ± 0.013 | 0.032 | 0.105 | |
| 2 | 4 | 0.140 ± 0.037 | 0.103 | 0.186 | |||
| 3 | 49 | 0.060 ± 0.019 | 0.013 | 0.104 | |||
| 4 | 31 | 0.050 ± 0.023 | 0.033 | 0.133 | |||
| 5 | 27 | 0.092 ± 0.033 | 0.041 | 0.174 | |||
| 6 | 20 | 0.104 ± 0.027 | 0.071 | 0.173 | |||
| 7 | 75 | 0.132 ± 0.062 | 0.052 | 0.439 |
| Process Parameter | Variable | Unit | Feeding Phase | No. of Values | Skewness | Kurtosis | Median |
|---|---|---|---|---|---|---|---|
| Biogas composition | CH4 | [%wt] | 1 | 37 | 0.041 | 0.571 | 57.3 |
| 2 | 4 | −0.167 | −1.191 | − | |||
| 3 | 51 | −0.297 | −1.401 | 44.7 | |||
| 4 | 34 | −3.061 | 2.19 | 53.8 | |||
| 5 | 36 | −1.043 | −0.722 | 52.2 | |||
| 6 | 28 | 0.773 | −0.717 | 52.5 | |||
| 7 | 88 | 0.543 | 0.326 | 53.1 | |||
| CO2 | [%wt] | 1 | 27 | −1.652 | 1.25 | 42.3 | |
| 2 | 3 | −0.383 | − | − | |||
| 3 | 51 | 0.934 | −1.069 | 43.6 | |||
| 4 | 34 | 3.808 | 3.712 | 45.7 | |||
| 5 | 20 | 0.478 | −0.446 | 48.2 | |||
| 6 | 19 | −0.257 | −0.962 | 46.6 | |||
| 7 | 52 | −1.431 | 0.653 | 46.8 | |||
| GPR | GPR Biogas | [Nm3·d−1] | 1 | 46 | 1.231 | −0.350 | 0.311 |
| 2 | 28 | −1.027 | 1.151 | 0.232 | |||
| 3 | 56 | −0.473 | −0.079 | 0.295 | |||
| 4 | 35 | 1.028 | 0.835 | 0.303 | |||
| 5 | 36 | −2.012 | −0.395 | 0.639 | |||
| 6 | 26 | −2.098 | 0.995 | 0.582 | |||
| 7 | 88 | 0.161 | −2.276 | 0.674 | |||
| GPR CH4 | [Nm3·d−1] | 1 | 37 | −0.197 | 0.073 | 0.188 | |
| 2 | 4 | −0.444 | −1.202 | − | |||
| 3 | 51 | −0.761 | −0.559 | 0.168 | |||
| 4 | 34 | 0.588 | −0.33 | 0.157 | |||
| 5 | 36 | −1.944 | −0.643 | 0.339 | |||
| 6 | 23 | −0.172 | 1.138 | 0.310 | |||
| 7 | 88 | 0.000 | −2.399 | 0.351 | |||
| SGP | SGP Biogas | [Nm3·kgVS−1] | 1 | 45 | 8.717 | 16.069 | 0.118 |
| 2 | 27 | 3.400 | 2.619 | 0.182 | |||
| 3 | 54 | 1.225 | 0.748 | 0.104 | |||
| 4 | 33 | 6.655 | 9.930 | 0.084 | |||
| 5 | 32 | 2.940 | 1.566 | 0.193 | |||
| 6 | 23 | 2.462 | 0.869 | 0.185 | |||
| 7 | 75 | 8.592 | 16.019 | 0.248 | |||
| SGP CH4 | [Nm3·kgVS−1] | 1 | 35 | 0.240 | 1.828 | 0.069 | |
| 2 | 4 | 0.375 | −0.860 | − | |||
| 3 | 49 | 1.195 | 0.743 | 0.054 | |||
| 4 | 31 | 6.431 | 9.402 | 0.046 | |||
| 5 | 27 | 0.570 | 0.032 | 0.080 | |||
| 6 | 20 | 2.450 | 0.980 | 0.095 | |||
| 7 | 75 | 9.078 | 17.583 | 0.130 |
© 2019 by the authors. Licensee MDPI, Basel, Switzerland. This article is an open access article distributed under the terms and conditions of the Creative Commons Attribution (CC BY) license (http://creativecommons.org/licenses/by/4.0/).
Share and Cite
Asquer, C.; Melis, E.; Scano, E.A.; Carboni, G. Opportunities for Green Energy through Emerging Crops: Biogas Valorization of Cannabis sativa L. Residues. Climate 2019, 7, 142. https://doi.org/10.3390/cli7120142
Asquer C, Melis E, Scano EA, Carboni G. Opportunities for Green Energy through Emerging Crops: Biogas Valorization of Cannabis sativa L. Residues. Climate. 2019; 7(12):142. https://doi.org/10.3390/cli7120142
Chicago/Turabian StyleAsquer, Carla, Emanuela Melis, Efisio Antonio Scano, and Gianluca Carboni. 2019. "Opportunities for Green Energy through Emerging Crops: Biogas Valorization of Cannabis sativa L. Residues" Climate 7, no. 12: 142. https://doi.org/10.3390/cli7120142
APA StyleAsquer, C., Melis, E., Scano, E. A., & Carboni, G. (2019). Opportunities for Green Energy through Emerging Crops: Biogas Valorization of Cannabis sativa L. Residues. Climate, 7(12), 142. https://doi.org/10.3390/cli7120142