Article

Evaluation and Modeling of Urban Heat Island Intensity in Basel, Switzerland

Department of Environmental Science, University Basel, CH-4056 Basel, Switzerland
*
Author to whom correspondence should be addressed.
Climate 2018, 6(3), 55; https://doi.org/10.3390/cli6030055
Submission received: 1 June 2018 / Revised: 16 June 2018 / Accepted: 18 June 2018 / Published: 21 June 2018

Abstract

:
An increasing number of people living in urban environments and the expected increase in long lasting heat waves makes the study of temperature distribution one of the major tasks in urban climatology, especially considering human health and heat stress. This excess heat is often underestimated because stations from national meteorological services are limited in numbers and are not representing the entire urban area with typically higher nocturnal temperatures, especially in densely built-up environments. For a majority of the population, heat stress is consequently monitored insufficiently. In this study, the factors influencing the nocturnal urban heat island have been evaluated in detail and have been tested using different spatial resolutions. A multiple linear regression model has been developed with predictors resulting from different data sources to model the urban air temperature distribution continuously. Results show that various datasets can be used for the prediction of the heat island distribution with comparable results, ideally run on a 200 m grid. Validation using random sampling indicated a RMSE clearly below the standard deviation of the measurements with an average around ~0.15 °C. The regression coefficients are varying within the nocturnal runs with best results around 22:00 CET (R2 > 0.9).

1. Introduction

Though only a very limited proportion of the global land surface is covered by urban areas, the majority of the world’s population is spending most of its time in such environments. Currently, over 75% of the people in Central Europe are city dwellers, with proportionally increasing tendencies [1,2].
Cities are known to have a special microclimate with higher nocturnal air temperatures (Ta) compared to their rural surroundings, which has been frequently discussed in literature and described with the well-established term “urban heat island” (UHI) [3,4,5,6,7,8,9,10,11,12]. This effect may be pleasant for urban dwellers during transition periods or in winter, because it reduces cold stress and space heating is less required due to the additional warmth [5]. During certain conditions, i.e., synoptically stable and long lasting anticyclonic weather situations in summer, this extra heat load can be threatening for elderly and vulnerable people [13]. The maximum temperatures are thereby not necessarily the main problem, but rather the lack of relief when the minimum temperatures are not declining below a certain level. Clarke and Bach (1971) focused their early studies on the influence of urban climate on human health. Based on a small data record, they found an increase in heat related excess mortality due to high nocturnal temperatures, either as a primary effect or as a contributing factor in heart disease, strokes or pulmonary disorders [14]. Scherer (2014) stated that extreme heat was responsible for 5% of all deaths from 2001 to 2010 in Berlin, affecting mainly people exceeding the age of 65 [15]. During extreme heat waves, the linear relationship between minimum temperature and mortality becomes an exponential function, indicating that every tenth of a degree increase has a dramatic influence on the total death rates [15,16]. Additional heat related deaths—ranging from 22,000 [17] to 70,000 [18] according to different studies—and an excess mortality of up to 30% [19] were found during the extreme heat waves in Central Europe in 2003 and 2015, respectively. Due to climate change, such events increased in the 20th century and will be an usual phenomenon in the 21st century [20]. These findings are also confirmed by statistical analysis considering the duration of large-scale weather patterns in Europe, which indicate that long-lasting weather situations (i.e., >10 d) are currently doubled in their frequency compared to the first half of the last century [21]. Studies show that this trend is ongoing in the future with heat waves that are more intense, longer lasting, and/or more frequent [22,23]. The combination of those three observations—i.e., the increasing urban population, the higher nocturnal Ta in cities and the increasing frequency, duration and intensity of heat waves—makes the study of urban climate, the resulting impacts on the urban population and especially the study of possible mitigation strategies indispensable.
To understand the physical processes behind the development of the UHI and to investigate the use of remote sensing and GIS data to study urban climate dynamics, it is fundamental to understand the concept of urban energy balance. Due to urbanization and the modification of natural vegetated surfaces to heterogeneous three-dimensional and largely sealed surfaces, vertical fluxes of heat, mass and momentum are altered dramatically compared to natural conditions [24]. The urban morphology, artificial surface materials and human behavior are the main factors influencing these exchanges [25]. Additionally, the nearly doubled urban surface, compared to a plane surface, increases the amount of energy stored in the urban fabric and within the urban canopy layer (UCL) [26].
The urban surface as a total can be described as a box with variable height (depending on the processes of interest) including streets, walls, roofs and all natural and artificial elements. It can be treated as an integrated system [24,27]. At about roof level, the energy balance is dominated by site-specific microscale effects [6]. On top of this UCL, the urban energy balance can be written as follows:
  Q *   ( +   Q F )   =   Q H   +   Q E   +   δ Q S   ( +   δ Q A ) ,
with:
Q *   = Net radiation,
Q F   = Anthropogenic heat release by combustion, traffic and human metabolism,
Q H   = Turbulent sensible heat flux density,
Q E   = Turbulent latent heat flux density,
δ Q S   = Net heat storage,
δ Q A   = Net heat advection.
The net radiation can be measured with net radiometers and/or computed with remote sensing data:
  Q *   =   S W   S W +   L W   L W ,
with:
S W   = Solar irradiance,
S W   = Shortwave reflection,
L W   = Atmospheric counter radiation,
L W   = Terrestrial emission.
The input terms S W and L W can be measured or modelled using topographic features combined with the geographical position and the actual solar altitude or boundary layer air temperature [28].
The longwave radiative loss, i.e., L W , is a function of the land surface temperature (LST) and emissivity:
  L W   =   σ ε T 4 ,
with σ as the Stefan-Boltzmann constant (5.67·10−8 W m−2 K−4), ε as the emissivity and T as the LST in K. Since EO-derived LST is strongly dependent on adequate atmospheric correction, this term is a possible source of errors. Even small variations have significant effects on the energy balance [29,30].
A crucial part in Equation (2) is S W . It is calculated by the multiplication of S W with the broadband surface albedo (α), computed using the VIS and NIR channels from satellite data or measured by a pyranometer (Section 2.3.1, Equation (8)) [31,32]:
  S W   =   α S W .
The term QF is currently under investigation and so far is not adequately described by remote sensing data [33]. It can be assumed, that in moderate climate cities like Basel, the summer QF input is relatively small, because cooling systems producing a lot of anthropogenic heat in summer are uncommon in Switzerland. The largest amount of QF in Basel is most likely generated by heating, which is limited to winter situations. Christen and Vogt (2004) found an annual average amount of QF in the range of 5 to 20 W m−2 in suburban and dense urban environments, respectively [26].
Urban fabrics comprise of special thermal properties, which makes the urban surface an ideal heat saver. The ratio δQs/Q*, indicating the amount of available energy used for storage, may reach ratios up to 0.58, 0.48 and 0.31 for measurement sites in Mexico City, Vancouver and Los Angeles, respectively [34]. During the BUBBLE measurement campaign in the city of Basel, values of 0.3 to 0.4 resulted at different urban sites [35]. This means, that only 60 to 70% of the net radiation is available for partitioning into the turbulent fluxes of sensible and latent heat. In case of extremely hot urban surfaces, this value might be even lower and if a minimum evapotranspiration is assumed on rural sites, which is likely to be the case during extreme heat waves and/or dry conditions, the sensible heat flux in an urban environment is even lower compared to its rural counterpart.
The turbulent fluxes QH and QE are related through the Bowen ratio (β = QH/QE). It is defined for specific surfaces and derived from flux tower measurements. Oke (1988) reported values for β of 0.6 to 1.0 in suburbs and 1.8 in the city core [24]. During the REKLIP project, Parlow (1996) found values of 1.5 in high-density urban to 0.8 in low-density urban areas and a maximum β of 1.8 in industrial areas in and around Basel [36]. On forests and natural surfaces, the values ranged between 0.4 above deciduous forests to 0.7 on arable land [24,36]. During one month of intensive measurements in Basel, Christen (2004) found daily variations of β, most pronounced at the rural site (0.5 to 0.2) and less pronounced at the urban site (~2) [26]. Taking these values (βU = 1.5, βR = 0.6) and comparing them to the differences in available energy due to lower QS on rural sites (QS_U = 40%, QS_R = 10%), QH is in the same range on grassland compared to dense urban areas.
Net advection ( δ Q A ) is neglected here, because heat wave events are normally coupled to synoptically calm conditions with very weak winds, especially during the night (ignoring micro-scale advection [24]).
In this study, the theoretical knowledge about the physical processes happening at the transition layer between the urban surface and the overlying air is used to investigate the development of the frequently evolving UHI in Basel, Switzerland. Thereby, various data sources are tested using a multiple linear regression (MLR) approach within different resolutions and at different time steps during the development of the nocturnal UHI. The investigation period was during a minor heat wave at the end of August 2016. The investigation area, the meteorological measurement stations and the complete setup of the method are described in Section 2. Results—including statistics, validation and exemplary maps—are presented in Section 3, followed by a discussion and concluding remarks in Section 4 and Section 5.

2. Materials and Methods

2.1. Site Description

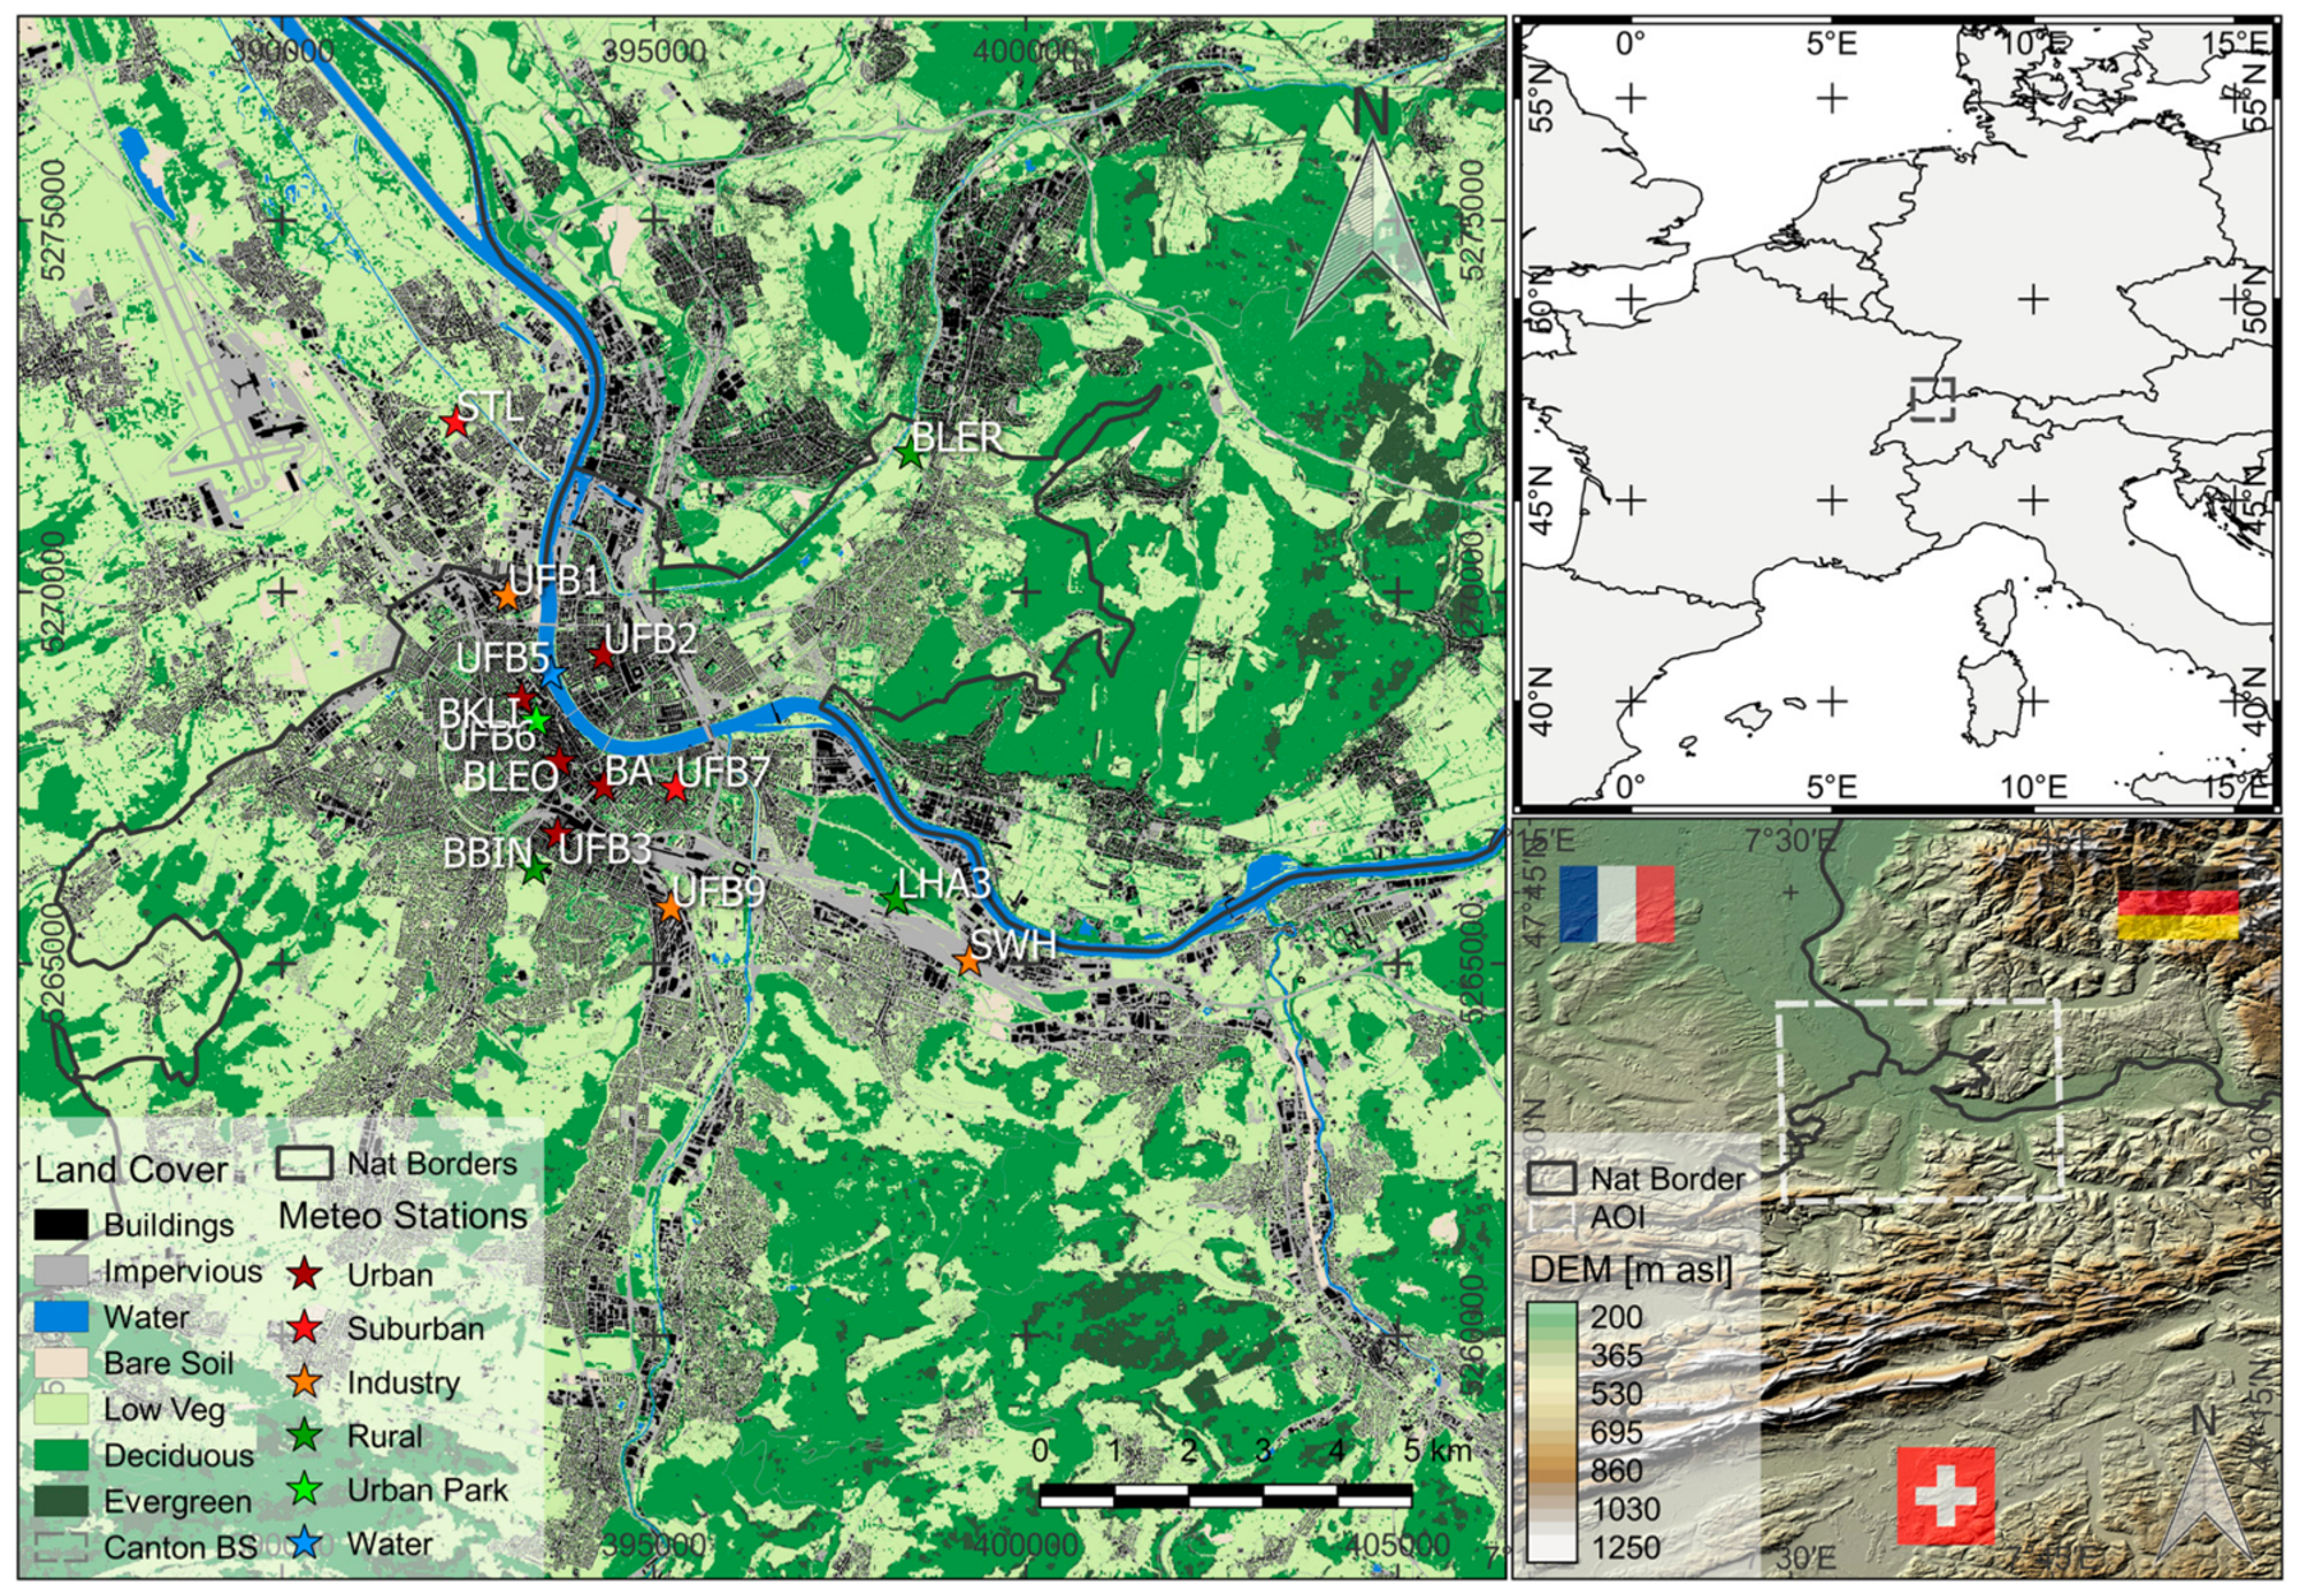
Basel is located at the southern end of the Upper Rhine Valley between the bordering hills of the Vosges (France), the Black Forest (Germany), and the Jura Mountains (Switzerland) at about 250 m a.s.l. (Figure 1).
The climate is considered oceanic, with mild winters and warm and sunny summers (Köppen Cfb climate) [37]. The annual mean temperature is 10.5 °C with an annual precipitation rate of 842 mm for the reference period 1981 to 2010 [38]. The warmest month is July with average maximum temperatures above 25 °C, though record-high temperatures during heat waves may also occur in June or August. Cold stress situations are less pronounced in the city, occasionally such phenomena may occur due to the outbreak of cold air masses from continental Russia.
Long-term measurements and several measurement campaigns in the region describe a distinct UHI, which establishes typically during the night with maximum temperature differences of up to 8 °C between rural and urban reference stations [12,39,40].
The investigation area contains the metropolitan area of Basel with approximately 730,000 inhabitants in total, including the bordering suburbs located in the Canton of Basel-Land (BL), the German cities Weil-am-Rhein and Lörrach, the French city Saint-Louis, and the city of Basel [41,42]. From north to south and west to east the area covers 21 by 20 km2, respectively, spanning from the upper left 47°38′35″ N 7°29′17″ E to the lower right 47°27′25″ N 7°45′32″ E.

2.2. Air Temperature Measurements

Below a blending height z*, the urban turbulence field must be considered three-dimensional and small-scale fluctuations may occur [43]. In this roughness sublayer (RSL), the measured temperature signal is directly influenced by the underlying surface, with a variable footprint due to different wind directions. Ideally, comparative measurements should be carried out at the same relative position in the RSL, depending on the anticipated model resolution. Only stations located at the transition level between the UCL and the RSL at about roof level are considered in this study. At this height, the sensors are not located directly in the wakes of the individual surface elements, but a local mixture of influences is still captured [6]. Note that the lower boundary of the RSL used here is defined after Oke (1988) as the top of the UCL, i.e., roughly the mean building height ( z H ). Christen and Vogt (2004) indicate that the measurement heights ( z ) of 0.8 < z / z H < 1.4 are representative for the local urban climate [26]. Stations located in large open spaces are used even if they are only located at 2 m measurement height, because the UCL may be entirely absent in such environments [4]. The main criterion for exclusion for those stations is cold air accumulation (Table 1).
All data are adjusted to the lowest station height adding a lapse rate of 0.6 °C per 100 m. To test the approach and to minimize the influence of temperature fluctuations, a mean nocturnal course of 6 consecutive nights during a heat wave starting on 23 August 2016 is used. During that period, the daytime maximum temperatures were mostly above 30 °C and several tropical nights (i.e., Tmin > 20 °C) were measured at the urban reference station (i.e., BKLI, Section 4.1).

2.3. Urban Surface Properties

Different types of surface properties are calculated, collected and tested separately to find reasonable input parameters for a MLR model. Three groups of surface descriptors emerged, which are described in the following sections.

2.3.1. Landsat Data

LST, NDVI and albedo is derived from satellite data acquired by the Landsat 8 operational land imager (OLI) and thermal infrared sensor (TIRS) at the beginning of the measurement period on 23 August 2016 10:16 UTC.
Atmospheric effects on the TIR signal are removed using a correction parameter accessed through the web-based atmospheric correction tool provided by NASA, which is based on NCEP reanalysis data and MODTRAN code. The conversion of top-of-atmosphere radiance ( L TOA ) to surface-leaving radiance ( L λ ) is done solving Equation (5):
  L TOA   =   τ ε L λ   +   L u   +   τ ( 1     ε ) L d ,
with L u as the upwelling or atmospheric path radiance and L d as the downwelling or sky radiance, which is reflected on the surface. Attenuating effects of the atmosphere are incorporated by the atmospheric transmission ( τ ) [46]. The emissivity map ( ε ) is based on a modified NDVI approach by Sobrino et al. (2008) [47]. To convert L λ to LST, the Landsat-specific estimate of the Planck curve including the calibration constants k 1 and k 2 , derived from Landsat metadata, is used:
  LST   =   k 2 l n ( k 1 L λ   +   1 ) .
The complete procedure is described and discussed in detail in Wicki and Parlow (2017) and reveals effectively corrected LST based on in situ measurements and models of atmospheric conditions [48]. The LST represents the surface UHI (SUHI), which has different mechanisms compared to the canopy UHI [12,49]. LST is used as a predictor, because the principles of energy fluxes and the expected UHI effect are based on different surface properties and their interaction with the incoming solar radiation. Dark impervious surfaces normally have a large heat capacity and high thermal conductivity rates, which enables the surface to absorb the incoming radiant energy more effectively [49]. The LST is the best estimate for this interaction available from remote sensing data. The energy stored in the urban fabric during the day and released during the night is one of the main causes of the nocturnal UHI, especially during heat wave conditions and large solar irradiance on the surface. Even though LST is not a perfect representation for the energy stored in the urban fabric, because thermal properties are only partly represented by LST, it is certainly connected to the soil energy flux, especially if used in combination with other surface properties [50].
The NDVI represents the different reflection properties of vegetated surfaces in the visible (RED) and near infrared (NIR) range. It can be written as:
  NDVI   =   NIR     RED NIR   +   RED .
A water mask based on a land cover classification is used to exclude water bodies from the analysis.
Surface broadband albedo ( α short ) is calculated using calibrated reflectance of five channels from the VIS to the SWIR range ( ρ 2 7 ) as a weighted average after Liang (2001) and adapted to Landsat 8 data [31]:
  α short   =   0.356 ρ 2   +   0.130 ρ 4   +   0.373 ρ 5   +   0.085 ρ 6   +   0.072 ρ 7     0.0018 .
The calibration applied on the Landsat data for α estimation includes the sun elevation, but no correction for distracting effects due to aerosols, atmospheric gases or topography was applied.
For this analysis, Landsat 8 data from a single acquisition was used. Previous studies have shown that during comparable weather situations, the LST distribution follows a certain pattern and does not essentially change [48]. The NDVI and α are even more stable, beside variation due to different solar angle, in a near-term period and do not change fundamentally within 6 days.

2.3.2. Urban Morphology

The sky view factor (ψsvf), i.e., the proportion of the observed sky divided by the total upper hemisphere, is calculated using the Urban Multi-scale Environmental Predictor (UMEP) and a digital surface model (DSM) with 3 m resolution [51]. During the resampling (averaging) to coarser resolutions, roof pixels are omitted to represent for dense urban areas with narrow streets, and therefore low ψsvf.
A digital object model (DOM), the product of subtracting a digital elevation model from the DSM, was used for the computation of   z H . The datasets are representative for the years 2008 to 2016. The averaging is done omitting the ground pixels, but including trees.
The plan area fraction ( λ P ) is derived using the raster DOM or high-resolution remote sensing data. This fraction is both a morphological variable (density) and part of the land cover fraction (surface cover), therefore, it is computed in two different ways and added to both groups (i.e., Morphology and Land Cover), separately. Since the land cover fraction is derived from remote sensing data, the resulting coefficients differ. The abbreviation BSF (building to surface fraction) is used for λ P in the Land Cover group.
The frontal area index ( λ F ) or roughness density [52] combines the mean height, breadth and density of the roughness elements in per unit ground area and describes how much of the area reached by a fictional air parcel is covered by walls (or vegetation) for a specific wind direction [53]. In this case, the isotropic λ F —which is not depending on the wind direction—is calculated using UMEP [51].
The two parameters λ P and λ F are used to determine the roughness length ( z 0 ) and zero displacement height ( z d ). These roughness parameters are calculated using a method described by Kanda (2013) [54].
The tree fraction ( λ T ), i.e., the number of trees per hectare, is estimated using high-resolution (10−2 m) aerial LIDAR data from 2010 [55]. The processed vector dataset consists of point data including position, height and crown diameter of every single tree of a major part within the investigation area (i.e., the Canton Basel-Stadt). Areas that are not covered by this dataset are derived from the DOM with a discrimination between vegetation and buildings based on a high-resolution land cover classification, described in Section 2.3.3.

2.3.3. Land Cover

A land cover classification is used to compute the BSF, the impervious surface fraction (ISF) and pervious surface fraction (PSF) by summing up the respective surfaces. The land cover classification is part of the Copernicus contributing datasets allocated with the Horizon2020 project URBANFLUXES [56]. The classification technique is based on a neural network approach. It is applied on SPOT data from 26 May 2012 and supplemented by WorldView imagery and seasonally variable Landsat data (2013–2016). The map with an original ground resolution of 2.5 m can be found in Figure 1 (left).

2.4. Method

2.4.1. State of the Art

Urban measurement networks are usually not dense enough to cover intra-urban differences effectively and denser networks are very cost intensive and impossible to maintain. Mobile measurements with devices mounted on cars [4,57,58,59], bicycles, different public transport vehicles [60,61] and/or by hand/foot are alternatives to cover small-scale differences despite some limitations (spatial, temporal and synoptic representativeness [57], duration and costs).
The link between the surface and the above Ta based on remote sensing or GIS data for comprehensive Ta estimations has been intensively investigated since the launch of the first satellites and Rao’s (1972) analysis using ITOS [62]. Karl (1988) used urban population as a surrogate for urbanization and tried to remove the “urban bias” in Ta measurements using 1200 urban and rural stations around the USA. Gallo (1993 and 1999) investigated the linear correlations between Ta and LST, but also between Ta and NDVI, which provided better results [63,64]. The same objective was pursued by Epperson (1995), who added nighttime brightness data from the Defense Meteorological Satellite Program to the NDVI analysis, which led to an MLR analysis [65].
Better correlation is usually found between minimum Ta (Tmin) and nighttime LST compared to maximum Ta (Tmax) and daytime LST [8,59,66,67,68,69,70]. The different behavior of surface and air temperature in urban environments, i.e., the shift in maximum heat island of the surface (day) to the maximum heat island of the air temperature (night), is crucial and mentioned explicitly in different investigations [8,57,67,71].
Regarding the application of such methods in highly heterogeneous urban areas, the coarse resolution and increased viewing angle of Meteosat SEVIRI, NOAA AVHRR or Terra/Aqua MODIS conceal important details, especially in medium-sized and small cities. Ma (2016) demonstrated the possibility of downscaling MODIS LST to 250 m resolution using a TsHARP algorithm and found better results compared to the original 1-km resolution data [72]. The possibility of using helicopter or aerial imagery is very cost intensive, difficult to conduct due to flight restrictions and often unrepeatable and thus unique. ASTER and Landsat data are most suitable for applications in urban areas regarding the spatial resolution [59,69,73,74], but ASTER has no constant revisit rate and Landsat is normally only acquiring daytime images with a revisit rate of maximum twice within 16 days (due to overlapping paths, which is the case for Basel). Nevertheless, multi-temporal LST analysis has shown that the general intra-urban LST patterns in an urban area are not varying substantially during comparable weather conditions [48].
However, LST or the built environment should not be used solely to explain the UHI effect [74]. Cresswell (1999) found an improvement of 50% less errors and higher correlation coefficients from predicted to actual temperature (0.80 to 0.84) if an additional proxy to LST versus Ta analysis was added [75]. Cristobal (2008) added remote sensing variables such as α, LST and NDVI to a multiple regression model based on altitude, latitude, continentality, solar radiation and cloudiness [76]. The use of multiple predictors was previously mentioned in the outlook section of several publications, e.g., Bechtel (2017) and Vogt (1997), and was applied before in other studies [76,77,78,79].

2.4.2. Method Description

The GIS dataset in this study is based on factors proposed by Stewart and Oke (2012) for the classification of local climate zones (LCZ) and accounts for the causes of the nocturnal UHI as discussed in many previous studies [5,6,26,27,35,44,80]. Cities are a system of different surface units—or morphological forms—that are repeated and arranged differently throughout the urban area [27]. These units define and control the urban climate as an integration of several influences, which can be disaggregated using multiple regression approaches. Urban meteorological measurement stations represent different types of urban composition that control the nocturnal temperature. The MLR approach decomposes, or unmixes, the specific portion of different land use types to the temperature signal. Thereby, the controlling units—hereafter referred to as the predictors—are treated as separate GIS layers. The number of dependent variables, i.e., measured Ta, must exceed the number of predictors (Equation (10)). Ideally, the measurement stations should represent different types of urban controlling units and a certain amount of variance is required.
The model finally enables the production of two-dimensional UHI maps based on the resulting coefficients applied on GIS and remote sensing data. Several runs with different combinations of surface properties and different spatial resolutions, which was done by resampling based on the average of every grid cell, were tested and evaluated in order to find the ideal configuration.
MLR is preferred instead of other methods (e.g., machine learning), because the individual behavior of the predictors is of major interest and not only calculations resulting from a black box.

2.4.3. Suitability Tests and Predictor Selection

A major problem of MLR is multi-collinearity, i.e., the explanation of one predictor by another, which can increase the estimates variance. The result is an adversely better statistic. If the data is to a large amount explained by one of the already existing variables, this excess data does not help to better explain the independent variable [81].
To build the final MLR model, two suitability tests have been applied: A multi-collinearity analysis for each group including a variance inflation factor (VIF) test and a multi-temporal simple linear correlation (SLC) analysis between the potential predictors and the measured Ta.
The SLC is used to reduce the number of predictors in advance. Potential predictors providing no explanation for the variance in the multi-temporal analysis are excluded before the collinearity analysis. In the final decision process, the behavior of the predictors in the SLC analysis was a criterion for exclusion if multi-collinearity was detected. The VIF is used to estimate how much of the variance is inflated due to the presence of correlation within the predictors of the model. This indicates how much of the estimated variance of the specific regression coefficient is increased, compared to the case that R2 would equal zero. For every predictor i in the model, the VIF formula can be written as:
  V I F = 1 1 R i 2 .
For the interpretation of the VIF values, several rules of thumb and the respective thresholds are described in literature. Most commonly the rule of >10 is applied to detect harmful multi-collinearity within the dataset. Since this must be considered dataset specific, models with a VIF > 10 could still include useful information and the thresholds need to be applied with caution. Nevertheless, we decided that a VIF of 10 can be used as a threshold, since this value was frequently applied [81,82].
A further method to reduce useless predictors would be a stepwise MLR (SMLR). This was also applied for testing, but not for the final model, because the model setup is intended to be stable over time and using SMLR changes the predictor composition with every run. However, the results are used to verify the decisions about inclusion or exclusion of predicting parameters.

2.4.4. Multiple Linear Regression

For every regression model, the LST is added as an additional predictor to account for the heat released from storage [12,24,27,71]. The variables that passed the suitability test are used for a MLR analysis by solving a set of linear equations (Equation (10)):
  X 11 T 1   +   X 12 T 2 +     +   X 1 m T m =   β 1   X 21 T 1   +   X 22 T 2 +     +   X 2 m T m =   β 2   X n 1 T 1   +   X n 2 T 2 +     +   X nm T m =   β n .
The dependent variables (T1−m) and the input predictors ( X 11 nm ) are used to determine the coefficients ( β 1 n ) for the best fit. The set can be solved, if more equations (i.e., Ta measurements, m) than unknown variables (i.e., input predictors, n) exist (m > n).
  T p r e   =   β 0   +   β 1 X 1   +   β 2 X 2   +     +   β n X n .
The MLR returns a vector of coefficient estimates (   β 1 n ) for each predictor (   X 1 n ) to solve a multiple linear regression equation (Equation (11)) and to find the responses (Tpre) for every grid point in a two-dimensional raster environment. The intercept value (   β 0 ) is the expected value if all predictors are set to zero and close to the average of the measurements [48].
The model is tested iteratively with varying conditions considering time, resolution and predictor combination to find the best results for the three groups defined as Land Cover, Landsat Data and Morphology.

2.4.5. Validation

The model output is validated using in situ measurements, dividing the Ta measurements in two clusters (i.e., 2/3 input and 1/3 validation). To ensure a certain variation within the model, the stations are classified into four groups (similar to Figure 1, but combining Park with Suburban) and one station per group is used for the validation cluster. The group Urban supplied two stations for the validation process, since it is the most populated class. The model is run five times with different input predictors, chosen by randomly generated numbers (MATLAB function randperm), and the resulting predictions are compared to the independently measured Ta.

3. Results

3.1. Suitability Test and Predictor Selection

The suitability test reveals important information about the significance of individual predictors and allows assembling of the different model groups. Figure 2 describes the results for the SLC as a surface plot including all correlation coefficients for six resolutions (subplots) at different steps in time (rows) for every predictor (columns). Above the columns and on the right side of the rows, mean values indicate the average behavior for every predictor and time step, respectively (displacement due to space limitation). The total average of all predictors for all time steps for every model resolution is printed as a bold number at the upper right of every subplot.
For the first group (Morphology),   z d ,   λ P and z H reveal the best results in the runs with a resolution below 400 m. With increasing cell size, z 0 is gaining importance. The lowest correlations for almost every run are found for ψsvf. Especially low correlations are found at resolutions below 400 m. Weak correlations between ψsvf and urban Ta are similarly described in Nichol (2005). They found the same cooling rates on parking lots and between high-rise buildings at 21:40 local time in Hong Kong, which was explained by the early time of comparison and the intense heating of the surface [69]. The second group (Landsat Data) showed a high abundance of nocturnal Ta to LST and NDVI. Αlbedo revealed very low correlation in the 100 m run and performed better at 200 and 300 m resolution. For the Land Cover group, the pattern changes with different resolutions. In most cases, the PSF and BSF are explaining the variance better than the ISF. Only for a resolution of 400 m, the ISF outperforms the BSF. The PSF revealed very high correlation coefficients and, especially for a resolution of 200 and 300 m, explains already a lot of the variance within the nocturnal Ta distribution. As a total, the multi-temporal analysis showed variations of regression results during the night. The best results are usually found between 20 UTC+1 and midnight. The best overall results are found at 200 and 300 m resolutions. The resulting coefficients are in good accordance to comparable SLC analyses [74].
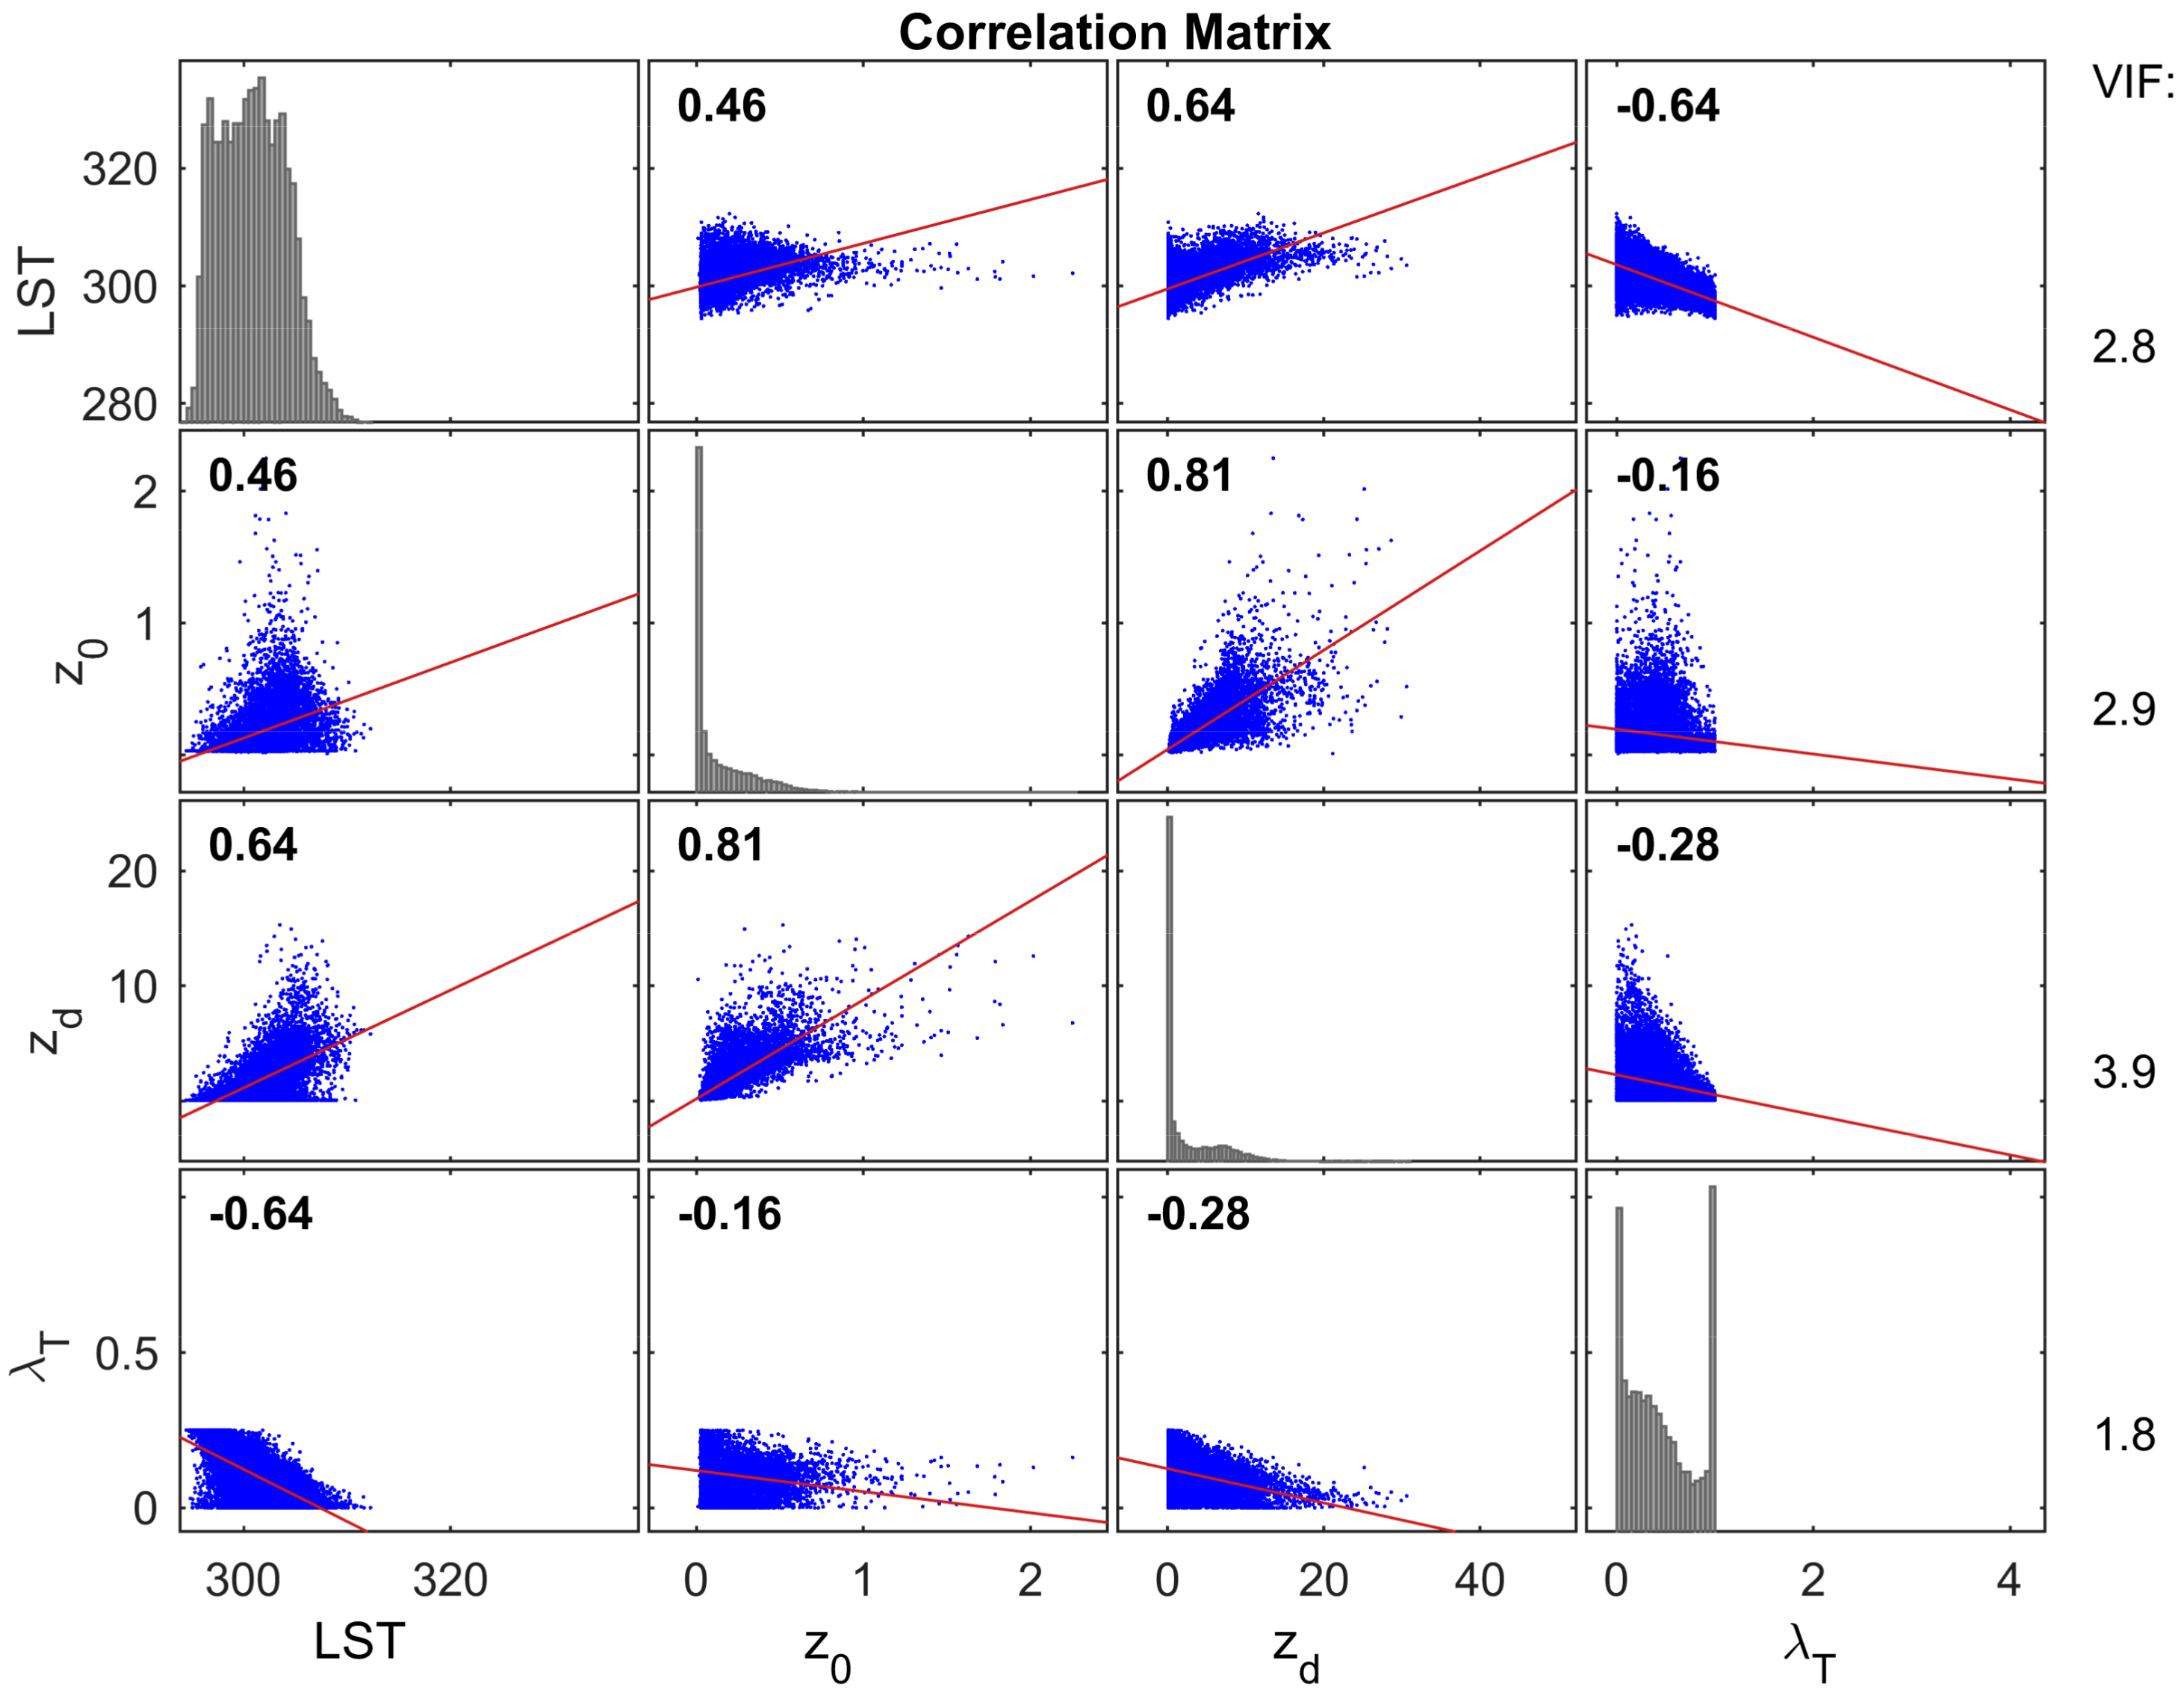
The evaluation of multi-collinearity showed high collinearity for   z H , z d ,   λ F and   λ P . The effects on the microclimate described by these parameters are therefore already explained to a large amount by one of these parameters. High VIF values up to 72 resulted from the multi-collinearity analysis. Reducing these parameters to only one, where the SLC regression factors are used as a criterion, helped to lower the VIF value to a maximum of 3.9 (at 200 m cell size). The resulting model includes the parameter   z d , z 0 and   λ T for the group Morphology (Figure A1).
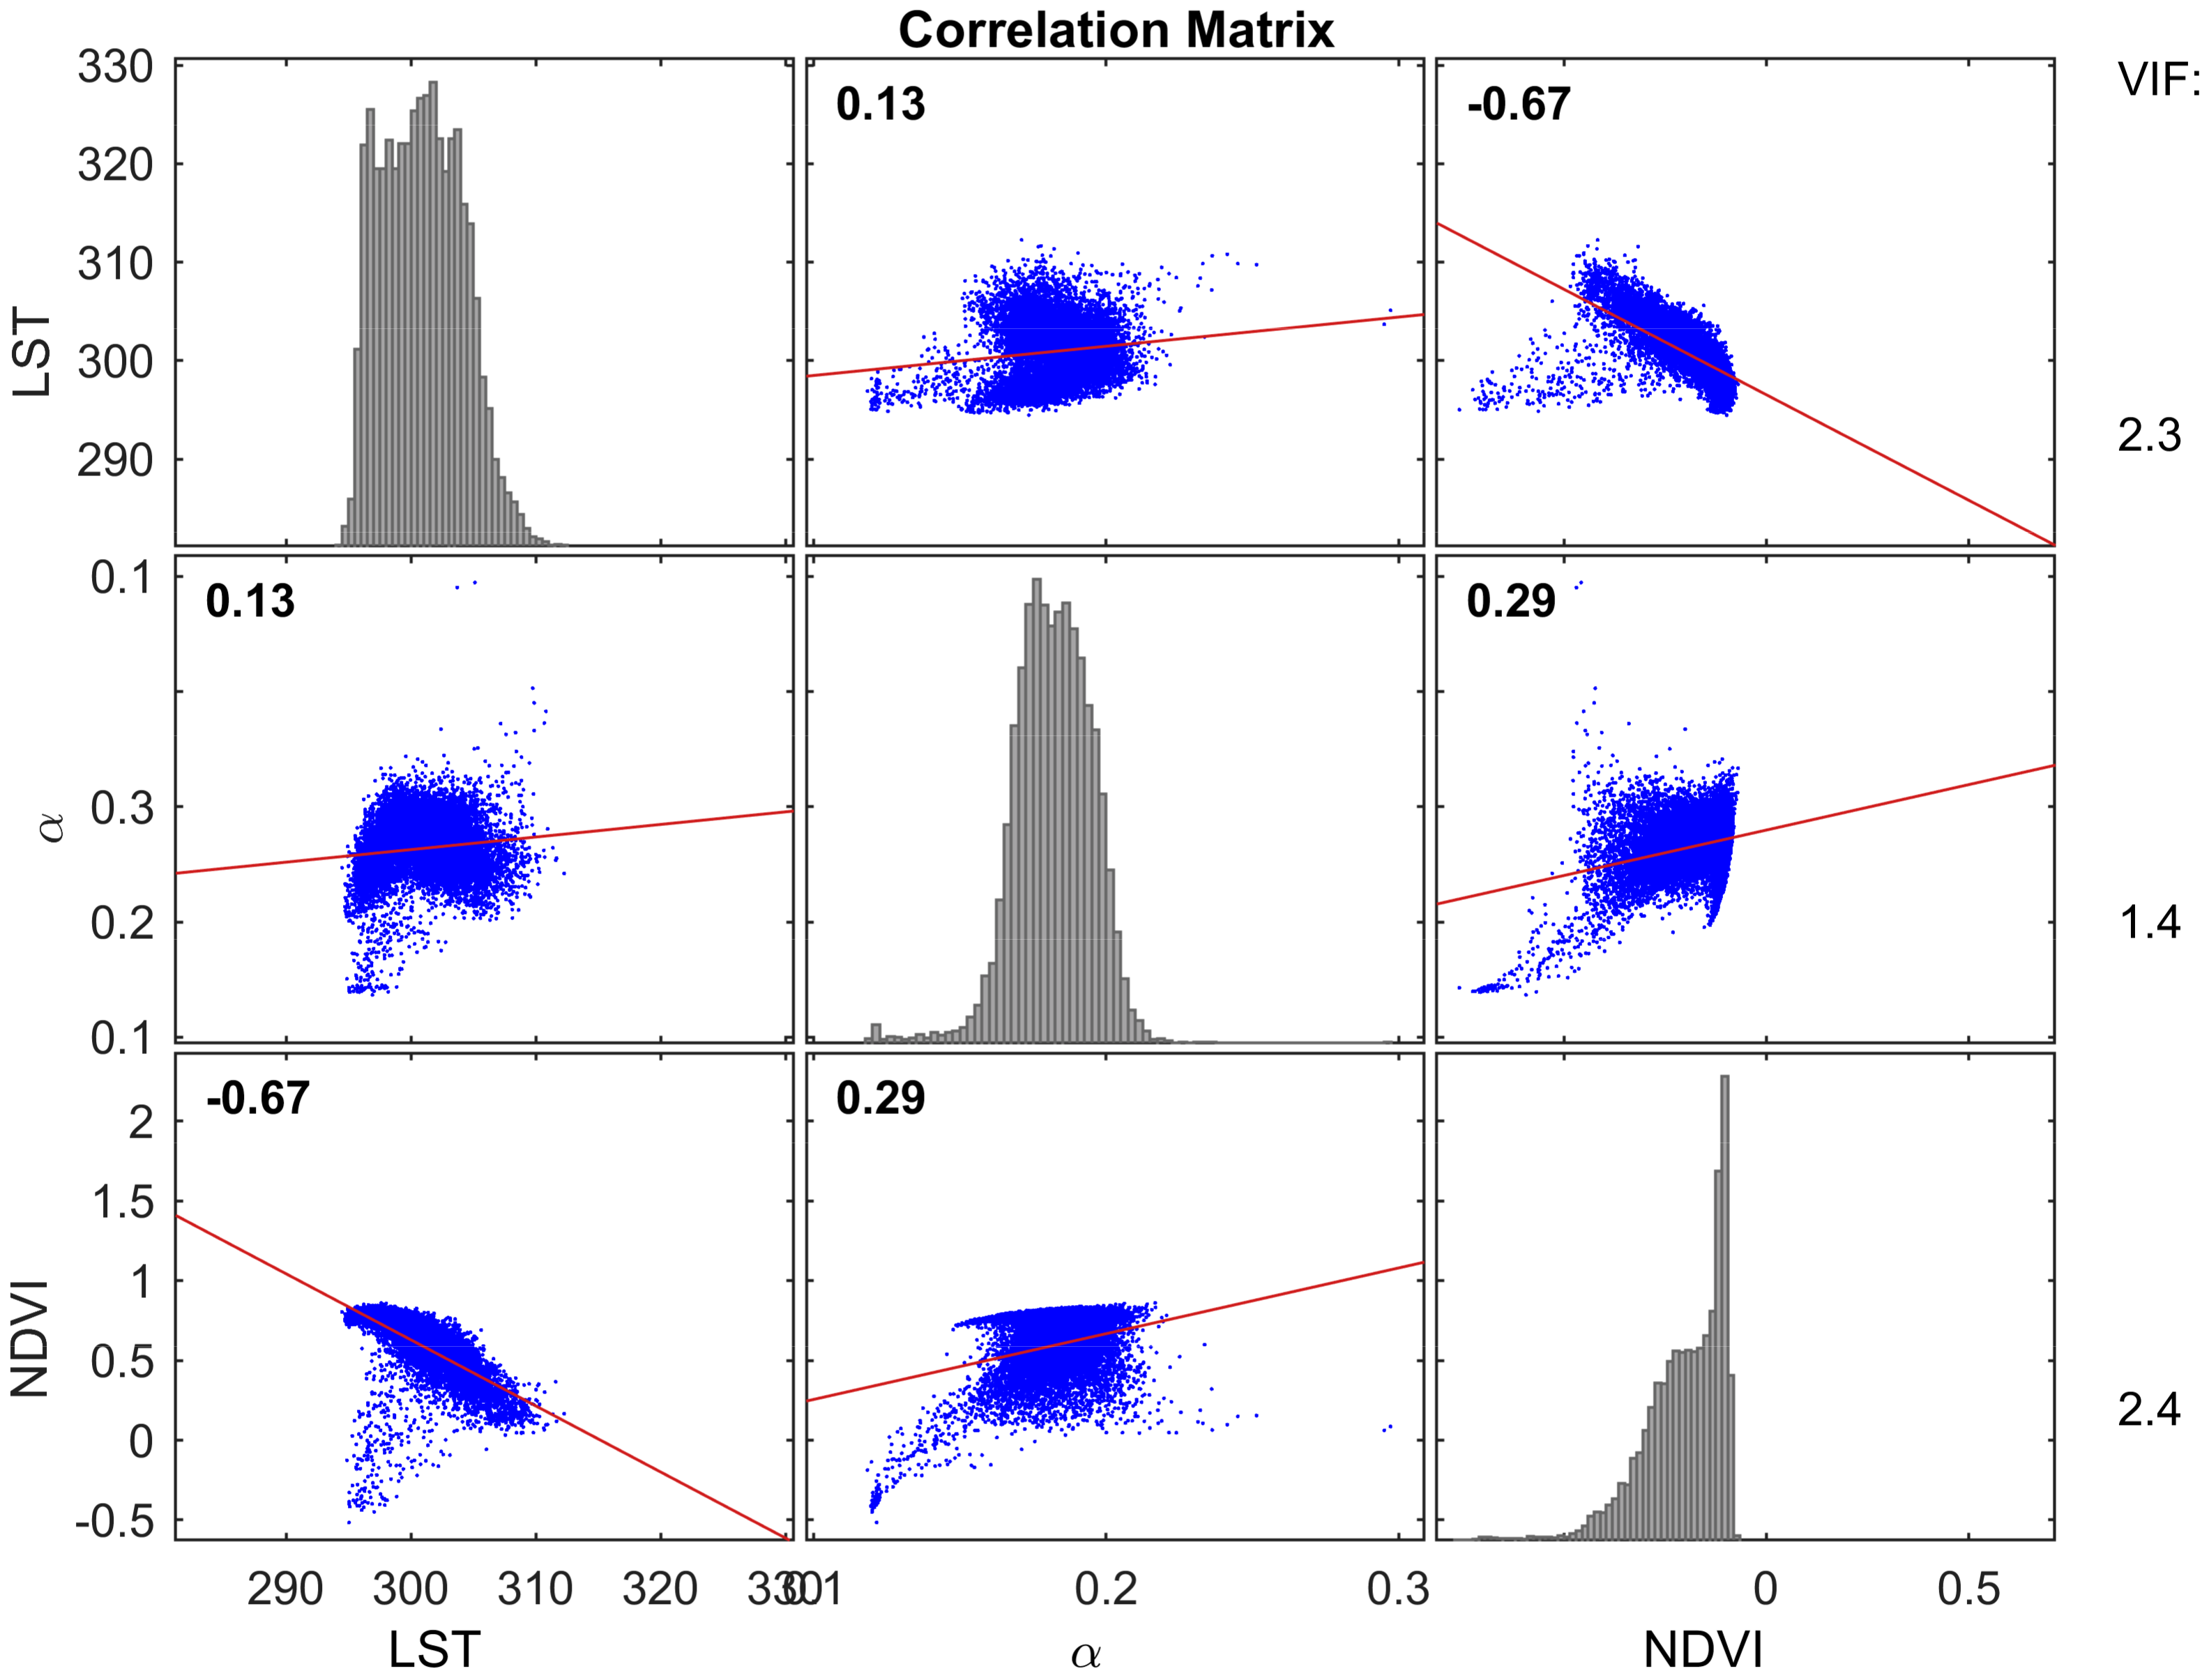
No problems with collinearity are found for the Landsat Data group. Therefore, all three predictors (LST, NDVI and α) are included (Figure A2).
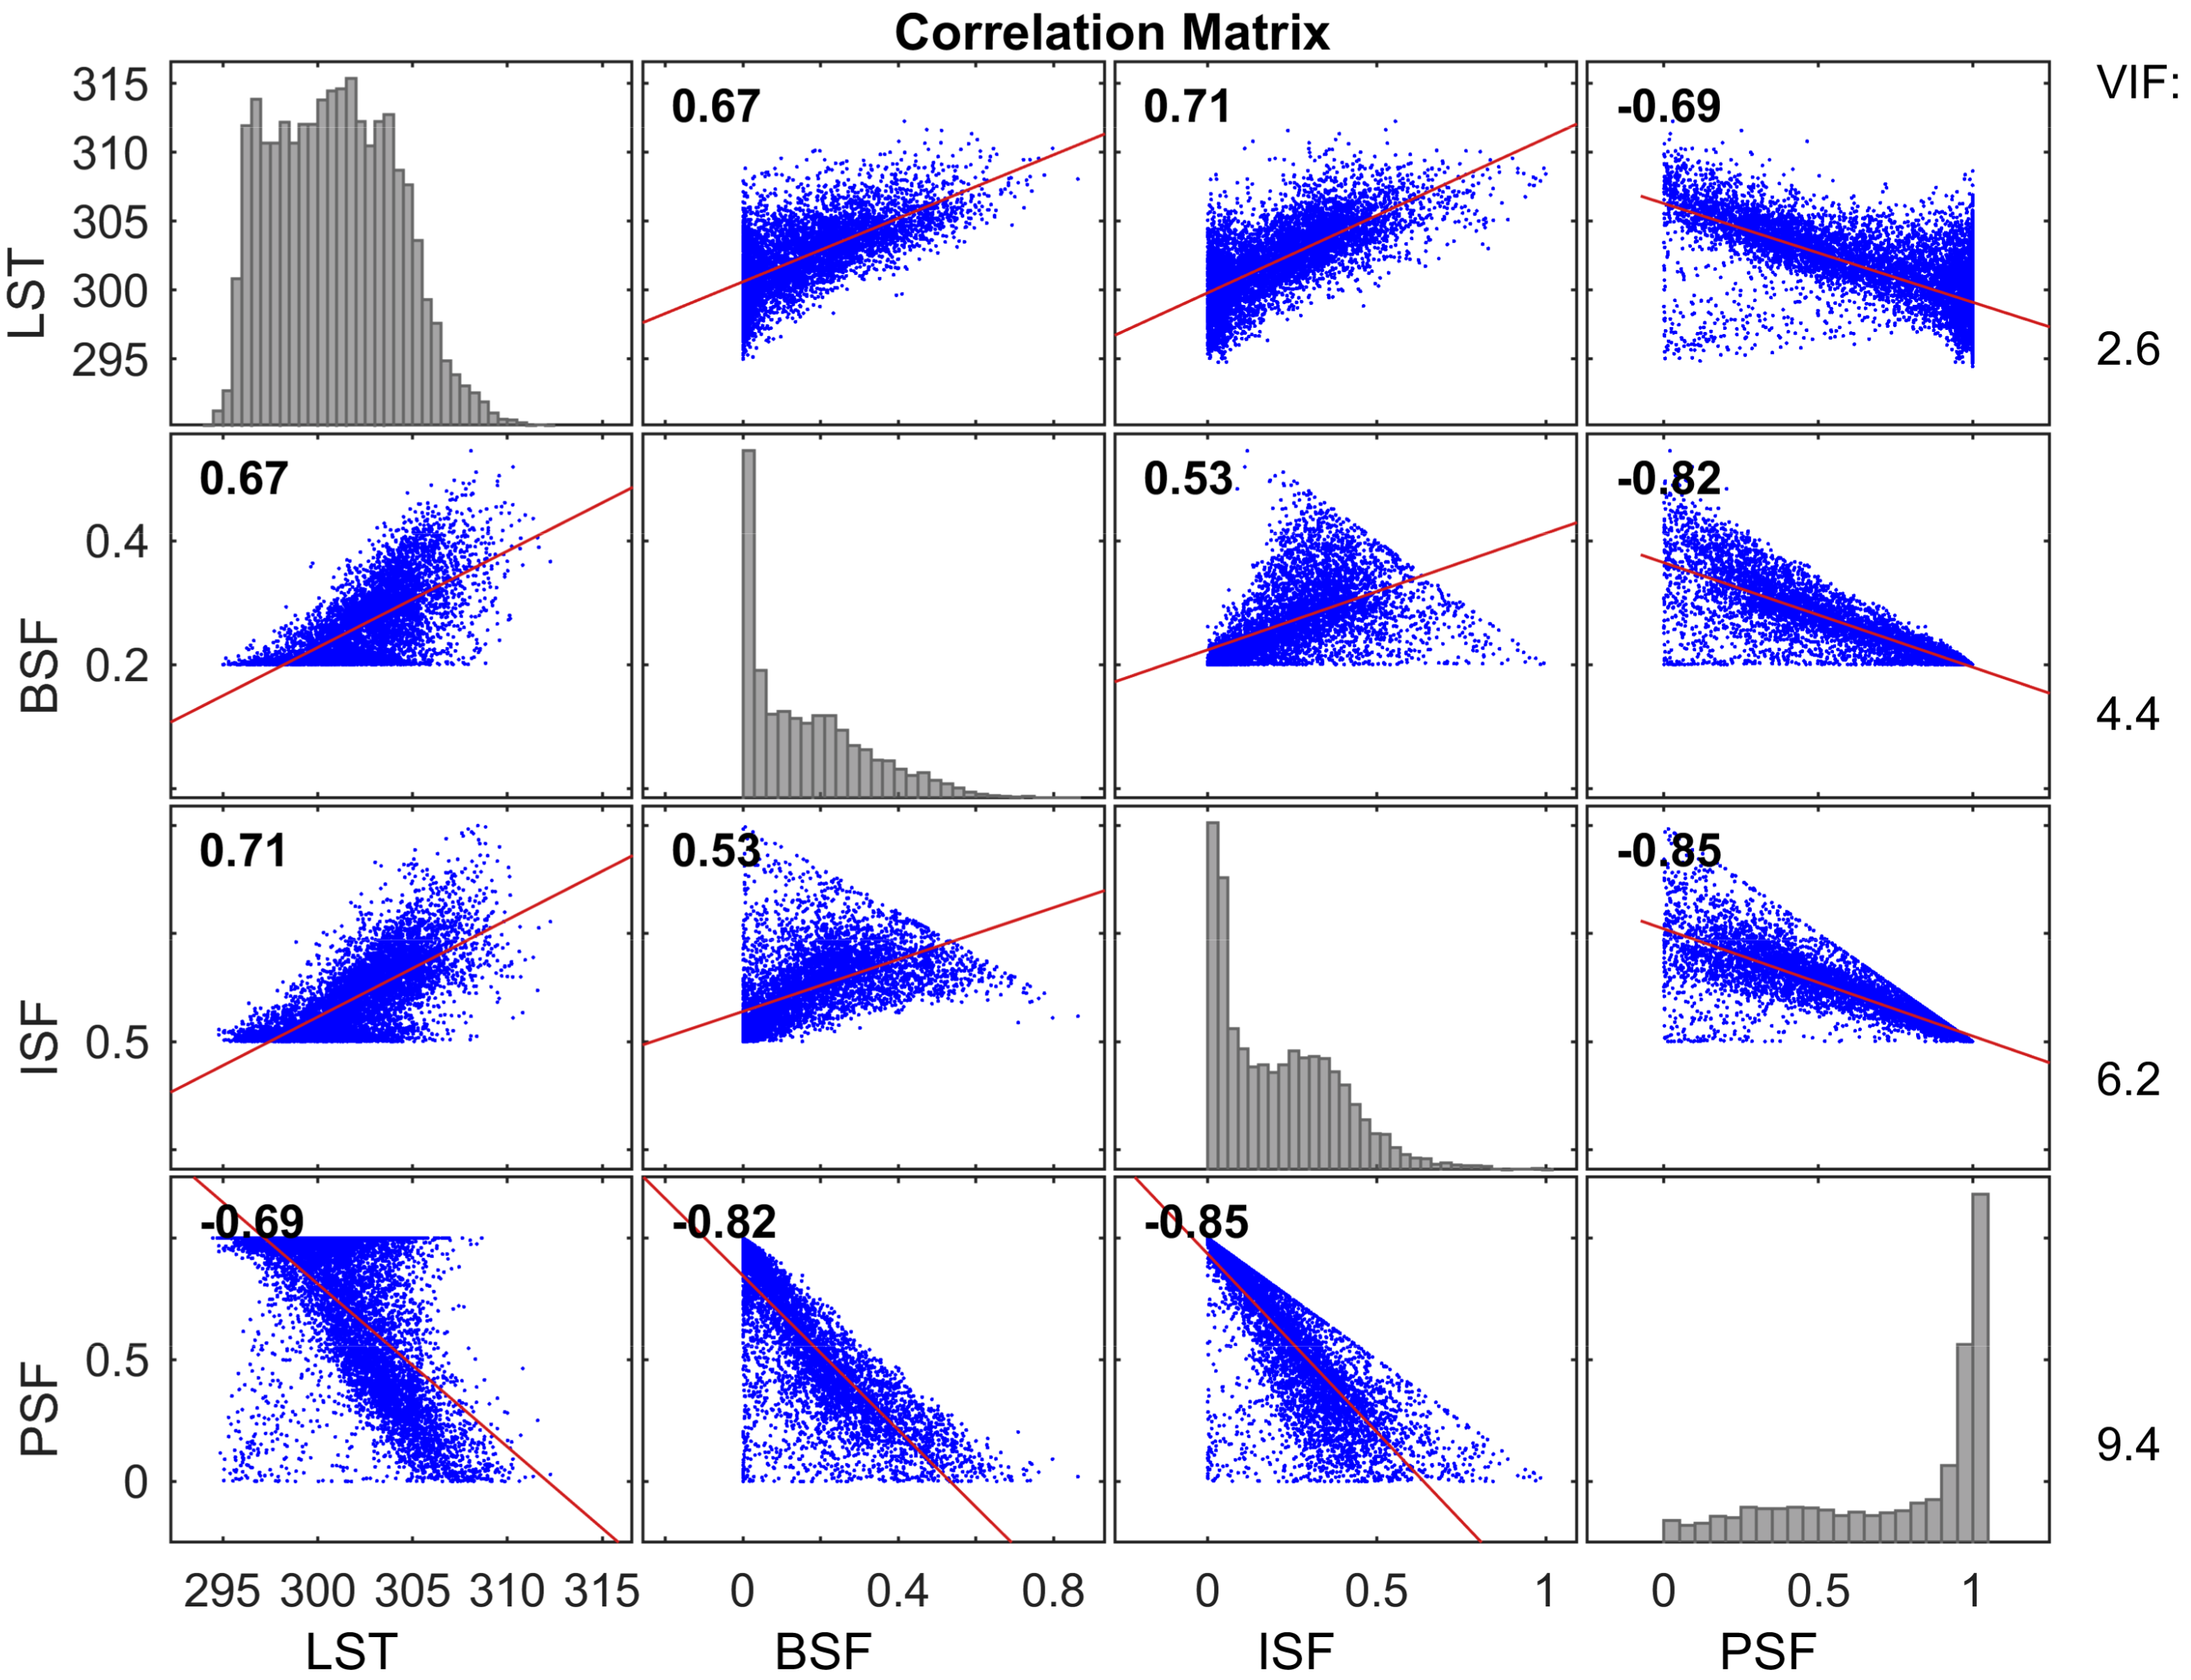
The third group Land Cover reached values close to the exclusion criterion, which was still a considered valuable. Increasing the cell size also increases the VIF, which needs to be taken into account during the interpretation of the results. Therefore, better regression results at higher resolutions might be the effect of collinearity for this group in special (Figure A3).

3.2. Multiple Linear Regression

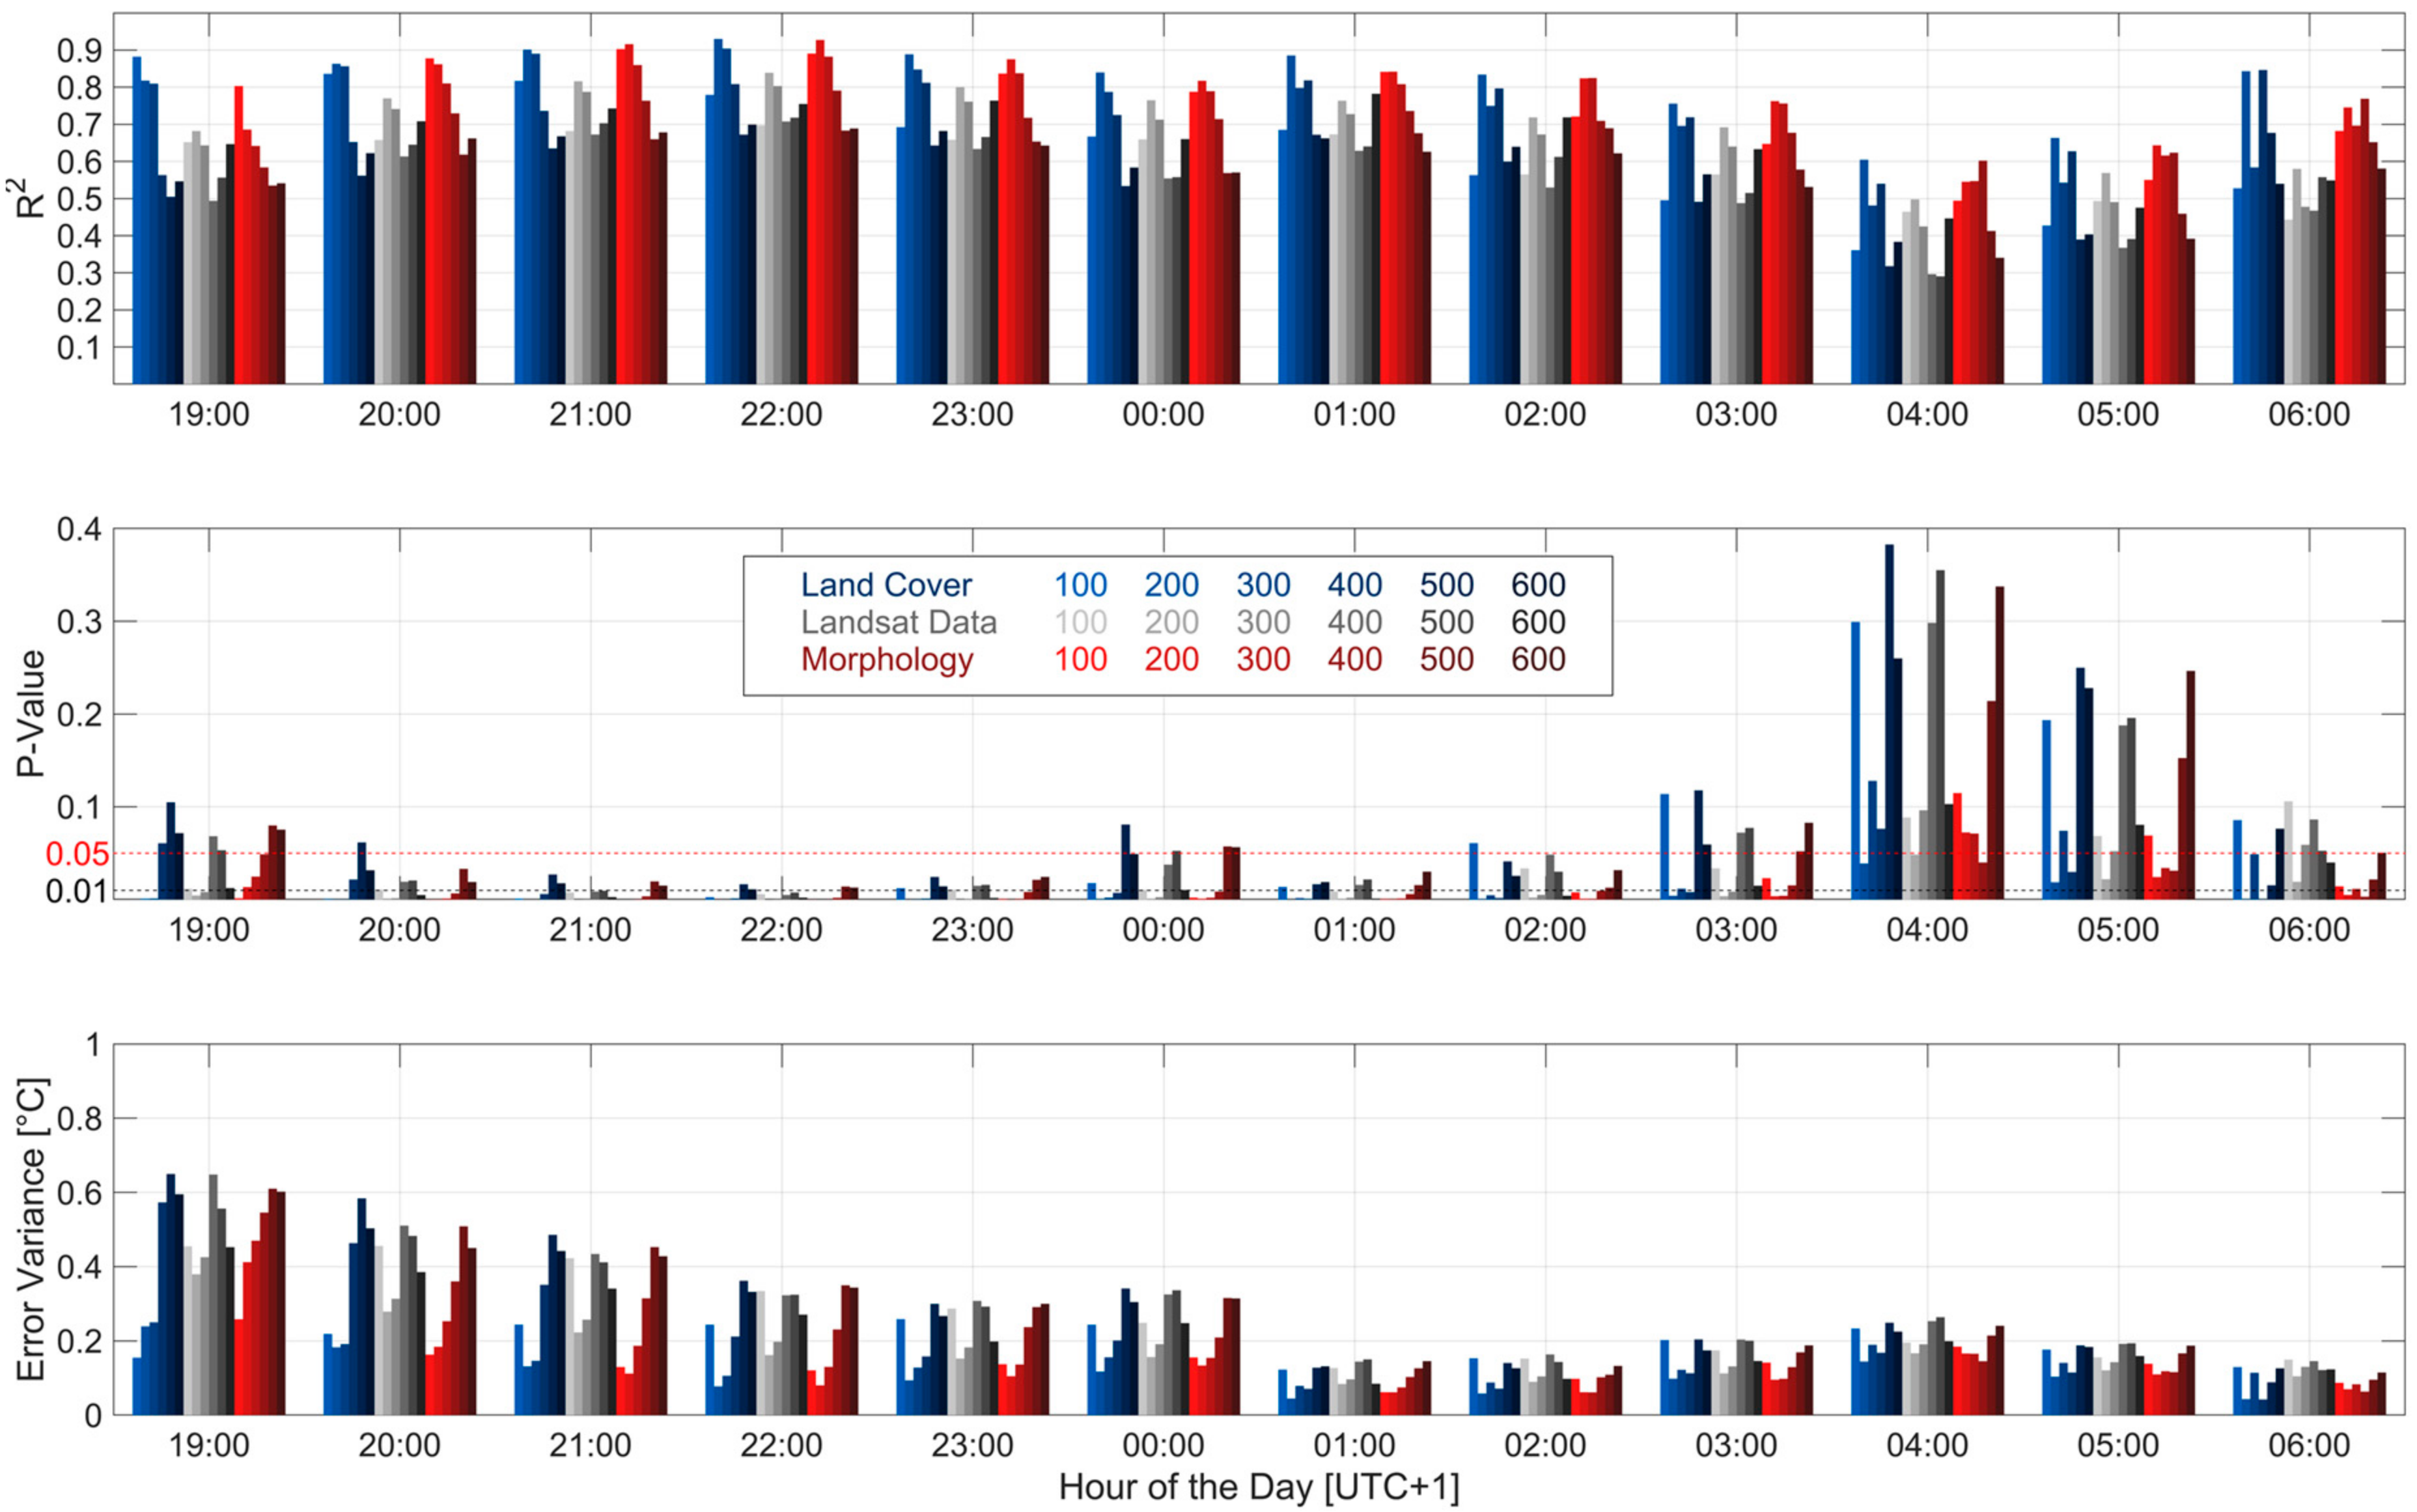
Three groups, six different resolutions (100 to 600 m grid cells), and 12 different points in time (19:00 to 06:00 CET) are tested. Figure 3 shows the complete statistics of this analysis including correlation, significance and error variance—i.e., total deviation from prediction to in situ measured temperatures—of the model runs. The two significance levels (0.05 and 0.01, as a red and black line, respectively) indicate the performance considering the specific criteria. A run falling below the 0.05 threshold is considered significant and valuable, a run falling below the 0.01 criteria is considered excellent. Runs above the 0.05 significance line should be treated with caution.
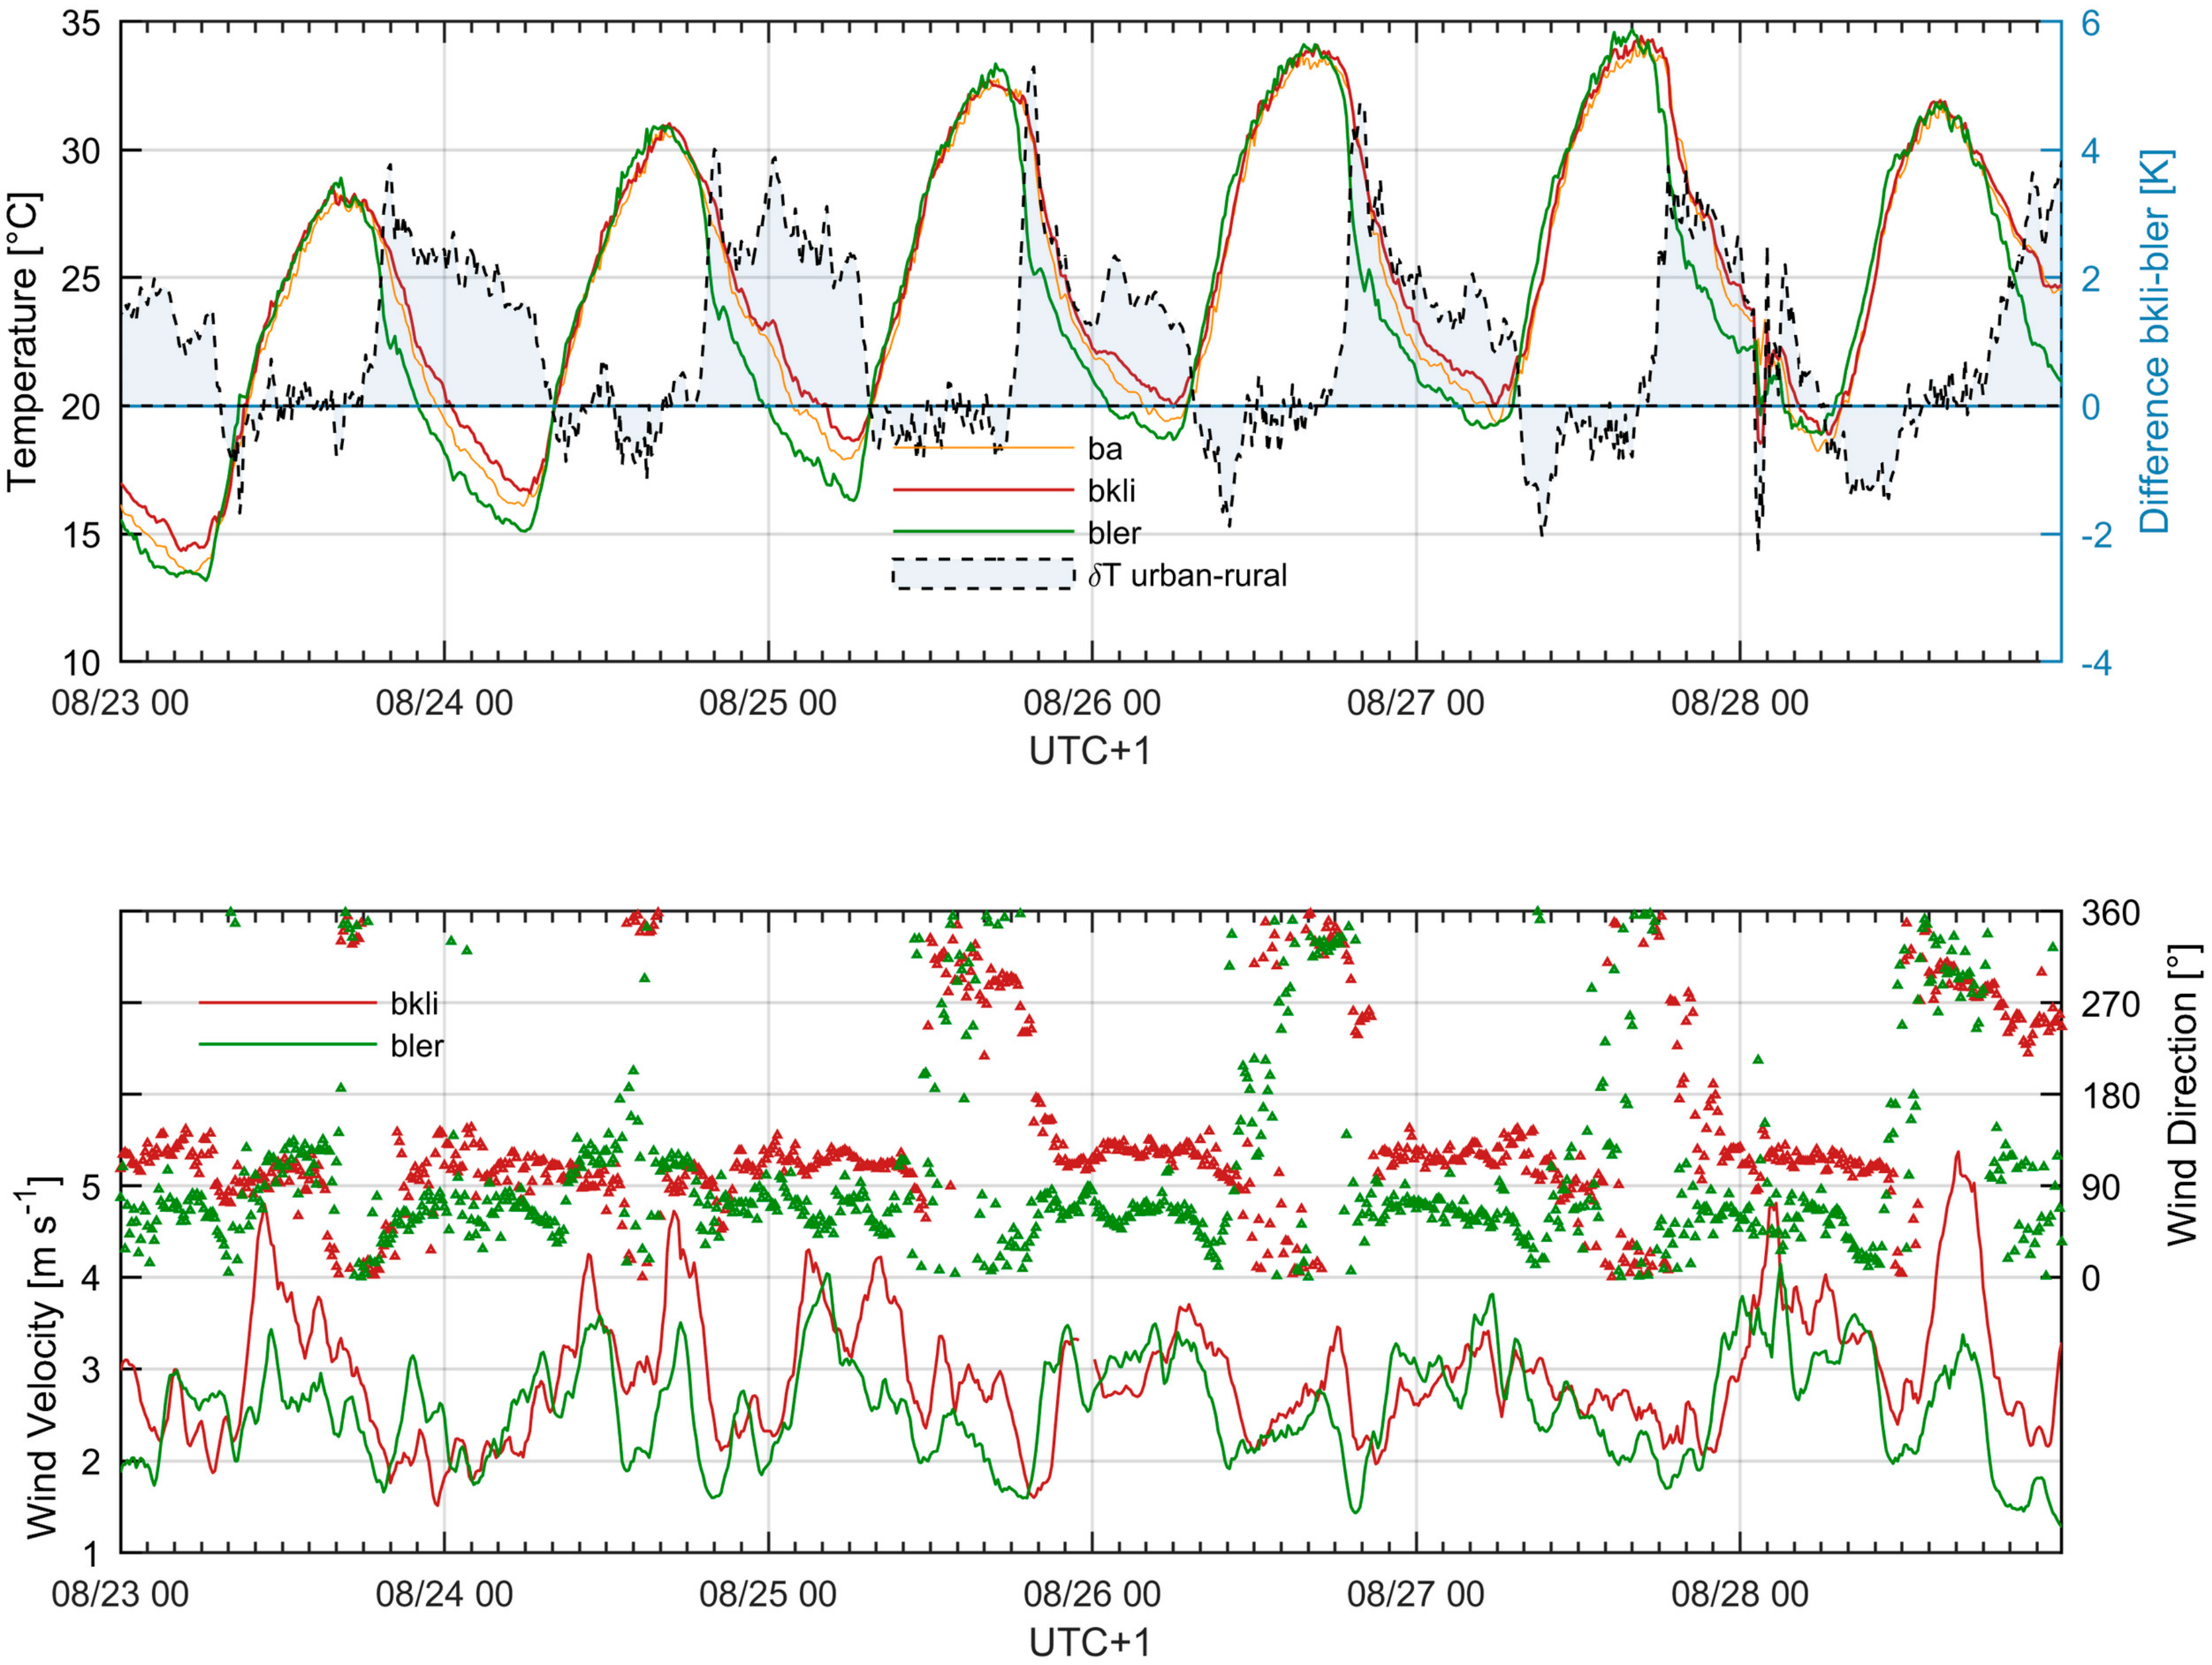
According to the statistics, best results are found for the Land Cover and Morphology (slightly lower) model with a R2 of 0.93 (significant on the 0.01-level) at 22:00 CET with 200 m resolution. The 200 m resolution showed the highest correlation factors also for the Landsat Data group (0.84) with decreasing tendencies at increasing resolutions. The significance is also reduced with coarser resolutions (except 100 m), with the same tendencies for the error variance. Highest correlations are found around 22:00 with a minimum at 04:00 CET. The same drop for significance is found at around 03:00 to 06:00 CET. The error variance typically decreases during the night since the temperature decreases, but the lower model success at around 04:00 CET is captured as well. This might be due to the loss of ‘fuel’, i.e., heat stored in the urban fabric, and the resulting decrease of the urban heat island and/or katabatic wind systems generated after substantial cooling on the surrounding hillsides. In Section 4.1, meteorological measurements during the investigation period are described and they demonstrate the higher UHI intensity at the same time the correlation reaches the highest numbers, or vice versa. As the UHI intensity decreases, the variance within the response is reduced, which depreciates the model statistics. The analysis of the wind systems indicates slightly stronger winds after midnight, but not with a significant trend. However, the wind direction—an indicator for cooling slope wind systems—does not change dramatically throughout the night.
Average statistics for the entire model run (i.e., 19:00 to 06:00 CET) are shown in Table 2. The R2-values and mean error variance are temporally averaged and the two significance levels (0.05 and 0.01) indicate how much percent of the overall runs have fulfilled the specific criteria for the different model resolutions. Again, the 200 m runs show highest correlation with almost 100% significance for all runs. More than three out of four runs show very high significance. The scales of 200 and 300 m seem to capture the temperature influence properly, because the error variance throughout all runs is the lowest for this resolution with errors ranging from 0.11 to 0.20 °C. Lowest correlations, accompanied by low significance and highest error variances, are found using 500 m grid cells.
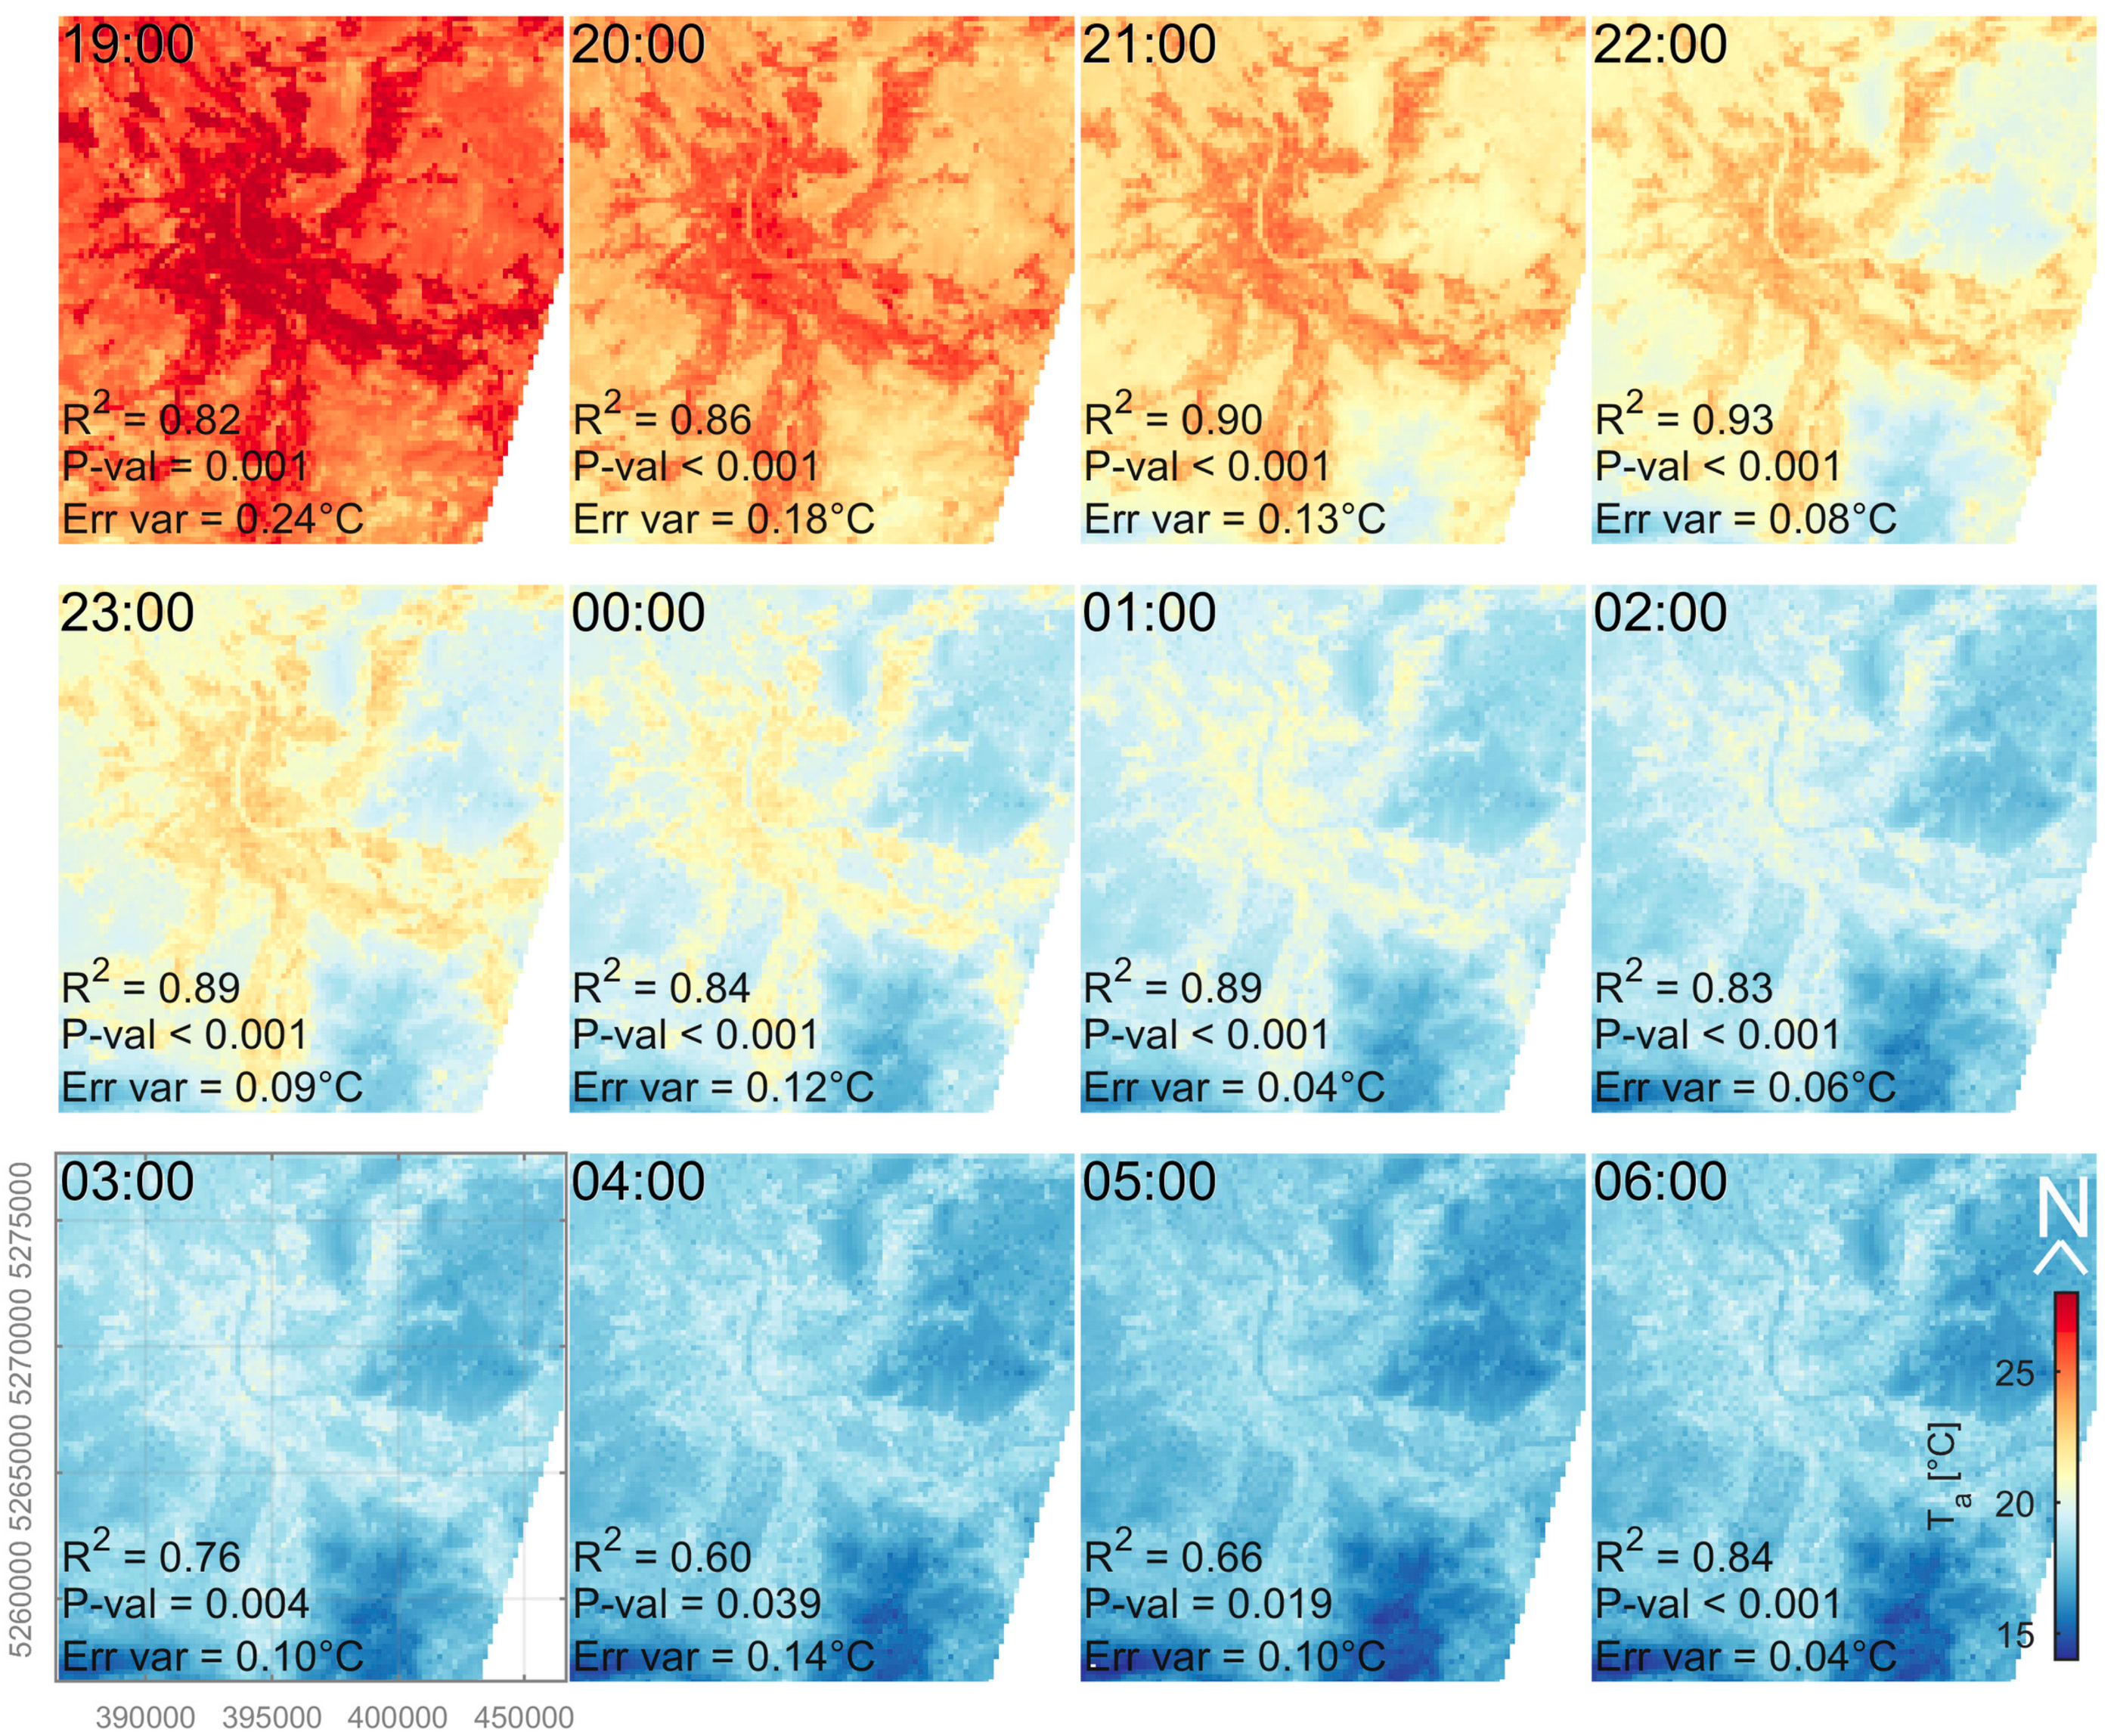
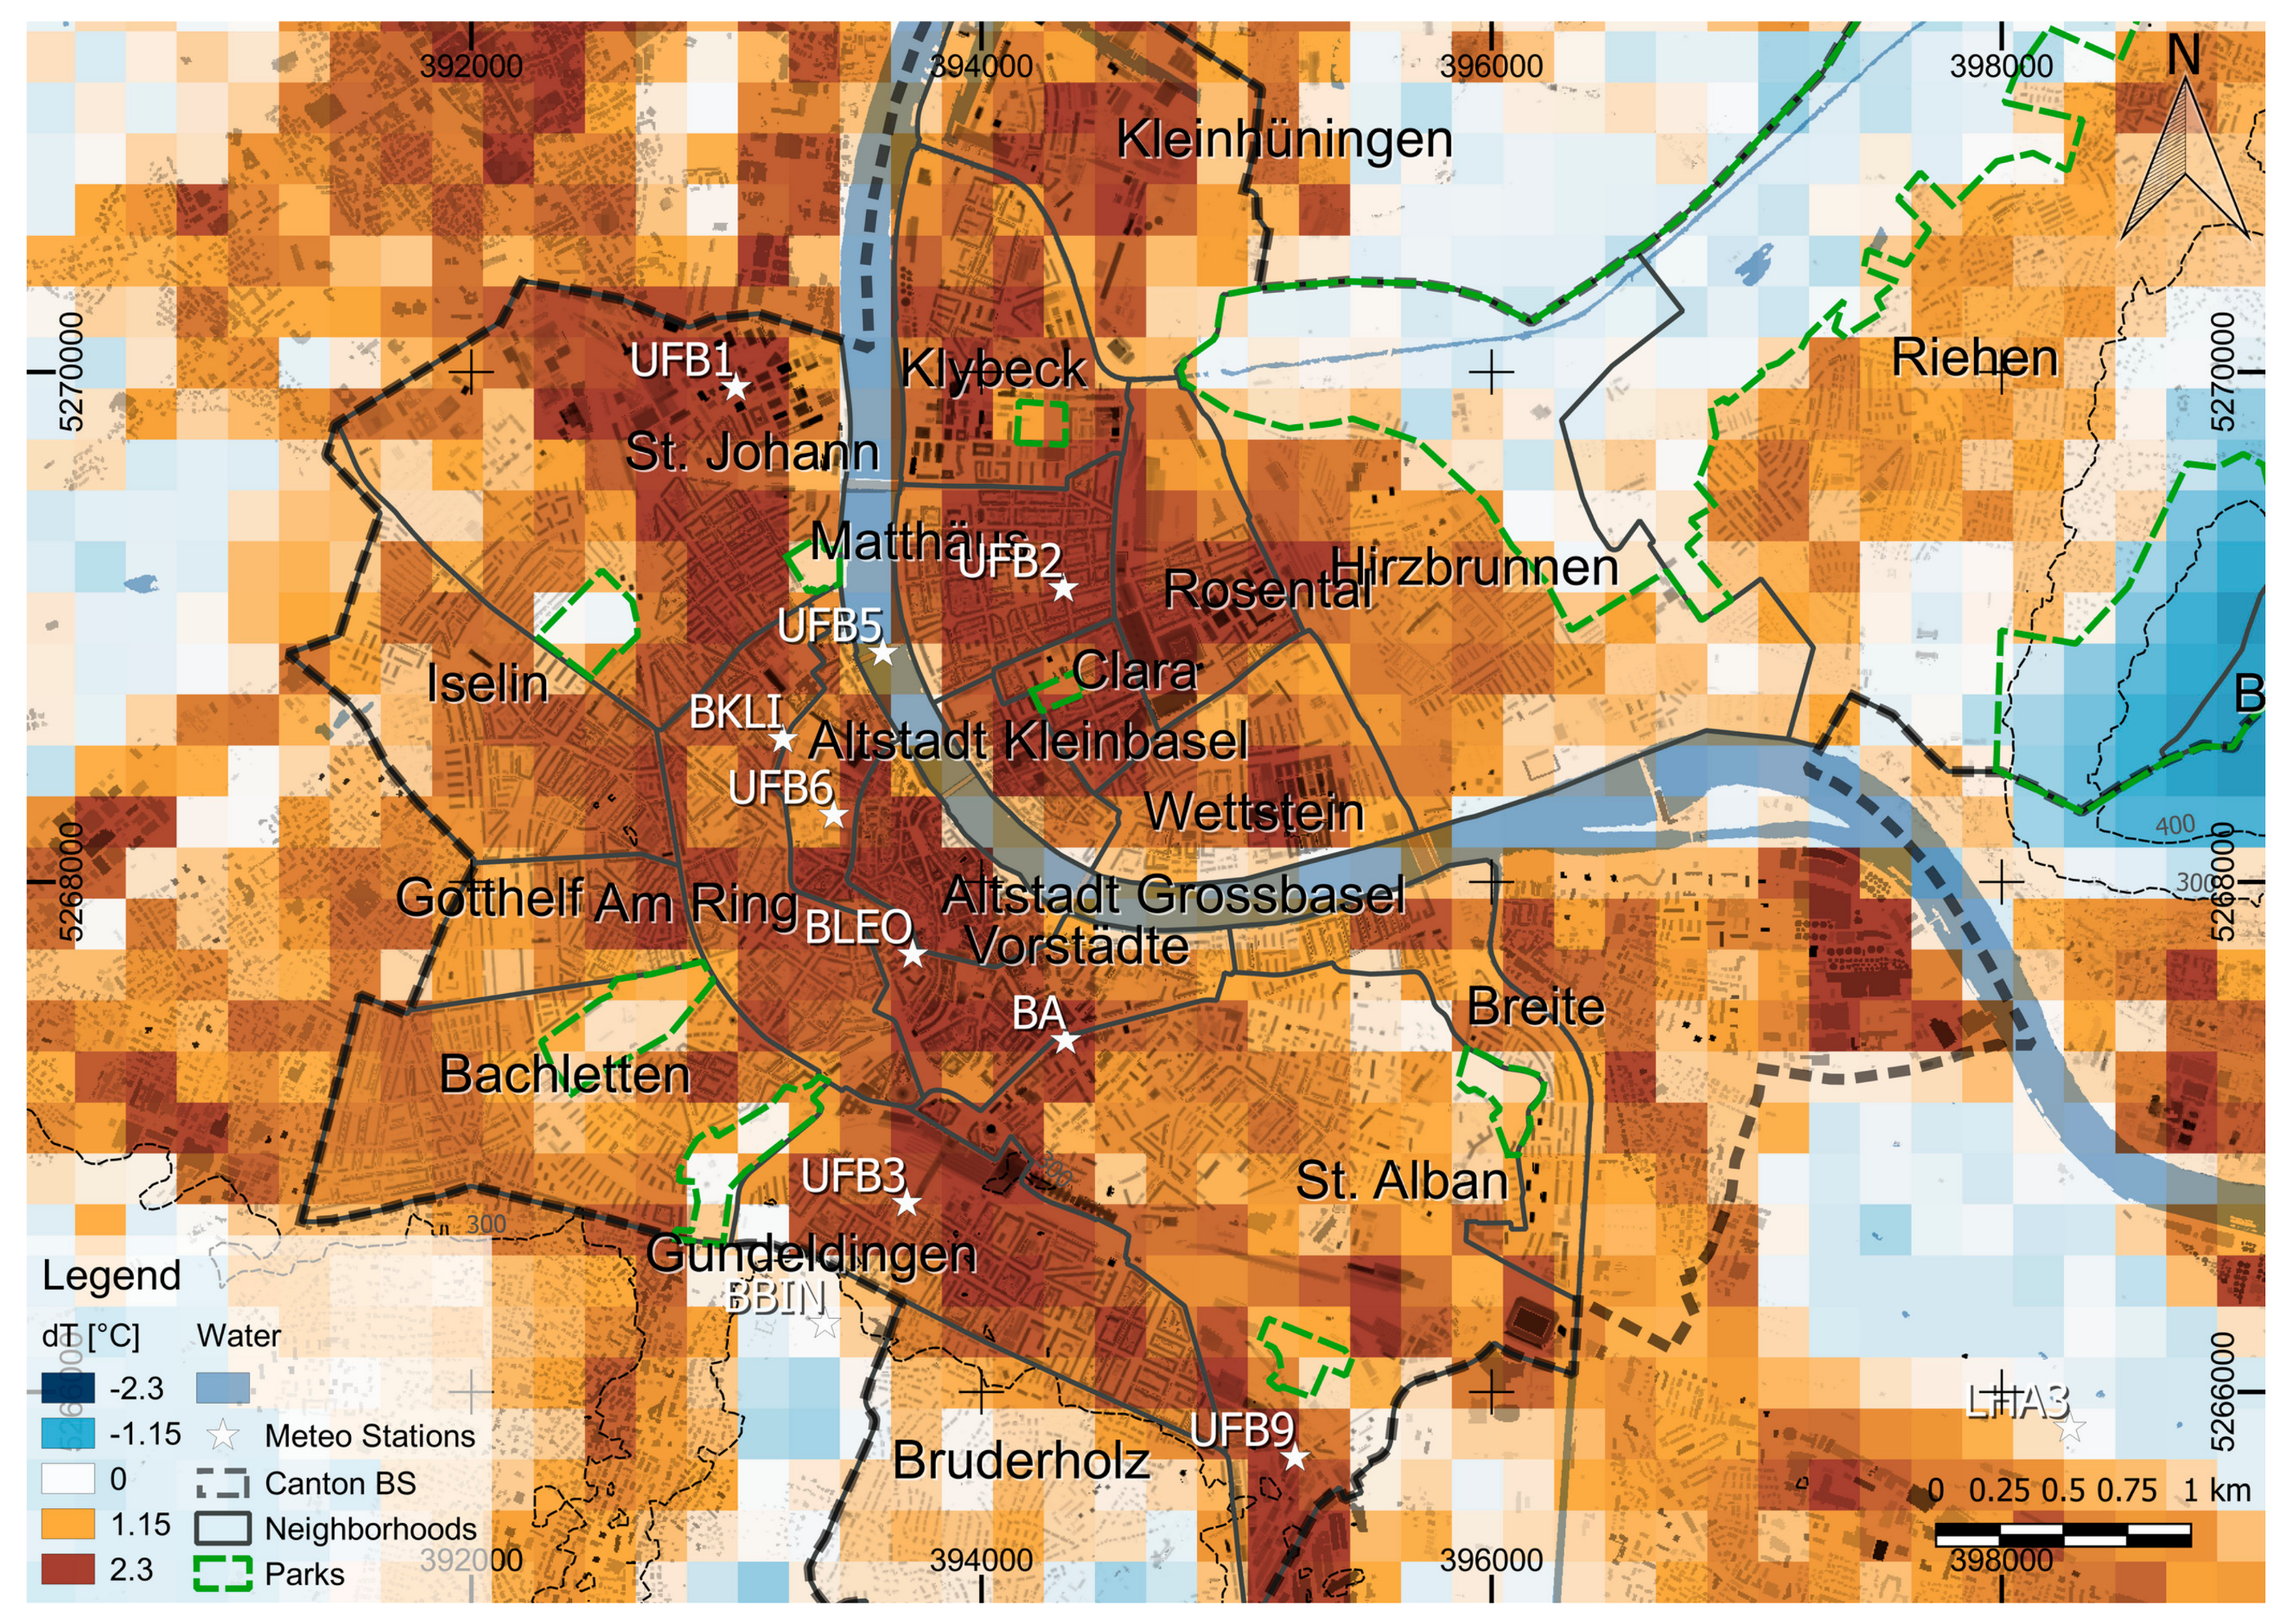
Figure 4 shows the evolution of Ta throughout the night with a resolution of 200 m. This predicted Ta results from the regression formula (Equation (11)) applied with the resulting coefficients and the specific predictor maps. Significant height differences are taken into account by a lapse rate of 0.6 °C per 100 m—the same cooling rate used to normalize the measured Ta. Therefore, a temperature bias can be addressed to elevated areas in the south and northeast of the city. However, the intra-urban differences are not resulting from height differences, because the urban area is relatively flat (Figure 1, Section 2.1). In this area, land cover is the main driver for regulating the Ta distribution and thus the UHI evolution. The old town core in the center of the image is clearly defined and remains always one of the warmest regions until the distribution is getting flatter around 03:00 CET. This is a typical feature of the nocturnal UHI, which often shows largest urban to rural differences in the first half of the night. Urban parks can clearly be detected as cool spots close to the city center. Figure 5 includes the difference of every raster cell to the modelled temperature at BBIN (i.e., an official weather station of MeteoSwiss). It indicates that the official temperature measurement for the city underestimates the heat load for most of the urban dwellers by 2–3 degrees. The temperature of this station would only be valid for the urban park sites, which have an influence of less than the park extent [83]. Large residential areas like Bachletten or St. Alban reveal a lower temperature difference to BBIN, and, therefore, less heat stress for the population. Highly densified areas like the old town (i.e., Altstadt) are clearly on top of the heat scale. The different railway stations located in the Rosental, St. Johann and Gundeldingen neighborhoods also show high positive deviations. Additionally, the industrial areas in St. Johann (at station UFB1) and at the eastern city limits are about 2 degrees warmer than BBIN in this model run.

3.3. Validation

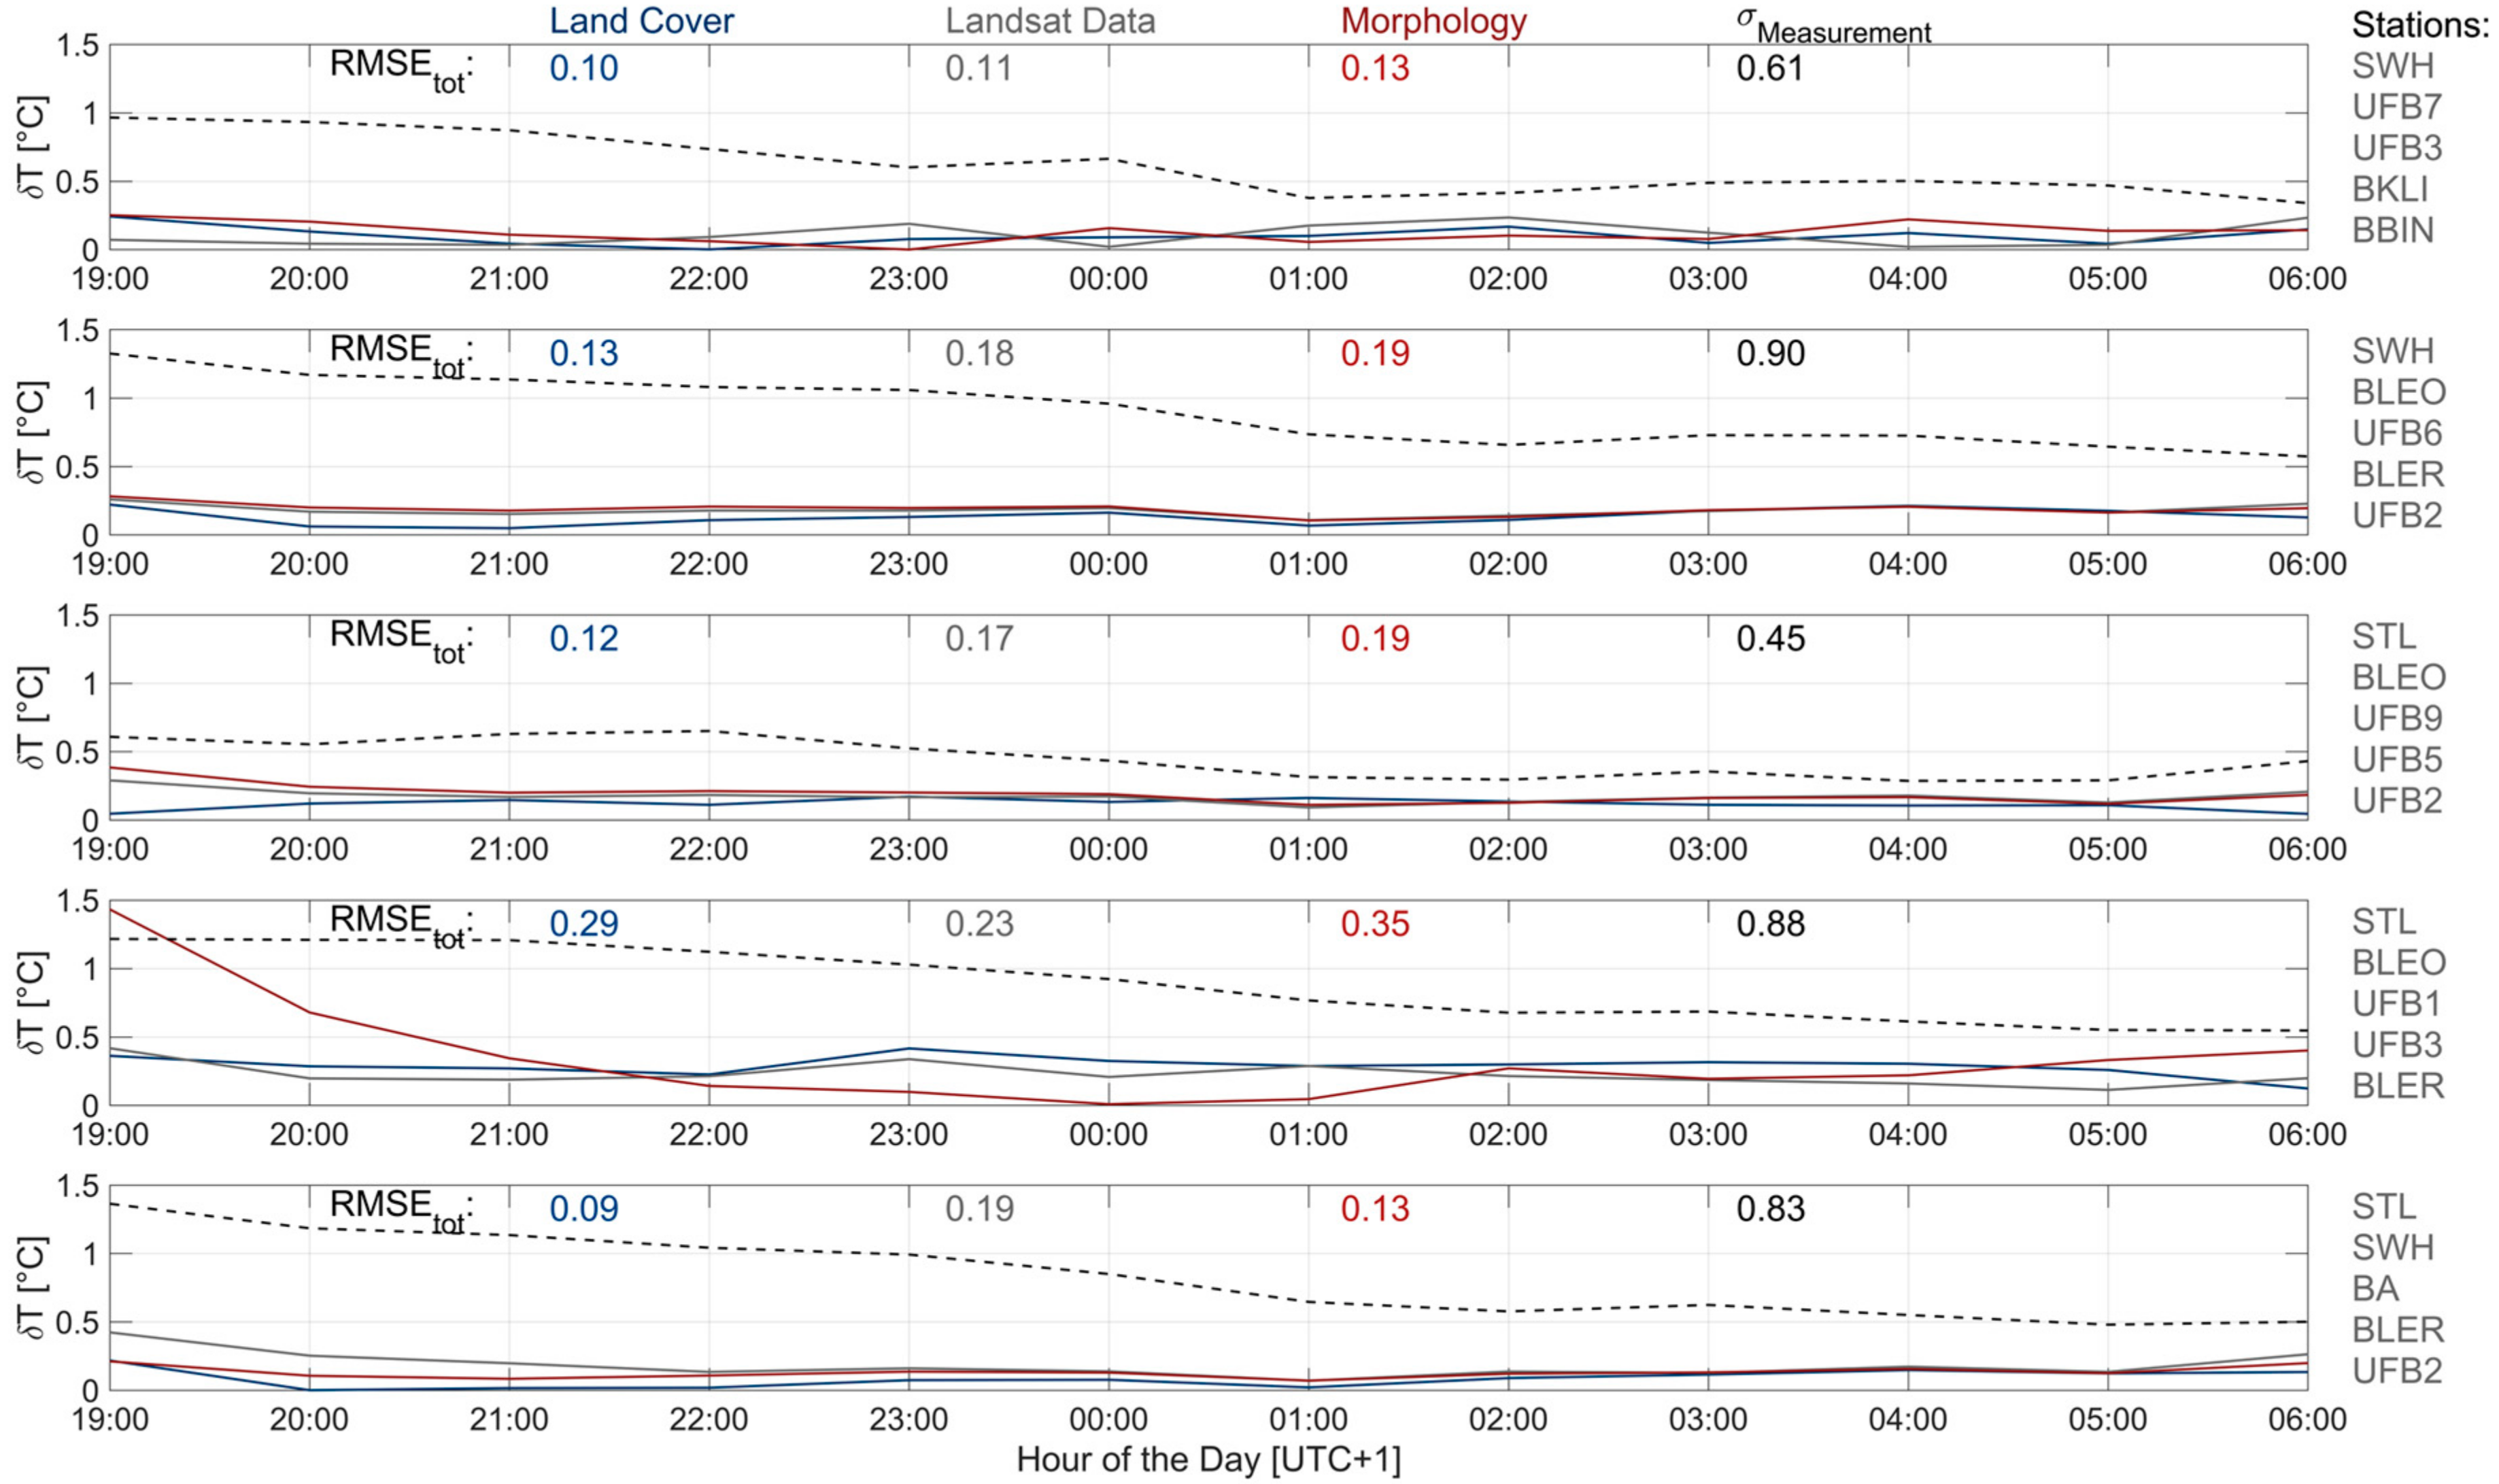
The RMSEs of the validation runs are clearly below the standard deviation of the measurements at the validation sites for all input predictor groups with the highest errors for the Morphology group and the best results using the Land Cover group, on average. The latter performed with RMSE values ranging from 0.07 to 0.27 °C in the exemplary run. The validation shows that some stations are specifically important for the model, especially if they are located in a unique environment. For a successful model run, a certain variation of the input predictor is needed. RMSEs are varying from one run to the other, because the different predictor setup creates slightly different coefficients for the regression formula. Nevertheless, the tendencies seem to remain constant and the results are still reasonable, even though a third of the input predictors are removed. Figure 6 shows deviation plots for five random sample sets on the 200 m grid, which is the resolution that performed best with the lowest RMSE. The largest errors are typically found at the beginning of the night, when the UHI is not yet fully developed. The error often decreases with decreasing temperature and increasing UHI intensity.

4. Discussion

4.1. Synoptic Conditions and Meteorological Measurements

The synoptic conditions during the investigation period were very calm with a persistent high-pressure system centering around 1025 hPa around northeast Germany. Due to the orientation of the high-pressure system, winds were expected to be very weak and coming from the eastern direction. The end of the period resulted from an eastward movement of the high-pressure system and the afterwards approaching cold front on 29 August 2016. During this small heat wave, a strong upper-atmospheric ridge developed with a stable omega-like pattern providing Central Europe with warm and dry air. The meteorological conditions measured at the urban reference station above roof-level delivered the same results as expected from the weather maps. The nocturnal wind was usually blowing from the eastern and east-southeastern sector with a mean velocity of 1.7 m s−1, almost never exceeding 4 m s−1. A wind system providing the city with fresh air regularly established in the afternoon, which is also one reason for the almost absent heat island during the day and the homogeneous temperature distribution. The development of the observed heat island in Basel started shortly after Tmax at around 18:00 CET (Figure 7) and generally peaked at around 22:00 CET. A maximum heat island intensity of 5.3 °C was found in this period, with a total average nocturnal heat island intensity of about 2 °C. During 15% of the time, the temperature difference between the urban and the rural station was larger than 3 °C between 19:00 and 06:50 CET. Most of the nights, the UHI intensity decreased steadily until it almost turned into a cooling island after sunrise in the morning hours. With increasing turbulence in the afternoon and the above-described wind system establishing at about noon, no significant difference between the urban and the rural measurement stations are apparent. On average, a slight cooling island with −0.2 °C was measured between 07:00 and 18:50 CET.

4.2. Model Output

The model output depicts a typical UHI development during the night with some colder areas in the suburbs and hot spots in the center and at industrial sites, including railway stations. Ta distribution seems to be rather a “heat archipelago of a city”, as mentioned by Kuttler (2012) [84]. Other studies using coarser datasets, such as MODIS or AVHRR, found one single UHI [85]. Within this urban archipelago, urban parks are well distinguished as cool ponds. This shows the strength of the model, because measurement sites in urban parks are very limited and the cooling effect of urban parks (i.e., park cooling island) is well described in previous urban climate studies [43,83,86]. Due to the small size of the parks in Basel, i.e., below 10 ha, these features only become apparent with increasing resolution. Since also the R2/p-value decrease/increase with coarser resolution, a minimum cell size of 200 m for medium-sized European cities, i.e., cities with a population <500,000 inhabitants, is proclaimed. Depending on the predictor used and the measurement height of Ta, a narrow resolution of 100 m—representing only the specific environment (i.e., the specific street canyon)—might be a good solution. For comprehensive maps with Ta measurements at about roof level, 100 m cell size is not ideal. Brazel and Stoll (1992) found a resolution of around 250 m reasonable, which was identified for North American cities with larger city structures [67]. Therefore, a 200 m resolution in this model seems to be realistic.
Eliasson and Upmanis (2000) found the greatest difference between urban parks and the surrounding urban areas between 2 and 6 h after sunset, which is exactly the time where the MLR model performed the best, considering the statistical analysis [86]. Park breezes, as mentioned by Eliasson & Upmanis (1999) and Oke (1989), and cold air drainage flows in general, are difficult to include in the model since they are allochthonous and have, besides barrier and channeling effects, no relation to the surface properties [43,86]. This might be a future improvement in the model.

4.3. Statistical Measures

It is difficult to contextualize the resulting statistical measures since most studies focused on different methods, periods, resolutions and/or datasets. If larger datasets (in number and spatial) are used, a higher error variance is expected, which cannot be explained with a better or worse model performance. On the other hand, if seasonal averages are used, less fluctuation and higher regression results are expected. This is also responsible for the usually lower RSME in our investigation (~0.1 to ~0.3 °C) compared to other studies, even though the regression coefficient is mediocre (between 0.71 and 0.82 with 200-m grid size on average), compared to other ‘successful’ studies.
Nevertheless, as important as high regression coefficients are the significance is expressed through low p-values. Thereby, the null hypothesis states that there is no relationship between the measurements and the predictors. A low p-value indicates that this null hypothesis is wrong and the model is significant. In this analysis, 0.05 was defined as the upper benchmark. If this benchmark is fulfilled, the specific predictors are useful for predicting Ta. If this threshold is not met, the model output should not be considered, even if the error variance is low or the R2 is very high. The analysis of multi-collinearity showed high VIF for the class Land Cover at higher resolution. The improving statistics at a resolution of 600 m might be explained by mapping unit problems and not be related to a better description of the model in this case.
Other studies also included different types of MLR approaches. Stoll and Brazel (1992) found correlation coefficients >0.9 with a stepwise multiple regression using helicopter and in situ TIR data [67]. Epperson (1995) has found R2 up to 0.92 using NDVI and nighttime brightness with an error of 1.84 °C, which can be explained through the large variance using 1000 stations [65]. Blennow (1998) achieved comparable results (R2 = 0.87, RMSE = 1.08 °C) in a rural surrounding and Cresswell (1999) found R2 between 0.80 and 0.84, but with a substantial error of 3.3 to 4.2 °C, which can also be explained with the large variance (modelled Ta for entire Africa) [75,87]. Ninyerola (2000), and later Christobal (2008) with a comparable approach, reached correlation coefficients up to 0.97 and 0.86, respectively [76,79]. They applied monthly and annual minimum, mean and maximum Ta and used different climatological factors such as altitude, latitude, continentality and solar radiation. Cristobal (2008) added remote sensing variables and called his model a “remote sensing and GIS hybrid”, which is comparable to our idea [76]. Many studies are concentrated on monthly or daily mean, minimum or maximum values and often found best correlation predicting daily minimum (i.e., nocturnal) Ta (e.g., [64,65,68,76,88,89,90,91] etc.). Modelling diurnal (or nocturnal) courses are seldom done. Bechtel (2014 and 2017) has applied MLR based on multi-temporal Meteosat SEVIRI data to predict short term Ta with very high correlation (R2 between 0.97 to 0.98) [77,92]. Nichol (2005 and 2009) used ASTER nighttime data in Hong Kong and compared the remote sensing data to Ta—measured during vehicle traverses and at measurement stations with R2 between 0.80 and 0.94 [59,69]. Ma (2015) noted that the results of single predictor studies could be improved using multiple predictors and found better correlations using higher resolution data [72]. This is confirmed by our study, but with a lower limit in spatial resolution of 200 m.
Even though a comparison of our regression approach with other studies is difficult, the statistical parameters are very promising and allow rejecting a model output in case of low significance and/or low correlation. The good performance is particularly confirmed by the random sampling validation, which indicates that for the tested grid cells Ta is predicted with high accuracy.

4.4. Potentials

The analysis of different model setups to evaluate the best method for extrapolating measured temperature into a two-dimensional environment has shown that the type of input predictor is not the most critical decision, but that it is essential to have multiple predictors. The selection of the responses are very critical, because a certain variation in the surrounding land cover of the measurement stations is crucial for the success of the model. Linear correlations between LST and Ta must be handled carefully, because the amount of thermal infrared radiation does not include the thermal properties of the specific surface (e.g., thermal inertia) and the interaction with the overlying air. For example, surfaces with a high thermal admittance readily accept energy during the day, transmit it to the substrate and release it at night with similar capability [24]. If a surface has a low thermal admittance, it reacts very fast to energy input and is relatively warm during the day, but it loses this energy similarly very quickly and is therefore unable to maintain positive energy fluxes to the surface during the night [6]. The ability of storing this energy might be explained by other parameters, such as the building density (λP).
An important application of the resulting dataset is the assessment of heat stress due to high nocturnal Tmin. Small increase in urban Tmin during strong heat waves increases the mortality and the morbidity substantially [14,16,19]. During the night, most people are located inside their building and therefore exposed to the respective indoor climate, which does not necessarily need to be the same as the outdoor climate [15]. Nevertheless, the outdoor temperature is the best measure of nocturnal heat stress that is widely available since not every household can be monitored. The resulting maps offer a high-resolution view on the heat distribution throughout a large region and they can be used for risk maps or intervention guidelines. For example, during heat waves, nocturnal heat stress in every grid cell can be summarized after every night, and areas that transcend a certain threshold can be considered for special care or even evacuation of vulnerable people.
The findings are also suitable for surface flux estimation, where the difference between Ta and LST is an important component required to compute the sensible heat flux [93].
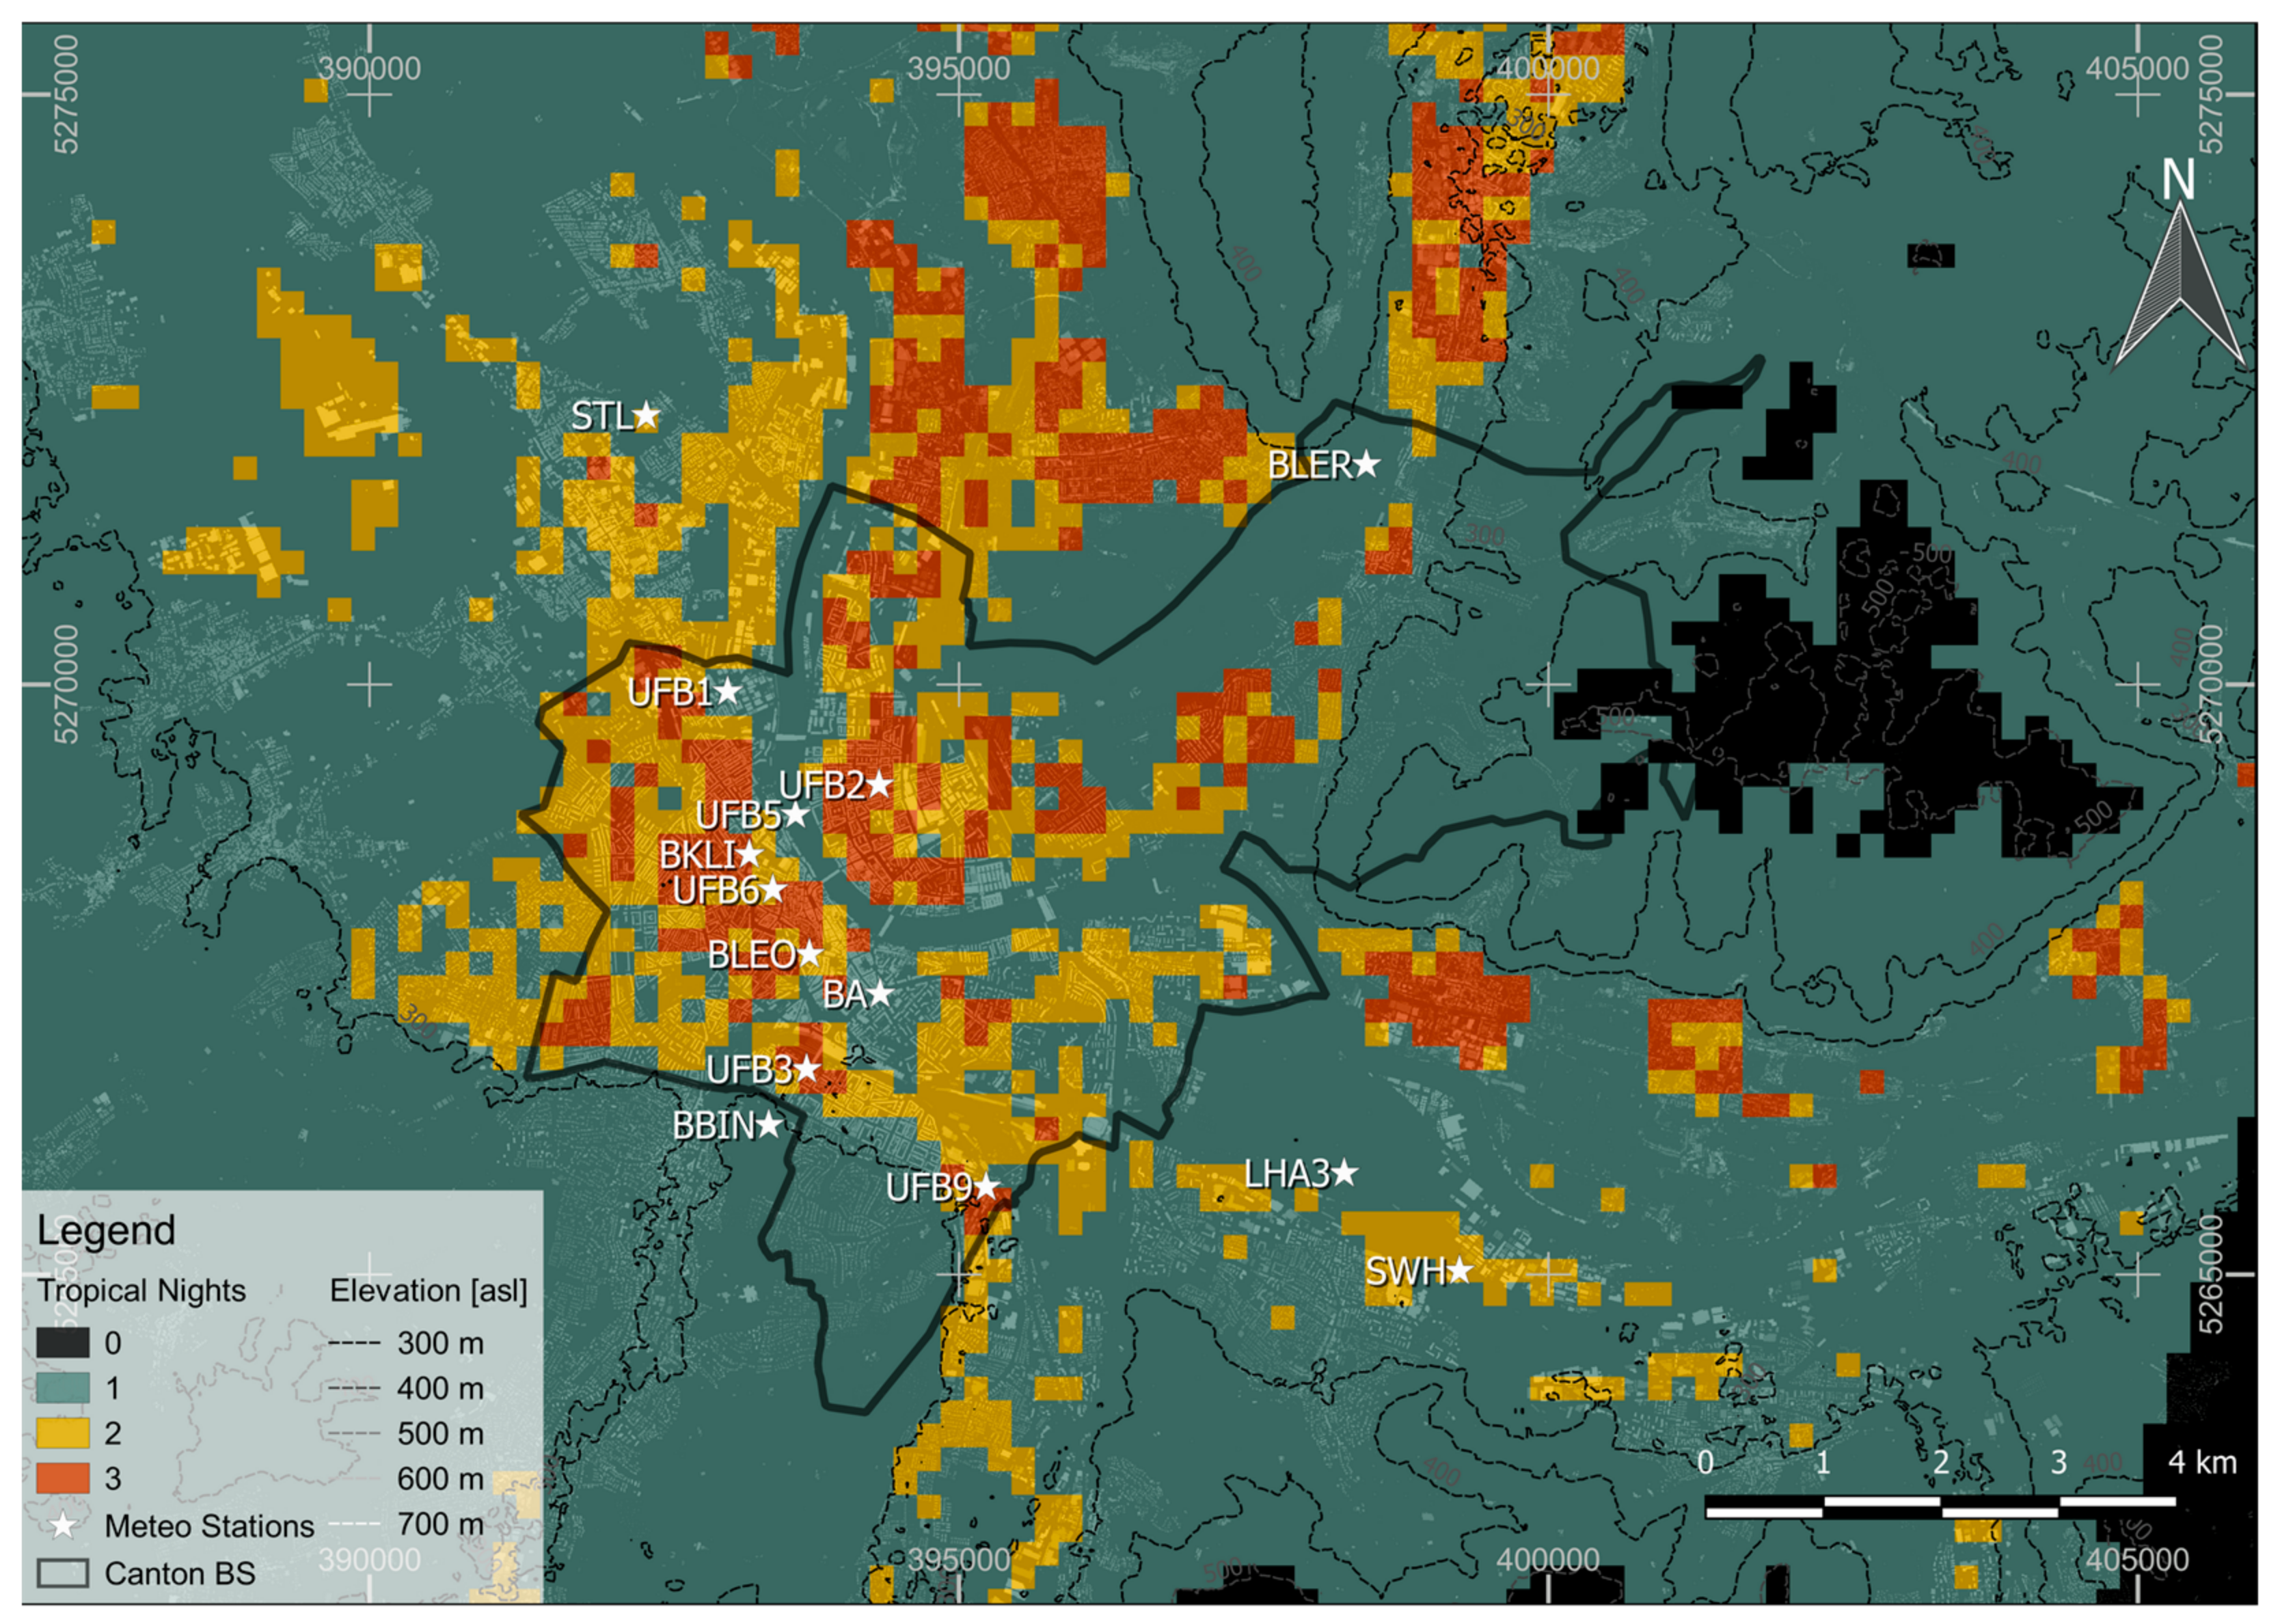
The model is evaluated using average temperatures of six consecutive days to exclude singularity effects and compare different setups for testing. The model is also tested as a heat stress predictor with individual hourly means during the evaluation period. During the night with the strongest heat island intensity (25 to 26 August 2016), the correlation coefficients reach values of 0.97 with very high significance. This proves that the model is also applicable on single day events with hourly temperature measurements as the response. As a measure for difference in heat stress, maps with the number of tropical nights during the specific heat wave are developed. Despite the higher elevated areas, in almost every grid cell at least one tropical night happened. In some areas, the number of tropical nights reached three during this period. The official measurement station (i.e., BBIN) is located in an area where only one tropical night was measured and this might lead to underestimation of heat stress in other areas (Figure 8).

5. Conclusions

The evaluation of multiple predictors influencing the development of the urban heat island (UHI) is shown and described in detail. Based on an empirical approach using in situ measurements, different groups of input predictors are tested within different grid resolutions to find the best parameters, resolution and time for a multiple linear regression model (MLR) to predict the UHI distribution and intensity.
Average correlation coefficients are ranging from 0.71 to 0.82 for the nocturnal model run and for the model resolution with a 200 m grid size, which emerged as the optimum spatial model resolution. The highest correlation coefficients are found at 22:00 CET, indicating that the nocturnal UHI phenomenon is most pronounced during that time under typical heat wave conditions, with 0.93 for the best model run during the entire measurement period (average diurnal course) and 0.97 for single nights. All model runs show high significance if applied on the 200 m resolution during the entire night.
Other studies based on multiple regression often predict monthly mean or climatological data with less fluctuations, larger measurement differences and less outliers, which provides higher correlations, but also larger error bias. In this study, the aim of the evaluation is a model applicable on near real-time air temperatures with a resolution representing different urban structures. The resulting two-dimensional maps are an innovation considering temporal and spatial resolution and they are useful for medical staff or, if used for statistical analysis of heat waves, as guidelines for urban planners and politics. Based on the above presented results, the implementation of a spatially coherent UHI surveillance can be further investigated.
An important finding of the study is that different datasets can be used with comparable results, which means the model is not tied to specific data and the user can decide which model setup provides the best results for his location. In our case, the use of land cover fraction including the distribution of sealed and built-up surfaces plus the LST offered best results.
The recently intensified discussion about the classification of different thermal zones throughout a city, i.e., the local climate zone scheme [44], improves the scientific knowledge about the UHI distribution and supported the discussion beyond urban to rural differences. The findings within this study are adding important insights to this discussion and they offer a quantification of theoretical considerations. Since an increasing number of people are living in the urban area compared to its rural counterpart, it is crucial to account for inner-urban differentiations.
Future improvement will be the testing of the method with less air temperature input data and the application in other cities.
Based on this study, tests and evaluations during the next summer are planned to further improve the model and make it a valuable tool for urban planners, the local administration and medical care.

Author Contributions

A.W. conceived and designed the experiments, conducted the analysis and is responsible for writing; E.P. helped developing the idea, supervised the analyses and the writing process and he is responsible for parts of the text; C.F. is responsible for parts of the measurement network, helped developing ideas and is responsible for the review of the text.

Funding

The project leading to this application has received funding from the European Union’s Horizon 2020 research and innovation program under grant agreement No. 637519 (URBANFLUXES).

Acknowledgments

Many thanks go to Dieter Scherer for the initial idea and Fred Meier for a lot of discussion at the beginning of the project, and Stavros Stagakis providing ideas to improve the study. The whole process always includes many persons responsible for the database, maintenance and fruitful talks during lunch breaks. Therefore, I would like to thank all members of the MCR research group at the University Basel.

Conflicts of Interest

The authors declare no conflict of interest.

Appendix A

Figure A1. Correlation matrix and VIF analysis for the group Morphology at a resolution of 200 m.
Climate 06 00055 g0a1
Figure A2. Correlation matrix and VIF analysis for the group Landsat Data at a resolution of 200 m.
Climate 06 00055 g0a2
Figure A3. Correlation matrix and VIF analysis for the group Land Cover at a resolution of 200 m.
Climate 06 00055 g0a3

References

  1. WHO. Global Health Observatory Data Repository. Available online: http://apps.who.int/gho/data/node.main.nURBPOP?lang=en (accessed on 13 December 2016).
  2. López-Moreno, E.; Oyeyinka, O.; Mboup, G. State of the World’s Cities 2010/2011. Bridging the Urban Divide; Earthscan: London, UK, 2008; p. 220. ISBN 978-1-84971-176-0. [Google Scholar]
  3. Oke, T.R.; Fuggle, R.F. Comparison of urban/rural counter and net radiation at night. Bound.-Layer Meteorol. 1972, 2, 290–308. [Google Scholar] [CrossRef]
  4. Oke, T.R. The distinction between canopy and boundary-layer urban heat islands. Atmosphere 1976, 14, 268–277. [Google Scholar] [CrossRef]
  5. Oke, T.R. Canyon geometry and the nocturnal urban heat island: Comparison of scale model and field observations. J. Climatol. 1981, 1, 237–254. [Google Scholar] [CrossRef]
  6. Oke, T.R. Street design and urban canopy layer climate. Energy Build. 1988, 11, 103–113. [Google Scholar] [CrossRef]
  7. Oke, T.R.; Johnson, G.T.; Steyn, D.G.; Watson, I.D. Simulation of surface urban heat islands under ‘ideal’ conditions at night Part 2: Diagnosis of causation. Bound.-Layer Meteorol. 1991, 56, 339–358. [Google Scholar] [CrossRef]
  8. Roth, M.; Oke, T.R.; Emery, W.J. Satellite-derived urban heat islands from three coastal cities and the utilization of such data in urban climatology. Int. J. Remote Sens. 1989, 10, 1699–1720. [Google Scholar] [CrossRef]
  9. Karl, T.R.; Diaz, H.F.; Kukla, G. Urbanization: Its detection and effect in the united states climate record. J. Clim. 1988, 1, 1099–1123. [Google Scholar] [CrossRef]
  10. Arnfield, A.J. Two decades of urban climate research: A review of turbulence, exchanges of energy and water and the urban heat island. Int. J. Climatol. 2003, 23, 1–26. [Google Scholar] [CrossRef]
  11. Ren, C.; Ng, E.; Katzschner, L. Urban climatic map studies: A review. Int. J. Climatol. 2011, 31, 2213–2233. [Google Scholar] [CrossRef]
  12. Parlow, E.; Vogt, R.; Feigenwinter, C. The urban heat island of Basel—Seen from different perspectives. DIE ERDE J. Geogr. Soc. Berl. 2014, 145, 96–110. [Google Scholar] [CrossRef]
  13. Mayer, H.; Holst, J.; Dostal, P.; Imbery, F.; Schindler, D. Human thermal comfort in summer within an urban street canyon in Central Europe. Meteorol. Z. 2008, 17, 241–250. [Google Scholar] [CrossRef]
  14. Clarke, J.F.; Bach, W. Comparison of the comfort conditions in different urban and suburban microenvironments. Int. J. Biometeorol. 1971, 15, 41–54. [Google Scholar] [CrossRef] [PubMed]
  15. Scherer, D.; Fehrenbach, U.; Lakes, T.; Lauf, S.; Meier, F.; Schuster, C. Quantification of heat-stress related mortality hazard, vulnerability and risk in Berlin, Germany. DIE ERDE J. Geogr. Soc. Berl. 2014, 144, 238–259. [Google Scholar] [CrossRef]
  16. Ragettli, M.S.; Vicedo-Cabrera, A.M.; Schindler, C.; Roosli, M. Exploring the association between heat and mortality in Switzerland between 1995 and 2013. Environ. Res. 2017, 158, 703–709. [Google Scholar] [CrossRef] [PubMed]
  17. Schär, C.; Jendritzky, G. Climate change: Hot news from summer 2003. Nature 2004, 432, 559–560. [Google Scholar] [CrossRef] [PubMed]
  18. Robine, J.-M.; Cheung, S.L.; Roy, S.L.; Oyen, H.V.; Griffiths, C.; Michel, J.-P.; Herrmann, F.R. Death toll exceeded 70,000 in Europe during the summer of 2003. C. R. Biol. 2008, 331, 171–178. [Google Scholar] [CrossRef] [PubMed]
  19. Vicedo-Cabrera, A.M.; Ragettli, M.S.; Schindler, C.; Roosli, M. Excess mortality during the warm summer of 2015 in Switzerland. Swiss Med. Wkly 2016, 146, 12. [Google Scholar] [CrossRef] [PubMed]
  20. Stocker, T.F.; Qin, D.; Plattner, G.-K.; Tignor, M.; Allen, S.K.; Boschung, J.; Nauels, A.; Xia, Y.; Bex, V.; Midgley, P.M. Climate Change 2013: The Physical Science Basis. Contribution of Working Group I to the Fifth Assessment Report of the Intergovernmental Panel on Climate Change; Cambridge University Press: Cambridge, UK; New York, NY, USA, 2013; p. 1535. [Google Scholar]
  21. Gerstengarbe, F.-W.; Werner, P.C. Katalog der Großwetterlagen Europas nach Paul Hess und Helmuth Brezowsky (1881–2004); Potsdam Institude for Climate Impact Research (PIK): Potsdam, Germany, 2005. [Google Scholar]
  22. Karl, T.R.; Trenberth, K.E. Modern global climate change. Science 2003, 302, 1719–1723. [Google Scholar] [CrossRef] [PubMed]
  23. Meehl, G.A.; Tebaldi, C. More intense, more frequent and longer lasting heat waves in the 21st century. Science 2004, 305, 994–997. [Google Scholar] [CrossRef] [PubMed]
  24. Oke, T.R. The urban energy balance. Prog. Phys. Geogr. 1988, 12, 471–508. [Google Scholar] [CrossRef]
  25. Grimmond, C.S.B.; Best, M.; Barlow, J.; Arnfield, A.J.; Baik, J.-J.; Baklanov, A.; Belcher, S.; Bruse, M.; Calmet, I.; Chen, F.; et al. Urban surface energy balance models: Model characteristics and methodology for a comparison study. In Meteorological and Air Quality Models for Urban Areas; Baklanov, A., Grimmond, C.S.B., Mahura, A., Athanassiadou, M., Eds.; Springer: Berlin, Germany, 2009; pp. 97–124. [Google Scholar]
  26. Christen, A.; Vogt, R. Energy and radiation balance of a central European city. Int. J. Climatol. 2004, 24, 1395–1421. [Google Scholar] [CrossRef] [Green Version]
  27. Nunez, M.; Oke, T.R. The energy balance of an urban canyon. J. Appl. Meteorol. 1977, 16, 11–19. [Google Scholar] [CrossRef]
  28. Parlow, E. Correction of terrain controlled illumination effects in satellite data. In Progress in Environmental Remote Sensing Research and Applications; Parlow, E., Ed.; Balkema: Rotterdam, The Netherlands, 1996; pp. 139–145. [Google Scholar]
  29. Jiménez-Muñoz, J.C.; Sobrino, J.A. Error sources on the land surface temperature retrieved from thermal infrared single channel remote sensing data. Int. J. Remote Sens. 2006, 27, 999–1014. [Google Scholar] [CrossRef]
  30. Li, Z.-L.; Tang, B.-H.; Wu, H.; Ren, H.; Yan, G.; Wan, Z.; Trigo, I.F.; Sobrino, J.A. Satellite-derived land surface temperature: Current status and perspectives. Remote Sens. Environ. 2013, 131, 14–37. [Google Scholar] [CrossRef] [Green Version]
  31. Liang, S. Narrowband to broadband conversions of land surface albedo I. Remote Sens. Environ. 2001, 76, 213–238. [Google Scholar] [CrossRef]
  32. Chrysoulakis, N. Estimation of the all-wave urban surface radiation balance by use of ASTER multispectral imagery and in situ spatial data. J. Geophys. Res. 2003, 108. [Google Scholar] [CrossRef] [Green Version]
  33. Chrysoulakis, N.; Marconcini, M.; Gastellu-Etchegorry, J.-P.; Grimmong, C.S.B.; Feigenwinter, C.; Lindberg, F.; Del Frate, F.; Klostermann, J.; Mi, Z.; Esch, T.; et al. Anthropogenic heat flux estimation from space. In Proceedings of the 2017 Joint Urban Remote Sensing Event (JURSE), Dubai, UAE, 6–8 March 2017; pp. 1–4. [Google Scholar] [CrossRef]
  34. Grimmond, C.S.B.; Oke, T.R. Heat storage in urban areas: Local-scale observations and evaluation of a simple model. J. Appl. Meteorol. 1999, 38, 922–940. [Google Scholar] [CrossRef]
  35. Christen, A.; Vogt, R.; Rotach, M.; Parlow, E. First results from BUBBLE II: Partioning of turbulent heat fluxes over urban surfaces. In Proceedings of the Fourth Symposium on the Urban Environment, Norfolk, VA, USA, 19 May 2002; American Meteorological Society: Norfolk, VA, USA, 2002; pp. 137–138. [Google Scholar]
  36. Parlow, E. Net radiation in the REKLIP-area—A spatial approach using satellite data. In Progress in Environmental Remote Sensing Research and Applications; Parlow, E., Ed.; Balkema: Rotterdam, The Netherlands, 1996. [Google Scholar]
  37. Kottek, M.; Grieser, J.; Beck, C.; Rudolf, B.; Rubel, F. World map of the Köppen-Geiger climate classification updated. Meteorol. Z. 2006, 15, 259–263. [Google Scholar] [CrossRef]
  38. MeteoSwiss. Climate Normals Basel/Binningen. Reference Period 1981–2010; Federal Office of Meteorology and Climatology MeteoSwiss: Zurich, Switzerland, 2016. [Google Scholar]
  39. Scherer, D.; Fehrenbach, U.; Beha, H.D.; Parlow, E. Improved concepts and methods in analysis and evaluation of the urban climate for optimizing urban planning processes. Atmos. Environ. 1999, 33, 4185–4193. [Google Scholar] [CrossRef]
  40. Rotach, M.W.; Vogt, R.; Bernhofer, C.; Batchvarova, E.; Christen, A.; Clappier, A.; Feddersen, B.; Gryning, S.E.; Martucci, G.; Mayer, H.; et al. BUBBLE—An urban boundary layer meteorology project. Theor. Appl. Climatol. 2005, 81, 231–261. [Google Scholar] [CrossRef]
  41. Chrysoulakis, N.; Feigenwinter, C.; Triantakonstantis, D.; Penyevskiy, I.; Tal, A.; Parlow, E.; Fleishman, G.; Düzgün, S.; Esch, T.; Marconcini, M. A conceptual list of indicators for urban planning and management based on Earth observation. ISPRS Int. J. Geo-Inf. 2014, 3, 980–1002. [Google Scholar] [CrossRef] [Green Version]
  42. Basel-Stadt. Basel-Stadt in Zahlen 2015; Statistisches Amt des Kantons Basel-Stadt: Basel, Switzerland, 2015. [Google Scholar]
  43. Oke, T.R.; Cleugh, H.A.; Grimmond, S.; Schmid, H.P.; Roth, M. Evaluation of spatially-averaged fluxes of heat, mass and momentum in the urban boundary layer. Weather Clim. 1989, 9, 14–21. [Google Scholar]
  44. Stewart, I.; Oke, T. Local climate zones for urban temperature studies. Bull. Am. Meteorol. Soc. 2012, 93, 1879–1900. [Google Scholar] [CrossRef]
  45. Wicki, A.; Parlow, E. Attribution of local climate zones using a multitemporal land use/land cover classification scheme. J. Appl. Remote Sens. 2017, 11, 026001. [Google Scholar] [CrossRef] [Green Version]
  46. Barsi, J.; Barker, J.; Schott, J. An atmospheric correction parameter calculator for a single thermal band earth-sensing instrument. In Proceedings of the Geoscience and Remote Sensing Symposium, Toulouse, France, 21–25 July 2003; IEEE: Toulouse, France, 2003; Volume 5, pp. 3014–3016. [Google Scholar]
  47. Sobrino, J.A.; Jiménez-Muñoz, J.C.; Sòria, G.; Romaguera, M.; Guanter, L.; Moreno, J.; Plaza, A.; Martìnez, P. Land surface emissivity retrieval from different VNIR and TIR sensors. IEEE Trans. Geosci. Remote Sens. 2008, 46, 316–327. [Google Scholar] [CrossRef]
  48. Wicki, A.; Parlow, E. Multiple regression analysis for unmixing of surface temperature data in an urban environment. Remote Sens. 2017, 9, 684. [Google Scholar] [CrossRef]
  49. Wang, C.; Myint, S.; Wang, Z.; Song, J. Spatio-Temporal Modeling of the Urban Heat Island in the Phoenix Metropolitan Area: Land Use Change Implications. Remote Sens. 2016, 8, 185. [Google Scholar] [CrossRef]
  50. Bastiaanssen, W.G.M.; Pelgrum, H.; Wang, J.; Ma, Y.; Moreno, J.F.; Roerink, G.J.; van der Wal, T. A remote sensing surface energy balance algorithm for land (SEBAL). J. Hydrol. 1998, 212, 213–229. [Google Scholar] [CrossRef]
  51. Lindberg, F.; Grimmond, C.S.B.; Gabey, A.; Huang, B.; Kent, C.W.; Sun, T.; Theeuwes, N.E.; Järvi, L.; Ward, H.C.; Capel-Timms, I.; et al. Urban Multi-scale Environmental Predictor (UMEP): An integrated tool for city-based climate services. Environ. Model. Softw. 2018, 99, 70–87. [Google Scholar] [CrossRef]
  52. Raupach, M.R. Simplified expressions for vegetation roughness length and zero-plane displacement as functions of canopy height and area index. Bound.-Layer Meteorol. 1994, 71, 211–216. [Google Scholar] [CrossRef]
  53. Grimmond, C.S.B.; Oke, T.R. Aerodynamic properties of urban areas derived from analysis of surface form. J. Appl. Meteorol. 1999, 38, 1262–1292. [Google Scholar] [CrossRef]
  54. Kanda, M.; Inagaki, A.; Miyamoto, T.; Gryschka, M.; Raasch, S. A New Aerodynamic Parametrization for Real Urban Surfaces. Bound.-Layer Meteorol. 2013, 148, 357–377. [Google Scholar] [CrossRef]
  55. Basel-Stadt. Geoportal Kanton Basel-Stadt; Grundbuch- und Vermessungsamt des Kantons Basel-Stadt: Basel, Switzerland, 2016. [Google Scholar]
  56. Marconcini, M.; Heldens, W.; Del Frate, F.; Latini, D.; Mitraka, Z.; Lindberg, F. EO-based products in support of urban heat fluxes estimation. In Proceedings of the Joint Urban Remote Sensing Event (JURSE), Dubai, UAE, 6–8 March 2017; IEEE: Dubai, UAE, 2017; pp. 1–4. [Google Scholar]
  57. Caselles, V.; Lopez Garcia, M.J.; Melia, J.; Perez Cueva, A.J. Analysis of the heat-island effect of the city of Valencia, Spain, through air temperature transects and NOAA satellite data. Theor. Appl. Climatol. 1991, 43, 195–203. [Google Scholar] [CrossRef]
  58. Ben-Dor, E.; Saaroni, H. Airborne video thermal radiometry as a tool for monitoring microscale structures of the urban heat island. Int. J. Remote Sens. 1997, 18, 3039–3053. [Google Scholar] [CrossRef]
  59. Nichol, J.E.; Fung, W.Y.; Lam, K.-S.; Wong, M.S. Urban heat island diagnosis using ASTER satellite images and ‘in situ’ air temperature. Atmos. Res. 2009, 94, 276–284. [Google Scholar] [CrossRef]
  60. Seidel, J.; Ketzler, G.; Bechtel, B.; Thies, B.; Philipp, A.; Böhner, J.; Egli, S.; Eisele, M.; Herma, F.; Langkamp, T.; et al. Mobile measurement techniques for local and micro-scale studies in urban and topo-climatology. DIE ERDE J. Geogr. Soc. Berl. 2016, 147, 15–39. [Google Scholar] [CrossRef]
  61. Maras, I.; Buttstädt, M.; Hahmann, J.; Hofmeister, H.; Schneider, C. Investigating public places and impacts of heat stress in the city of Aachen, Germany. DIE ERDE J. Geogr. Soc. Berl. 2013, 144, 290–303. [Google Scholar] [CrossRef]
  62. Gallo, K.P.; Tarpley, J.D.; McNab, A.L.; Karl, T.R. Assessment of urban heat islands: A satellite perspective. Atmos. Res. 1995, 37, 37–43. [Google Scholar] [CrossRef]
  63. Gallo, K.P.; McNab, A.L.; Karl, T.R.; Brown, J.F.; Hood, J.J.; Tarpley, J.D. The use of a vegetation index for assessment of the urban heat island effect. Int. J. Remote Sens. 1993, 14, 2223–2230. [Google Scholar] [CrossRef]
  64. Gallo, K.P.; Owen, T.W. Satellite-based adjustments for the urban heat island temperature bias. J. Appl. Meteorol. 1999, 38, 806–813. [Google Scholar] [CrossRef]
  65. Epperson, D.L.; Davis, J.M.; Bloomfield, P.; Karl, T.R.; McNab, A.L.; Gallo, K.P. Estimating the urban bias of surface shelter temperatures using upper-air and satellite data. Part II: Estimation of the urban bias. J. Appl. Meteorol. 1995, 34, 340–357. [Google Scholar] [CrossRef]
  66. Dousset, B. AVHRR-derived cloudiness and surface temperature patterns over the Los Angeles area and their relationships to land use. In Proceedings of the 12th Canadian Symposium on Remote Sensing Geoscience and Remote Sensing Symposium, Vancouver, BC, Canada, 10–14 July 1989; Volume 4, pp. 2132–2137. [Google Scholar] [CrossRef]
  67. Stoll, M.J.; Brazel, A.J. Surface-air temperature relationships in the urban environment of Phoenix, Arizona. Phys. Geogr. 1992, 13, 160–179. [Google Scholar] [CrossRef]
  68. Vancutsem, C.; Ceccato, P.; Dinku, T.; Connor, S.J. Evaluation of MODIS land surface temperature data to estimate air temperature in different ecosystems over Africa. Remote Sens. Environ. 2010, 114, 449–465. [Google Scholar] [CrossRef]
  69. Nichol, J. Remote sensing of urban heat islands by day and night. Photogramm. Eng. Remote Sens. 2005, 71, 613–621. [Google Scholar] [CrossRef]
  70. Fu, G.; Shen, Z.; Zhang, X.; Shi, P.; Zhang, Y.; Wu, J. Estimating air temperature of an alpine meadow on the Northern Tibetan Plateau using MODIS land surface temperature. Acta Ecol. Sin. 2011, 31, 8–13. [Google Scholar] [CrossRef]
  71. Voogt, J.A.; Oke, T.R. Thermal remote sensing of urban climates. Remote Sens. Environ. 2003, 86, 370–384. [Google Scholar] [CrossRef]
  72. Ma, W.; Zhou, L.; Zhang, H.; Zhang, Y.; Dai, X. Air temperature field distribution estimations over a Chinese mega-city using MODIS land surface temperature data: The case of Shanghai. Front. Earth Sci. 2015, 10, 38–48. [Google Scholar] [CrossRef]
  73. Mao, K.B.; Tang, H.J.; Wang, X.F.; Zhou, Q.B.; Wang, D.L. Near-surface air temperature estimation from ASTER data based on neural network algorithm. Int. J. Remote Sens. 2008, 29, 6021–6028. [Google Scholar] [CrossRef]
  74. Myint, S.W.; Wentz, E.A.; Brazel, A.J.; Quattrochi, D.A. The impact of distinct anthropogenic and vegetation features on urban warming. Landsc. Ecol. 2013, 28, 959–978. [Google Scholar] [CrossRef] [Green Version]
  75. Cresswell, M.P.; Morse, A.P.; Thomson, M.C.; Connor, S.J. Estimating surface air temperatures, from Meteosat land surface temperatures, using an empirical solar zenith angle model. Int. J. Remote Sens. 1999, 20, 1125–1132. [Google Scholar] [CrossRef]
  76. Cristóbal, J.; Ninyerola, M.; Pons, X. Modeling air temperature through a combination of remote sensing and GIS data. J. Geophys. Res. 2008, 113. [Google Scholar] [CrossRef] [Green Version]
  77. Bechtel, B.; Zakšek, K.; Oßenbrügge, J.; Kaveckis, G.; Böhner, J. Towards a satellite based monitoring of urban air temperatures. Sustain. Cities Soc. 2017, 34, 22–31. [Google Scholar] [CrossRef]
  78. Vogt, J.V.; Viau, A.A.; Paquet, F. Mapping regional air temperature fields using satellite-derived surface skin temperatures. Int. J. Climatol. 1997, 17, 1559–1579. [Google Scholar] [CrossRef] [Green Version]
  79. Ninyerola, M.; Pons, X.; Roure, J.M. A methodological approach of climatological modelling of air temperature and precipitation through gis techniques. Int. J. Climatol. 2000, 20, 1823–1841. [Google Scholar] [CrossRef]
  80. Wang, C.; Middel, A.; Myint, S.W.; Kaplan, S.; Brazel, A.J.; Lukasczyk, J. Assessing local climate zones in arid cities: The case of Phoenix, Arizona and Las Vegas, Nevada. ISPRS J. Photogramm. Remote Sens. 2018, 141, 59–71. [Google Scholar] [CrossRef]
  81. O’brien, R.M. A caution regarding rules of thumb for Variance Inflation Factors. Qual. Quant. 2007, 41, 673–690. [Google Scholar] [CrossRef]
  82. Craney, T.A.; Surles, J.G. Model-dependent Variance Inflation Factor cutoff values. Qual. Eng. 2002, 14, 391–403. [Google Scholar] [CrossRef]
  83. Spronken-Smith, R.A.; Oke, T.R. The thermal regime of urban parks in two cities with different summer climates. Int. J. Remote Sens. 1998, 19, 2085–2104. [Google Scholar] [CrossRef]
  84. Kuttler, W. Climate change on the urban scale—Effects and counter-measures in Central Europe. In Human and Social Dimensions of Climate Change; InTech: Garching bei München, Germany, 2012. [Google Scholar] [CrossRef]
  85. Pichierri, M.; Bonafoni, S.; Biondi, R. Satellite air temperature estimation for monitoring the canopy layer heat island of Milan. Remote Sens. Environ. 2012, 127, 130–138. [Google Scholar] [CrossRef]
  86. Eliasson, I.; Upmanis, H. Nocturnal airflow from urban parks-implications for city ventilation. Theor. Appl. Climatol. 2000, 66, 95–107. [Google Scholar] [CrossRef]
  87. Blennow, K. Modelling minimum air temperature in partially and clear felled forests. Agric. For. Meteorol. 1998, 91, 223–235. [Google Scholar] [CrossRef]
  88. Yao, Y.; Zhang, B. MODIS-based estimation of air temperature of the Tibetan Plateau. J. Geogr. Sci. 2013, 23, 627–640. [Google Scholar] [CrossRef]
  89. Mostovoy, G.V.; Filippova, M.G.; Kakani, V.G.; Reddy, K.R.; King, R.L. Statistical estimation of daily maximum and minimum air temperatures from MODIS LST data over the State of Mississippi. GIScience Remote Sens. 2006, 43, 78–110. [Google Scholar] [CrossRef]
  90. Emamifar, S.; Rahimikhoob, A.; Noroozi, A.A. Daily mean air temperature estimation from MODIS land surface temperature products based on M5 model tree. Int. J. Climatol. 2013, 33, 3174–3181. [Google Scholar] [CrossRef] [Green Version]
  91. Benali, A.; Carvalho, A.C.; Nunes, J.P.; Carvalhais, N.; Santos, A. Estimating air surface temperature in Portugal using MODIS LST data. Remote Sens. Environ. 2012, 124, 108–121. [Google Scholar] [CrossRef]
  92. Bechtel, B.; Wiesner, S.; Zaksek, K. Estimation of dense time series of urban air temperatures from multitemporal geostationary satellite data. IEEE J. Sel. Top. Appl. Earth Obs. Remote Sens. 2014, 7, 4129–4137. [Google Scholar] [CrossRef]
  93. Feigenwinter, C.; Parlow, E.; Vogt, R.; Schmutz, M.; Chrysoulakis, N.; Lindberg, F.; Marconcini, M.; del Frate, F. Spatial distribution of sensible and latent heat flux in the URBANFLUXES case study city Basel (Switzerland). In Proceedings of the 2017 Joint Urban Remote Sensing Event (JURSE), Dubai, UAE, 6–8 March 2017; pp. 1–4. [Google Scholar] [CrossRef]
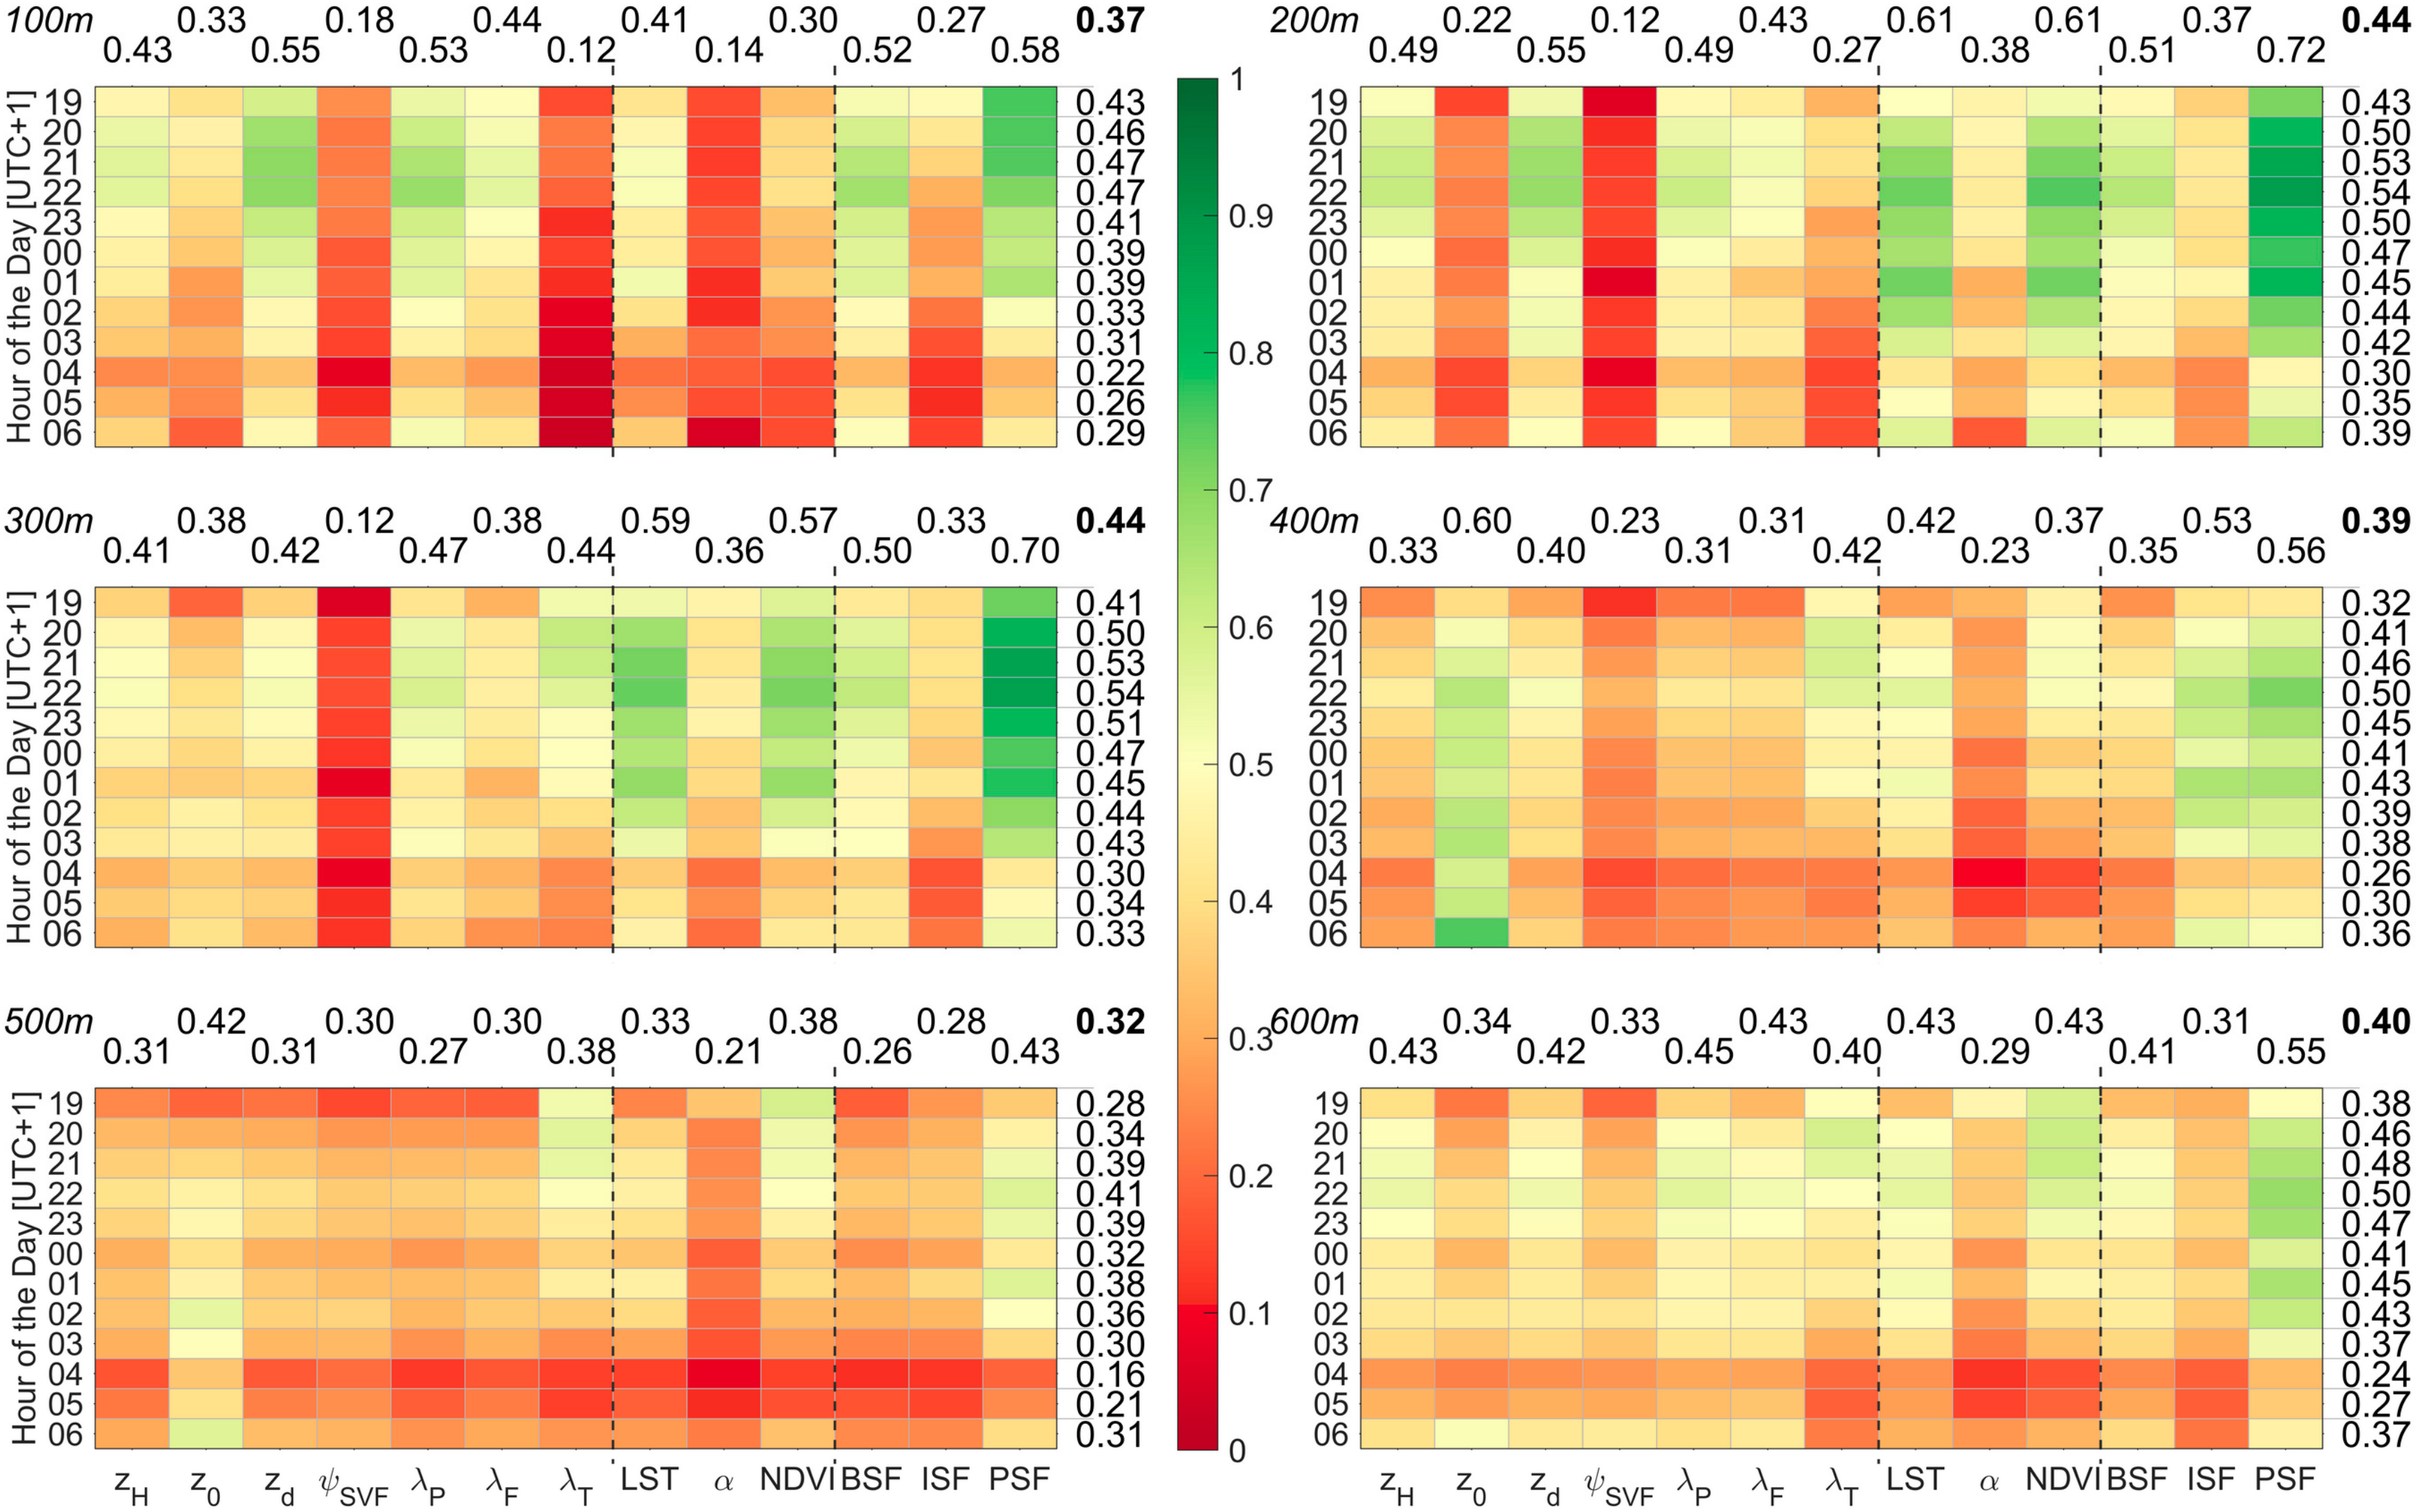
Figure 1. Land cover of the investigation area including classified measurement stations (left, grid reference UTM-32N) and the area of interest (AOI) as a grey rectangle on the topographic map (ASTER GDEM) of the tri-national region France, Germany and Switzerland (lower right), indicated as a grey rectangle in the upper right overview map. Station name and detailed classification can be found in Table 1.
Climate 06 00055 g001
Figure 2. Correlation coefficients of all linear regressions for the 100 to 600 m cell size runs as a suitability test. The columns represent the individual predictors and the rows represent the different time of the day, colored after the specific correlation coefficient (red = 0 to green = 1). The three different groups are separated by vertical dotted lines and the abbreviations are mentioned in the text.
Climate 06 00055 g002
Figure 3. Statistics for all multiple regression runs shown as bar plots with R2 in the upper plot, p-value in the middle and error variance in the lower plot. The colors are corresponding to different input datasets and the brightness of the specific colors decreases with decreasing resolution. In the center plot, the 0.05 and 0.01 significance level is indicated by red and black dotted lines, respectively.
Climate 06 00055 g003
Figure 4. Outputs for the Land Cover model representing the about-roof level temperature for the specific heat wave in August 2016 as an average with 200 m resolution. The coordinate system indicated in the lower left map is UTM-32N and the time is CET.
Climate 06 00055 g004
Figure 5. Zoom to the city center showing the difference between each grid point and the MeteoSwiss station Basel/Binningen (BBIN, lower left third of the map) based on the model output with 200 m grid size and the Land Cover predictors at 22:00 CET. The border of the Canton Basel-Stadt (BS) is shown as a dashed line and the buildings are plotted as a dimmed overlay. Large parks within BS are manually included as green polygons and the different neighborhoods are indicated as labelled dark grey polygons. The white stars are measurement stations used for the analysis. The river Rhine is shown as a transparent blue overlay and the coordinate system is UTM-32N.
Climate 06 00055 g005
Figure 6. Validation of the model output using five different random samples on a 200 m grid for three groups. For every step in time (x-axis), the RMSE resulting from the difference between predicted Ta to measured Ta is indicated for each group. The resulting average is shown as numbers referring to the specific groups according to the color (blue = Land Cover, grey = Landsat Data and red = Morphology) and the stations used for validation are listed at the right side of the plots. The black dotted line depicts the standard deviation of the measured Ta used for validation.
Climate 06 00055 g006
Figure 7. Time series of air temperature (upper plot) and wind (lower plot) measurements at urban (red and orange) and rural (green) reference stations for the entire investigation period. The light blue area in the upper plot represents the difference between the rural and the urban reference station. The x-axis label indicates the time in the following format: mm/dd/hh.
Climate 06 00055 g007
Figure 8. Number of tropical nights (Tmin > 20 °C) between the 23 and the 29 August 2016 based on the model prediction in a 200-m grid. A DOM behind the data layer depicts the city structure and contour lines describe the topography. The coordinate system is UTM-32N.
Climate 06 00055 g008
Table 1. List of all stations used for this study with the specific code as an abbreviation. The geographic location of the stations can be found in Figure 1. The local climate zones (LCZ) definition is based on previous work and expert knowledge after the guidance of Stewart and Oke (2012) [44,45].
StationCodeHeight [a.s.l.]Height [a.g.l.]SensorLCZ
Basel-BinningenBBIN3162ASPTCD9
FeldbergstrasseUFB225615Decagon VP32
A2 HardLHA32756ThyganAE
KlingelbergstrasseBKLI28628ASPTC2
Lange ErlenBLER27310HMP45CD
Johanniter-BrückeUFB525619(4) *WXT520GA
Meret-OppenheimUFB328020WXT520210
HirzbodenwegUFB727025WXT5206
NovartisUFB125675WXT520102
DreispitzUFB928418Decagon VP3102
PetersplatzUFB626824Decagon VP32A
AeschenplatzBA27040HMP45C2
LeonhardBLEO27341HMP45C23
SchweizerhalleSWH28025HMP45CE10
St. LouisSTL2474HMP45C6
* Located on a bridge with a height of about 15 m.
Table 2. Statistics for six different model resolutions derived from hourly model runs between 19:00 and 06:00 CET and three different input datasets. The R2 statistics and error variances are averaged. The significance-analysis shows the precentral number of runs fulfilling the 0.05/0.01-significance level during the modelling period of 12 h.
StatisticsMethod100 m200 m300 m400 m500 m600 m
Mean R2Land Cover0.640.820.750.720.560.58
Landsat Data0.600.710.660.540.570.66
Morphology0.750.790.760.700.600.57
0.05-level
significance fulfilled [%]
Land Cover5810083835058
Landsat Data7510075585083
Morphology8392921005850
0.01-level
significance fulfilled [%]
Land Cover3383676700
Landsat Data257575171750
Morphology6775676700
Mean Error
Variance [°C]
Land Cover0.200.110.140.210.310.28
Landsat Data0.260.170.200.300.290.23
Morphology0.140.130.160.210.280.29