Abstract
Grape, olive, and wheat are traditional Mediterranean Basin crops that have immense cultural, economic, and ecological importance, and are the basis for producing wine, olive oil, and pasta and bread products. Of fruit crops, grape has the largest area and the highest economic importance globally. These traditional Mediterranean crop systems and related food products have global relevance, and yet globally, all regions with Mediterranean climate are especially vulnerable to climate change that threatens this Mediterranean bio-cultural heritage. However, how to analyze the complex tripartite ecological, economic, and social effects of climate change on these systems has been vexing and largely unexplored. Here we review how a bioeconomic approach using physiologically-based demographic models in the context of geographic information systems may be an important step in examining the complexity of these factors on grape. We show that with relatively modest data and funding, regional bioeconomic analysis of grape production under present weather and climate change is possible, and that management-relevant complexity can be included in a mechanistic way.
1. Introduction
Grape (Vitis vinifera) is an important cultural, economic and ecological feature of the Mediterranean Basin but also a cosmopolitan crop with the largest acreage and the highest economic value among fruit crops globally [1]. With olive (Olea europaea) and wheat (Triticum durum and T. aestivum), grape forms the core of traditional Mediterranean crop systems that are the basis for producing olive oil, pasta, and wine [2,3,4]. Olive oil, pasta, and wine are unique in that they are both food commodities with a global market and are hallmarks of the Mediterranean diet; they are part of the UNESCO intangible cultural heritage of humanity [5,6,7]. These crops and related food products are of utmost ecological, economic, and cultural relevance to the Mediterranean region and globally [8]. Yet globally, all regions with Mediterranean climate are especially vulnerable to climate change [9], and the associated ecological, economic, and social effects threaten this Mediterranean bio-cultural heritage [10,11]. However, how to analyze the tripartite ecological, economic, and social effects of climate change has been vexing and largely unexplored [12]. Here we review how a bioeconomic approach using physiologically-based demographic models (PBDMs) in the context of a geographic information system (GIS) may be an important step in examining the complexity brought about by these tripartite factors, albeit with different levels of precision. A PBDM-based bioeconomic analysis of olive was completed [12] that demonstrated the importance of including the ecological complexity of trophic interactions between species in assessing biological and economic impacts of climate change over large geographic areas, and provides a template for assessing climate change impact in other agroecosystems such as grape [13]. This paper reviews the ecological and geographic complexity involved in assessing the bioeconomics of grape production under climate change with a focus on the European grapevine moth Lobesia botrana, the principal native pest of grape in the Palearctic region. The goal is to show that with relatively modest data and funding, regional bioeconomic analysis of grape production under climate change is possible that includes management-relevant complexity in a mechanistic way. Specifically, the present paper is conceived as a companion paper that complements Gutierrez et al. [13] as follows:
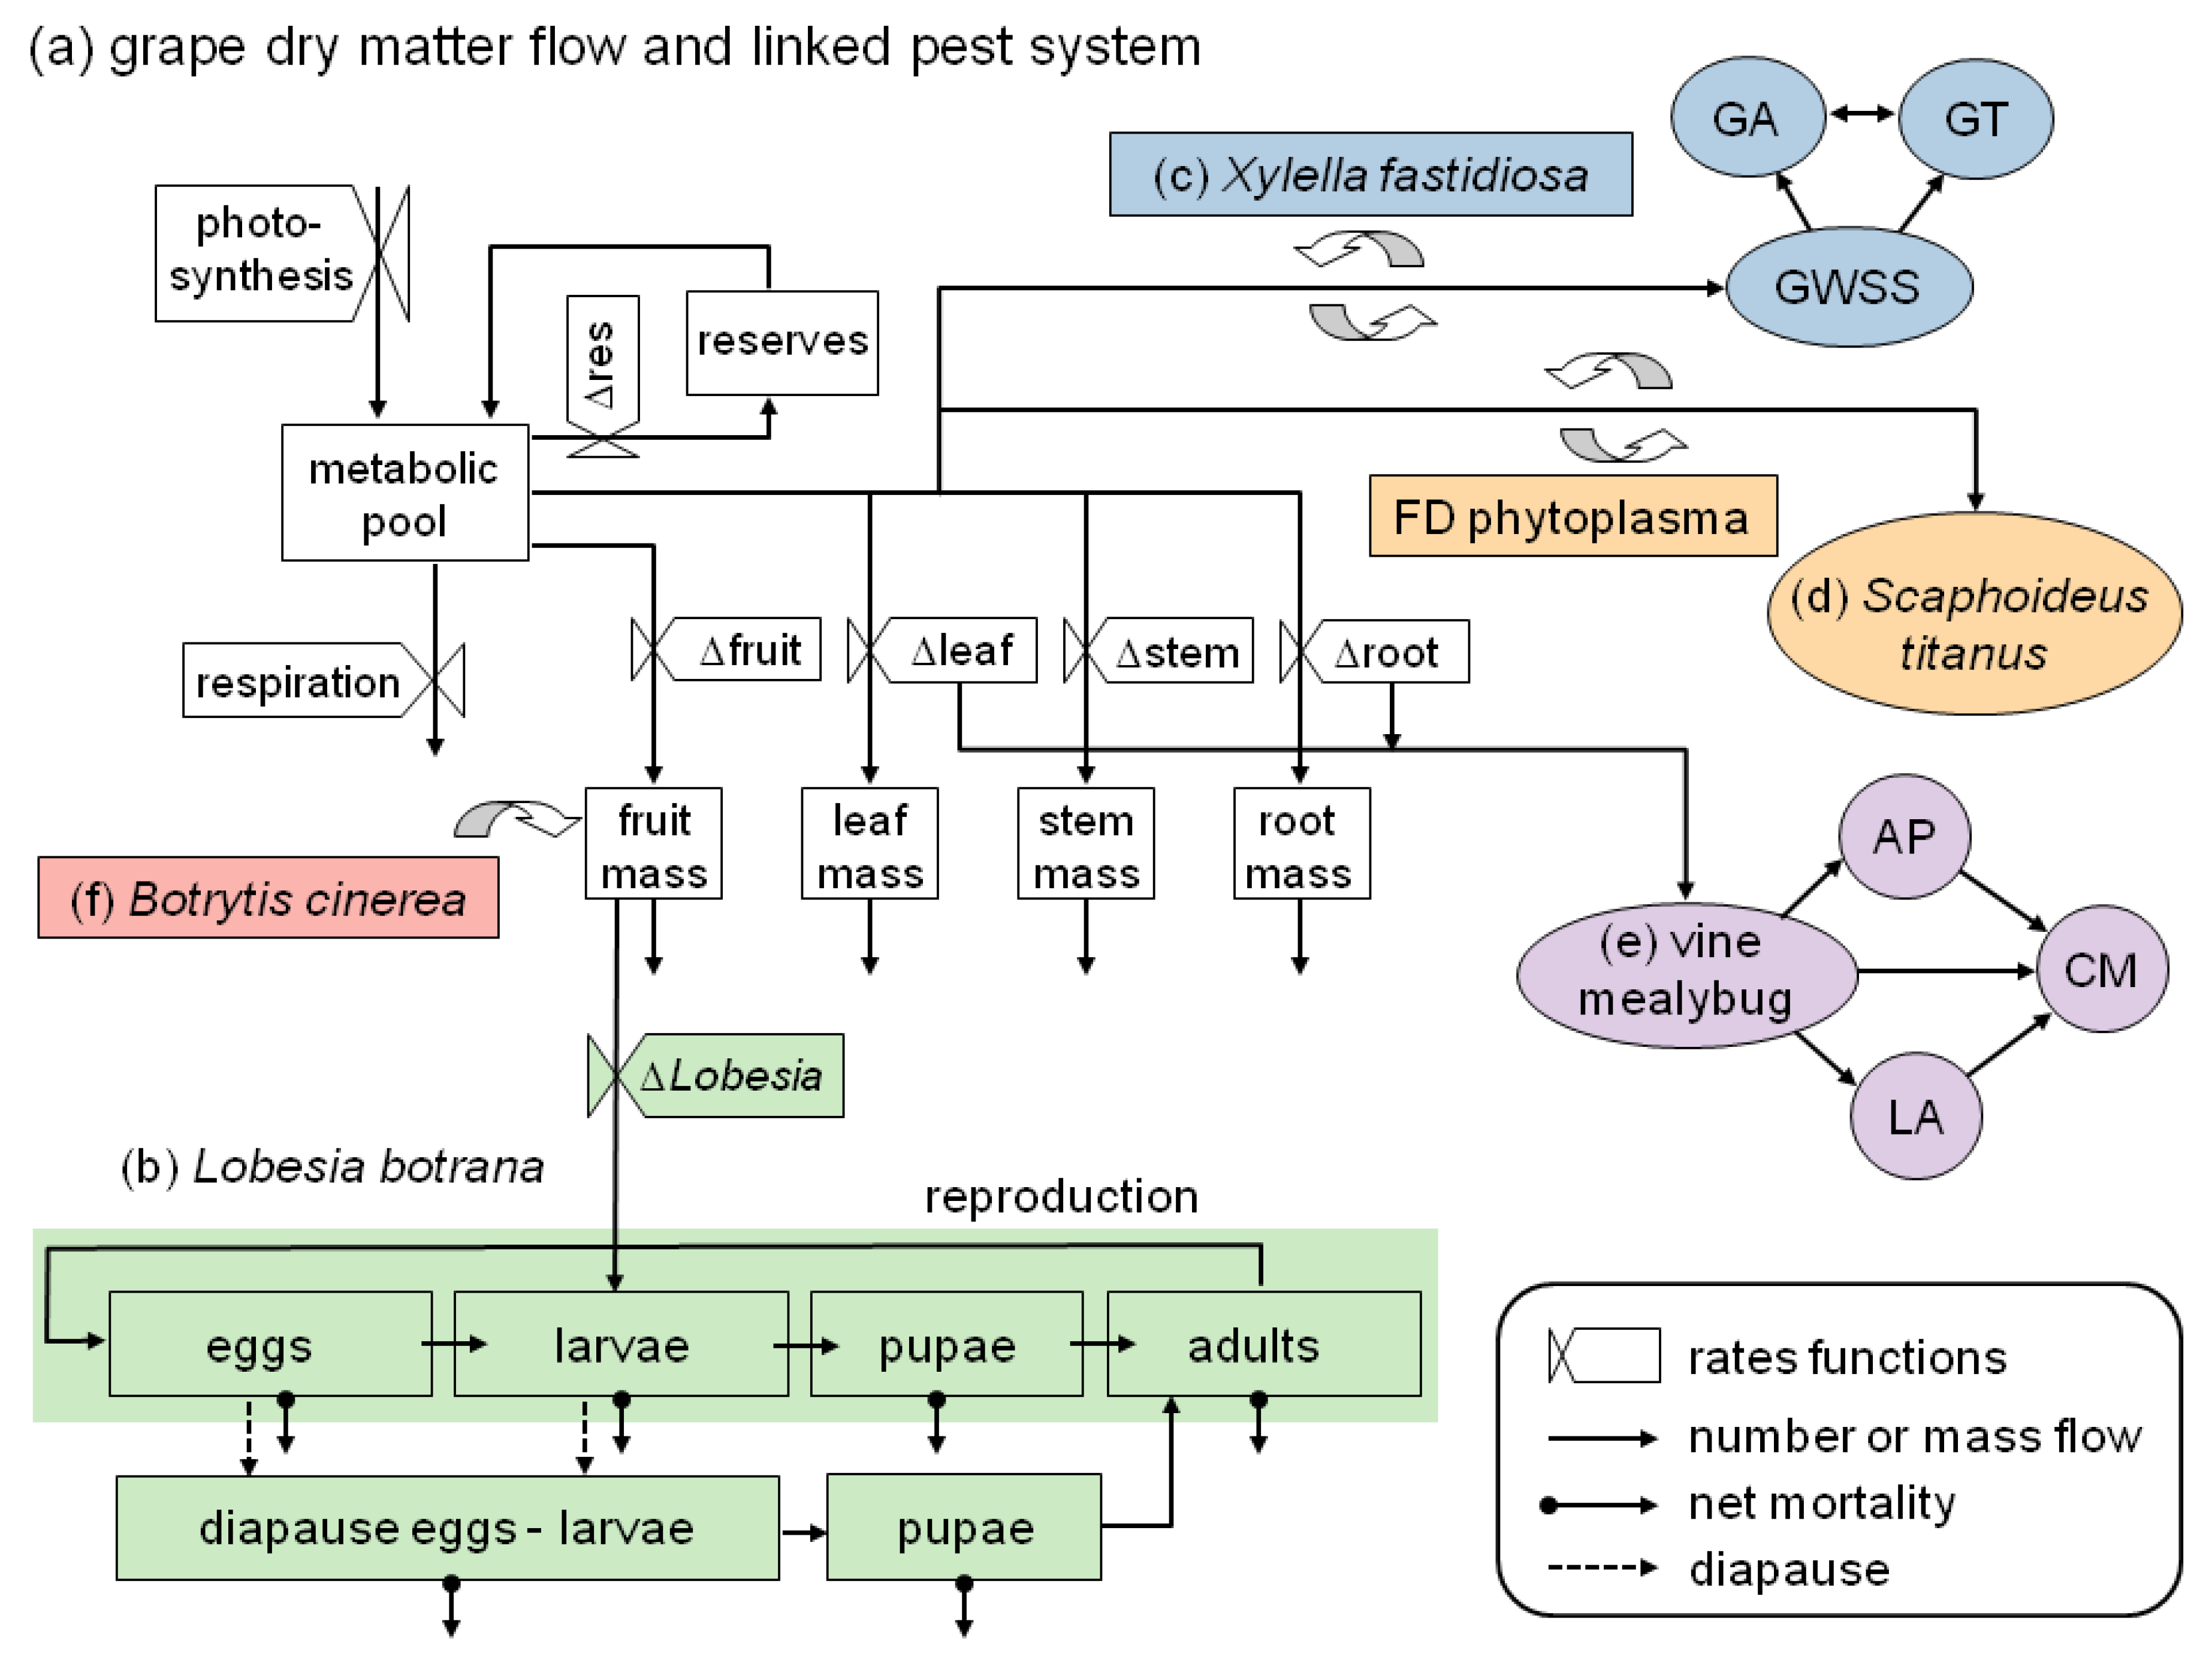
- It illustrates the ecological and geographic complexity involved in assessing the bioeconomics of grape production under climate change, including an expanded overview on ongoing and prospective work in PBDM analysis of the pest/vector/disease complex of grape (Figure 1);
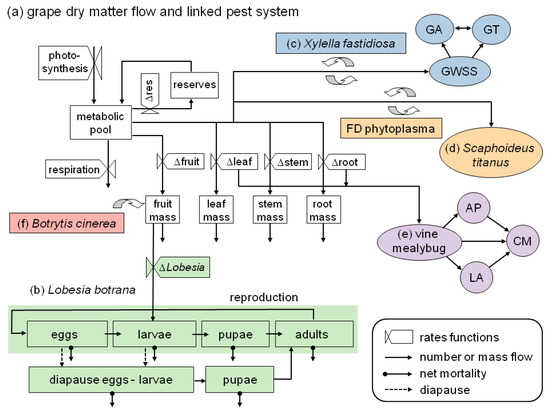 Figure 1. The grape system model including major pests, vectors, and diseases that have been modeled and included in the extant or developing system. (a) Dry matter flow in grapevine [38,39]; and (b) the linkage of European grapevine moth (Lobesia botrana) life-stages including diapause induction and termination [13,40]. Linkages of three vascular feeding Homoptera; (c) the glassy-winged sharpshooter (GWSS) with its natural enemies the parasitoids Gonatocerus ashmeadi (GA) and G. triguttatus (GT), and the transmission of the bacterium Xylella fastidiosa that causes Pierce’s disease [41]; (d) the leafhopper Scaphoideus titanus and the transmission of the phytoplasma that causes flavescence dorée disease (currently being modeled) [42]; and (e) the vine mealybug with its natural enemies the parasitoids Anagyrus pseudococci (AP) and Leptomastidea abnormis (LA), and a coccinellid predator, Cryptolaemus montrouzieri (CM) [43]; (f) Linkage of the fungus Botrytis cinerea that causes grey mold disease developed by González-Domínguez et al. [44]. (Figure modified from [13]).
 - It pinpoints key ecological differences that drive different levels of management and external input intensity in olive and grape, the two major perennial traditional cropping systems of Mediterranean agriculture (Section 2);
- It provides a broad overview on how PBDMs in a GIS context can be used to explore mechanistically otherwise mostly intractable complex problems such as crop-pests interactions that lie at the interface between global change and biological systems (i.e., global change biology) based on the paradigm of ecological analogies (Section 3);
- It reviews the GIS context for PBDMs by illustrating how GRASS GIS [14] can be linked to the free software environment for statistical computing and graphics R [15] to analyze (Figure 2 and Figure 3) and assess (Figure 4) the observed geographic distribution of grape (or any other crop) production in the Euro-Mediterranean region (or any other region including globally);
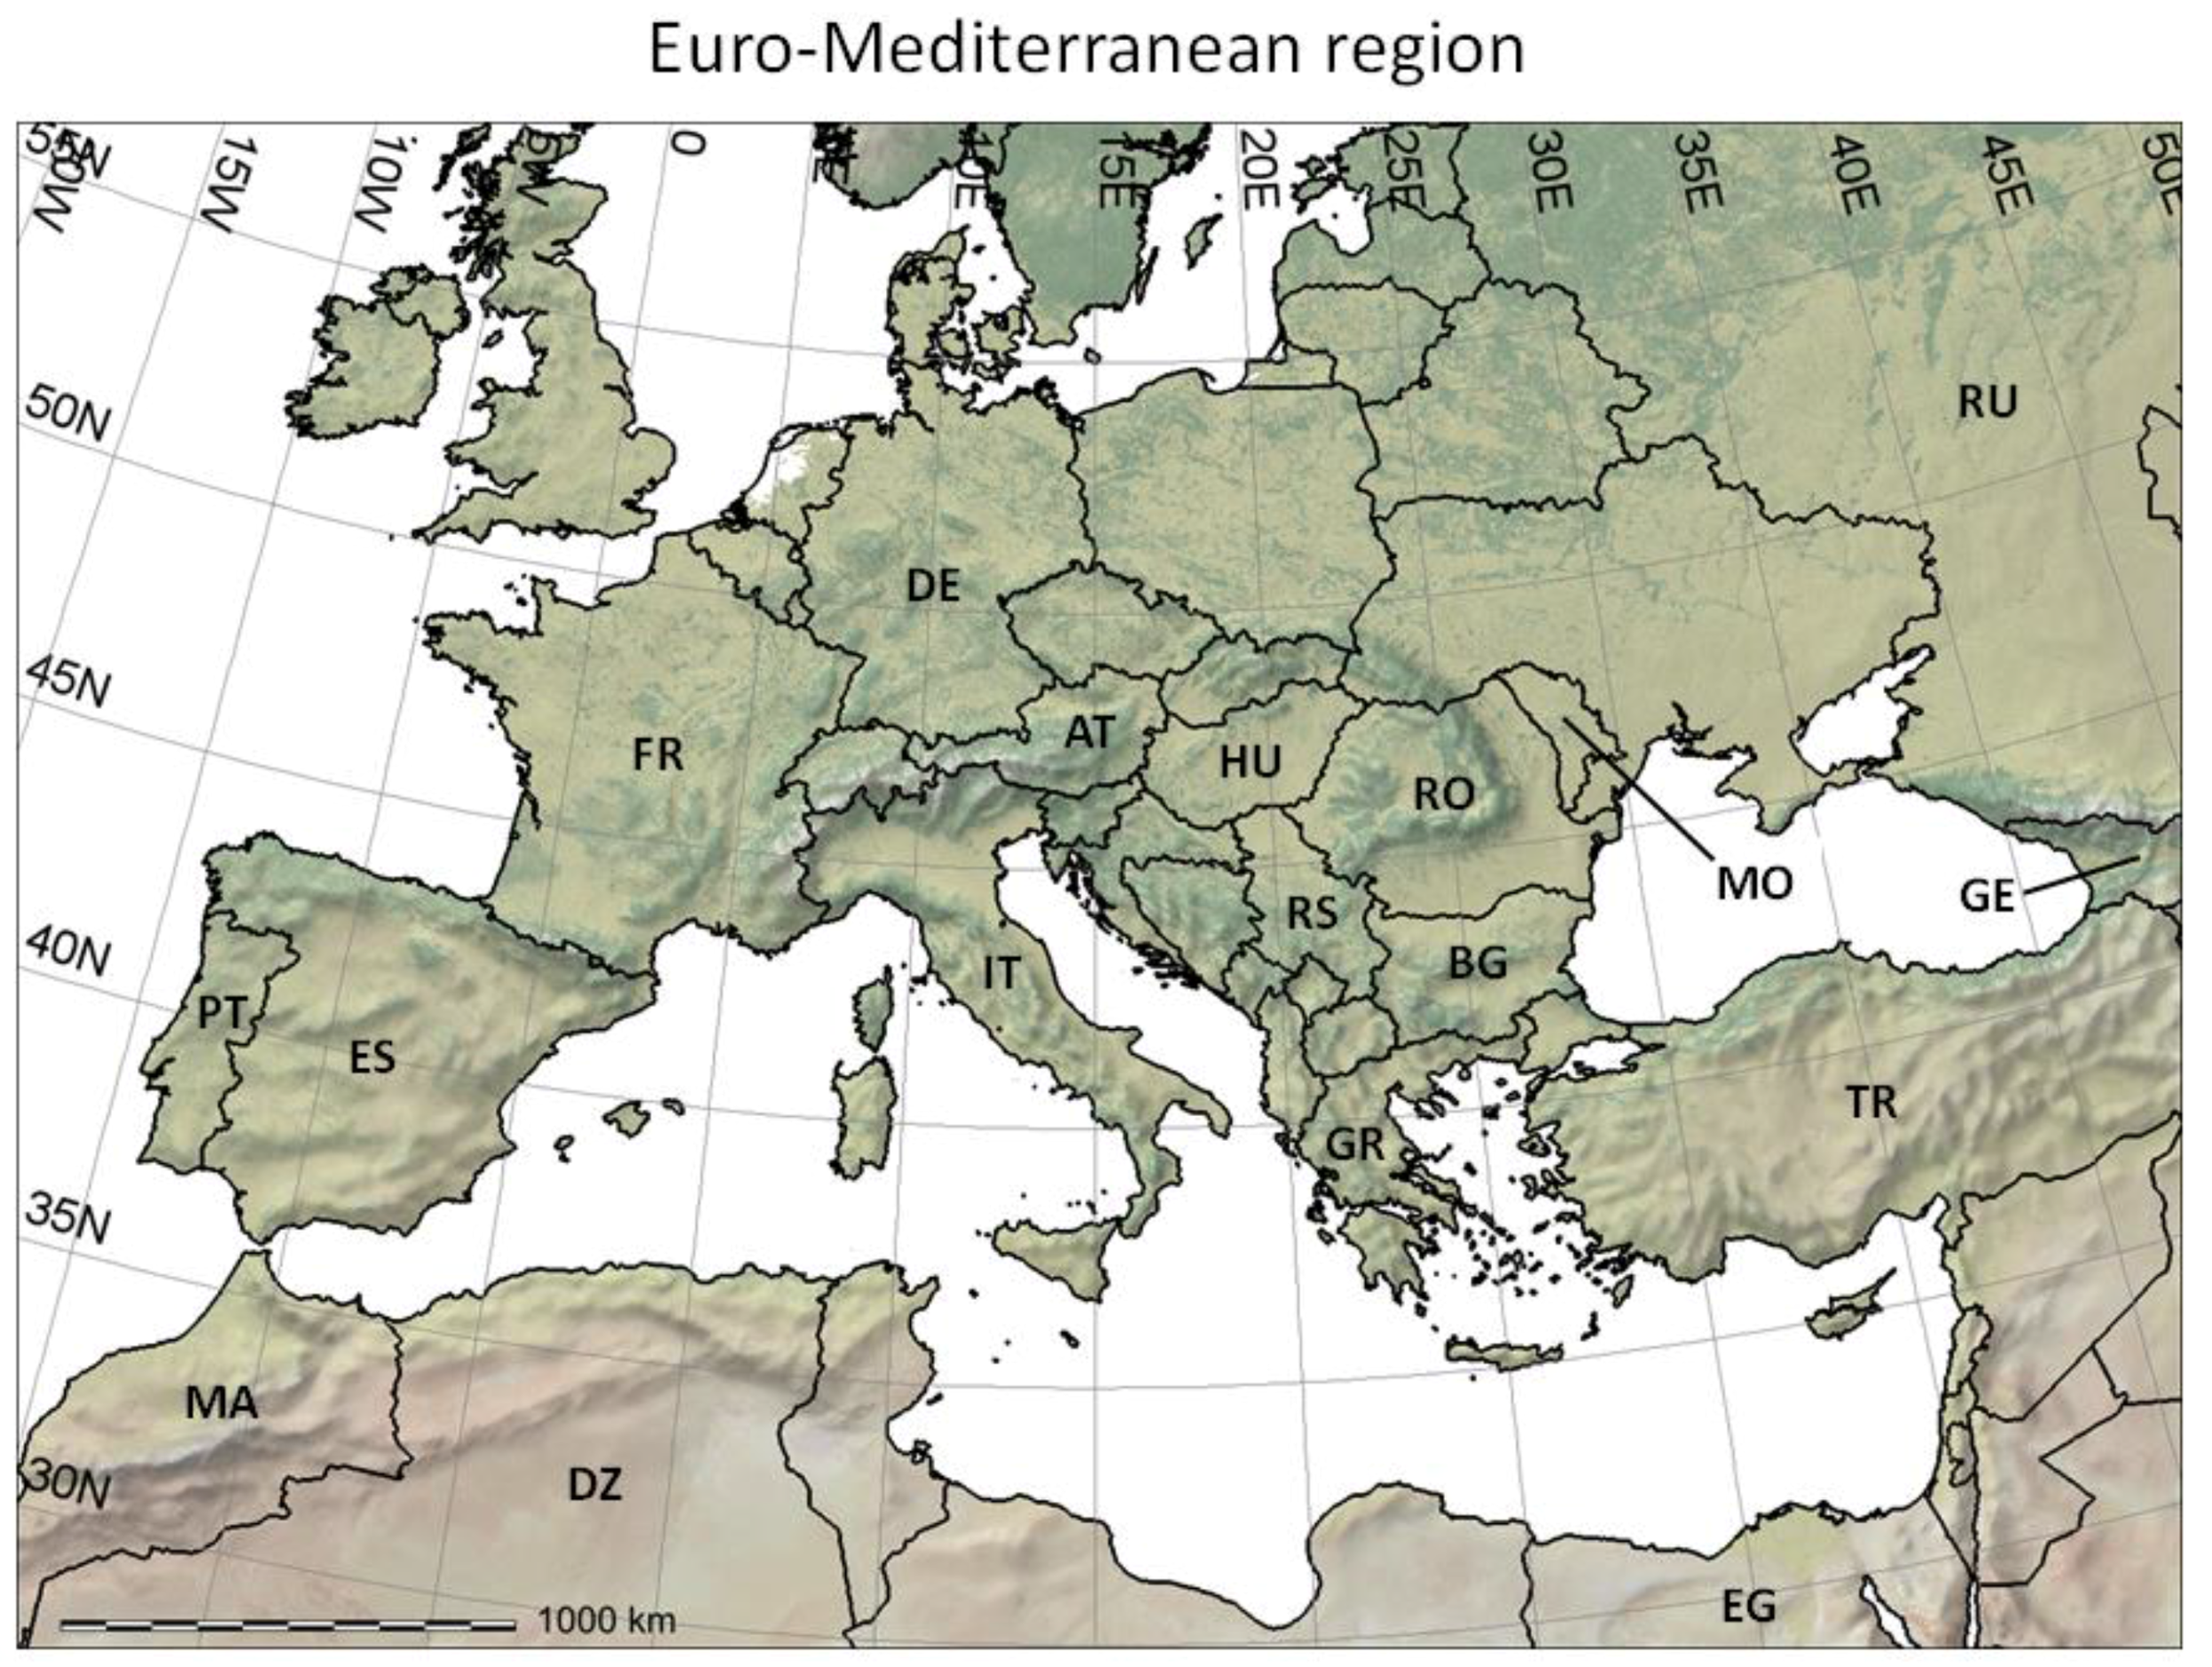
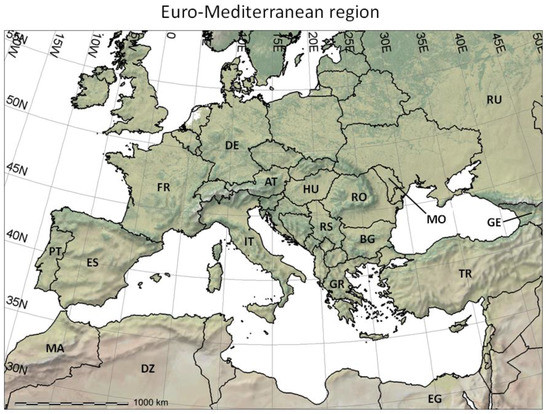 Figure 2. The Euro-Mediterranean part of the Western Palearctic region considered in the present paper, including shaded relief and land cover coloring based on satellite observations (form http://www.naturalearthdata.com/), and two-letter country codes (i.e., ISO 3166-1 alpha-2 codes, https://en.wikipedia.org/wiki/ISO_3166-1_alpha-2) used in this study to identify countries of interest. DZ = Algeria; AT = Austria; BG = Bulgaria; EG = Egypt; FR = France; DE = Germany; GR = Greece; HU = Hungary; IT = Italy; MO = Moldova; MA = Morocco; PT = Portugal; RO = Romania; RU = Russia; RS = Serbia; ES = Spain; TR = Turkey.
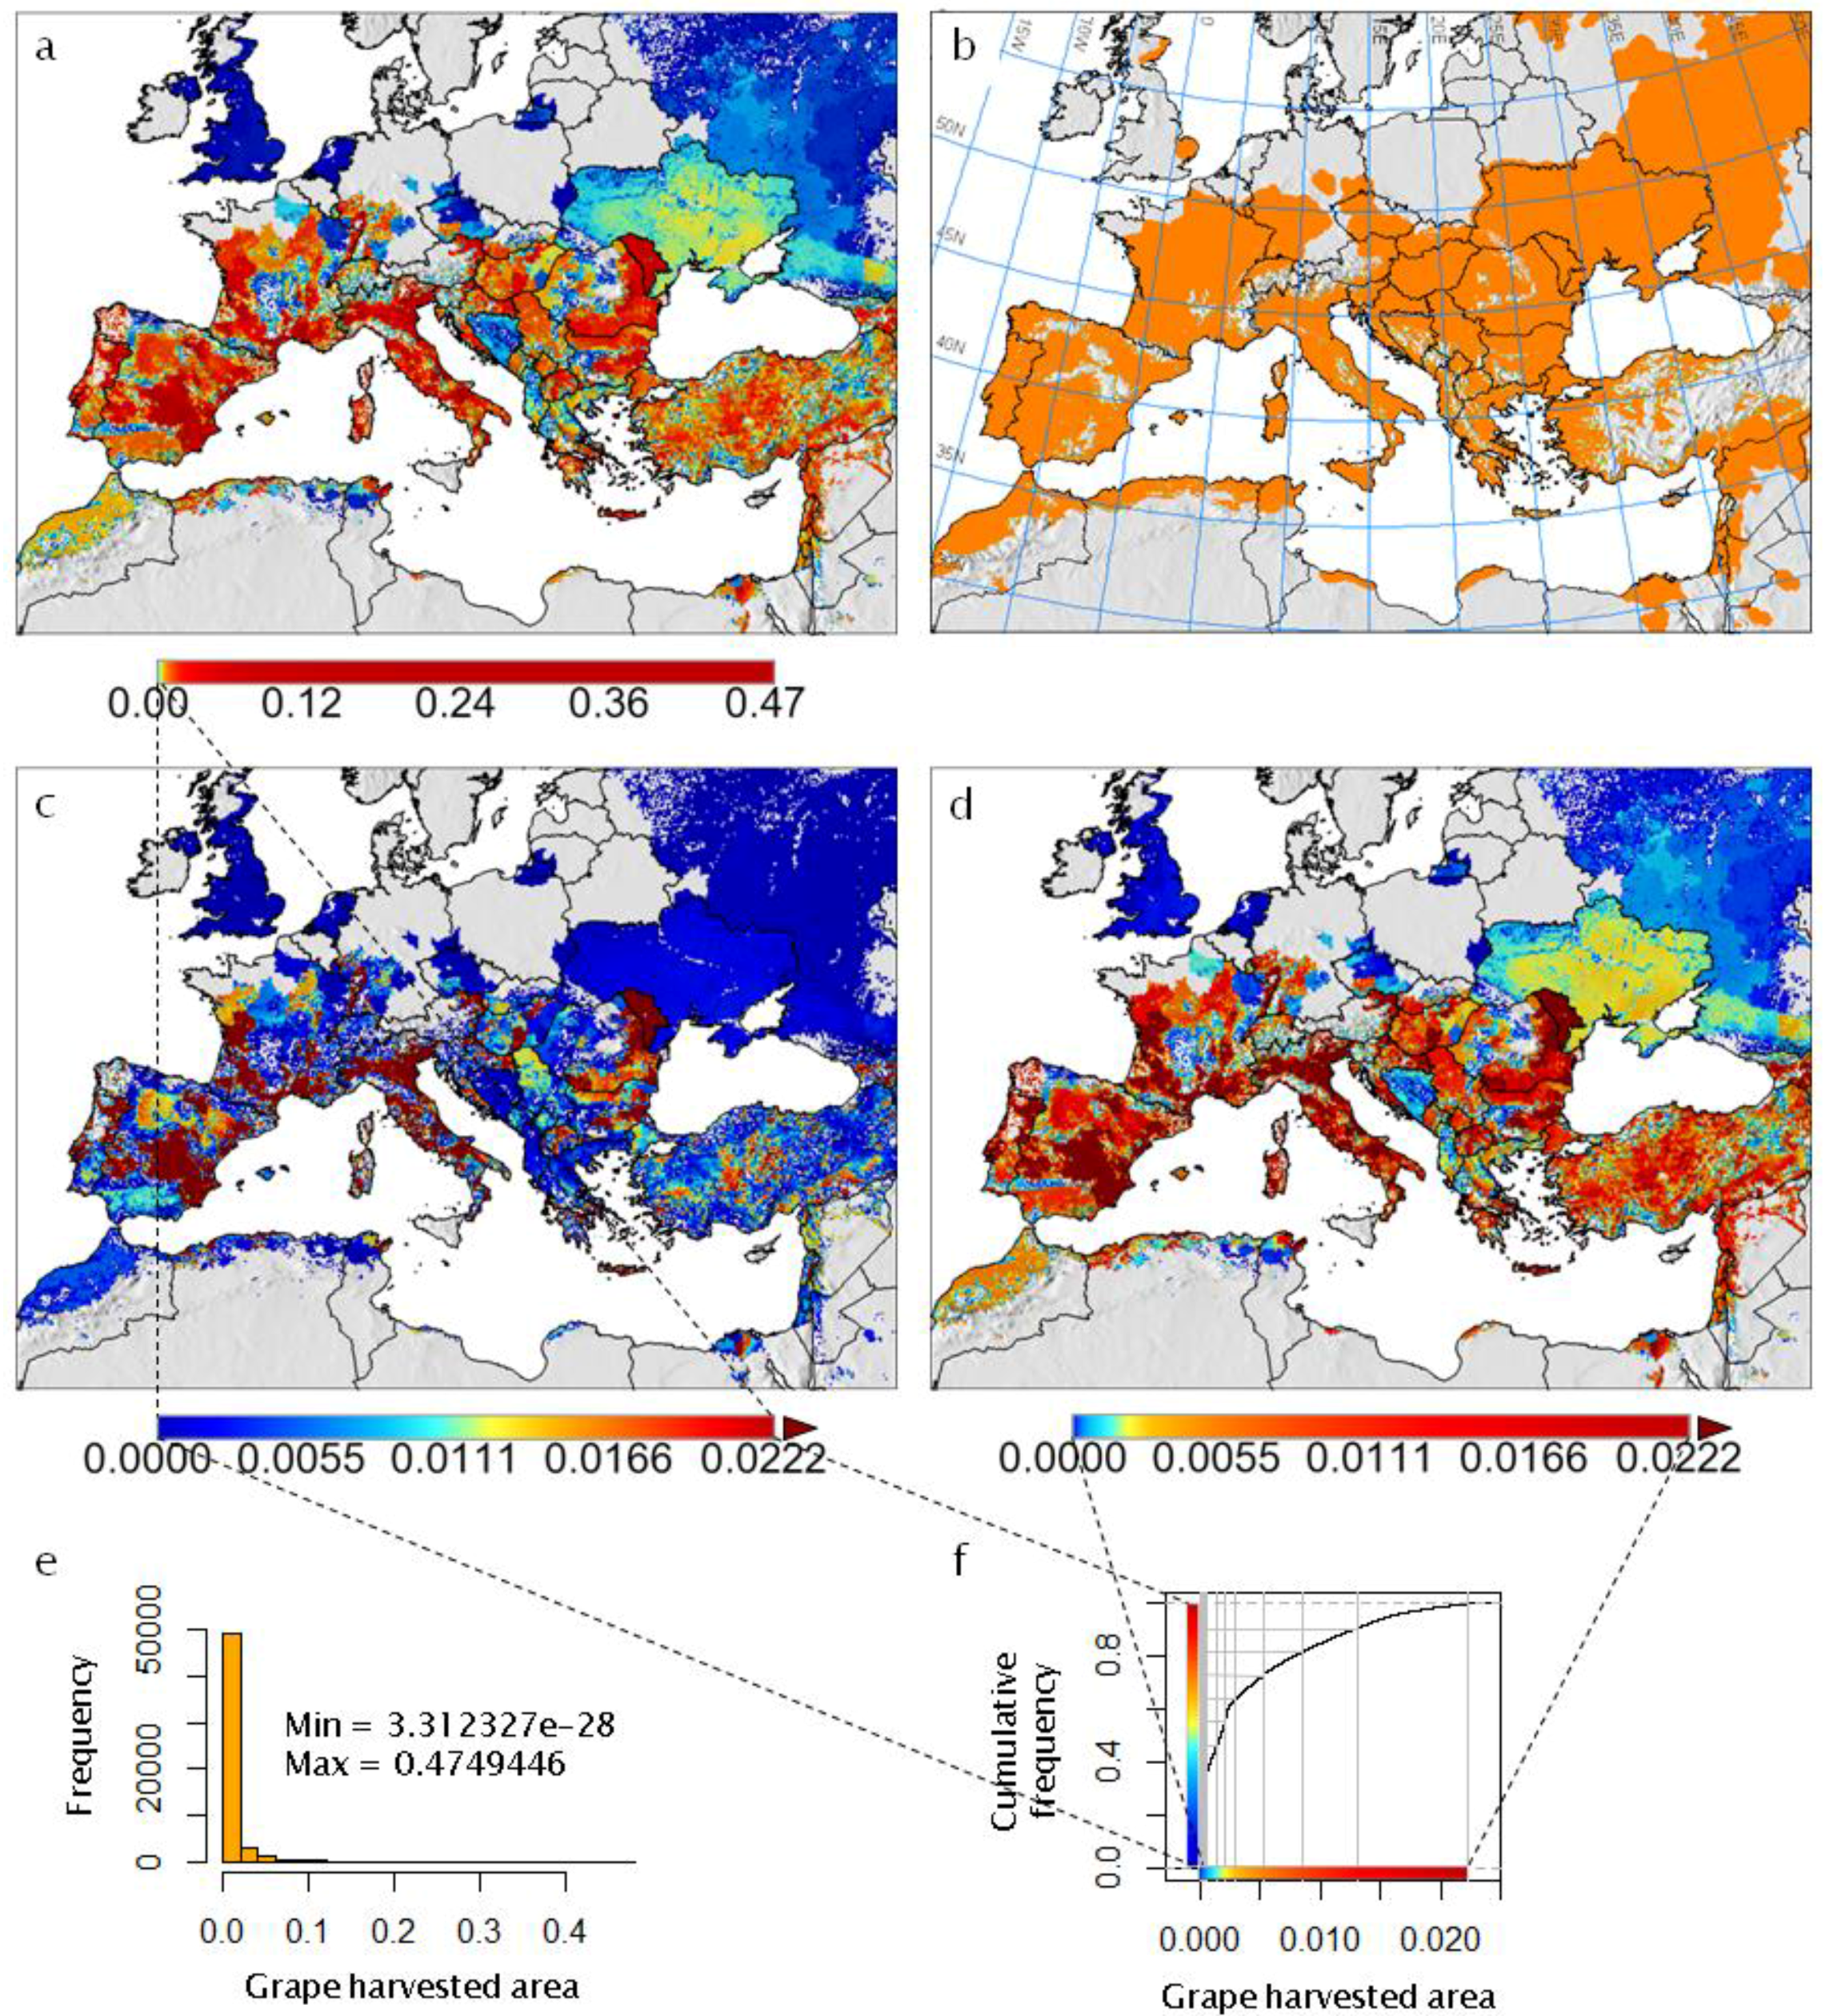
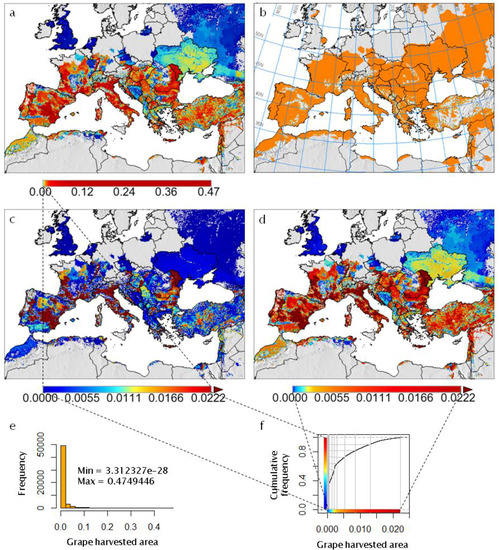 Figure 3. Analysis of the observed geographic distribution of grape production for the reference year 2000 using the fraction of ~10 km × 10 km cell covered by vineyards (data from [62]) mapped only if fraction is ≥0.0001 (i.e., each raster cell that covers ~104 ha of land is considered part of the grape growing area if it includes at least one ha of vineyard): (a) map with histogram-equalized color coding (f) where each color covers an equal share of land; (b) derived potential grape distribution with uniform color to highlight the grape growing area (note that missing data for Sicily in [62] were filled using Corine Land Cover 2000 raster data [63]); (c) map where statistical outliers selected via the boxplot R function [15] are mapped in very dark red (i.e., symbol ►) to improve visual detection of differences within non-outlier data [64]; (d) map with histogram-equalized color coding restricted to non-outlier data, and where each color covers an equal share of land but only for areas covered by non-outlier data cells (f); (e) frequency histogram of data in (a–d); (f) cumulative frequency used to assign an equal number of cells to every color in the legend of plot (d).
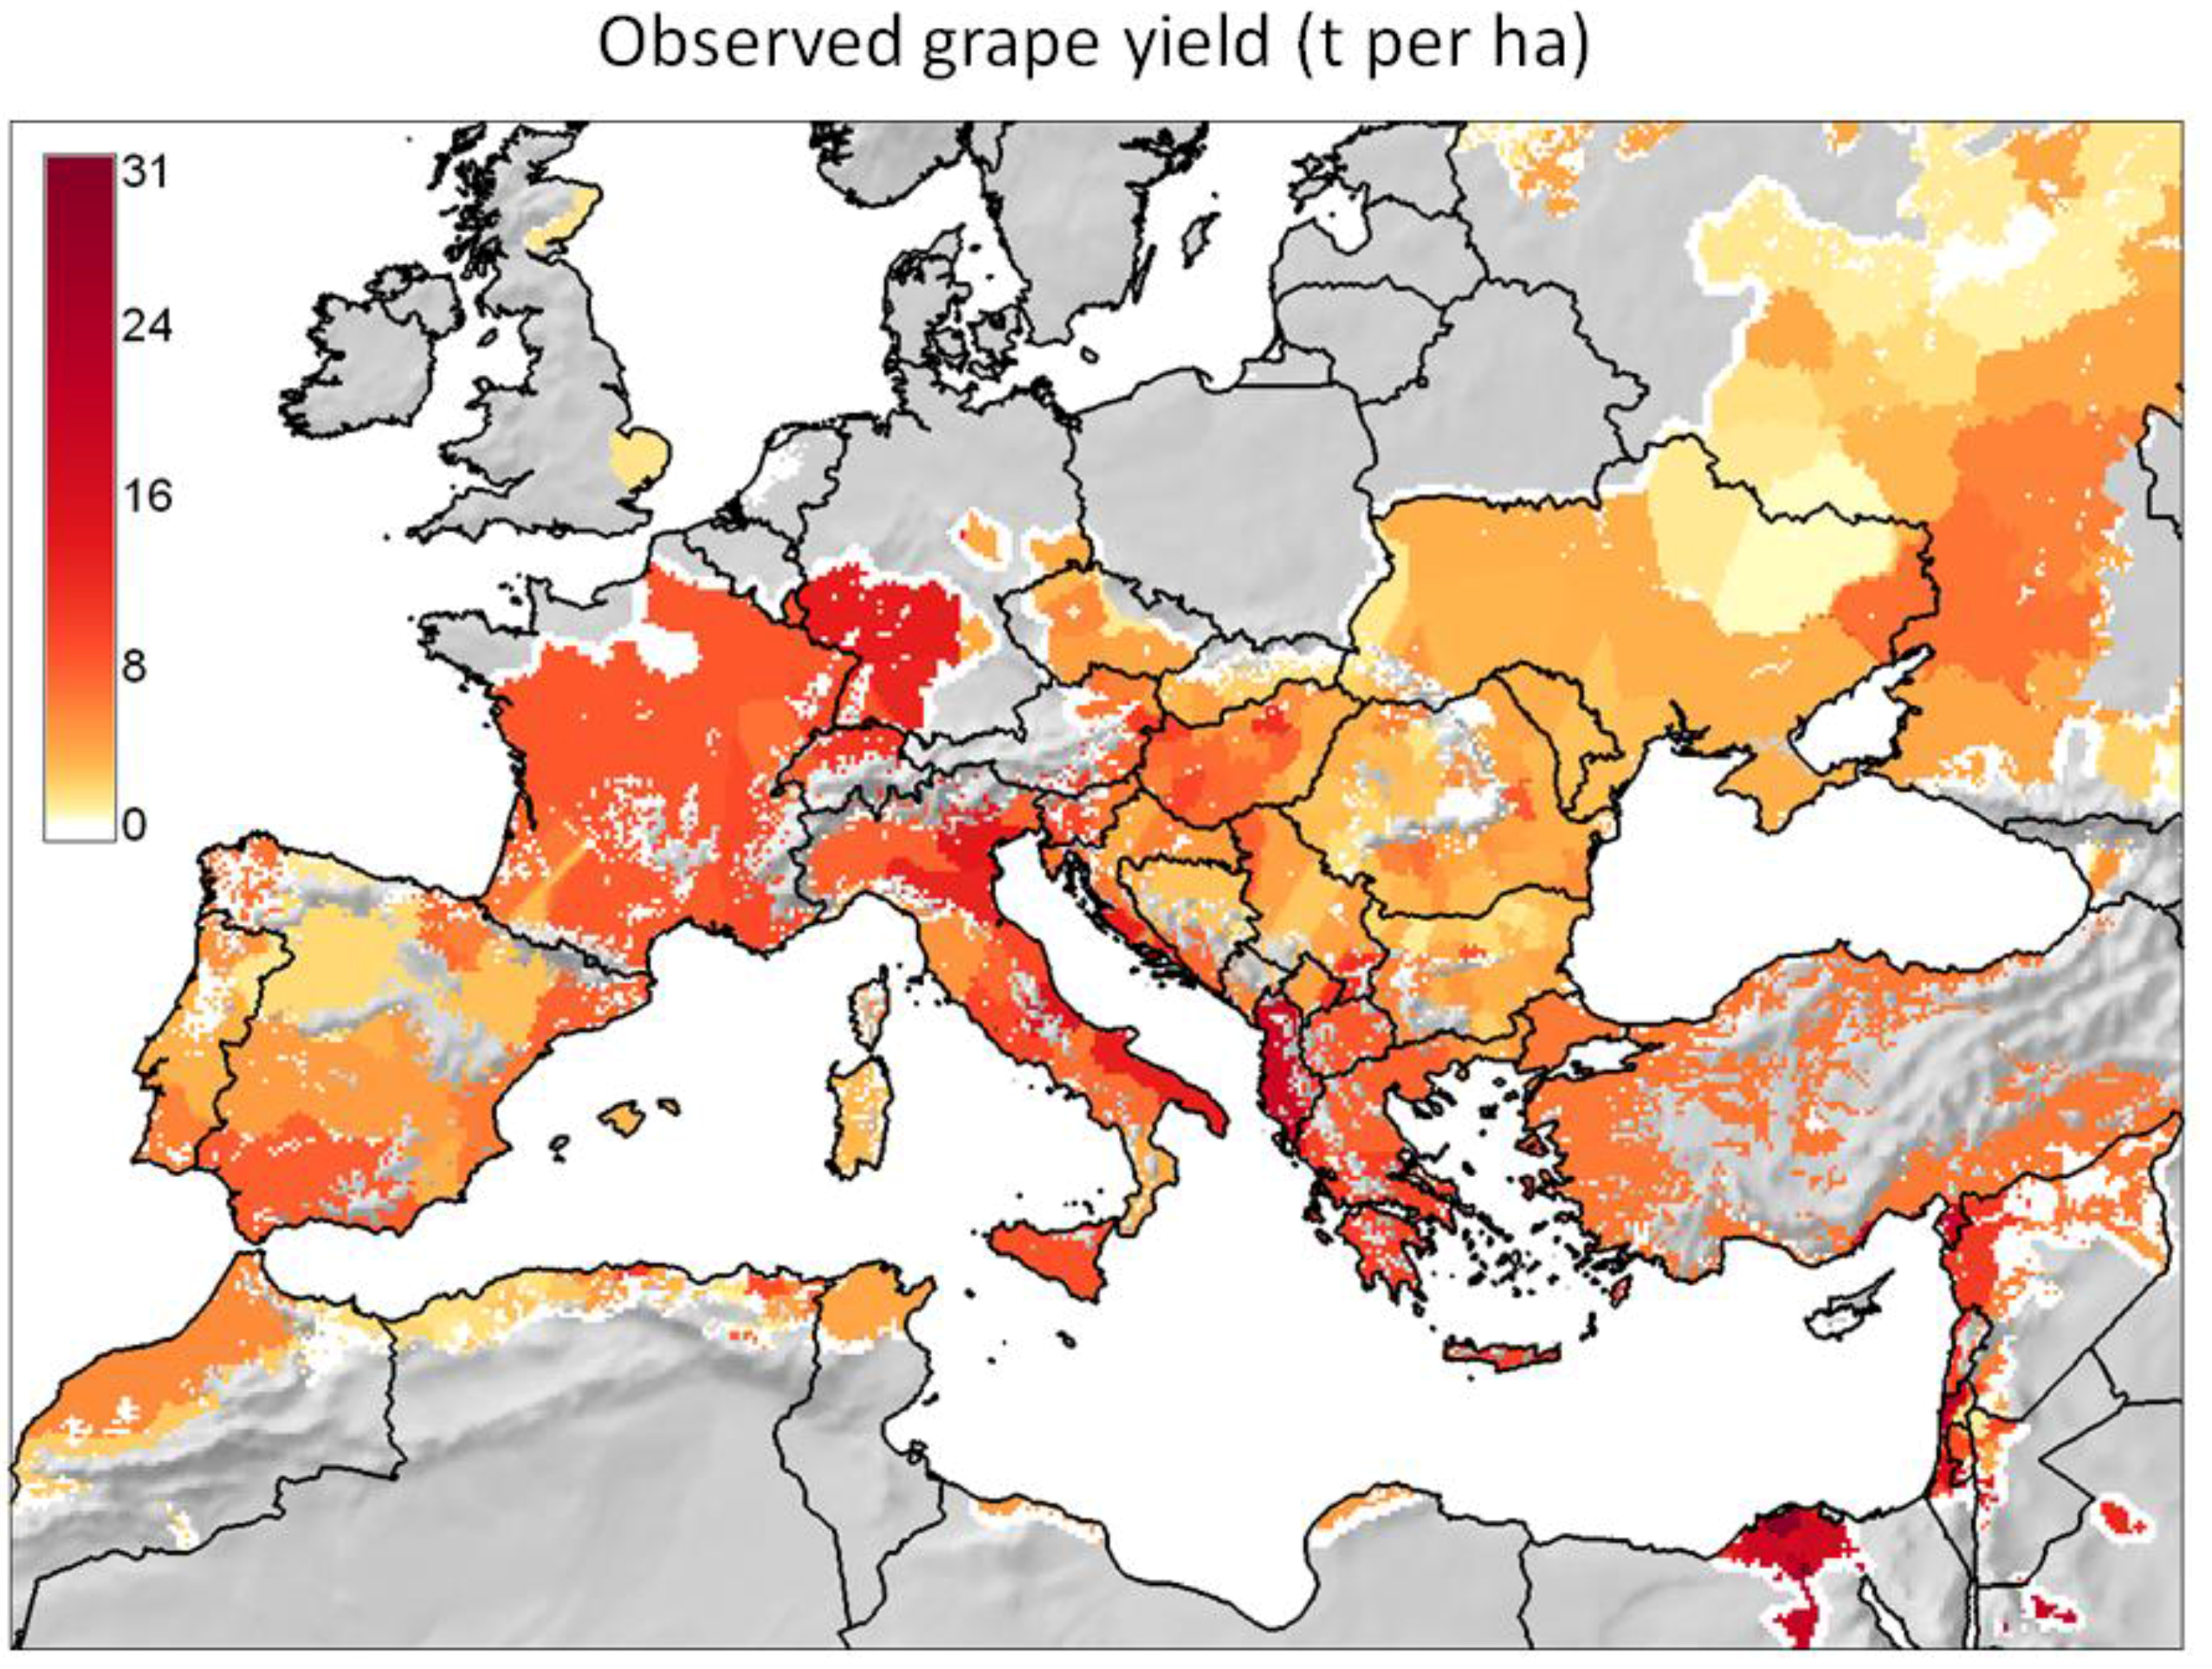
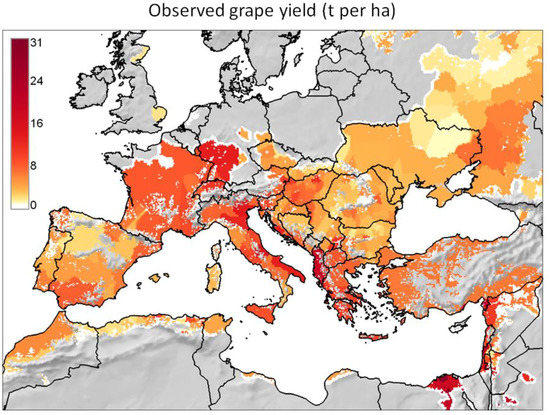 Figure 4. Observed grape yield (t per ha) for the reference year 2000 (data from [62]) mapped for the observed geographic distribution shown in Figure 3. Note that missing data for Sicily in [62] were filled using AGRO-MAPS data [65].
 - For each of the major grape growing countries of the Euro-Mediterranean region (Figure 2) it shows the probability distribution of changes in grape yield and grapevine moth infestation (Figure 5 and Figure 6), as well as the fraction of grape growing area in each country where these changes are expected to be positive or negative (Table 1 and Table 2);
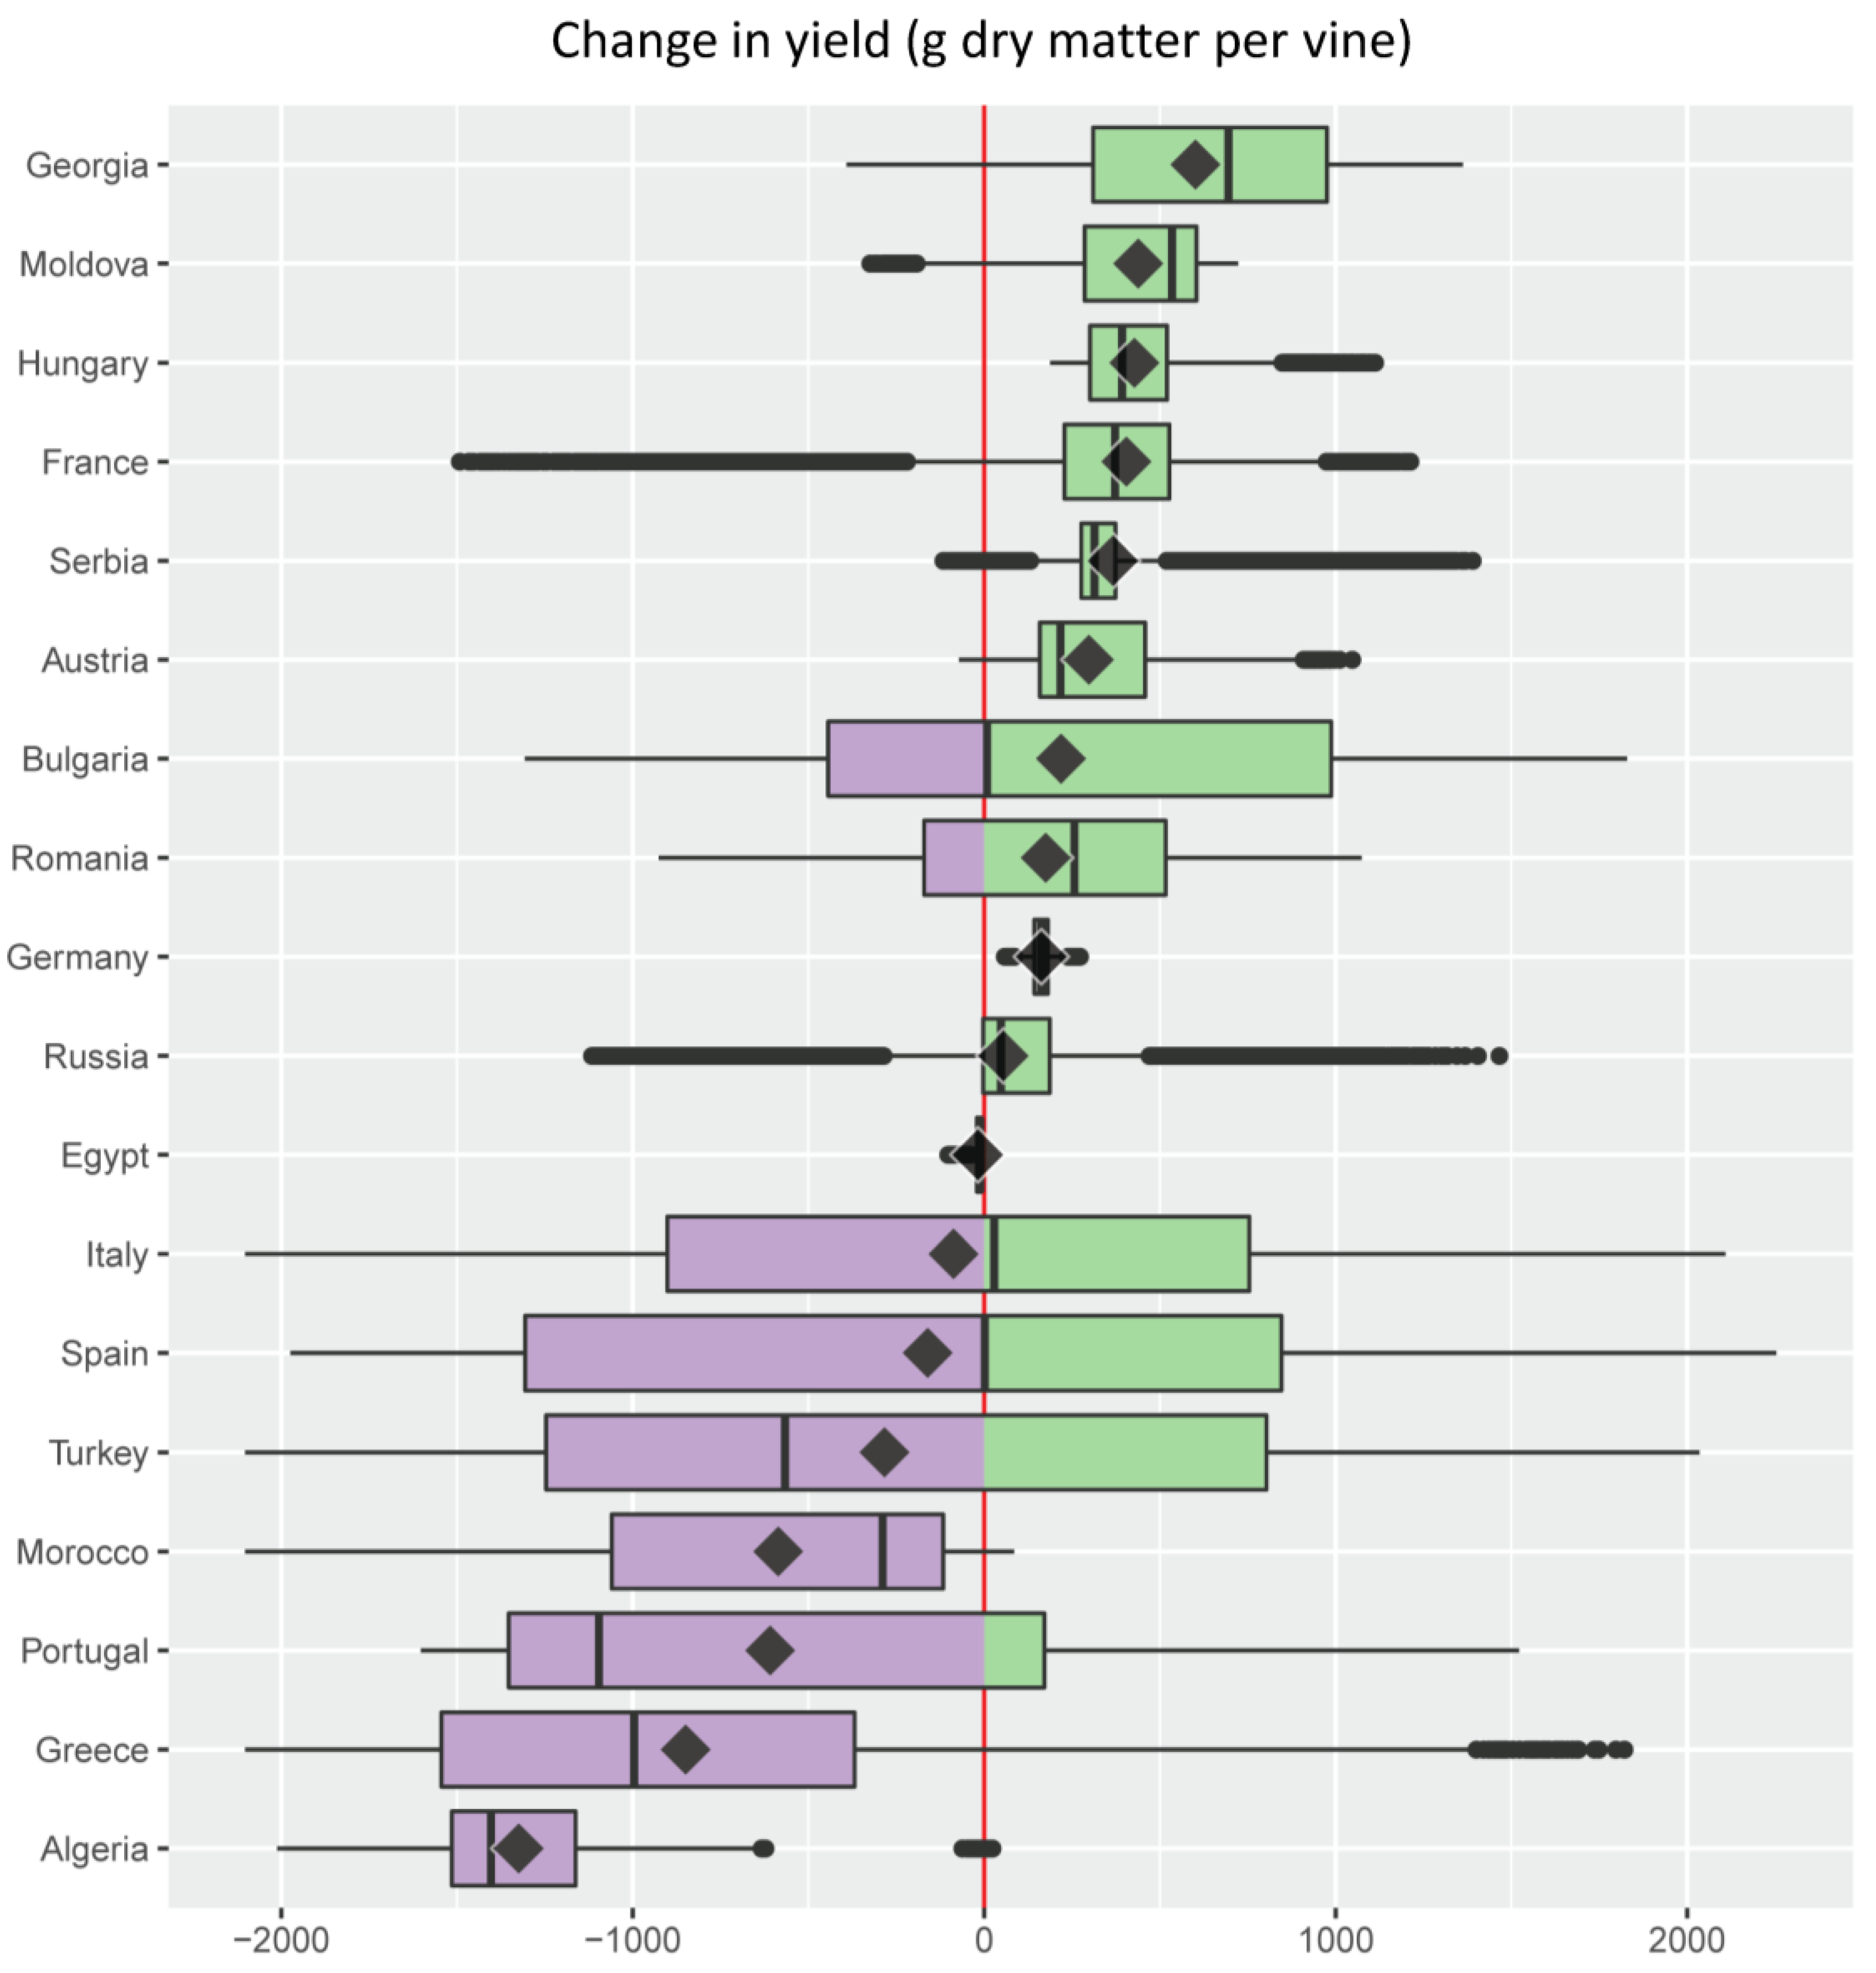
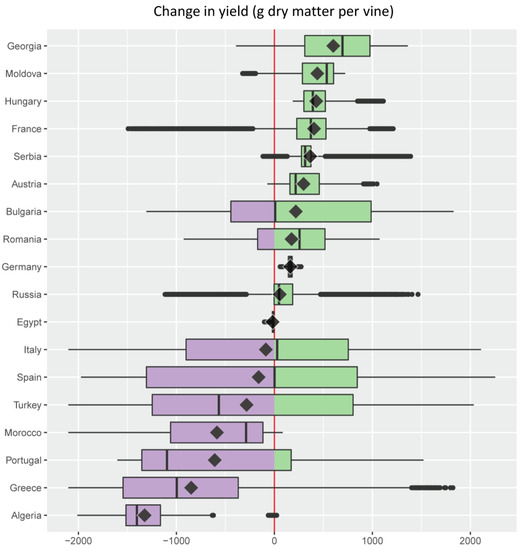 Figure 5. Change in grape yield (g dry matter per plant) under an A1B scenario of 1.8 °C average climate warming in the Euro-Mediterranean region illustrated as a series of stacked boxplots (graphics produced using the R package ggplot2 [72]), one for each of the 18 Euro-Mediterranean countries (Figure 2) having a grape growing area larger than 32 × 103 ha [67]. Box-and-whisker plots (boxplots) indicate the distribution of data with the vertical black line inside the box representing the median value, the left and right limits of the box being the 25th and 75th percentile (the lower and upper quartiles, respectively), and the whiskers indicating the minimum and maximum value unless outliers are shown as black points, in which case whiskers represent the lower quartile − (1.5 × the interquartile range) (IQR, a measure of statistical dispersion equal to the difference between upper and lower quartiles) and/or the upper quartile + (1.5 × IQR). The superimposed diamonds indicate the mean climate change impact, and boxplots are ordered using this parameter. The red line is a reference for no impact with violet filling indicating a negative change (decrease) and green a positive one (increase). Color palette from ColorBrewer [73].
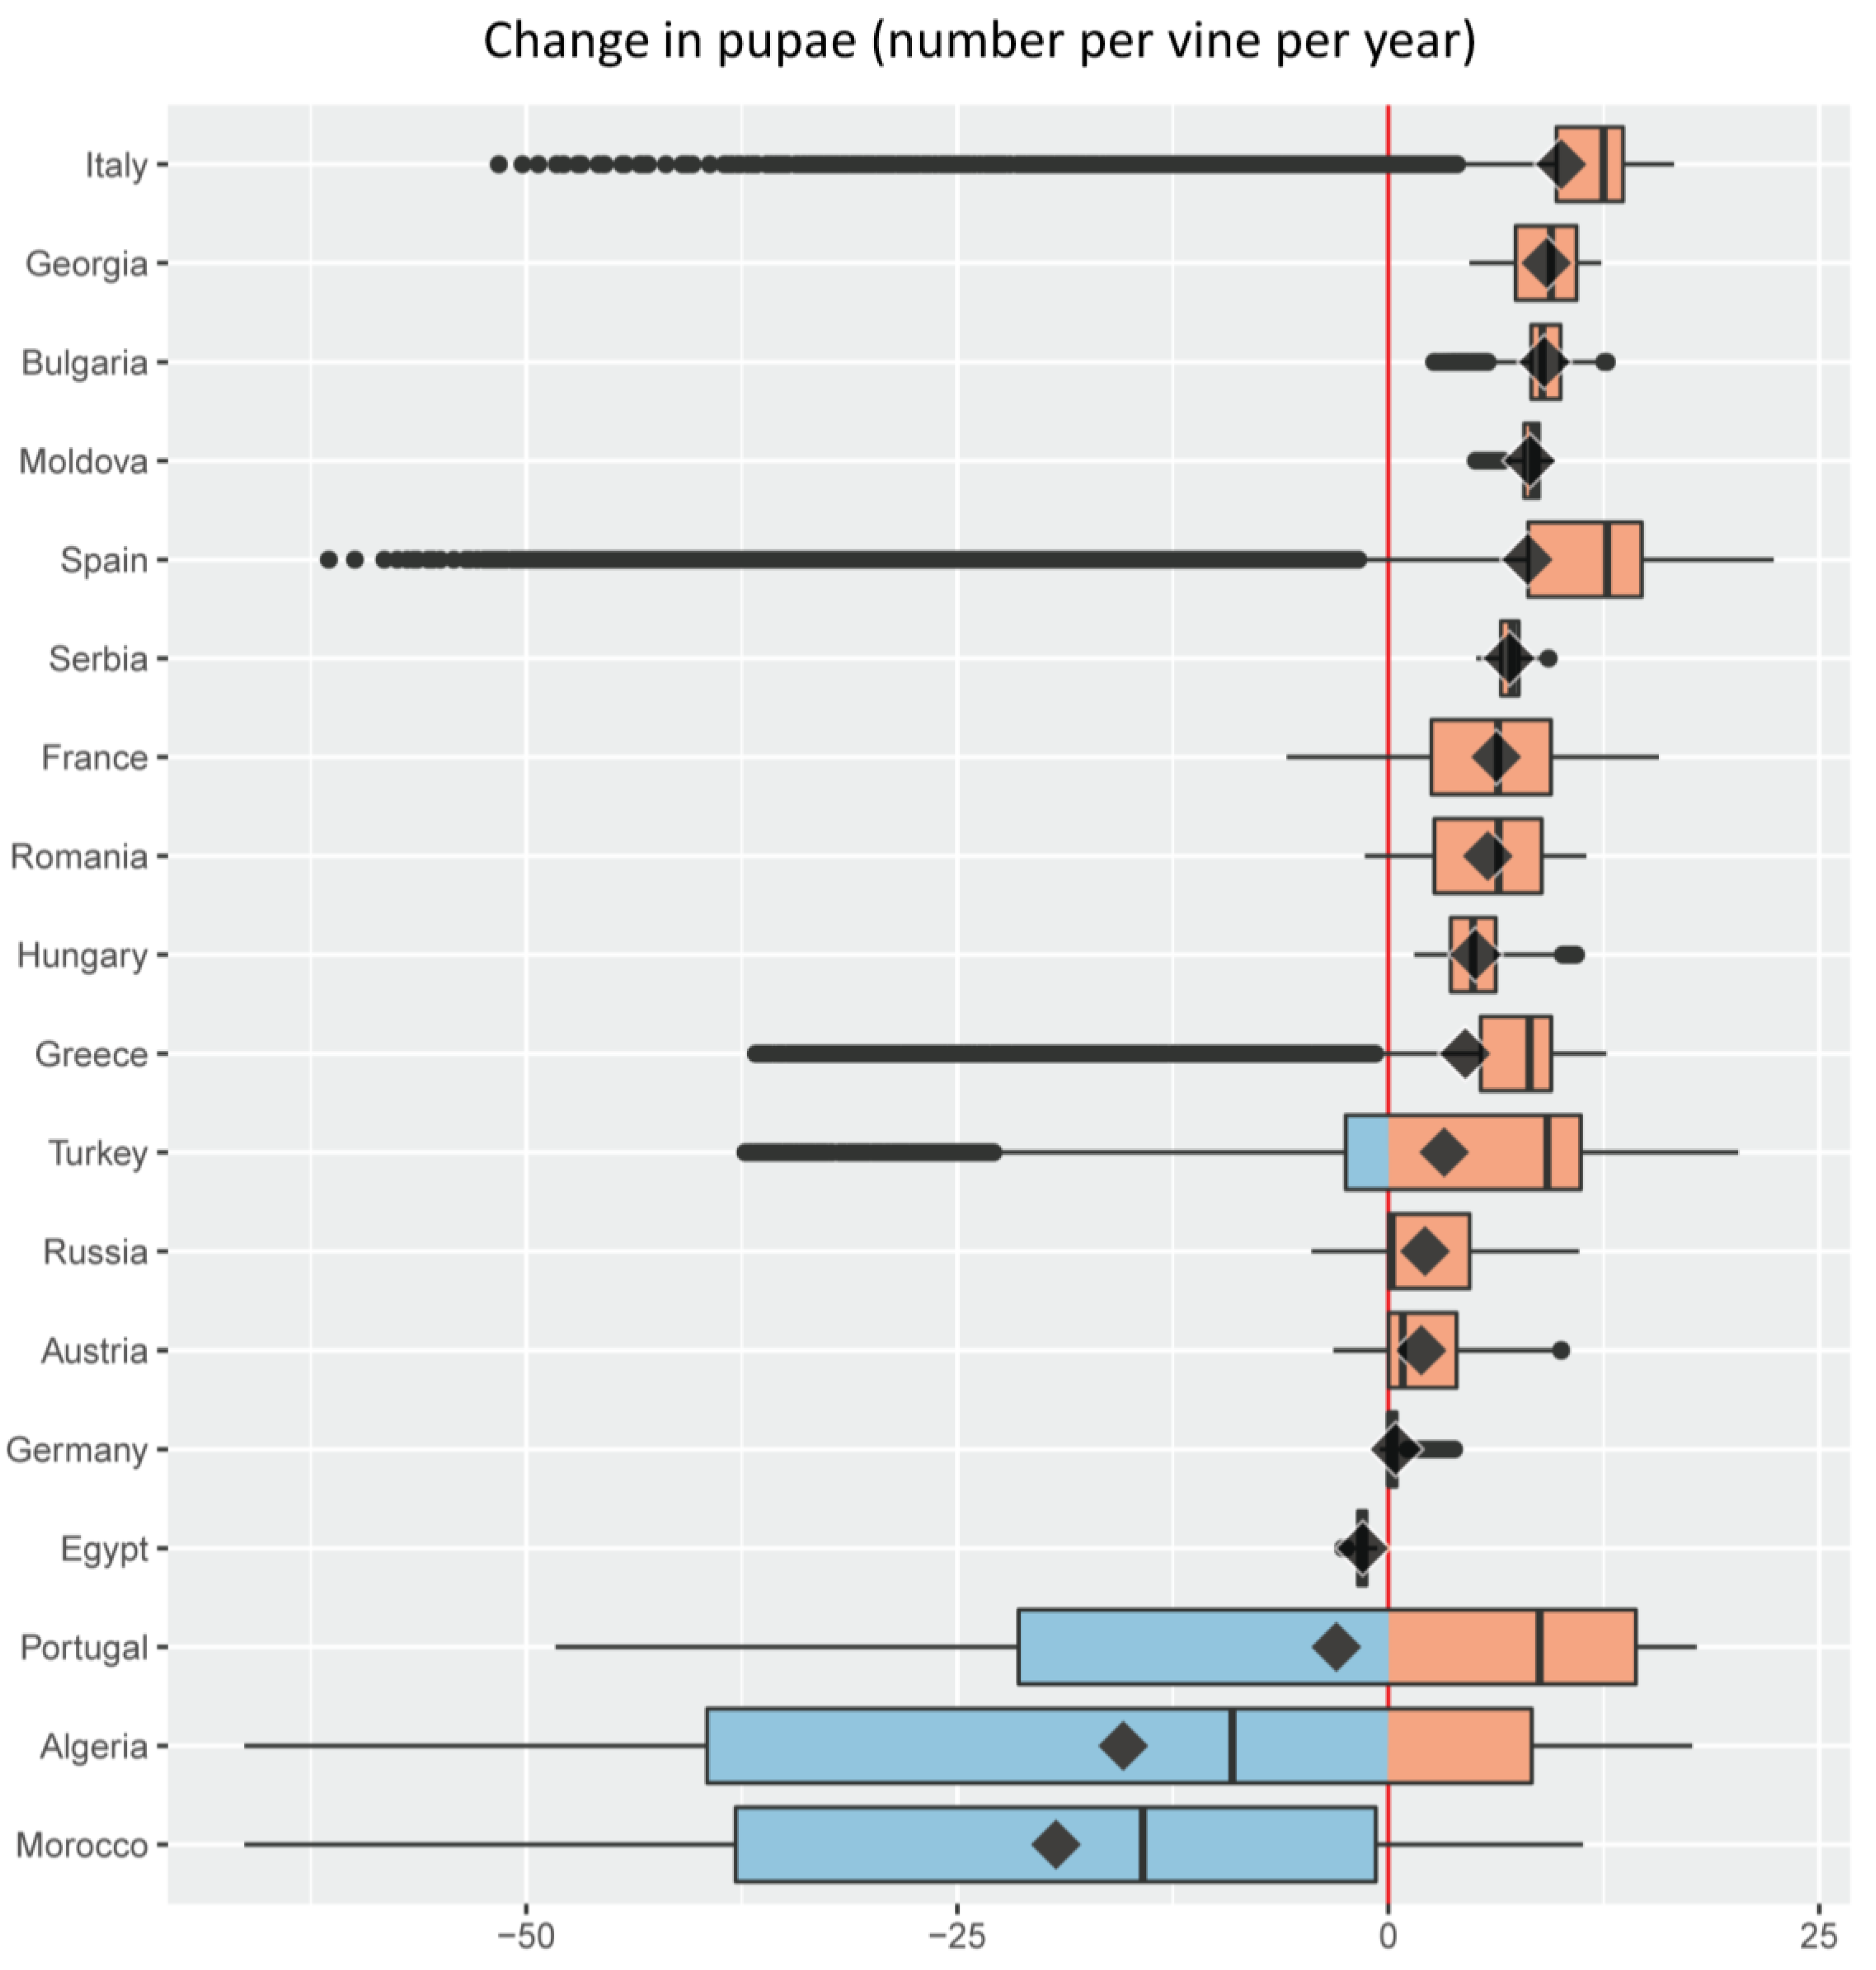
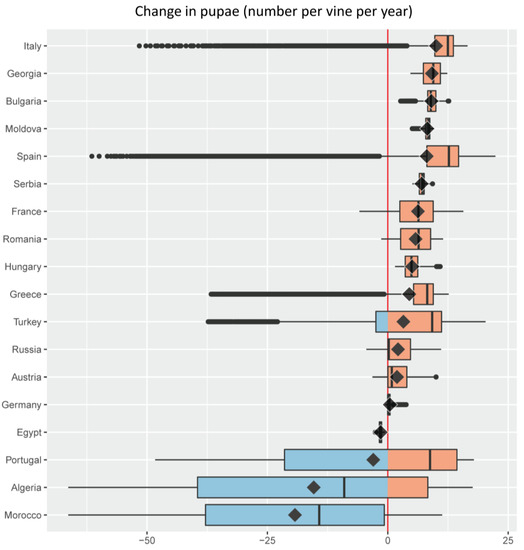 Figure 6. Change in the density of the grapevine moth Lobesia botrana (cumulative number of pupae per plant per year) under an A1B scenario of 1.8 °C average climate warming in the Euro-Mediterranean region illustrated as a series of stacked boxplots (graphics produced using the R package ggplot2 [72]), one for each of the 18 Euro-Mediterranean countries (Figure 2) having a grape growing area larger than 32 × 103 ha [67]. Box-and-whisker plots (boxplots) indicate the distribution of data with the vertical black line inside the box representing the median value, the left and right limits of the box being the 25th and 75th percentile (the lower and upper quartiles, respectively), and the whiskers indicating the minimum and maximum value unless outliers are shown as black points, in which case whiskers represent the lower quartile − (1.5 × the interquartile range) (IQR, a measure of statistical dispersion equal to the difference between upper and lower quartiles) and/or the upper quartile + (1.5 × IQR). The superimposed diamonds indicate the mean climate change impact, and boxplots are ordered using this parameter. The red line is a reference for no impact with blue filling indicating a negative change (decrease) and pink a positive one (increase). Color palette from ColorBrewer [73].
 Table 1. Percent fraction (%) of the grape growing area where negative or positive changes in yield (Δ yield) are projected under an A1B scenario of 1.8 °C average climate warming in the 18 Euro-Mediterranean countries with the largest vineyard area.
 Table 2. Percent fraction (%) of the grape growing area where negative or positive changes in the density of grapevine moth (Lobesia botrana) (Δ pupae) are projected under an A1B scenario of 1.8 °C average climate warming in the 18 Euro-Mediterranean countries with the largest vineyard area.
 - It ranks the 18 major Euro-Mediterranean grape growing countries in terms of the following bioeconomic measures of climate risk: (a) mean climate change impact on grape yield and grapevine moth infestation (Figure 5 and Figure 6); (b) relative share of the grape growing area in each country where grape yield and grapevine moth infestation are expected to be negative or positive (Table 1 and Table 2).
2. Olive vs. Grape
Olive and grape are the two major perennial crop systems traditionally grown in the Mediterranean Basin [16]. They are ecological, socioeconomic, and cultural assets of Mediterranean landscapes [17] developed over centuries of human-nature interaction [18], and show considerable ecological resilience [19] when properly managed [4,18,20,21,22].
Olive and grape are to some extent complementary agroecosystems. In olive, the usually conflicting goals of biodiversity conservation and agricultural production largely converge (see e.g. supplementary materials in [12]). In contrast, the economic drivers in grape production have turned it into an industrial monoculture that currently is an important source of ecological disruption and pollution in the agricultural landscape [23]. Specifically, olive is an evergreen plant with a relatively stable associated pest/pathogen complex in which only the olive fruit fly Bactrocera oleae causes economic damage requiring ongoing management [24,25], whereas grape is deciduous and seasonally colonized by herbivores, and requires relatively high pesticide use to prevent economic damage from a variety of pests and pathogens [26] (Figure 1) leading to environmental and health concerns. Overall, pesticide inputs in grape are expected to increase under climate change [27] unless better management practices can be developed.
3. The PBDM Approach
Complexity is intrinsically high in grape, and is a major barrier to analysis and management (see Figure 1; modified from [13]), with climate change further complicating issues [28,29]. To fully understand the consequences of current and future management practices requires a holistic analysis of the system [30], but while this is often advocated [31,32,33,34,35,36] it is rarely achieved. As a result, management strategies for critical pest problems often fail because holistic analyses that underpin sound decision making at the field level are unavailable [37].
One way to tackle complex problems such as crop-pests interactions that lie at the interface between global change and biological systems (i.e., global change biology) is to analyze them using a mechanistic description of their biology (i.e., a model) based on the unifying paradigm that all organisms including humans acquire and allocate resources by analogous processes (the paradigm of ecological analogies, see [30], and http://www.casasglobal.org/). PBDMs are based on the notion that analogous weather-driven sub-models for resource acquisition and birth-death dynamics can be used to predict explicitly the biology and dynamics of heterotherm species across trophic levels [30,37,45,46], including the economic level [47,48]. PBDMs include bottom-up effects of plant growth and development on herbivore dynamics, and the top-down action of natural enemies [28,49]. Realistic PBDMs have been used as the production function in bioeconomic analyses in agriculture including invasive species under observed and climate change scenarios at various spatial scales and with different degrees of economic focus [12,50,51]. General bioeconomic PBDMs of renewable resource exploitation including the economic consumer can also be used to examine the stability and bioeconomic properties of natural and agro-ecosystems [45,52,53,54]. Bioeconomic analysis using PBDMs is based on theoretical foundations that include a set of analogies between natural and human economies [47,48].
When driven by weather including climate change scenarios, PBDMs predict the phenology, age structure and abundance dynamics, and the distribution of the interacting species across wide geographic areas [37,55]. Several weather data sources can be used to drive weather-driven PBDMs [56], including satellite remote sensing [57,58] and regional climate change projections [59,60], while the geographic information system (GIS) GRASS (http://grass.osgeo.org) [14] is used to perform geospatial analysis and produce maps.
A significant fraction of the management-relevant complexity included in the grape agroecosystem has been or is being modeled using the PBDMs in a GIS context (Figure 1) [13,38,39,40,41,43], and hence the reader is referred to the original papers for a full description. Here we focus on how the interaction of grape and its major insect pest L. botrana is expected to change as a result of climate warming [see 13] in the major grape growing countries of the Euro-Mediterranean region (Figure 2). It is worth noting that although feeding by L. botrana larvae causes relatively small direct yield losses, the associated indirect damage may be economically large and be possibly exacerbated by the grey mold fungus Botrytis cinerea (Sclerotiniaceae) (Figure 1).
4. The GIS Context for PBDMs
GIS have the capacity to integrate digital data layers into joint databases and to provide data analysis and visualization techniques for ecological data, whether field observations or PBDM predictions. We use the free and open source GIS software GRASS [14]. A number of factors affecting species distribution and abundance may be integrated into ecosystem models as digital data using joint geo-referenced databases in a GIS [30]. Another important component in the PBDM data management system is R [15] which is a software environment for statistical computing and graphics that is also free and open source, and that enables a two-way interface to GRASS functionality and data [61].
A first geographic step in studying grape production in the Euro-Mediterranean region is to assess the observed geographic distribution and yield of the crop. To achieve this, we used GRASS to process and analyze state of the art datasets on the distribution of grape (Figure 3) and of grape yield (Figure 4).
5. Climate Change Effects on Grape and Its Major Insect Pest
PBDMs are driven by daily weather, and hence a climate modeling scenario is required to assess the effects of projected climate change on grape and L. botrana [40]. In this study, we used the A1B regional climate change scenario that posits +1.8 °C warming for the Euro-Mediterranean region [60]; a scenario that is towards the middle of the Intergovernmental Panel on Climate Change [33] range of greenhouse gas (GHG) forcing scenarios [66]. This fine-scale weather dataset at ~30 km resolution was developed by Dell’Aquila et al. [60] using the regional climate model PROTHEUS [59]. PROTHEUS is a coupled atmosphere-ocean regional model that allows simulation of local extremes of weather via the inclusion of a fine-scale representation of topography and the influence of the Mediterranean Sea [59]. The PROTHEUS A1B scenario is a fine-scale projection of future climate change for the Euro-Mediterranean region, and the daily weather data for the periods 1960–1970 (reference baseline) and 2040–2050 (climate change) was used to run the grapevine/L. botrana system across the Euro-Mediterranean region [13]. Here we provide further analysis of the data presented in [13], with emphasis on regional bioeconomic analysis. Specifically, we present an overview of changes in grape yield (Figure 5) and L. botrana density (Figure 6) as driven by climate warming for each of the 18 Euro-Mediterranean countries (Figure 2) having a grape growing area larger than 32 × 103 ha [67]. The present paper provides information that complements that found in [13].
The present analysis shows that climate warming effects on grape and its major insect pest may be positive and/or negative in the different countries (Figure 5 and Figure 6). With the notable exception of France where vineyards extend beyond 50° North (Figure 3b), Mediterranean countries (i.e., Algeria, Greece, Portugal, Morocco, Turkey, Spain, Italy, and Egypt) are projected to experience a negative average effect of climate warming on grape yield (Figure 5). A general detrimental effect of climate change on viticulture in the Mediterranean region has previously been shown, although without consideration of the pest level [11,68,69,70,71]. Countries such as Spain, Bulgaria, and Italy where the median effect of climate warming on grape yield is close to zero, are projected to have positive or negative yield changes on equal shares of their respective vineyard areas (Figure 5). Spain is expected to have the highest variability in climate warming effects on yields, with the lowest variability expected in Egypt (Figure 5). Projected climate warming will increase grape yield to some extent in all countries except Egypt, but yield increases are expected over the entire grape growing area only in Germany and Hungary (Figure 5).
An average increase in infestations by L. botrana is projected in most countries because of climate warming, with the pest expected to increase across all vineyards of Hungary, Serbia, Moldova, Bulgaria, and Georgia (Figure 6). Some Mediterranean countries with hotter climates where negative yield change is expected on average under climate warming, are also projected to experience decreased average pest infestations: this is the case of Morocco, Algeria, Portugal, and Egypt (Figure 6). On average, others such as Greece, Spain, and Italy are projected to face both decreases in yield and increases in pest infestation (Figure 6). Algeria shows the largest variability in climate warming effects on pest infestations, while Egypt the smallest (Figure 6). Climate warming is predicted to increase pest levels in a total of 14 countries vs. only 10 countries where increased yield is expected (Figure 5 vs. Figure 6).
Additional information that complements estimates of the variability, median, mean, and extreme values in yield and pest level changes under climate warming, is the relative share of the grape growing area in each country that is expected to experience these changes (Table 1 and Table 2).
Note the absence of areas where no change in yield and pest level is expected under climate warming (Table 1 and Table 2). This is due to the use of the single value zero to separate positive and negative changes. An alternative approach would be to use an interval including zero and a range of small positive and negative values of change that would be considered negligible.
6. Discussion
Determining the direction and magnitude of change in tri-trophic natural and agro-ecosystems due to climate change is a major challenge for developing sustainable management strategies. These changes may be in phenology, yield, pest levels, natural enemy efficacy, and other measurable aspects of the system. To assess the underlying causes of these changes requires that we analyze the population dynamics of plant, herbivorous and carnivorous species and their interactions under extant weather and climate change [12,30]. The literature is replete with analyses that fail to include the appropriate level of system complexity, and that yield solutions having little relevance to develop a general understanding of the problems. Among the ecosystem level problems that will be complicated by global change and climate change will be changes in the dynamic interactions of ecosystem components [28,74] as weather may affect each in different ways, and these changes will challenge our capacity to develop timely solutions.
An efficient way to address holistically ecosystem level analyses that are robust to climate change effects is the development of mechanistic physiologically-based demographic models (i.e., PBDMs) of the biology of the interacting species in a weather-driven GIS context [30]. The problem of developing PBDMs is simplified by the fact that all species in all trophic levels (including the economic one) have by analogy the same resource acquisition and allocation strategies [30,47,48]. These PBDMs can be used as the economic objective function to perform realistic bioeconomic analyses that include usually neglected core ecological issues that determine socio-economic outcomes. Two recent examples under extant and climate change weather scenarios are the bioeconomic analysis of olive/olive fly in the Mediterranean Basin [12] and the impact of weather and new biotechnologies in Indian cotton on increases in economic distress and in Indian farmer suicides [51]. Applications with a more traditional economic bent are also possible, leading to estimates of the economic gains and losses of extant and new technologies at local and regional level in crop/pest systems [50]. Bioeconomic models based on sound PBDMs have firm theoretical, ecological and economic foundations with known stability and bioeconomic properties [45,47,48,52,53,54] and can readily be applied to natural and agro-ecosystems as affected by changes in climate, and biological and technological innovations.
This paper focused on grape in the Palearctic region, but globally, grape is the fruit crop with the largest acreage and the highest economic value [1]. Grape has a variety of pests and pathogens that cause economic damage [75,76,77] and that require control interventions. As a result, chemical use in grape is among the highest among agricultural crops [23,26]. To assess the impact of pests, a model for grapevine was developed based upon extensive field data [38,39], while models for the pests were developed based on modest data and funding ([13,38,39,40,41]; Figure 1). Because the PBDMs capture the weather driven biology of the different species and their interactions, the same system model can be used to analyze grape and the pest species globally where they co-occur under observed and climate change weather. These models have a modular structure, and as such models of additional pest species can be added as required; e.g., the major fungal disease Botrytis cinerea [44].
The principal native insect pest of grape in the Palearctic region is the grapevine moth L. botrana, and was the focus of our analysis in the Mediterranean Basin in the face of extant weather and of climate warming [13]. The analysis predicts that grape yield and L. botrana densities may increase or decrease across the major grape growing countries of the Euro-Mediterranean region (Figure 2). On a finer scale, the analysis predicts that climate warming effects on grape and L. botrana may vary widely across countries and within ecological zones within a country (Figure 5 and Figure 6; Table 1 and Table 2; see Figure 9 in [13]). Because the grape/L. botrana PBDM system is driven by weather, the model may be applied at various levels (e.g., field or regional) and used to develop management strategies. Applications at the field level, however, require development of infrastructure to provide field level estimates of initial conditions for plant, pests and diseases, and site-specific weather data to drive the model.
Pest problems such as L. botrana have required chemical inputs to control it (and other pests and diseases), resulting in chemical use that is one of the highest among crops, and that is expected to increase under climate change [27] in a time and place specific manner. The PBDM system could also be used to develop and test alternative control strategies. For example, the grape/L. botrana system was used to evaluate the use of pheromone-based control strategies [13,40]. PBDM grounded holistic bioeconomic models and analyses are well suited to address such evolving problems due to various causes in a timely manner; especially in the face of climate change where prior experience may provide little guidance.
Our study on grape is the most recent of a long series of analyses carried out using PBDMs worldwide in systems as diverse as alfalfa, cassava, coffee, grape, olive, mosquitoes, rice, screwworm, and tsetse fly (http://www.casasglobal.org/). This progress was made possible by the identification of core conceptual, semantic, and algorithmic patterns discussed above [13,38,39,40,41,42,43]. The development of unified plug and play software for PBDM development would empower researchers globally to perform rapid and low-cost holistic bio-economic analyses of eco-social problems of many crop systems.
Acknowledgments
Funding for the modeling/GIS analysis was provided by Agenzia nazionale per le nuove tecnologie, l’energia e lo sviluppo economico sostenibile (ENEA), Rome, Italy and by the Center for the Analysis of Sustainable Agricultural Systems (CASAS Global), Kensington, California, USA. This research contributes to the knowledge hub titled Modelling European Agriculture with Climate Change for Food Security (MACSUR; www.macsur.eu/) within the Joint Programming Initiative on Agriculture, Food Security and Climate Change (FACCEJPI; www.faccejpi.com/); to the agreement between ENEA and the Italian Ministry of the Environment and Protection of Land and Sea (Convezione tra ENEA e Ministero dell’Ambiente e della Tutela del Territorio e del Mare); and to the project titled Turning climate-related information into added value for traditional MEDiterranean Grape, OLive and Durum wheat food systems (MED-GOLD) that has received funding from the European Union’s Horizon 2020 research and innovation programme under grant agreement No. 776467. An earlier version of this paper was presented at the international conference “Wine sustainability”, Pescara, Italy, 1–2 September 2017.
Author Contributions
L.P. and A.P.G. designed and performed the analysis; all authors contributed to analyzing the data; M.N. contributed analysis tools and A.B. contributed economics expertise to the analysis; L.P. wrote the initial draft of the manuscript and all authors contributed to the final version.
Conflicts of Interest
The authors declare no conflict of interest.
References
- Vivier, M.A.; Pretorius, I.S. Genetically tailored grapevines for the wine industry. Trends Biotechnol. 2002, 20, 472–478. [Google Scholar] [CrossRef]
- Trichopoulou, A.; Lagiou, P. Healthy traditional Mediterranean diet: An expression of culture, history, and lifestyle. Nutr. Rev. 1997, 55, 383–389. [Google Scholar] [CrossRef] [PubMed]
- Grigg, D. Food consumption in the Mediterranean region. Tijdschr. Voor Econ. En Soc. Geogr. 1999, 90, 391–409. [Google Scholar] [CrossRef]
- Blondel, J. The “design” of Mediterranean landscapes: A millennial story of humans and ecological systems during the historic period. Hum. Ecol. 2006, 34, 713–729. [Google Scholar] [CrossRef]
- Medina, F.X. Mediterranean diet, culture and heritage: Challenges for a new conception. Public Health Nutr. 2009, 12, 1618–1620. [Google Scholar] [CrossRef] [PubMed]
- United Nations Educational, Scientific and Cultural Organization (UNESCO). Mediterranean Diet. Available online: https://ich.unesco.org/en/RL/mediterranean-diet-00884 (accessed on 1 March 2017).
- Ponti, L.; Gutierrez, A.P.; Altieri, M.A. Preserving the Mediterranean diet through holistic strategies for the conservation of traditional farming systems. In Biocultural Diversity in Europe; Agnoletti, M., Emanueli, F., Eds.; Environmental History; Springer: Cham, Switzerland, 2016; pp. 453–469. ISBN 978-3-319-26313-7. [Google Scholar]
- Pattara, C.; Russo, C.; Antrodicchia, V.; Cichelli, A. Carbon footprint as an instrument for enhancing food quality: Overview of the wine, olive oil and cereals sectors. J. Sci. Food Agric. 2017, 97, 396–410. [Google Scholar] [CrossRef] [PubMed]
- Alessandri, A.; De Felice, M.; Zeng, N.; Mariotti, A.; Pan, Y.; Cherchi, A.; Lee, J.-Y.; Wang, B.; Ha, K.-J.; Ruti, P.; Artale, V. Robust assessment of the expansion and retreat of Mediterranean climate in the 21st century. Sci. Rep. 2014, 4, 7211. [Google Scholar] [CrossRef] [PubMed]
- Geri, F.; Amici, V.; Rocchini, D. Human activity impact on the heterogeneity of a Mediterranean landscape. Appl. Geogr. 2010, 30, 370–379. [Google Scholar] [CrossRef]
- Hannah, L.; Roehrdanz, P.R.; Ikegami, M.; Shepard, A.V.; Shaw, M.R.; Tabor, G.; Zhi, L.; Marquet, P.A.; Hijmans, R.J. Climate change, wine, and conservation. Proc. Natl. Acad. Sci. USA 2013, 110, 6907–6912. [Google Scholar] [CrossRef] [PubMed]
- Ponti, L.; Gutierrez, A.P.; Ruti, P.M.; Dell’Aquila, A. Fine-scale ecological and economic assessment of climate change on olive in the Mediterranean Basin reveals winners and losers. Proc. Natl. Acad. Sci. USA 2014, 111, 5598–5603. [Google Scholar] [CrossRef] [PubMed]
- Gutierrez, A.P.; Ponti, L.; Gilioli, G.; Baumgärtner, J. Climate warming effects on grape and grapevine moth (Lobesia botrana) in the Palearctic region. Agric. For. Entomol. 2017. [Google Scholar] [CrossRef]
- Neteler, M.; Bowman, M.H.; Landa, M.; Metz, M. GRASS GIS: A multi-purpose Open Source GIS. Environ. Model. Softw. 2012, 31, 124–130. [Google Scholar] [CrossRef]
- R Core Team. R: A Language and Environment for Statistical Computing; R Foundation for Statistical Computing: Vienna, Austria, 2017; Available online: http://www.R-project.org (accessed on 26 June 2017).
- Kaniewski, D.; Van Campo, E.; Boiy, T.; Terral, J.-F.; Khadari, B.; Besnard, G. Primary domestication and early uses of the emblematic olive tree: Palaeobotanical, historical and molecular evidence from the Middle East. Biol. Rev. 2012, 87, 885–899. [Google Scholar] [CrossRef] [PubMed]
- Zimmermann, R.C. Recording rural landscapes and their cultural associations: Some initial results and impressions. Environ. Sci. Policy 2006, 9, 360–369. [Google Scholar] [CrossRef]
- Sirami, C.; Nespoulous, A.; Cheylan, J.-P.; Marty, P.; Hvenegaard, G.T.; Geniez, P.; Schatz, B.; Martin, J.-L. Long-term anthropogenic and ecological dynamics of a Mediterranean landscape: Impacts on multiple taxa. Landsc. Urban Plan. 2010, 96, 214–223. [Google Scholar] [CrossRef]
- Lavorel, S. Ecological diversity and resilience of Mediterranean vegetation to disturbance. Divers. Distrib. 1999, 5, 3–13. [Google Scholar] [CrossRef]
- Batáry, P.; Báldi, A.; Kleijn, D.; Tscharntke, T. Landscape-moderated biodiversity effects of agri-environmental management: A meta-analysis. Proc. R. Soc. Lond. B Biol. Sci. 2011, 278, 1894–1902. [Google Scholar] [CrossRef] [PubMed]
- Bagella, S.; Filigheddu, R.; Caria, M.C.; Girlanda, M.; Roggero, P.P. Contrasting land uses in Mediterranean agro-silvo-pastoral systems generated patchy diversity patterns of vascular plants and below-ground microorganisms. Comptes Rendus Biol. 2014, 337, 717–724. [Google Scholar] [CrossRef] [PubMed]
- Bagella, S.; Caria, M.C.; Farris, E.; Rossetti, I.; Filigheddu, R. Traditional land uses enhanced plant biodiversity in a Mediterranean agro-silvo-pastoral system. Plant Biosyst. Int. J. Deal. Asp. Plant Biol. 2016, 150, 201–207. [Google Scholar] [CrossRef]
- Provost, C.; Pedneault, K. The organic vineyard as a balanced ecosystem: Improved organic grape management and impacts on wine quality. Sci. Hortic. 2016, 208, 43–56. [Google Scholar] [CrossRef]
- Viggiani, G. La difesa integrata dell’olivo: Attualità e prospettive. Inf. Fitopatol. 1989, 2, 23–32. [Google Scholar]
- Daane, K.M.; Johnson, M.W. Olive fruit fly: Managing an ancient pest in modern times. Annu. Rev. Entomol. 2010, 55, 151–169. [Google Scholar] [CrossRef] [PubMed]
- Pertot, I.; Caffi, T.; Rossi, V.; Mugnai, L.; Hoffmann, C.; Grando, M.S.; Gary, C.; Lafond, D.; Duso, C.; Thiéry, D.; et al. A critical review of plant protection tools for reducing pesticide use on grapevine and new perspectives for the implementation of IPM in viticulture. Crop Prot. 2016. [Google Scholar] [CrossRef]
- Delcour, I.; Spanoghe, P.; Uyttendaele, M. Literature review: Impact of climate change on pesticide use. Food Res. Int. 2015, 68, 7–15. [Google Scholar] [CrossRef]
- Gutierrez, A.P.; Ponti, L.; Gilioli, G. Climate change effects on plant-pest-natural enemy interactions. In Handbook of Climate Change and Agroecosystems: Impacts, Adaptation, and Mitigation; Hillel, D., Rosenzweig, C., Eds.; Imperial College Press: London, UK, 2010; pp. 209–237. ISBN 978-1-84816-655-4. [Google Scholar]
- Gutierrez, A.P.; Ponti, L. Analysis of invasive insects: Links to climate change. In Invasive Species and Global Climate Change; Ziska, L.H., Dukes, J.S., Eds.; CABI Publishing: Wallingford, UK, 2014; pp. 45–61. [Google Scholar]
- Gutierrez, A.P. Applied Population Ecology: A Supply-Demand Approach; John Wiley and Sons: New York, NY, USA, 1996; ISBN 0-471-13586-0. [Google Scholar]
- Zavaleta, E.S.; Hobbs, R.J.; Mooney, H.A. Viewing invasive species removal in a whole-ecosystem context. Trends Ecol. Evol. 2001, 16, 454–459. [Google Scholar] [CrossRef]
- Hulme, P.E. Beyond control: Wider implications for the management of biological invasions. J. Appl. Ecol. 2006, 43, 835–847. [Google Scholar] [CrossRef]
- Intergovernmental Panel on Climate Change (IPCC). Climate Change 2007: Impacts, Adaptation and Vulnerability. Contribution of Working Group II to the Fourth Assessment Report of the Intergovernmental Panel on Climate Change; Cambridge University Press: Cambridge, UK; New York, NY, USA, 2007; ISBN 978-0-521-70597-4. [Google Scholar]
- Intergovernmental Panel on Climate Change (IPCC). Climate change 2014: Impacts, Adaptation, and Vulnerability. Part A: Global and sectoral aspects. Contribution of Working Group II to the Fifth Assessment Report of the Intergovernmental Panel on Climate Change; Cambridge University Press: Cambridge, UK; New York, NY, USA, 2014; ISBN 978-1-107-64165-5. [Google Scholar]
- Sutherst, R.; Bourne, A. Modelling non-equilibrium distributions of invasive species: A tale of two modelling paradigms. Biol. Invasions 2009, 11, 1231–1237. [Google Scholar] [CrossRef]
- Gilman, S.E.; Urban, M.C.; Tewksbury, J.; Gilchrist, G.W.; Holt, R.D. A framework for community interactions under climate change. Trends Ecol. Evol. 2010, 25, 325–331. [Google Scholar] [CrossRef] [PubMed]
- Gutierrez, A.P.; Ponti, L. Eradication of invasive species: Why the biology matters. Environ. Entomol. 2013, 42, 395–411. [Google Scholar] [CrossRef] [PubMed]
- Gutierrez, A.P.; Williams, D.W.; Kido, H. A model of grape growth and development: The mathematical structure and biological considerations. Crop Sci. 1985, 25, 721–728. [Google Scholar] [CrossRef]
- Wermelinger, B.; Baumgärtner, J.; Gutierrez, A.P. A demographic model of assimilation and allocation of carbon and nitrogen in grapevines. Ecol. Model. 1991, 53, 1–26. [Google Scholar] [CrossRef]
- Gutierrez, A.P.; Ponti, L.; Cooper, M.L.; Gilioli, G.; Baumgärtner, J.; Duso, C. Prospective analysis of the invasive potential of the European grapevine moth Lobesia botrana (Den. & Schiff.) in California. Agric. For. Entomol. 2012, 14, 225–238. [Google Scholar] [CrossRef]
- Gutierrez, A.P.; Ponti, L.; Hoddle, M.; Almeida, R.P.P.; Irvin, N.A. Geographic distribution and relative abundance of the invasive glassy-winged sharpshooter: Effects of temperature and egg parasitoids. Environ. Entomol. 2011, 40, 755–769. [Google Scholar] [CrossRef] [PubMed]
- Rigamonti, I.E.; Jermini, M.; Fuog, D.; Baumgärtner, J. Towards an improved understanding of the dynamics of vineyard-infesting Scaphoideus titanus leafhopper populations for better timing of management activities. Pest Manag. Sci. 2011, 67, 1222–1229. [Google Scholar] [CrossRef] [PubMed]
- Gutierrez, A.P.; Daane, K.M.; Ponti, L.; Walton, V.M.; Ellis, C.K. Prospective evaluation of the biological control of vine mealybug: Refuge effects and climate. J. Appl. Ecol. 2008, 45, 524–536. [Google Scholar] [CrossRef]
- González-Domínguez, E.; Caffi, T.; Ciliberti, N.; Rossi, V. A mechanistic model of Botrytis cinerea on grapevines that includes weather, vine growth stage, and the main infection pathways. PLoS ONE 2015, 10, e0140444. [Google Scholar] [CrossRef] [PubMed]
- Gutierrez, A.P.; Baumgärtner, J.U. Multitrophic level models of predator-prey energetics: I. Age-specific energetics models—Pea aphid Acyrthosiphon pisum (Homoptera: Aphididae) as an example. Can. Entomol. 1984, 116, 924–932. [Google Scholar] [CrossRef]
- Gutierrez, A.P. The physiological basis of ratio-dependent predator-prey theory: The metabolic pool model as a paradigm. Ecology 1992, 73, 1552–63. [Google Scholar] [CrossRef]
- Regev, U.; Gutierrez, A.P.; Schreiber, S.J.; Zilberman, D. Biological and economic foundations of renewable resource exploitation. Ecol. Econ. 1998, 26, 227–242. [Google Scholar] [CrossRef]
- Gutierrez, A.P.; Regev, U. The bioeconomics of tritrophic systems: Applications to invasive species. Ecol. Econ. 2005, 52, 383–396. [Google Scholar] [CrossRef]
- Gutierrez, A.P.; Ponti, L. Assessing and managing the impact of climate change on invasive species: The PBDM approach. In Invasive Species and Global Climate Change; Ziska, L.H., Dukes, J.S., Eds.; CABI Publishing: Wallingford, UK, 2014; pp. 271–288. [Google Scholar]
- Pemsl, D.E.; Gutierrez, A.P.; Waibel, H. The economics of biotechnology under ecosystem disruption. Ecol. Econ. 2008, 66, 177–183. [Google Scholar] [CrossRef]
- Gutierrez, A.P.; Ponti, L.; Herren, H.R.; Baumgärtner, J.; Kenmore, P.E. Deconstructing Indian cotton: Weather, yields, and suicides. Environ. Sci. Eur. 2015, 27, 12. [Google Scholar] [CrossRef]
- Gutierrez, A.P.; Mills, N.J.; Schreiber, S.J.; Ellis, C.K. A physiologically based tritrophic perspective on bottom-up-top-down regulation of populations. Ecology 1994, 75, 2227–2242. [Google Scholar] [CrossRef]
- Gutierrez, A.P.; Gilioli, G.; Baumgärtner, J. Ecosocial consequences and policy implications of disease management in East African agropastoral systems. Proc. Natl. Acad. Sci. USA 2009, 106, 13136–13141. [Google Scholar] [CrossRef] [PubMed]
- Gutierrez, A.P.; Ponti, L. Bioeconomic sustainability of cellulosic biofuel production on marginal lands. Bull. Sci. Technol. Soc. 2009, 29, 213–225. [Google Scholar] [CrossRef]
- Gutierrez, A.P.; Ponti, L.; d’Oultremont, T.; Ellis, C.K. Climate change effects on poikilotherm tritrophic interactions. Clim. Chang. 2008, 87, S167–S192. [Google Scholar] [CrossRef]
- Ponti, L.; Gutierrez, A.P.; Basso, B.; Neteler, M.; Ruti, P.M.; Dell’Aquila, A.; Iannetta, M. Olive agroecosystems in the Mediterranean Basin: Multitrophic analysis of climate effects with process-based representation of soil water balance. Procedia Environ. Sci. 2013, 19, 122–131. [Google Scholar] [CrossRef]
- Neteler, M. Estimating daily Land Surface Temperatures in mountainous environments by reconstructed MODIS LST data. Remote Sens. 2010, 2, 333–351. [Google Scholar] [CrossRef]
- Metz, M.; Rocchini, D.; Neteler, M. Surface temperatures at the continental scale: Tracking changes with remote sensing at unprecedented detail. Remote Sens. 2014, 6, 3822–3840. [Google Scholar] [CrossRef]
- Artale, V.; Calmanti, S.; Carillo, A.; Dell’Aquila, A.; Hermann, M.; Pisacane, G.; Ruti, P.M.; Sannino, G.; Striglia, M.V.; Giorgi, F.; Bi, X.; Pal, J.S.; Rauscher, S. An atmosphere-ocean regional climate model for the Mediterranean area: Assessment of a present climate simulation. Clim. Dyn. 2010, 35, 721–740. [Google Scholar] [CrossRef]
- Dell’Aquila, A.; Calmanti, S.; Ruti, P.; Struglia, M.V.; Pisacane, G.; Carillo, A.; Sannino, G. Effects of seasonal cycle fluctuations in an A1B scenario over the Euro-Mediterranean region. Clim. Res. 2012, 52, 135–157. [Google Scholar] [CrossRef]
- Bivand, R. Using the R–Grass interface: Current status. OSGeo J. 2007, 1, 36–38. [Google Scholar]
- Monfreda, C.; Ramankutty, N.; Foley, J.A. Farming the planet: 2. Geographic distribution of crop areas, yields, physiological types, and net primary production in the year 2000. Glob. Biogeochem. Cycles 2008, 22, GB1022. [Google Scholar] [CrossRef]
- European Environment Agency (EEA). Corine Land Cover 2000 Raster Data. Available online: https://www.eea.europa.eu/ds_resolveuid/DAT-79-en (accessed on 20 June 2017).
- Tominski, C.; Fuchs, G.; Schumann, H. Task-driven color coding. In Proceedings of the 2008 12th International Conference Information Visualisation, London, UK, 9–11 July 2008; pp. 373–380. [Google Scholar] [CrossRef]
- Food and Agriculture Organization of the United Nations (FAO). AGRO-MAPS; FAO: Rome, Italy, 2012. [Google Scholar]
- Giorgi, F.; Bi, X. Updated regional precipitation and temperature changes for the 21st century from ensembles of recent AOGCM simulations. Geophys. Res. Lett. 2005, 32, L21715. [Google Scholar] [CrossRef]
- International Organisation of Vine and Wine (OIV). OIV Statistical Report on World Vitiviniculture; International Organisation of Vine and Wine: Paris, France, 2017. [Google Scholar]
- Bindi, M.; Fibbi, L.; Gozzini, B.; Orlandini, S.; Miglietta, F. Modelling the impact of future climate scenarios on yield and yield variability of grapevine. Clim. Res. 1996, 7, 213–224. [Google Scholar] [CrossRef]
- Fraga, H.; García de Cortázar Atauri, I.; Malheiro, A.C.; Santos, J.A. Modelling climate change impacts on viticultural yield, phenology and stress conditions in Europe. Glob. Change Biol. 2016, 22, 3774–3788. [Google Scholar] [CrossRef] [PubMed]
- Mozell, M.R.; Thach, L. The impact of climate change on the global wine industry: Challenges & solutions. Wine Econ. Policy 2014, 3, 81–89. [Google Scholar] [CrossRef]
- Moriondo, M.; Ferrise, R.; Trombi, G.; Brilli, L.; Dibari, C.; Bindi, M. Modelling olive trees and grapevines in a changing climate. Environ. Model. Softw. 2015, 72, 387–401. [Google Scholar] [CrossRef]
- Wickham, H. Ggplot2: Elegant Graphics for Data Analysis; Springer: New York, NY, USA, 2009. [Google Scholar]
- Brewer, C.A. ColorBrewer: Color Advice for Maps. Available online: http://colorbrewer2.org/ (accessed on 19 June 2017).
- Ponti, L.; Gilioli, G.; Biondi, A.; Desneux, N.; Gutierrez, A.P. Physiologically based demographic models streamline identification and collection of data in evidence-based pest risk assessment. EPPO Bull. 2015, 45, 317–322. [Google Scholar] [CrossRef]
- Bournier, A. Grape insects. Annu. Rev. Entomol. 1977, 22, 355–376. [Google Scholar] [CrossRef]
- Flaherty, D.L.; Jensen, F.; Kasimatis, A.; Kido, H.; Moller, W. Grape Pest Management; Agricultural Sciences Publications, University of California: Berkeley, CA, USA, 1981. [Google Scholar]
- Ragusa, S.; Tsolakis, H. (Eds.) La Difesa Della Vite Dagli Artropodi Dannosi; Università degli Studi di Palermo: Palermo, Italy, 2006. [Google Scholar]
© 2018 by the authors. Licensee MDPI, Basel, Switzerland. This article is an open access article distributed under the terms and conditions of the Creative Commons Attribution (CC BY) license (http://creativecommons.org/licenses/by/4.0/).

