Article

Future Water Availability from Hindukush-Karakoram-Himalaya upper Indus Basin under Conflicting Climate Change Scenarios

by
Shabeh ul Hasson
1,2
1
CEN, Institute of Geography, University of Hamburg, Hamburg 20146, Germany
2
Department of Space Sciences, Institute of Space Technology, Islamabad 44000, Pakistan
Climate 2016, 4(3), 40; https://doi.org/10.3390/cli4030040
Submission received: 24 May 2016 / Revised: 1 August 2016 / Accepted: 12 August 2016 / Published: 26 August 2016
(This article belongs to the Special Issue Impact of Climate Change on Water Resources)

Abstract

:
Future of the crucial Himalayan water supplies has generally been assessed under the anthropogenic warming, typically consistent amid observations and climate model projections. However, conflicting mid-to-late melt-season cooling within the upper Indus basin (UIB) suggests that the future of its melt-dominated hydrological regime and the subsequent water availability under changing climate has yet been understood only indistinctly. Here, the future water availability from the UIB is presented under both observed and projected—though likely but contrasting—climate change scenarios. Continuation of prevailing climatic changes suggests decreased and delayed glacier melt but increased and early snowmelt, leading to reduction in the overall water availability and profound changes in the overall seasonality of the hydrological regime. Hence, initial increases in the water availability due to enhanced glacier melt under typically projected warmer climates, and then abrupt decrease upon vanishing of the glaciers, as reported earlier, is only true given the UIB starts following uniformly the global warming signal. Such discordant future water availability findings caution the impact assessment communities to consider the relevance of likely (near-future) climate change scenarios—consistent to prevalent climatic change patterns—in order to adequately support the water resource planning in Pakistan.

1. Introduction

Since the agrarian economy of Pakistan largely depends upon highly seasonal water supplies from the Hindukush-Karakoram-Himalayan (HKH) watersheds of the Indus basin, a pragmatic assessment of future water availability from these watersheds is utmost necessary for ensuring the sustainable socio-economic development in the country. The issue of future water availability from these HKH watersheds has further been accentuated in the wake of recent acceleration of climate change [1] and now established amplified warming over high altitudes [2,3]; thus substantial changes in the existing cryosphere and subsequently in the melt runoff regime are anticipated, threatening the overall hydrological equilibrium upstream and exacerbating the water management problems downstream. It is, therefore, fundamental to investigate the likely impacts of climate change on the future water availability from the HKH watersheds, particularly from the upper Indus basin (UIB—Figure 1) that contributes around half (2405 m 3 · s 1 ) [4] of the surface water availability in Pakistan, warranting a life to the immediate downstream Tarbela reservoir—a largest water storage structure in the country.
Only few studies have been performed in this regard that consistently suggest an increased future water availability from the UIB. For instance, the snow runoff model forced with SRES A2 climate change projections (2071–2100) from the PRECIS (Providing Regional Climates for Impact Studies) regional climate model (RCM) suggests a month-early snowmelt runoff peak, rise in glacier melt and rainfall runoffs and increase in the overall water availability by 7% [5]. Similarly, the cryospheric-hydrological model driven with the climate change scenarios of representative concentration pathways (RCPs) 4.5 and 8.5 from the coupled model intercomparison project phase 5 (CMIP5) experiments has simulated an increased water availability at least until mid-21st century due to accelerated melting [6]. Forcing the UBC (University of British Columbia) watershed model with the climate change projections from the Conformal-Cubic Atmospheric (CCAM) model and the ICTP regional climate model (RegCM) under RCP4.5 and RCP8.5 scenarios also suggests 50% and 80% increases in the water availability by mid to end of 21st century, respectively [7]. Further, the UBC watershed model driven with the projections from PRECIS RCM under A2 and B2 climate change scenarios simulates likewise an increased water availability by around 60% and 35% till 2050s, respectively [8].
The above mentioned studies, and additionally those, focusing on the water availability from the sub-basins of the UIB [9,10,11,12,13,14], obtain the climate change information from the present-day global or regional climate models (GCMs/RCMs) that project a consistent warming for present and future climates under anthropogenic forcing [15,16]. In contrast, the UIB has been reported to deciphering climatic changes that are discordant to the anthropogenic warming signals. For instance, observations from the few valley-bottom meteorological stations suggest that the UIB features mid-to-late melt (monsoon) season cooling throughout the second half of the 20th century [17,18,19]. Such cooling phenomenon from the valley bottom stations has also been observed over recent three decades (1980–2009) [20,21,22]. Lately, a comprehensive and systematic view of the prevailing climatic changes from the novel high-altitude observations (1995–2012), together with the updated valley-bottom stations record (1961–2012) confirms that the mid-to-late melt season cooling not only continues but is more profound during recent decades [4]. On an extended retrospective timescale, the analysis of tree ring based paeleoclimatic temperature reconstructions also reveals that the Karakoram temperature changes consistently conflicted to the hemispheric temperature trends for past half millennium [23].
Interestingly, the observed hydrocryospheric changes in the UIB are quite consistent with the summer cooling phenomenon, and to somewhat, with the present state of increasing moisture accumulation as analyzed from the station record [4,18,21,22,24]. For instance, analyses of daily to weekly MODIS snow cover products for early 21st century indicate an increasing extent of the snow cover over the UIB, over its sub-basins and over the abode Central Karakoram National Park (CKNP) [20,22,25,26]. Similarly, analysis of the daily MODIS snow product for the 2001–2012 period reveals a falling tendency of the regional end-of-summer snow line altitudes for the UIB and for its sub-basins, indicating an overall positive change in the high-altitude water resources therein [25]. Further, the glaciological studies and the analyses of remotely-sensed data reveal that the overall glacial extent within the UIB and its sub-regions is observed to be somewhat stagnant since 1980s [20,22,27,28,29,30]. In addition to stable glacial extent, balanced or slightly positive geodetic mass balance of the UIB glaciers has also been consistently observed, particularly since the beginning of 21st century [27,31,32,33,34,35]. Subsequently, the hydrometric observations indicate decreasing melt season discharges from the UIB and its sub-basins [4,17,19,36], which is also consistent with the observed cooling phenomenon [4]. The continuation of discordant observed cooling for the melt-dominated hydrological regime of the UIB together with subsequent consistent responses from the abode cryosphere implies a broader spectrum of climatic uncertainty over the UIB, of which the climate change projections from the climate models merely serve a warming direction. In view of such observed hydro-cryo-climatic responses, it has been argued that the typical climate change scenarios—representing warming and glacier depletion—are irrelevant for assessing the near-future water availability from the UIB and that such scenarios are subject to a far future, if at all [25]. Hence, aforementioned studies assess the future water availability from the UIB [5,6,7,8] or from its sub-basins [9,10,11,12,13,14] by addressing only partially the future climatic uncertainty.
Addressing a broader spectrum of climatic uncertainty over the UIB, this study assesses the future changes in the hydrological regime and the subsequent water availability from the UIB under two contrasting climate change scenarios: (1) one representing the continuation of observed mid-to-late (spring to early) melt season cooling (warming) and stable glacial extent till near-future, and; (2) one suggesting consistent warming as projected by seven fine scale (0.44°) CORDEX-SA experiments under the extreme emissions scenario of RCP8.5, together with intact-, 50%- and no-glacier cover. These climate change scenarios are forced to a less-data-extensive semi-distributed watershed model from the University of British Columbia (UBC). A semi-distributed model is advantageous in terms of its higher predictive skill and smaller parametric uncertainty than that of the fully distributed models in a data scarce region, as of the UIB [37]. The UBC watershed model [38] has been setup for the UIB up to Besham Qila site with the best possible description of geophysical features, and has been driven for roughly two decades using the most representative high-altitude observations. Since the UBC model distinctly calculates snowmelt, glacial melt and rainfall runoff components, their changes under two likely but contrasting climate change scenarios have been assessed here. Thus, taking into account a wider spectrum of climatic uncertainty over the UIB, the study provides crucial information for the better management of future water resources, and supports in revisiting the near future plans for agriculture production and power generation in Pakistan.

2. Study Area

The UIB is located within the geographical range of 31–37 N and 72–82 E, covering an area of 162,393 km 2 up to the Besham Qila gauging site (Figure 1). The basin hosts three gigantic massifs—western Himalaya at lower latitudes of the basin, Karakoram Range in further north (Trans-Himalayas), and Hindu Kush Range in the west of Karakoram-Himalaya ranges. These ranges collectively host more than 13,000 glaciers covering 19,370 km 2 (roughly 12%) of the basin area where the Karakoram Range hosts most of the ice reserves [31,39]. The mean annual snow cover varies between 3%–67% [25]. The complex HKH terrain abode, sizeable horizontal and vertical extents and moisture inputs from two distinct large-scale circulation modes—westerly disturbances and summer monsoon—play a significant role in morphing the assorted hydrological regimes of the basin [4]. Accordingly to defined hydrological regimes [40], a high flow regime of the UIB (April–September) can further be categorized into mountain nival and mountain glacial melt regimes, which observe their peak discharges during late-spring/early-summer and during late-summer, respectively. The snowmelt dominates in early part of the melt season while the glacier melt dominates for the rest of melt season. During the low flow period (October–March), the runoff comprises of mainly the groundwater component. The overall melt water contribution from the UIB exceeds 70%–80% of its total runoff yield [5,41]. The nival regime markedly depends upon the accumulated precipitation during previous season while the concomitant temperatures largely drive the glacial regime [42]. These regimes are mainly nourished by the solid moisture input from the western disturbances during winter and spring seasons [31,43,44,45,46,47]. During the summer monsoon period (July–September), the monsoonal incursions also bring considerable moisture at higher (lower) elevations in solid (liquid) form [24,43,44]. Such moisture input is anomalously higher during the positive phase of the North Atlantic Oscillation (NAO) and during the warm phase of the El Niño-Southern Oscillation (ENSO) [48,49].

3. Data Used

The UIB hosts more than twelve high-altitude (above 2200 m asl) automated and six relatively low-altitude (below 2200 m asl) manual valley-bottom weather stations, featuring a medium-to-long term record lengths [4,25]. In order to calibrate and validate the UBC watershed model, the meteorological observations from three high-altitude stations, namely Naltar, Hushe and Khunjrab at the elevation of 2898, 3075 and 4440 m asl, respectively, have been obtained from the snow and ice hydrology project (SIHP) of the water and power development authority (WAPDA), Pakistan (Table 1). The meteorological observations from these stations include daily values of temperature maximum (Tmax), temperature minimum (Tmin), and total precipitation (P) for the period 1995–2012. The considered meteorological stations: (1) feature relatively complete set of record for the investigated period; (2) cover possible far east-west extent of the Karakoram cryosphere; (3) spread well across most of the active hydrologic altitudinal range of the UIB (2500–5500 m asl) [41]; (4) and required a relatively less calibration effort.
The same set of stations has been used for devising a hypothetical near-future (2013–2030) climate change scenario. While for the far-future climate change scenario (2087–2097), the outputs of seven fine-scale (0.44 ) CORDEX-SA experiments that are obtained by dynamically downscaling six CMIP5 coupled climate models using three different RCMs (CCAM, RCA4 and REMO) for a high-end emissions scenario of RCP8.5 have been used (Table 2). For comparing simulated discharge with observations, daily stream flow record for the Besham Qila gauge was obtained from the surface water hydrology project (SWHP) of WAPDA for the period 1969–2012.
The watershed description parameters were estimated from the freely available databases. For instance, a lately available one arc-second (30 m) global digital elevation model (DEM) of the shuttle radar topographic mission (SRTM) was obtained from the USGS database. Similarly, the forest cover and forest canopy density datasets were obtained from the United Nations Environment Programme (UNEP) Environmental Data Explorer, as compiled from USGS/NASA—Distributed Active Archive Center [50]. The glacier cover was extracted from the lately released Version 5.0 of the Randolf Glacier Inventory (RGI5) [39].

4. Methods

4.1. Hydrological Model

Originally developed for the mountainous watersheds around 3–4 decades ago and being continuously updated since then, the UBC is a conceptual, continuous, deterministic, and semi-distributed energy-balance model [38]. In view of scarce data availability within the mountainous watersheds, as in case of the present study area, the UBC takes minimum set of point observations (Tmax, Tmin and P) together with geophysical watershed characteristics in order to reproduce the hydrological response at hourly and daily time scales. Since the vertical gradients of hydroclimatic parameters are key factors in determining the hydrological behavior of a watershed, model divides the watershed possibly into twelve elevation zones, within which all hydro-meteo-climatic conditions are assumed to be homogeneous. The UBC implements a simplified energy balance approach for the snowmelt. In this regard, the requisite parameters, such as, cloud cover, wind speed and albedo are estimated from the temperature record based upon the relationships established from the field investigations performed within the Karakoram-Himalaya region under the SIHP, WAPDA project [51]. This specialty of the UBC model along with the afore-mentioned features makes its application highly suitable for the Himalayan environment.
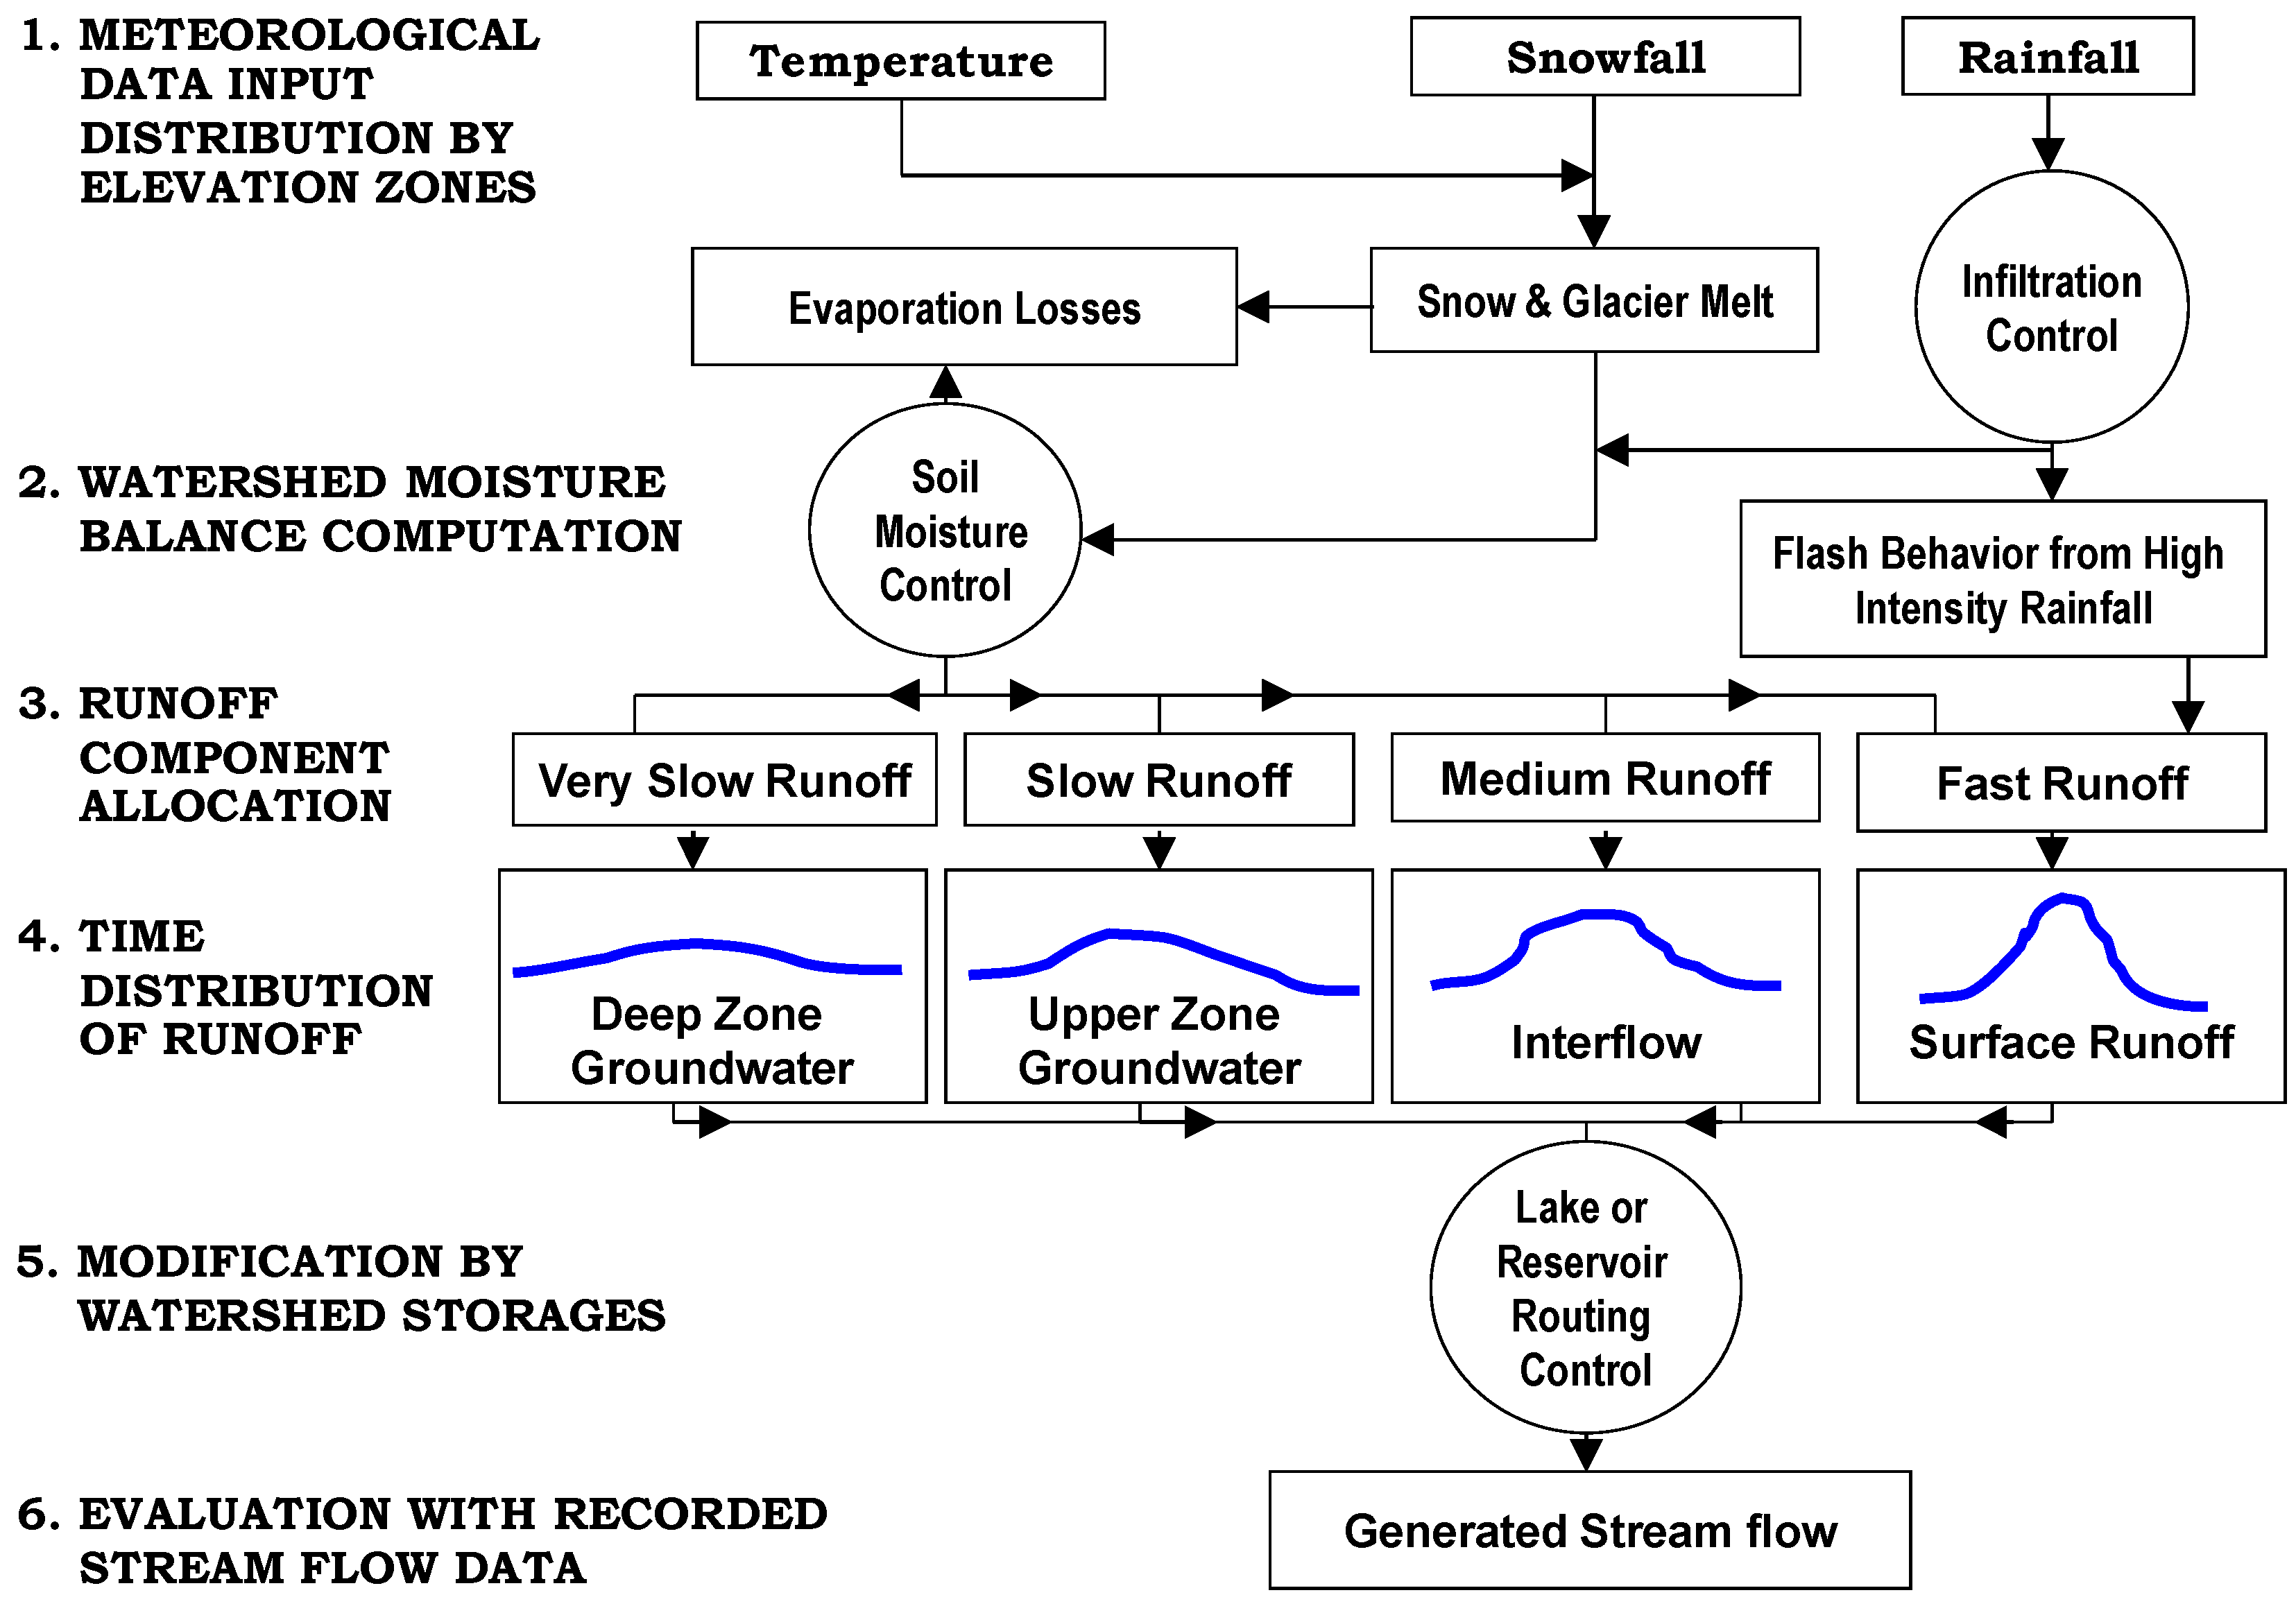
The model melts the accumulated snowpack and the existing glaciers based on available energy, and provides discrete runoff contributions from snowmelt, glacier melt and rainfall. The generated runoff is subsequently allocated to fast, medium, slow and very slow runoff components by the soil moisture routine (Figure 2). For instance, after accounting for interception and sublimation losses, an amount of water reaching the surface is divided into fast (surface) runoff and infiltrated water, based upon the impermeable area that varies according to saturation conditions. Considering soil moisture deficit under evaporative demands, the infiltrated water is further divided into groundwater and interflow (medium runoff) components. The groundwater is allocated to upper (slow runoff) and deep (very slow runoff) zones based on a predefined percolation coefficient. The model applies a water-conserved linear reservoir approach for routing the runoff from each component towards the watershed outlet. The snow accumulation and melt routines are described in Appendix whereas for details about other components of the UBC model, earlier studies [51,52,53] are referred.

4.2. Model Setup, Calibration and Validation

4.2.1. Model Setup

The UIB drainage area has been delineated up to the Besham Qila site by applying a GIS-based automated delineation procedure on a 30 m SRTM DEM. The automated delineation procedure erroneously includes the adjoining northeast watershed of Pangong Tso, which is in fact a closed basin as suggested by now substantial geological evidence [54,55]. Excluding the Pangong Tso watershed, the UIB drainage area was estimated as 165,515 km 2 , which is quite in line with the SWHP, WAPDA estimates (i.e., 162,393 km 2 ). The details of actual delineation of the UIB considered here along with the implications of its overestimated drainage area on modeling runoff are given in [56].
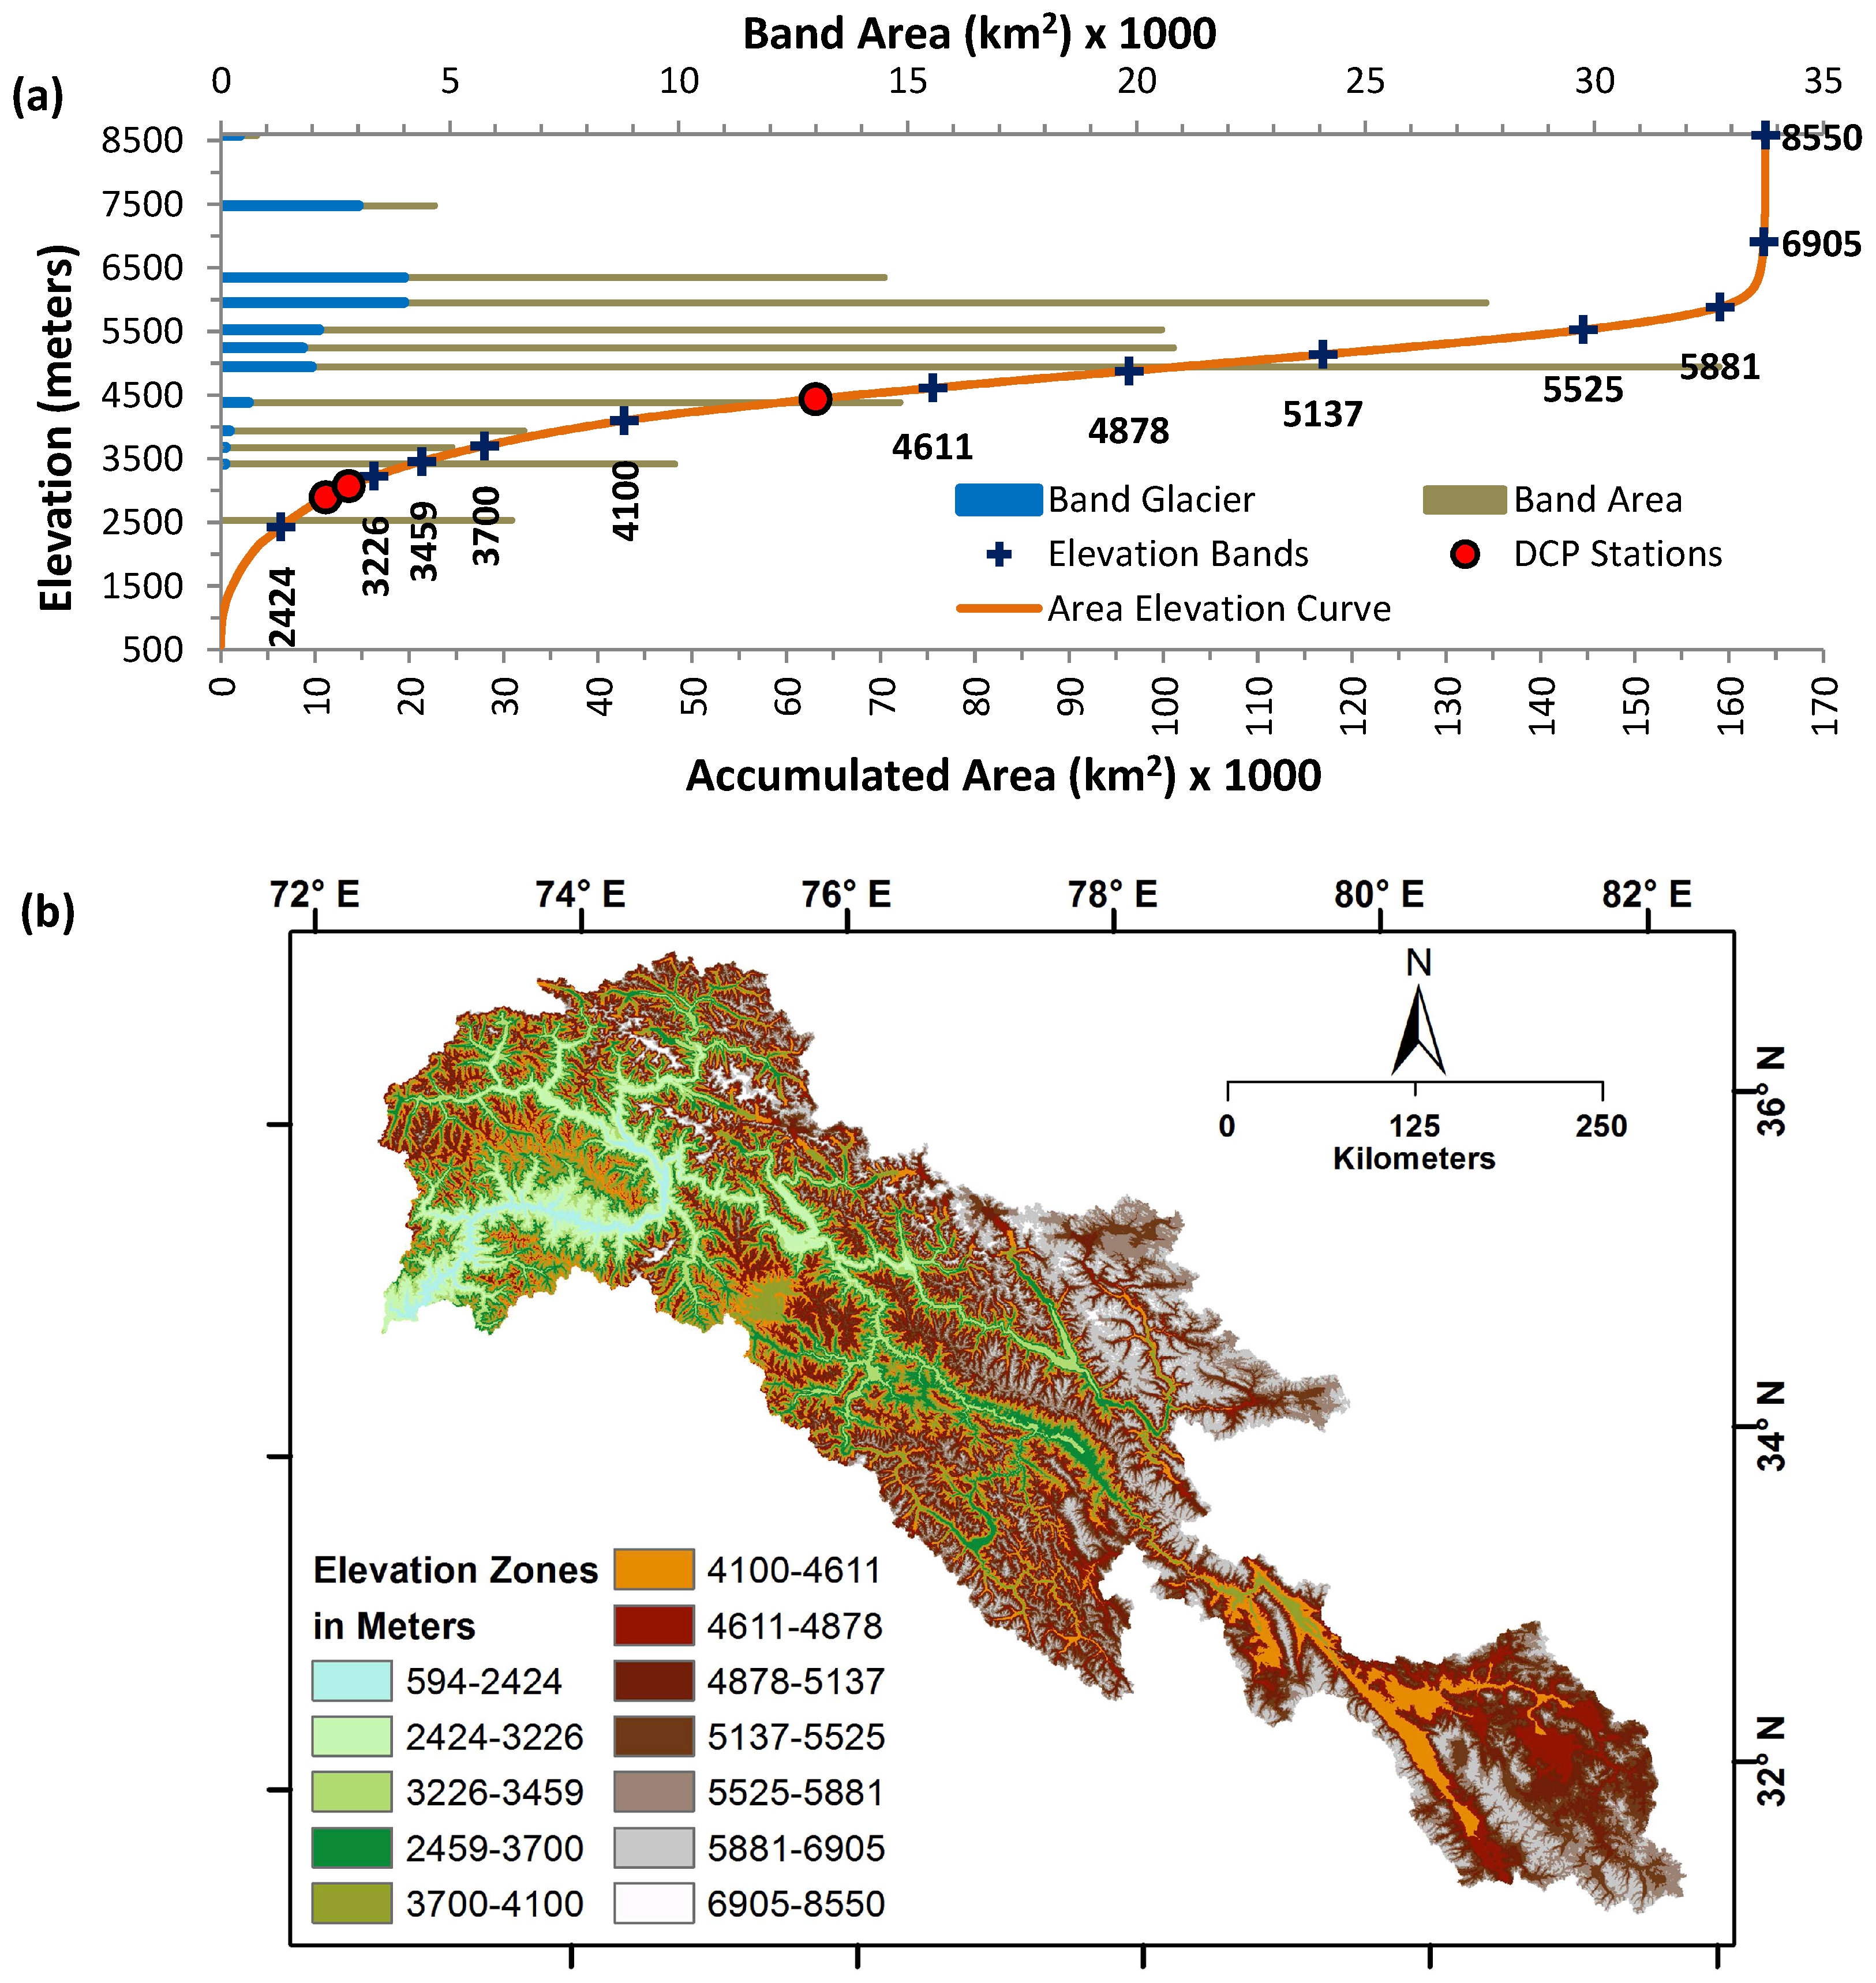
In view of a large vertical extent of the UIB (594–8550 m asl), the basin was divided into twelve maximum possible elevation zones (bands) based on the area elevation curve (AEC) that was developed from the 30 m SRTM DEM. Figure 3 shows the demarcation of 12 elevation bands on AEC, their glacial coverage, and altitudes of meteorological stations used for model calibration. For each elevation band, the geophysical parameters, such as, total surface and glaciated areas along with their north-south orientations (0–1), forest cover and canopy density as well as mean elevations are estimated from the respective datasets (Table 3).
The UBC model allows adjustments to more than 90 parameters, of which usually 17 parameters of precipitation distribution and its adjustments, and of water allocation and its routing need to be calibrated while the rest take preset standard values. For the precipitation distribution within the UIB, a strong positive vertical gradient has been suggested by various studies [13,43,57,58]. Instead, station observations suggest a negative precipitation gradient along an elevation increase. In fact deriving vertical precipitation lapse rate from a very sparse meteorological network within the complex terrain of HKH is extremely difficult, particularly when basin areas along the latitudinal and longitudinal transects come under the influence of either completely distinct or combination of active large scale precipitation regimes.
Few field campaigns have suggested that the maximum precipitation within the UIB occurs roughly between 5000 and 6000 m asl [27,31,43,58,59,60,61], where it becomes five to ten fold [27,61] and then decreases above such elevation range. Since, no long-term record is available above 4400 m asl, so far, observed precipitation datasets are neither fully representative of the basin discharge nor the glacial nourishment [10,42,62,63]. Based on glacier mass balance proxy, a first-order approximation of the vertical precipitation lapse rate for the western Karakoram has been reported to be around 0.21 % ± 12 % at the height of 5500 m asl [63]. Knowing the facts that large number of the UIB glaciers lying within the high-relief HKH ranges are mainly nourished by avalanche activities [31] and that the lapse rate is estimated only for a part of the UIB [63], there exists a huge uncertainty of precipitation distribution. Since the UBC allows the implementation of multiple elevation barriers in order to better describe the orographic precipitation variability, the height of such barriers and their vertical precipitation lapse rates were set by generalizing the available findings [27,61,63]. The first barrier, E 0 L M I D was set at 3000 m asl while the second barrier, E 0 L H I was set at 6000 m asl. The range between these two barriers covers most of the vertical extent of the glaciated area (Figure 3). The vertical precipitation lapse rate was set to 0.10% [27,61] for the elevation range below E 0 L M I D height, and to 0.31% and −0.40% for up to and above E 0 L H I heights, respectively [63].
The debris-covered glaciers are very common within the UIB [64,65]. Modelling the ablation from such debris-covered ice requires mapping of its extent, estimation of debris thickness and consideration of debris material composition [57]; former two are mainly considered in the modeling process. Presently, these estimates are not available for the whole UIB and estimating them from the remotely sensed datasets at such a large scale is nontrivial [66]. Investigating glacier area of 3500 km 2 within the Hindukush-Karakoram region, a study reports roughly 20% of such area under the debris cover [28]. Investigation over more than 700 glaciers within the CKNP suggests that around 11% of the total glacier area (around 4600 km 2 ) is under the debris cover [67]. For the whole Hindukush-Karakoram, the supraglacial debris cover has generally been reported to be around 10% of the total glacier area [65]. Most recent estimates suggest that around 2000 km 2 of the total glacial extent of the whole Indus basin is under the debris cover [68]. Such estimates are in line with earlier studies [65,67] given the fact that debris-covered glaciers of the Indus basin are mainly present within the UIB. Therefore, the supraglacial debris cover from the studies [65,67,68] have been considered as reasonable estimates for the UIB. Such debris-covered glacial extent appears to be stable over time as either no or near-zero change has been reported for 93 Karakoram glaciers investigated over the 1977–2014 period [69]. Further, the analysis over more than 700 CKNP glaciers since early 21st century also suggests insignificant changes in the supraglacial debris extent [20,22].
The supraglacial debris have a variable thickness, which substantially influences the rate of ablation from the underlying ice [64]; the ablation is typically highest at around 1 cm (lowest above 40 cm) of the debris thickness as suggested by various studies within the UIB (Rakhiot glacier [70], Rakhiot and Barpu glaciers [71], Baltoro glacier [72], Hinarche glacier [57], Dokriani Glacier [64]). An increase in the ablation rate for up to 1 cm of debris thickness is due to the conduction of absorbed radiative heating to underlying ice, while its decrease for further increase in debris thickness is due to the insulation effects; for the average debris thickness, the overall rate of debris-covered ice ablation typically remains around 0.5 ± 0.1 of the clean ice ablation rate [57,64,70,71,72]. Modeling the ablation from debris-free and debris-covered glaciers over wider area of around 4600 km 2 within the CKNP has also suggested, on average, similar rates of debris-cover ice ablation relative to clean ice ablation [67]. Though the UBC model does not explicitly simulate the debris-covered ice ablation processes, however, their generalized implementation can be achieved through alternate mechanisms. For instance, the topographic parameters, such as orientation and slope affect the total ablation in a similar way the debris thickness does [72]. However, quantitative estimates of the influences of slope and orientation on the ablation rates are not available for the study basin. On the other hand, reducing the extent of debris-covered part of the glaciers proportional to the factor of their ablation reduction (relative to clean ice glaciers) is another alternate to implement the debris-covered ice ablation in the models, in view of their typical surface melting property. Thus, the debris-covered glacial extent of the UIB that is around 1937 km 2 (10% of the total UIB glacier cover) has been reduced by a typical factor of 0.5 from the lower elevation bands, assuming the average thickness of the debris [57,64,70,71,72]. Such a generalized approach for implementing the debris-covered ice ablation is quite feasible for a semi-distributed watershed model.

4.2.2. Calibration and Validation

A semi-automated optimization procedure together with the manual tuning was adopted to obtain the optimized values of calibration parameters within their predefined ranges. For sound evaluation of calibration and validation of the model simulations, the use of several efficiency criteria has been recommended [73]. In this regard, an objective function has been employed to assess the optimization (Equation (1)) together with four different shape and scale indices, such as, Nash-Sutcliffe Efficiency (NSE) [74], percentage volume error (%VE), root mean square error (RMSE) and weighted coefficient of determination (D). The NSE (Equation (2)) is a ratio of mean squared error (MSE) to the observed variance, subtracted from the unity. Ranging between (worst fit) and 1 (perfect fit), the NSE determines the scale and shape fit of the observed and simulated discharges. The %VE (Equation (3)) determines the scale fit, denoting a zero value as a perfect fit while positive and negative values as over- and under-estimations of the observed discharge, respectively. The RMSE (Equation (4)) with an optimal value of zero provides the residual between observed and simulated discharges. With an optimal value of 1, D (Equation 5) is a shape parameter, which determines the relationship between the simulated and the observed discharges. The simple D should not be used for error quantification since, relying only on the correlation, it can substantially overestimate the model efficiency [73]. Here, a weighted form of D was used that takes into account the slope, b, and intercept, a, and performs much better than D alone [73].
E O P T = N S E 1 V s i m V o b s
N S E = 1 i = 1 n ( Q o b s i Q s i m i ) 2 i = 1 n ( Q o b s i Q o b s ¯ ) 2
% V E = V s i m V o b s V o b s × 100
R M S E = i = 1 n ( Q o b s i Q s i m i ) 2 n
D = 1 i = 1 n ( Q o b s i ( b · Q s i m i + a ) ) 2 i = 1 n ( Q o b s i Q o b s ¯ ) 2
a = 1 n i = 1 n Q o b s i b i = 1 n Q s i m i
b = i = 1 n ( Q o b s i ) ( Q s i m i ) 1 n i = 1 n Q s i m i i = 1 n Q o b s i i = 1 n ( Q s i m i ) 2 1 n i = 1 n Q s i m i 2
where, V s i m and V o b s refer to simulated and observed flow volumes, while Q o b s i and Q s i m i are the observed and simulated discharges on day i, respectively. Q o b s ¯ refers to the mean observed discharge for the simulation period containing n number of days.

4.3. Climate Change Scenarios

4.3.1. Prevailing Hydro-Cryo-Climatic Changes

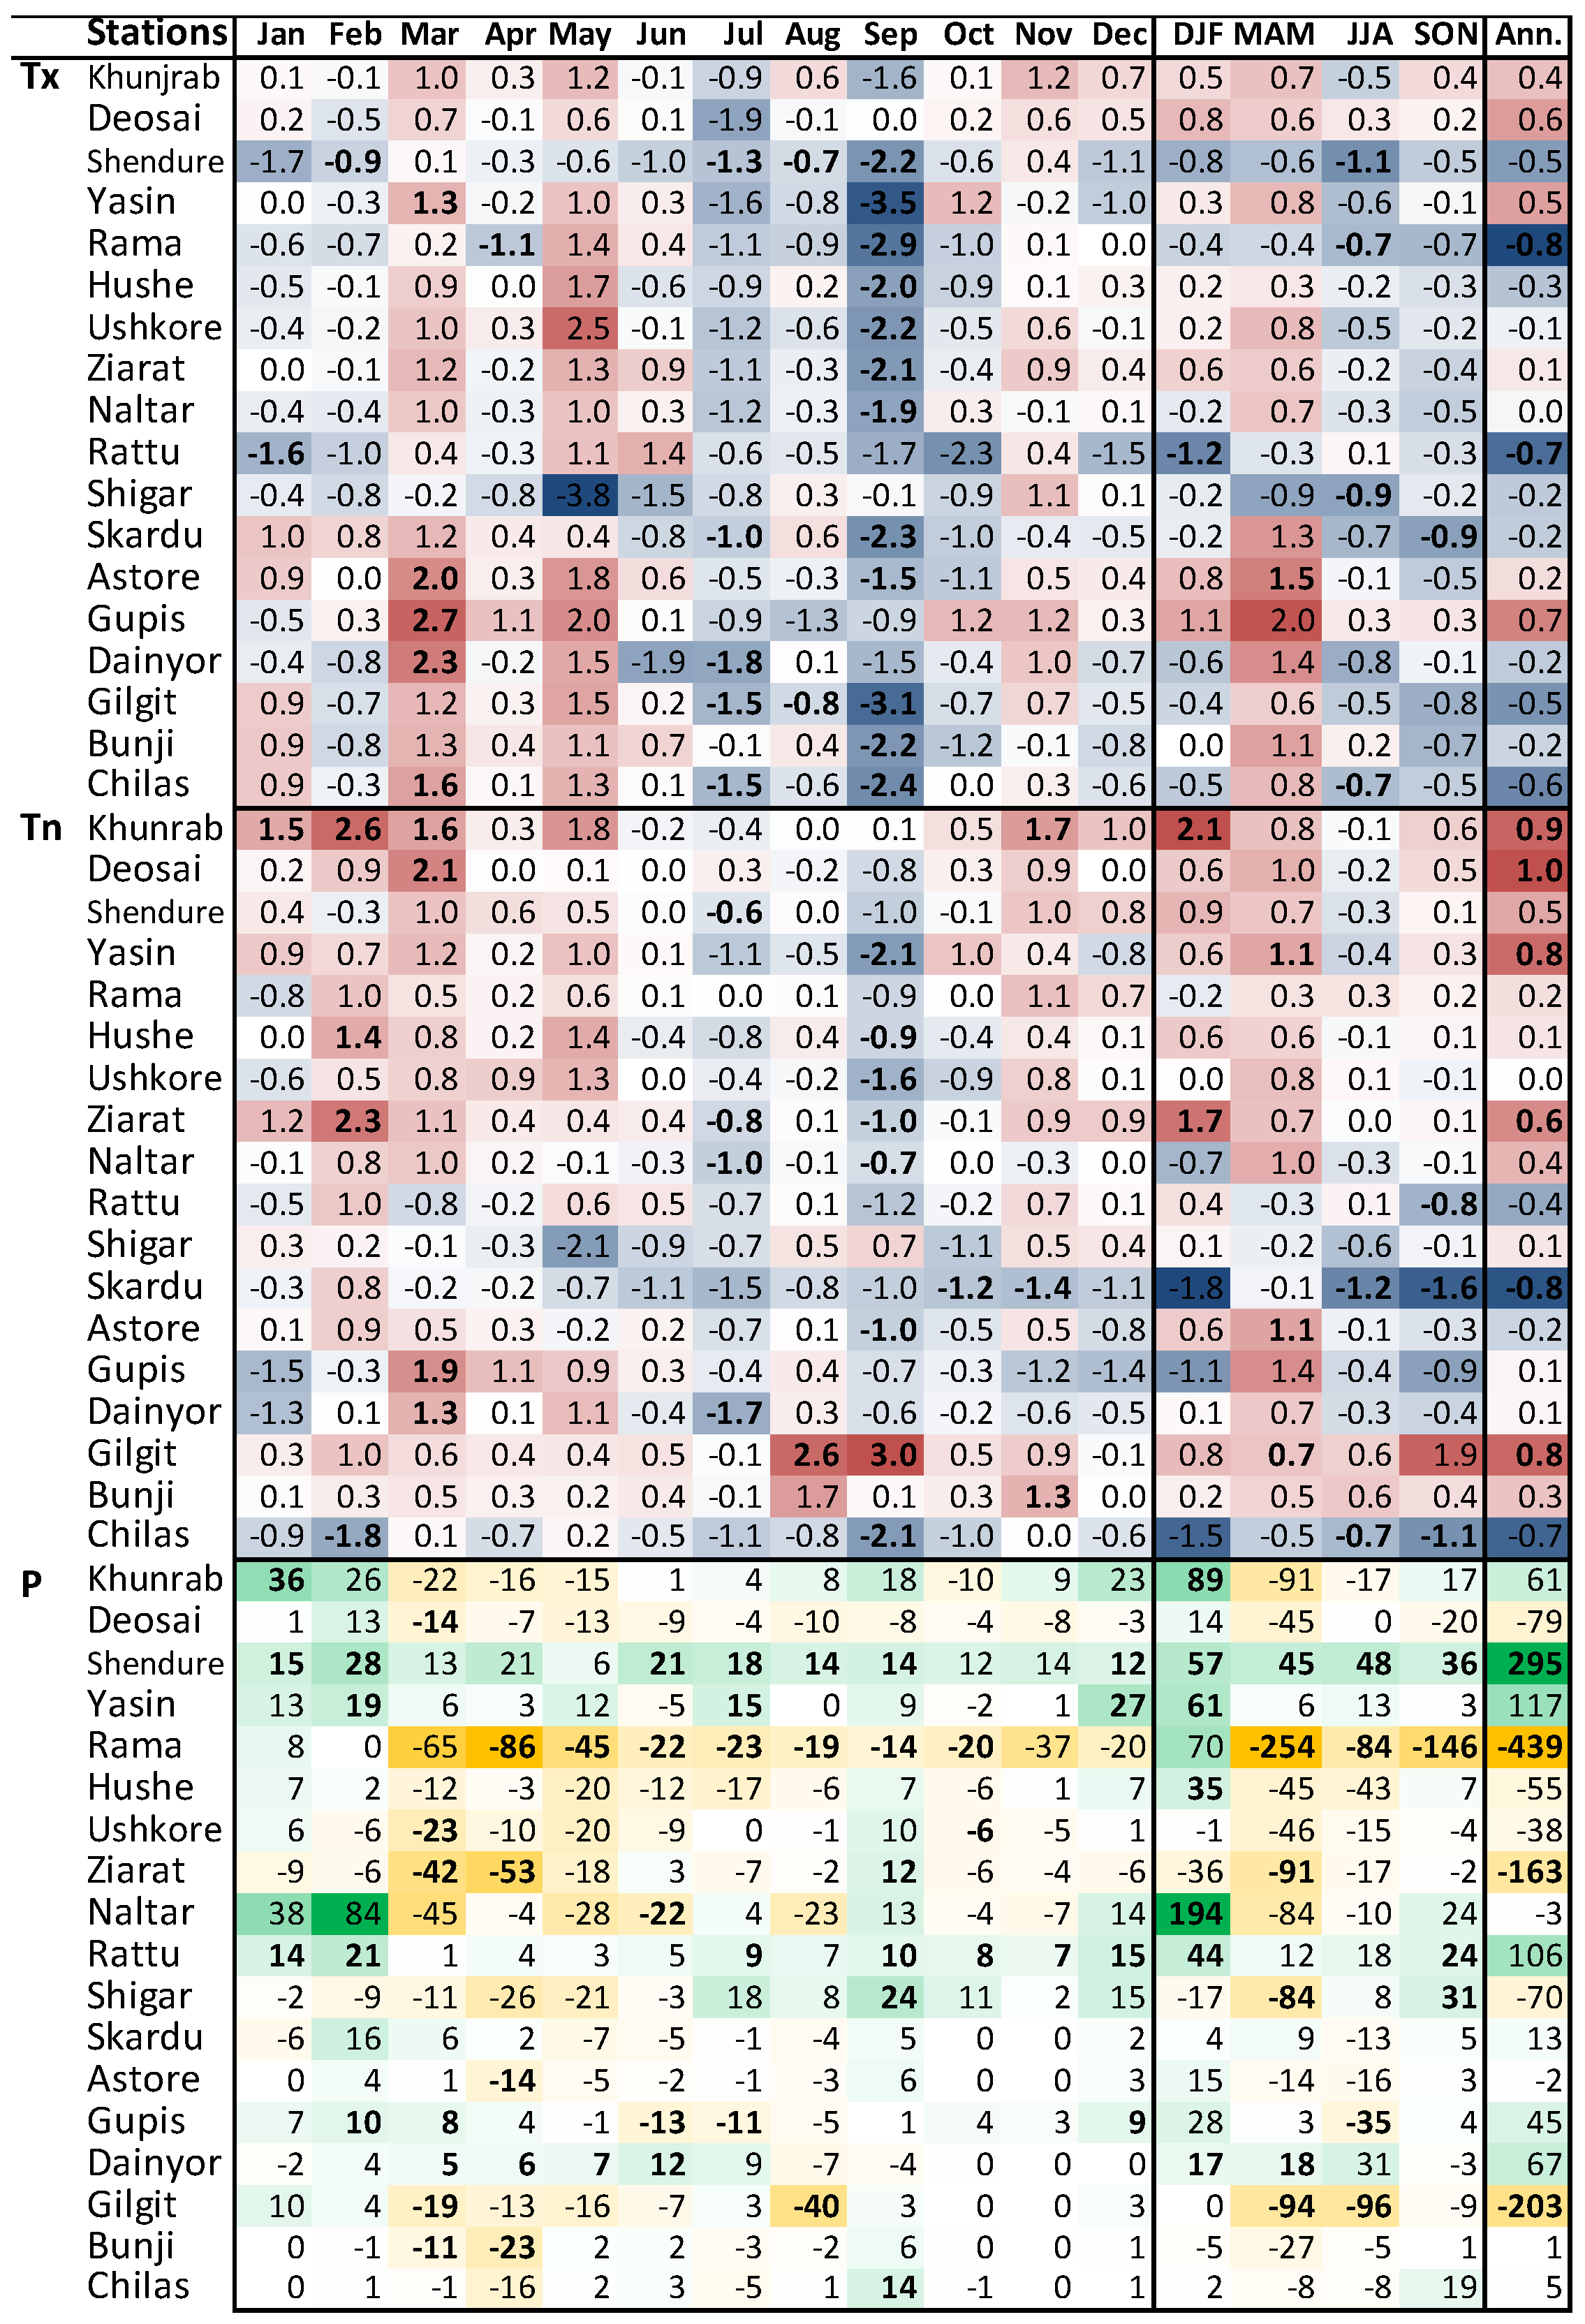
As mentioned afore in Section 1, there is now a substantial evidence that the UIB responses to the anthropogenic forcing are partly contrary to what has been observed over and across the neighboring regions and worldwide, and as projected by GCMs/RCMs under various emission scenarios. The rest observed changes that are consistent with a typical climate change signal mainly include a dominant spring warming and somewhat increase in winter precipitation [4,17,18,19]. Nevertheless, a summer cooling phenomenon is unique for the UIB with the present-day climate models being unable to represent it even at a qualitative scale [16]. In Tabular Figure 4, yet a complete picture of prevailing climatic changes is presented from all operational high- and low-altitude stations within the UIB after [4]. These changes exhibit significant cooling during the monsoon months, particularly in Tmax, where insignificant tendencies are also well agreed on a sign of change. For precipitation, most of the stations suggest an increase during the late summer monsoon (September) and winter (December to February) months.
Bearing in mind that the above-mentioned cooling is observed from a sparse station network, which is further confined to the political boundary of Pakistan, such cooling may only sporadically exist across the basin. Against this background, trends in discharge—that exhibit integrated response to the prevailing climatic changes over a basin—as well as changes in the glacial mass balances can supplement the sparse observational network and can serve as proxy observations for the regions of no data record, such as, eastern Karakoram [4]. A few studies analyzing these proxy observations from eastern Karakoram suggest against the observed cooling reports. For instance, arguing that a rise of late melt-season discharge from the eastern Karakoram over the 1973–2010 period is subject to enhanced glacial melt, the study [75] linked its speculation to a significant glacial mass loss of −0.10 m·yr 1 observed over a short period of 2003–2008 by [35]. In contrast, the geodetic mass balance analysis over the same study zone but over a longer period (2000–2010) revealed a slightly positive mass balance for the eastern Karakoram glaciers [33]. Furthermore, the areal extent of the eastern Karakoram glaciers has been reported to be growing since the end of 1980s [29]. A significant falling trend of the end-of-summer regional snow line altitude for the eastern Karakoram over the period 2000–2012 also indicates a positive change in the high-altitude frozen water resources therein [25]. For other main cryospheric regions of the UIB, the studies consistently report and support cooling phenomenon [4,17,19,21,27,28,30,35,36,75,76]. Over the whole UIB, increasing snow cover in a recent decade [25,26] and conflict of tree-ring based paeleoclimatic Karakoram summer temperatures with the hemispheric warming for recent five centuries [23] have also been reported.
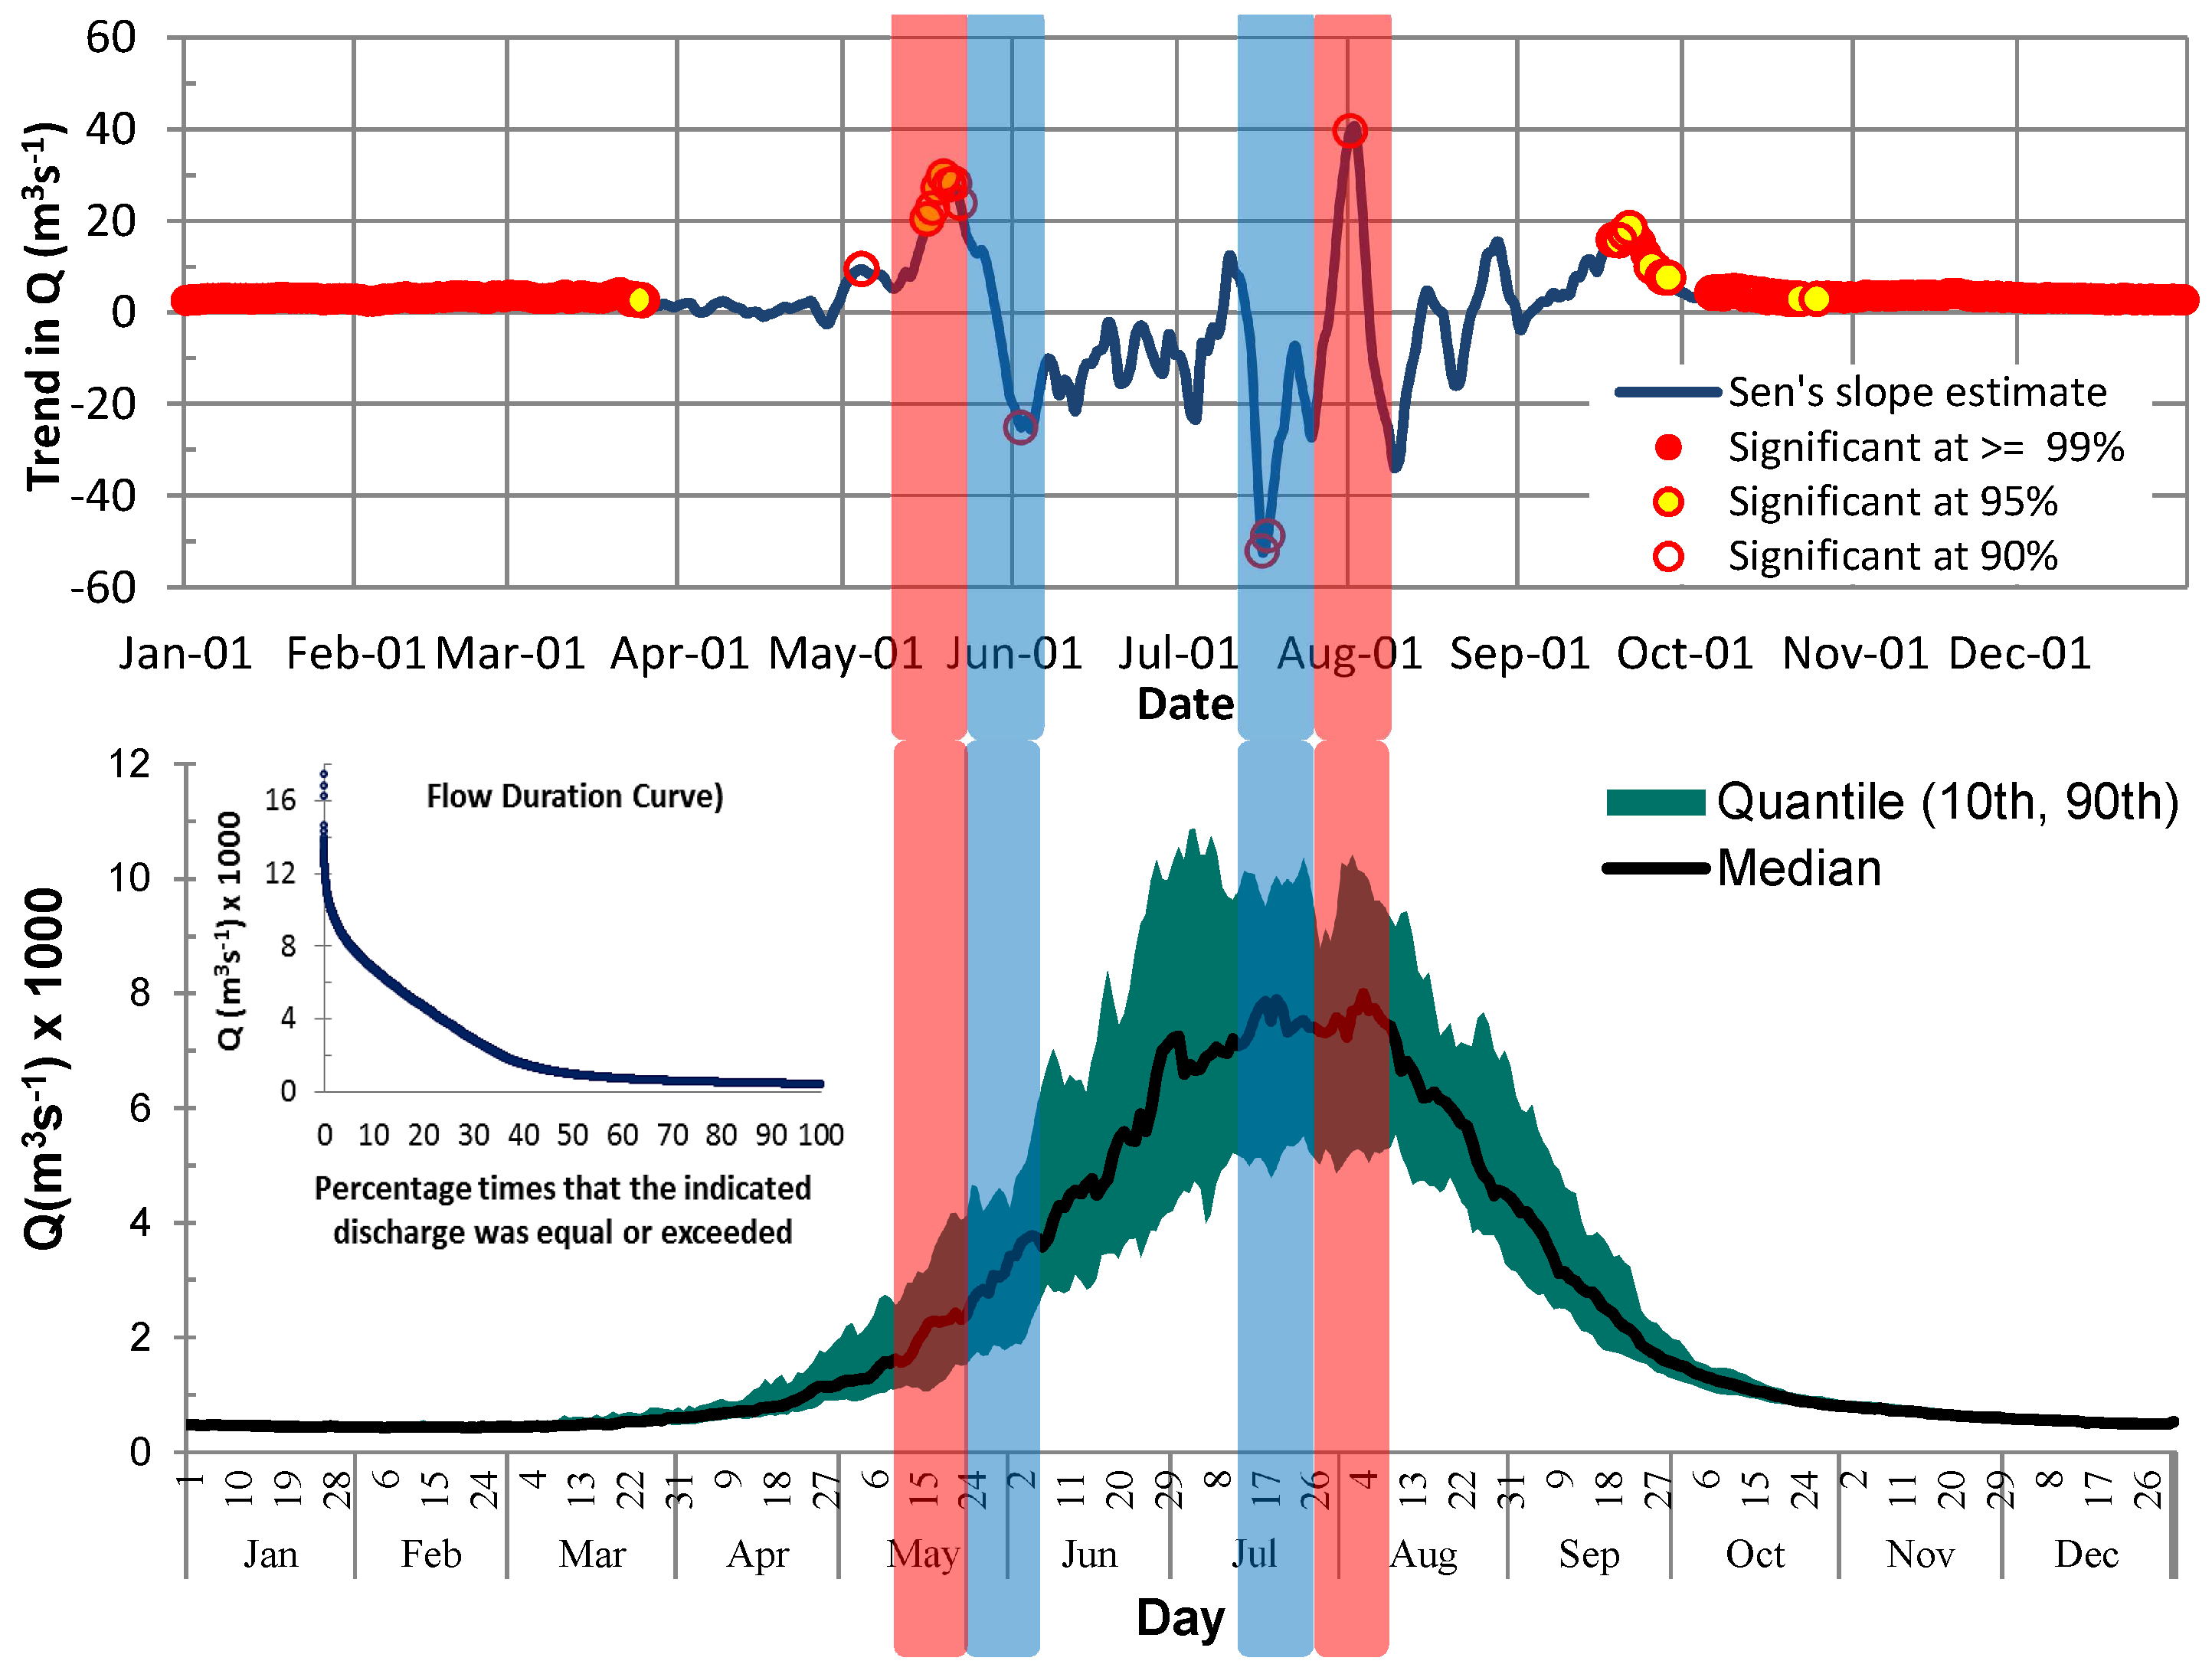
Though the aforementioned findings support a wide spread cooling over the UIB, the UIB discharge tendencies have been additionally assessed, in order to gain insight that whether such cooling phenomenon predominantly influences the overall hydrological regime, aside few exceptions might exist. For this, the long-term hydrograph along with the true (Sen’s [77,78]) slopes of the long term trends for each day of a year (DOY), smoothed with 3–10 days moving average windows are plotted (Figure 5). It is noted that the UIB discharge tendencies are well explained by the prevailing climatic trends shown in Tabular Figure 4. For instance, cooling within the monsoon season (July-September) that mainly coincides with the glacier melt season, has resulted in a significant drop of flows during late-July to early-August period. Similarly, a significant rise (fall) in discharge for month of May (June) that coincides with the main snowmelt season, clearly indicate early shift of the snowmelt regime. These findings confirm the dominant influence of cooling on the glacial regimes of the UIB.
The observed cooling is attributed to the incursions of the summer monsoonal offshoots, which are seemed to be more frequent in near future, in view of the observed rising trends in the monsoon season cloud cover, [21] and precipitation [4] and due to projected extension in the monsoonal domain north and northwest ward over the UIB [47]. Such obvious indications of prevailing hydroclimatic changes and their continuation emphasize the use of a plausible climate change scenario, at least for the near-future. Earlier, it has been argued that the climate change scenarios (temperature increase, glacier area decrease) adopted by previous studies are not relevant at least for the near-future and may only be realized in the far-future with no time stamp attached [25]. Hence, in order to address larger spectrum of future climatic uncertainty, two plausible hypothetical climate change scenarios have been considered; one representing the continuation of prevailing contrasting climatic conditions while other consistent with the global warming patterns.

4.3.2. Near-Future Climate Change Scenario

Here, a climate change scenario has been empirically devised to represent the continuation of prevailing climatic conditions to the near-future. Contrary to typically devised hypothetical climate change scenarios that often perturb the climatic variables arbitrarily and uniformly through the annual course [44], here emphasis is given on a scenario that anticipates climatic changes on an intraseasonal scale, as also depicted from the Tabular Figure 4.
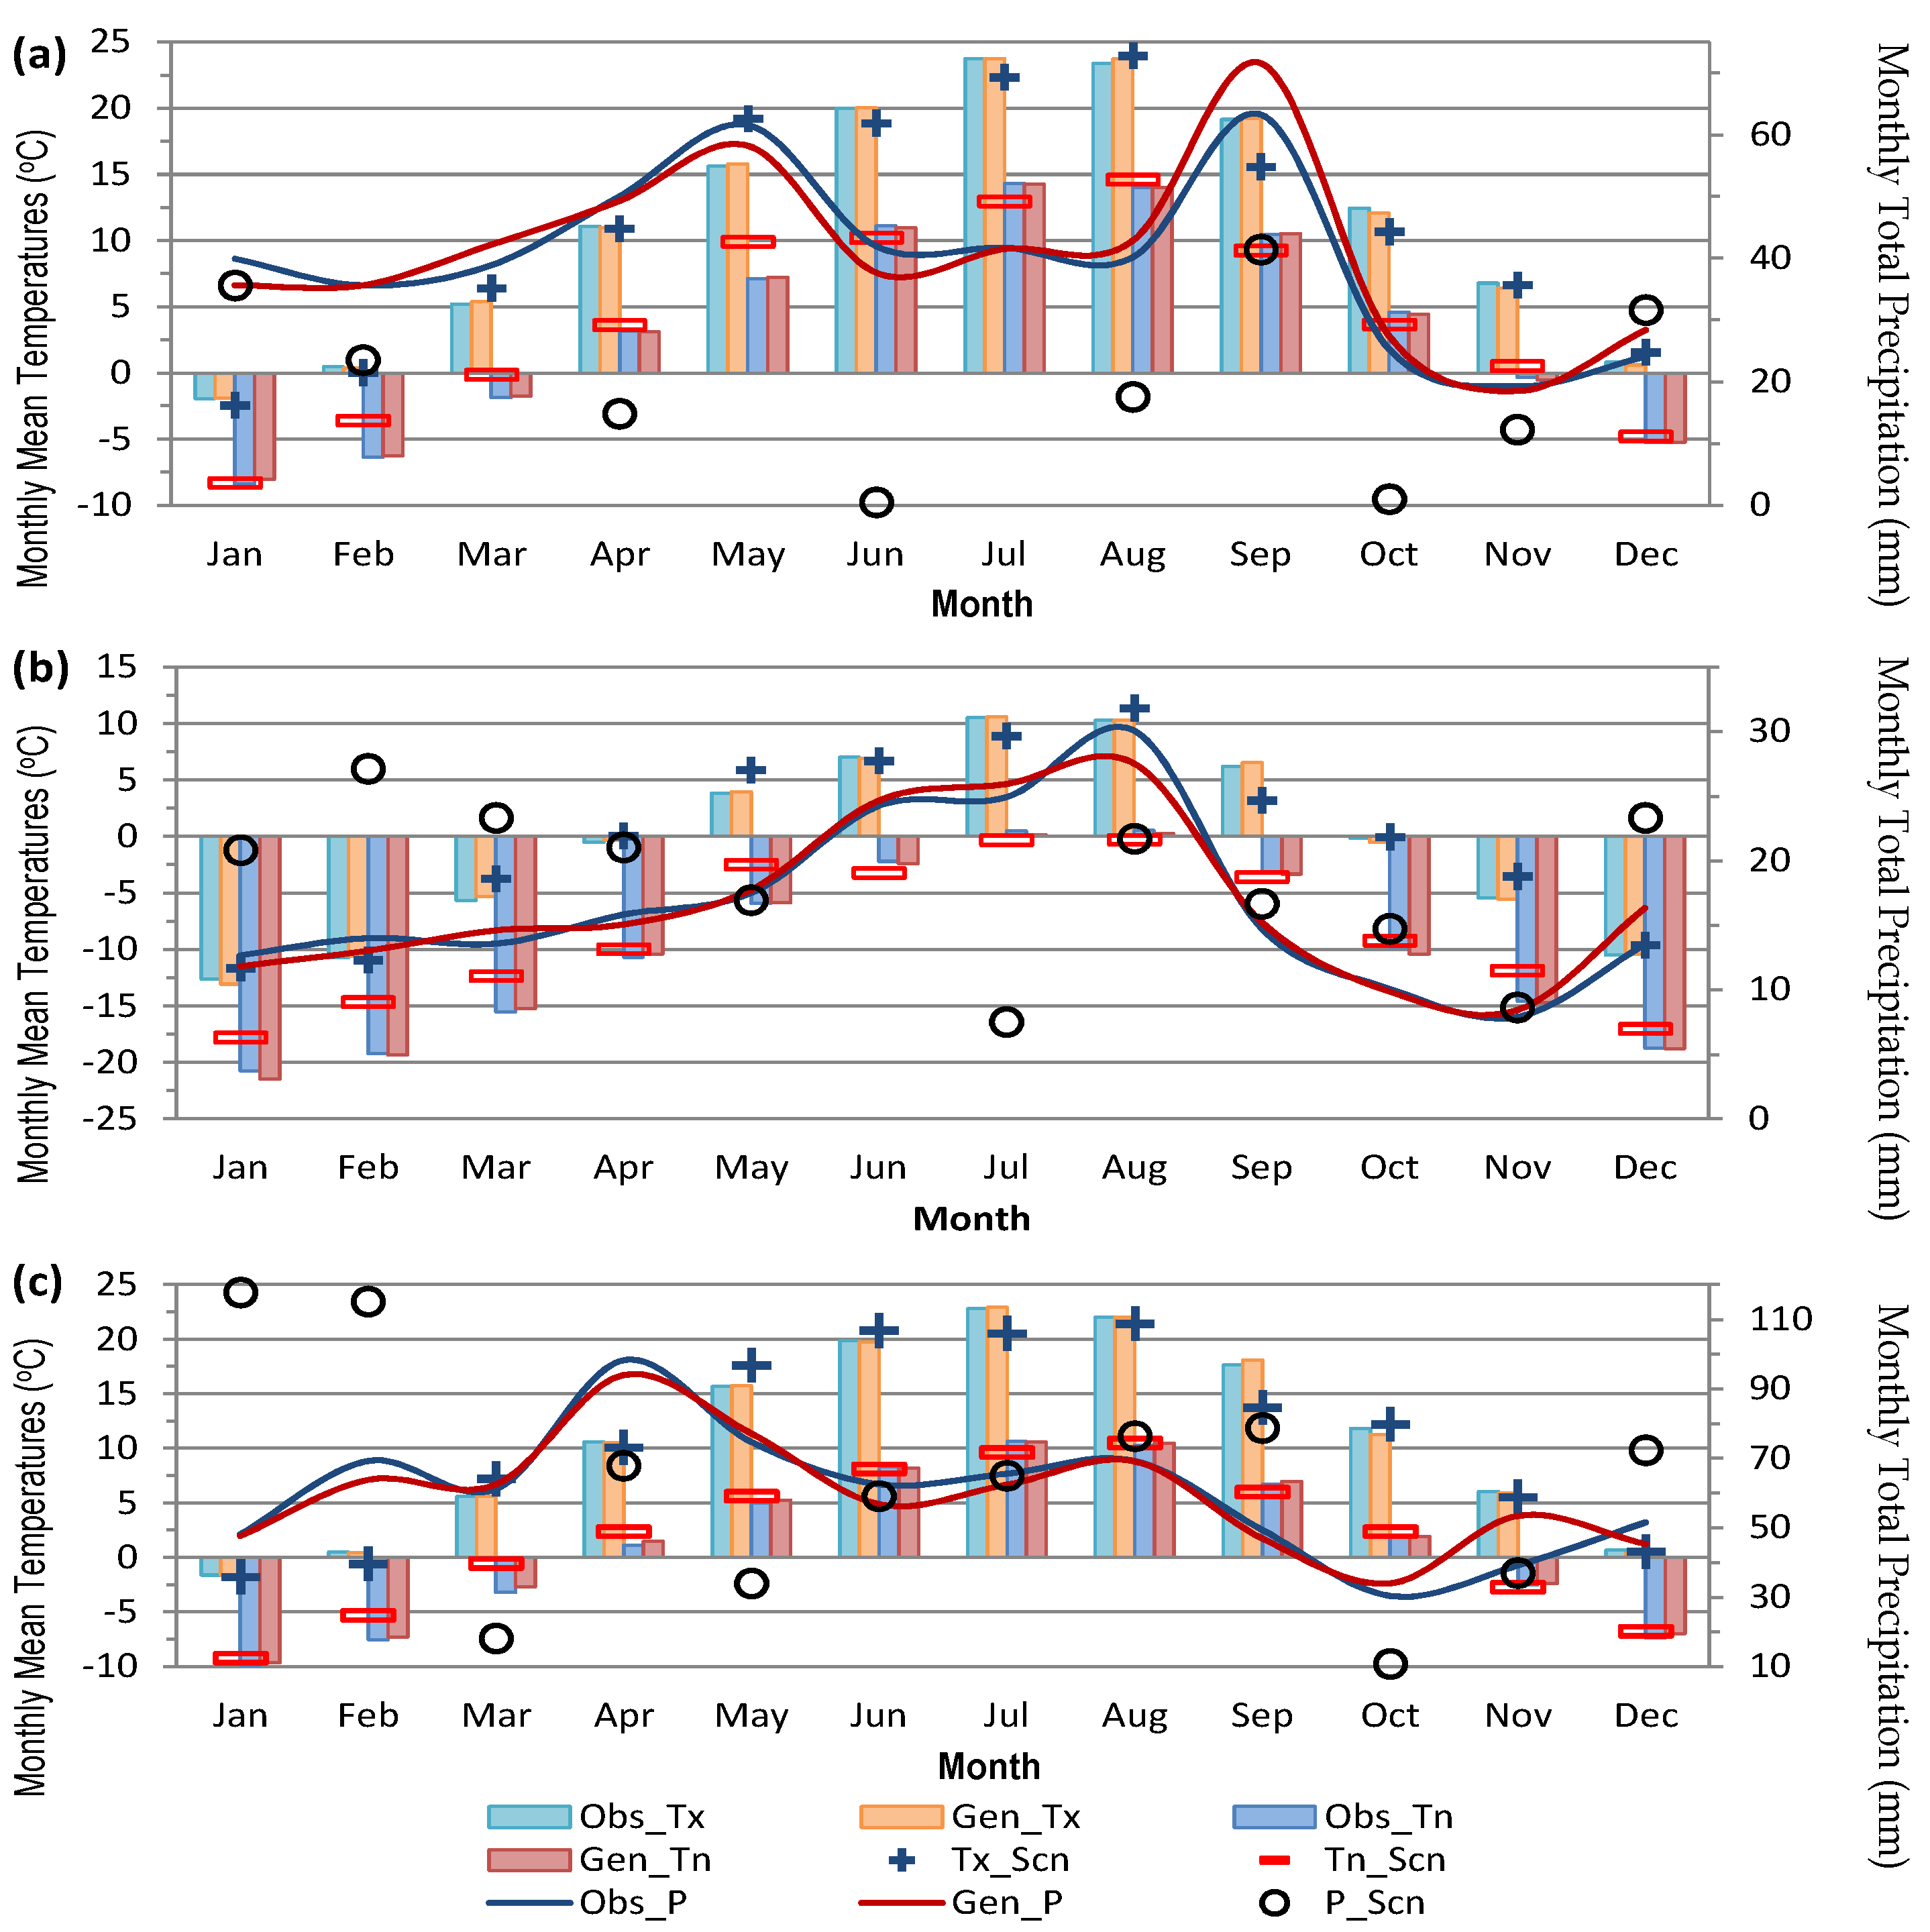
Thus, the monthly time series of considered high-altitude stations (1995–2012) have been extended for next 18-years (2013–2030) using a linear regression intercept and true slope obtained through Sen’s slope method [77,78]. The monthly change factors (Table 4) for the extended future period (2013–2030) were estimated relative to the observed period (1995–2012).
A stochastic weather generator of LARS-WG [79] has been calibrated using the observed time series (1995–2012) from each station separately. Based on the calibrated observed statistics for the period (1995–2012), several synthetic ensemble members each of 30-year daily time series were stochastically generated. Then, the LARS-WG was validated by comparing the statistics of these stochastically generated synthetic ensemble members with those of the observed times series, which should not be statistically significantly different in an optimum case. The observed statistics for the period 1995–2012 were then perturbed by monthly change factors of the future period (2013–2030) in a validated LARS-WG and ten future ensemble members each of 30-year daily time series were generated. It is to note that the variability of future time series is different than that of observed time series, as it has been stochastically perturbed.
The future climatic changes are likely to change the extent of future cryosphere [10], which in turn can affect the future water availability [9,11]. Thus, it is important to incorporate changes in the future cryosphere that are plausible under anticipated climate change scenario, while assessing the future water availability from a glacerized basin. Since the overall glacial extent of the UIB somewhat remained stagnant since 1980s [28,29,30,65] and particularly since early 21st century [20,22] under the ongoing regional warming, no change in the present-day glacial extent has been assumed for the near-future scenario (2013–2030), as also adopted by several studies [5,9,11].

4.3.3. Far-Future Climate Change Scenario

The climate change information have been obtained from seven fine scale (0.44 ) CORDEX-SA simulations, which are performed by downscaling six CMIP5 GCMs employing three different RCMs (Table 2). In view of obtaining a far-future climate change scenario, projections for an extreme emissions scenario of RCP 8.5 are considered for the last decade of the 21st century. The RCP8.5 scenario, assuming ramp up of the radiative forcing up to 8.5 W·m 2 by the end of 21st century, is considered as an upper bracket of the climatic forcing [80,81].
It is pertinent to mention here that though CORDEX-SA experiments provide high resolution present and future climate simulations, however, their ability to reproduce the observed hydro-climatology over the steep HKH topography is by hardly any means better than their forcing CMIP5 GCMs, which being consistent to their older versions and downscaled experiments, substantially over- (under-) estimate precipitation (temperatures) and fail to reproduce summer cooling [7,15,16,82,83,84,85,86,87]. Such cold and wet biases in the CORDEX-SA and their CMIP5 forcing experiments are larger than their projected end of 21st century climatic changes under RCP8.5, indicating huge climatic uncertainty over the UIB [16]. These projected warmer climates from the low fidelity CORDEX-SA experiments are considered here as a hypothetical warming scenario—assuming that the climate models have simulated these climates in a physically consistent way [88]. Further, it is not realistic to attach a time stamp to this scenario, as it is not clear when the UIB will uniformly follow the anthropogenic warming. The CORDEX-SA experiments were adjusted for biases against the considered station datasets using a quantile-quantile mapping approach, prior to their use in the hydrological model.
For changes in the glacial extent, various studies have generally adopted an arbitrary reduction of 50% by mid-century under projected wetter and warmer climates [5,6,9,13]. In contrast, employing a glacio-hydrological model over highly glacierzied (Shigar) sub-basin of the UIB, recent study has reported a negligible ice cover changes by the mid-century under warmer climates as projected under various RCP scenarios [14]. Hence, in view of somewhat stagnant UIB glacial extent at present and conducive hydroclimatic conditions under ongoing regional and global warming, reduction in the future glacial extent under more wetter and warmer climates by the mid of 21st century needs to be rationalized for the UIB. Further, despite 50% reduction in the glacial extent by the mid-century, studies project consistent increase in the water availability due to enhanced glacier melt [5,6,13]. In fact, glacier melt contribution and subsequent water availability will consistently rise under warmer climates until unless the glacial cover declines to a tipping point, as clearly shown by [14]. Identifying timings of such tipping point glacial extent, however, is non-trivial, first in view of the huge multi-model spread of the projected warming [14,16], and second, the timings of occurrence of such projected warming is less likely to be realistic, and rather unknown, in view of conflicting cooling observed at present [4,17,20,21]. Hence, for assessing the far-future water availability under the extreme-end forcing of RCP8.5 by the end of 21st century, three glacial extents are assumed regardless of their time of realization: (1) intact-glacier cover; (2) 50%-glacier cover, and; (3) no-glacier, at all. The 50% reduction in the glacier cover was obtained from the lowest elevation bands.

5. Results

5.1. Calibration and Validation

5.1.1. UBC Model

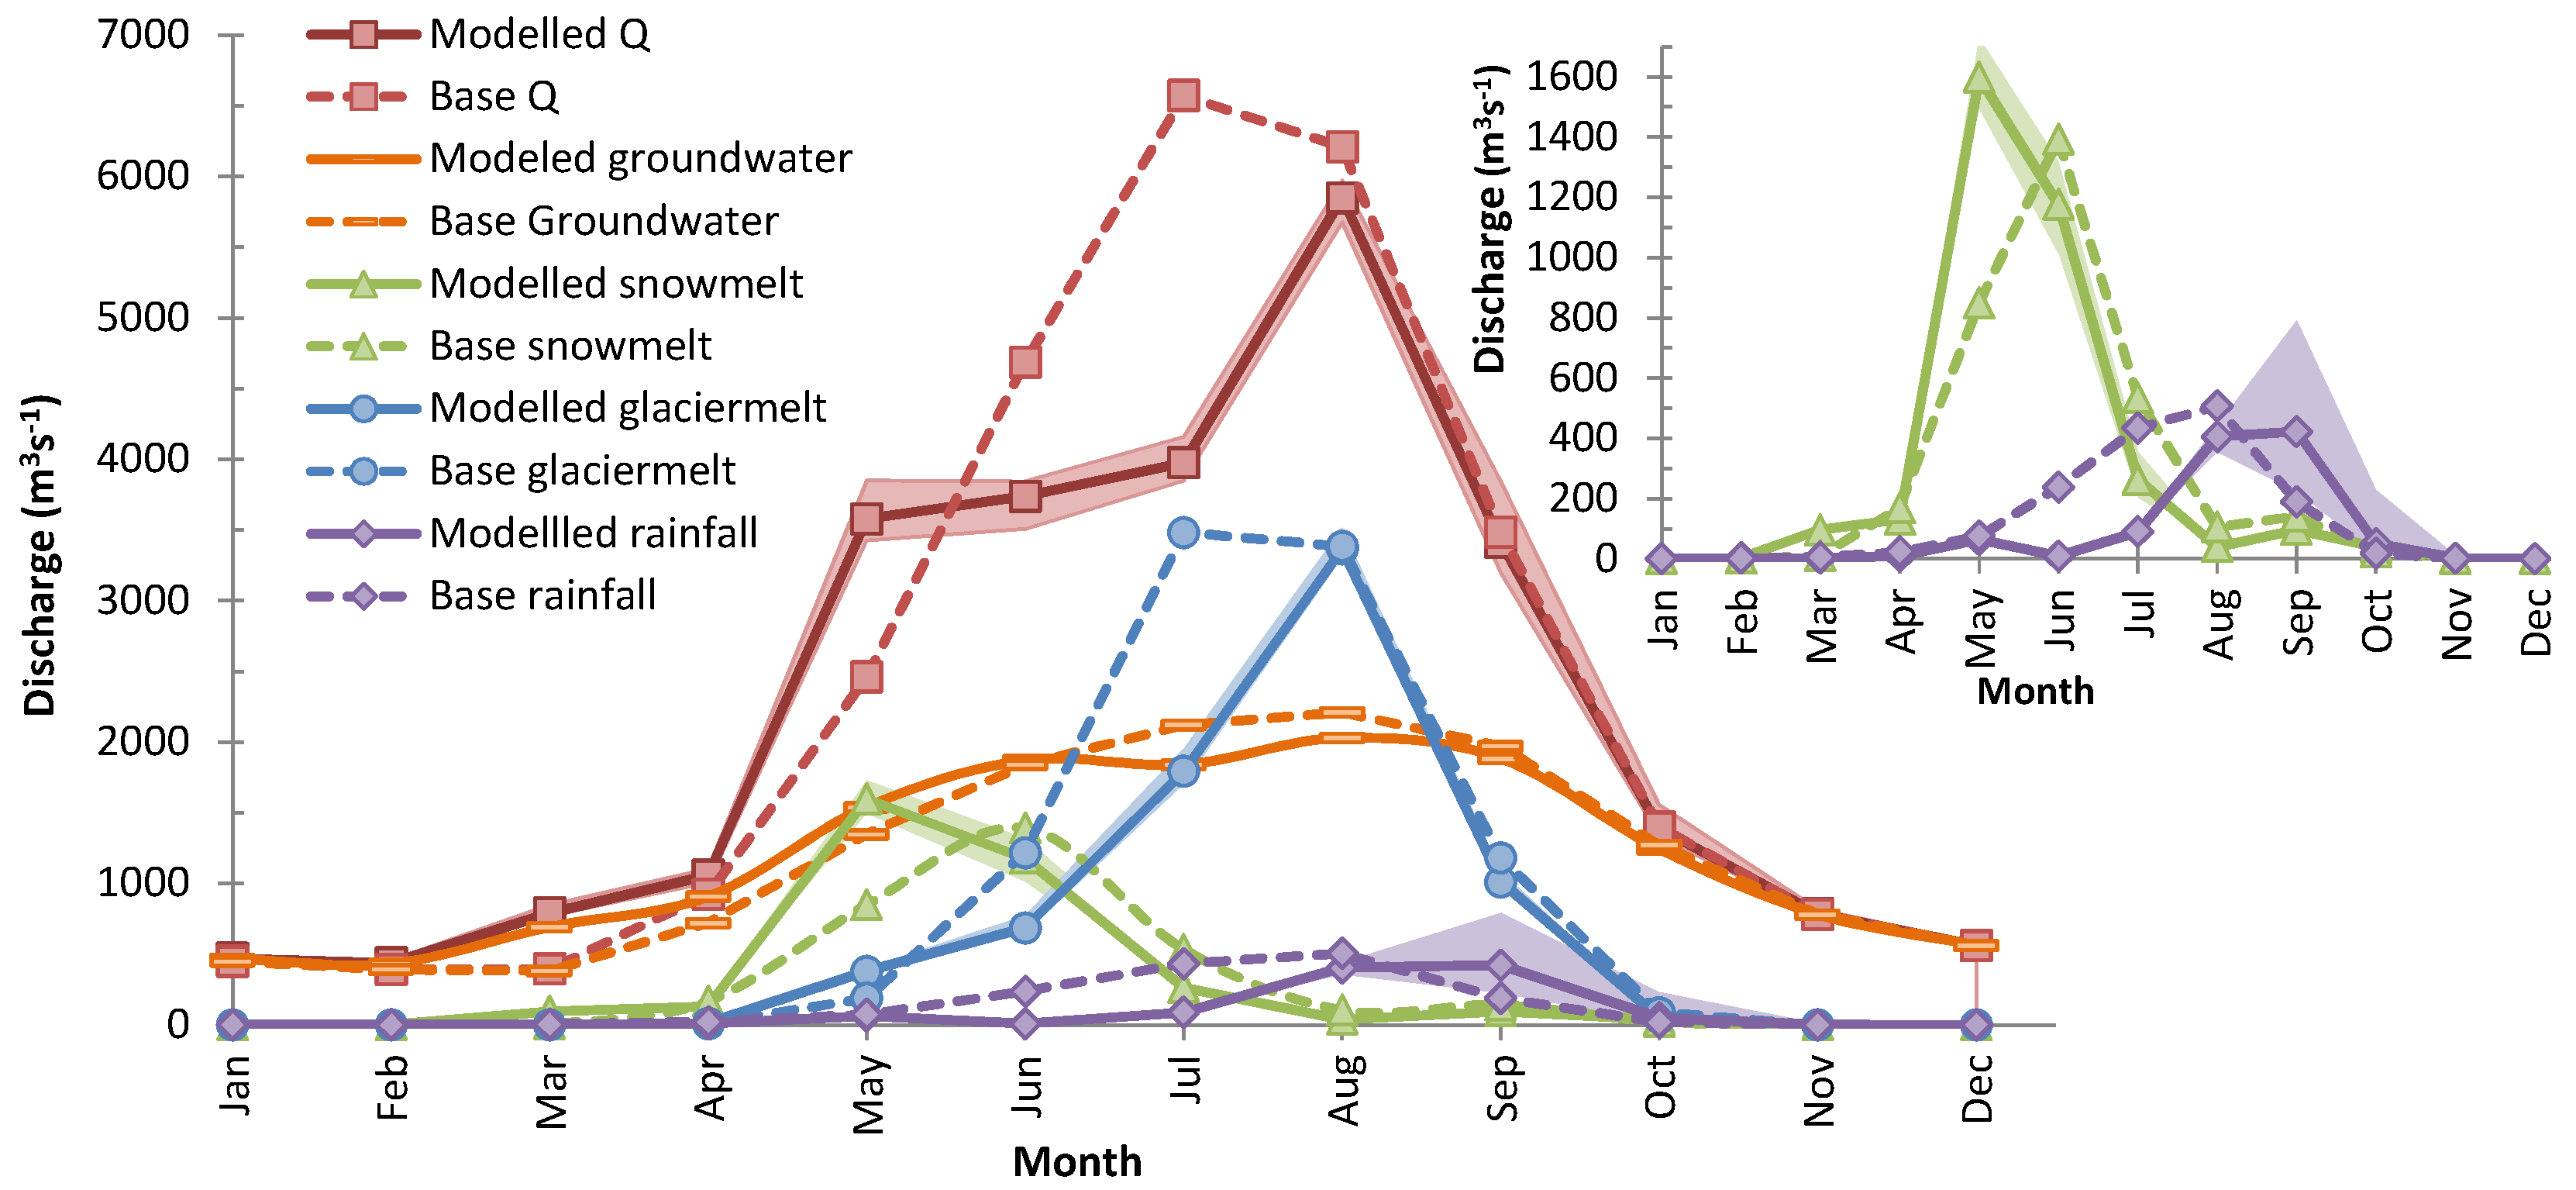
The calibration and validation results of the UBC watershed model are shown in Figure 6 and are quantitatively summarized in Table 5. The overall calibration results have suggested the estimates of NSE, D and EOPT as 0.9 with a negligible volume error (−0.01) and a RMSE of around 800 m 3 · s 1 . Within a 9-year calibration period (1994/1995–2002/2003), the results suggest maximum calibration efficiency for the year 2002–2003 where NSE and D are 0.96, and EOPT is 0.93. On the other hand, lowest performance was achieved for the flood year 1998–1999 (NSE of 0.82, D of 0.91 and EOPT of 0.60) followed by the flood year 1999–2000 (NSE of 0.81, D of 0.84 and EOPT of 0.67). These two consecutive years have experienced flood peaks of above than 13,000 m 3 · s 1 owing to intense July rainfall (high correlation with rainfall outflow), partially captured by the station observations but dampened during the calibration process in order to ensure homogeneous distribution across the large-extent study basin. The long-term flow duration curve and hydrograph shown in Figure 5 suggest that discharge peaks over and above 10,000 m 3 · s 1 are extremely rare for the UIB. It is pertinent to mention here that NSE is particularly sensitive to such peaks as D [73], thus EOPT too. Such situations may additionally happen within the large river basins, when the rainstorm only partially affects the basin in a way that it is not captured by the sparse observational network. Such phenomenon can further be illustrated from the validation statistics.
The validation period (2003/2004–2011/2012) comprises of three extreme flood years in a series where the flood of year 2009–2010 was unprecedented. The 2010 flood event had partially influenced the study basin, yielding two peaked discharges (above 18,000 m 3 · s 1 ) at the basin outlet in August. The overall validation results suggest NSE, D, EOPT, %VE as 0.85, 0.83, 0.82 and −2.24, respectively. Excluding three exceptional years of partially affecting rain-fed flood events, it is noted that the overall validation results into higher NSE and D of 0.9 and 0.92, respectively, implying again that the model performance for these flood years is mainly restricted by an incomplete spatial rainfall distribution captured by the observational network. Notwithstanding, the overall performance of the UBC model for the period (1994/1995–2011/2012) suggests NSE, D, EOPT and %VE as 0.87, 0.86, 0.86, −1.15, respectively when including the flood years, and as 0.92, 0.86, 0.89, −2.82, respectively without considering the flood years. Such performance statistics suggest overall a successful application of the UBC model over the UIB.

5.1.2. LARS-WG

The validation results of the LARS-WG are shown in Figure 7 and summerzied in Table 6. It is noted that LARS-WG performs well in reproducing the observed statistics despite the fact that the observed time series spans over a short period of 18-years (1995–2012). The synthetic temperature time series generated by LARS-WG features a mean annual bias ranging from 0.01 to −0.16 C for the Tmin and −0.05 to 0.02 C for the Tmax amid the considered meteorological stations. The absolute RMSE ranges from 0.146 to 0.340 C for the Tmin and from 0.213 to 0.243 C for the Tmax, where such RMSE range is below 0.02 for Hushe, 0.03 for Khunjrab and 0.04 for Naltar stations in the relative terms. As for the precipitation, the mean annual bias (−0.53 to 0.6) for the LARS-WG generated synthetic time series is negligible while the absolute RMSE is only 1.274 mm for Khunjrab, 3.642 mm for Hushe and 5.481 mm for Naltar stations. It is noted that the performance of LARS-WG is highest for Khunrab station followed by Hushe and Naltar stations, respectively. Similarly, the fractional positive or negative biases in the synthetic temperature time series suggest that the LARS-WG features higher skill for temperature variables as compared to precipitation, which is further higher for the Tmax than for the Tmin variables. Overall, the performance of the LARS-WG has been found quite satisfactory for the considered high-altitude stations within the study region. Such satisfactory performance of the LARS-WG has allowed its further application in devising a plausible near-future climate change scenario. The Figure 7 also shows the near-future climate changes scenario (Tmax, Tmin and P), which is devised by perturbing the statistics of synthetic validated LARS-WG time series with the change factors derived for the 2013–2030 future period relative to the 1995–2012 observed period (Table 4).

5.2. Future Water Availability

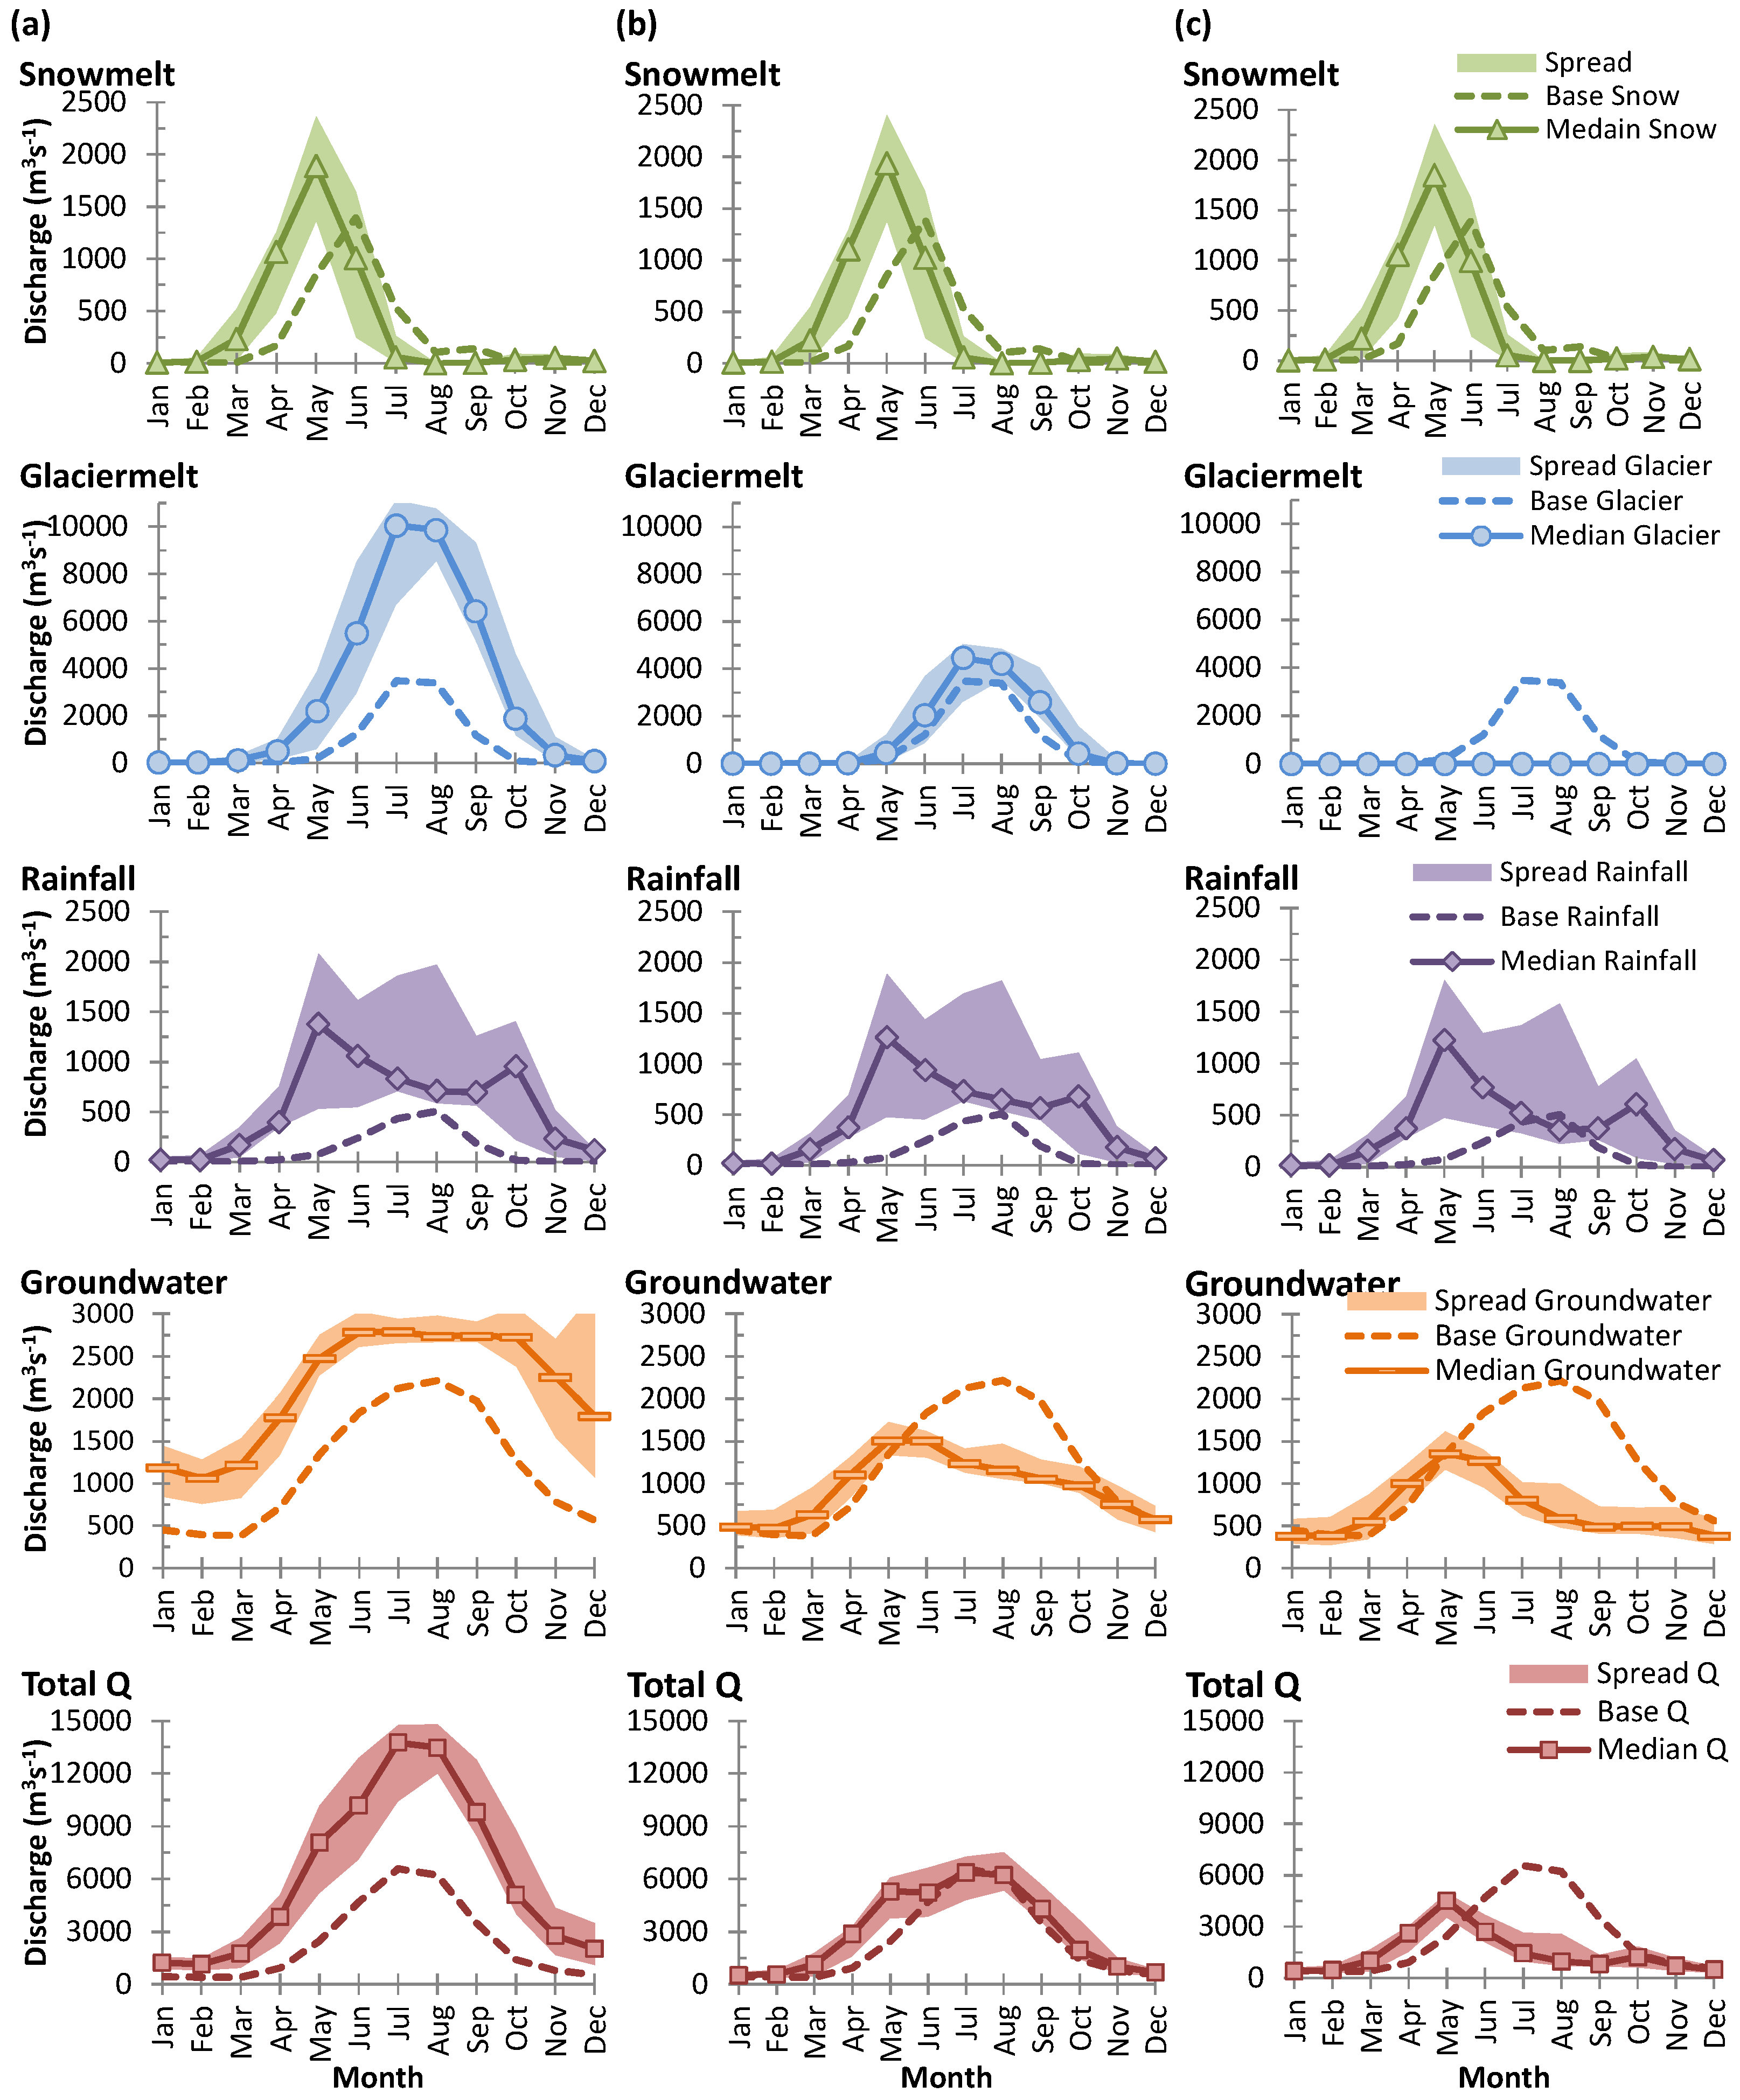
Results of both near- and far-future climate change scenario are given in Table 7, and are graphically shown in Figure 8 and Figure 9, respectively.

5.2.1. Near-Future Climate Change Scenarios

Under the most plausible near-future scenario, a median ensemble change suggests that the mean UIB discharge will be reduced by roughly 8% (range 6%–10%) relative to the present-day mean discharge. Such reduction is a subsequent response from the individual discharge components, which exhibit distinct changes. For instance, the glacier melt contribution to the total flow will be reduced by 24% (range 21%–25%), indicating marked changes in the overall hydrological regime of the UIB. In contrast, snowmelt outflow has been projected to rise by 7% (range 2%–14%). Changes in other discharge components suggest 29% decrease in the rainfall outflow (range 0%–43%) while groundwater contribution will increase by roughly 2% (range 0%–3%).
Changes in the individual discharge components not only influence the amount of water availability but its timings too. The Figure 8 shows that increase in the snowmelt outflow components is accompanied by an early snowmelt, while reduction in the glacier melt contribution has resulted in its delayed peak by one month. The snowmelt peak has been shifted from June to May while the peak glacier melt is shifted from July to August. Subsequently, the mean annual hydrograph suggests an early onset due to early snowmelt while the peak annual discharge, coinciding with the glacier melt timings, is delayed by one month, shifting from July to August.

5.2.2. Far-Future Climate Change Scenario (Intact Glacier)

Given that the far-future climate change scenario is realized at some point in time and the present-day glacial extent remains unchanged by then (Figure 9), a substantial increase in the UIB discharge is projected; median of such an increase is 1.6 times (range 1 to 2.2 times) of the base period discharge. The maximum change is projected for the rainfall outflow component, which will increase by 3.4 times (range 2 to 5 times). This is followed by a threefold increase in the glacier melt contribution (range 2 to 4 times). The minimum rise is observed in the snowmelt contribution, which will be around 25% (range −2% to 74%) of the base period snowmelt contribution. The groundwater contribution will subsequently rise by 86% (range 56% to 100%).
Moreover, the timings of peak snowmelt runoff will advance by one month and will occur in May rather than in June. Similar advance is observed for the whole nival regime, which will span over March–July rather than April–August period. The spread of rainfall outflow is relatively large among the ensemble members. However, the median rainfall outflow will feature its peak in May instead of August, followed by in October. Interestingly, the glacial regime exhibits no shift but will expand from May–October to April–November, owing to an early onset and a delayed retreat while months of peak timings will remain unchanged. Similar is the case with the annual hydrograph, where the wet season will span over March-November period.

5.2.3. Far-Future Climate Change Scenario (50% Glacier)

Besides 50% reduction in the glacier cover, the median of the ensemble simulations suggests that the overall UIB discharge will increase by 24% (range −4% to 54%) relative to the base period. Interestingly, at the lower-end of the climatic uncertainty, the overall discharge will become slightly lower than that of the base period discharge. Similarly, though the glacier melt contribution to the overall discharge will rise by 50% and 100% for the median and maximum changes, respectively, however it will be slightly lower to that of the present-day for the lower-end of the climatic uncertainty. Such finding suggests that decreasing the glacier cover by more than 50% may yield the water availability lower than the base period, indicating a tipping point behavior of the glaciers under extreme forcing. The maximum change is again projected for the rainfall outflow component, which will increase by 2.8 times (range 1.5 to 4.5 times). The snowmelt contribution will rise by around 25% (range 1% to 62%) while the groundwater contribution will drop by 20% (range −5% to −25%) relative to the base period.
The timings of snowmelt outflows under 50%-glacier realization will be similar to those as projected under intact-glacier realization. Similarly, the median rainfall outflow will also feature its peak in May instead of August, followed by in October, where the peak in October is smaller in magnitude as compared to the intact-glacier scenario. Interestingly, the glacial melt regime agrees well with the glacier melt regime of the base period, exhibiting only minute extension in the late-glacier melt period. The groundwater contribution has been considerably dropped during the glacier melt period (June–September) while it will be maximum in May and June. The annual hydrograph will mostly remain close to the annual hydrograph of base period with a little extension owing to an early shift of the snowmelt regime, where the wet season will span over the March–November period.

5.2.4. Far-Future Climate Change Scenario (No Glacier)

The maximum change is projected in the rainfall outflow, which will rise by 2.3 times (ranging from being double to 3.6 times) of its present-day contribution. After the rainfall outflow, the snowmelt outflow will rise by 19% as compared to its base period contribution. In contrast, a negative change of around 45% (range 29% to 48%) is projected for the groundwater component as there will be no groundwater recharge from the glacier melt throughout the glacier melt season. Besides positive changes in the rainfall and snowmelt outflows, the overall water availability from the UIB will be reduced by 40% (range 22% to 51%) relative to the present-day water availability, mainly due to absence of glacier and glacier melt.
The timings of the rainfall and snowmelt outflows under no-glacier realization will be similar to those as projected under intact-glacier and 50%-glacier realization. The peak groundwater period (June–October) for the intact-glacier realization will now confine to May–June only, as in case of 50%-glacier realization. The overall hydrological regime of the UIB will be shifted from glacial-nival to nival-pluvial regime. Hence, a peak discharge will be available in May, while wet (dry) season will span from March to July/August (September to February).

6. Discussion

The model performance over 9-year calibration and 9-year validation periods has been found very good, implying that model can reproduce the observed runoff with required accuracy using a minimum set of observations. However, limited skill of the UBC model in reproducing the rare extreme discharge peaks is mainly subject to extreme rainfall events partially affecting such a large study basin. This emphasizes either on the application of UBC model for the sub-basins of the UIB or employing a fully distributed hydrological model with a full set of available meteorological stations. Moreover, exceptions to the observed cooling at some places cannot be characterized in the UBC as it considers the hydroclimatic conditions within each elevation zone homogeneous, reinforcing the application of a fully distributed model. These models further allow spatially explicit distribution of snow pack and existing glacial extent and masses, which are primitive to reduce the typical uncertainties of compensation between the glacier and snowmelt. Further, the hydrological model calibration/validation against the multiple dataset of observed snow cover, glacial mass balances and discharges together improve the overall runoff estimation, and yields realistic snow and glacier melts components [89]. This will be the focus of a follow up study.
The study aimed to address the climate change impacts on the hydrological regime of the UIB considering a broader climatic uncertainty; relevant climate change scenarios derived from the observational record, and those, projected by the low fidelity climate model experiments under extreme forcing scenarios. It is worth mentioning that the single scenario for the near-future may represent only an aspect of likely changes in the near future climate. Therefore, a wide range of plausible climate change scenarios that are devised empirically on similar lines—representative of the continuation of prevailing climatic trends—should be adopted in order to more adequately address the near-future climatic uncertainty, and subsequently, the water availability from the UIB to support the informed policy decisions.
The study has focused on changes in the future water availability and its temporal availability (seasonality) rather than changes in the mass balance of the glaciers. The results from the near-future scenario suggests the continuation of the observed hydroclimatic changes, and that, such changes will largely influence the melt dominated hydrological regime of the UIB. Under such scenario, the projected reduction of glacier melt by a quarter, and of rainfall runoff by half are due to the mid-to-late melt season cooling while a projected increase in the snowmelt up to 14% is a result of early-melt season warming. Subsequently, the overall water availability is projected to decline by up to 10%. Worth noting fact is that substantial reduction in the glacier melt, aside changes in precipitation that are also positive, indicates a positive change in the frozen water resources of the UIB. Such finding is largely consistent with the prevailing changes depicted from the long-term observed streamflow record (Figure 5) and with the reports of anomalously positive or stable glacial mass balances and extents [20,22,27,28,29,31,33,34,35], increasing snow covers and falling end-of-summer regional snow line altitudes [20,22,25,26], and subsequent reduction in the melt season discharges [4,19]. On the other hand, a decrease in the glacier melt and in the overall discharge is in direct contrast to the reports from earlier studies, which addressing only partially the climatic uncertainty over the UIB assess its future water availability under warmer climates [5,6,7,8,90], and suggest rather enhanced glacial melt and rise in the water availability throughout the 21st century. Such contradictory findings of rise in the near-future water availability, lacking the relevance of near-future climate change in accordance with the prevailing hydroclimatic trends, are quite misleading for the immediate freshwater resources management in Pakistan.
Though abrupt drastic decline in the near-future runoff is less likely, considerable changes in its seasonality are rather obvious from the results. For instance, increasing snowmelt owing to early melt-season warming has resulted in a month early peak of the snowmelt runoff regime. In contrast, decreasing glacier melt owing to mid-to-late melt-season cooling has resulted in a delayed peak of the glacier melt runoff regime by one month. Subsequently, the overall hydrological regime exhibits similar changes as of the dominating glacier melt regime. Moreover, if the observed changes will continue roughly in the similar manner, the snow and glacier melt regimes seem to be shifting apart from each other, indicating more dependence on nival to pluvial rather than on glacial regime for the future water availability. These findings clearly suggest that the non-uniform climatic changes on an intra-seasonal scale have distinct impact on the discharge components. Hence, uniformly perturbing various input parameters throughout the annual course (which yield physically inconsistent changes) as typically adopted in the hypothetically devised climate change scenarios [44,91] will project superficial changes in the timings of the runoff components and in the overall seasonality of the runoff regime.
For the far-future scenario, an increase in the rainfall outflow under the intact-glacier realization is projected to be lower under the 50%-glacier realization, and further lower under the no-glacier realization. This is due to the fact that reduction in the glacier cover will expose more surface area to the soil layer infiltration and ground water percolation throughout the melt period and mainly during the glacier melt season. As a result, the direct rainfall outflow will be delayed due to infiltration and percolation to the groundwater and will become part of the groundwater contribution. Such relative reduction in the rainfall outflow during the main glacier melt season (July–September) can be seen from Figure 9. Similar case is observed for the snowmelt outflow increase, which being 24% and 19% for the 50%- and no-glacier realizations, respectively, will remain slightly lower than the increase for the intact-glacier realization. It is noted that increases in the rainfall outflows under no-glacier, 50%-glacier and intact-glacier realizations of the far-future climate change scenario are projected to be higher than the projected changes in the rest of hydrological components, which may partly be due to: (1) increase in the actual rainfall itself, and; (2) phase changes of the solid precipitation into liquid under the projected increase in the early-melt (spring) season temperatures (Figure 4), as the maximum increase in the rainfall outflow occurs during the main snowmelt period (Figure 9).
Besides 50% reduction in the glacier cover under the far-future scenario, the median change suggests that the glacier melt contribution and the overall water availability from the UIB will rise, consistent with earlier studies [5,6,13]. However, for the lower-end of the climatic uncertainty under the far-future scenario, the glacier melt contribution and the overall water availability from the UIB is projected to become slightly lower than that of the base period, implying that a further decrease in the glacier extent (by more than 50%) may yield the water availability lower than the base period. Similar findings have been reported for the Shigar sub-basin of the UIB, for which a reduction in the glacial extent by half or more projects a reduction in the future water availability under SRES A2 scenario, relative to the base period [11]. These contrasting findings of the future water availability increase or decrease with 50% reduction in the glacier extent mainly result from the future climatic uncertainty for the given forcing; the climate models project distinct climatic changes under the same forcing scenario owing to their structural uncertainty [16,47].
Summarizing, the far-future scenario suggests the overall dominance of the glacier melt regime owing to enhanced glacier melt under warmer climates, and subsequently, rise in the overall water availability until glaciers vanish (or reach a tipping point) where their contribution becomes so small that the overall water availability will reduce. These findings are largely in agreement with the earlier future water availability projections for the UIB under warmer climates as typically but inconsistently projected by the climate models under a variety of anthropogenic forcing [5,6,7,8], as explained in Section 1. The results of far-future water availability are further consistent with earlier studies focusing on the sub-basins of the UIB. For instance, a consistent increase in the mid-21st century water availability from the Shigar sub-basin has been reported under SRES A2 scenario due to enhanced glacier melt until the glacial extent reduces to 50% [11]. Similar results of an increased future water availability due to enhanced glacier melt are reported for the Shigar sub-basin throughout the 21st century under various RCP scenarios as simulated by CMIP5 GCMs [14]. The assessment of future water availability from the Hunza, Astore and Gilgit sub-basins of the UIB under SRES A2 scenario likewise suggests an increased water availability for the intact-glacier but drastic decrease for the no-glacier realizations by the end of 21st century. Further, a twofold increase in the future water availability from the Hunza sub-basin in response to the hypothetical warmer climates till the end of 21st century has also been reported [10]. Nevertheless, projections of first increasing flows due to deglaciation and then abrupt drop on vanishing of glaciers and glacial melt (or reduction due to reaching tipping point) has most likely been delayed until the region comes uniformly under the influence of warming signal and starts following the same sign of change as projected by the present-day climate models under various emission scenarios.
Interestingly, prevailing observed changes and climate models’ projections under anthropogenic forcing both consistently suggest a warming during the early-melt (spring) season in the future [16]. Hence, all four realizations of the adopted climate change scenarios project similar changes for the nival regime of the UIB, suggesting a month early (in May instead of June) snowmelt outflow (peak) and its overall increase (7% to 25%) by near-to-far future, which is further consistent with the earlier reports. For instance, a month early snowmelt runoff peak has been reported for the UIB till the end of 21st century under SRES A2 emissions scenarios [5]. Similar is the case with the Shigar sub-basin of the UIB, for which an earlier occurrence of the snowmelt outflow has been projected under various RCP scenarios throughout the 21st century [14]. As for changes in the overall future water availability, a qualitative agreement is achieved amid the near-future scenario with intact-glacier and the no-glacier realization of the far-future scenario (reduction up to 10% and 50%, respectively), which emphasizes more on the importance of unique cooling phenomenon and its relevance than on changes in the cryosphere, while assessing the future water availability from the UIB.

7. Conclusions

The near- and far-future climate change scenarios that contradict on the direction of their projected climatic changes during the main glacier melt season suggest distinct changes in the overall hydrological regime of the UIB, and subsequently, in the future water availability from the basin. For instance, the near-future scenario suggests a substantial drop in the glacier melt and one month delay in its peak, and subsequently, reduction in the overall water availability. These changes, particularly in the view of increasing precipitation, indicate a positive change in the frozen water resources of the UIB. Further, strengthening of nival but suppression of the glacial melt regime under the near-future scenario implies both the regimes shifting apart, indicating substantial changes in the seasonality of the overall hydrological regime. In contrast to the near-future scenario, the far-future scenario project a strengthening of the glacial regime, no change in the glacier melt peak runoff timings and substantial increase in the overall water availability till the glacier cover either reaches a tipping point or fully vanishes. For the nival regime, however, both scenarios consistently suggest its strengthening that is accompanied by a month early occurrence of the snowmelt outflow.
In view of the huge adaptation costs involved, the contradictory future water availability projections for the UIB emphasize on considering the relevance of likely climate change scenarios for the foreseen future. Further, regardless of which scenario is realized, distinct changes in the seasonality of individual discharge components, and subsequently, of the overall hydrological regimes, and thus, of the timings of the future water availability are obvious, which will certainly impact the existing water resource management practices in Pakistan. Further, in view of sparse real and sporadic proxy observations and the low fidelity of present-day climate models, it is speculated that the challenges of future water availability assessment, such as, ascertaining prevailing changes from the observations, obtaining future climate projections and quantifying and reducing the uncertainties [92] seem to be far more severe for the UIB. Further, the non-climatic factors, such as, the socioeconomic developments, landuse/landcover changes, burgeoning population and inadequate management of existing water resources in the region pose multiple pressures on the future water resources, and may worsen the severity of climatic impacts on the future water availability.

Acknowledgments

The author acknowledges: (1) the Pakistan Meteorological Department, the Water and Power Development Authority (WAPDA), Pakistan and EvK2-CNR for the provision of hydroclimatic observations, support and relevant information; (2) the USGS for the provision of one arc-second digital elevation model; (3) the United Nations Environment Programme (UNEP) for providing the forest cover and forest canopy density datasets, as compiled from USGS/NASA—Distributed Active Archive Center, through their Environmental Data Explorer; (4) the IACS Working Group on the Randolph Glacier Inventory and Infrastructure for Glacier Monitoring for the provision of version 5.0 of the Randolph Glacier Inventory; and (5) the World Climate Research Programme’s Working Group on Regional Climate, and the Working Group on Coupled Modelling, former coordinating body of CORDEX, and the climate modelling groups for producing and making available their model outputs as listed in Table 2. The author also acknowledges the support from the Cluster of excellence in the Integrated Climate System Analysis and Prediction (CliSAP), Hamburg, Germany.

Author Contributions

This is a solo-authored article.

Conflicts of Interest

The authors declare no conflict of interest.

Abbreviations

The following abbreviations are used in this manuscript:
UIBUpper Indus Basin
HKHHindukush-Karakoram-Himalaya
UBCUniversity of British Columbia
AECArea Elevation Curve
DEMDigital Elevation Model
MODISMODerate Resolution Imaging Spectroradiometer
CORDEX-SACoordinated Regional Climate Downscaling Experiments for South Asia

Appendix A UBC Snowmelt Routine and Snowpack Budget

The UBC model accumulates and melts snow for each elevation band using block-budget and wedge-budget approaches. The block-budget approach accumulates and melts the snow at the mid-altitude of each elevation band when snow is not patchy (100 > S 0 P A T S > 400 mm water equivalent). Under patchy snow conditions, wedged-budget approach redistributes the snow in a way that there is less snow at lower elevation and more snow at higher elevation of the band. The wedge-budget approach then melts the snow, featuring a smooth transition of snow line from bottom to top of the elevation band.
Instead of a degree-day method, the model applies a simplified energy budget approach for the snowmelt. This approach performs better in open areas since the relationship between temperature and incoming shortwave radiation is nonlinear due to elevation and incoming air mass induced variations in temperature. Similarly, the relationship between the snowpack albedo and the net radiation is also nonlinear mainly due to variations in albedo with fresh snowfall events. Further, rugged terrain and wind-induced turbulent mixing in open areas increases the convective and condensation melts. Thus, temperature does not feature a linear relationship to overall melt in the open areas. Therefore, model uses temperature to estimate non-linear surface energy exchange parameters of the snowpack required for its melt. It describes the snowmelt components, such as, shortwave and longwave radiations, convective and advective heat transfer in mm·day 1 based on Equations (A1)–(A3) tested on high-quality dataset from the U.S. Corps studies in 1954.
M e l t s w = I s w ( 1 C l d ) ( 1 A l b d )
where I s w is the incident shortwave solar radiations that vary with respect to time of the year, latitude, site exposure and atmospheric conditions. The shortwave energy melt, M e l t s w is reduced by the presence of cloud cover, C l d and albedo, A l b d .
Based on Stefan Boltzman law, the net long-wave energy budget of the snowpack under clear-sky conditions (and in open areas) equals to the difference between its blackbody radiation and incident gray-body radiations from overlying air mass. For cloudy conditions (and under tree cover), such budget equals to the difference of black-body radiations from the snowpack and the cloud/tree cover. Under non-clear sky conditions, the long-wave energy budget is positive at just above freezing air temperature while for clear-sky conditions it is positive only when the air temperature is above 21 C. Thus, the snowmelt of a melting snowpack at 0 C from the net long-wave energy, M e l t l w under both clear and cloudy sky conditions in mm day 1 becomes:
M e l t l w = ( 20 + 0.94 T a v g ) ( 1 C l d ) + 1.24 T C l d × C l d
where T C l d refers to the cloud temperature.
Convective melt component relates to the turbulent heat exchange between the snowpack and its overlying air mass. In a moderate wind conditions, rise in air temperature increases the air mass stability, allowing minimum heat exchange to the underlying snowpack, unless winds become strong. On the other hand, advective heat transfer is related to moisture transport from and to the snowpack and can produce snowmelt when the dew point temperatures exceed the freezing point temperatures. The snowmelt due to convective and advective heat exchanges can be approximated by Equation (10) and are subject to a limiting factor R M = 1 7.7 R I , reasonably linearized for + 0.12 < R I < 0.1 , where R I = 0.095 T a v g V 2 is a bulk Richardson number and V is the wind speed in km·h 1 .
M e l t c o n v / a d v = C N ( ρ 101 ) T a v g / d e w × V
where C N is a constant for convective, c o n = 0.18 and for advective, a d v = 0.35 heat transfer and ρ is the air pressure in kilo pascals at the considered height. Convective melt takes the mean temperature, T a v g while advective melt uses the dew point temperature, T d e w which is well approximated from T m i n . Snowmelt from rain is computed as Equation (A4), where K is a constant representing the heat content of the rain in mm· C 1 .
M e l t r a i n = K × T a v g × R A I N
Since the cloud cover, wind speed and albedo are usually not available in a data scarce mountainous watershed, the model estimates such parameters based on temperature using Equation (A5).
C l d = 1 T m a x T m i n T r a n g e
where T r a n g e denotes the diurnal temperature range under clear-sky conditions at a certain height. The wind speed is calculated by the model using Equation (A6).
V = P 0 V B M W ( P 0 V B M X 1 ) T E D 25
where, P 0 V B M X is a threshold of maximum wind speed in km·h 1 for heights below 2 km and T E D is a maximum temperature range for that day. The model implements increases in the wind speed with elevation, V i n c as Equation (A7).
V i n c = V C 0 E L E M B a n d 1000
where C 0 E L E M B a n d is the mid elevation of the band. The model assumes the fresh snow albedo as 0.95 that rapidly decays at a rate of 0.9 on a daily basis until it settles down to 0.65, from where it decays further at a slower rate and reaches to 0.3 for a seasonally aged snowpack. When a fresh snow of 15 mm falls, albedo jumps back to 0.95 and decays until it settles down to its pre-snowfall value. The snow-covered glaciers are treated similarly while the albedo for snow-free parts of the glaciers is assumed to be 0.3.

References

  1. IPCC. Climate Change 2013: The Physical Science Basis. Contribution of Working Group I to the Fifth Assessment Report of The Intergovernmental Panel on Climate Change; IPCC: New York, NY, USA, 2013. [Google Scholar]
  2. MRI. Elevation-dependent warming in mountain regions of the world. Nat. Clim. Chang. 2015, 5, 424–430. [Google Scholar] [Green Version]
  3. Hasson, S.; Gerlitz, L.; Schickhoff, U.; Scholten, T.; Böhner, J. Recent climate change over high Asia. In Climate Change, Glacier Response, and Vegetation Dynamics in the Himalaya; Springer: Basel, Switzerland, 2016; pp. 199–217. [Google Scholar]
  4. Hasson, S.; Böhner, J.; Lucarini, V. Prevailing climatic trends and runoff response from Hindukush- Karakoram-Himalaya, upper Indus basin. Earth Syst. Dyn. Discuss. 2015, 6, 579–653. [Google Scholar] [CrossRef]
  5. Immerzeel, W.W.; Droogers, P.; de Jong, S.; Bierkens, M. Large-scale monitoring of snow cover and runoff simulation in Himalayan river basins using remote sensing. Remote Sens. Environ. 2009, 113, 40–49. [Google Scholar] [CrossRef]
  6. Lutz, A.; Immerzeel, W.; Shrestha, A.; Bierkens, M. Consistent increase in High Asia’s runoff due to increasing glacier melt and precipitation. Nat. Clim. Chang. 2014, 4, 587–592. [Google Scholar] [CrossRef]
  7. Ali, S.; Li, D.; Congbin, F.; Khan, F. Twenty first century climatic and hydrological changes over Upper Indus Basin of Himalayan region of Pakistan. Environ. Res. Lett. 2015, 10, 014007. [Google Scholar] [CrossRef]
  8. Khan, F.; Pilz, J.; Amjad, M.; Wiberg, D.A. Climate variability and its impacts on water resources in the Upper Indus Basin under IPCC climate change scenarios. Int. J. Glob. Warm. 2015, 8, 46–69. [Google Scholar] [CrossRef]
  9. Akhtar, M.; Ahmad, N.; Booij, M. The impact of climate change on the water resources of Hindukush- Karakorum-Himalaya region under different glacier coverage scenarios. J. Hydrol. 2008, 355, 148–163. [Google Scholar] [CrossRef]
  10. Tahir, A.A.; Chevallier, P.; Arnaud, Y.; Neppel, L.; Ahmad, B. Modeling snowmelt-runoff under climate scenarios in the Hunza River basin, Karakoram Range, Northern Pakistan. J. Hydrol. 2011, 409, 104–117. [Google Scholar] [CrossRef]
  11. Bocchiola, D.; Diolaiuti, G.; Soncini, A.; Mihalcea, C.; D’Agata, C.; Mayer, C.; Lambrecht, A.; Rosso, R.; Smiraglia, C. Prediction of future hydrological regimes in poorly gauged high altitude basins: The case study of the upper Indus, Pakistan. Hydrol. Earth Syst. Sci. 2011, 15, 2059–2075. [Google Scholar] [CrossRef]
  12. Naeem, U.A.; Hashmi, H.N.; Shamim, M.; Ejaz, N. Flow variations in Astore River under assumed glaciated extents due to climate change. Pak. J. Eng. Appl. Sci. 2012, 11, 73–81. [Google Scholar]
  13. Immerzeel, W.; Pellicciotti, F.; Bierkens, M. Rising river flows throughout the twenty-first century in two Himalayan glacierized watersheds. Nat. Geosci. 2013, 6, 742–745. [Google Scholar] [CrossRef]
  14. Soncini, A.; Bocchiola, D.; Confortola, G.; Bianchi, A.; Rosso, R.; Mayer, C.; Lambrecht, A.; Palazzi, E.; Smiraglia, C.; Diolaiuti, G. Future hydrological regimes in the Upper Indus Basin: A case study from a high-altitude glacierized catchment. J. Hydrometeorol. 2015, 16, 306–326. [Google Scholar] [CrossRef]
  15. Mishra, V. Climatic uncertainty in Himalayan water towers. J. Geophys. Res. Atmos. 2015, 120, 2689–2705. [Google Scholar] [CrossRef]
  16. Hasson, S.; Böhner, J.; Chishtie, F. Low fidelity of present-day climate modelling experiments and future climatic uncertainty over Himalayan watersheds of Indus basin. Clim. Dyn. 2016. under review. [Google Scholar]
  17. Fowler, H.; Archer, D. Conflicting signals of climatic change in the Upper Indus Basin. J. Clim. 2006, 19, 4276–4293. [Google Scholar] [CrossRef]
  18. Sheikh, M.; Manzoor, N.; Adnan, M.; Ashraf, J.; Khan, A.M. Climate Profile and Past Climate Changes in Pakistan; GCISC Report No. RR-01; Global Change Impact Studies Centre (GCISC): Islamabad, Pakistan, 2009. [Google Scholar]
  19. Khattak, M.S.; Babel, M.; Sharif, M. Hydro-meteorological trends in the upper Indus River basin in Pakistan. Clim. Res. 2011, 46, 103–119. [Google Scholar] [CrossRef]
  20. Minora, U.; Bocchiola, D.; D’Agata, C.; Maragno, D.; Mayer, C.; Lambrecht, A.; Mosconi, B.; Vuillermoz, E.; Senese, A.; Compostella, C.; et al. 2001–2010 glacier changes in the Central Karakoram National Park: A contribution to evaluate the magnitude and rate of the “Karakoram anomaly”. Cryosphere Discuss. 2013, 7, 2891–2941. [Google Scholar] [CrossRef]
  21. Bocchiola, D.; Diolaiuti, G. Recent (1980–2009) evidence of climate change in the upper Karakoram, Pakistan. Theor. Appl. Climatol. 2013, 113, 611–641. [Google Scholar] [CrossRef]
  22. Minora, U.; Bocchiola, D.; D’Agata, C.; Diolaiuti, G.; Mayer, C.; Lambrecht, A.; Vuillermoz, A.; Senese, A.; Compostella, C.; Smiraglia, C. Glacier area stability in the Central Karakoram National Park (Pakistan) in 2001–2010: The “Karakoram Anomaly” in the spotlight. Prog. Phys. Geogr. 2013. [Google Scholar] [CrossRef]
  23. Zafar, M.U.; Ahmed, M.; Rao, M.P.; Buckley, B.M.; Khan, N.; Wahab, M.; Palmer, J. Karakorum temperature out of phase with hemispheric trends for the past five centuries. Clim. Dyn. 2015, 46, 1943–1952. [Google Scholar] [CrossRef]
  24. Archer, D.R.; Fowler, H.J. Spatial and temporal variations in precipitation in the Upper Indus Basin, global teleconnections and hydrological implications. Hydrol. Earth Syst. Sci. 2004, 8, 47–61. [Google Scholar] [CrossRef]
  25. Hasson, S.; Lucarini, V.; Khan, M.; Petitta, M.; Bolch, T.; Gioli, G. Early 21st century snow cover state over the western river basins of the Indus River system. Hydrol. Earth Syst. Sci. 2014, 18, 4077–4100. [Google Scholar] [CrossRef]
  26. Tahir, A.A.; Adamowski, J.F.; Chevallier, P.; Haq, A.U.; Terzago, S. Comparative assessment of spatiotemporal snow cover changes and hydrological behavior of the Gilgit, Astore and Hunza River basins (Hindukush- Karakoram-Himalaya region, Pakistan). Meteorol. Atmos. Phys. 2016. [Google Scholar] [CrossRef]
  27. Hewitt, K. The Karakoram anomaly? Glacier expansion and the ‘elevation effect’, Karakoram Himalaya. Mt. Res. Dev. 2005, 25, 332–340. [Google Scholar] [CrossRef]
  28. Scherler, D.; Bookhagen, B.; Strecker, M.R. Spatially variable response of Himalayan glaciers to climate change affected by debris cover. Nat. Geosci. 2011, 4, 156–159. [Google Scholar] [CrossRef]
  29. Bhambri, R.; Bolch, T.; Kawishwar, P.; Dobhal, D.; Srivastava, D.; Pratap, B. Heterogeneity in glacier response in the upper Shyok valley, northeast Karakoram. Cryosphere 2013, 7, 1385–1398. [Google Scholar] [CrossRef] [Green Version]
  30. Rankl, M.; Kienholz, C.; Braun, M. Glacier changes in the Karakoram region mapped by multimission satellite imagery. Cryosphere 2014, 8, 977–989. [Google Scholar] [CrossRef]
  31. Hewitt, K. Glacier change, concentration, and elevation effects in the Karakoram Himalaya, Upper Indus Basin. Mt. Res. Dev. 2011, 31, 188–200. [Google Scholar] [CrossRef]
  32. Gardelle, J.; Berthier, E.; Arnaud, Y. Slight mass gain of Karakoram glaciers in the early twenty-first century. Nat. Geosci. 2012, 5, 322–325. [Google Scholar] [CrossRef]
  33. Gardelle, J.; Berthier, E.; Arnaud, Y.; Kaab, A. Region-wide glacier mass balances over the Pamir- Karakoram-Himalaya during 1999–2011. Cryosphere 2013, 7, 1885–1886. [Google Scholar] [CrossRef] [Green Version]
  34. Kaab, A.; Berthier, E.; Nuth, C.; Gardelle, J.; Arnaud, Y. Contrasting patterns of early twenty-first-century glacier mass change in the Himalayas. Nature 2012, 488, 495–498. [Google Scholar] [CrossRef] [PubMed]
  35. Kääb, A.; Treichler, D.; Nuth, C.; Berthier, E. Brief communication: Contending estimates of 2003–2008 glacier mass balance over the Pamir-Karakoram-Himalaya. Cryosphere 2015, 9, 557–564. [Google Scholar] [CrossRef]
  36. Sharif, M.; Archer, D.R.; Fowler, H.J.; Forsythe, N. Trends in timing and magnitude of flow in the Upper Indus Basin. Hydrol. Earth Syst. Sci. 2013, 17, 1503–1516. [Google Scholar] [CrossRef]
  37. Wi, S.; Yang, Y.; Steinschneider, S.; Khalil, A.; Brown, C. Calibration approaches for distributed hydrologic models in poorly gaged basins: Implication for streamflow projections under climate change. Hydrol. Earth Syst. Sci. 2015, 19, 857–876. [Google Scholar] [CrossRef]
  38. Quick, M.C.; Pipes, A. A combined snowmelt and rainfall runoff model. Can. J. Civ. Eng. 1976, 3, 449–460. [Google Scholar] [CrossRef]
  39. Arendt, A.; Bliss, A.; Bolch, T.; Cogley, J.G.; Gardner, A.S.; Hagen, J.-O.; Hock, R.; Huss, M.; Kaser, G.; Kienholz, C.; et al. Randolph Glacier Inventory—A Dataset of Global Glacier Outlines, 5th ed.; Global Land Ice Measurements from Space; Digital Media: Boulder, CO, USA, 2015. [Google Scholar]
  40. Krasovskaia, I.; Arnell, N.; Gottschalk, L. Flow regimes in northern and western Europe: Development and application of procedures for classifying flow regimes. IAHS Publ. 1994, 221, 185–192. [Google Scholar]
  41. SIHP. Snow and Ice Hydrology; Pakistan Phase-II Final Report to CIDA, IDRC File No.88-8009-00; International Development Research Centre: Ottawa, ON, Canada, 1997. [Google Scholar]
  42. Archer, D. Contrasting hydrological regimes in the upper Indus Basin. J. Hydrol. 2003, 274, 198–210. [Google Scholar] [CrossRef]
  43. Wake, C.P. Glaciochemical investigations as a tool for determining the spatial and seasonal variation of snow accumulation in the central Karakoram, northern Pakistan. Ann. Glaciol. 1989, 13, 279–284. [Google Scholar]
  44. Ali, G.; Hasson, S.; Khan, A.M. Climate Change: Implications and Adaptation of Water Resources in Pakistan; Technical Report GCISC-RR-13; Global Change Impact Studies Centre (GCISC): Islamabad, Pakistan, 2009. [Google Scholar]
  45. Palazzi, E.; Hardenberg, J.; Provenzale, A. Precipitation in the Hindu-Kush Karakoram Himalaya: Observations and future scenarios. J. Geophys. Res. Atmos. 2013, 118, 85–100. [Google Scholar] [CrossRef]
  46. Hasson, S.; Lucarini, V.; Pascale, S.; Böhner, J. Seasonality of the hydrological cycle in major South and Southeast Asian river basins as simulated by PCMDI/CMIP3 experiments. Earth Syst. Dyn. 2014, 5, 67–87. [Google Scholar] [CrossRef]
  47. Hasson, S.; Pascale, S.; Lucarini, V.; Böhner, J. Seasonal cycle of precipitation over major river basins in South and Southeast Asia: A review of the {CMIP5} climate models data for present climate and future climate projections. Atmos. Res. 2016, 180, 42–63. [Google Scholar] [CrossRef]
  48. Shaman, J.; Tziperman, E. The effect of ENSO on Tibetan Plateau snow depth: A stationary wave teleconnection mechanism and implications for the South Asian monsoons. J. Clim. 2005, 18, 2067–2079. [Google Scholar] [CrossRef]
  49. Syed, F.; Giorgi, F.; Pal, J.; King, M. Effect of remote forcings on the winter precipitation of central southwest Asia part 1: Observations. Theor. Appl. Climatol. 2006, 86, 147–160. [Google Scholar] [CrossRef]
  50. UNEP. As Compiled from USGS/NASA—Distributed Active Archive Center; United Nations Environment Programme: Geneva, Switzerland, 2015. [Google Scholar]
  51. Pipes, A.; Quick, M.C. Modelling large scale effects of snow cover. In Large Scale Effects of Seasonal Snow Cover; International Association of Hydrological Sciences Press & Institute of Hydrology: Wallingford, UK, 1987; pp. 151–160. [Google Scholar]
  52. Loukas, A.; Vasiliades, L.; Dalezios, N.R. Potential climate change impacts on flood producing mechanisms in southern British Columbia, Canada using the CGCMA1 simulation results. J. Hydrol. 2002, 259, 163–188. [Google Scholar] [CrossRef]
  53. Loukas, A.; Vasiliades, L. Streamflow simulation methods for ungauged and poorly gauged watersheds. Nat. Hazards Earth Syst. Sci. 2014, 14, 1641–1661. [Google Scholar] [CrossRef]
  54. Huntington, E. Pangong: A glacial lake in the Tibetan Plateau. J. Geol. 1906, 14, 599–617. [Google Scholar] [CrossRef]
  55. Brown, E.; Bendick, R.; Bourles, D.; Gaur, V.; Molnar, P.; Raisbeck, G.; Yiou, F. Early Holocene climate recorded in geomorphological features in Western Tibet. Palaeogeogr. Palaeoclimatol. Palaeoecol. 2003, 199, 141–151. [Google Scholar] [CrossRef]
  56. Hasson, S. Atypical uncertainties in modelling runoff from Hindukush-Karakoram-Himalaya, upper Indus basin. 2016; in preparation. [Google Scholar]
  57. Mayer, C.; Lambrecht, A.; Mihalcea, C.; Belò, M.; Diolaiuti, G.; Smiraglia, C.; Bashir, F. Analysis of glacial meltwater in Bagrot Valley, Karakoram: Based on short-term ablation and debris cover observations on Hinarche Glacier. Mt. Res. Dev. 2010, 30, 169–177. [Google Scholar] [CrossRef]
  58. Winiger, M.; Gumpert, M.; Yamout, H. Karakorum-Hindukush-western Himalaya: Assessing high-altitude water resources. Hydrol. Process. 2005, 19, 2329–2338. [Google Scholar] [CrossRef]
  59. Young, G.; Schmok, J. Ice loss in the ablation area of a Himalayan glacier: Studies on Miar Glacier, Karakorum Mountains, Pakistan. Ann. Glaciol. 1989, 13, 289–293. [Google Scholar]
  60. Young, G.; Hewitt, K. Hydrology research in the upper Indus basin, Karakoram Himalaya, Pakistan. Hydrol. Mt. Areas 1990, 190, 139–152. [Google Scholar]
  61. Hewitt, K. Tributary glacier surges: An exceptional concentration at Panmah Glacier, Karakoram Himalaya. J. Glaciol. 2007, 53, 181–188. [Google Scholar] [CrossRef]
  62. Tahir, A.A.; Chevallier, P.; Arnaud, Y.; Ashraf, M.; Bhatti, M.T. Snow cover trend and hydrological characteristics of the Astore River basin (Western Himalayas) and its comparison to the Hunza basin (Karakoram region). Sci. Total Environ. 2015, 505, 748–761. [Google Scholar] [CrossRef] [PubMed]
  63. Immerzeel, W.W.; Pellicciotti, F.; Shrestha, A.B. Glaciers as a proxy to quantify the spatial distribution of precipitation in the Hunza basin. Mt. Res. Dev. 2012, 32, 30–38. [Google Scholar] [CrossRef]
  64. Pratap, B.; Dobhal, D.; Mehta, M.; Bhambri, R. Influence of debris cover and altitude on glacier surface melting: A case study on Dokriani Glacier, central Himalaya, India. Ann. Glaciol. 2015, 56, 9–16. [Google Scholar] [CrossRef]
  65. Bolch, T.; Kulkarni, A.; Kääb, A.; Huggel, C.; Paul, F.; Cogley, J.; Frey, H.; Kargel, J.S.; Fujita, K.; Scheel, M.; et al. The state and fate of Himalayan glaciers. Science 2012, 336, 310–314. [Google Scholar] [CrossRef] [PubMed] [Green Version]
  66. Mihalcea, C.; Mayer, C.; Diolaiuti, G.; D’agata, C.; Smiraglia, C.; Lambrecht, A.; Vuillermoz, E.; Tartari, G. Spatial distribution of debris thickness and melting from remote-sensing and meteorological data, at debris-covered Baltoro glacier, Karakoram, Pakistan. Ann. Glaciol. 2008, 48, 49–57. [Google Scholar] [CrossRef]
  67. Minora, U.; Senese, A.; Bocchiola, D.; Soncini, A.; D’Agata, C.; Ambrosini, R.; Mayer, C.; Lambrecht, A.; Vuillermoz, E.; Smiraglia, C.; et al. A simple model to evaluate ice melt over the ablation area of glaciers in the Central Karakoram National Park, Pakistan. Ann. Glaciol. 2015, 56, 202–216. [Google Scholar] [CrossRef]
  68. Bajracharya, S.R.; Maharjan, S.B.; Shrestha, F.; Guo, W.; Liu, S.; Immerzeel, W.; Shrestha, B. The glaciers of the Hindu Kush Himalayas: Current status and observed changes from the 1980s to 2010. Int. J. Water Resour. Dev. 2015, 31, 161–173. [Google Scholar] [CrossRef]
  69. Herreid, S.; Pellicciotti, F.; Ayala, A.; Chesnokova, A.; Kienholz, C.; Shea, J.; Shrestha, A. Satellite observations show no net change in the percentage of supraglacial debris-covered area in northern Pakistan from 1977 to 2014. J. Glaciol. 2015, 61, 524–536. [Google Scholar] [CrossRef]
  70. SIHP. Snow and Ice Hydrology Project; Technical Report IDRC File No. 88-8009-00; Water and Power Development Authority (WAPDA), Hydrology and Research Directorate: Lahore, Pakistan, 1986. [Google Scholar]
  71. Mattson, L. Ablation on debris covered glaciers: An example from the Rakhiot Glacier, Panjab, Himalaya. IAHS Publ. 1993, 218, 289–296. [Google Scholar]
  72. Mihalcea, C.; Mayer, C.; Diolaiuti, G.; Lambrecht, A.; Smiraglia, C.; Tartari, G. Ice ablation and meteorological conditions on the debris-covered area of Baltoro glacier, Karakoram, Pakistan. Ann. Glaciol. 2006, 43, 292–300. [Google Scholar] [CrossRef]
  73. Krause, P.; Boyle, D.; Bäse, F. Comparison of different efficiency criteria for hydrological model assessment. Adv. Geosci. 2005, 5, 89–97. [Google Scholar] [CrossRef]
  74. Nash, J.E.; Sutcliffe, J.V. River flow forecasting through conceptual models part I—A discussion of principles. J. Hydrol. 1970, 10, 282–290. [Google Scholar] [CrossRef]
  75. Mukhopadhyay, B.; Khan, A.; Gautam, R. Rising and falling river flows: Contrasting signals of climate change and glacier mass balance from the eastern and western Karakoram. Hydrol. Sci. J. 2015, 60, 2062–2085. [Google Scholar] [CrossRef]
  76. Gioli, G.; Khan, T.; Scheffran, J. Climatic and environmental change in the Karakoram: Making sense of community perceptions and adaptation strategies. Reg. Environ. Chang. 2014, 14, 1151–1162. [Google Scholar] [CrossRef]
  77. Theil, H. A rank-invariant method of linear and polynomial regression analysis. In Collection of Henri Theil’s Contributions to Economics and Econometrics; Springer: Basel, Switzerland, 1992; pp. 345–381. [Google Scholar]
  78. Sen, P.K. Estimates of the regression coefficient based on Kendall’s tau. J. Am. Stat. Assoc. 1968, 63, 1379–1389. [Google Scholar] [CrossRef]
  79. Semenov, M.A.; Pilkington-Bennett, S.; Calanca, P. Validation of ELPIS 1980-2010 baseline scenarios using the observed European Climate Assessment data set. Clim. Res. 2013, 57, 1–9. [Google Scholar] [CrossRef]
  80. Moss, R.H.; Edmonds, J.A.; Hibbard, K.A.; Manning, M.R.; Rose, S.K.; van Vuuren, D.P.; Carter, T.R.; Emori, S.; Kainuma, M.; Kram, T.; et al. The next generation of scenarios for climate change research and assessment. Nature 2010, 463, 747–756. [Google Scholar] [CrossRef] [PubMed]
  81. Van Vuuren, D.P.; Edmonds, J.; Kainuma, M.; Riahi, K.; Thomson, A.; Hibbard, K.; Hurtt, G.C.; Kram, T.; Krey, V.; Lamarque, J.F.; et al. The representative concentration pathways: An overview. Clim. Chang. 2011, 109, 5–31. [Google Scholar] [CrossRef]
  82. Islam, S.; Rehman, N.; Sheikh, M.M.; Khan, A.M. High Resolution Climate Change Scenarios over South Asia Region Donscaled by Regional Climate Model PRECIS for IPCC SRES A2 Scneario; Technical Report GCISC-RR-06; Global Change Impact Studies Centre (GCISC): Islamabad, Pakistan, 2009. [Google Scholar]
  83. Kulkarni, A.; Patwardhan, S.; Kumar, K.K.; Ashok, K.; Krishnan, R. Projected climate change in the Hindu Kush-Himalayan region by using the high-resolution regional climate model PRECIS. Mt. Res. Dev. 2013, 33, 142–151. [Google Scholar] [CrossRef]
  84. Syed, F.S.; Iqbal, W.; Syed, A.A.B.; Rasul, G. Uncertainties in the regional climate models simulations of South-Asian summer monsoon and climate change. Clim. Dyn. 2014, 42, 2079–2097. [Google Scholar] [CrossRef]
  85. Rajbhandari, R.; Shrestha, A.; Kulkarni, A.; Patwardhan, S.; Bajracharya, S. Projected changes in climate over the Indus river basin using a high resolution regional climate model (PRECIS). Clim. Dyn. 2015, 44, 339–357. [Google Scholar] [CrossRef]
  86. Iqbal, W.; Syed, F.; Sajjad, H.; Nikulin, G.; Kjellström, E.; Hannachi, A. Mean climate and representation of jet streams in the CORDEX South Asia simulations by the regional climate model RCA4. Theor. Appl. Climatol. 2016. [Google Scholar] [CrossRef]
  87. Hasson, S. Seasonality of Precipitation over Himalayan Watersheds in CORDEX South Asia and their CMIP5 forcing experiments. Atmosphere 2016. under review. [Google Scholar]
  88. Hasson, S.; Lucarini, V.; Pascale, S. Hydrological cycle over South and Southeast Asian river basins as simulated by PCMDI/CMIP3 experiments. Earth Syst. Dyn. 2013, 4, 199–217. [Google Scholar] [CrossRef]
  89. Finger, D.; Vis, M.; Huss, M.; Seibert, J. The value of multiple data set calibration versus model complexity for improving the performance of hydrological models in mountain catchments. Water Resour. Res. 2015, 51, 1939–1958. [Google Scholar] [CrossRef]
  90. Rees, G.; Collins, D. An Assessment of the Potential Impacts of Deglaciation on the Water Resources of the Himalaya; Technical Report R7890; Centre for for Ecology and Hydrology: Oxfordshire, UK, 2004. [Google Scholar]
  91. Singh, P.; Kumar, N. Impact assessment of climate change on the hydrological response of a snow and glacier melt runoff dominated Himalayan river. J. Hydrol. 1997, 193, 316–350. [Google Scholar] [CrossRef]
  92. Kundzewicz, Z.W.; Gerten, D. Grand challenges related to the assessment of climate change impacts on freshwater resources. J. Hydrol. Eng. 2014, 20, A4014011. [Google Scholar] [CrossRef]
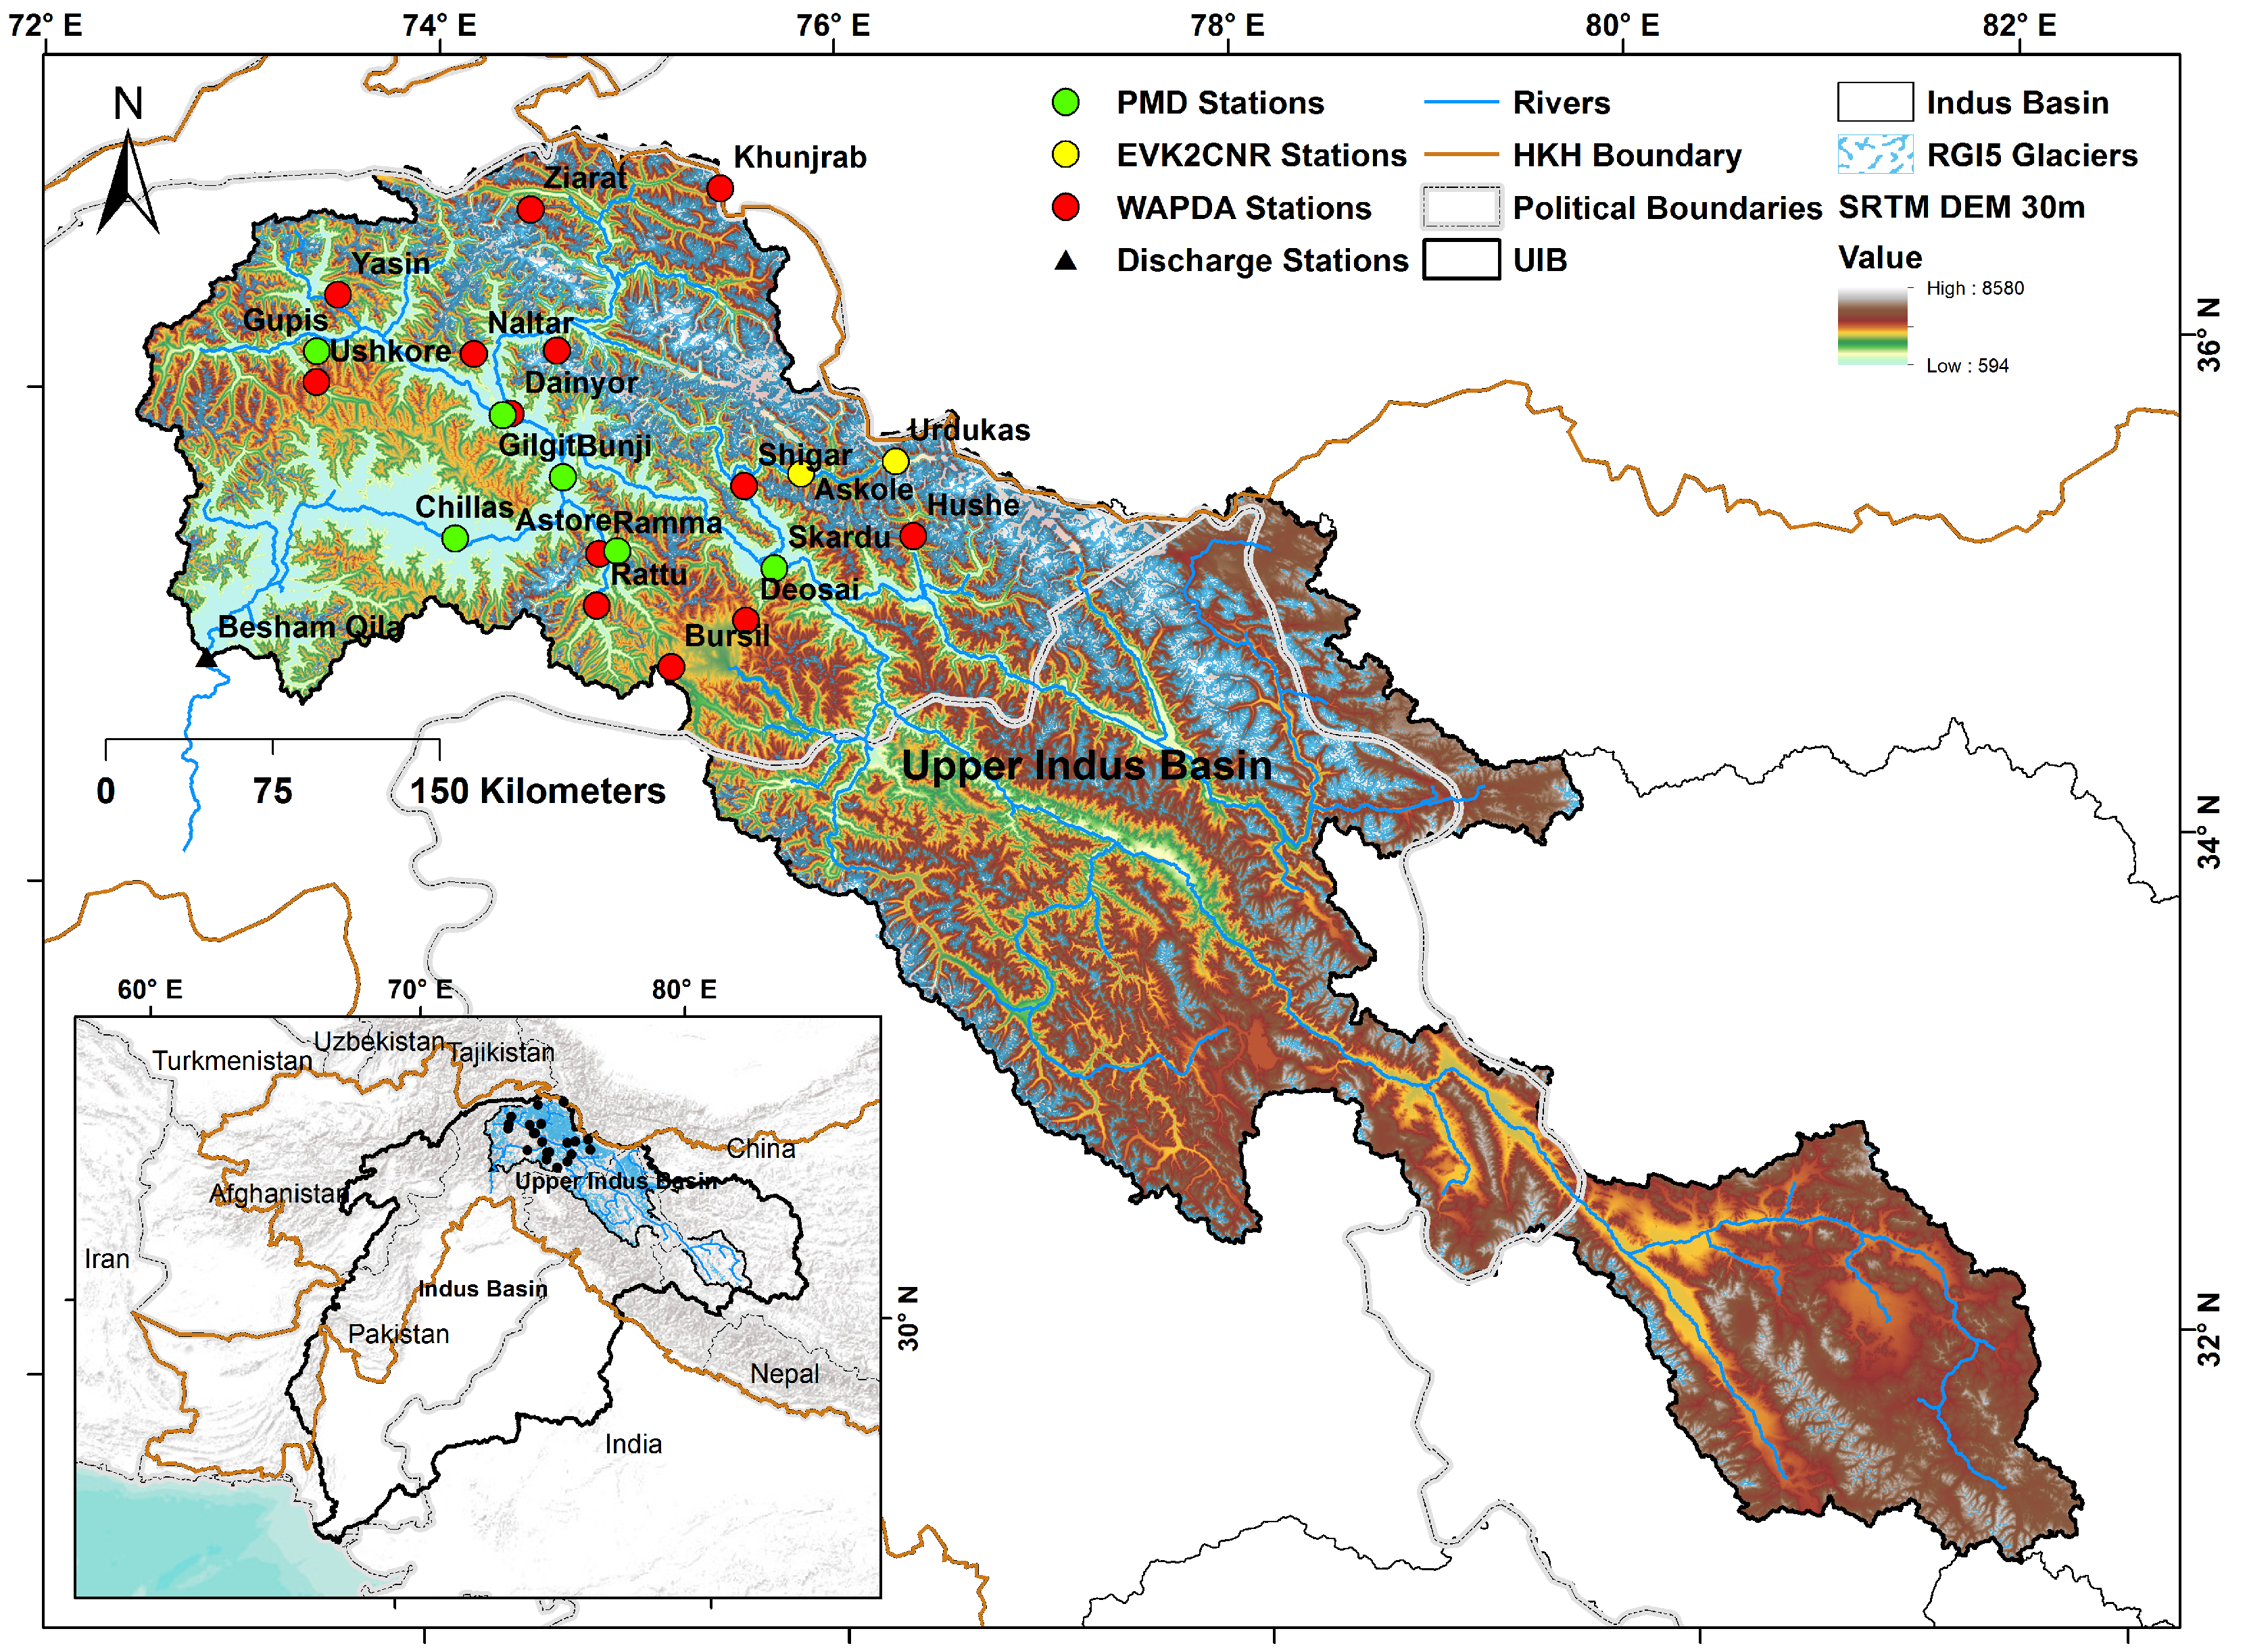
Figure 1. The upper Indus basin (UIB) along with the station network, Hindukush-karakoram-Himalayan (HKH) Ranges and the cryosphere.
Climate 04 00040 g001
Figure 2. The schematic diagram of the UBC watershed model.
Climate 04 00040 g002
Figure 3. (a) Area elevation curve (AEC), along with the demarcation of considered elevation bands, height of used meteorological stations, band-wise surface area and glacier cover; (b) Spatial description of twelve elevation bands identified based on AEC. Note: The elevations are given in the unit of meters while the areas are given in the unit of 1000 km 2 .
Climate 04 00040 g003
Figure 4. Decadal trends in maximum (Tx), minimum (Tn) temperatures ( C) and precipitation (P in mm). Trends significant at 90% level are given in bold. Negative signs and blue/yellow colors indicate decrease while non-negative values and red/green colors indicate increase. Note: After [4].
Climate 04 00040 g004
Figure 5. Long-term trends and variability of the UIB hydrological regime at the Besham Qila site. The blue bars indicate the times of a year when the UIB hydrological regime features significant negative trends while the red bars indicate the opposite. Inset shows the flow duration curve.
Climate 04 00040 g005
Figure 6. (a) Results of calibration (1994/95–2002/03) and validation (2003/04–2011/12) of the UBC watershed model for the UIB at Besham Qila; (b,c) for the calibration period only; (d,e) for the validation period only; (f,g) for the whole period.
Climate 04 00040 g006
Figure 7. Observed (Obs), generated by LARS-WG weather generator (Gen) for period 1995–2012 and perturbed for short term hypothetical climate change scenario (Scn) for period 2013–2030 for maximum (Tx), minimum (Tn) temperatures ( C) and precipitation (P in mm), (a) Hushe; (b) Khunjrab; (c) Naltar.
Climate 04 00040 g007
Figure 8. Results of near-future hypothetical climate change scenario (2013–2030), suggesting the continuation of prevailing climatic trends to near-future. Inset more clearly shows the snowmelt and rainfall outflow.
Climate 04 00040 g008
Figure 9. Results of far-future climate change scenario as projected by seven (low fidelity) CORDEX-SA regional climate modeling experiments under the representative concentration pathway (RCP) 8.5 forcing by the end of 21st century (2087–2097) with glacier cover: (a) intact; (b) −50%; (c) −100%.
Climate 04 00040 g009
Table 1. High-altitude meteorological stations and outlet discharge gauge.
S. No.Station NameFromToAgencyLatitudeLongitudeHeight (m)Basin
Meteorological Stations
1.Khunjrab19952012WAPDA36.84111075.4191704440Hunza
2.Naltar19952012WAPDA36.16667074.1830002898Hunza
3.Hushe19952012WAPDA35.42389076.3670003075Shyok
Discharge Station
1.Besham Qila19692012WAPDA34.92416775.381944580UIB
Table 2. The List of seven CORDEX South Asia experiments for RCP8.5 and their CMIP5 forcing.
S. No.Experiment NameForcing GCMRCM Employed
1ACCESS1-0_CCAMACCESS1-0CCAM—Conformal-Cubic Atmospheric Model from Commonwealth Scientific and Industrial Research Organization
2CCSM4_CCAMCCSM4CCAM
3CNRM-CM5_CCAMCNRM-CM5CCAM
4GFDL-CM3_CCAMGFDL-CM3CCAM
5MPI-ESM-LR_CCAMMPI-ESM-LRCCAM
6EC-EARTH_RCA4EC-EARTHRCA4—Rossby Centre regional atmospheric model version 4-2
7MPI-ESM-LR_REMOiMPI-ESM-LRREMO—The Regional Model for climate simulations was jointly developed by Max Plank Institute for Meteorology (MPI-M) and German Climate Computing Centre (DKRZ)
Table 3. Geophysical characteristics of the UIB watershed by elevation zone. Elevation is given in meters while areas are given in km 2 .
ParametersElevation Bands
123456789101112
Mid-elevation (meters)190228843347358439144373474650085321567860927180
Area (km 2 )584097655016656514,79332,83721,32420,99528,20614,9864840149
Forested fraction0.150.080.040.020.010.000.000.000.000.000.000.00
Forest canopy density0.130.080.380.030.010.000.000.000.000.000.000.00
Orientation index
(0 = North,1 = South)0.890.910.890.900.900.980.980.900.980.870.890.00
Glacier cover (km 2 )
RGI5 Actual0.3102.5111.1194.9639.61980.31917.72402.74533.34158.83171.9157.0
For debris-cover ablation0.251.355.597.4319.81536.01917.72402.74533.34158.83171.9157.0
South-oriented
glaciated fraction0.940.890.950.950.940.940.960.950.940.940.950.96
Table 4. Monthly change factors derived for the period 2013–2030 relative to 1995–2012 for devising a near-future scenario.
Change FactorsVariableJanFebMarAprMayJunJulAugSepOctNovDec
NaltarTx−0.16−1.071.55−0.561.870.88−2.31−0.58−3.90.48−0.45−0.16
Tn1.282.83.241.190.63−0.23−1.070.25−0.711−0.170.58
P2.391.460.310.680.470.941.041.131.620.350.771.18
HusheTx−0.53−0.51.14−0.243.41−1.18−1.490.59−3.58−1.72−0.070.76
Tn0.072.721.710.412.66−0.94−1.40.58−1.21−0.870.920.47
P0.920.62−0.080.31−0.110.01−0.090.450.660.040.661.36
KhunjrabTx0.95−0.231.880.491.86−0.33−1.691.09−3.030.161.920.9
Tn2.954.543.150.42.91−1.06−0.86−0.77−0.360.592.771.75
P1.71.761.681.251−0.050.310.741.161.461.091.78
Table 5. Calibration and validation results of the UBC model applied over the UIB at Besham Qila.
Simulation PeriodNSEVE%EOPTDRMSE (m3·s−1)
CalibrationOctober 1994 to September 20030.9−0.010.90.9810
ValidationOctober 2003 to September 20120.85−2.240.820.831027
OverallOctober 1994 to September 20120.87−1.150.860.86925
Table 6. Performance of the LARS-WG against the observations (1995–2012).
StationVariableAnnual BiasAbsolute RMSERelative RMSE
HusheTmin0.010.1460.017
Tmax−0.030.2130.015
P0.63.6420.086
NaltarTmin0.190.2640.038
Tmax−0.050.2430.018
P−0.535.4810.088
KhunjrabTmin−0.160.340.027
Tmax0.020.230.029
P0.11.2740.072
Table 7. Percentage Change in the future water availability under near- (2013–2030) and far-future (2087–2097) climate change scenarios.
Discharge
Components
% Change Near-Future% Change Far-Future% Change Far-Future%Change Far-Future
Glacier Cover IntactGlacier Cover IntactGlacier Cover (−50%)No Glacier Cover (−100%)
MinMaxMedianMinMaxMedianMinMaxMedianMinMaxMedian
Snowmelt1.613.97−2742516224−45819
Glacier melt−20.8−25.2−23.5166433295−411654−100−100−100
Rainfall−0.3−43.4−29.2205520344154442286104366233
Groundwater−0.231.85610186−5−25−19−29−48−45
Total Discharge−5.8−9.9−7.596220163−45424−22−51−40