1. Introduction
Climate change is increasingly affecting the planning and safety of outdoor events through rising temperatures, more frequent heat extremes, and deteriorating thermal comfort. Global mean temperature has increased substantially since the pre-industrial period, and further warming is expected over the coming decades [
1,
2,
3]. These changes affect a wide range of outdoor activities, including cultural events, mass gatherings, recreational activities, and sporting competitions, where thermal conditions can influence participant comfort, health, event continuity, and operational management [
4,
5]. The implications are particularly important for outdoor sport because physical exercise generates considerable metabolic heat while high air temperature, humidity, solar radiation, and weak ventilation can restrict heat dissipation. Under such conditions, the risks of dehydration and exertional heat illness increase [
6], while thermoregulatory strain can compromise athletic performance and safety [
7,
8]. Weather conditions can therefore influence not only athletes’ physiological responses and performance but also competition scheduling, fairness, medical preparedness, and the continuity of sporting events. These concerns have already led international sporting organizations to promote heat-acclimatization strategies, cooling and hydration measures, enhanced medical preparedness, and schedule adaptation for competitions conducted in hot environments [
8,
9].
Heat-risk assessment in sport has consequently evolved from the use of simple meteorological variables toward biometeorological indices that integrate several components of the outdoor thermal environment. The Wet-Bulb Globe Temperature (WBGT) remains one of the most established operational indices for sport, occupational health, and military activities because it incorporates the effects of air temperature, humidity, wind, and solar radiation [
10,
11]. However, WBGT has recognized physiological and methodological limitations [
12]. The Universal Thermal Climate Index (UTCI) provides a complementary approach based on a multi-node thermophysiological model that integrates air temperature, humidity, wind speed, and mean radiant temperature to characterize human thermal strain [
13,
14]. Recent research on major sporting events has increasingly extended these indices toward questions of heat-risk management and adaptation. Bandiera et al. [
15], for example, examined heat-related risk and international federation policies for Paris 2024, while Lucio and Gomes [
16] assessed outdoor thermal comfort in the climatic context of the Qatar 2022 FIFA World Cup. At the African scale, Sawadogo et al. [
17] showed that global warming may progressively affect the climatic suitability of locations for hosting major sporting competitions. This issue is particularly relevant because Africa and West Africa are projected to experience substantial increases in temperature, heat extremes, and population exposure to heat stress during the coming decades [
18,
19,
20,
21].
Despite these advances, an important methodological gap remains between the characterization of environmental heat conditions and their translation into operational decision support. Existing studies frequently focus on individual thermal indices, climatological characterization, future climate suitability, or sport-specific management policies, whereas approaches combining complementary biometeorological indices, climatological probabilities of threshold exceedance, and explicit decision-support procedures remain comparatively limited, particularly in tropical and subtropical environments.
From a climate-services perspective, the value of climate information lies not only in producing meteorological or climatological data, but also in transforming these data into decision-relevant products that support practical actions. This process is commonly described as the climate-service value chain, progressing from climate data generation and analysis to tailored climate information, risk assessment, decision support, and ultimately user action [
22,
23]. The framework proposed in this study explicitly follows this sequence by translating ERA5-derived climatological information into biometeorological indices, exceedance probabilities, operational risk categories, and venue-specific scheduling guidance for event organizers, national meteorological services, sports federations, medical teams, and emergency planners. Heat-health warning approaches similarly emphasize this progression from climate information to graduated preparedness and response rather than meteorological monitoring alone [
24].
The Dakar 2026 Youth Olympic Games (YOG) provides a relevant case study for addressing this gap. Dakar, the capital of Senegal, is located on the Atlantic coast of West Africa, and the Dakar 2026 YOG will constitute the first Olympic event organized on the African continent. Competitions will take place across Dakar, Diamniadio, and Saly, which differ in their exposure to maritime and more continental climatic influences. The event therefore provides an opportunity to investigate how climatological thermal information can be translated into operational planning guidance in an African tropical-to-semi-arid context.
Against this background, this study develops an operational climate-service framework for heat-risk management using the Dakar 2026 Youth Olympic Games as a case study. The framework integrates two complementary biometeorological indices, the WBGT and UTCI, with climatological exceedance probabilities and a hierarchical decision-support approach for climate-informed competition scheduling. Specifically, the objectives are to (i) analyze the recent evolution of heat-stress conditions across the competition zones; (ii) characterize their spatial and hourly variability; (iii) quantify the probabilities of exceeding internationally established operational heat-stress thresholds; (iv) identify the time windows and zones most favorable for outdoor competition; and (v) translate climatological information into actionable guidance for event organizers, meteorological services, and health teams. The scientific contribution of this study lies in developing and demonstrating a transferable climate-services methodology that integrates complementary biometeorological indices, climatological exceedance probabilities, and hierarchical operational decision-support procedures into a unified framework for heat-risk management. Although demonstrated using the Dakar 2026 Youth Olympic Games as a case study, the proposed methodology is designed to be transferable, with appropriate local adaptation, to major outdoor sporting events in tropical and subtropical environments.
2. Materials and Methods
2.1. Study Area and Competition Venues
Senegal lies on the Atlantic coast of West Africa (12–17° N), where the climate is influenced by the combined effects of the Atlantic Ocean and the West African Monsoon. According to the Köppen–Geiger climate classification [
25], the three Olympic competition zones (Dakar, Diamniadio and Saly) are predominantly located within the hot semi-arid (BSh) climate zone, while the southern part of the study area lies close to the transition toward the tropical savanna (Aw) climate. This climatic setting generates marked spatial gradients in temperature, humidity, ventilation and marine influence across the study area, which are directly relevant to outdoor thermal comfort and heat-stress conditions. Late October to early November corresponds to the transition between the rainy and the dry season; although rainfall becomes rare, high temperatures combined with residual humidity and strong solar radiation can generate substantial thermal strain during outdoor physical activity.
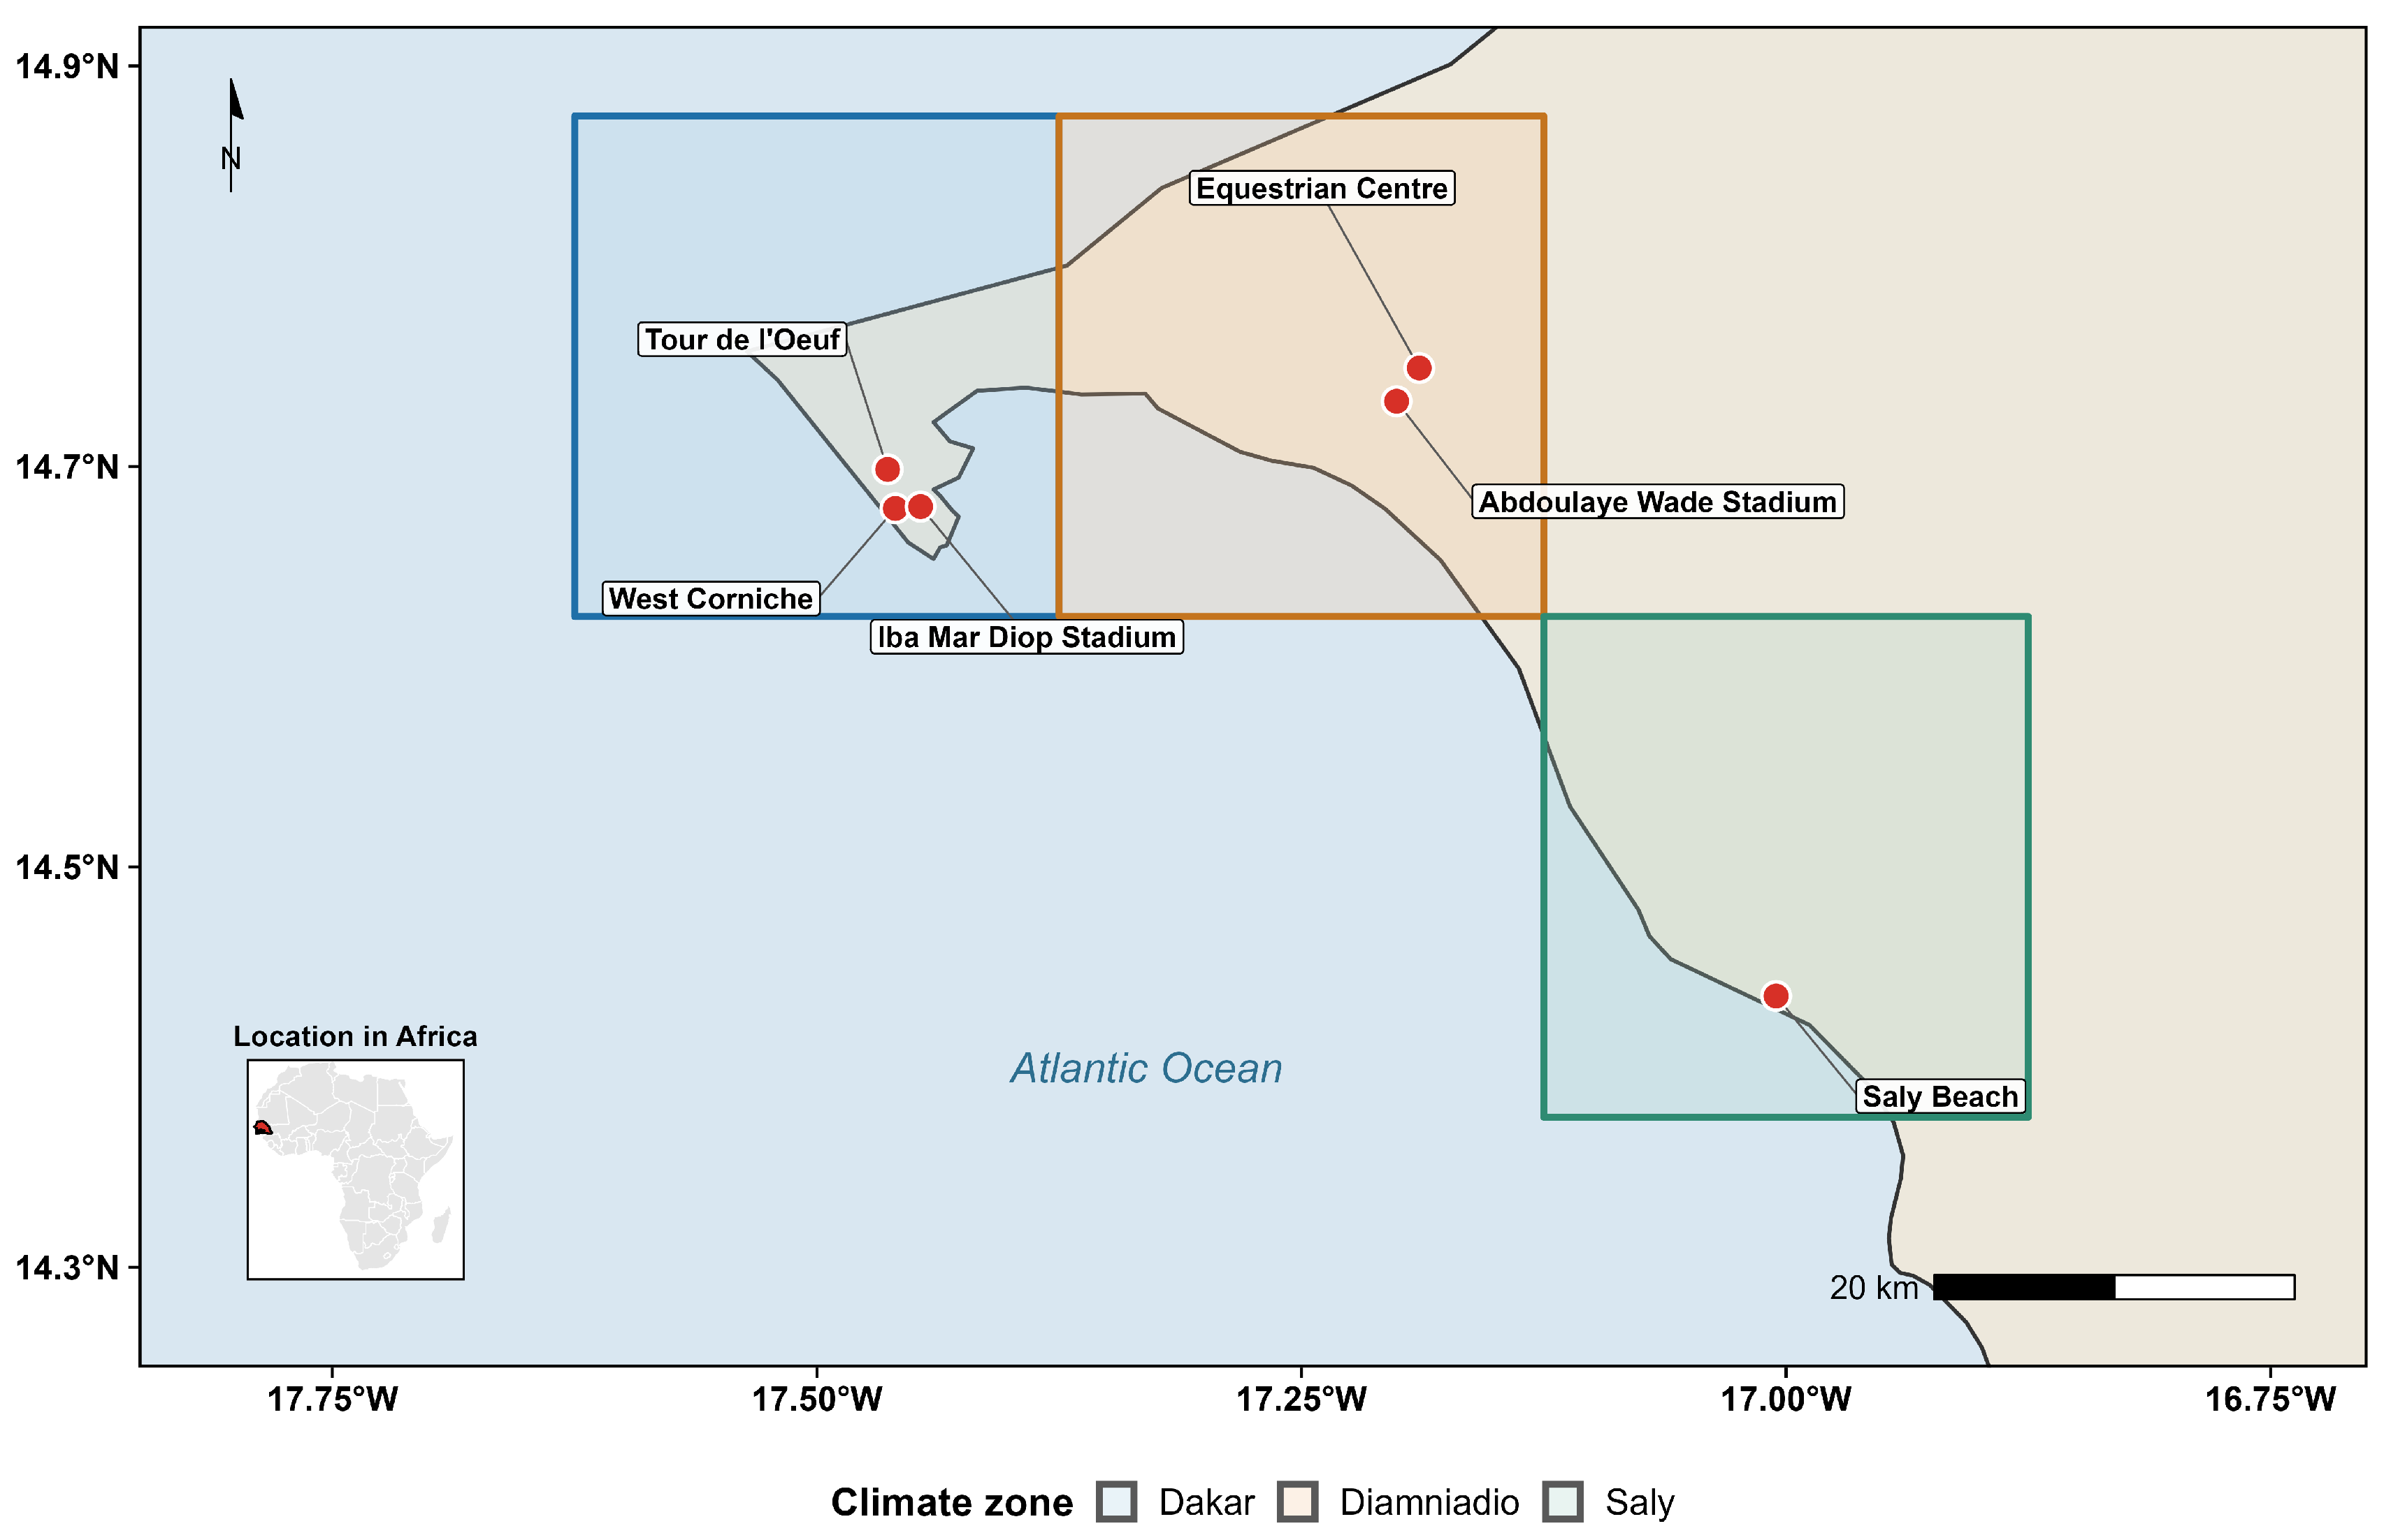
Unlike most previous YOG editions, the Dakar 2026 competitions will be distributed across three distinct geographical clusters, Dakar, Diamniadio and Saly (
Figure 1), with contrasting geographical and environmental settings likely to influence local heat-stress conditions. Because the WBGT and UTCI characterize outdoor thermal conditions, the analysis focuses on the six outdoor competition venues; the indoor venues (Dakar Arena and Dakar Expo Centre, in Diamniadio) are excluded, since indoor conditions are not represented by these indices.
The Dakar zone, located on the Cap-Vert peninsula and directly exposed to the maritime influence of the Atlantic Ocean, includes the Iba Mar Diop Stadium, the West Corniche and the Tour de l’Œuf. The Diamniadio zone, about 25 km east of Dakar, groups the outdoor venues of the Abdoulaye Wade Stadium and the Equestrian Centre; further from the coast, this peri-urban zone experiences a more limited oceanic influence and displays more continental thermal characteristics. Finally, the Saly zone, on the Petite Côte about 70 km south of Dakar, is represented by the Saly Beach venue, where interactions between coastal conditions, atmospheric humidity and solar radiation can lead to high levels of heat stress.
At the ERA5 resolution (0.25°), venues located within the same zone fall into the same grid cell. Therefore, the analysis is effectively conducted at the scale of the three competition zones rather than at the microclimatic scale of each individual venue. Throughout the manuscript, results and recommendations should consequently be interpreted as zone-scale information representative of the venues contained, not as a resolved venue-by-venue assessment.
2.2. Data
This study relies on the ERA5 reanalysis produced by the European Centre for Medium-Range Weather Forecasts (ECMWF) within the Copernicus Climate Change Service (C3S) [
26]. ERA5 data provide hourly meteorological variables globally, at a spatial resolution of 0.25° × 0.25° (≈25 km). The ERA5 is not a remote-sensing product. It is a global atmospheric reanalysis that combines numerical weather prediction with assimilated observations from multiple observing systems to provide spatially and temporally consistent meteorological fields [
26]. Therefore, UTCI was not retrieved directly from satellite observations; instead, it was calculated from ERA5 meteorological and radiative variables following the established UTCI procedure.
The variables used are 2 m air temperature (Ta), 2 m dew-point temperature (Td), surface pressure (SP), the zonal (U10) and meridional (V10) components of the 10 m wind, surface solar radiation downwards (SSRD), total sky direct solar radiation at the surface (FDIR) and surface thermal radiation downwards (STRD). The 10 m wind speed (V) was computed from U10 and V10, and relative humidity (RH) was derived from Ta and Td. Senegal is on GMT (UTC+0) with no daylight-saving time, so local time in the analyses corresponds directly to ERA5 UTC time.
For each venue, hourly series were extracted from the ERA5 grid cell nearest to the venue coordinates. Only the hours falling within the Games window (31 October–13 November) were retained, for each year from 1991 to 2025. An identical 14-day window was extracted for every year, so all annual samples contain the same number of hourly observations; therefore, leap years require no specific treatment, since the selected window lies after 29 February in all cases.
The 1991–2025 period was selected for three reasons. First, it combines the standard 30-year WMO climatological reference period (1991–2020) with the five most recent years, so that the climatology used for planning reflects the most recent conditions rather than a baseline that ends five years before the event. Second, it provides a 35-year sample, sufficiently long for a robust estimation of high percentiles and trends within a 14-day window. Third, it avoids the earliest ERA5 decades for which the assimilated observing system over West Africa is sparser and less homogeneous, and which are of limited relevance for characterizing the conditions expected in 2026.
Because of the 0.25° resolution and the coastal position of the Dakar and Saly venues, the selected grid cell may be partly influenced by the ocean surface; this limitation is taken into account in the interpretation of the spatial gradient (
Section 4.5).
2.3. Thermal Stress Indices
Heat stress was assessed using two complementary biometeorological indices: the WBGT and UTCI. The WBGT is widely used for heat-risk assessment in sporting, occupational and military activities because it integrates the combined effects of air temperature, humidity, wind and solar radiation [
8,
10]. The UTCI is based on the UTCI-Fiala multi-node thermophysiological model of human heat exchange and incorporates air temperature, humidity, wind speed and mean radiant temperature (
), thereby providing a complementary physiologically based characterization of outdoor thermal stress [
13,
14].
The meteorological variables influence these indices through distinct physical mechanisms. Increasing air temperature enhances sensible heat load, high atmospheric humidity reduces the efficiency of evaporative cooling, and wind promotes convective and evaporative heat loss. Short-wave and long-wave radiation determine the radiant heat load experienced by the human body and are represented through globe temperature in the WBGT and
in the UTCI [
12,
13,
14].
For sunny outdoor conditions, WBGT follows the ISO 7243:2017 [
10] formulation:
where
is the natural wet-bulb temperature (°C),
the black-globe temperature (°C) and
is air temperature (°C).
The UTCI is an equivalent temperature derived from four environmental inputs and can be represented functionally as:
where
is mean radiant temperature (°C), V is wind speed (m s
−1), and RH is relative humidity (%). Mean radiant temperature represents the combined radiant heat load from the surrounding environment and constitutes the principal radiative input to the UTCI model [
13,
14].
Since
,
and
are not provided directly by ERA5 data, they were diagnostically derived from the ERA5 meteorological and radiative fields. Mean radiant temperature was calculated from the downward short-wave (SSRD, FDIR) and long-wave (STRD) radiation fluxes using the radiative-balance approach implemented for ECMWF thermal-comfort applications [
27]. The WBGT was then computed using the iterative physical model of Liljegren et al. [
28], which explicitly solves the energy balance of the natural wet bulb and black globe, while the UTCI was calculated using the operational polynomial approximation of Bröde et al. [
13].
The UTCI additionally assumes a standardized reference person walking at approximately 4 km h
−1 (metabolic rate ≈ 135 W m
−2; 2.3 MET), with clothing insulation dynamically adjusted according to outdoor air temperature through the UTCI clothing model [
13,
14]. These standardized assumptions were retained without modification, and therefore UTCI should be interpreted as a standardized environmental thermal-stress indicator rather than a sport-specific prediction of individual physiological response.
Both indices were derived directly from the same ERA5 variables and competition-zone grid cells rather than from the ERA5-HEAT product [
29]. This ensured methodological consistency between the WBGT and UTCI, allowed explicit implementation of the outdoor in-sun WBGT formulation relevant for sport, and provided complete transparency for the threshold and sensitivity analyses developed in this study. ERA5-HEAT nevertheless constitutes an important benchmark, and comparison with this product is identified as a priority for future research.
Finally, although WBGT and UTCI were computed using internationally accepted physical algorithms, their inputs originate from atmospheric reanalysis rather than in situ observations. Consequently, uncertainties in ERA5 meteorological and radiative fields, particularly under partly cloudy conditions or strong solar forcing, propagate into the estimated thermal indices. The results should therefore be interpreted as physically consistent estimates of temporal variability, spatial gradients and relative heat-stress conditions rather than as direct instrumental measurements, an approach widely adopted in climatological studies based on reanalysis [
28,
29,
30].
2.4. Statistical Analysis
The 90th percentile (P90) was used to characterize recurrent high heat-stress conditions during the Games window. P90 was preferred over P95 or maximum values in order to represent heat conditions likely to occur regularly during the Games, while limiting the influence of isolated extreme values; therefore, it provides a robust indicator of the operational conditions that athletes are most likely to encounter. It should be made explicit that P90 represents recurrent high-risk conditions and not worst-case risk: rare but potentially dangerous heat episodes may exceed the levels reported here, and real-time monitoring remains necessary during the event. This percentile-based approach is widely used to characterize recurrent climate extremes, including in IPCC assessments [
2,
31,
32,
33,
34].
The climatological diurnal cycle was obtained by computing the P90 of WBGT and UTCI for each local hour from 06:00 to 22:00, the official competition window of the Dakar 2026 YOG, and for each of the three zones, over the whole 1991–2025 period restricted to the Games window.
The evolution of heat stress was analyzed from the annual P90 series (one value per year and per zone). An ordinary least-squares (OLS) linear regression was fitted to each series; slopes are expressed in °C decade
−1, and their significance is assessed from the
p-value of the coefficient at the 0.05 level [
35,
36]. Two caveats apply to this analysis and are stated explicitly. First, OLS assumes independent, homoscedastic and approximately normal residuals; with 35 annual values, moderate departures from these assumptions cannot be excluded, and the reported
p-values should be interpreted as indicative rather than definitive. Complementing OLS with a non-parametric Mann–Kendall test and Sen’s slope estimator, and reporting 95% confidence intervals for the slopes, would provide a more robust assessment and is identified as a priority revision (
Section 4.5). Second, six trend tests are performed (two indices × three zones) without correction for multiple hypothesis testing, which increases the probability of a Type I error; the trends reported below should be read with this in mind, even though the consistency of the sign and magnitude of the slopes across indices and zones argues against a spurious result.
Exceedance probabilities: The frequency of conditions likely to affect competition safety was estimated, for each venue and each hour, as the probability of exceeding the main operational thresholds:
where
≥
is the number of hours exceeding the threshold and N the total number of hours. The thresholds used correspond to current international recommendations for heat-risk assessment during outdoor physical activity. For WBGT, the thresholds of 28, 30 and 32 °C correspond to moderate, high and extreme risk levels [
8,
10,
37,
38]. For UTCI, the thresholds of 32, 38 and 46 °C correspond to the moderate, strong and very strong heat-stress categories defined by the UTCI consortium [
13,
14,
39].
These thresholds, already established internationally and validated against physiological responses and heat-illness records, were deliberately left unmodified. This choice is reinforced by the nature of the YOG: athletes aged 15–17 come from very diverse climatic backgrounds and display heterogeneous levels of acclimatization. Using a standard, internationally recognized set of thresholds ensures comparability of results and protects the least acclimatized delegations, whereas locally calibrated thresholds would risk underestimating the risk for non-acclimatized athletes [
8,
10,
37,
38].
For visualization and inter-venue comparison, hourly exceedance probabilities were grouped into four classes (0–10%, 10–30%, 30–60% and 60–100%). This classification is a synthesis tool intended to facilitate interpretation; it does not define regulatory thresholds, which remain those of the operational WBGT and UTCI values [
22,
23,
24].
2.5. Operational Scheduling Framework
To translate biometeorological information into directly usable guidance, an operational decision framework was developed, consistent with international recommendations on conducting sports in the heat [
8,
10,
38,
40]. The methodological workflow implemented in this study follows the climate-service value chain described in the Introduction. ERA5 climate data are first transformed into biometeorological indices (WBGT and UTCI), then into climatological exceedance probabilities and operational risk categories, and finally into venue-specific scheduling recommendations intended to support decision making by event organizers and other stakeholders.
For each venue and each local hour, the exceedance probability was computed for each of the six thresholds, and the two indices were then combined using a conservative rule that retains, at each severity level, the higher of the two probabilities:
- -
;
- -
;
- -
.
The maximum was preferred over alternatives such as joint exceedance, weighted scoring, or two separate decision matrices, for three reasons. Joint exceedance (requiring both indices to exceed their threshold simultaneously) would be the least conservative option and would systematically discard the warning issued by the index that is more sensitive to the dominant local driver, humidity at Saly, radiation inland. Weighted scoring would require weights that are not supported by evidence for this population and would blur the physical meaning of the internationally recognized thresholds. Two separate matrices would leave the resolution of disagreement between indices to the end user, in real time, which is precisely what an operational framework should avoid. Retaining the maximum implements a precautionary rule in which agreement between indices reinforces confidence in the assigned category, while disagreement automatically triggers the more cautious classification.
A recommendation was then assigned to each time slot using a 5% exceedance-frequency criterion, applied hierarchically from the most to the least severe level:
- -
Avoid competition: ≥ 5%;
- -
Avoid scheduling: ≥ 5% (and < 5%);
- -
Use precautions: ≥ 5% (and < 5%);
- -
Recommended: no threshold exceeded more than 5% of the hours.
The 5% criterion is a methodological choice, not a regulatory threshold, and its justification is explicitly precautionary. Three considerations support a stricter value than the 10% or 20% frequencies often used in planning applications. First, the exposed population consists of minors aged 15–17, for whom organizers have a duty of care and whose thermoregulatory strategies, competition experience in hot climates and capacity to recognize and report early symptoms are on average less developed than in adult elite athletes [
7,
38]. Second, acclimatization is highly heterogeneous across the more than 200 delegations expected, so a criterion protective of the median athlete would leave the least acclimatized delegations under-protected. Third, in a hierarchical framework the criterion is applied to the most severe level first, so a 5% value on
means that a slot is flagged as soon as extreme conditions are expected, roughly once every twenty Games-window hours, a frequency that is already operationally material given the potential severity of exertional heat stroke. Because this value is a choice rather than a standard, a sensitivity analysis comparing 5%, 10% and 20% is identified as a required complement (
Section 4.5).
Each category corresponds to graduated risk-management measures, ranging from reinforced hydration and medical surveillance (Use precautions) to postponement or rescheduling of the competition (Avoid competition). This approach is consistent with the recommendations of the IOC, World Athletics and the American College of Sports Medicine, and with the principles of the heat-health warning systems promoted by the WMO, WHO and GHHIN, which favor graduated, risk-based decision protocols over a single meteorological threshold [
1,
8,
24,
40,
41].
Finally, to compare thermal exposure across venues, each venue was ranked by the number of time slots (06:00–22:00) falling into the Avoid scheduling or Avoid competition categories over the Games window. This count is a synthetic indicator of relative heat-risk exposure and identifies the venues requiring priority attention in competition planning.
3. Results
3.1. Long-Term Evolution of Heat Stress
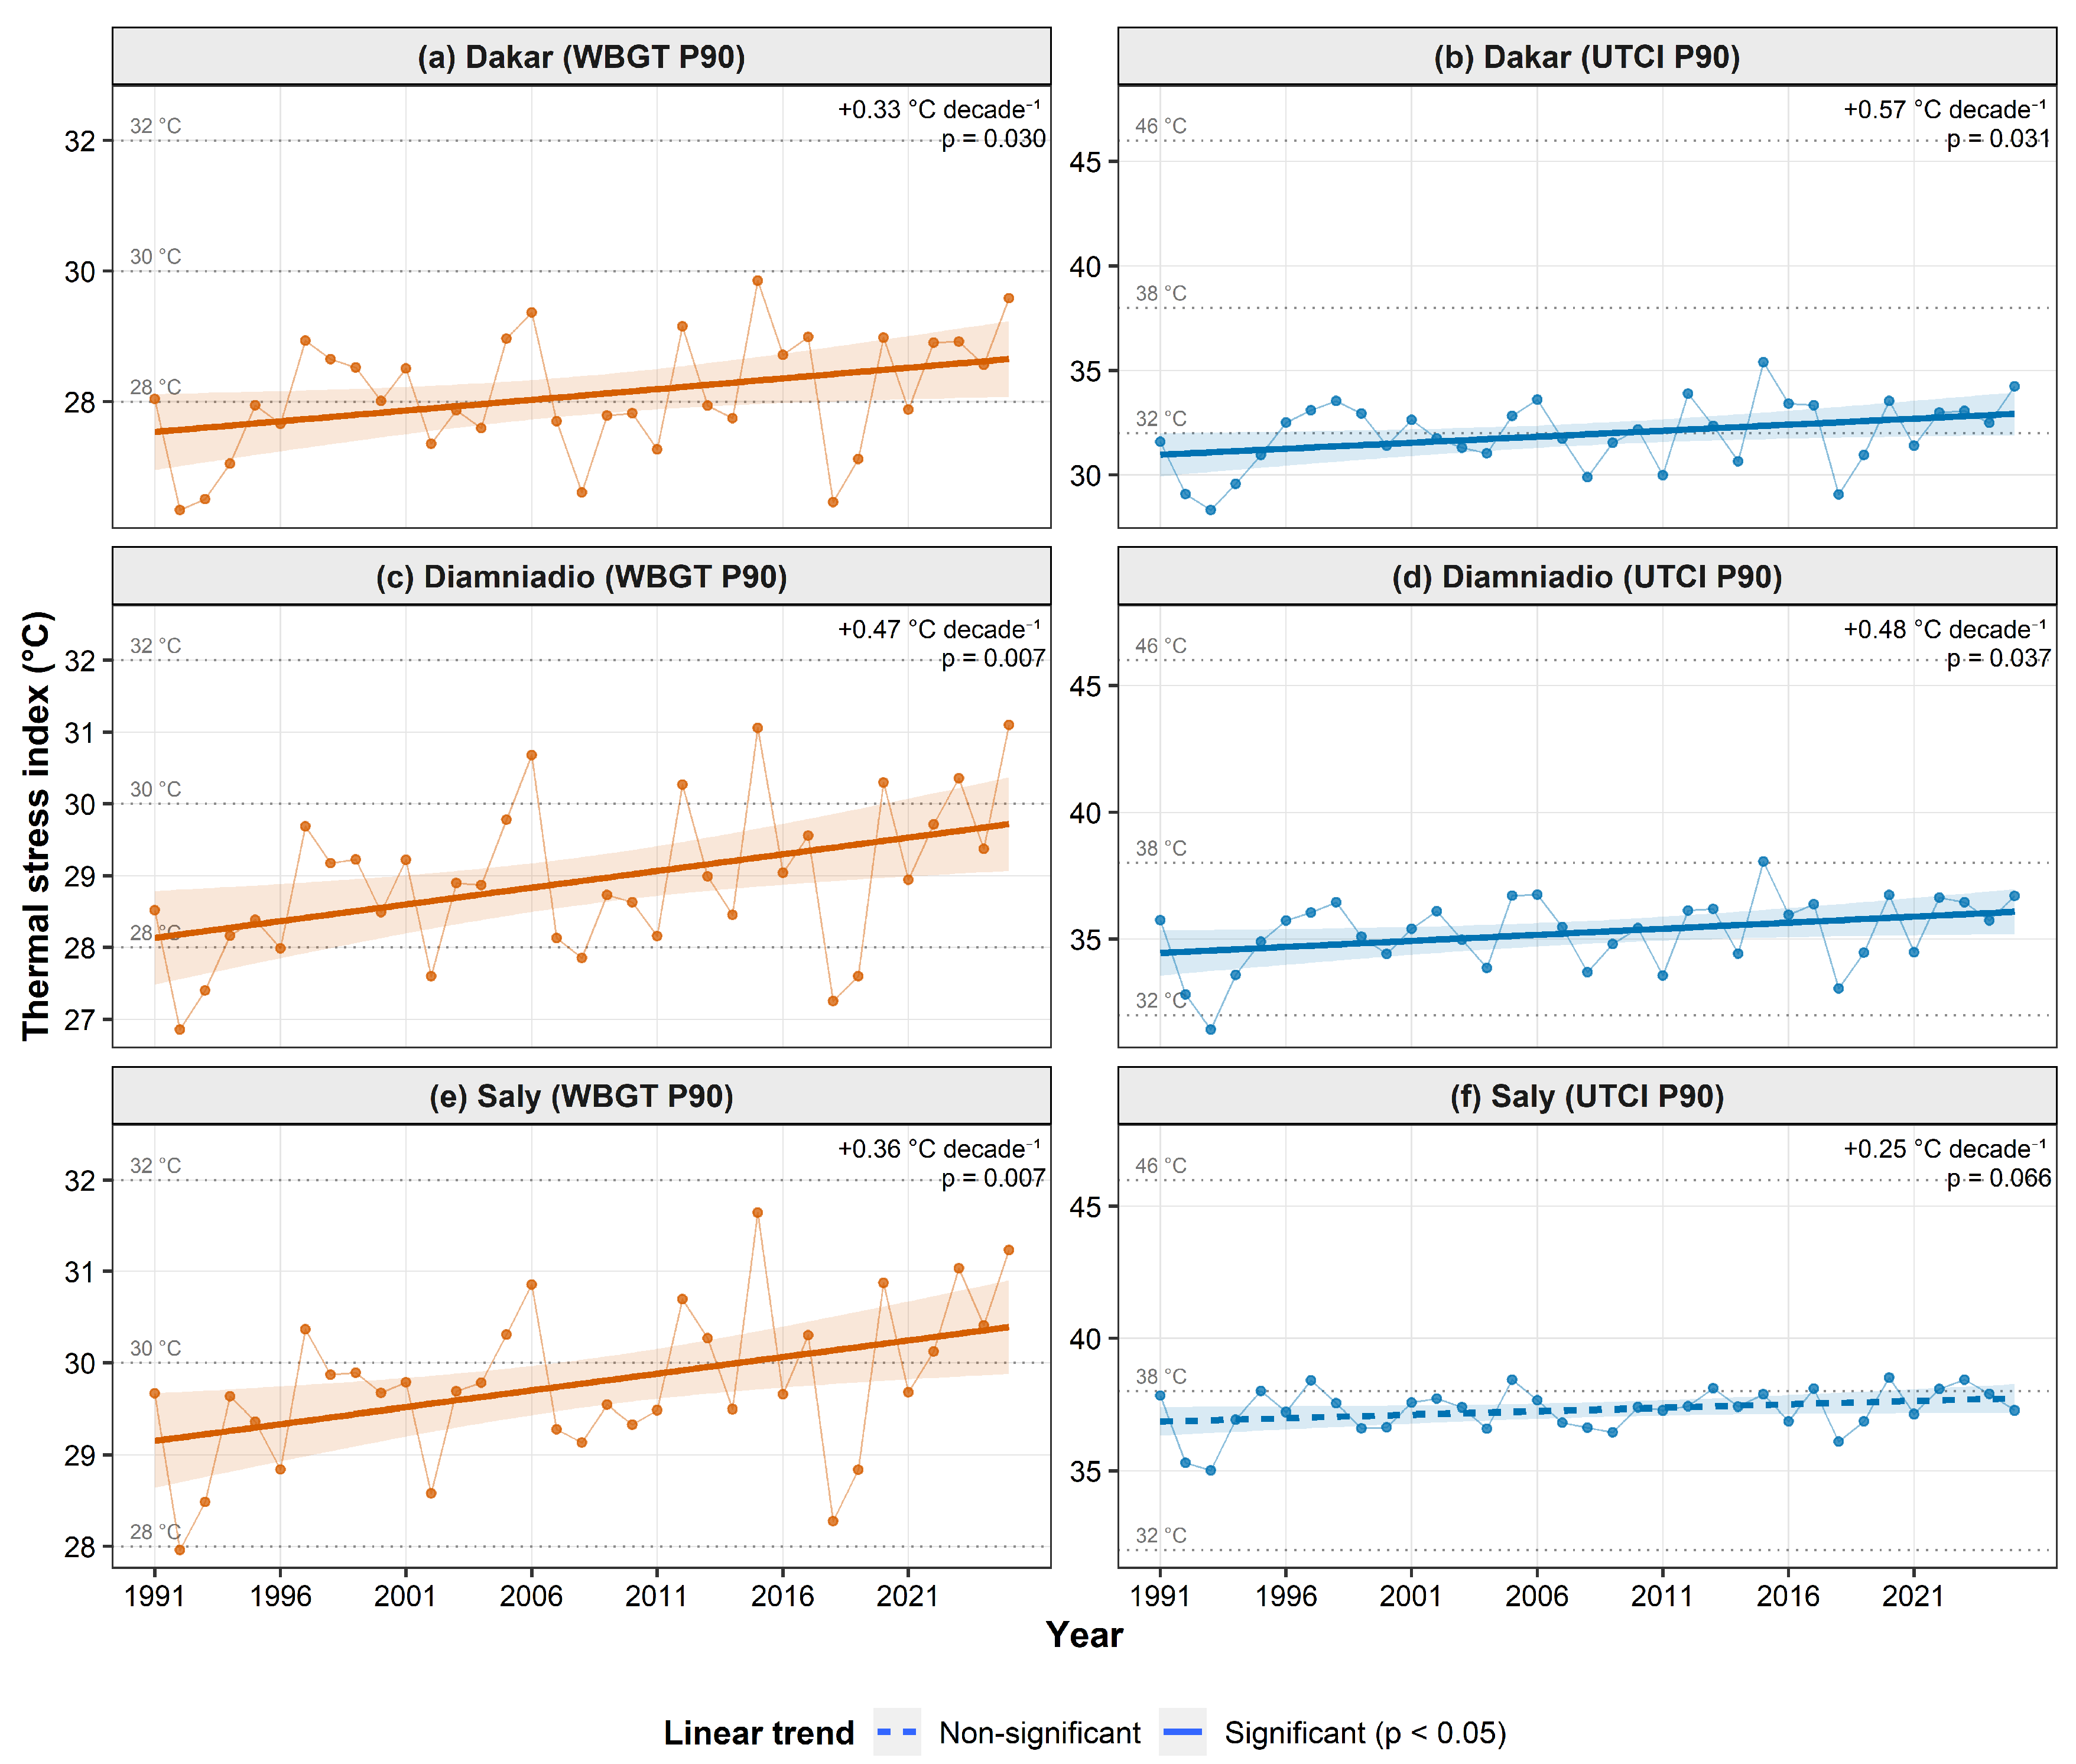
The analysis reveals a significant intensification of climatological heat stress across the three competition zones during the 1991–2025 period, although the magnitude of warming differs according to both the thermal index and the local environmental setting (
Figure 2).
Both WBGT and UTCI exhibit positive long-term trends across the three competition zones, although their magnitude and statistical significance vary by index and location. WBGT trends are positive and statistically significant in the three zones: +0.33 °C decade−1 in Dakar (p = 0.030), +0.47 °C decade−1 in Diamniadio (p = 0.007) and +0.36 °C decade−1 in Saly (p = 0.007). UTCI trends are of the same order of magnitude and also significant in Dakar (+0.57 °C decade−1, p = 0.031) and Diamniadio (+0.48 °C decade−1, p = 0.037); at Saly, the UTCI trend remains positive (+0.25 °C decade−1) but does not reach significance (p = 0.066), owing to stronger interannual variability that reduces the signal-to-noise ratio. The weaker and non-significant UTCI trend observed at Saly is consistent with stronger coastal modulation and greater interannual variability; however, the present analysis does not permit attribution of this difference to a specific meteorological mechanism. Sea breezes moderate daytime air temperatures while simultaneously increasing humidity, thereby increasing interannual variability in the UTCI and reducing the statistical significance of its long-term trend.
Overall, the WBGT exhibits a spatially coherent increase across the three zones, whereas UTCI displays greater spatial variability, suggesting that local radiative and maritime influences modulate the long-term evolution of perceived thermal stress.
A spatial gradient separates the three zones: Dakar shows the lowest levels, while Saly, followed by Diamniadio, records the highest. In these two zones, the annual WBGT P90 frequently exceeds the 28 °C threshold and occasionally reaches 30–31 °C, while the UTCI P90 is frequently around 38 °C, the strong heat-stress threshold. In Dakar, by contrast, the maritime influence keeps the WBGT P90 mostly below 30 °C and the UTCI P90 generally between 30 and 35 °C.
These findings indicate that long-term heat-risk evolution cannot be interpreted solely as a function of regional warming but also reflects local environmental controls, particularly the contrasting influence of coastal and inland conditions across the competition zones.
3.2. Climatological Diurnal Cycle
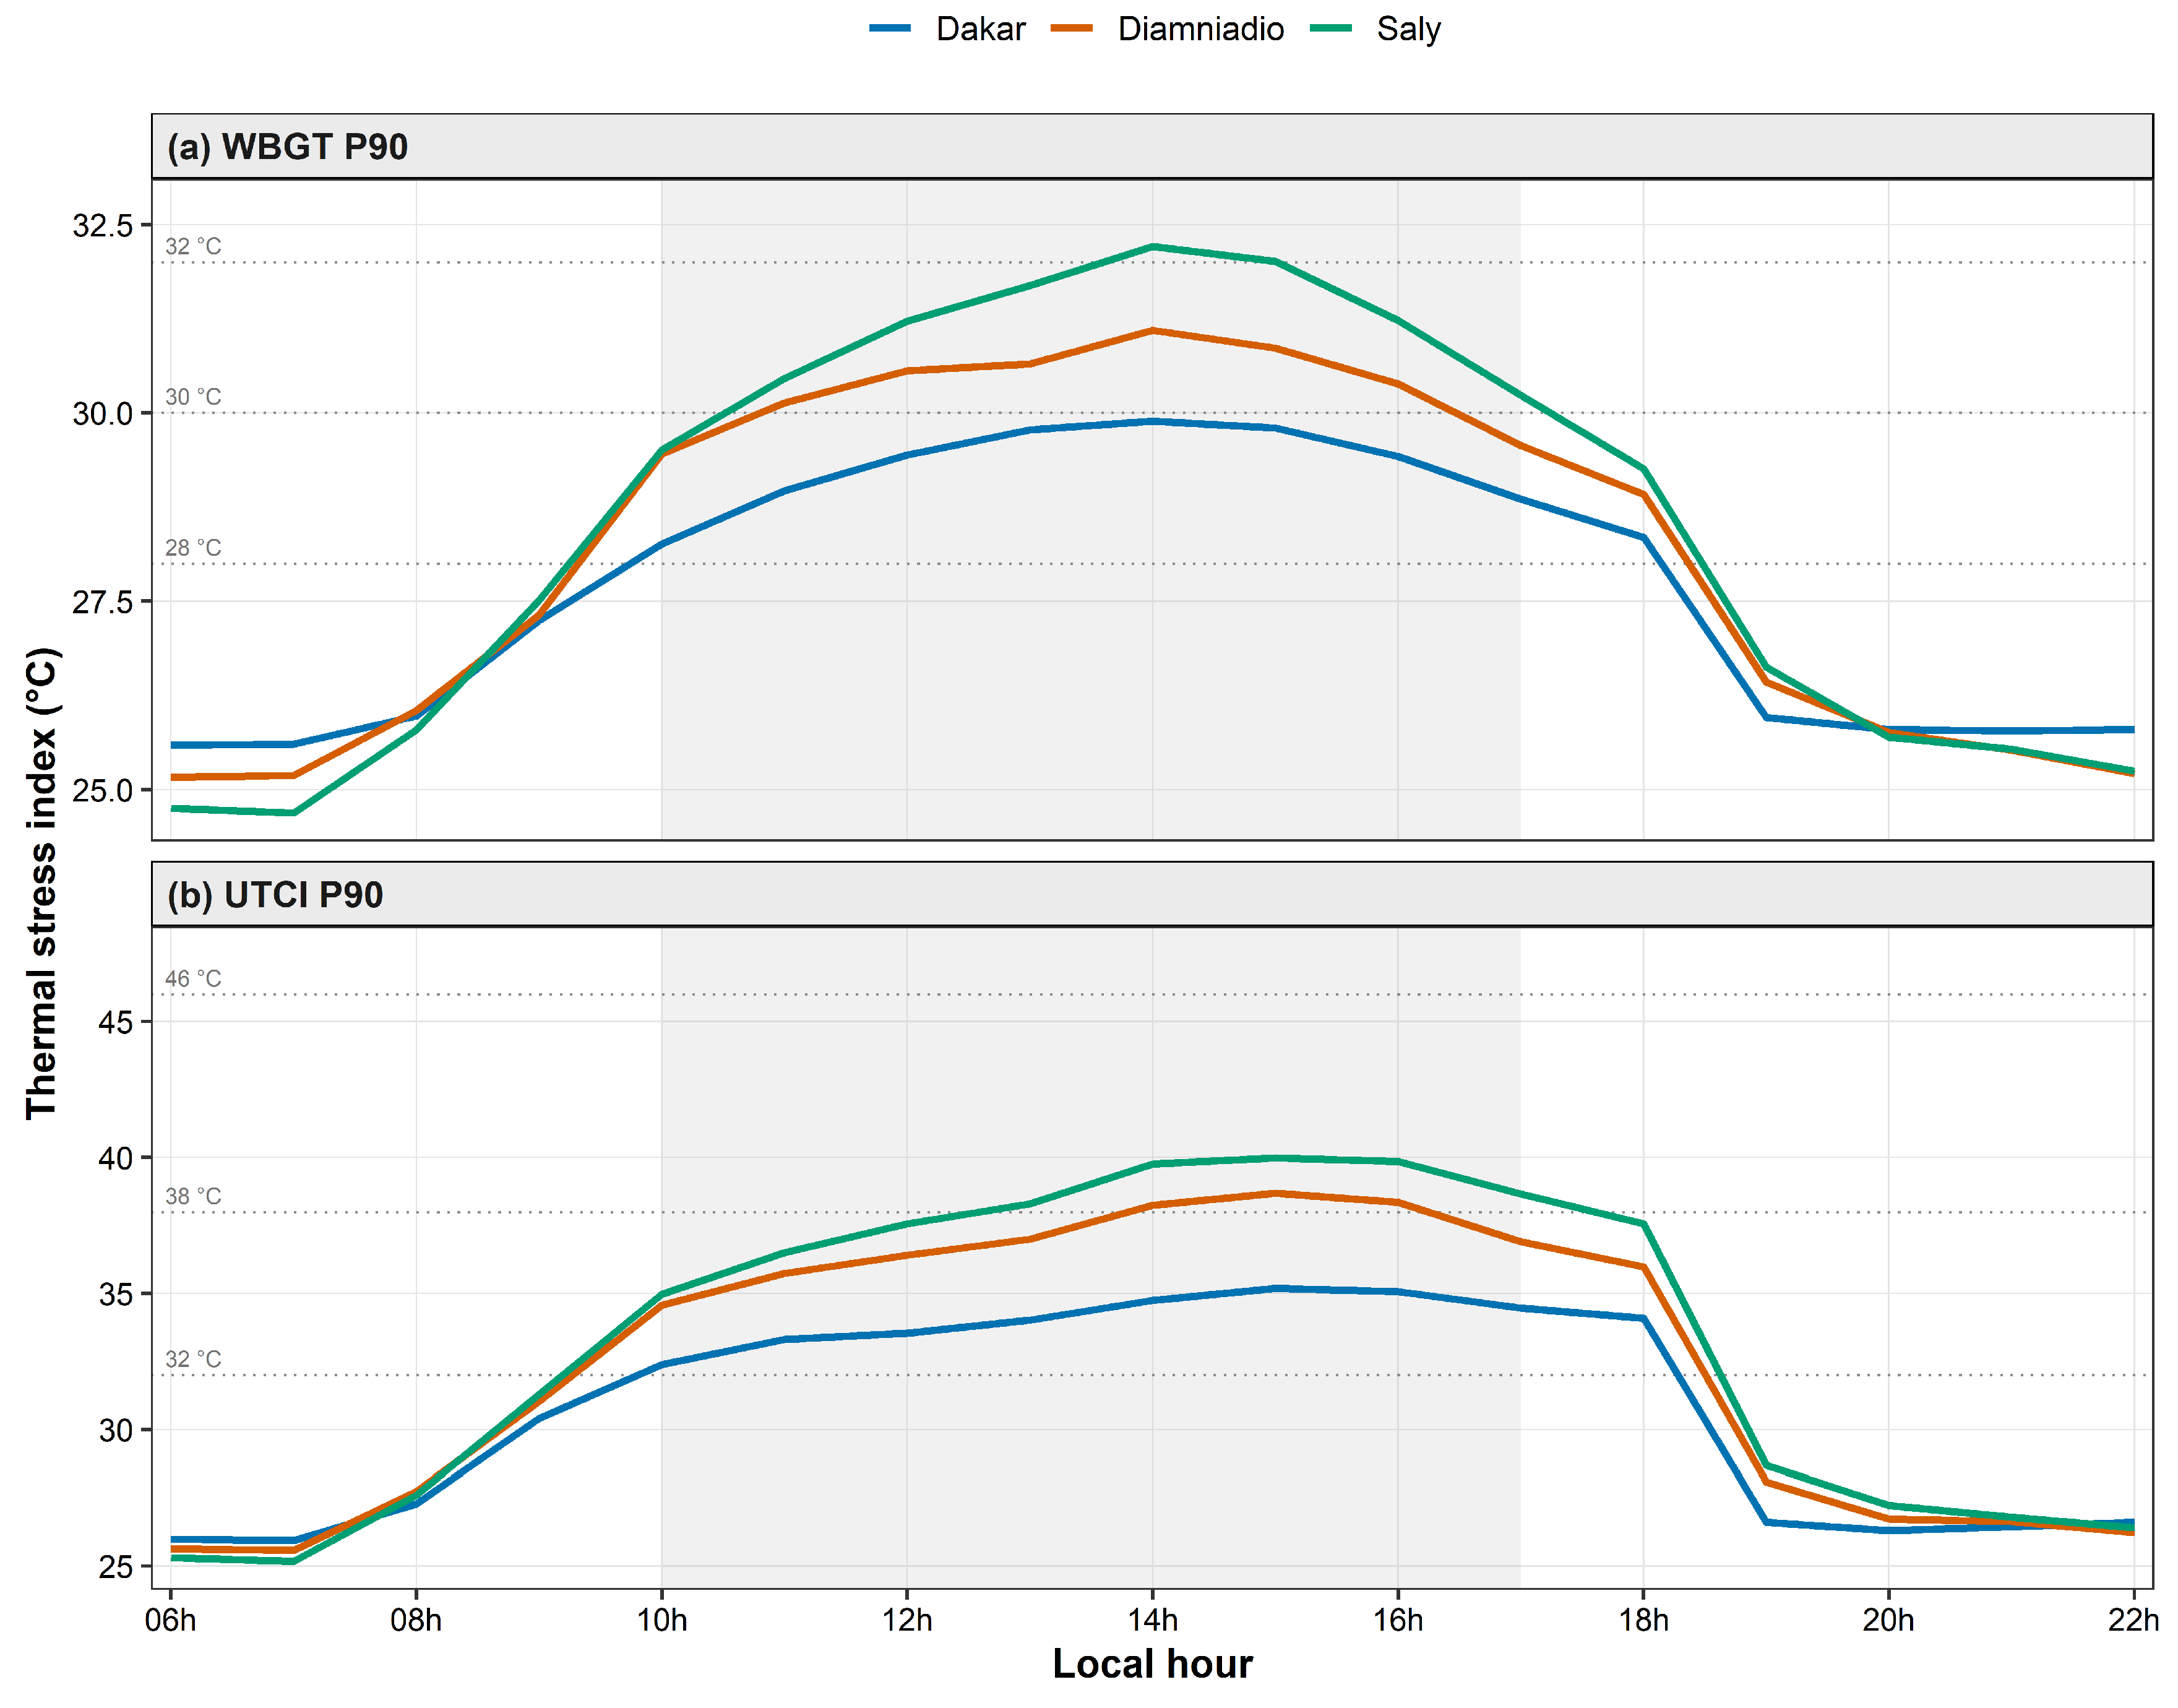
A pronounced and spatially coherent afternoon peak of heat stress was identified across all competition zones, with Saly consistently exhibiting the highest thermal stress and Dakar the lowest during daytime hours (
Figure 3).
Both indices describe a pronounced diurnal cycle: heat stress rises rapidly from about 08:00, peaks between 14:00 and 15:00, and then decreases through the late afternoon. This pattern is common to the three zones but differs markedly in magnitude. This common diurnal behavior indicates that solar forcing is the dominant driver of daytime heat stress, whereas the magnitude of the response depends on local environmental characteristics.
For the WBGT, the 28 °C threshold is exceeded between about 10:00 and 17:00 at Diamniadio and Saly, over a shorter window in Dakar. Peak values, reached around 14:00, are 32.2 °C at Saly, 31.1 °C at Diamniadio and 29.9 °C in Dakar; the high-risk threshold (30 °C) is crossed only at Saly and Diamniadio, and Saly momentarily reaches the extreme-risk threshold (32 °C) in the middle of the day. For the UTCI, values cross the strong-stress threshold (38 °C) between about 12:00 and 17:00 at Saly and Diamniadio, over a shorter window in Dakar, with a peak around 15:00 of 40.0 °C at Saly, 38.7 °C at Diamniadio and 35.2 °C in Dakar; the very strong stress threshold (46 °C) is not reached in any zone.
The spatial contrast is largest during the hottest hours (12:00–16:00). This ranking is, however, reversed in the early morning and in the evening: before about 08:00 and after about 20:00, Dakar displays the highest values of the three zones. This inversion is consistent with the moderating thermal effect of the ocean, which reduces the diurnal amplitude in Dakar (milder nights, cooler days), whereas the more continental zones of Diamniadio and Saly experience relatively cooler nights and higher daytime peaks.
The reduced daytime heat stress observed in Dakar is consistent with the moderating influence of the Atlantic Ocean, which limits daytime warming but maintains relatively warmer nighttime conditions through enhanced thermal inertia. Conversely, the more inland locations experience larger diurnal thermal amplitudes, resulting in cooler mornings but substantially higher daytime heat stress.
From an operational perspective, these results identify the early afternoon (approximately 12:00–16:00) as the critical period requiring enhanced heat-risk management across all competition zones.
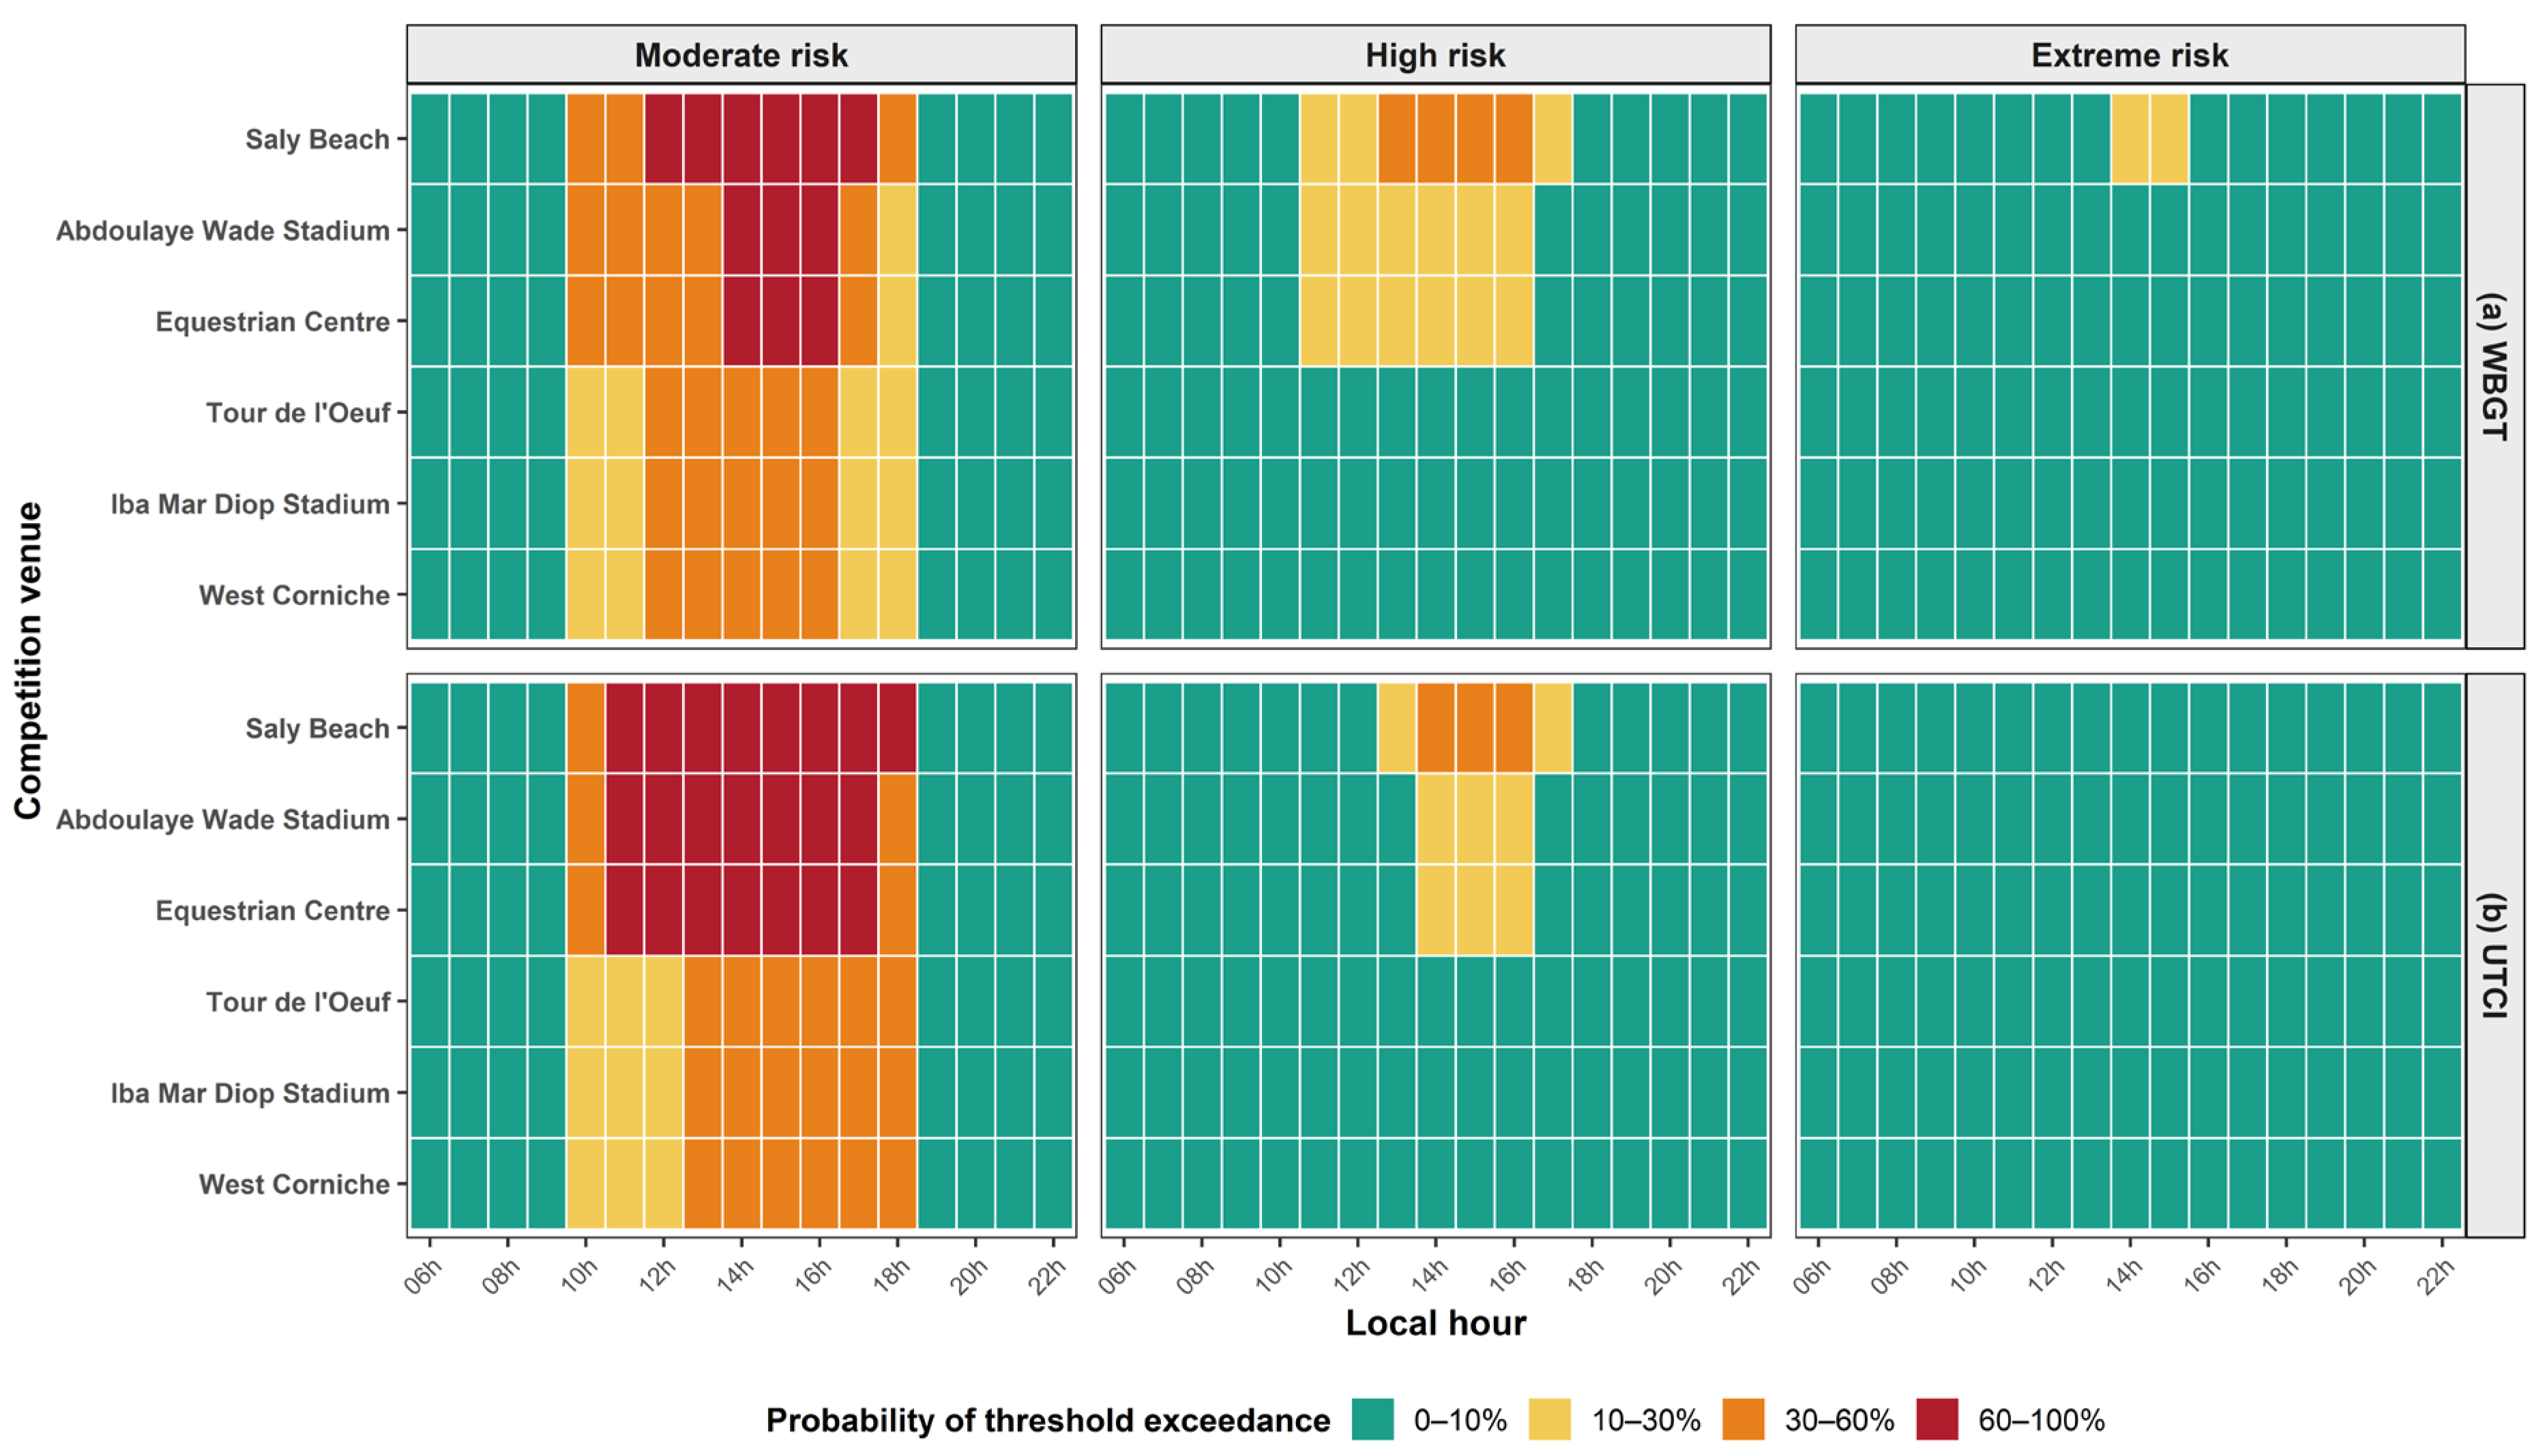
3.3. Hourly Probability of Threshold Exceedance
The probability analysis identifies a clearly defined temporal window of elevated operational heat risk concentrated between late morning and mid-afternoon, with Saly and Diamniadio consistently presenting the highest likelihood of threshold exceedance (
Figure 4).
For the WBGT, the moderate-risk threshold (≥28 °C) reaches the 60–100% class in the middle of the day at Saly Beach and at the Diamniadio venues (Abdoulaye Wade Stadium and Equestrian Centre); the coastal Dakar venues (Tour de l’Œuf, Iba Mar Diop Stadium, West Corniche) remain in the 30–60% class. The high-risk threshold (≥30 °C) is mainly exceeded at Saly (30–60% between 13:00 and 16:00), then at Diamniadio (10–30%), while the Dakar venues remain in the 0–10% class. The extreme threshold (≥32 °C) is reached only at Saly, and only marginally (10–30% around 14:00–15:00), remaining in the 0–10% class at all other venues.
UTCI data yields consistent spatial and temporal patterns. The moderate threshold (≥32 °C) is exceeded almost systematically (60–100%) from late morning to mid-afternoon at Saly and at the Diamniadio venues, while the coastal Dakar venues remain in the 30–60% class. The high threshold (≥38 °C) is reached mainly at Saly (30–60% between 14:00 and 16:00) and, to a lesser extent, at Diamniadio (10–30%), with the Dakar venues being almost never exposed (0–10%). The extreme threshold (≥46 °C) is not reached at any venue (0–10% everywhere).
The close agreement between WBGT and UTCI data demonstrates the robustness of the identified spatial and temporal patterns despite their different physiological formulations. Both indices consistently identify Saly as the most heat-exposed competition zone and Dakar as the least exposed.
Overall, the 11:00–17:00 window, and more specifically 13:00–16:00, concentrates the highest exceedance probabilities for both indices. The Saly Beach and the Diamniadio venues show the highest values, while the coastal Dakar venues benefit from maritime attenuation; this attenuation is nevertheless insufficient to remove the risk during the hottest hours, since the moderate WBGT and UTCI thresholds are frequently exceeded there.
Collectively, these results demonstrate that heat-risk is governed by both the timing of competition and the geographical location of the venue. Although the Atlantic Ocean reduces the probability of threshold exceedance in Dakar, moderate heat-risk remains frequent during the hottest hours, highlighting the need for preventive measures even in the coastal venues.
3.4. Operational Scheduling Categories
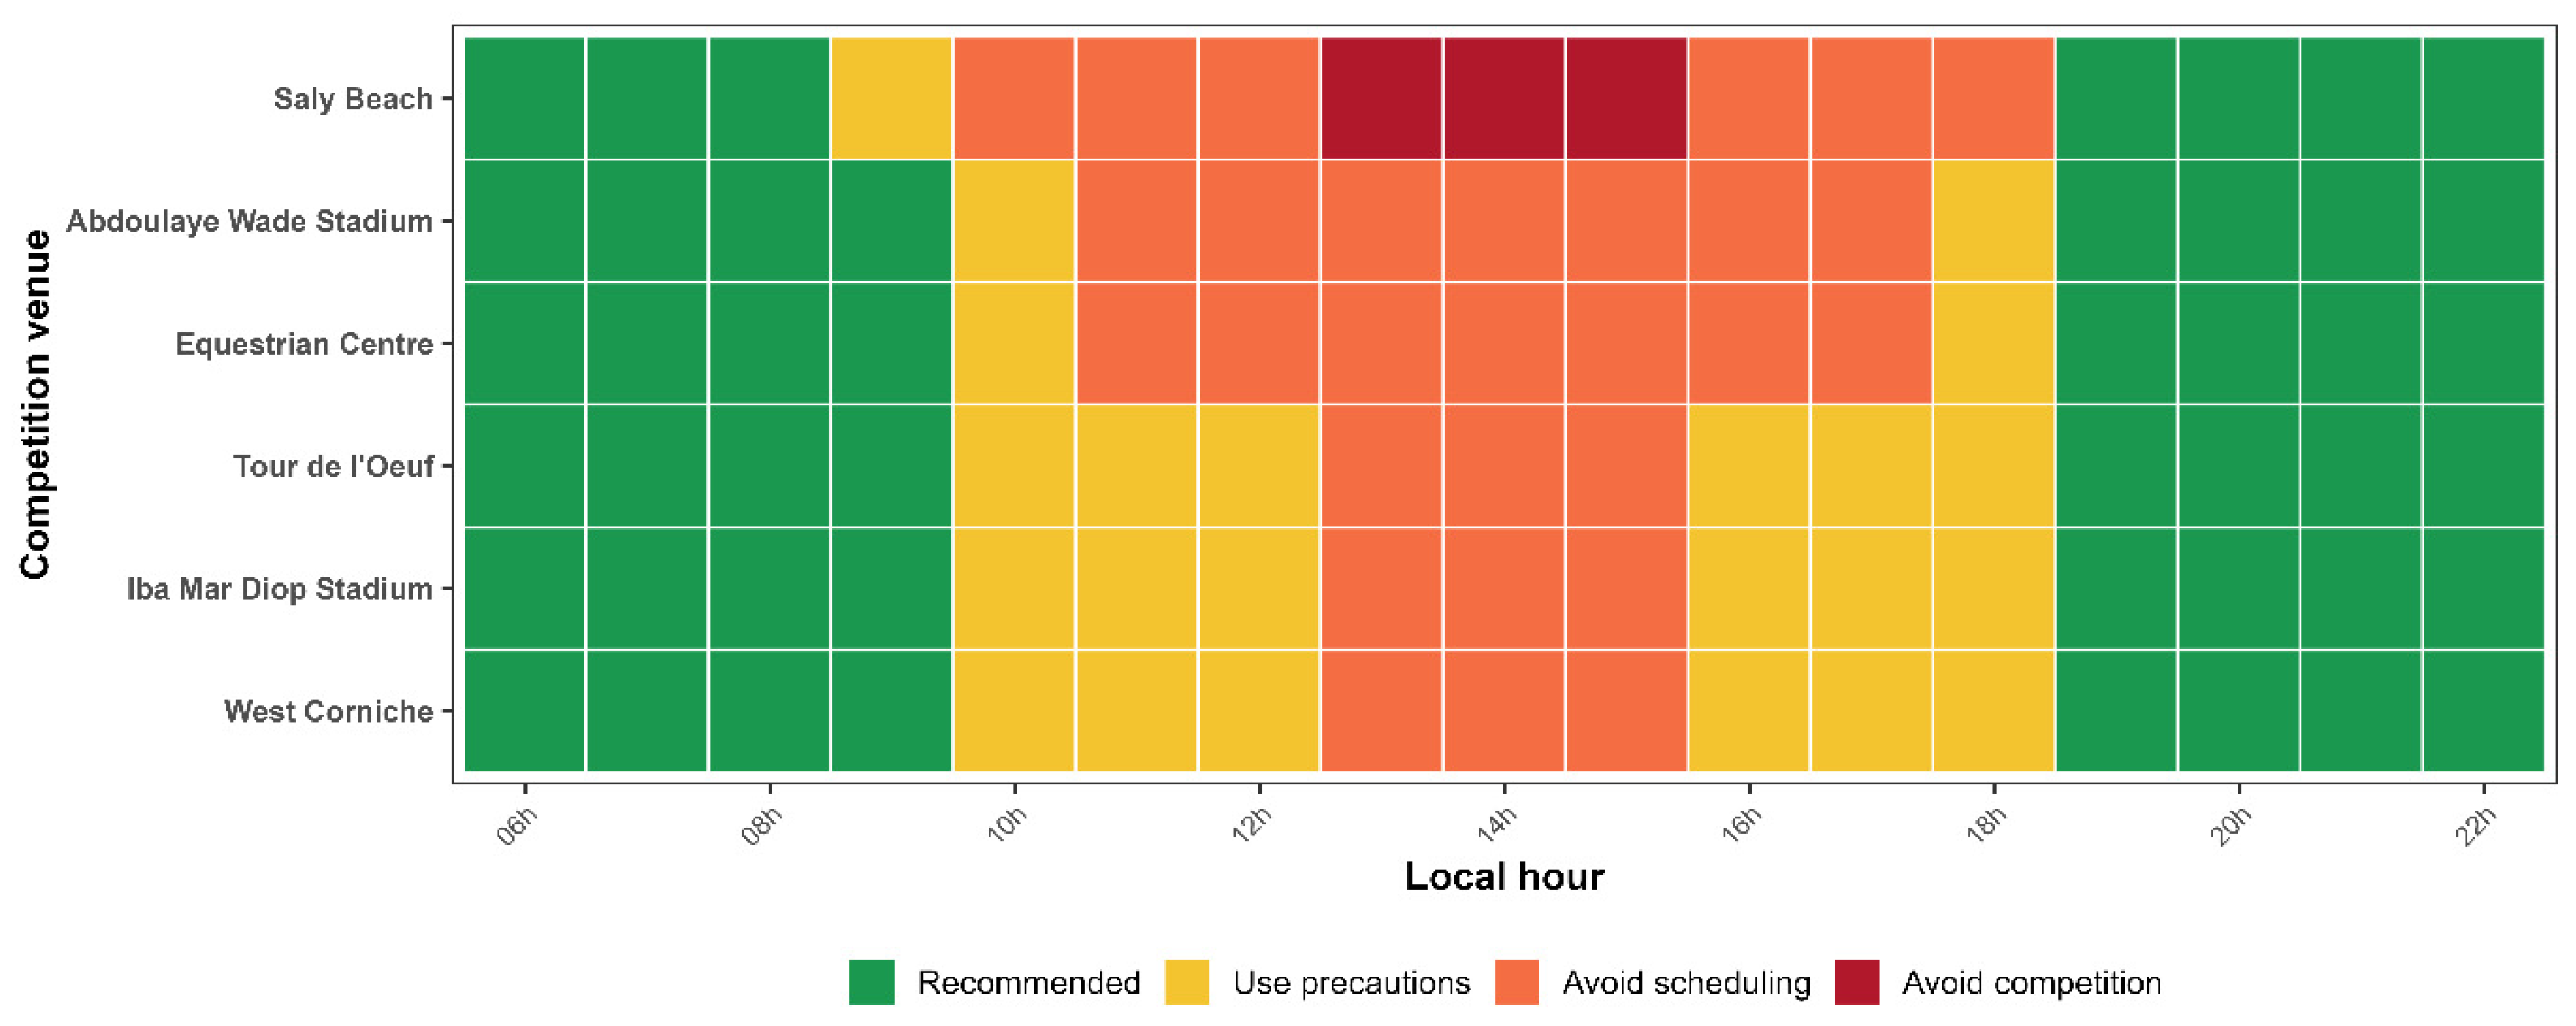
The proposed operational framework transforms climatological heat-risk information into venue-specific scheduling recommendations, thereby providing direct decision support for competition planning (
Figure 5).
The slots between 06:00 and 09:00, and from 19:00 onwards, fall in the Recommended category at all venues: during these periods, the probability of exceeding the critical WBGT and UTCI thresholds remains low.
From 10:00 onwards, conditions deteriorate progressively at all venues. An intermediate Use precautions phase appears in mid-morning, calling for measures such as reinforced hydration, longer recovery periods, provision of shaded areas and enhanced medical surveillance of athletes. Around midday, most venues shift to Avoid scheduling.
The 13:00–15:00 period corresponds to the climatological peak of heat risk. Saly Beach is the most exposed venue, with an Avoid competition recommendation extending from 13:00 to 15:00. The Diamniadio venues (Abdoulaye Wade Stadium and Equestrian Centre) and the coastal Dakar venues (West Corniche, Tour de l’Œuf and Iba Mar Diop Stadium) never reach this critical level, although they remain classified as Avoid scheduling for several hours around midday. The Diamniadio venues nevertheless differ from the Dakar venues by an earlier and more pronounced entry into the unfavorable categories.
These results confirm the spatial gradient identified in the WBGT and UTCI analyses. Venues further from the oceanic influence, in particular Saly Beach and Diamniadio, experience the greatest thermal constraints, while the coastal Dakar venues benefit from a moderating effect associated with the proximity of the ocean, an effect that reduces the intensity of heat stress without removing the risk during the hottest hours.
The progressive transition from “Recommended” to “Avoid Competition” categories demonstrates that scheduling decisions should account simultaneously for the timing of the event and the local climatic characteristics of each competition zone.
It should be emphasized that these recommendations rest on a climatological analysis of the most probable conditions observed between 1991 and 2025 during the Games window. They describe the expected level of risk in a climatological sense, not the weather conditions that will prevail during the 2026 edition. In practice, conditions on a given day may depart substantially from this climatology (cloud cover, stronger wind, unusual humidity or temporary cooling). The proposed time slots should therefore be regarded as a strategic planning framework, to be updated with the short-range forecasts issued by the Agence Nationale de l’Aviation Civile et de la Météorologie (ANACIM), the national meteorological service.
Overall, the operational framework demonstrates how climatological information can be translated into actionable climate services that support strategic planning while remaining compatible with short-range weather forecasting during the Games.
4. Discussion
4.1. Interpretation of Spatial and Temporal Heat-Stress Patterns
This study characterizes the climatological distribution of heat stress during the Dakar 2026 Youth Olympic Games competition window and translates these patterns into an operational climate-service framework for competition planning. Four principal findings emerge. First, both WBGT and UTCI data indicate a significant intensification of thermal stress between 1991 and 2025 across the three competition zones, although the magnitude differs between indices and locations. Second, a persistent spatial gradient (Saly > Diamniadio > Dakar) highlights the importance of local environmental conditions. Third, heat stress is strongly controlled by the diurnal cycle, with the highest thermal load occurring between 11:00 and 17:00. Finally, combining complementary thermal indices with climatological exceedance probabilities provides an operational basis for heat-informed scheduling of outdoor sporting events.
A persistent spatial gradient was identified, with the highest daytime heat-stress conditions occurring in Saly, followed by Diamniadio and Dakar. This pattern is consistent with differences in maritime influence across the study area. Dakar, located on the Cap-Vert Peninsula and directly exposed to the Atlantic Ocean, experiences stronger maritime moderation of daytime temperatures. Diamniadio is located farther inland, and therefore experiences a weaker oceanic influence, whereas Saly combines high daytime temperatures with substantial atmospheric humidity and solar exposure. However, the physical mechanisms underlying these spatial differences cannot be fully resolved from the present analysis because the respective contributions of wind, humidity, radiation, land-surface properties, and local circulation were not explicitly decomposed.
The diurnal cycle is particularly relevant for operational planning. Both the WBGT and UTCI increase rapidly after the morning hours, with the highest values generally occurring around 14:00–15:00, and the largest threshold-exceedance probabilities are concentrated between 11:00 and 17:00. Conditions before 09:00 and after 19:00 are substantially less stressful. The benefits of rescheduling outdoor activities toward cooler evening periods have also been demonstrated in non-sport outdoor events [
4], while previous research has emphasized that climate change increasingly affects the planning of a broad range of outdoor events [
5]. These findings indicate that timing is an important component of heat-risk management, alongside hydration, acclimatization, cooling strategies, and medical preparedness [
6,
7,
8].
4.2. Comparison with Previous Heat-Risk Assessment and Management Approaches
Heat-risk assessment in sport has traditionally relied heavily on established thermal indices, particularly the WBGT. WBGT remains widely used because it integrates the combined effects of air temperature, humidity, wind, and radiation, and is supported by an extensive history of operational application in sport, occupational health, and military environments [
8,
10,
11,
12]. In contrast, the UTCI is based on a multi-node thermophysiological model and provides a more detailed representation of the interactions between meteorological conditions and human thermal strain [
13,
14].
Recent research on major sporting events has progressively moved beyond the calculation of thermal indices toward broader questions of risk management and adaptation. For Paris 2024, Bandiera et al. [
15] assessed heat-related risk in relation to the heat policies adopted by international sporting federations, emphasizing the importance of translating thermal conditions into operational procedures. At the continental scale, Sawadogo et al. [
17] investigated how global warming may alter the climatic suitability of African countries for hosting future African Cup of Nations competitions. For the Qatar 2022 FIFA World Cup, Lucio and Gomes [
16] examined outdoor thermal comfort under the climatic conditions associated with the event. Together, these studies demonstrate that heat-risk research for sport increasingly combines climatological characterization with questions of event planning, adaptation, and decision making.
The contribution of the present study does not lie in the development of a new thermal index. Rather, it addresses the methodological step between heat-hazard characterization and operational decision support. The framework combines two complementary biometeorological indices, climatological exceedance probabilities, and a hierarchical decision rule to translate long-term climate information into time- and zone-specific scheduling guidance. This distinction is central to the climate-services concept, which emphasizes not only the production of climate information but also its transformation, communication, and use in decision making [
22,
23,
31].
Compared with previous studies, the methodological novelty of the present framework lies not in the development of a new thermal index but in the integration of four complementary components: (i) long-term climatological characterization, (ii) simultaneous use of WBGT and UTCI data, (iii) climatological exceedance-probability analysis, and (iv) translation of these probabilities into an operational climate-service decision-support framework. Previous studies have generally focused on thermal-index calculation, individual heat-wave events, or policy evaluation, whereas the present framework explicitly links climatological information to operational planning decisions through a transparent climate-service workflow.
The Dakar 2026 case also differs from assessments focused primarily on individual heat-wave episodes. The patterns identified here represent recurrent climatological conditions during the exact Games calendar rather than a single extreme event. Consequently, heat-risk management cannot rely exclusively on short-range forecasts immediately before competition. Climatological information can support strategic planning several months in advance by identifying recurrently unfavorable hours and zones, while weather forecasts and observations can subsequently update those planning recommendations during the Games.
4.3. Operational Climate-Service Framework
Combining WBGT and UTCI data provides a more robust basis for operational heat-risk assessment than either index considered individually, because the two indices characterize complementary aspects of outdoor thermal stress [
8,
10,
11]. The UTCI, by contrast, integrates air temperature, wind speed, humidity, and mean radiant temperature within a thermophysiological framework, and therefore provides a more physiologically based representation of atmospheric heat stress [
13,
14].
In the present analysis, the two indices show strong agreement regarding the main spatial and temporal patterns. Both identify Saly and Diamniadio as the most exposed zones during the central hours of the day, Dakar as comparatively moderated, and late morning to late afternoon as the period of greatest heat stress. Agreement between indices based on different formulations increases confidence that these broad patterns are not simply an artifact of a single thermal metric.
However, the WBGT and UTCI should not be interpreted as interchangeable indicators of individual physiological risk. The indices differ in their formulation, assumptions, and stress classifications [
12,
39,
42]. Moreover, neither index directly incorporates sport-specific metabolic intensity, clothing, hydration status, individual acclimatization, health status, or behavioral adaptation. The outputs of this study should therefore primarily be interpreted as indicators of environmental thermal hazard, rather than as direct estimates of heat illness or athlete-specific physiological risk.
This distinction is particularly important in the context of the Youth Olympic Games. The present study did not measure physiological responses among athletes aged 15–17, and therefore cannot infer age-specific effects of heat from the present results. Any consideration of athlete health must instead be grounded in established sports-medicine evidence and international guidance on exercise in hot environments [
6,
7,
8,
38]. Future developments should integrate discipline-specific metabolic demands, competition duration, clothing, acclimatization, and physiological evidence before athlete- or sport-specific risk estimates are produced.
The principal operational contribution of the framework is the translation of climatological thermal hazard into planning information. Importantly, the WBGT and UTCI thresholds used in this study were not newly developed. The WBGT thresholds were derived from established standards and international recommendations for heat exposure and sport [
8,
10,
38], whereas UTCI categories follow the established UTCI framework [
13,
14,
39].
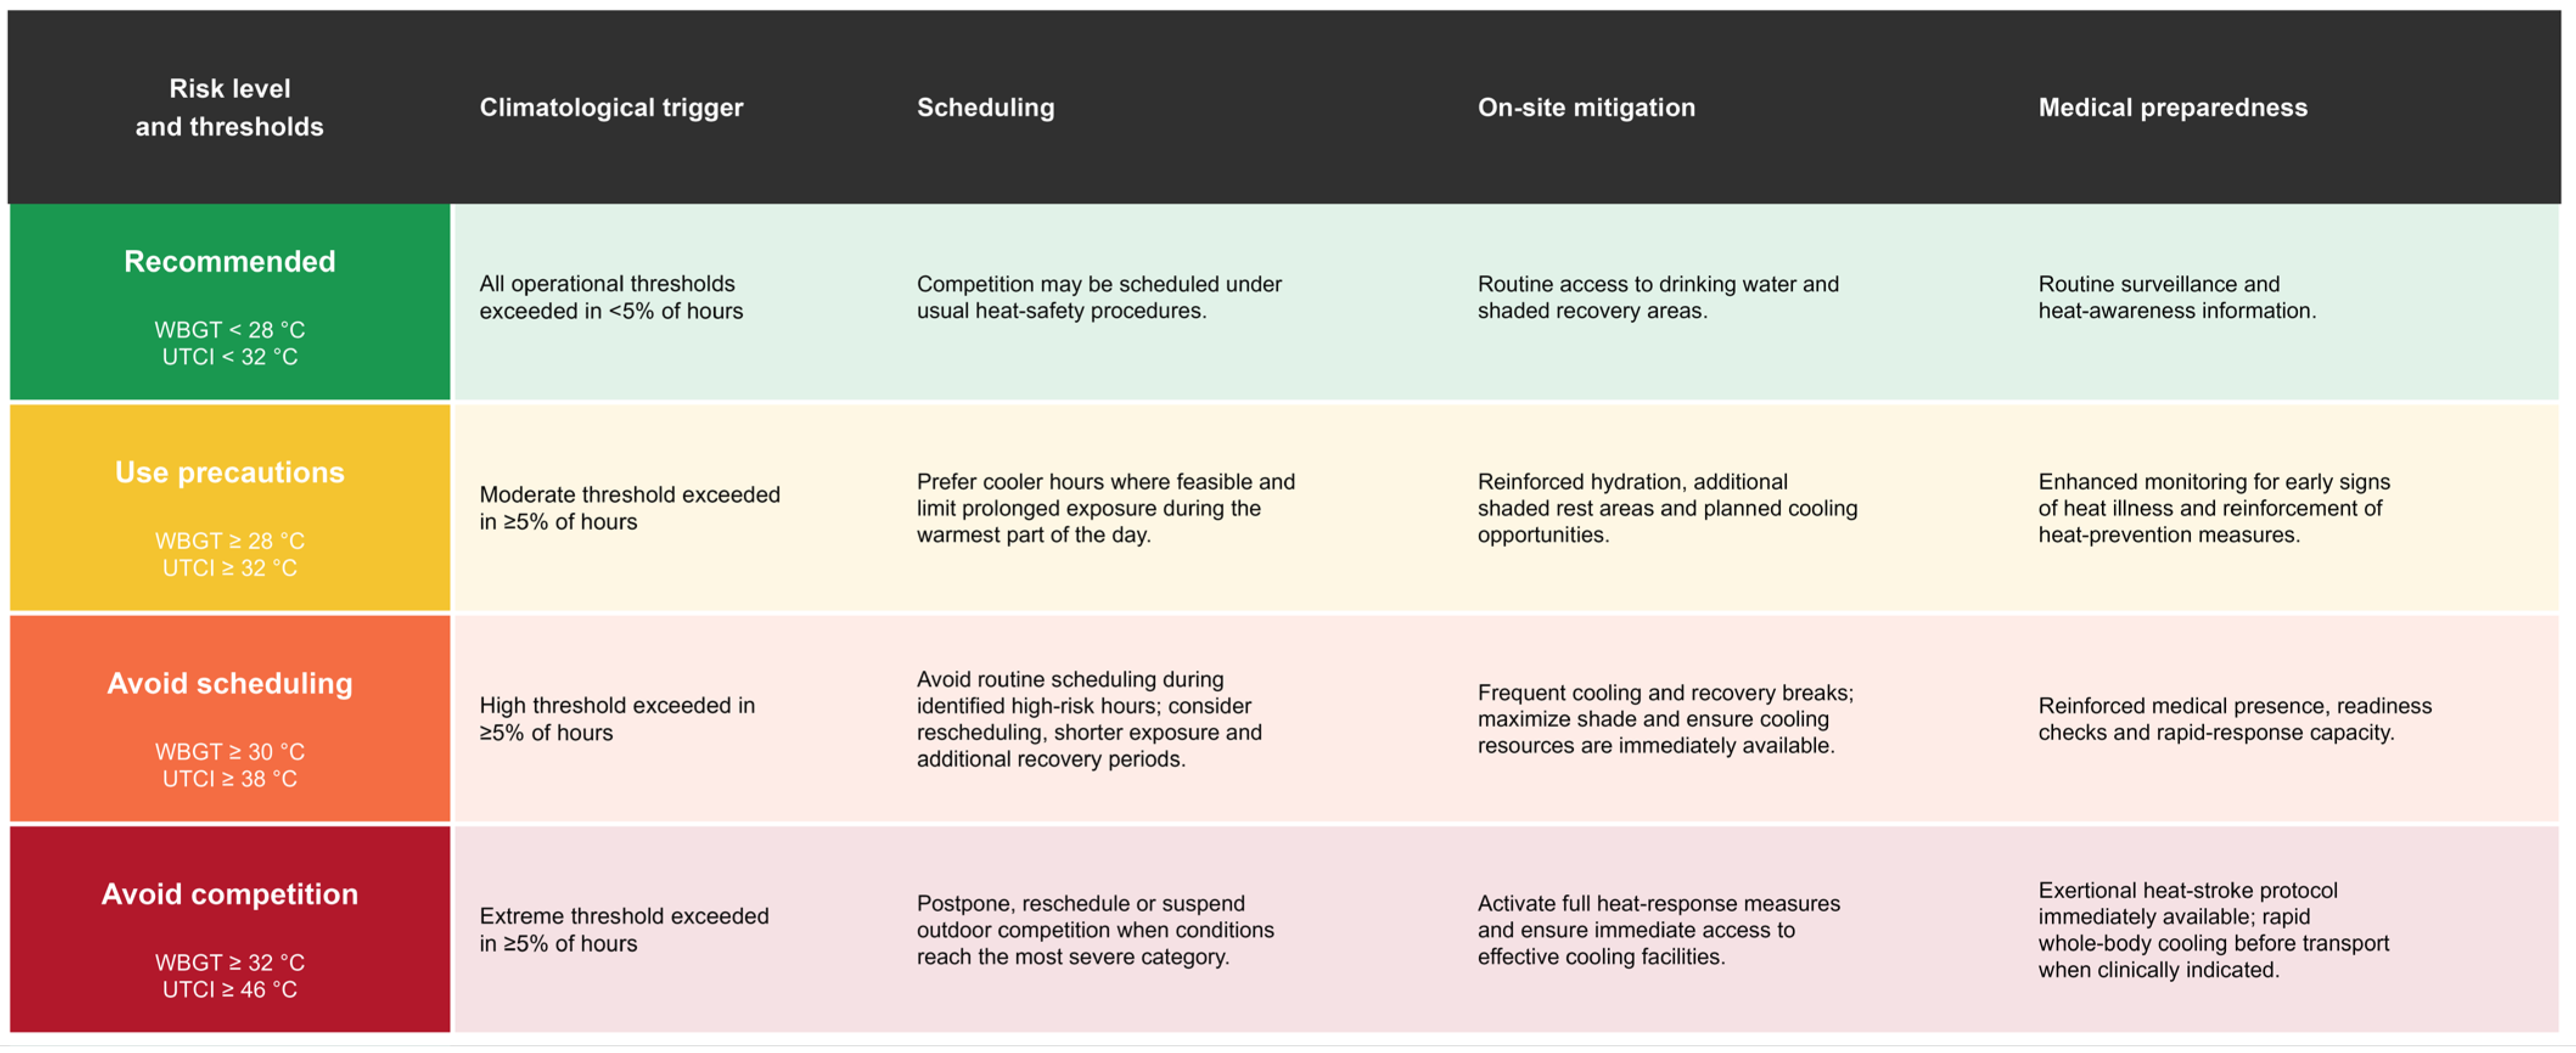
Based on these internationally recognized thresholds, an Operational Heat-Risk Action Matrix was developed (
Figure 6) to translate climatological exceedance probabilities into practical scheduling, heat-mitigation and medical-preparedness guidance. The matrix does not introduce new medical thresholds; rather, it operationalizes existing scientific and medical guidance within a climatological decision-support framework. Consequently, the Operational Heat-Risk Action Matrix should not be interpreted as a new medical classification. Rather, it combines established environmental heat-stress thresholds with climatological probabilities of exceedance to generate planning categories. The associated measures, including hydration, cooling, medical surveillance, modification of activity, and rapid management of exertional heat illness, are supported by existing sports-medicine and heat-health guidance [
6,
8,
9,
38,
40].
A clear distinction must nevertheless be maintained between the scientific basis of the thermal thresholds and the decision framework proposed in this study. The WBGT and UTCI thresholds are derived from internationally recognized standards and sports-medicine guidance, whereas the 5% exceedance-frequency criterion is a precautionary methodological choice introduced to support climatological planning. It should therefore not be interpreted as a medically validated or regulatory threshold. Rather, its purpose is to translate climatological exceedance probabilities into operational planning categories that facilitate strategic scheduling. Future studies could evaluate the robustness of this framework through sensitivity analyses using alternative exceedance-frequency criteria and by assessing its performance under different climatic and sporting contexts.
The proposed workflow follows the climate-service value chain described in the literature [
22,
23]. ERA5 provides the meteorological variables from which WBGT and UTCI are derived; these indices are subsequently converted into climatological exceedance probabilities, which are then translated into operational planning guidance for competition scheduling, heat mitigation and medical preparedness. This progression from climate information to decision support is also consistent with the principles of heat-health warning systems, which emphasize the transformation of meteorological information into graduated preparedness and response measures [
24].
4.4. Implications for Heat-Risk Management and Climate Services
The proposed framework has direct implications for competition scheduling, heat-risk mitigation, and climate-service implementation during outdoor sporting events. Exercise generates substantial metabolic heat, and when environmental conditions constrain heat dissipation, thermal strain, dehydration, cardiovascular load, fatigue, performance impairment, and the risk of exertional heat illness can increase [
6,
7,
8,
9,
38].
These implications should nevertheless be interpreted within the limits of the present study. No athlete-level physiological, clinical, or medical data were analyzed. The study therefore cannot determine whether a particular athlete would experience heat illness under a given WBGT or UTCI value. Individual risk depends on factors including competition intensity and duration, clothing, hydration, acclimatization, physical fitness, health status, and access to cooling or shade [
6,
7,
8,
9,
38].
Accordingly, the scheduling framework should complement rather than replace medical and sport-specific protocols. Sports-medicine recommendations emphasize prevention, heat acclimatization, hydration, symptom recognition, rapid cessation of activity when exertional heat illness is suspected, and immediate cooling when exertional heat stroke occurs [
6,
7,
8,
9,
38]. The climatological framework can identify periods during which enhanced preparedness is warranted, but competition-day decisions should incorporate contemporaneous weather observations, forecasts, medical assessment, and federation-specific rules.
Heat-risk management should also extend beyond athletes. Officials, volunteers, spectators, security personnel, and media workers may experience prolonged outdoor exposure during sporting events. Heat-health research emphasizes that the consequences of heat depend not only on the meteorological hazard but also on exposure and individual vulnerability [
40,
43]. Therefore, appropriate event-management measures may include access to drinking water, shaded or cooled areas, communication of heat information, and suitable work–rest arrangements for personnel with prolonged outdoor exposure.
The broader scientific contribution of this study lies in integrating established biometeorological information into an operational climate-service framework rather than in proposing a new thermal index. The framework connects four components that are often considered separately: thermal-index calculation, climatological characterization, exceedance-probability estimation, and operational decision support. This integration provides a transparent pathway for transforming historical climate information into planning guidance, consistent with the principles of climate services [
22,
23,
31].
The Dakar 2026 Youth Olympic Games provides a relevant case study because the competition is distributed across zones with contrasting levels of maritime influence and includes outdoor activities occurring during a period characterized by recurrent daytime heat stress. Nevertheless, the methodological framework is not intrinsically dependent on Dakar. Because it relies on internationally recognized biometeorological indices and locally calculated climatological probabilities, the same general workflow could be adapted to other heat-exposed outdoor sporting events.
Transferability should not, however, be interpreted as universal applicability without local adaptation. Climatic conditions, venue characteristics, competition duration, participant characteristics, federation policies, and medical protocols vary considerably among sporting events. Application of the framework elsewhere would, therefore, require recalculation of the local climatology and careful adaptation of operational decisions to the relevant sporting and health guidance.
Future research should proceed in several directions. First, dynamical or statistical downscaling and high-resolution in situ observations could improve the representation of venue-scale microclimates. Second, the environmental framework should be extended toward discipline-specific assessments incorporating competition duration, metabolic demand, clothing, and sport-specific heat policies. This is particularly relevant for multidisciplinary events such as the YOG, where thermal exposure differs substantially among sports. Third, climatological planning should be integrated with forecast-based updates and real-time observations, thereby establishing a continuous climate-service chain from long-term strategic planning to competition-day decision support.
4.5. Study Limitations
Several limitations should be considered when interpreting the results.
First, the assessment relies on ERA5 reanalysis at a spatial resolution of 0.25°. Although the ERA5 provides a spatially and temporally homogeneous meteorological dataset suitable for long-term climatological analysis [
26], this resolution cannot represent venue-scale microclimatic characteristics such as shading, vegetation, construction materials, sand and synthetic surfaces, built geometry, or localized ventilation. Venues falling within the same ERA5 grid cell consequently share the same meteorological forcing, and the results should be interpreted as competition-zone estimates rather than venue-resolved measurements.
Second, the ERA5-derived thermal indices were not formally validated against in situ WBGT or UTCI observations. The WBGT is particularly sensitive to radiative conditions, and uncertainties in meteorological and radiation fields can propagate into derived heat-stress indices [
27,
28,
30]. ANACIM operates conventional and automatic meteorological stations within the broader study area, but routine stations do not necessarily provide direct measurements of black-globe temperature and natural wet-bulb temperature. Future research should therefore combine reanalysis data with conventional station observations and dedicated venue-level heat-stress measurements during the Games. This limitation is already acknowledged in the current manuscript.
Third, long-term trends were assessed using ordinary least-squares regression. Future studies could complement the ordinary least-squares analysis with non-parametric approaches such as the Mann–Kendall test and Sen’s slope estimator to further assess the robustness of the detected trends. Fourth, the 5% exceedance-frequency criterion used in the operational framework is a methodological planning choice rather than an internationally validated threshold. Sensitivity analyses using alternative exceedance frequencies, such as 10% and 20%, would help determine the robustness of the resulting scheduling categories.
Fifth, restricting the climatological analysis to the exact 14-day Games window maximizes operational relevance but reduces the number of observations used to estimate recurrent heat conditions compared with a full seasonal climatology. Although the same calendar window was extracted for every year, future analyses could assess the sensitivity of the results to shifts in the competition period.
Sixth, the framework primarily assesses environmental hazard, whereas complete heat risk results from interactions among hazard, exposure, and vulnerability [
1,
2,
3]. The present analysis characterizes meteorological hazard and partially represents exposure through competition timing and location, but it does not quantify discipline-specific metabolic load or individual vulnerability.
Finally, the analysis is climatological and cannot predict the actual weather conditions that will occur during the 2026 YOG. Interannual climate variability may result in conditions that are warmer or cooler than the historical climatology. Consequently, the climatological planning framework should be complemented by subseasonal information where relevant, short-range weather forecasts, and real-time meteorological observations are consulted during the Games.
5. Conclusions
This study developed a climatological climate-service framework to support heat-risk management for the Dakar 2026 Youth Olympic Games using the WBGT and UTCI complementary biometeorological indices. The analyses identified clear spatial and temporal patterns of heat stress across the three competition zones and translated them into operational scheduling recommendations.
Three principal findings emerged. First, climatological heat stress increased during 1991–2025, with WBGT P90 trends ranging from +0.33 to +0.47 °C decade−1, while the UTCI also increased significantly in Dakar (+0.57 °C decade−1) and Diamniadio (+0.48 °C decade−1). Second, a persistent spatial gradient (Saly > Diamniadio > Dakar) revealed that the inland and southern venues experience substantially greater heat stress than the coastal Dakar venues. Third, the highest heat risk consistently occurred between 11:00 and 17:00, with peak conditions around 14:00–15:00, whereas the safest periods for outdoor competitions were identified before 09:00 and after 19:00.
The main scientific contribution of this study is the development of a transferable climate-services framework that translates complementary biometeorological indices and climatological exceedance probabilities into operational decision support for heat-risk management at major outdoor sporting events.
These findings provide a practical basis for climate-informed planning of major sporting events. By integrating complementary thermal indices, climatological exceedance probabilities, and a transparent decision-support framework, this study demonstrates how climatological information can be transformed into actionable climate services for competition scheduling and heat-risk management. Although developed for the Dakar 2026 Youth Olympic Games, the proposed workflow is transferable to other outdoor sporting events in tropical and subtropical regions, provided that local climatological analyses are performed before implementation.




 ,
,