
Article

Observed and Simulated Decadal Variability of Precipitation in North Africa and the Mediterranean: Insights from ERA5 Reanalysis and CORDEX-CORE Simulations


International Water Research Institute, University Mohammed VI Polytechnic, Benguerir BP 43150, Morocco
*
Author to whom correspondence should be addressed.
Climate 2026, 14(9), 172; https://doi.org/10.3390/cli14090172
Submission received: 24 April 2026 / Revised: 8 June 2026 / Accepted: 17 June 2026 / Published: 24 August 2026

Abstract

Climate change and variability pose serious threats to natural and human systems. The Mediterranean and North Africa (MNA) are among the world’s climate change hotspots. An in-depth understanding of the decadal climate variability in this region is critical to support planning and management, as well as adaptation in important sectors such as water resources. Therefore, in this study, fifth-generation ECMWF atmospheric reanalysis (ERA5) precipitation data and the outputs of the Coordinated Regional Downscaling Experiment-COmmon Regional Experiment (CORDEX-CORE) regional models were used to characterize the decadal precipitation variability in MNA and its sub-regions (Western North Africa: WNA, Sahara: SAH, southern Mediterranean: SMED, and northern Mediterranean: NMED). The models showed overestimation in most areas and underestimation in a few areas relative to the ERA5 data, with the magnitude varying by region and season. The positive biases obtained from the regional climate models (RCMs) were higher than the positive biases obtained from the general circulation models (GCMs). The wet biases were dominant during the annual, summer, and autumn seasons over MNA and its sub-regions. Negative biases were mostly associated with GCMs, mainly HadGEM2-ES and/or NorESM1-M; meanwhile, they were linked with RCMs such as CCLM5-0-15 and/or RegCM4_v7 and were mostly obtained in winter and spring. The multi-model mean (MME) was better at reproducing the decadal precipitation patterns over MNA, SMED, and NMED at all time scales, while REMO2015-NorESM1-M and the MME performed better than the remaining models at the annual time scale over WNA and SAH. These findings are useful for improving climate modeling, the water resources management and related sectors, and climate adaptation strategies in the region, especially in North Africa. The short-period coverage of the simulated data available for this study constitutes a limitation to the findings.

1. Introduction

Climate variability on decadal time scales plays a fundamental role in shaping regional hydroclimates by modulating long-term trends, governing precipitation anomalies, and conditioning the impacts of climate change on natural and human systems. Decadal variability, typically defined as climate fluctuations occurring over periods of approximately 10 years, bridges interannual variability and externally forced climate change and represents a major source of uncertainty in regional climate projections [1,2,3,4]. Unlike interannual variability, which is largely characterized by short-lived atmospheric processes, decadal variability emerges from slower oceanic adjustments, persistent atmosphere–ocean coupling, and low-frequency internal climate dynamics, making it challenging to predict [5]. These processes can generate multi-year wet and dry periods, temporarily reinforce or mask forced trends, and serve as a key source of potential variability in the climate system.
The Mediterranean Basin is a prominent climate change hotspot, characterized by enhanced warming, increasing aridity, heatwaves, and pronounced climate variability [6,7,8,9,10], which remain challenging for North Africa. These characteristics are exacerbated by strong interdecadal precipitation variability, which directly affects water availability, agricultural activities, and socio-economic stability [11,12,13,14]. For instance, decadal precipitation influences the productivity of global grazing lands and livestock systems [15], energy production through effects on hydropower and infrastructure [16], and life on Earth [17]. Precipitation over North Africa is dominated by a winter rainfall regime controlled by mid-latitude circulation and Mediterranean air–sea interactions. However, the relationships between the Mediterranean air–sea interactions are still challenging to study, particularly at the decadal time scale. Long-term precipitation changes are often difficult to detect against a background of strong internal variability, highlighting the importance of climate models for disentangling forced signals from natural and anthropogenic decadal fluctuations. Therefore, decadal precipitation variability is particularly relevant for the Mediterranean and North Africa (MNA) region, as it captures alternating multi-year wet and dry regimes that are not evident at shorter time scales, which are critical for water resource management and drought risk assessment [18]. Moreover, systems that aim to forecast the mean climate conditions over the next 5–10 years critically depend on accurate simulations of low-frequency variability and its underlying mechanisms [9]. Understanding climate variability at decadal time scales has become increasingly important for improving our understanding of climate variations and guiding adaptation strategies [5,6]. Thus, deficiencies in simulating decadal precipitation variability constrain the attribution of observed changes, which could limit the utility of near-term climate information for adaptation planning in the energy and infrastructure sectors.
Despite its importance, decadal precipitation variability over North Africa remains poorly characterized. Previous studies focused on decadal precipitation [19,20,21,22,23] over the Mediterranean, with very limited coverage of the entire North African region, while analyses explicitly targeting decadal time scales over the MNA region remain comparatively scarce. Moreover, to better uncover decadal precipitation behavior and the capacity of regional climate models (RCMs), the MNA is subdivided into sub-regions. The previous studies either focused on different seasons [24,25] or methods [26] (e.g., composite analysis), and many existing studies rely on coarse-resolution observational products or low-resolution climate model simulations that may inadequately represent regional-scale processes, complex topographies, and land–atmosphere feedback relevant to understanding erratic precipitation in North Africa [12,26,27]. The capability of current climate models to accurately reproduce the observed decadal precipitation variability in the region remains uncertain. Moreover, although several studies have evaluated simulated interannual precipitation against observations over parts of this region [21,22,23,24,25], very few have exploited the high-resolution decadal variability of precipitation from the Coordinated Regional Downscaling Experiment-COmmon Regional Experiment (CORDEX-CORE) regional climate simulations [28], which are specifically designed to improve the representation of the regional climate features that strongly influence hydro-climatic processes.
In this study, the performance of regional climate models is assessed to uncover the decadal precipitation characteristics in the high-resolution CORDEX-CORE regional climate simulations for the MNA region (18° W–45° E, 20° N–45° N). Fifth generation ECMWF atmospheric reanalysis (ERA5) precipitation data are used as a reference after a brief comparison with observational data such as the Climatic Research Unit (CRU) and Global Precipitation Climatology Center (GPCC) for the period of 1970–2005. This period was selected because it matches the temporal coverage of the simulated data. Specifically, the present study aims to:
(1) Characterize the spatio-temporal decadal precipitation variability in the MNA region;
(2) Evaluate the ability of CORDEX-CORE simulations to reproduce the decadal fluctuations in precipitation from ERA5 over the study period. In addition, we explore the origin of biases in the CORDEX-CORE data.
The rest of this paper is organized as follows. Section 2 describes the data and methods used in the study. Section 3 presents the climatological analysis of precipitation variability at interannual and decadal time scales. Finally, Section 4 summarizes the main findings and provides conclusions.

2. Data and Methods

2.1. Study Area and Data

The study area (Figure 1) covers the MNA, which is subdivided into four sub-regions: the southern Mediterranean (SMED), the northern Mediterranean (NMED), the Sahara (SAH), and western North Africa (WNA). While IPCC AR6 [29] classifies this domain into two broad regions, namely the Mediterranean (MED) and SAH, we further refined the Mediterranean sector by distinguishing its northern and southern parts and western North Africa from SMED as a distinct sub-region. This finer subdivision between the north and south is motivated by the marked climatic contrasts within the MED region, particularly in terms of large-scale index interactions, moisture sources, and regional circulation factors. This justifies treating these zones as distinct sub-regions for analysis.
We used daily precipitation data from ERA5 [30] at a spatial resolution of 0.25° × 0.25° over the period of 1970–2005. Previous research showed that ERA5 can be used with confidence over extra-tropical regions [31], which include the study area. The time period selected corresponds to that of the simulated data. It should be noted that ERA5 has some limitations, as described in [30,32].
The monthly precipitation data from the CRU (University of East Anglia) and Met Office [33] were used. In addition, GPCC data were also used [34].
The model datasets were obtained from the CORDEX-CORE experiment, a coordinated subset within CORDEX that offers a standardized set of high-resolution simulations (0.22° or ~25 km) across all major land regions, which use a common set of regional climate models (RCMs) forced by general circulation models (GCMs). We used the outputs of all nine available CORDEX-CORE models (Table 1): RegCM, CCLM, and REMO2015 RCMs, all driven by HadGEM2-ES (Had), MPI-ESM-MR (MPI), and NorESM (Nor). The multi-model ensemble mean (MME) data were obtained using Climate Data Operator (CDO), version 2.0.4 [35]. In this study, the conservative interpolation technique was applied to remap all the data to an identical grid with a 0.25° horizontal resolution [36].

2.2. Methods

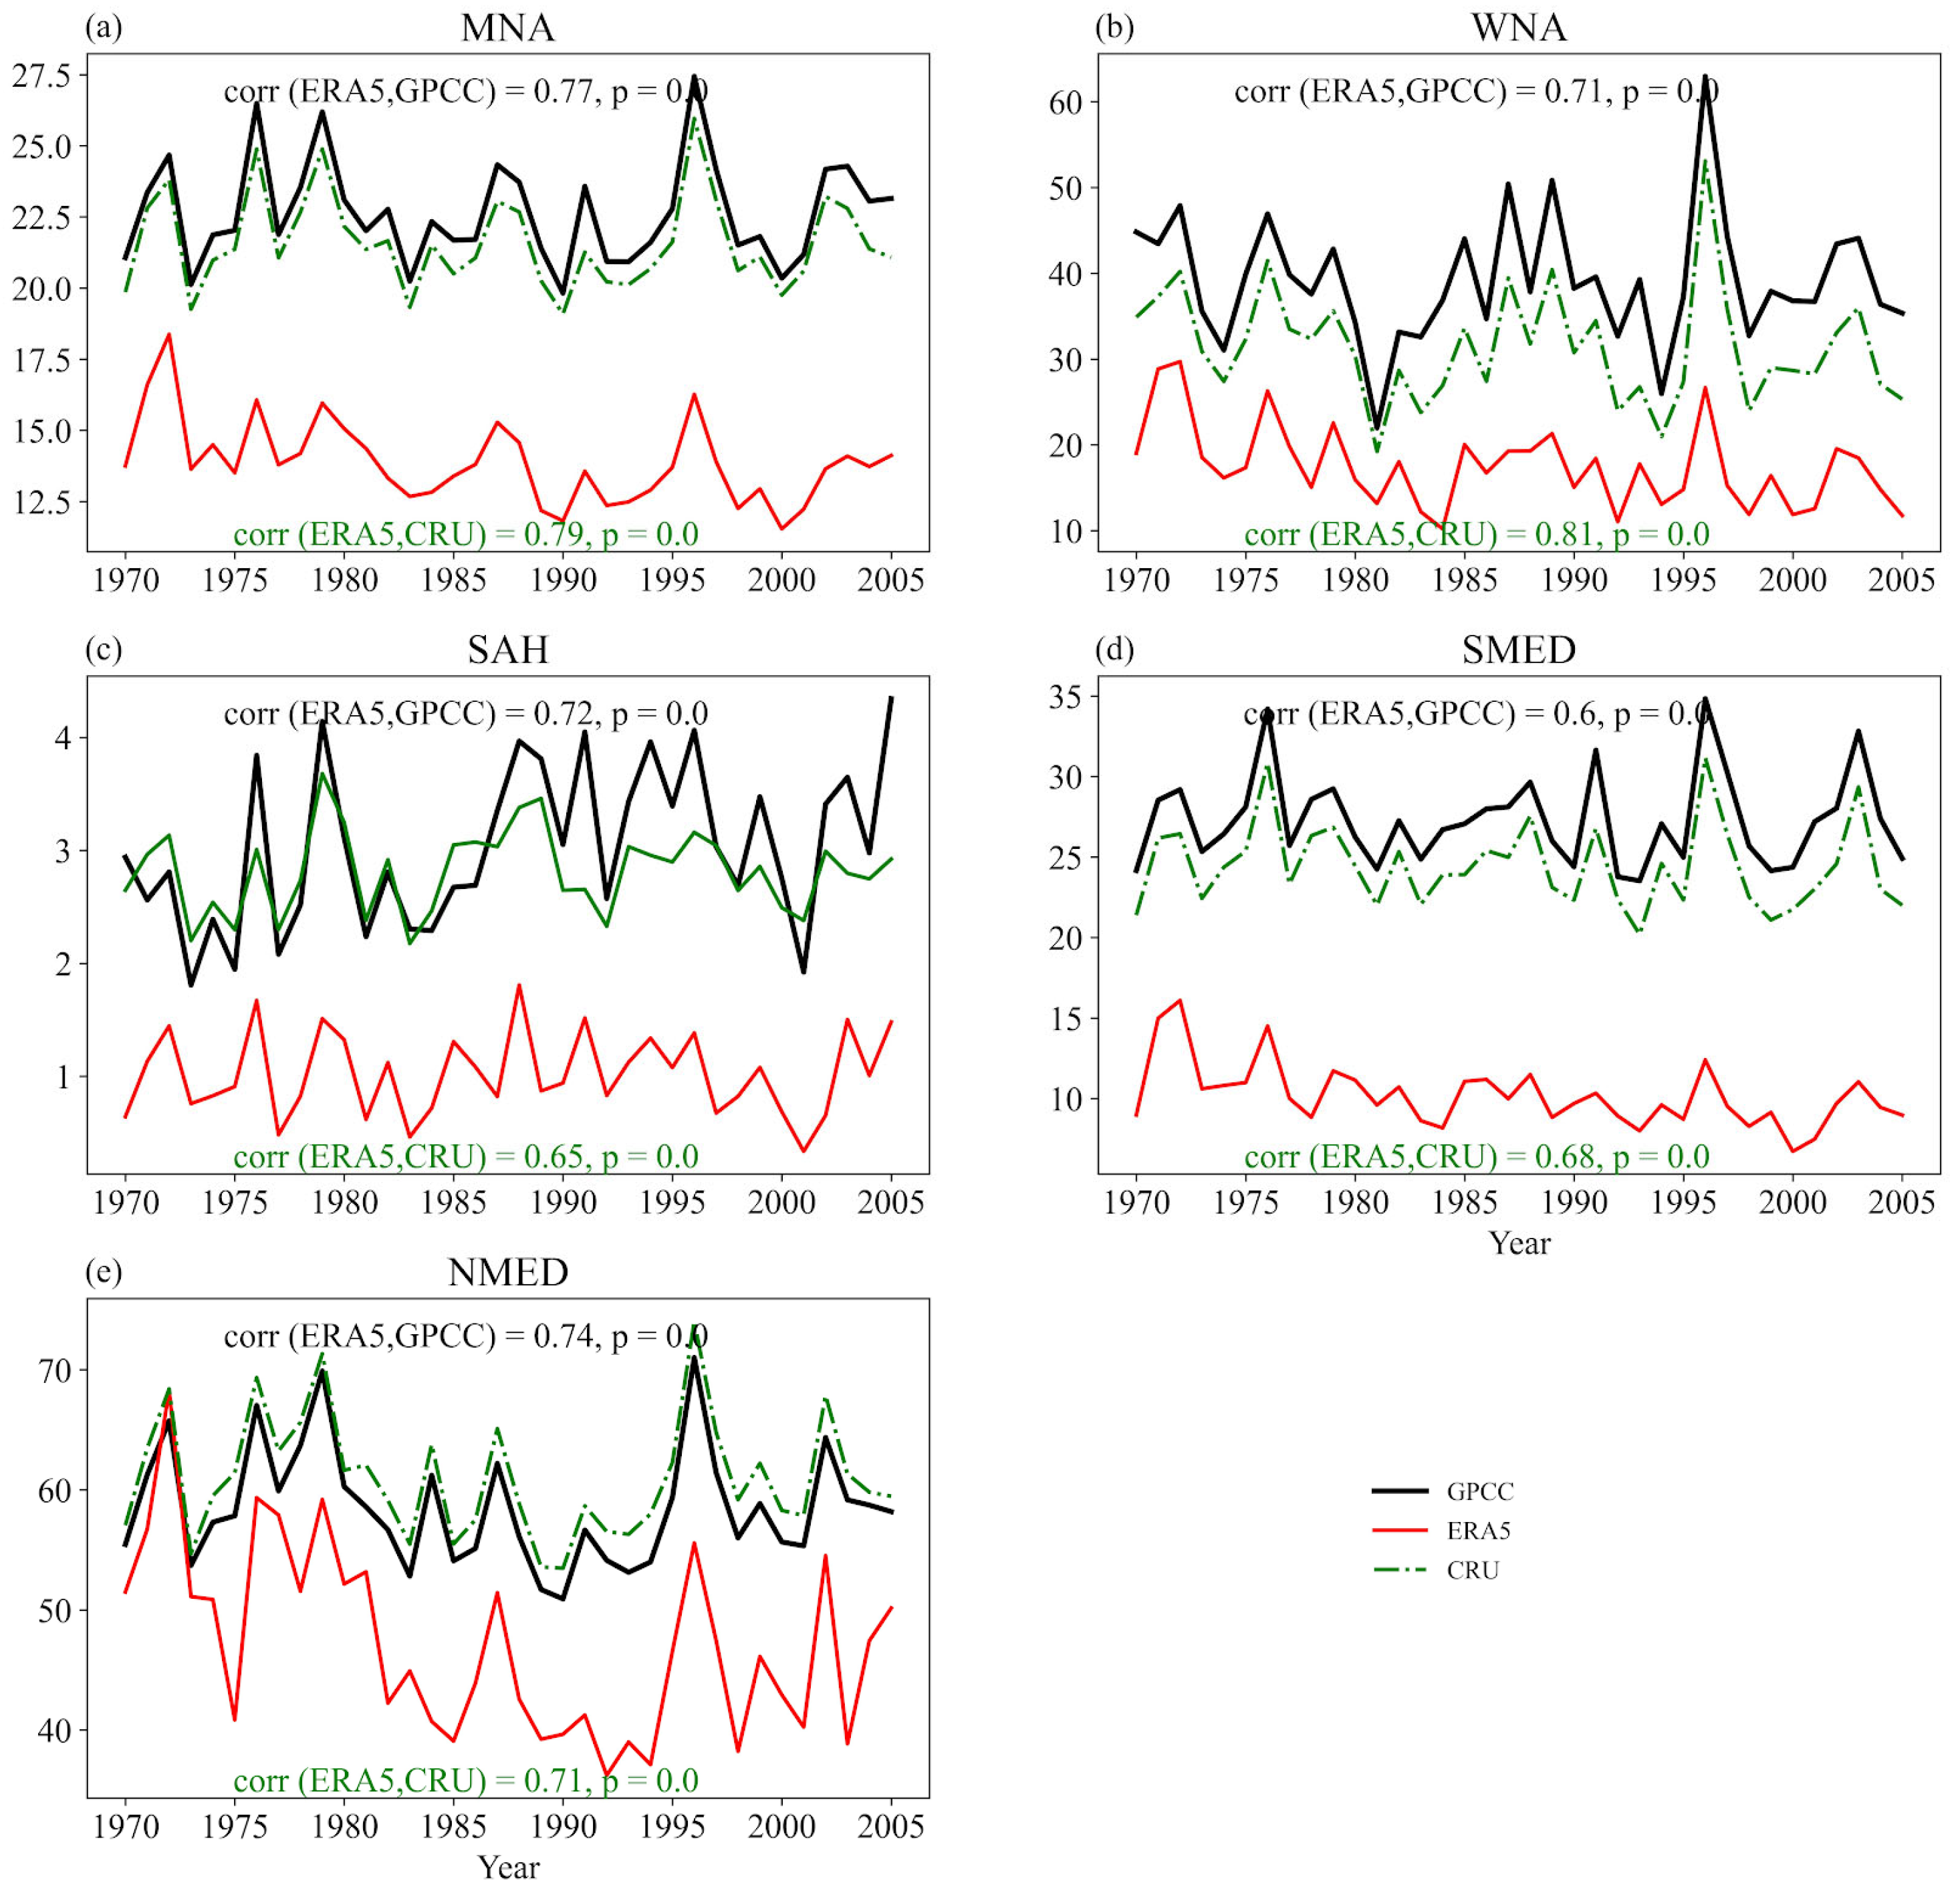
To validate the ERA5 reanalysis product, we compared the ERA5 precipitation data with CRU and GPCC data over the period of 1970–2005 and found significant relationships (p < 0.01; Figure 2). The annual cycle and area-averaged decadal precipitation of ERA5 (Figures S1 and S2) adequately captured the patterns of the GPCC and CRU data; therefore, the ERA5 data were used as the reference data. However, the discrepancies between the observational datasets (CRU and GPCC) and ERA5 based on the root mean square error (RMSE) at both interannual and decadal time scales are provided in the Supplementary Materials (Table S1). All datasets were interpolated to 0.25° before the analysis. To investigate the decadal-to-multi-decadal variability of precipitation, a 10-year window with cutoff equal to 0.1 was used with a low-pass Butterworth filter applied to the time series before analysis. The filter was applied in both forward and backward directions, which involves two passes of the data through the filter, which cancels out the phase shift of the filtering process, preserving the waveform shape of the original signal. This is essential when working with data that require accurate representation. The default odd option used has the corresponding symmetry about the end point of the data.
This filter has been widely used to characterize decadal changes in climate variables. This approach is comparable to a running or moving average filter, which is effective for identifying trends and making inferences about future conditions based on past and current states.
To evaluate the statistical significance level, the effective degree of freedom was calculated following the method in [37,38] and using the critical value of r. The effective degree of freedom (Nef) is expressed as:
1 N e f = 1 N + 2 N × j = 1 N N j N ρ x x j ρ y y j
where N represents the sample size, and ρ x x j   a n d   ρ y y j are the autocorrelations at lag one. The critical correlation value (rcrit) is defined as follows:
r c r i t = t 2 t 2 + N e f
where t represents the Student’s statistic at a given confidence level. At α = 0.05, rcrit = 0.51.
A two-way grouping of the climate models was performed in order to compare the biases from the RCMs and GCMs. A boxplot was used to summarize the area-averaged decadal precipitation from ERA5 and the models.
The monthly data were averaged over twelve months to obtain annual values. A similar step was applied to obtain the mean precipitation for the DJF, MAM, JJA, and SON periods. We assessed the performance of models in capturing the precipitation characteristics of the ERA5 data at the interannual scale using the seasonal cycle.

3. Climatology of Precipitation at Annual and Decadal Time Scales

3.1. Annual Cycle of Precipitation

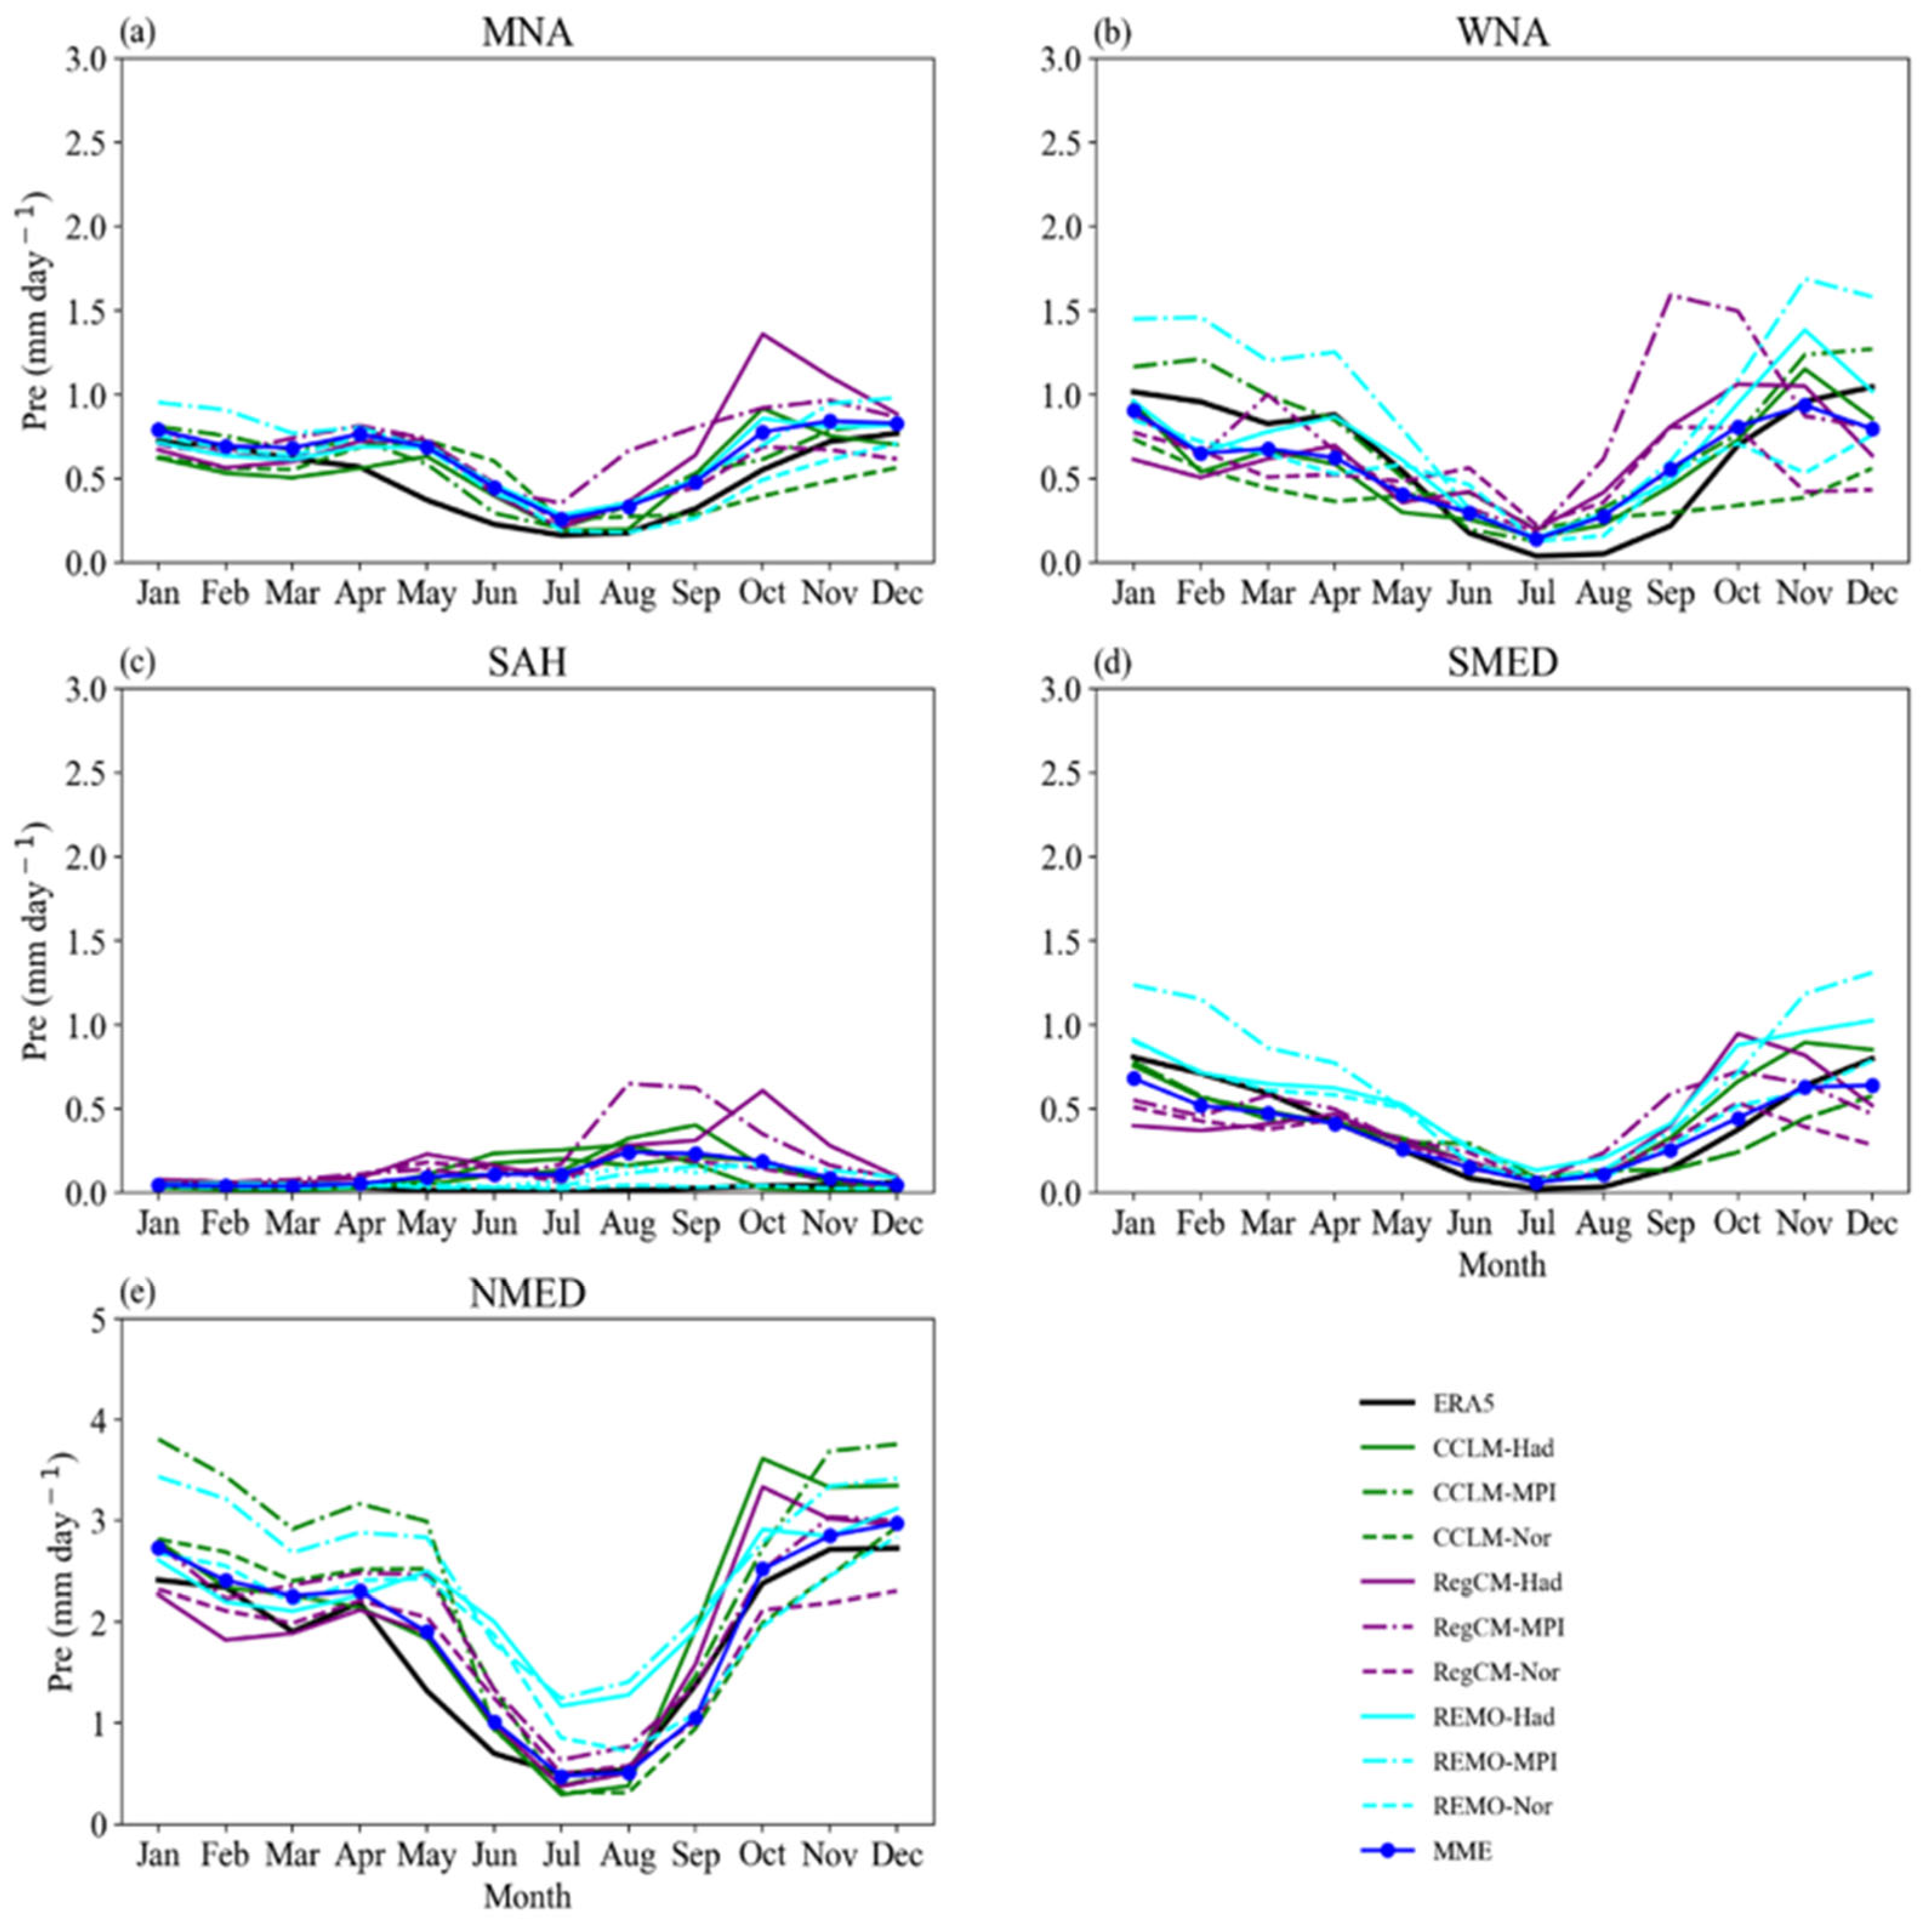
Figure 3 shows the area-averaged annual cycle of precipitation over the MNA and its four sub-regions, comparing individual RCMs and their multi-model ensemble mean (MME) with the ERA5 data. The models generally reproduced the seasonal cycle across all regions but exhibited notable differences in total amounts, particularly during wet months. In particular, the typical Mediterranean precipitation regime exhibited in NMED, SMED, and WNA was reproduced quite well, with wet winters, a sharp decline in spring, and a pronounced summer minimum, followed by an increase starting in early autumn. In these regions, the MME closely followed the ERA5 seasonal phase and overall magnitude, particularly capturing the summer drying and the following autumn increase. However, a noticeable inter-model spread was present, especially during autumn and winter, with several models overestimating precipitation during these seasons over NMED (Figure 3e), where the precipitation amounts were higher overall. The spread was also pronounced over SMED from October to February (Figure 3d). Some models tended to overestimate precipitation in this region throughout the year; this bias was particularly evident with the REMO RCM, regardless of the driving model. For WNA (Figure 3b), the MME reproduced the overall seasonal cycle of precipitation despite the alternating underestimations and overestimations throughout the year. A substantial inter-model spread was observed from late summer to autumn, with dominant positive biases leading the MME to exceed the ERA5 precipitation values. In summary, the MME overestimated precipitation between June and October while underestimating it during the remainder of the year.
The very low precipitation amounts for SAH due to its arid climate were relatively well reproduced between December and April (Figure 3c). However, the amounts were overestimated by both the MME and most of the individual models in summer and autumn, suggesting challenges in simulating this kind of sporadic (in space and time) precipitation. The very low amounts in the ERA5 data during these months were well-reproduced by REMO, but it was GCM-dependent. It is worth noting that this region also registers extreme events [39] that may be overestimated by the models, contributing to the mean bias. Our results are consistent with those of [40], who compared CORDEX-CORE precipitation over Africa with CHIRPS (Climate Hazards Infrared Precipitation with Stations) and GPCC (Global Precipitation Climatology Center) data. In particular, despite focusing their analyses on the regions south of 30° N, their results showed that winter rainfall was generally underestimated by the individual models in the Mediterranean part of Africa and mostly overestimated in summer. Consistent with our finding, the authors of [41] also showed that the biases depend on both the RCM and the driving GCM.

3.2. Characteristics of Decadal Precipitation

The spatial distribution of the mean decadal precipitation calculated at the annual scale over the study domain (Figure S3) showed, as expected, that precipitation was strongly concentrated along the northern part of the domain, with pronounced maxima over the Mediterranean Basin and adjacent mountainous regions. The annual mean precipitation exceeded 3 mm day−1 over the western and central Mediterranean and parts of the eastern Mediterranean, reflecting the combined influence of mid-latitude storm tracks and orographic enhancement. In contrast, precipitation decreased sharply to the south, with coastal and mountainous regions registering between 1 and 3 mm day−1. The SAH exhibited much drier conditions, with values generally below 0.5 mm day−1 across most of the region. The seasonal patterns during DJF, MAM, and SON closely resembled the annual distribution, while WNA and SMED showed near-zero precipitation during JJA (Figure S4).
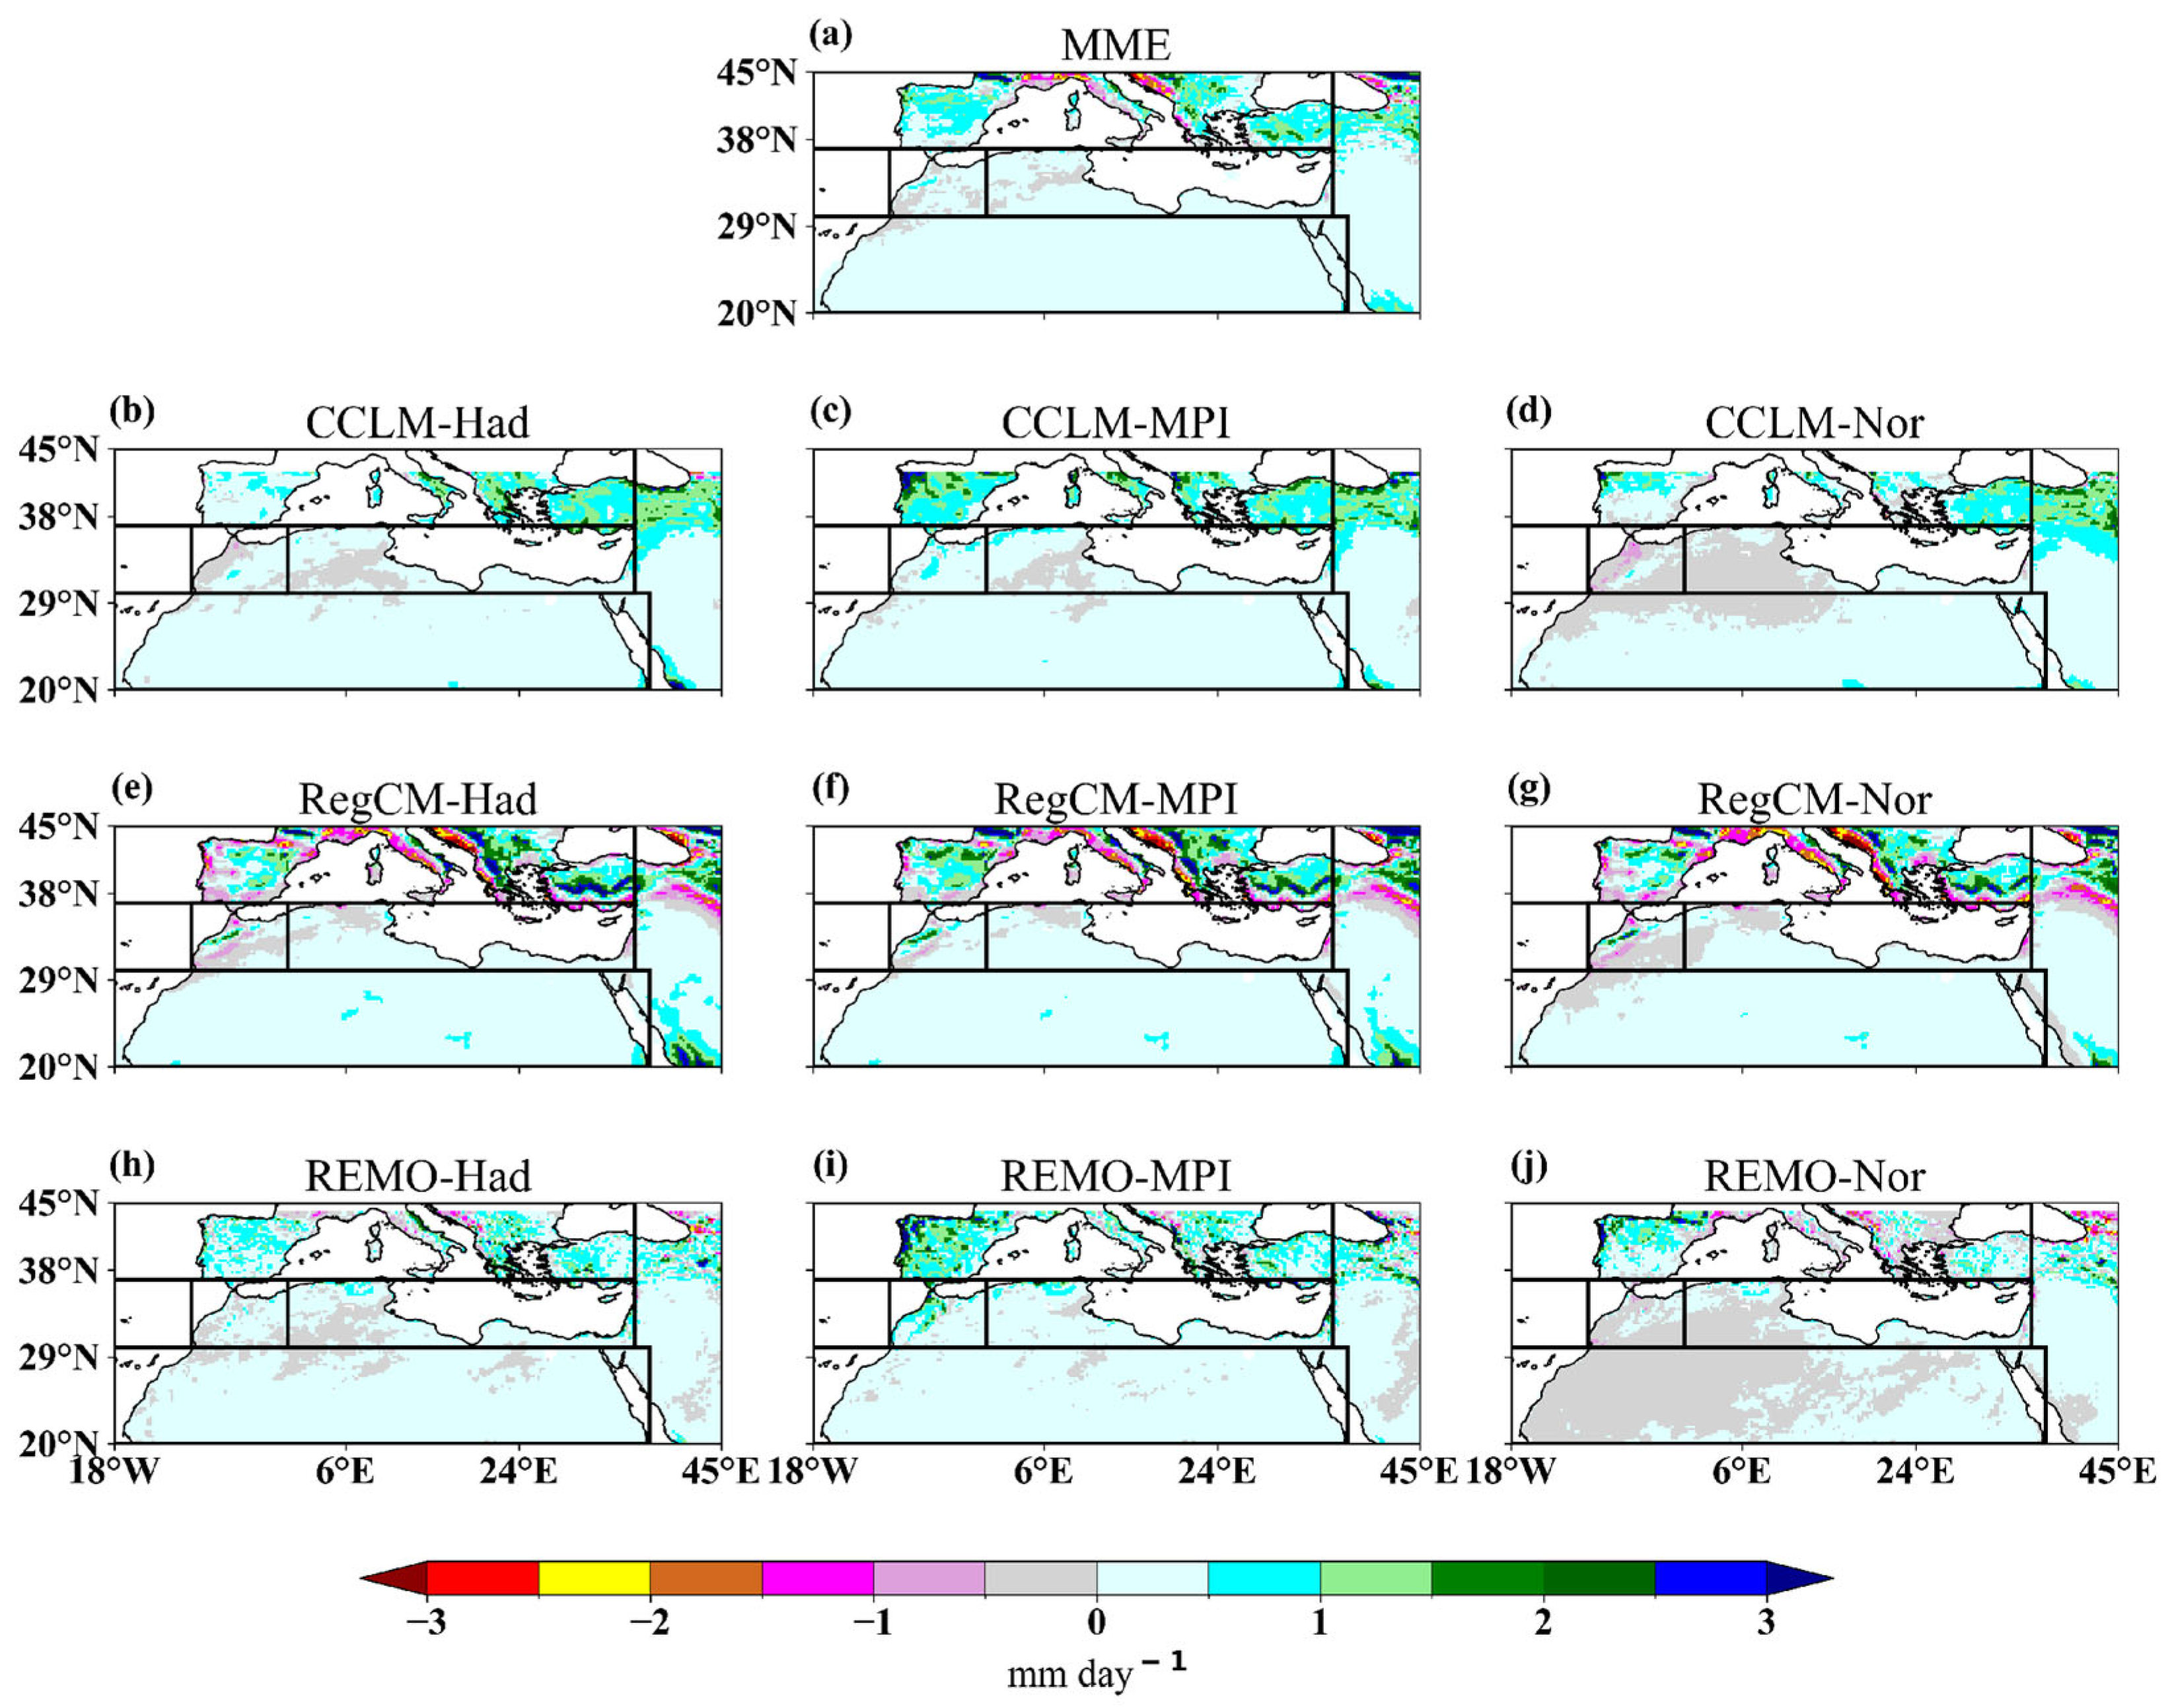
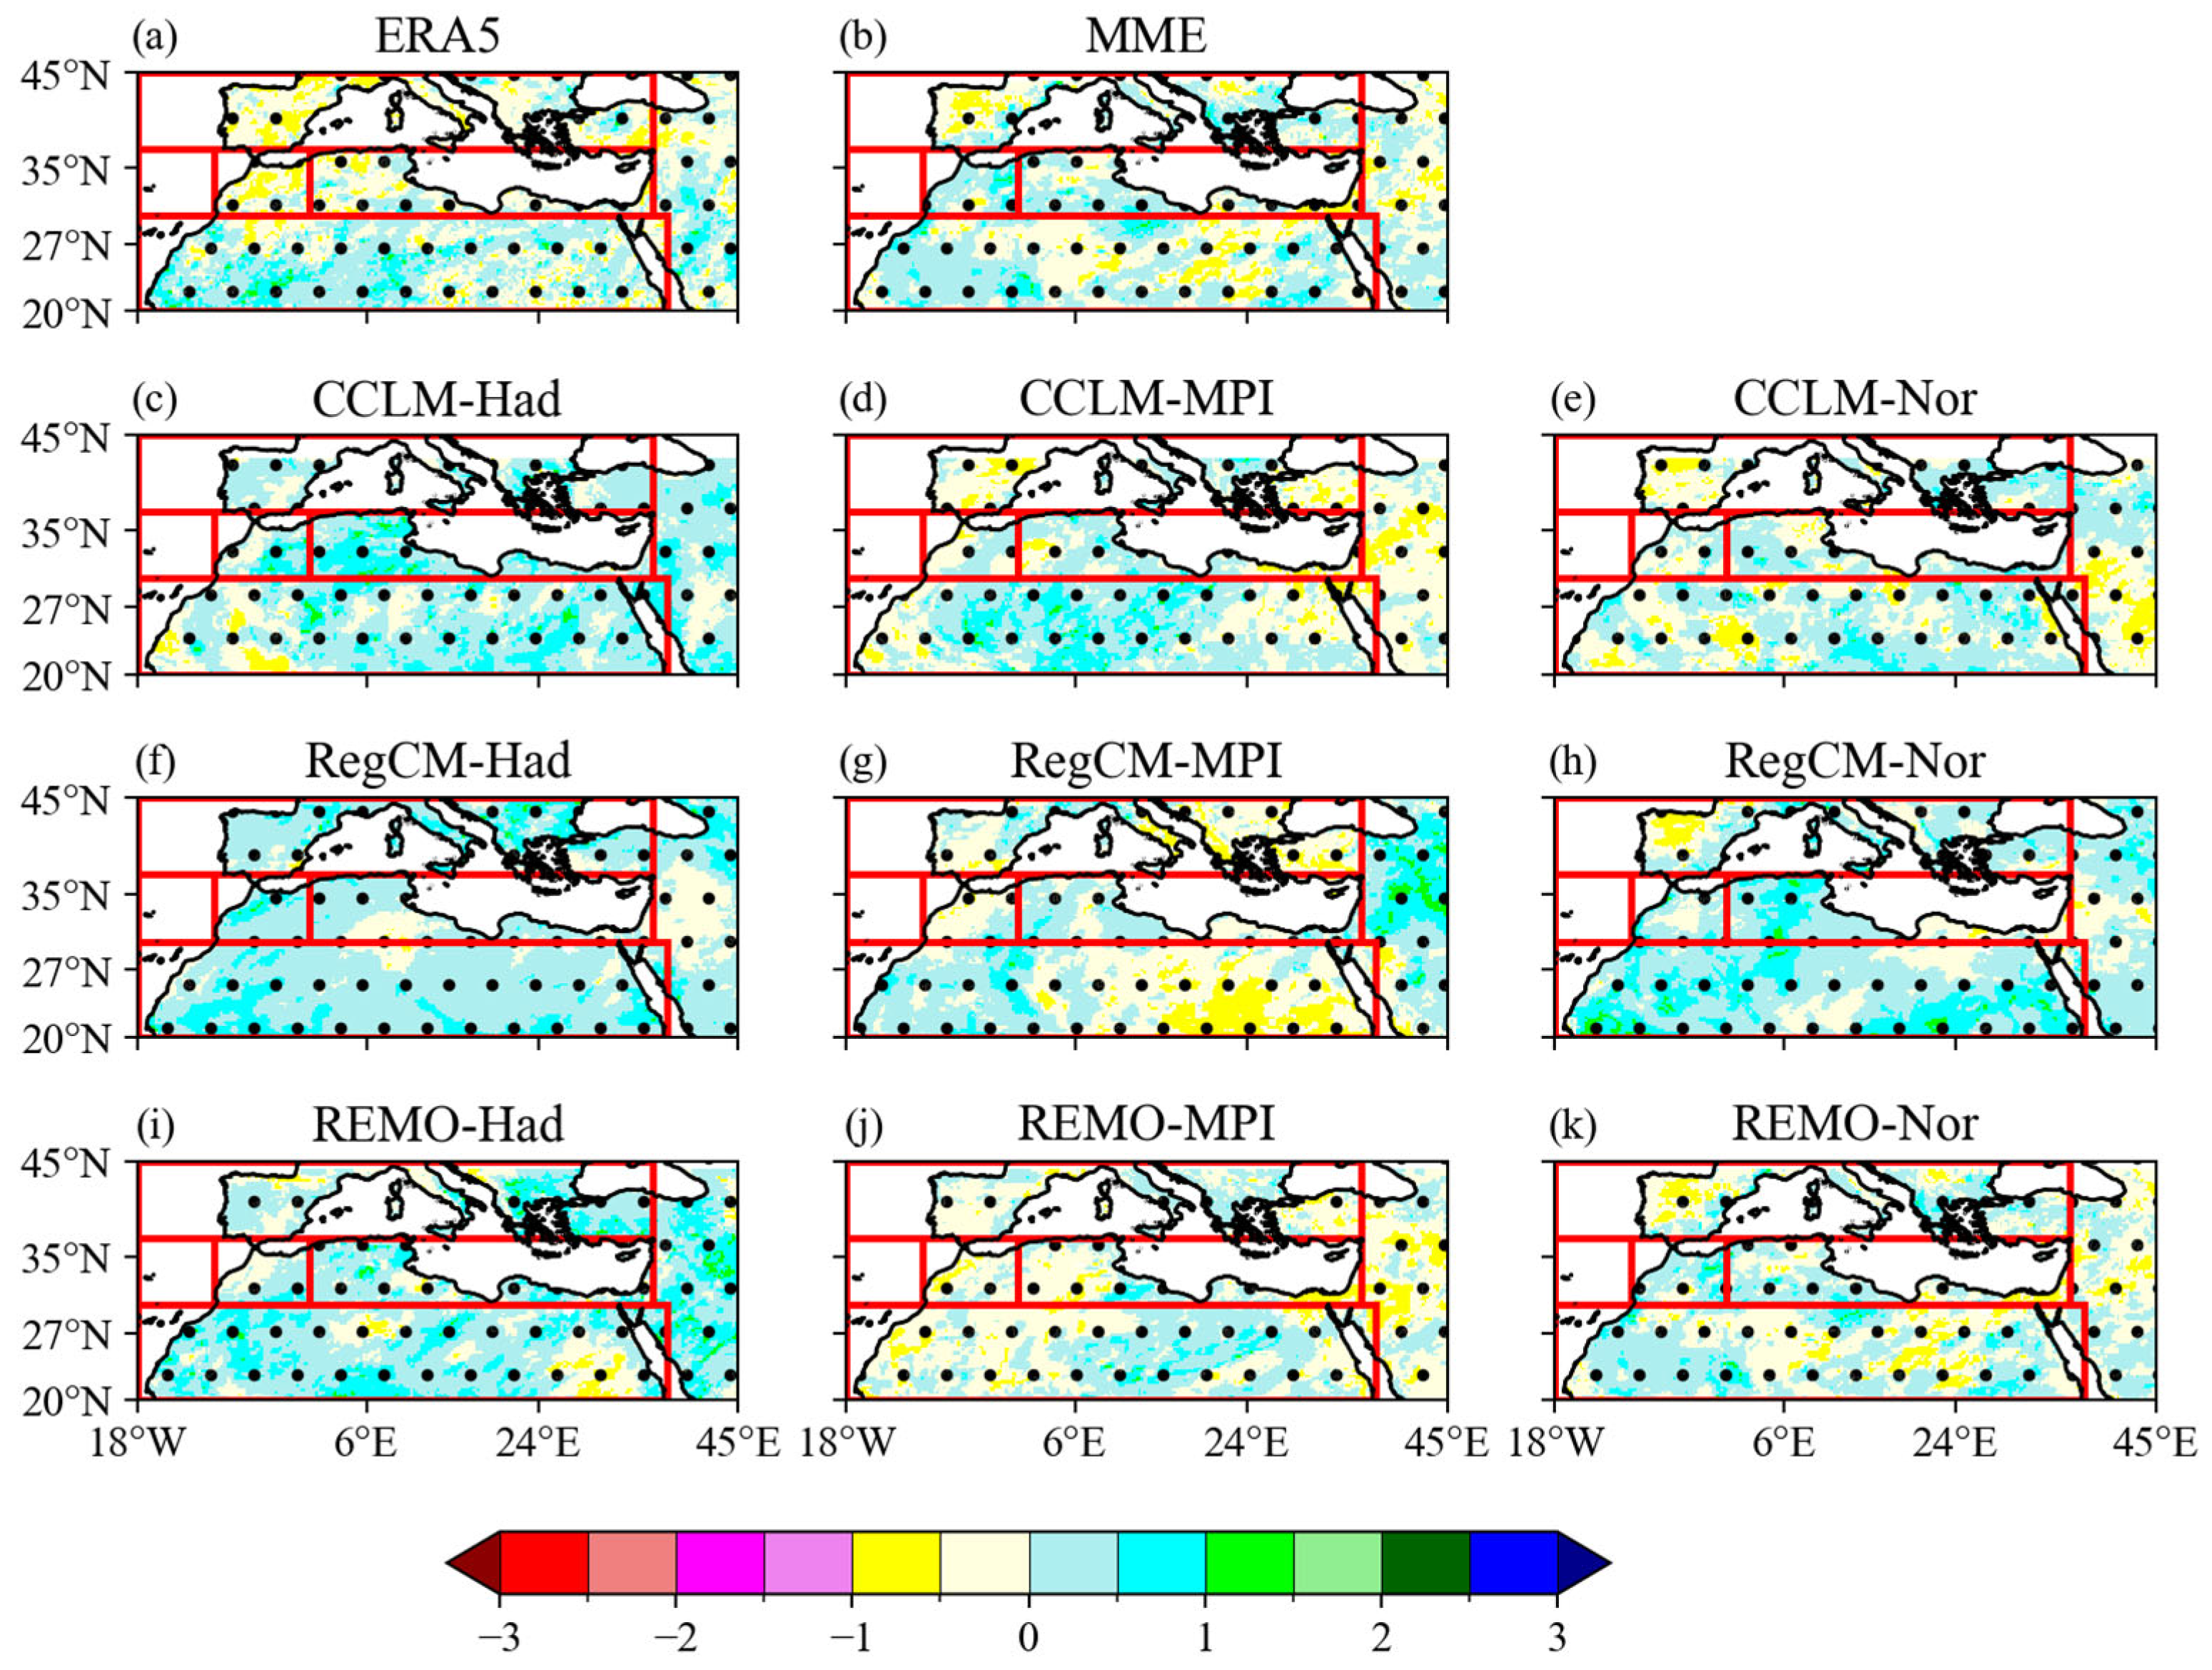
The spatial distribution of annual-scale decadal precipitation anomalies and their statistical significance are presented in Figure 4. Overall, both individual regional climate models and the MME exhibited relatively modest biases over most of North Africa, which reached up to ±1 mm day−1. This indicates that at the continental scale, the MME does not display pronounced systematic errors in reproducing decadal precipitation variability.
The highest biases were concentrated over the NMED region, which received the most precipitation in the study domain. In this area, precipitation biases typically ranged between +0.5 and +1 mm day−1, with localized maxima reaching up to 2 mm day−1, particularly in simulations driven by the MPI GCM (Figure 4b,e,h). In contrast, models forced by the NorESM GCM (Figure 4c,f,i) consistently underestimated decadal precipitation across large parts of North Africa, with negative biases of approximately −0.5 mm day−1. At the regional scale, RegCM tended to overestimate precipitation along the WNA coastal areas, whereas CCLM and REMO showed the opposite behavior, characterized by underestimations along the coast and a marked overestimation over the interior of WNA. Similarly, parts of the NMED region displayed negative biases in the RegCM simulations, which may be partly attributed to differences in physical parameterization schemes, particularly those related to convection and land–atmosphere interactions (e.g., [42,43]). In addition, the authors of [44] showed that the difference between observed and modeled data is sensitive to model physics, particularly the convective parameterization. Seasonal bias patterns (Figure S5) showed negative precipitation biases during DJF and MAM over WNA and SAH, while JJA and SON were dominated by positive biases across most of North Africa, indicating an overall overestimation of decadal precipitation in summer and autumn. REMO and CCLM exhibited more pronounced biases, with REMO showing positive biases during JJA and SON, consistent with its known tendency to overestimate precipitation over the MNA region [45]. These biases likely reflect limitations in the representation of key atmospheric processes and the influence of biased boundary conditions inherited from the driving GCMs.
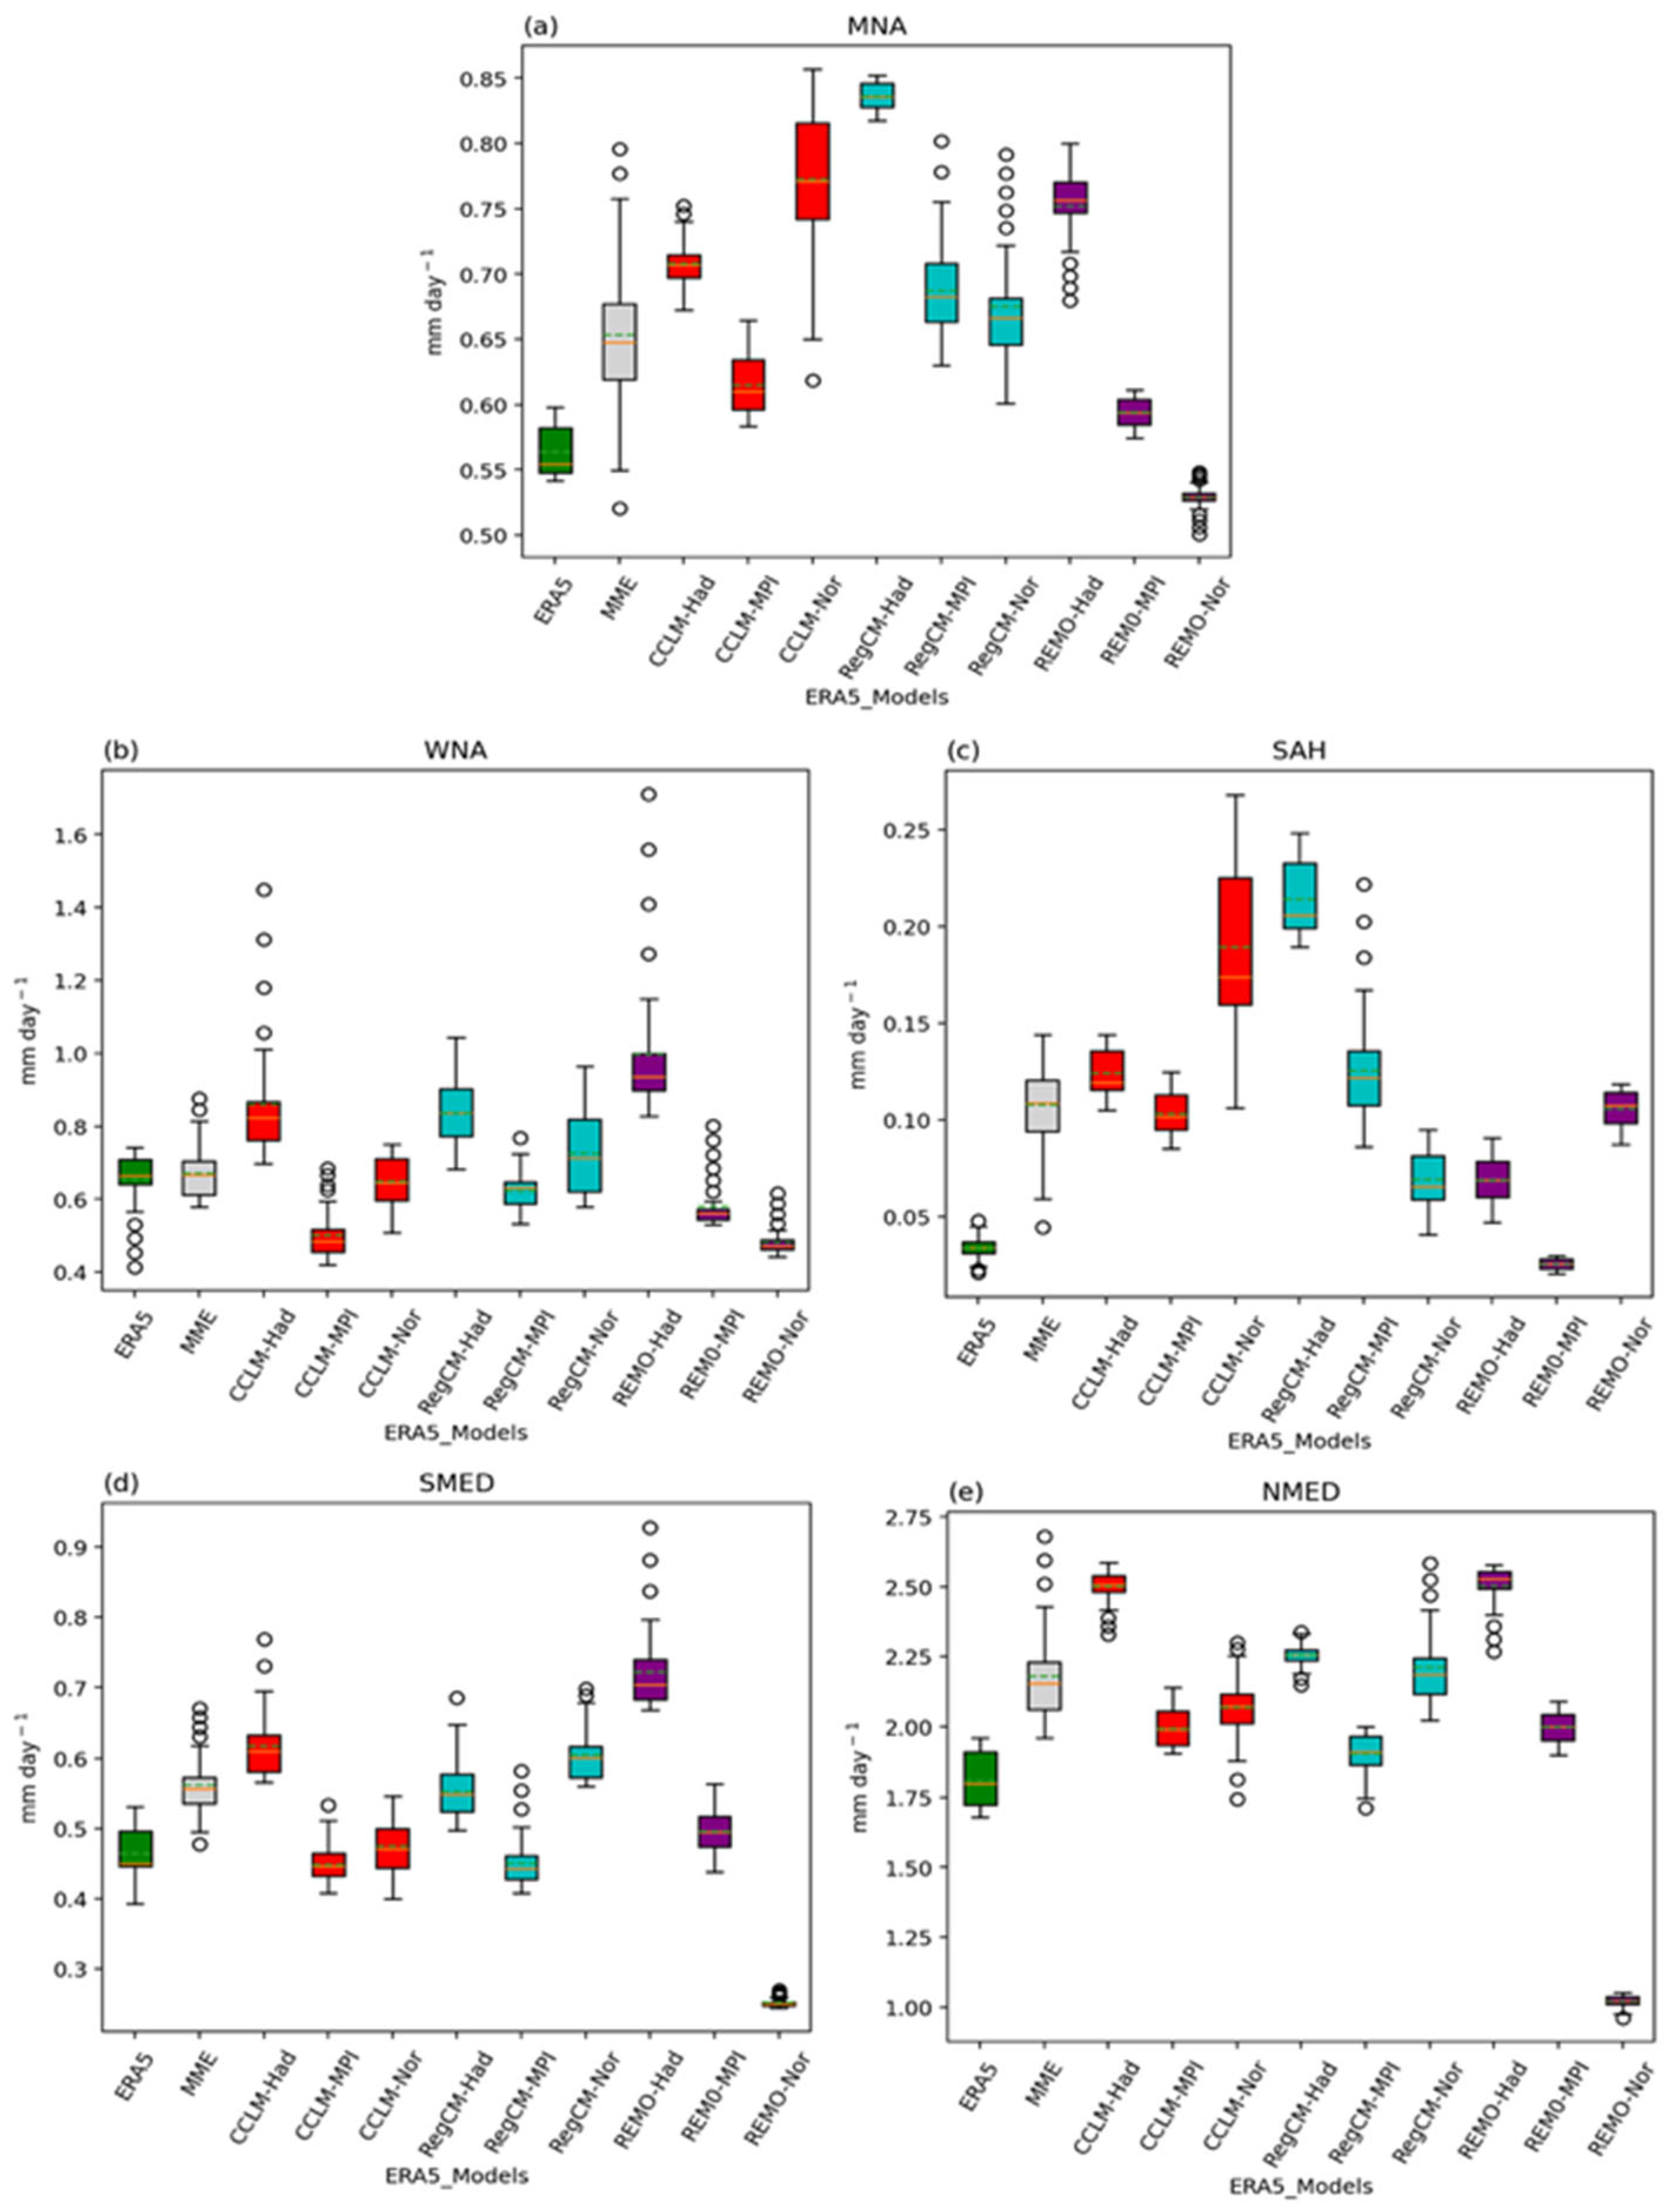
The distribution of area-averaged decadal precipitation around the 50% line through the first and third quartiles and the interquartile range is shown in Figure 5. Over the MNA region at the annual scale (Figure 5a), except for the median of REMO-Nor and REMO-MPI, which was closer to the median of ERA5, the median decadal precipitation values of the individual models and MME were greater than that of ERA5, indicating an overestimation of median values over the MNA region. In addition, CCLM-MPI exhibited the widest spread in decadal precipitation values, indicating high variability, whereas the three REMO configurations showed more compact distributions, reflecting comparatively lower variability; among them, REMO-Nor was the most compact. For WNA, the median decadal precipitation values of CCLM-Had, RegCM-Had, and REMO-Had were clearly greater than that of ERA5, suggesting an overestimation of these models over the WNA region. Meanwhile, CCLM-MPI, RegCM-MPI, REMO-MPI, and REMO-Nor showed lower median values than ERA5 (Figure 5b), suggesting an underestimation of median decadal precipitation. In this region, RegCM-Nor exhibited the highest variability in decadal precipitation values, whereas the lowest variability was obtained with REMO-Nor. The median values of the MME, CCLM-Nor, RegCM-MPI, and RegCM-Nor were close to that of ERA5, which models showed better performance in reproducing the distribution of decadal precipitation values in WNA. For SAH, the median decadal precipitation in all models except REMO-MPI exceeded that of ERA5, indicating general overestimation (Figure 5c). In contrast, REMO-MPI showed a lower median than ERA5, reflecting underestimation. Variability was highest in CCLM-Nor and lowest in REMO-MPI. Notably, the median of REMO-MPI was the closest to that of ERA5, suggesting a better representation of decadal precipitation variability.
SMED (Figure 5d) showed higher variability in models driven by the Had GCM; the decadal precipitation values of these models were greater than those of ERA5, signifying an overestimation. Meanwhile, the lowest variability was obtained with REMO-Nor, with a decadal value less than that of ERA5, indicating an underestimation of the median value.
In Figure 5e, except for the REMO-Nor model, all models exhibited median decadal precipitation values greater than that of ERA5 for NMED. This means that most of the models overestimated the decadal precipitation. In contrast, REMO-Nor showed a lower median decadal precipitation than ERA5, indicating that REMO-Nor underestimated this value for NMED.
Overall, model outputs showed good agreement with the ERA5 data for NMED and SMED, indicating that most models could simulate the decadal precipitation over these two regions. Meanwhile, the simulated data showed poor agreement with the ERA5 data for the MNA region, WNA, and SAH. Among the GCMs, the Nor-driven models exhibited the lowest variability across the five domains, producing the results closest to the ERA5 data.
The seasonal results are presented in the Supplementary Materials (Figures S6–S10). Both the magnitude and variability of decadal precipitation differed across seasons, regions, and RCMs, and no driving model consistently outperformed the others across all regions. During DJF, dry biases dominated the entire MNA, the results of which were projected in a previous study [46]. Similarly, dominant dry biases were found during MAM. Meanwhile, JJA and SON exhibited wetting biases over a large part of the MNA region.
Figure 6 shows the spatial distribution of the Mann-Kendall trends at each grid point. At the annual scale, heterogeneous trends in decadal precipitation were evident across the entire region. For WNA, ERA5 exhibited predominantly positive trends in decadal precipitation. The simulations from CCLM-Had and RegCM-Had indicated dominant positive trends. In contrast, the MME and the models forced by MPI GCM showed predominantly negative trends of nearly −0.2 for WNA. While negative trends indicate a reduction in decadal precipitation, the positive slope rates indicate a wetting trend over the study period. A previous study on decadal precipitation in Africa used the CRU dataset and showed a predominantly negative trend for WNA [25]; these results are consistent with some of the model outputs in our study. The negative trends could be due to the MPI driving model.
ERA5 exhibited a mixed pattern of decadal precipitation trends for SAH, with positive trends of approximately +0.1, predominantly over the eastern SAH, and negative trends reaching −0.15over the western SAH. In contrast, regional climate models, with the notable exceptions of RegCM-MPI and REMO-MPI, simulated significant positive trends (~0.1–0.2) over large parts of the SAH.
For SMED, predominantly positive trends in decadal precipitation were obtained in the ERA5 reanalysis. CCLM-Had, RegCM-Nor, and MME showed similar trends. The NMED region exhibited positive trends in the ERA5 data over the Iberian area (western part of NMED), whereas the Balkan region experienced both positive and negative trends. Previous findings showed an increase in precipitation over Iberia during warm–wet days from 1970 to 2007 [47]. Meanwhile, most models exhibited predominantly negative trends in decadal precipitation over the Iberian Peninsula, specifically, CCLM-Had, CCLM-MPI, RegCM-MPI, REMO-MPI, CCLM-Nor, RegCM-Nor, REMO-Nor, and the MME. In the Balkan region, some models detected negative trends in decadal precipitation, for example, CCLM-MPI, RegCM-MPI, and REMO-MPI.
Seasonally, there were predominantly negative trends in decadal precipitation for WNA during DJF and SON in the ERA5 data. A mixture of positive and negative trends during MAM was observed for this region (Figure S16). The majority of the individual models and the MME showed predominantly positive trends during DJF, whereas there was a predominantly negative trend in SON. In contrast, over the remaining regions, the JJA and SON seasons sometimes exhibited positive and sometimes negative trends, indicating that there were no clear trends in decadal precipitation during these seasons in some sub-regions. It implies that while some areas experience decreases in decadal precipitation, other areas experience increases, highlighting the complexity of precipitation variability over a large area. A previous analysis of precipitation over the MNA region and its sub-regions did not find any trends [48], which is in line with the present results. The differences in precipitation trends could be explained by many factors, such as an uneven distribution of elevation and micro-meteorological events [49,50,51]. The increase in decadal precipitation implies a wet condition, whereas a decrease in decadal precipitation implies a dry condition.
The comparison of the results of the RCMs and GCMs with the ERA5 data for the MNA region is summarized in Table 2.
After summing the biases by the driving and downscaling models, it was found that the RCMs contributed to the positive biases in mean decadal precipitation. The RCMs showed higher biases in terms of magnitude during MAM and SON compared with the other seasons. Similar results were found for WNA, SAH, SMED, and NMED (Table S2). This could be explained by the effects of the boundary conditions in the RCMs [46].
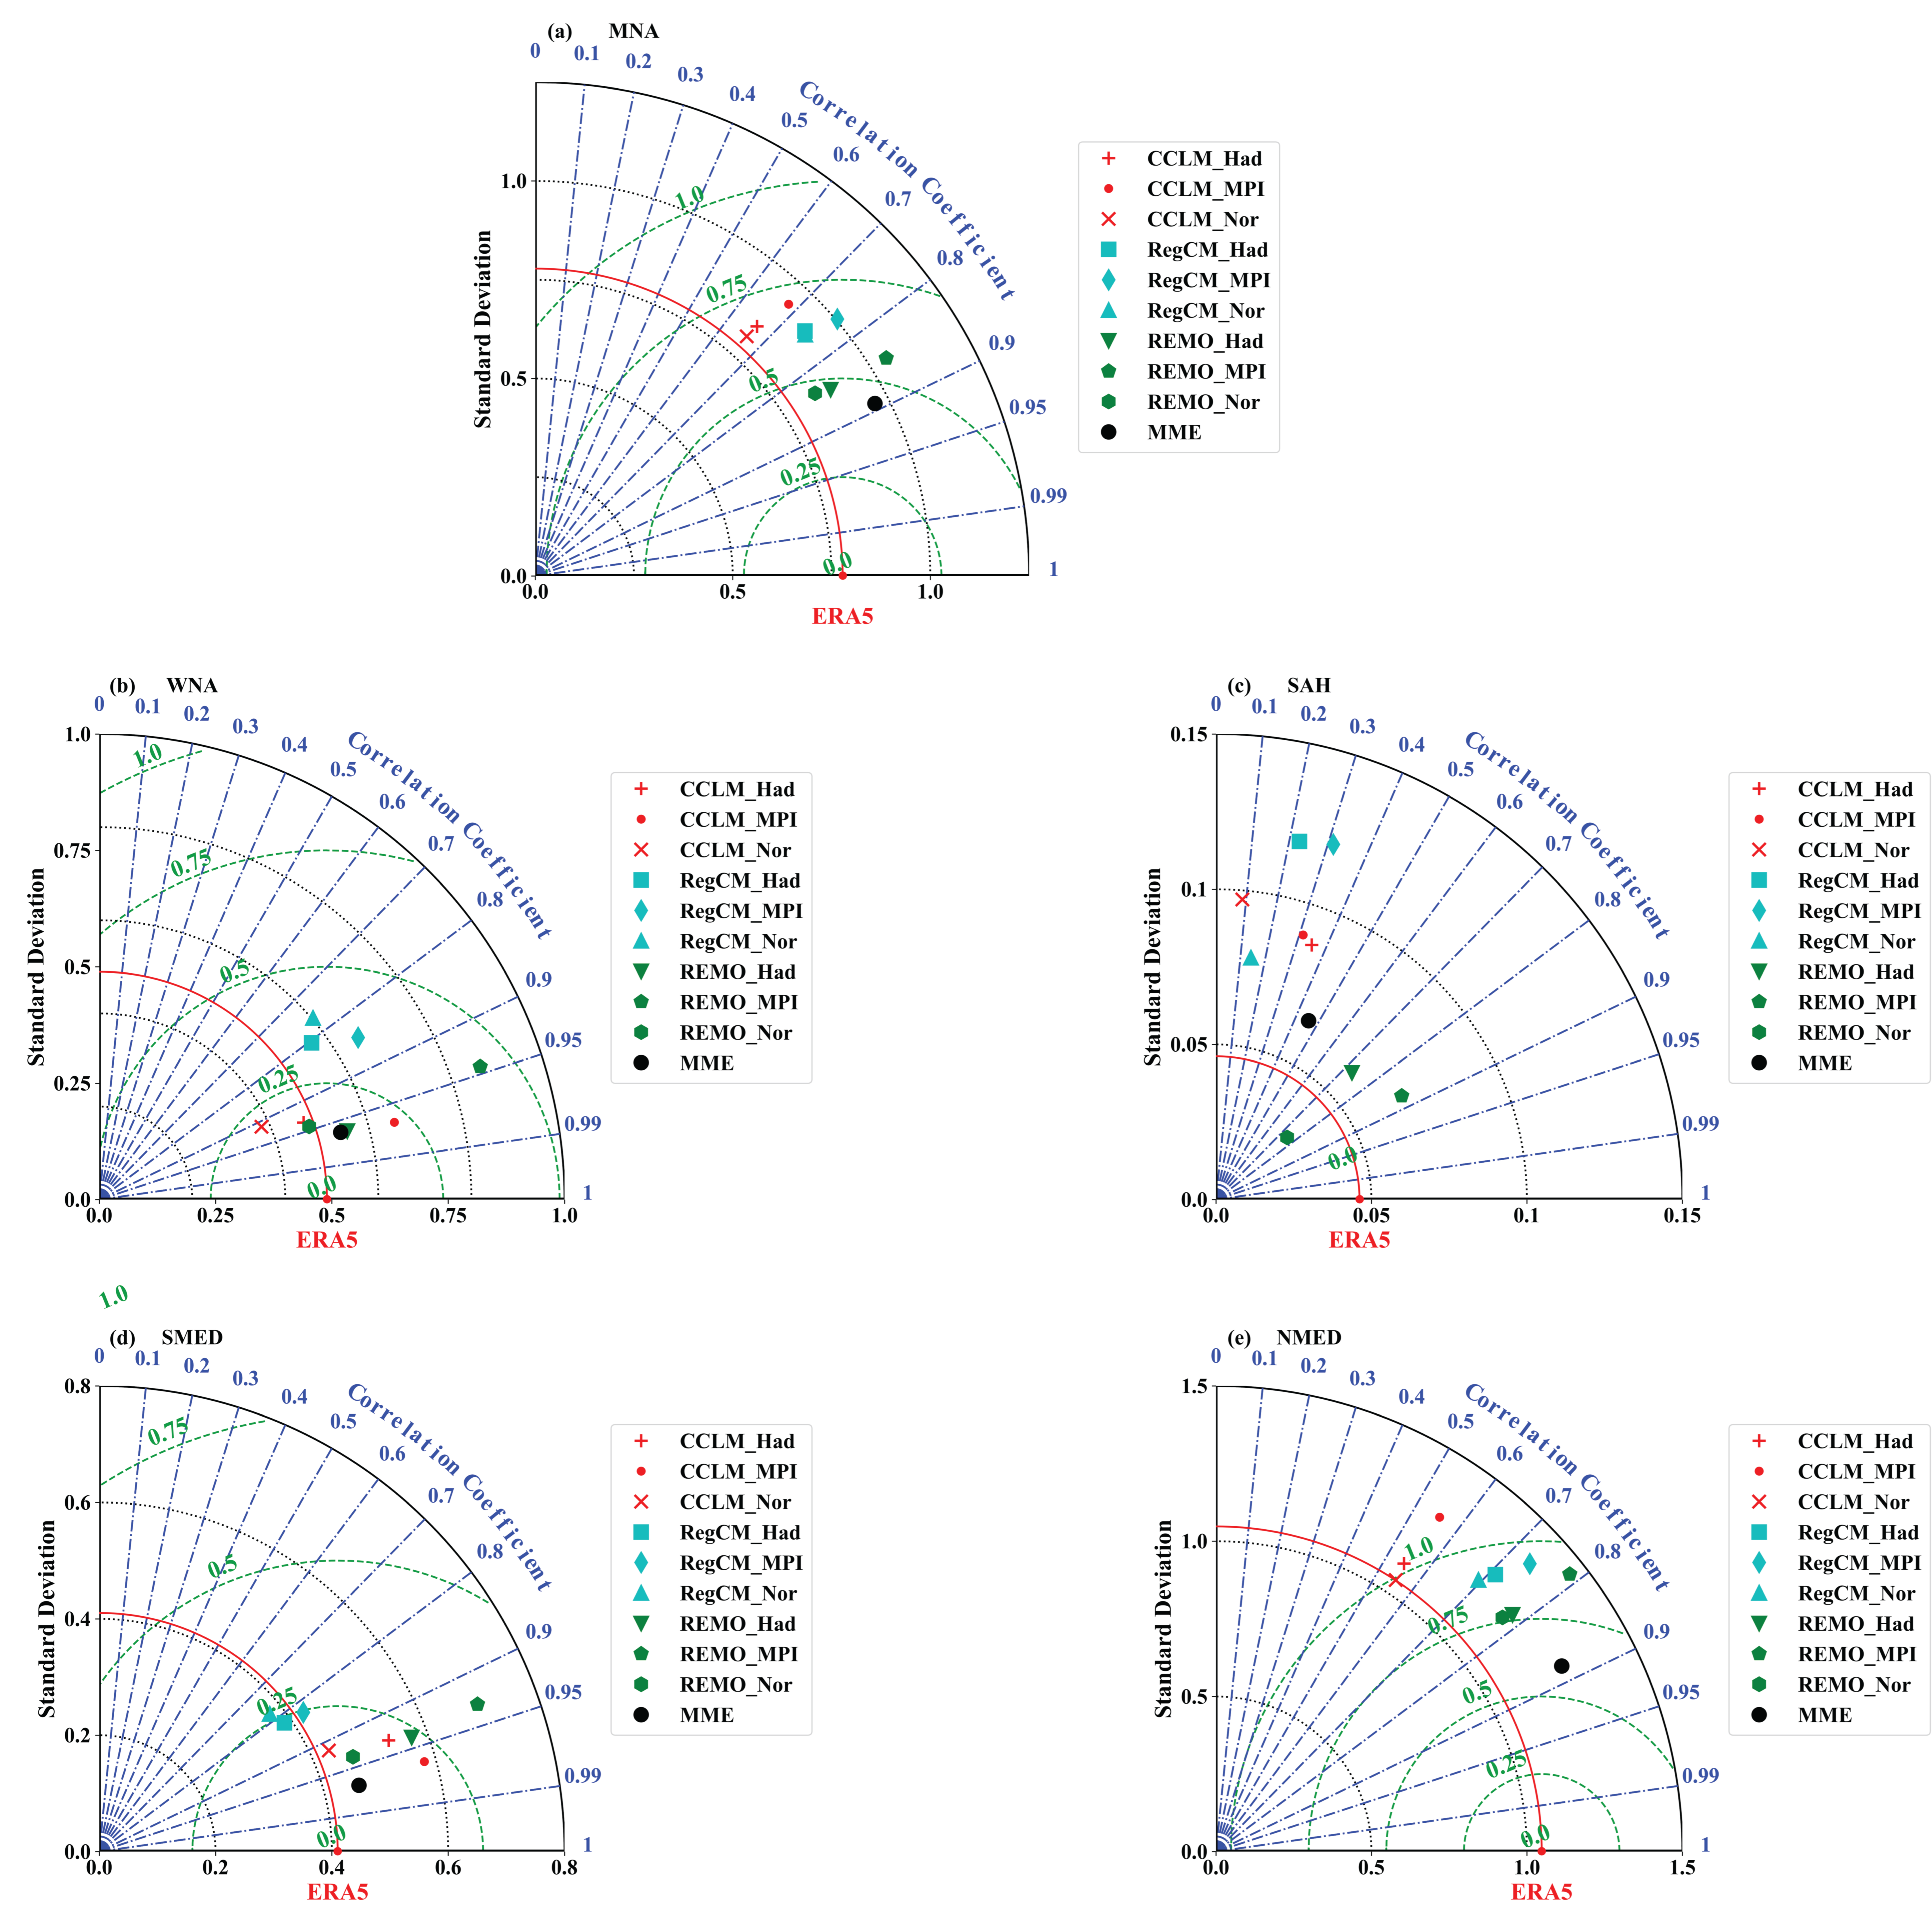
The spatio-temporal patterns of decadal precipitation from the CORDEX-CORE models and ERA5 were compared at annual (Figure 7) and seasonal (Figures S11–S15) scales. At the annual scale, the spatial patterns showed significant associations between ERA5 and the models, with correlation coefficients ranging from 0.66 to 0.90 for the MNA region, 0.75 to 0.96 for WNA, 0.03 to 0.90 for SAH, 0.80 to 0.97 for SMED, and 0.55 to 0.88 for NMED. RegCM performed better in SMED, whereas its weakest performance was observed for SAH. The MME achieved higher correlation coefficients than most individual models across all sub-regions, except in SAH, with clear improvements for SMED and NMED. CCLM-MPI and REMO-Nor showed good performance for the MNA, while REMO-Nor performed particularly well for WNA and SAH, with RMSE values ranging from 0.47 to 0.70 mm day−1. Overall, REMO exhibited the lowest bias and higher correlations thanRegCM and CCLM. The RMSE values also indicated that the MME produced the lowest errors for the MNA region, WNA, SMED, and NMED, confirming that the ensemble agrees more closely with the ERA5 data, which is in agreement with previous studies [52,53]. In contrast, REMO-Nor performed better in SAH at the annual scale compared to the other sub-regions.
Seasonally, model performance varied across both regions and seasons. For WNA, the lowest RMSEs were 0.47 mm day−1 in DJF (MME), 0.53 mm day−1 in MAM (REMO-Had), 0.46 mm day−1 in JJA (REMO-MPI), and 0.43 mm day−1 in SON (MME). In general, the MME produced the lowest RMSE values across seasons, ranging from 0.59 to 0.78 mm day−1. For the SAH region, REMO consistently yielded the lowest RMSEs (0.02–0.04 mm day−1), whereas REMO-Nor performed better in SMED. For NMED and SMED, the MME also produced the lowest seasonal RMSEs, between 0.16 and 0.20 mm day−1. Overall, the MME showed good performance across most regions at the annual scale, while at the seasonal scale, the model performance varied depending on the region.

4. Summary and Conclusions

In this study, we assessed the precipitation variability at the decadal time scale over MNA regions using nine CORDEX-CORE models and their MME, with ERA5 used as the reference dataset. Multiple statistical metrics were employed to characterize decadal variability in the ERA5 reanalysis to compare individual models and their MME against ERA5 across the region and its sub-regions and in different seasons with a focus on the decadal time scale. The key results of this study can be summarized as follows:
The annual cycle patterns were well-captured by the majority of models, which is similar to the results of a previous study in Africa [54]. Area-averaged decadal precipitation over the studied regions has been shown to be declining, specifically in the MNA region, WNA, SMED, and NMED, but tends to increase over the SAH region. These trends were also observed in this study with most of the models.
Predominantly positive trends in decadal precipitation were evident over large parts of the southern part of SMED, including the western part of WNA and the western parts of NMED, which exhibited an increase in decadal precipitation, whereas an obvious decrease was observed over the eastern part of NMED.
Comparison of the spatio-temporal decadal precipitation patterns in the MNA region and its sub-regions revealed strong correlation between the ERA5 and CORDEX-CORE model results. It was also found that the MME showed the lowest root mean square error for most of the regions for the studied period (1970–2005). However, caution must be taken when interpreting the MME, despite its ability to replicate the ERA5 data, because the outliers can skew the distributions [55].
The discrepancies between the ERA5 reanalysis and CORDEX-CORE decadal precipitation data could be attributed to many reasons, such as the parametrization schemes, hydrological cycle, and the different responses of soil moisture–precipitation feedback mechanisms [46,56,57]. In total, the capacity of CORDEX-CORE to reproduce the decadal precipitation variability of the reanalysis ERA5 depends on the region, model, season, and metrics.
Hence, improving the simulation of climate variables would require incorporating longer time scales to obtain deeper insights into the factors that affect regional decadal precipitation trends; these findings could be useful for supporting water resource management, climate adaptation monitoring, and climate model development.
In the current study, the short temporal coverage of the data, which constitutes a limitation to the study, warrants cautious interpretation and application of the results. Therefore, simulation data covering a longer period would improve the quality of information regarding decadal climate variability, in conjunction with the available decadal precipitation simulated in CMIP6. Our future research will focus on understanding how decadal precipitation is associated with general circulation using the same butter filter method.

Supplementary Materials

The following supporting information can be downloaded at: https://www.mdpi.com/article/10.3390/cli14090172/s1.

Author Contributions

F.K.O.: Conceptualization, data curation, formal analysis, investigation, methodology, software, visualization, writing—original draft; K.A.: Data curation, formal analysis, investigation, methodology, writing—review and editing; F.D.: Conceptualization, funding, supervision, methodology, writing—review and editing. All authors have read and agreed to the published version of the manuscript.

Funding

This research was funded by the first author’s research program at the University of Mohammed VI Polytechnic, Morocco.

Data Availability Statement

The ERA5 and CORDEX-CORE models’ output datasets were retrieved from https://cds.climate.copernicus.eu/datasets/reanalysis-era5-single-levels?tab=download and https://www.cordex.org/experiment-guidelines/cordex-core, respectively (accessed on 10 December 2024). The CRU and GPCC precipitation were obtained from https://crudata.uea.ac.uk/cru/data/hrg/cru_ts_4.09/cruts.2503051245.v4.09/ (accessed on 27 May 2026), and downloaded from https://opendata.dwd.de/climate_environment/GPCC/html/fulldata-monthly_v2022_doi_download.html (accessed on 27 May 2026), respectively. The Python 3.11 code used for the calculation and visualizations can be obtained upon request from the first author.

Acknowledgments

The authors gratefully acknowledge Redouane Lguensat and Juliette Mignot for their insightful and fruitful discussions. The authors also thank the CORDEX working groups for making the CORDEX-CORE experiment data available to researchers. The authors also acknowledge the financial support from OCP-UM6P. Some parts of the Introduction section were drafted with the assistance of ChatGPT (OpenAI, GPT-5-mini) to improve clarity and phrasing. AI was not used for the analyses or writing of the Conclusions section. Our gratitude goes to the anonymous reviewers for their thoughtful comments, which improve the quality of this work.

Conflicts of Interest

The authors declare no conflict of interest.

References

  1. Meehl, G.A.; Goddard, L.; Murphy, J.; Stouffer, R.J.; Boer, G.J.; Danabasoglu, G.; Dixon, K.; Giorgetta, M.A.; Greene, A.M.; Hawkins, E.; et al. Can It Be Skillful? Bull. Am. Meteorol. Soc. 2009, 90, 1467–1486. [Google Scholar] [CrossRef] [Scilit]
  2. Brasseur, G.P.; Gallardo, L. Climate Services: Lessons Learned and Future Prospects. Earth’s Future 2016, 4, 79–89. [Google Scholar] [CrossRef] [Scilit]
  3. Smith, D.M.; Eade, R.; Scaife, A.A.; Caron, L.P.; Danabasoglu, G.; DelSole, T.M.; Delworth, T.; Doblas-Reyes, F.J.; Dunstone, N.J.; Hermanson, L.; et al. Robust Skill of Decadal Climate Predictions. npj Clim. Atmos. Sci. 2019, 2, 13. [Google Scholar] [CrossRef] [Scilit]
  4. IPCC Climate Change 2021–The Physical Science Basis: Working Group I Contribution to the Sixth Assessment Report of the Intergovernmental Panel on Climate Change, 1st ed.; Cambridge University Press: Cambridge, UK, 2021; ISBN 978-1-009-15789-6.
  5. Cassou, C.; Kushnir, Y.; Hawkins, E.; Pirani, A.; Kucharski, F.; Kang, I.S.; Caltabiano, N. Decadal Climate Variability and Predictability: Challenges and Opportunities. Bull. Am. Meteorol. Soc. 2018, 99, 479–490. [Google Scholar] [CrossRef] [Scilit]
  6. Gouveia, C.M.; Trigo, R.M.; Beguería, S.; Vicente-Serrano, S.M. Drought Impacts on Vegetation Activity in the Mediterranean Region: An Assessment Using Remote Sensing Data and Multi-Scale Drought Indicators. Glob. Planet. Change 2017, 151, 15–27. [Google Scholar] [CrossRef] [Scilit]
  7. Fraga, H.; Moriondo, M.; Leolini, L.; Santos, J.A. Mediterranean Olive Orchards under Climate Change: A Review of Future Impacts and Adaptation Strategies. Agronomy 2020, 11, 56. [Google Scholar] [CrossRef] [Scilit]
  8. Lazoglou, G.; Papadopoulos-Zachos, A.; Georgiades, P.; Zittis, G.; Velikou, K.; Manios, E.M.; Anagnostopoulou, C. Identification of Climate Change Hotspots in the Mediterranean. Sci. Rep. 2024, 14, 29817. [Google Scholar] [CrossRef] [Scilit] [PubMed]
  9. Nicolì, D.; Gualdi, S.; Athanasiadis, P.J. Decadal Predictions Outperform Climate Projections in Forecasting Mediterranean Wintertime Precipitation. Environ. Res. Lett. 2025, 20, 5194. [Google Scholar] [CrossRef] [Scilit]
  10. Arjdal, K.; Driouech, F.; Balhane, S.; Manzanas, R. Compound Heatwaves in North Africa: Mechanisms and Model Capabilities. Earth Syst. Environ. 2026. [Google Scholar] [CrossRef] [Scilit]
  11. Ali, M.; Hong, P.-Y.; Mishra, H.; Vrouwenvelder, J.; Saikaly, P.E. Adopting the Circular Model: Opportunities and Challenges of Transforming Wastewater Treatment Plants into Resource Recovery Factories in Saudi Arabia. J. Water Reuse Desalin. 2022, 12, 346–365. [Google Scholar] [CrossRef] [Scilit]
  12. Arjdal, K.; Driouech, F.; Vignon, É.; Chéruy, F.; Manzanas, R.; Drobinski, P.; Chehbouni, A.; Idelkadi, A. Future of Land Surface Water Availability over the Mediterranean Basin and North Africa: Analysis and Synthesis from the CMIP6 Exercise. Atmos. Sci. Lett. 2023, 24, e1180. [Google Scholar] [CrossRef] [Scilit]
  13. Lamptey, B.; Sahabi Abed, S.; Gudoshava, M.; Mutemi, J.; Bopape, M.J.; Adefisan, E.A.; Igri, M.P.; Seidou Sanda, I.; Ndiaye, O.; Parker, D.J.; et al. Challenges and Ways Forward for Sustainable Weather and Climate Services in Africa. Nat. Commun. 2024, 15, 10–13. [Google Scholar] [CrossRef] [Scilit] [PubMed]
  14. Li, F.-F.; Lu, H.-L.; Wang, H.-R.; Sun, P.; Qiu, J. Atmospheric Water Resources and Their Exploitability in the Middle East. J. Hydrometeorol. 2025, 26, 273–291. [Google Scholar] [CrossRef] [Scilit]
  15. Li, J.; Guan, J.; Han, W.; Tian, R.; Lu, B.; Yu, D.; Zheng, J. Important Role of Precipitation in Controlling a More Uniform Spring Phenology in the Qinba Mountains, China. Front. Plant Sci. 2023, 14, 1074405. [Google Scholar] [CrossRef] [Scilit] [PubMed]
  16. Tsartsali, E.E.; Athanasiadis, P.J.; Materia, S.; Bellucci, A.; Nicolì, D.; Gualdi, S. Predicting Precipitation on the Decadal Timescale: A Prototype Climate Service for the Hydropower Sector. Clim. Serv. 2023, 32, 100422. [Google Scholar] [CrossRef] [Scilit]
  17. Brennan, J. The Rain’s Importance to Life on Earth. 2022. Available online: https://www.sciencing.com/rains-importance-life-earth-23021// (accessed on 25 November 2025).
  18. Ogou, F.K.; Yang, Q.; Duan, Y.; Ma, Z. Comparative Analysis of Interdecadal Precipitation Variability over Central North China and Sub Saharan Africa. Atmos. Ocean. Sci. Lett. 2019, 12, 201–207. [Google Scholar] [CrossRef] [Scilit]
  19. Mariotti, A. Decadal Climate Variability and Change in the Mediterranean Region. Sci. Technol. Infus. Clim. Bull. 2011. Available online: https://ftp.cpc.ncep.noaa.gov/CTB/2010-2011/Previous/AnnaritaMariotti_CTBSeminar_0506-2011.pdf (accessed on 16 June 2026).
  20. Mariotti, A.; Dell’Aquila, A. Decadal Climate Variability in the Mediterranean Region: Roles of Large-Scale Forcings and Regional Processes. Clim. Dyn. 2012, 38, 1129–1145. [Google Scholar] [CrossRef] [Scilit]
  21. Guemas, V.; García-Serrano, J.; Mariotti, A.; Doblas-Reyes, F.; Caron, L.P. Prospects for Decadal Climate Prediction in the Mediterranean Region. Q. J. R. Meteorol. Soc. 2015, 141, 580–597. [Google Scholar] [CrossRef] [Scilit]
  22. Mariotti, A.; Pan, Y.; Zeng, N.; Alessandri, A. Long-Term Climate Change in the Mediterranean Region in the Midst of Decadal Variability. Clim. Dyn. 2015, 44, 1437–1456. [Google Scholar] [CrossRef] [Scilit]
  23. Dell’Aquila, A.; Mariotti, A.; Bastin, S.; Calmanti, S.; Cavicchia, L.; Deque, M.; Djurdjevic, V.; Dominguez, M.; Gaertner, M.; Gualdi, S. Evaluation of Simulated Decadal Variations over the Euro-Mediterranean Region from ENSEMBLES to Med-CORDEX. Clim. Dyn. 2018, 51, 857–876. [Google Scholar] [CrossRef] [Scilit]
  24. Lüdecke, H.J.; Müller-Plath, G.; Wallace, M.G.; Lüning, S. Decadal and Multidecadal Natural Variability of African Rainfall. J. Hydrol. Reg. Stud. 2021, 34, 100795. [Google Scholar] [CrossRef] [Scilit]
  25. Nooni, I.K.; Ogou, F.K.; Saidou Chaibou, A.A.; Prempeh, N.A.; Atta-Darkwa, T.; Paing, K.H.; Fianko, S.K.; Jin, Z.; Yu, X. Links Between Teleconnection Patterns and Mean Precipitation in Africa and the Arabian Peninsula from 1903 to 2023. Int. J. Climatol. 2025, 45, e70001. [Google Scholar] [CrossRef] [Scilit]
  26. James, R.; Washington, R.; Abiodun, B.; Kay, G.; Mutemi, J.; Pokam, W.; Hart, N.; Artan, G.; Senior, C. Evaluating Climate Models with an African Lens. Bull. Am. Meteorol. Soc. 2018, 99, 313–336. [Google Scholar] [CrossRef] [Scilit]
  27. Arjdal, K.; Vignon, É.; Driouech, F.; Chéruy, F.; Er-Raki, S.; Sima, A.; Chehbouni, A.; Drobinski, P. Modeling Land–Atmosphere Interactions over Semiarid Plains in Morocco: In-Depth Assessment of GCM Stretched-Grid Simulations Using In Situ Data. J. Appl. Meteorol. Climatol. 2024, 63, 369–386. [Google Scholar] [CrossRef] [Scilit]
  28. Giorgi, F.; Coppola, E.; Jacob, D.; Teichmann, C.; Omar, S.A.; Ashfaq, M.; Ban, N.; Bülow, K.; Bukovsky, M.; Buntemeyer, L.; et al. The CORDEX-CORE EXP-I Initiative: Description and highlight results from the initial analysis. Bull. Am. Meteorol. Soc. 2022, 103, E293–E310. [Google Scholar] [CrossRef] [Scilit]
  29. Iturbide, M.; Gutiérrez, J.M.; Alves, L.M.; Bedia, J.; Cerezo-Mota, R.; Cimadevilla, E.; Cofiño, A.S.; Di Luca, A.; Faria, S.H.; Gorodetskaya, I.V.; et al. An Update of IPCC Climate Reference Regions for Subcontinental Analysis of Climate Model Data: Definition and Aggregated Datasets. Earth Syst. Sci. Data 2020, 12, 2959–2970. [Google Scholar] [CrossRef] [Scilit]
  30. Hersbach, H.; Bell, B.; Berrisford, P.; Hirahara, S.; Horányi, A.; Muñoz-Sabater, J.; Nicolas, J.; Peubey, C.; Radu, R.; Schepers, D.; et al. The ERA5 Global Reanalysis. Q. J. R. Meteorol. Soc. 2020, 146, 1999–2049. [Google Scholar] [CrossRef] [Scilit]
  31. Lavers, D.A.; Simmons, A.; Vamborg, F.; Rodwell, M.J. An Evaluation of ERA5 Precipitation for Climate Monitoring. Q. J. R. Meteorol. Soc. 2022, 148, 3152–3165. [Google Scholar] [CrossRef] [Scilit]
  32. Hersbach, H. ERA5 Atmospheric Reanalysis. Key Limitations 2023. Available online: https://climatedataguide.ucar.edu/climate-data/era5-atmospheric-reanalysis (accessed on 16 June 2026).
  33. Harris, I.; Jones, P.D.; Osborn, T.J.; Lister, D.H. Updated High-Resolution Grids of Monthly Climatic Observations-the CRU TS3.10 Dataset. Int. J. Climatol. 2014, 34, 623–642. [Google Scholar] [CrossRef] [Scilit]
  34. Schneider, U.; Becker, A.; Finger, P.; Meyer-Christoffer, A.; Ziese, M.; Rudolf, B. GPCC’s New Land Surface Precipitation Climatology Based on Quality-Controlled in Situ Data and Its Role in Quantifying the Global Water Cycle. Theor. Appl. Climatol. 2013, 115, 15–40. [Google Scholar] [CrossRef] [Scilit]
  35. Schulzweida, U. CDO User Guide. 2022. Available online: https://zenodo.org/records/7112925 (accessed on 16 June 2026).
  36. Diez-Sierra, J.; Iturbide, M.; Fernández, J.; Gutiérrez, J.M.; Milovac, J.; Cofiño, A.S. Consistency of the Regional Response to Global Warming Levels from CMIP5 and CORDEX Projections. Clim. Dyn. 2023, 61, 4047–4060. [Google Scholar] [CrossRef] [Scilit]
  37. Li, Y.; Li, J.; Feng, J. A Teleconnection between the Reduction of Rainfall in Southwest Western Australia and North China. J. Clim. 2012, 25, 8444–8461. [Google Scholar] [CrossRef] [Scilit]
  38. Li, J.; Sun, C.; Jin, F. NAO Implicated as a Predictor of Northern Hemisphere Mean Temperature Multidecadal Variability. Geophys. Res. Lett. 2013, 40, 5497–5502. [Google Scholar] [CrossRef] [Scilit]
  39. Armon, M.; De Vries, A.J.; Marra, F.; Peleg, N.; Wernli, H. Saharan Rainfall Climatology and Its Relationship with Surface Cyclones. Weather Clim. Extrem. 2024, 43, 100638. [Google Scholar] [CrossRef] [Scilit]
  40. Gnitou, G.T.; Tan, G.; Niu, R.; Nooni, I.K. Assessing Past Climate Biases and the Added Value of CORDEX-CORE Precipitation Simulations over Africa. Remote Sens. 2021, 13, 2058. [Google Scholar] [CrossRef] [Scilit]
  41. Gnitou, G.T.; Li, Q.; Tan, G.; Nooni, I.K. Distributional Added Value Analysis of Daily CORDEX-CORE RegCM4-7 Historical Precipitation Simulations over Africa. Atmos. Res. 2023, 291, 106818. [Google Scholar] [CrossRef] [Scilit]
  42. Mendez, M.; Maathuis, B.; Hein-Griggs, D.; Alvarado-Gamboa, L.-F. Performance Evaluation of Bias Correction Methods for Climate Change Monthly Precipitation Projections over Costa Rica. Water 2020, 12, 482. [Google Scholar] [CrossRef] [Scilit]
  43. Sun, C.; Liang, X.-Z. Understanding and Reducing Warm and Dry Summer Biases in the Central United States: Improving Cumulus Parameterization. J. Clim. 2023, 36, 2015–2034. [Google Scholar] [CrossRef] [Scilit]
  44. Cavicchia, L.; Scoccimarro, E.; Gualdi, S.; Marson, P.; Ahrens, B.; Berthou, S.; Conte, D.; Dell’Aquila, A.; Drobinski, P.; Djurdjevic, V.; et al. Mediterranean Extreme Precipitation: A Multi-Model Assessment. Clim. Dyn. 2018, 51, 901–913. [Google Scholar] [CrossRef] [Scilit]
  45. Paxian, A.; Hertig, E.; Seubert, S.; Vogt, G.; Jacobeit, J.; Paeth, H. Present-Day and Future Mediterranean Precipitation Extremes Assessed by Different Statistical Approaches. Clim. Dyn. 2015, 44, 845–860. [Google Scholar] [CrossRef] [Scilit]
  46. Dosio, A.; Jury, M.W.; Almazroui, M.; Ashfaq, M.; Diallo, I.; Engelbrecht, F.A.; Klutse, N.A.B.; Lennard, C.; Pinto, I.; Sylla, M.B.; et al. Projected Future Daily Characteristics of African Precipitation Based on Global (CMIP5, CMIP6) and Regional (CORDEX, CORDEX-CORE) Climate Models. Clim. Dyn. 2021, 57, 3135–3158. [Google Scholar] [CrossRef] [Scilit]
  47. Fernández-Montes, S.; Rodrigo, F. Trends in Surface Air Temperatures, Precipitation and Combined Indices in the Southeastern Iberian Peninsula (1970–2007). Clim. Res. 2015, 63, 43–60. [Google Scholar] [CrossRef] [Scilit]
  48. González-Hidalgo, J.C.; Vicente-Serrano, S.M. Is There a Precipitation Decline in the Mediterranean Region? An Assessment Based on the Scientific Literatured. Int. J. Climatol. 2025, 45, e8918. [Google Scholar] [CrossRef] [Scilit]
  49. Shi, X.; Durran, D.R. The Response of Orographic Precipitation over Idealized Midlatitude Mountains Due to Global Increases in CO2. J. Clim. 2014, 27, 3938–3956. [Google Scholar] [CrossRef] [Scilit]
  50. Pepin, N.C.; Arnone, E.; Gobiet, A.; Haslinger, K.; Kotlarski, S.; Notarnicola, C.; Palazzi, E.; Seibert, P.; Serafin, S.; Schöner, W.; et al. Climate Changes and Their Elevational Patterns in the Mountains of the World. Rev. Geophys. 2022, 60, e2020RG000730. [Google Scholar] [CrossRef] [Scilit]
  51. Yavaşlı, D.D. Spatio-Temporal Trends in Precipitation Indices Over Mediterranean Using ERA5 -Land Data (1950–2024). Intl J. Climatol. 2025, 45, e70049. [Google Scholar] [CrossRef] [Scilit]
  52. Zhu, Y.; Yang, S. Interdecadal and Interannual Evolution Characteristics of the Global Surface Precipitation Anomaly Shown by CMIP5 and CMIP6 Models. Int. J. Climatol. 2021, 41, E1100–E1118. [Google Scholar] [CrossRef] [Scilit]
  53. Zhang, B.; Song, S.; Wang, H.; Guo, T.; Ding, Y. Evaluation of the Performance of CMIP6 Models in Simulating Extreme Precipitation and Its Projected Changes in Global Climate Regions. Nat. Hazards 2025, 121, 1737–1763. [Google Scholar] [CrossRef] [Scilit]
  54. Nikulin, G.; Jones, C.; Giorgi, F.; Asrar, G.; Büchner, M.; Cerezo-Mota, R.; Christensen, O.B.; Déqué, M.; Fernandez, J.; Hänsler, A.; et al. Precipitation Climatology in an Ensemble of CORDEX-Africa Regional Climate Simulations. J. Clim. 2012, 25, 6057–6078. [Google Scholar] [CrossRef] [Scilit]
  55. Chen, J. Arithmetic Mean: Definition, Limitations, and Alternatives. In Limitations of the Arithmetic Mean; Temple University, Parsons School of Design: Baldwin, NY, USA, 2025; Available online: https://www.investopedia.com/terms/a/arithmeticmean.asp (accessed on 16 June 2026).
  56. Endris, H.S.; Omondi, P.; Jain, S.; Lennard, C.; Hewitson, B.; Chang’a, L.; Awange, J.L.; Dosio, A.; Ketiem, P.; Nikulin, G.; et al. Assessment of the Performance of CORDEX Regional Climate Models in Simulating East African Rainfall. J. Clim. 2013, 26, 8453–8475. [Google Scholar] [CrossRef] [Scilit]
  57. Safari, B.; Sebaziga, J.N.; Siebert, A. Evaluation of CORDEX-CORE Regional Climate Models in Simulating Rainfall Variability in Rwanda. Int. J. Climatol. 2023, 43, 1112–1140. [Google Scholar] [CrossRef] [Scilit]
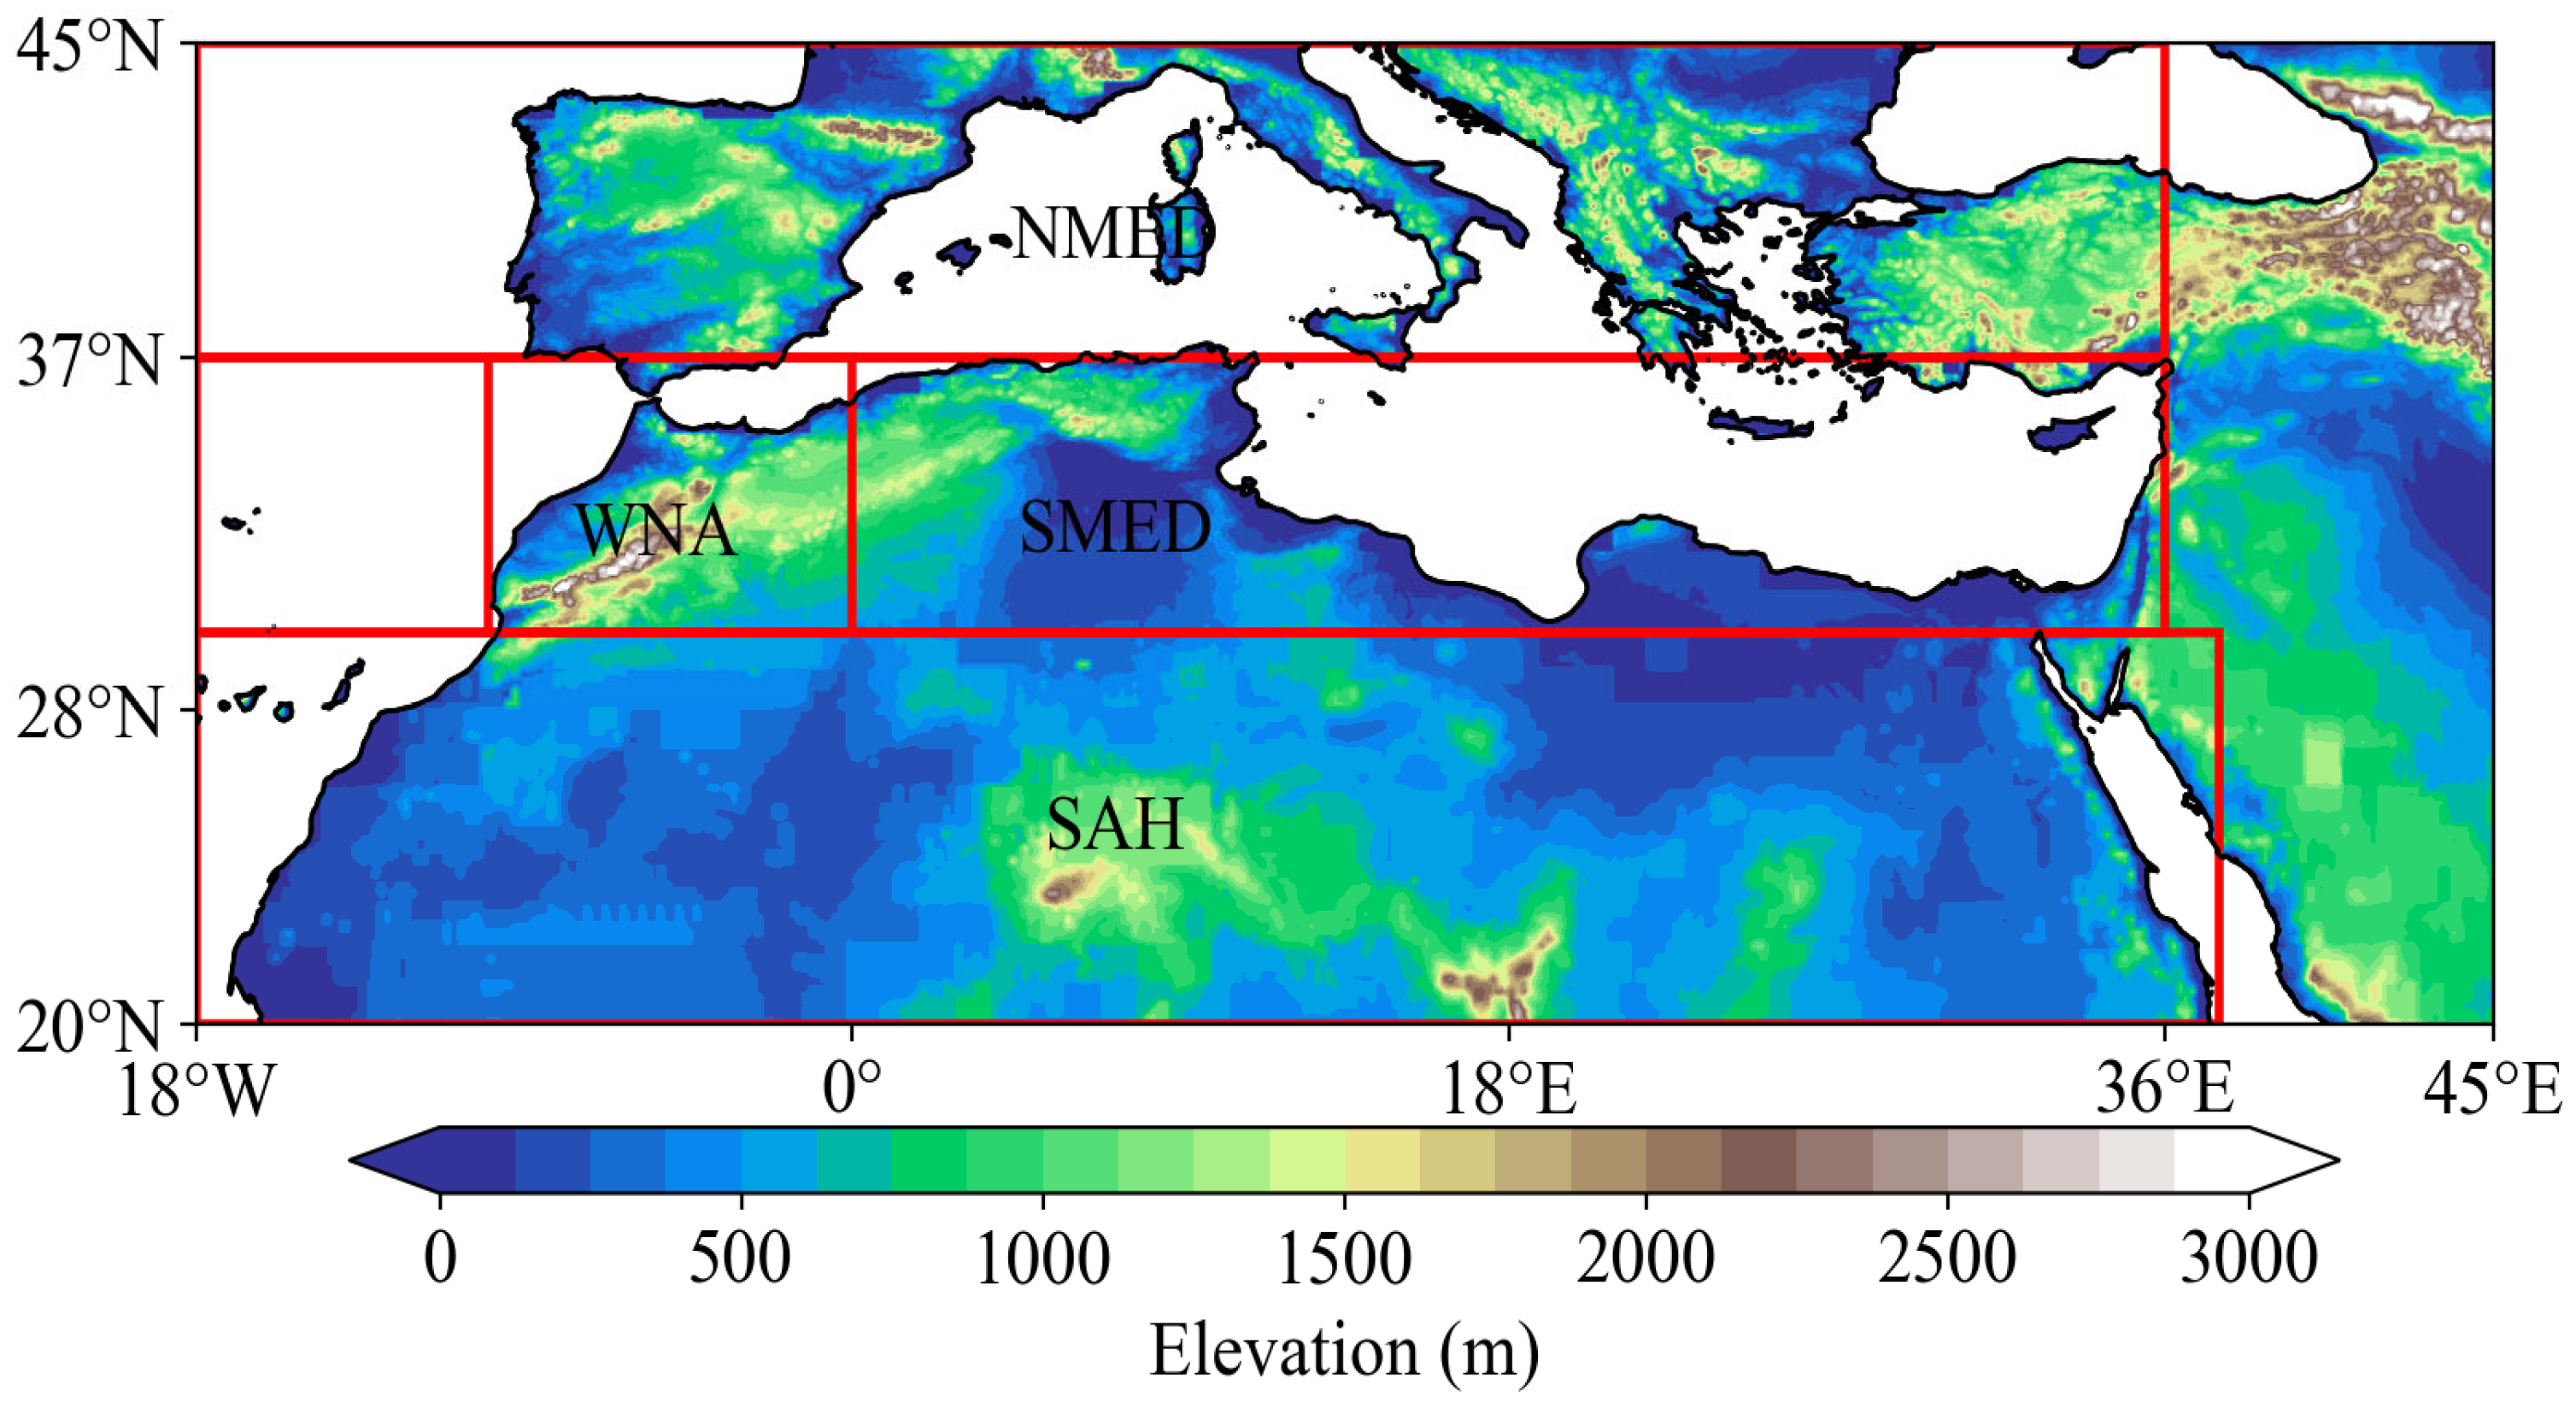
Figure 1. Overview of the study area (MNA) showing topography (elevation in m) and the defined sub-regions (in red boxes).
Climate 14 00172 g001
Figure 2. Comparison of the area-averaged precipitation over (a) MNA, (b) WNA, (c) SAH, (d) SMED, and (e) NMED from ERA5, CRU, and GPCC for the period of 1970–2005.
Climate 14 00172 g002
Figure 3. Annual cycle of precipitation simulated by the multi-model mean and the nine climate models (colored lines) compared to that of ERA5 (black line) for (a) the MNA region, (b) WNA, (c) SAH, (d) SMED, and (e) NMED, averaged over the period of 1970−2005.
Climate 14 00172 g003
Figure 4. Spatial distribution of decadal precipitation biases (individual models and multi-model mean minus ERA5) over the period 1970–2005. The black boxes indicate the sub-regions.
Climate 14 00172 g004
Figure 5. Boxplot of annual decadal precipitation for (a) the MNA region, (b) WNA, (c) SAH, (d) SMED, and (e) NMED. The median is shown in yellow, the green dashed line represents the mean, and the upper and lower limits of the box represent the first (25%) and third (75%) quartiles. The white circles represent the outliers in the datasets.
Climate 14 00172 g005
Figure 6. Spatial distribution of Mann–Kendall trends (×10−1) in decadal precipitation during the period of 1970–2005. Shaded areas represent the slope rate, and black dots indicate significance at the 5% level. The red boxes represent the studied sub-regions.
Climate 14 00172 g006
Figure 7. Taylor diagram comparing ERA5 with CORDEX-CORE models for (a) the MNA, (b) WNA, (c) SAH, (d) SMED, and (e) NMED regions for the period of 1970–2005.
Climate 14 00172 g007
Table 1. Data used in the study.
Driving ModelRCMs (0.22° × 0.22°)Available Period
MOHC-HadGEM2-ESCCLM5-0-151970–2005
RegCM4_v71970–2005
REMO20151970–2005
MPI-M-MPI-ESM-LRCCLM5-0-151970–2005
RegCM4_v71970–2005
REMO20151970–2005
NCC-NorESM1-MCCLM5-0-151970–2005
RegCM4_v71970–2005
REMO20151970–2005
Table 2. Biases (mm day−1) of RCMs and GCMs relative to ERA5 over the MNA for the period of 1970–2005.
ANNDJFMAMJJASON
GCMsHad0.06−0.140.050.080.22
MPI0.110.020.120.100.15
Nor−0.01−0.020.110.11−0.11
RCMsCCLM0.10−0.050.160.170.16
RegCM0.21−0.030.230.250.34
REMO0.110.030.170.100.08
Disclaimer/Publisher’s Note: The statements, opinions and data contained in all publications are solely those of the individual author(s) and contributor(s) and not of MDPI and/or the editor(s). MDPI and/or the editor(s) disclaim responsibility for any injury to people or property resulting from any ideas, methods, instructions or products referred to in the content.