
Article

Climate-Related Vulnerability in Healthcare Facilities: Development and Field Application of a Facility-Level Assessment Tool in Selangor, Malaysia

by
Nurul Amalina Khairul Hasni
1,*,
Nadia Mohamad
1,
Raheel Nazakat
1,
Imanul Hassan Abdul Shukor
2,
Sharifah Mazrah Sayed Mohamed Zain
1,
Siti Aishah Rashid
1,
Noraishah Mohammad Sham
1,
Nik Muhammad Nizam Nik Hassan
1,
Mohamad Iqbal Mazeli
1,
Mohd Redzuan Zainudin
1,
Thahirahtul Asma’ Zakaria
3 and
Rohaida Ismail
1
1
Environmental Health Research Centre, Institute for Medical Research, National Institutes of Health, Ministry of Health Malaysia, Shah Alam 40170, Malaysia
2
Institute for Health Management, National Institutes of Health, Ministry of Health Malaysia, Shah Alam 40170, Malaysia
3
Environmental Health and Climate Change Sector, Disease Control Division, Ministry of Health Malaysia, Putrajaya 62590, Malaysia
*
Author to whom correspondence should be addressed.
Climate 2026, 14(8), 155; https://doi.org/10.3390/cli14080155
Submission received: 29 April 2026 / Revised: 11 June 2026 / Accepted: 30 June 2026 / Published: 28 July 2026

Abstract

Climate-related hazards are occurring with increasing frequency, resulting in notable disruptions to healthcare systems. In Malaysia, healthcare facilities are particularly impacted by flooding and heatwaves, which can occur annually across some regions. Despite these recurrent challenges, there remains limited availability of a standardized tool to systematically assess healthcare facility (HCF) vulnerability to climate hazards. This study aimed to develop, validate and conduct a field testing of the Vulnerability Index Tool for Assessing Levels of Climate Resilience in Healthcare Facilities (VITAL-HCF) for facility-level assessment in Malaysia. The VITAL-HCF was developed through extensive literature review, experts consultations, and adaptation of the World Health Organization (WHO) healthcare facility vulnerability checklist. The tool underwent forward and backward translation to ensure linguistic and contextual equivalence, followed by content and face validation by subject-matter experts in climate and healthcare professionals. Subsequently, field testing was performed in three government healthcare facilities to assess the clarity, applicability, and feasibility of administration to ensure accurate responses representing facility-level capacity and vulnerability. The healthcare facility vulnerability index (HCFVI) for heatwaves and flooding was then calculated for each facility. Revised Scale-Level Content Validity Indices (S-CVI/Ave) varied across the exposure, sensitivity and adaptive capacity domains (0.93–1.00). Items with a content validity index < 0.83 were either removed or revised and reorganized to improve relevance. Face validation showed good clarity with S-FVI/Ave ≥ 0.87. The final tool comprised 12 exposure, 11 sensitivity, and 181 adaptive capacity indicators. Field testing showed that a facilitated, multidisciplinary group approach among key respondents was feasible and timely. Facility A, located in an urban setting, had high vulnerability for hot weather and heatwaves (HCFVI = 0.51), while facilities B and C recorded moderate vulnerability. Both Facilities A and B recorded moderate vulnerability for floods, while Facility C, a hospital in an urban setting, had low vulnerability (HCFVI = 0.23). The VITAL-HCF demonstrated satisfactory content validity, face validity, and feasibility for assessing climate-related vulnerability in HCFs. The tool incorporates key vulnerability components of exposure, sensitivity, and adaptive capacity, providing a structured approach for the systematic assessment of climate-related vulnerability in healthcare facilities to support targeted preparedness and resilience planning.

1. Introduction

Climate change poses a critical threat to global health systems, affecting healthcare infrastructure, service delivery and functional capacity. As key emergency infrastructure, healthcare facilities (HCFs) face growing risks from climate hazards including floods, cyclones, storms, drought, and heatwaves [1,2,3]. Major flood events can compromise continuity of care by disrupting essential services and damaging critical infrastructure, thereby reducing system functionality during periods of peak demand [4]. Similarly, heatwaves amplify system-level pressures by increasing patient load, straining workforce capacity, and challenging healthcare operations [5,6]. Despite these challenges, these facilities are expected to remain operational and provide medical services to the surrounding community.
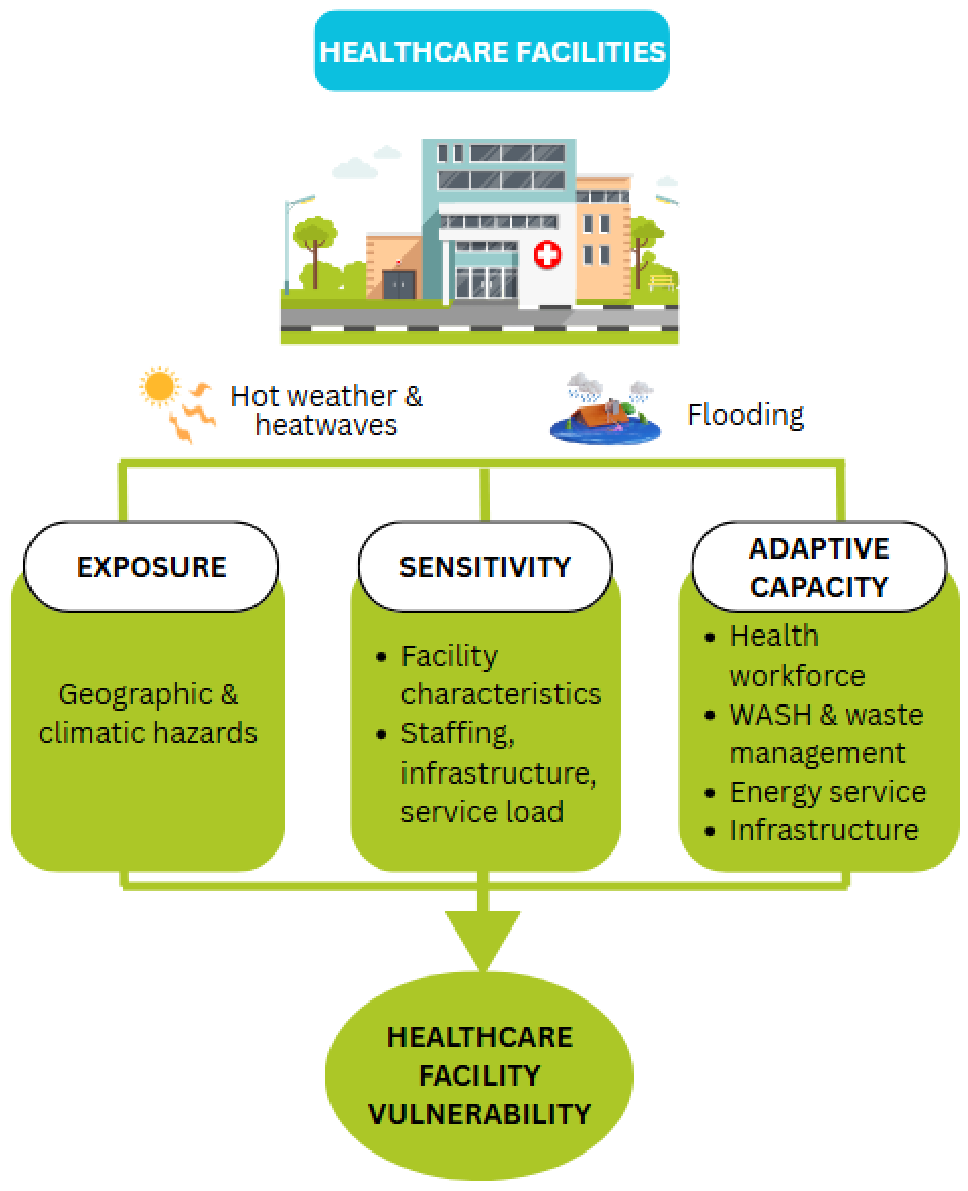
Given the increasing frequency and impact of these climate hazards, there is a need for a structured approach to assess the vulnerability of healthcare facilities and their capacity to respond. In this context, climate vulnerability provides a useful framework, defined as a function of exposure, sensitivity, and adaptive capacity [7,8]. The vulnerability of healthcare facilities reflects their level of susceptibility and ability to cope with the adverse effects of climate change, emphasizing that risk arises not only from hazard occurrence but also from intrinsic system characteristics and response capacity [7,8]. Exposure describes the extent to which a system is subjected to climate hazards, considering both the spatial location and temporal occurrence of hazard events [8,9]. Sensitivity refers to the degree to which systems are affected when exposed to climate hazards, influenced by inherent characteristics that determine their capacity to withstand or absorb impacts [8,9]. Lastly, adaptive capacity is defined as the ability to adjust to potential harm, maintain functionality, and respond effectively to climate-related impacts [2,10]. At the facility level, adaptive capacity is shaped by broader contextual factors such as governance, resources, and regulatory support [11,12].
Understanding vulnerability provides insight into healthcare facilities’ resilience when faced with climate-related hazards [13]. However, climate vulnerability remains an underexplored area in the research literature. Several studies have reported moderate to high levels of vulnerability, with common challenges observed in infrastructure, health workforce capacity, and essential operational systems, including water supply, waste management and energy systems [12,14,15]. The facilities’ vulnerabilities have often been exacerbated by limited adaptive capacity, including insufficient preparedness measures, resource constraints, and gaps in maintenance and contingency planning.
In Malaysia, climate hazards are an ongoing and recurrent public health crisis. Previous major flood events inflicted damages and devastations to thousands of households and communities across Peninsular and East Malaysia [16,17]. The 2021 flood alone affected eight states, causing disruptions to 138 Ministry of Health (MOH) healthcare facilities’ operations [18]. Concurrently, heatwave events in Malaysia have become more frequent and intense, with level two heatwave events recorded in multiple locations nationwide, and maximum temperatures approaching 40 °C in some areas [19,20,21]. These rising temperatures have been associated with rising heat-related illnesses and cardio-respiratory morbidity and mortality [22,23].
Despite the increasing recognition of climate-related risks to health systems, there remains limited availability of locally adapted and validated instruments for assessing climate vulnerability in Malaysian HCFs. Several frameworks and assessment tools have been developed to support healthcare facilities in evaluating climate-related vulnerability, resilience and their vulnerability to climate hazards and preparedness, including the World Health Organization (WHO) Checklist to Assess Vulnerabilities in Health Care Facilities in the Context of Climate Change, WHO Guidance for Climate Resilient and Environmentally Sustainable Health Care Facilities, the Hospital Safety Index (HSI), and the Water and Sanitation for Health Facility Improvement Tool (WASH FIT) [13,24,25,26]. These tools provide valuable guidance for identifying vulnerabilities, preparedness gaps, and resilience-building priorities within healthcare facilities. However, existing approaches are largely based on checklist-driven assessments and may have limited capacity to generate standardized quantitative vulnerability indices that enable comparison across facilities and geographical settings [27,28,29].
In addition, many frameworks do not integrate objective exposure indicators derived from climate, environmental, and spatial datasets within a single assessment framework encompassing exposure, sensitivity, and adaptive capacity. These global tools have not been formally adapted or validated for the Malaysian healthcare context [29]. The need for local adaptation has been highlighted in other Southeast Asian countries, including Indonesia, Vietnam, India, Pakistan, and Bangladesh, where context-specific modifications were necessary to better reflect local climate patterns and healthcare systems [30,31,32,33,34]. To address these gaps, this study aimed to develop and validate a healthcare facility climate vulnerability assessment tool that integrates exposure, sensitivity and adaptive capacity domains and to evaluate its application in selected healthcare facilities in Malaysia.

2. Materials and Methods

This study was conducted between October 2024 and March 2025 in three phases: tool development, validity assessment, and field testing. The overall methodological workflow is illustrated in Figure 1.

2.1. Phase 1: Tool Development and Adaptation

The VITAL-HCF was developed based on the vulnerability framework as illustrated in Figure 2. Indicators within the three domains of exposure, sensitivity, and adaptive capacity were developed based on experts’ input, peer-reviewed literature and published WHO documents [24].

2.1.1. Exposure Domain

Exposure indicators integrate spatial data such as distance from a potential hazard, historical climate events, hydroclimate projections, and other hydroclimate variables including average precipitation, average temperature, and relative humidity. Exposure data were obtained from district and state health offices, the Malaysian Meteorological Department, online satellite-based datasets, and hydroclimate projections from the National Hydraulic Research Institute of Malaysia (NAHRIM). The selected indicators were primarily objective information derived from measurable environmental data, thereby minimizing subjectivity in the assessment. This climate information was included as part of the exposure indicators for calculation of the vulnerability index score.

2.1.2. Sensitivity Domain

Indicators in this domain aimed to assess aspects related to service complexity, patient load, human resources, and infrastructure attributes that may influence vulnerability. Similar to the other domains, these indicators were incorporated as sensitivity indicators and contributed to the calculation of the vulnerability index.

2.1.3. Adaptive Capacity Domain

The adaptive capacity domain captures the preparedness and adaptive measures implemented by the facility. The indicators in this domain were adapted from the WHO’s Checklist to Assess Vulnerabilities in Health Care Facilities in the Context of Climate [24], which is licensed under the Creative Commons Attribution-NonCommercial-ShareAlike 3.0 IGO license (CC BY-NC-SA 3.0 IGO). Adaptation involved reviewing and contextualizing items according to the Malaysian healthcare setting, additional refinement for clarity, reassignment across domains, and removal of redundant or less relevant items. The domain included hazard-specific components for heatwaves and floods and was structured around four fundamental components that underpin healthcare system resilience, namely, (i) health workforce, (ii) water, sanitation, and hygiene (WASH) and waste management, (iii) energy services, and (iv) infrastructure. The indicators assessed a facility’s preparedness measures including capacity development, monitoring and assessment, response protocols and regulations, and facility-level adaptations.

2.1.4. Translation Process

All survey items were translated from English into Malay following a standard forward–backward translation procedure to ensure linguistic and conceptual equivalence. Two independent bilingual translators with public health and clinical backgrounds conducted forward translations and harmonized through consensus discussion. The translated version was back-translated into English and reviewed by the research team and subject-matter experts to identify discrepancies and ensure the intended meanings of the original questions were retained.

2.2. Phase 2: Vulnerability Assessment Tool Validation

Following translation, the tool underwent content validation to assess relevance and conceptual alignments of the items, followed by face validation to evaluate clarity and comprehensibility.

2.2.1. Content Validation

A total of six climate and public health experts with more than 10 years of relevant experience in environmental health, healthcare systems, or climate-related assessments were selected to participate in the content validation to assess the relevance of the items. All experts had prior working experience at District Health Offices and were familiar with public health operations at the district and facility levels. In addition, the panel also included experts with experience in climate change and climate-related assessment, enabling an indicative evaluation of the relevance, appropriateness, and contextual applicability of the questionnaire items for the intended target population. Each expert rated the item’s relevance on a 4-point scale (1 = not relevant to 4 = highly relevant) [35]. The Item-level Content Validity Index (I-CVI) and S-CVI/Ave were calculated. Items with an I-CVI < 0.83 or S-CVI/Ave < 0.9 were revised or removed based on recommendations for content validation involving six or more experts [35,36].
I C V I = N u m b e r   o f   e x p e r t s   r a t i n g   t h e   i t e m   a s   r e l e v a n t T o t a l   n u m b e r   o f   e x p e r t s
S C V I / A v e = Σ I C V I s c o r e s T o t a l   n u m b e r   o f   i t e m s

2.2.2. Face Validation

Subsequently, a total of ten healthcare staff from the District Health Office, clinical management, and engineering department were recruited for face validation. Participants were selected to reflect the intended end users for the VITAL-HCF tool during the field implementation. Each item is rated for clarity and comprehension on a 4-point scale (1 = not clear to 4 = very clear) to assess their understanding during questionnaire completion. Feedback was gathered on the wording, construct, and suggestions from the respondents. The clarity and comprehension rating was recorded as 0 (scale 1 or 2) or 1 (scale 3 or 4). The Item-level Face Validity Index (I-FVI) and Scale-level FVI/Average (S-FVI/Ave) were calculated. An I-FVI value of at least 0.83 was deemed acceptable for tests involving at least 10 respondents [37,38].
I F V I = N u m b e r   o f   r e s p o n d e n t s   r a t i n g   t h e   i t e m   a s   c l e a r T o t a l   n u m b e r   o f   r e s p o n d e n t s
S F V I / A v e = Σ I F V I   s c o r e s T o t a l   n u m b e r   o f   i t e m s

2.3. Phase 3: Field Testing of Vulnerability Assessment Tool

Field testing of the tool was conducted to evaluate the items’ comprehensibility, relevancy, and practicality for local healthcare facilities settings.

2.3.1. Study Locations

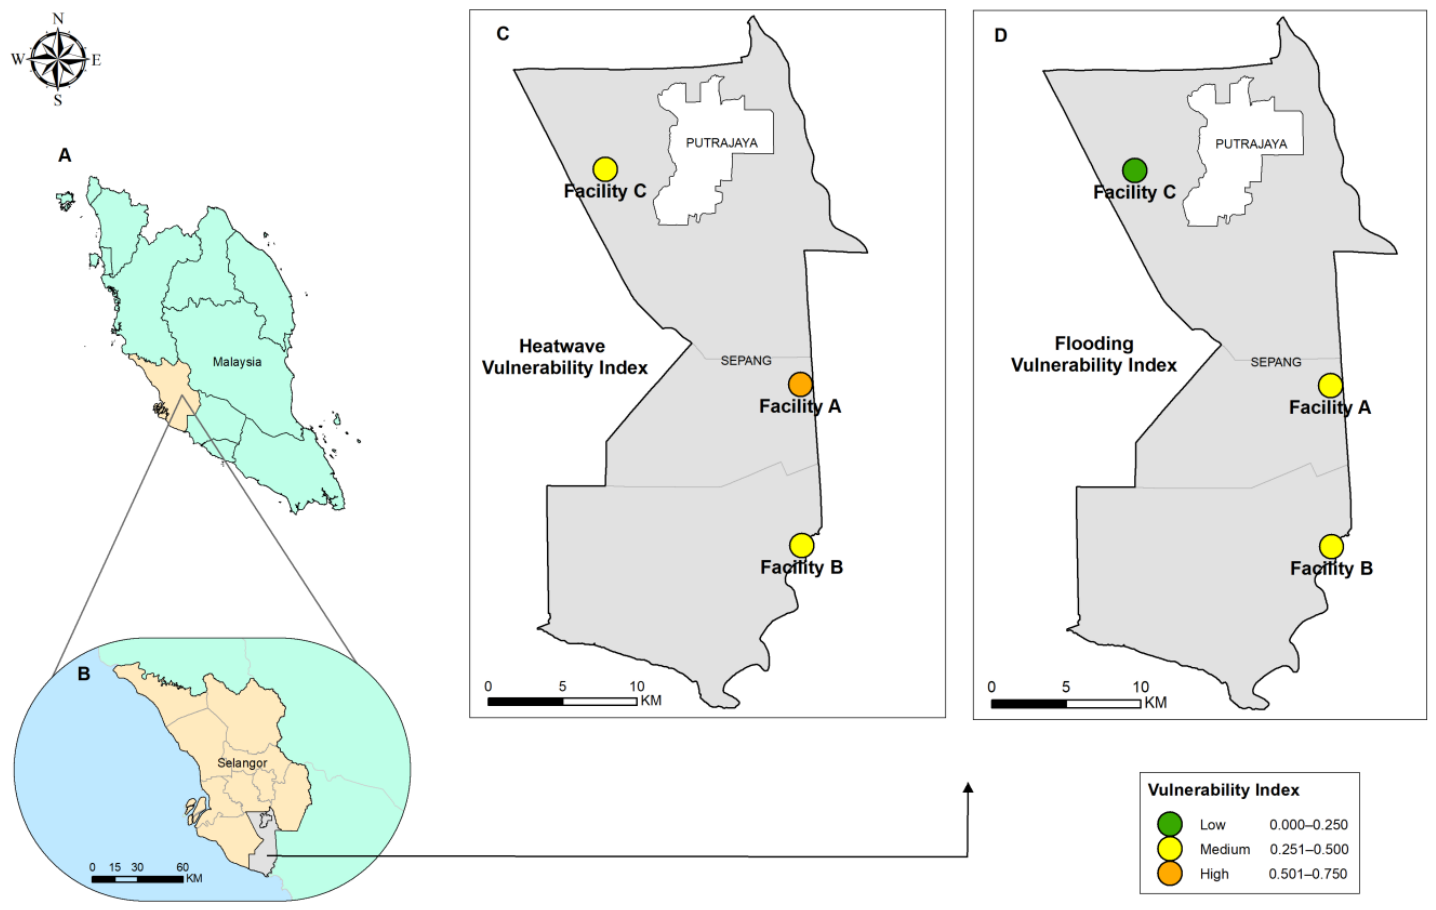
The field testing was conducted in three public healthcare facilities in the Sepang district of Selangor, within the central region of Peninsular Malaysia. The district covers an approximately 600 km2 area and has an estimated population of 384,244 [39]. Sepang was selected due to its documented exposure to climate hazards, including previous level 1 heatwave alerts (35–37 °C for at least three consecutive days) and flooding history. Two government health clinics (Facility A and Facility B) and one hospital (Facility C) were included in this field testing, which represent the different settings of public healthcare facilities in Malaysia. This includes (1) general hospitals, (2) clinics covering high population densities, (3) clinics covering low population densities. This field testing was intended as a preliminary assessment of the feasibility and applicability of the tool, and further evaluation using a larger sample of healthcare facilities is warranted.
Facility A was an urban health clinic with three in-house Family Medicine Specialists, serving a population of over 90,000. Meanwhile, Facility B was a smaller, non-specialist health clinic situated in the rural area, covering a population of approximately 6000. Facility C was a public hospital serving a population of approximately 140,000.

2.3.2. Healthcare Facility Representatives

A total of 17 healthcare workers including clinical staff (n = 7), engineers and assistant engineers (n = 4), administrative officers (n = 2), occupational and environmental health officers (n = 3), and quality unit officers (n = 1) were involved in the field testing. Participants were purposively selected from facility-level personnel based on their roles and responsibilities related to the domains assessed, ensuring representation across clinical, technical, administrative, and environmental health aspects.

2.3.3. Mode of Administration

The tool was administered through facilitated, in-person group discussions. Each item was discussed collectively among facility representatives, and responses were agreed upon by consensus. This approach was used because the unit of assessment was the healthcare facility, allowing input from personnel across different functional areas to ensure a comprehensive and accurate representation of facility-level conditions.

2.4. Data Analysis

Vulnerability Assessment

Exposure and sensitivity indicators were scored based on categorical scoring or normalization of continuous variables. For adaptive capacity, indicators were scored using three standardized response categories reflecting preparedness levels: (i) prepared and able to respond, (ii) partially prepared, and (iii) unprepared (Table S1). All item responses were subsequently standardized to a 0–1 scale. Higher scores for exposure and sensitivity reflected greater vulnerability, while higher adaptive capacity scores indicated lower vulnerability.
Normalization was applied to selected continuous indicators within the exposure and sensitivity domains to enable standardized scoring and comparability across variables with different units and ranges for the calculation of the HCFVI. Exposure indicators subjected to normalization included average relative humidity, rainfall, and temperature, while sensitivity indicators included population coverage, number of doctors per capita, number of specialists per capita, and average daily patient attendance. Min–max normalization was applied using the following equation:
x = x   x ( m i n i m u m )   x   m a x i m u m   x   ( m i n i m u m )
For categorical variables, the scoring used to derive the 0–1 scale was assigned based on vulnerability classifications and category thresholds adapted from the previous literature and relevant references. All item responses were subsequently standardized to a 0–1 scale prior to index calculation. The index calculation for the exposure and sensitivity domains was performed using the following formula:
E x p o s u r e   I n d e x   ( E i ) = i = 1 n E i / n
S e n s i t i v i t y   I n d e x   ( S i ) = i = 1 n S i / n
Individual subdomains of adaptive capacity were calculated using these formulae:
H e a l t h   w o r k f o r c e   i n d e x   ( H W i ) = i = 1 n H W i / n
W A S H   i n d e x   ( W A S H i ) = i = 1 n W A S H i / n
E n e r g y   s e r v i c e s   i n d e x   ( E S i ) = i = 1 n E i / n
I n f r a s t r u c t u r e   i n d e x   ( I N F i ) = i = 1 n I N F i / n
Subsequently, the total adaptive capacity index for each HCF was calculated using the following formula:
A d a p t i v e   c a p a c i t y   i n d i c e s   ( A C i ) = H W i + W A S H i + E S i + I N F i 4
A composite HCFVI was then calculated by assigning equal weights to the three core vulnerability domains, exposure (E), sensitivity (S), and adaptive capacity (AC), where higher index scores indicate greater vulnerability. The index was classified into four vulnerability categories: low (0.000–0.250), moderate (0.251–0.500), high (0.501–0.750), and very high (0.751–1.000). These categories were derived using equal interval classification of the standardized index scores to facilitate interpretation and comparison across healthcare facilities [40].
H C F V I = E + S + ( 1 A C ) 3
The HCFVI was developed based on the Intergovernmental Panel on Climate Change (IPCC) vulnerability framework, in which exposure, sensitivity, and adaptive capacity are conceptualized as fundamental and interrelated dimensions contributing to overall vulnerability [7,8,41]. Since there is no established empirical evidence or validated weighting approach specific to healthcare facility climate vulnerability assessment, equal weighting was adopted as a transparent and pragmatic approach. This approach is consistent with previous vulnerability index studies, where equal weighting is commonly applied to minimize subjectivity and ensure transparency as well as interpretability of the composite index [40,42].
The analysis was conducted at the facility level (n = 3). Descriptive statistics were used to summarize the domain scores and overall vulnerability indices. A vulnerability map was developed using ArcGIS version 10.3 (Geographic Information System) based on facility-level vulnerability scores to visualize spatial patterns of exposure, sensitivity, and adaptive capacity.

2.5. Ethical Considerations

Ethical approval for this study was obtained from the Medical Research and Ethics Committee (MREC), Ministry of Health Malaysia (24-01826-ZRO). Written informed consent was obtained from respondents before data collection.

3. Results

A total of 13 exposure indicators and 16 sensitivity indicators were initially developed based on the relevant literature, while 235 adaptive capacity indicators adapted from WHO documents were included in the initial version of the questionnaire. The large number of adaptive capacity indicators reflects coverage across multiple preparedness domains and two climate hazard categories. These indicators subsequently underwent content and face validation, with refinements made to address redundancy and contextual relevance.

3.1. Validation Results

3.1.1. Content Validation Results

The exposure domain demonstrated consistently high item relevance, with I-CVI and S-CVI values of 1.00 (Table 1). The sensitivity domain showed greater variability, with I-CVI values ranging from 0.43 to 1.00 and an S-CVI/Ave of 0.83, which increased to 0.95 after item removal. Within the adaptive capacity domain, variability in item relevance was more pronounced. Both hot weather and heatwave- and flood-related indicators had I-CVI values ranging from 0.16 to 1.00, with an overall S-CVI/Ave of 0.71 and 0.84, respectively. Items with I-CVI values below the predefined threshold (<0.83) were reviewed by the research team. Items deemed redundant or contextually irrelevant were removed, while essential items were revised to improve clarity. Following this process, 54 items were removed from adaptive capacity domains. Several items were reassigned across components (health workforce, WASH and waste management, energy service, and infrastructure) to improve conceptual alignment with the underlying vulnerability framework. Following the refinement, the final S-CVI/Ave for the adaptive capacity domain was 0.93.

3.1.2. Face Validation Results

Across all domains, I-FVI values ranged from 0.80 to 1.00, with an S-FVI/Ave of 0.87–0.99, indicating strong agreement on item clarity. Minor wording revisions were made in response to reviewers’ feedback to improve clarity and comprehension.

3.2. Final Instrument Indicators for VITAL-HCF

The final tool consisted of 12 exposure indicators, 11 sensitivity indicators, and 181 adaptive capacity indicators (60 for hot weather and heatwave and 121 for flood), as summarized in Table 2. One item (geographical area) was removed from the exposure domain following content validation. Within the sensitivity domain, five structural indicators, (i) facility-built area, (ii) total number of staff, (iii) number of departments, (iv) number of units, and (v) type of clinic, were removed due to conceptual overlap and limited contribution to vulnerability differentiation. For the adaptive capacity domain, 36 items were revised for contextual clarity, and 54 were removed due to redundancy or lack of applicability to the local healthcare setting (Table S2).

3.3. Field-Testing Outcomes

3.3.1. Healthcare Facility Characteristics

Table 3 summarizes the characteristics of the three healthcare facilities, which differ in their geographical settings, facility type, and population coverage. Facilities A and C are urban facilities with higher patient loads and service capacity, while Facility B is a smaller rural clinic with lower patient volume and prior flooding exposure. All facilities reported frequent hot weather and heatwave events in the past five years.

3.3.2. Practical Feasibility of Instrument

Based on the field testing, participation from multidisciplinary personnel facilitated discussion and completion of the assessment in a timely manner. Despite the large number of indicators, respondents contributed to sections relevant to their expertise and areas of responsibility. Additionally, the structured format of the questionnaire, together with detailed definitions and guidance for response options, facilitated completion of the assessment. The field-testing exercise demonstrated that administration of the instrument was both feasible and acceptable in the participating healthcare facilities.

3.3.3. Climate Vulnerability Results

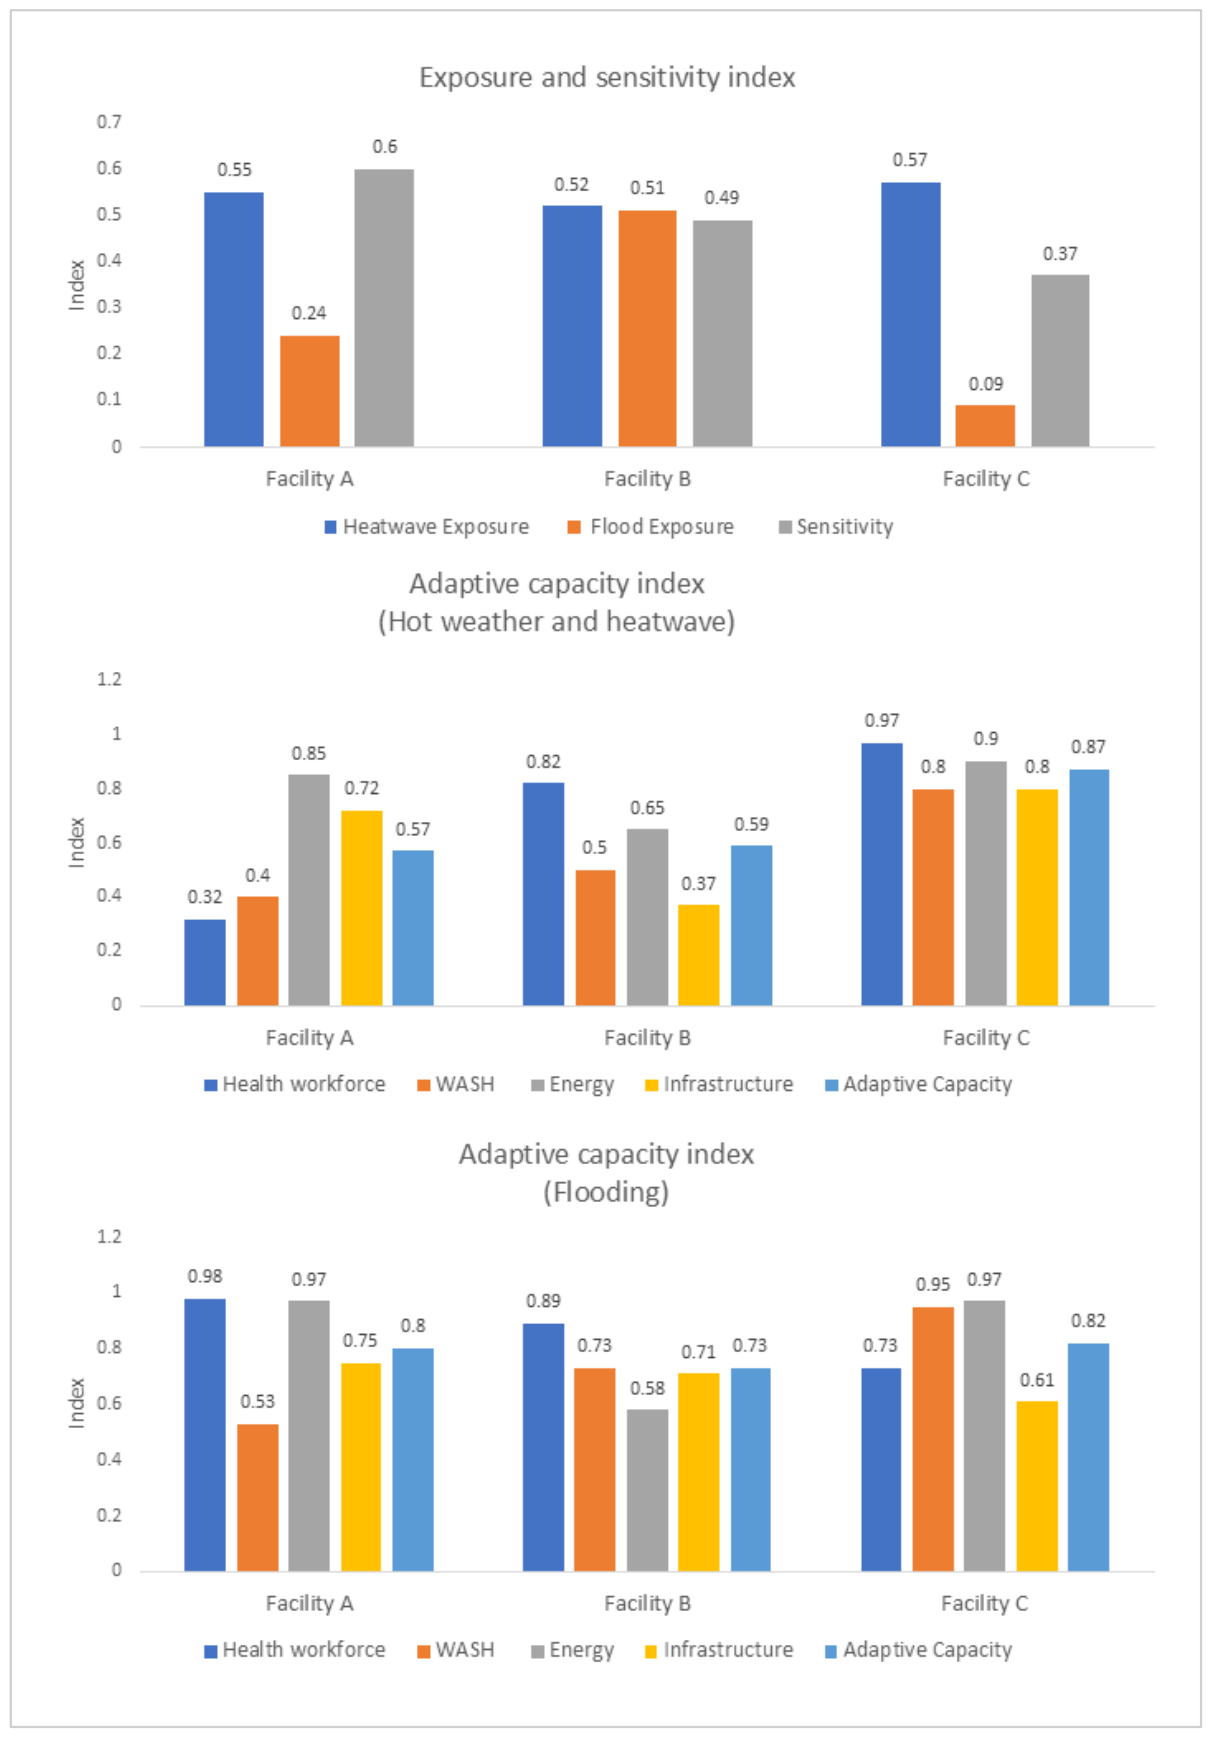
As shown in Figure 3, Facility A demonstrated high vulnerability to hot weather and heatwaves (HCFVI = 0.52), while Facility B (HCFVI = 0.47) and Facility C (HCFVI = 0.36) showed moderate vulnerability. For flooding, moderate vulnerability was observed in both Facility A (HCFVI = 0.35) and Facility B (HCFVI = 0.42), while Facility C demonstrated low vulnerability (HCFVI = 0.22).
A detailed summary of results by subdomain is illustrated in Figure 4 below. For exposure, heatwave exposure ranged from 0.52 to 0.57, while flood exposure ranged from 0.09 to 0.51, with Facility C and Facility B having a high level of exposure to heatwaves and floods, respectively. Sensitivity indices ranged from 0.40 to 0.61 across all facilities. Higher overall adaptive capacity scores were observed for flooding across all facilities compared to heatwaves. Notably, Facility C recorded the highest level of adaptive capacity, with the index exceeding 0.80.

4. Discussion

The VITAL-HCF was developed and adapted based on the IPCC vulnerability framework, which conceptualizes vulnerability as a function of exposure, sensitivity, and adaptive capacity. The application of this framework in healthcare facilities enables a comprehensive vulnerability assessment. While the WHO checklist provides a comprehensive qualitative assessment of healthcare facility preparedness, the VITAL-HCF extends this approach by operationalizing vulnerability into a structured, facility-level assessment tool. It incorporates quantitative scoring across domains, integrates objective exposure indicators derived from climate and spatial data, and enables multi-hazard assessment within a single framework. In addition, the tool was contextualized to the Malaysian healthcare setting, enhancing its relevance and applicability for local implementation. Similar frameworks have been applied in climate-related health vulnerability assessments at the community level [43,44]. Through this approach, hazard-specific vulnerability can be quantified for individual healthcare facilities, and component-specific limitations can be identified to support targeted adaptation and resilience-building measures. Other Southeast Asian countries, including the Philippines, Taiwan, Thailand, and Timor-Leste, have conducted local climate vulnerability assessments of their healthcare systems [45]. These efforts typically adapt global tools to local contexts through literature review, expert consultation, data collection, and validation, with priority hazards identified based on local conditions.

4.1. Development of Vulnerability Assessment Tool

This study aimed to develop a structured assessment tool for assessing climate-related vulnerability in healthcare facilities. While existing guidance documents provide comprehensive checklists for assessing vulnerability and resilience, adaptation was necessary to improve their applicability, relevance, and usability in real-world settings, consistent with approaches adopted in previous climate resilience and healthcare vulnerability assessment studies [12,33,46,47]. Through review of existing literature, the exposure domain integrates relevant spatial, historical, and climatic data to comprehensively characterize the external risk environment of healthcare facilities [9,48,49,50,51,52,53]. Facility characteristics, including the type of facility, building age, number of stories, population coverage, bed capacity, daily patient load, number of doctors, ventilation capacity, and power supply reliability, were identified as key sensitivity components of HCFs during hazard events [50,51,54,55,56].
The components of health workforce, WASH and waste management, energy, and infrastructure primarily reflect institutional preparedness and resource availability [24]. Within the health workforce domain, staff training, community engagement activities, and disaster management committees were identified as important adaptive components [48,53]. Central to adaptive capacity, healthcare facilities are highly dependent on external infrastructure systems, including power, water, and transportation, particularly during disaster events [52], and disruptions to these systems can significantly affect service delivery.

4.2. Validation of Vulnerability Assessment Tool

The validation process was essential to ensure that the tool was applicable to the Malaysian healthcare context and accurately represented the vulnerability concept [35]. All exposure domain items were retained following content validation, indicating that the indicators were well-defined and appropriately captured climate hazard exposure. Given that exposure is largely determined by geographic location and hazard dynamics [41], the inclusion of multiple indicators enhances the ability to capture variability across facilities and avoids underestimation of risk.
Content validation of the sensitivity domain indicated the need for refinement, with several items removed due to low relevance. Items such as facility area, number of departments, and number of units were excluded, as they primarily reflect structural size and organizational complexity rather than functional susceptibility to climate-related hazards. The removal of these items therefore improves the conceptual clarity of the sensitivity domain by prioritizing indicators that more directly capture the facility’s response to climate stressors. For the adaptive capacity domain, extensive revisions were required for the WASH and energy components due to variability in relevance, while the health workforce and infrastructure domains required targeted adjustments. Reassignment and removal of redundant items enhanced conceptual coherence and reduced overlap across components.
Subsequent face validation demonstrated high clarity and comprehensibility for most items, aligning healthcare and engineering terminology with commonly used operational language for local healthcare facilities. The final checklist exhibits clear domain alignment and conceptual consistency with established vulnerability frameworks.

4.3. Field Testing of Assessment Tool

Through facilitated multidisciplinary group discussions, responses were more comprehensive and consensus was more readily achieved based on the collective agreement among participants. Participation of diverse roles of representatives and departments directly reflected the facility-level nature of the assessment and enabled accurate consolidation of information across domains. This approach allowed real-time discussion, which reduced the need for follow-up clarification. This also facilitated consensus-building and improved understanding of item intent. In the Malaysian context, the DHO plays a central role in the administration and oversight of health clinics, including occupational safety and environmental health, primary care services, engineering services, regulatory implementation, and disaster preparedness planning. In addition to clinical representatives from individual clinics, involvement of relevant officers from the DHO was essential to provide accurate and comprehensive input on facility preparedness across administrative, workforce, essential services, and infrastructure components.

4.4. HCF Climate Vulnerability

Through the field testing, variability in vulnerability profiles across the three facilities were observed. High vulnerability to hot weather and heatwaves was observed in Facility A, which corresponded with a higher sensitivity index compared to the other facilities. In contrast, flood vulnerability was highest in Facility B, due to prior flood experience and closer proximity to the nearest river.

4.5. Exposure to Climate Hazards

The field testing showed that exposure to heatwave events was relatively consistent across facilities, reflecting the widespread occurrence of hot weather and heatwave events in the study area. In contrast, flood exposure varied more substantially. These differences highlight the influence of geographic location and local hazard dynamics in determining exposure levels. The findings also demonstrate the utility of the exposure indicators in capturing site-specific variability across different climate hazards.

4.6. Sensitivity to Climate Hazards

The sensitivity level for the facilities ranged between moderate to high sensitivity, corresponding to differences in facility characteristics such as service demand and capacity. Facility A had a lower doctors-to-population ratio and older building age, causing higher sensitivity compared to other facilities. All facilities, however, were affected by frequent power outages, but higher frequencies were recorded in Facilities A and B. This finding is consistent with a previous study indicating heightened risk for power outages during extreme events from heightened grid demand [50]. These factors may increase susceptibility to disruption when exposed to climate hazards, even under similar exposure conditions. The findings suggest that the sensitivity indicators were able to capture variation in facility-level characteristics that may influence susceptibility to the adverse effects of climate-related events.

4.7. Adaptive Capacity of HCF

Adaptive capacity was generally higher for floods compared to heatwaves across all facilities. As flooding is a recurrent climate hazard, most facilities are well prepared with flood action plans compared to heatwaves. Facility C, a government hospital with a Green Building Certification, demonstrated a consistently higher capacity to respond to both flood and heatwave hazards. However, limitations were still observed in infrastructure components including supply chain continuity, resource planning, and emergency logistics. These involved limited arrangements for staff accommodation, procurement and storage of essential supplies, and evacuation plans. Facility A and B also demonstrated lower adaptive capacity in WASH and waste management in anticipation for heatwave events, particularly in water quality surveillance, monitoring systems, and access to an alternative water supply, as well as measures to protect healthcare waste from heat exposure. Facility B had lower adaptive capacity in energy services due to a lack of available generators in the event of a power outage.
Evidence from a previous study indicates that while facilities may have an adequate water supply, future capacity remains uncertain [53]. Restoration of the water supply, availability of backup power sources, continuity of supply chains, and the capacity of the health workforce to manage patient surges were some of the key preparedness measures in anticipating a climate event [52,53]. A study in Kosovo highlighted weaknesses in infrastructure integrity and waste management, with staffing shortages as a key contributor to vulnerability [12]. In Southeast Asia, findings from Timor-Leste similarly identified resource constraints, limited infrastructure maintenance, and inadequate backup water supply as key challenges [15]. Disruptions to these systems can significantly affect healthcare service delivery.
Overall, these findings illustrate the application of the VITAL-HCF in characterizing domain-specific vulnerability patterns and generating facility-level vulnerability profiles. The field testing demonstrates how the tool can be used to systematically assess exposure, sensitivity, and adaptive capacity across different healthcare facilities. The assessment findings may assist healthcare facilities in identifying potential gaps, preparedness planning, and implementing targeted adaptive measures that could enhance facility resilience in anticipation of ongoing and potential climate risks. In the context of heatwave adaptation, the availability of an action plan to accommodate increased patient load, the application of reflective roofing to reduce indoor heat, a secured alternative water supply, and improvements in natural ventilation through building design modifications were some of the essential actions [48,53]. Meanwhile, strengthening health workforce capacity, emergency plans for water and waste systems, the elevation of critical infrastructure, the relocation of essential equipment, and constructing physical barriers to prevent floodwater ingress were some of the measures proposed for flood preparedness [13,50].
It should be noted that the field testing was conducted in three healthcare facilities and was intended to evaluate the feasibility, clarity, and operational applicability of the VITAL-HCF as a tool since it covers the different settings of public healthcare facilities in Malaysia. However, further studies involving a larger and more geographically diverse sample of healthcare facilities are required to evaluate the reliability and broader applicability of the index.
A health–climate vulnerability assessment tool has substantial implications for adoption due to the increasing climate threats to human health [13,24]. Improving health system vulnerability will help in ensuring uninterrupted healthcare services to communities, especially vulnerable populations. Previous studies have highlighted the need for healthcare facility climate vulnerability and resilience assessment to identify gaps and inform strategic planning [29,46]. This study addresses this gap through validation and initial field testing of a climate vulnerability assessment tool tailored to the Malaysian healthcare context. The tool enables systematic evaluation of climate-specific hazards, including heatwaves and flooding, and provides evidence to support policy-driven adaptation and preparedness planning. Thus, this tool provides a structured and standardized approach to strengthen climate resilience in health systems and can be adopted at the local and national level, especially in a tropical country such as Malaysia. Wider application and evaluation across healthcare facilities are needed to strengthen the evidence base, inform coordinated resilience strategies, and guide long-term climate adaptation efforts within the health system.

4.8. Strength and Limitation

This study demonstrates several notable strengths. The instrument developed showed strong content and face validity, with strong revised validity indices, supporting the relevance and clarity of the items. The group-based data collection approach facilitated collective input across departments, enabling more comprehensive and contextually informed responses. In addition, the tool is designed for practical application, requiring approximately two hours to complete, making it suitable for routine use in facility-level assessments. Importantly, the instrument encompasses all three core domains of vulnerability, thereby providing a comprehensive framework for assessing healthcare facility vulnerability to support climate adaptation planning. The field-testing component was intended to evaluate the feasibility, clarity, and applicability of the tool in real-world healthcare settings.
However, several limitations should be acknowledged. The field testing was conducted in three healthcare facilities within a single district (Sepang, Selangor), which may limit the generalizability of the findings to other geographical regions and healthcare settings in Malaysia. Further studies involving larger and more diverse healthcare facilities are required to evaluate the broader applicability of the index. In addition, the current HCFVI applies equal weighting across exposure, sensitivity, and adaptive capacity domains using a linear additive approach. While this method enhances the transparency, interpretability, and comparability of the index, the present study did not evaluate alternative weighting approaches or potential non-linear relationships between vulnerability domains. Future studies may explore expert-informed weighting, statistical weighting approaches, and sensitivity analysis to further refine the HCFVI model.
Furthermore, the tool relies on a self-administered, group-based approach in which responses are determined through consensus among participants. Although this method promotes multidisciplinary input and improves completeness of information, it may introduce reporting and consensus-related biases. The questionnaire also contains a relatively large number of indicators, particularly within the adaptive capacity domain. While comprehensive coverage is necessary to capture multiple dimensions of climate vulnerability, completion of the assessment may potentially impose a time and administrative burden on respondents. Future refinement of the tool may explore opportunities to streamline selected indicators while maintaining its validity and comprehensiveness.
Lastly, the current version of the VITAL-HCF was developed using priority climate hazards relevant to Malaysia and available hazard datasets. Future studies should expand the framework to include additional climate-related hazards and compound events, supported by hazard-specific indicators and projections, to provide a more comprehensive assessment of healthcare facility vulnerability under evolving climate conditions.

5. Conclusions

The increasing intensity and frequency of climate-related hazards in Malaysia underscore the need for a standardized assessment tool to evaluate healthcare facility preparedness and vulnerability to climate-related risks. This study demonstrates the development, validation, and preliminary field application of the VITAL-HCF, which integrates exposure, sensitivity, and adaptive capacity within a single assessment framework. The validation results demonstrated good content and face validity, while field testing illustrated the feasibility and applicability of the tool in selected healthcare facilities.
The VITAL-HCF provides a structured approach for assessing climate-related vulnerability and generating facility-level vulnerability profiles that may support future planning and adaptation efforts. The tool may also be applicable in countries with similar healthcare facility contexts and climate characteristics, subject to further validation. Further implementation and evaluation involving a larger sample of healthcare facilities are recommended to strengthen the evidence base and assess the tool’s applicability in diverse settings.

Supplementary Materials

The following supporting information can be downloaded at https://www.mdpi.com/article/10.3390/cli14080155/s1, Table S1: Scoring for indicators in the exposure, sensitivity, and adaptive capacity domains. Table S2: Items removed following content validation.

Author Contributions

N.A.K.H.: Conceptualization, Methodology, Investigation, Data Curation, Formal Analysis, Validation, Writing—Original Draft, Writing—Review and Editing, Visualization, Project Administration, Funding Acquisition. N.M.: Validation, Investigation, Writing—Original Draft, Writing—Review and Editing. R.N.: Methodology, Validation, Investigation, Formal Analysis, Data Curation, Writing—Original Draft, Writing—Review and Editing. I.H.A.S.: Validation, Investigation, Writing—Original Draft, Writing—Review and Editing. S.M.S.M.Z.: Methodology, Validation, Investigation, Writing—Original Draft, Writing—Review and Editing. N.M.S.: Methodology, Validation, Investigation, Writing—Original Draft, Writing—Review and Editing. S.A.R.: Validation, Investigation, Writing—Original Draft, Writing—Review and Editing. N.M.N.N.H.: Validation, Investigation, Writing—Original Draft, Writing—Review and Editing. M.I.M.: Validation, Investigation, Writing—Original Draft, Writing—Review and Editing. M.R.Z.: Investigation, Formal Analysis, Data Curation, Visualization. T.A.Z.: Methodology, Validation, Methodology, Writing—Review and Editing. R.I.: Supervision, Methodology, Writing—Review and Editing, Funding Acquisition. All authors: Critically Revised the Manuscript. All authors have read and agreed to the published version of the manuscript.

Funding

The research was funded by the Ministry of Health Malaysia (NMRR ID-24-01826-ZRO; 24-027).

Data Availability Statement

The data that support the findings of this study are available from the corresponding author upon reasonable request, subject to relevant ethical and institutional approvals.

Acknowledgments

We would like to thank the Director General of Health Malaysia for their support and permission to publish this paper. During the preparation of this manuscript, the authors used ChatGPT (OpenAI, GPT-5.3) for language editing and refinement. The authors reviewed and edited the output and take full responsibility for the content of this publication.

Conflicts of Interest

The authors declare that they have no known conflicts of interest to influence the work reported in this paper.

Abbreviations

The following abbreviations are used in this manuscript:
HCFHealthcare facility
VITAL-HCFVulnerability Index Tool for Assessing Climate-Related Vulnerability in Healthcare Facilities
WHOWorld Health Organization
HCFVIHealthcare facility vulnerability index
S-CVI/AveAverage of Scale-level Content Validity Indices
S-FVI/AveAverage of Scale-level Face Validity Indices
MOHMinistry of Health
WASHWater, sanitation, and hygiene
I-CVI Item-level Content Validity Index
I-FVIItem-level Face Validity Index
ArcGISGeographic Information System
MRECMedical Research and Ethics Committee
DHODistrict Health Office

References

  1. Ebi, K.L.; Vanos, J.; Baldwin, J.W.; Bell, J.E.; Hondula, D.M.; Errett, N.A.; Hayes, K.; Reid, C.E.; Saha, S.; Spector, J.; et al. Ex-treme Weather and Climate Change: Population Health and Health System Implications. Annu. Rev. Public Health 2020, 42, 293–315. [Google Scholar]
  2. Intergovernmental Panel on Climate Change (IPCC) Annex II: Glossary. In Climate Change 2022: Impacts, Adaptation and Vul-nerability. Contribution of Working Group II to the Sixth Assessment Report of the Intergovernmental Panel on Climate Change; Pörtner, H.-O., Roberts, D.C., Tignor, M., Poloczanska, E.S., Mintenbeck, K., Alegría, A., Craig, M., Langsdorf, S., Löschke, V., Möller, V., et al., Eds.; Cambridge University Press: Cambridge, UK, 2022; pp. 2897–2930. [Google Scholar]
  3. Abebe, Y.A.; Pregnolato, M.; Jonkman, S.N. Flood Impacts on Healthcare Facilities and Disaster Preparedness—A Systematic Review. Int. J. Disaster Risk Reduct. 2025, 119, 105340. [Google Scholar] [CrossRef] [Scilit]
  4. Raker, E.J.; Zacher, M.; Lowe, S.R. Lessons from Hurricane Katrina for Predicting the Indirect Health Consequences of the COVID-19 Pandemic. Proc. Natl. Acad. Sci. USA 2020, 117, 12595–12597. [Google Scholar] [CrossRef] [Scilit] [PubMed]
  5. Lomas, K.J.; Giridharan, R. Thermal Comfort Standards, Measured Internal Temperatures and Thermal Resilience to Climate Change of Free-Running Buildings: A Case-Study of Hospital Wards. Build. Environ. 2012, 55, 57–72. [Google Scholar] [CrossRef] [Scilit]
  6. Brooks, K.; Landeg, O.; Kovats, S.; Sewell, M.; OConnell, E. Heatwaves, Hospitals and Health System Resilience in England: A Qualitative Assessment of Frontline Perspectives from the Hot Summer of 2019. BMJ Open 2023, 13, e068298. [Google Scholar] [CrossRef] [Scilit] [PubMed]
  7. Intergovernmental Panel on Climate Change (IPCC). Climate Change 2007: Impacts, Adaptation and Vulnerability. Con-Tribution of Working Group II to the Fourth Assessment Report of the Intergovernmental Panel on Climate Change; Parry, M.L., Canziani, O.F., Palutikof, J.P., van der Linden, P.J., Hanson, C.E., Eds.; Cambridge University Press: Cambridge, UK, 2007. [Google Scholar]
  8. Cardona, O.D.; van Aalst, M.K.; Birkmann, J.; Fordham, M.; McGregor, G.; Perez, R.; Pulwarty, R.S.; Schipper, E.L.F.; Sinh, B.T.; Décamps, H. Determinants of risk: Exposure and vulnerability. In Managing the Risks of Extreme Events and Disasters to Advance Climate Change Adaptation. A Special Report of Working Groups I and II of the Intergovernmental Panel on Climate Change (IPCC); Field, C.B., Barros, V., Stocker, T.F., Qin, D., Dokken, D.J., Ebi, K.L., Mastrandrea, M.D., Mach, K.J., Plattner, G.-K., Allen, S.K., et al., Eds.; Cambridge University Press: Cambridge, UK, 2012; pp. 65–108. [Google Scholar]
  9. Birkmann, J.; Cardona, O.D.; Carreño, M.L.; Barbat, A.H.; Pelling, M.; Schneiderbauer, S.; Kienberger, S.; Keiler, M.; Alex-ander, D.; Zeil, P.; et al. Framing vulnerability, risk and societal responses: The MOVE framework. Nat. Hazards 2013, 67, 193–211. [Google Scholar] [CrossRef] [Scilit]
  10. Fagerdal, B.; Lyng Hilda Bøand Guise, V.; Anderson, J.E.; Braithwaite, J.; Wiig, S. Exploring the Influence of Health System Factors on Adaptive Capacity in Diverse Hospital Teams in Norway: A Multiple Case Study Approach. BMJ Open 2024, 14, e076945. [Google Scholar] [CrossRef] [Scilit] [PubMed]
  11. Lugten, E.; Hariharan, N. Strengthening health systems for climate adaptation and health security: Key considerations for policy and programming. Health Secur. 2022, 20, 435–439. [Google Scholar] [CrossRef] [Scilit] [PubMed]
  12. Mehmeti-Cakuli, L.; Dimovska, M.; Gjorgjev, D. Assessing the current healthcare system capacity in Kosovo to address po-tential risks of climate change extremes. Open Access Maced. J. Med. Sci. 2024, 12, 471–477. [Google Scholar] [CrossRef] [Scilit]
  13. World Health Organization. WHO Guidance for Climate-Resilient and Environmentally Sustainable Health Care Facilities; World Health Organization: Geneva, Switzerland, 2020; Available online: https://www.who.int/publications/i/item/9789240012226 (accessed on 11 June 2026).
  14. Chatterjee, A.; Wadhawan, S.; Chitale, V.; Dhandhania, P. Making India’s Healthcare Infrastructure Climate Resilient: A District-Level Risk Assessment Framework; Council on Energy, Environment and Water (CEEW): New Delhi, India, 2024; Available online: https://www.ceew.in/publications/climate-risk-assessment-for-critical-infrastructure-and-healthcare-resilience (accessed on 11 June 2026).
  15. World Health Organization. Assessment Report: Technical Support to Develop Climate-Resilient and Environmentally-Sustainable Health Care Facilities in Timor-Leste; WHO Country Office for Timor-Leste: Dili, Timor-Leste, 2024; Available online: https://www.who.int/timorleste/publications (accessed on 11 June 2026).
  16. Yusry, M. Times Malaysia Was Hit Hard by Severe Floods That Took Lives and Caused Billions in Damage. Malay Mail. 27 August 2024. Available online: https://www.malaymail.com/news/malaysia/2024/08/27/times-malaysia-was-hit-hard-by-severe-floods-that-took-lives-and-caused-billions-in-damage/147316 (accessed on 11 June 2026).
  17. Davies, R. Malaysia floods—Kelantan Flooding Worst Recorded as Costs Rise to RM1 Billion. FloodList. 5 January 2015. Available online: https://floodlist.com/asia/malaysia-floods-kelantan-worst-recorded-costs (accessed on 11 June 2026).
  18. Ministry of Natural Resources and Environmental Sustainability (MNRES). Malaysia Fourth National Communication Report (NC4) Under the United Nations Framework Convention on Climate Change; Ministry of Natural Resources and Environmental Sustainability: Putrajaya, Malaysia, 2024; Available online: https://unfccc.int/documents/638313 (accessed on 11 June 2026).
  19. Mohammad, A.A. Kota Marudu Sizzles Under Level 2 Heatwave as Hot Spell Grips Sabah. New Straits Times, 2025[AM32.1][M1.1]. Available online: https://www.nst.com.my (accessed on 11 June 2026).
  20. International Federation of Red Cross and Red Crescent Societies (IFRC). Malaysia: Heat Wave—03-2024—Sabah and Pen-in-Sular Heat Wave #6. ReliefWeb, 4 April 2024. Available online: https://reliefweb.int/report/malaysia/malaysia-heat-wave-03-2024-sabah-and-peninsular-heat-wave-6-2024-04-04 (accessed on 11 June 2026).
  21. Malaysian Meteorological Department (MET Malaysia). myMETdata Portal. Available online: https://mymetdata.met.gov.my (accessed on 11 June 2026).
  22. Yong, K.H.; Teo, Y.N.; Azadbakht, M.; Phung, H.; Chu, C. The scorching truth: Investigating the impact of heatwaves on Selangor’s elderly hospitalisations. Int. J. Environ. Res. Public Health 2023, 20, 5910. [Google Scholar] [CrossRef] [Scilit] [PubMed]
  23. Cheng, J.; Xu, Z.; Bambrick, H.; Prescott, V.; Wang, N.; Zhang, Y.; Su, H.; Tong, S.; Hu, W. Cardiorespiratory effects of heat-waves: A systematic review and meta-analysis of global epidemiological evidence. Environ. Res. 2019, 177, 108610. [Google Scholar] [CrossRef] [Scilit] [PubMed]
  24. World Health Organization. Checklists to Assess Vulnerabilities in Health Care Facilities in the Context of Climate Change; World Health Organization: Geneva, Switzerland, 2021; Available online: https://www.who.int/publications/i/item/9789240022904 (accessed on 11 June 2026).
  25. World Health Organization; Pan American Health Organization. Hospital Safety Index: Guide for Evaluators, 2nd ed.; Pan American Health Organization: Washington, DC, USA; World Health Organization: Washington, DC, USA, 2018; Available online: https://iris.paho.org/handle/10665.2/51448 (accessed on 11 June 2026).
  26. World Health Organization. Water and Sanitation for Health Facility Improvement Tool (WASH FIT): A Practical Guide for Improving Quality of Care Through Water, Sanitation and Hygiene in Health Care Facilities; World Health Organization: Geneva, Switzerland, 2017; Available online: https://www.who.int/publications/i/item/9789241511698 (accessed on 11 June 2026).
  27. Luke, J.; Franklin, R.; Aitken, P.; Dyson, J. Safer hospital infrastructure assessments for socio-natural disaster—A scoping review. Prehosp. Disaster Med. 2021, 36, 627–635. [Google Scholar] [CrossRef] [Scilit] [PubMed]
  28. Balbus, J.; Berry, P.; Brettle, M.; Jagnarine-Azan, S.; Soares, A.; Ugarte, C.; Varangu, L.; Villalobos Prats, E. Enhancing the sustainability and climate resiliency of health care facilities: A comparison of initiatives and toolkits. Rev. Panam. Salud Publica 2016, 40, 174–180. [Google Scholar] [PubMed]
  29. Schwerdtle, P.N.; Ngo, T.A.; Hasch, F.; Phan, T.V.; Quitmann, C.; Montenegro-Quiñonez, C.A. Climate change resilient health facilities: A scoping review of case studies in low and middle-income countries. Environ. Res. Lett. 2024, 19, 074041. [Google Scholar] [CrossRef] [Scilit]
  30. Shah, F.; Ranghieri, F. A Workbook on Planning for Urban Resilience in the Face of Disasters: Adapting Experiences from Vietnam’s Cities to Other Cities; The World Bank: Washington, DC, USA, 2012. [Google Scholar]
  31. Ministry of Health; Republic of Indonesia. Report on Vulnerability and Adaptation Assessment; Ministry of Health: Jakarta, In-donesia, 2025; Available online: https://www.kemkes.go.id (accessed on 11 June 2026).
  32. Jain, R.; Rao, B. Health care facility vulnerability in developing nations: Strengthening health care policy-making and im-ple-mentation. J. Public Health 2018, 26, 653–662. [Google Scholar] [CrossRef] [Scilit]
  33. World Bank. Climate and Health Vulnerability Assessment: Pakistan; World Bank: Washington, DC, USA, 2024; Available online: https://documents.worldbank.org/en/publication/documents-reports/documentdetail/099070324142031034 (accessed on 11 June 2026).
  34. Service [AM33.1][M2.1] Readiness Assessment of the Health Facilities in the Climate Vulnerable North-Eastern Areas in Bangladesh; Pathfinder International: Dhaka, Bangladesh, 2024; Available online: https://www.pathfinder.org/publications/health-facility-assessment-report/ (accessed on 11 June 2026).
  35. Yusoff, M. ABC of content validation and content validity index calculation. Educ. Med. J. 2019, 11, 49–54. [Google Scholar] [CrossRef] [Scilit]
  36. Polit, D.F.; Beck, C.T. The content validity index: Are you sure you know what’s being reported? Critique and recommendations. Res. Nurs. Health 2006, 29, 489–497. [Google Scholar] [CrossRef] [Scilit] [PubMed]
  37. Mohamad Marzuki, M.F.; Yaacob, N.A.; Yaacob, N.M. Translation, cross-cultural adaptation, and validation of the Malay version of the System Usability Scale questionnaire for the assessment of mobile apps. JMIR Hum. Factors 2018, 5, e10308. [Google Scholar] [CrossRef] [Scilit] [PubMed]
  38. Yusoff, M. ABC of response process validation and face validity index calculation. Educ. Med. J. 2019, 11, 55–61. [Google Scholar] [CrossRef] [Scilit]
  39. Department of Statistics Malaysia (DOSM). OpenDOSM Kawasanku Portal: P.113 Sepang, Selangor Dashboard. Available online: https://open.dosm.gov.my/dashboard/kawasanku/Selangor/parlimen/P.113%20Sepang (accessed on 28 January 2026).
  40. Sujakhu, N.M.; Ranjitkar, S.; Niraula, R.R.; Asad, M.; Nizami, A.; Schmidt-Vogt, D.; Xu, J. Determinants of livelihood vulnerability in farming communities in two sites in the Asian Highlands. Water Int. 2018, 43, 165–182. [Google Scholar] [CrossRef] [Scilit]
  41. Intergovernmental Panel on Climate Change (IPCC). Climate Change 2001: Impacts, Adaptation, and Vulnerability: Contribution of Working Group II to the Third Assessment Report of the Intergovernmental Panel on Climate Change; McCarthy, J.J., Canziani, O.F., Leary, N.A., Dokken, D.J., White, K.S., Eds.; Cambridge University Press: Cambridge, UK, 2001; Available online: https://www.ipcc.ch/site/assets/uploads/2018/03/WGII_TAR_full_report-2.pdf (accessed on 11 June 2026).
  42. Ehsan, S.; Ara, R.; Nizam, K.; Maulud, A. Household external vulnerability due to climate change in Selangor coast of Malaysia. Clim. Risk Manag. 2022, 35, 100408. [Google Scholar] [CrossRef] [Scilit]
  43. Nazakat, R.; Ibrahim, M.F.; Arsad, F.S.; Mohammad Sham, N.; Nik Hassan, N.M.N.; Mohamad, N.; Rashid, S.A.; Wan Mahiyuddin, W.R.; Ismail, R. Validation of a questionnaire for assessing household vulnerability to climate change and health among small island communities. Front. Public Health 2025, 13, 1593880. [Google Scholar] [CrossRef] [Scilit] [PubMed]
  44. Rakotoarison, N.; Raholijao, N.; Razafindramavo, L.M.; Rakotomavo, Z.A.P.H.; Rakotoarisoa, A.; Guillemot, J.S.; Randri-ami-alisoa, Z.J.; Mafilaza, V.; Ramiandrisoa, V.A.M.P.; Rajaonarivony, R.; et al. Assessment of risk, vulnerability and adaptation to climate change by the health sector in Madagascar. Int. J. Environ. Res. Public Health 2018, 15, 2643. [Google Scholar] [CrossRef] [Scilit] [PubMed]
  45. Health Care Without Harm (HCWH) Southeast Asia. Resilient Health Systems in Asia: A Guide to Contextualizing Climate Vulnerability Assessment Tools for Local Needs; Health Care Without Harm Southeast Asia: Quezon City, Philippines, 2025; Available online: https://noharm.org/sites/default/files/2025-03/A%20Guide%20to%20Contextualizing%20Climate%20Vulnerability%20Assessment%20Tools%20for%20Local%20Needs.pdf (accessed on 11 June 2026).
  46. Paterson, J.; Berry, P.; Ebi, K.; Varangu, L. Health care facilities resilient to climate change impacts. Int. J. Environ. Res. Public Health 2014, 11, 13097–13116. [Google Scholar] [CrossRef] [Scilit] [PubMed]
  47. Shirali, G.; Salehi, V.; Cheraghian, B.; Goudarzi, G.; Shahsavani, A.; Alavi, N.; Maddah, S.; Borhani, F. Promoting envi-ron-mental sustainability and climate change resilience at healthcare facilities: A pilot study in Iran. Int. J. Environ. Sci. Technol. 2025, 22, 1697–1708. [Google Scholar]
  48. Allarane, N.; Atchade, A.J.; Azagoun, V.V.A.; Houngnigbe, A.I.; Seingue, R.G.; N’Dilbé, T.-R.; Hetcheli, F. Assessment of climate risks, vulnerability of urban health systems, and individual adaptation strategies in the city of N’Djaména (Chad). Climate 2024, 12, 5. [Google Scholar]
  49. Muleia, R.; Maúre, G.; José, A.; Maholela, P.; Adjei, I.A.; Karim, M.R.; Trigo, S.; Kutane, W.; Inlamea, O.; Kazembe, L.N.; et al. Assessing the vulnerability and adaptation needs of Mozambique’s health sector to climate: A comprehensive study. Int. J. Environ. Res. Public Health 2024, 21, 532. [Google Scholar] [CrossRef] [Scilit] [PubMed]
  50. Codjoe, S.N.A.; Gough, K.V.; Wilby, R.L.; Kasei, R.; Yankson, P.W.K.; Amankwaa, E.F.; Abarike, M.A.; Atiglo, D.Y.; Kayaga, S.; Mensah, P.; et al. Impact of extreme weather conditions on healthcare provision in urban Ghana. Soc. Sci. Med. 2020, 258, 113072. [Google Scholar] [CrossRef] [Scilit] [PubMed]
  51. Rana, I.A.; Routray, J.K. Multidimensional model for vulnerability assessment of urban flooding: An empirical study in Paki-stan. Int. J. Disaster Risk Sci. 2018, 9, 359–375. [Google Scholar] [CrossRef] [Scilit]
  52. Arboleda, C.A.; Abraham, D.M.; Richard, J.-P.P.; Lubitz, R. Vulnerability assessment of health care facilities during disaster events. J. Infrastruct. Syst. 2009, 15, 149–161. [Google Scholar] [CrossRef] [Scilit]
  53. Schwerdtle, P.N.; Zidouemba, D.T.; Dermbaye, A.R.; Jobanputra, K.; McRae, M.; Tarabbo, M.; Njouonkou, M.; Madjissem, M.; Robert, A.; Haider, Z. Building climate resilience in health systems: A climate vulnerability and capacity assessment in a rural hospital in Chad. Ann. Glob. Health 2025, 91, 50. [Google Scholar] [CrossRef] [Scilit] [PubMed]
  54. Chan, E.Y.Y.; Huang, Z.; Lam, H.C.Y.; Wong, C.K.P.; Zou, Q. Health vulnerability index for disaster risk reduction: Appli-cation in Belt and Road Initiative (BRI) region. Int. J. Environ. Res. Public Health 2019, 16, 380. [Google Scholar] [CrossRef] [Scilit] [PubMed]
  55. Bae, H.-H.; Kang, J.E.; Lim, Y.-R. Assessing the health vulnerability caused by climate and air pollution in Korea using the fuzzy TOPSIS. Sustainability 2019, 11, 2894. [Google Scholar] [CrossRef] [Scilit]
  56. Farley, J.M.; Suraweera, I.; Perera, W.L.S.P.; Hess, J.; Ebi, K.L. Evaluation of flood preparedness in government healthcare facilities in Eastern Province, Sri Lanka. Glob. Health Action 2017, 10, 1331539. [Google Scholar] [CrossRef] [Scilit] [PubMed]
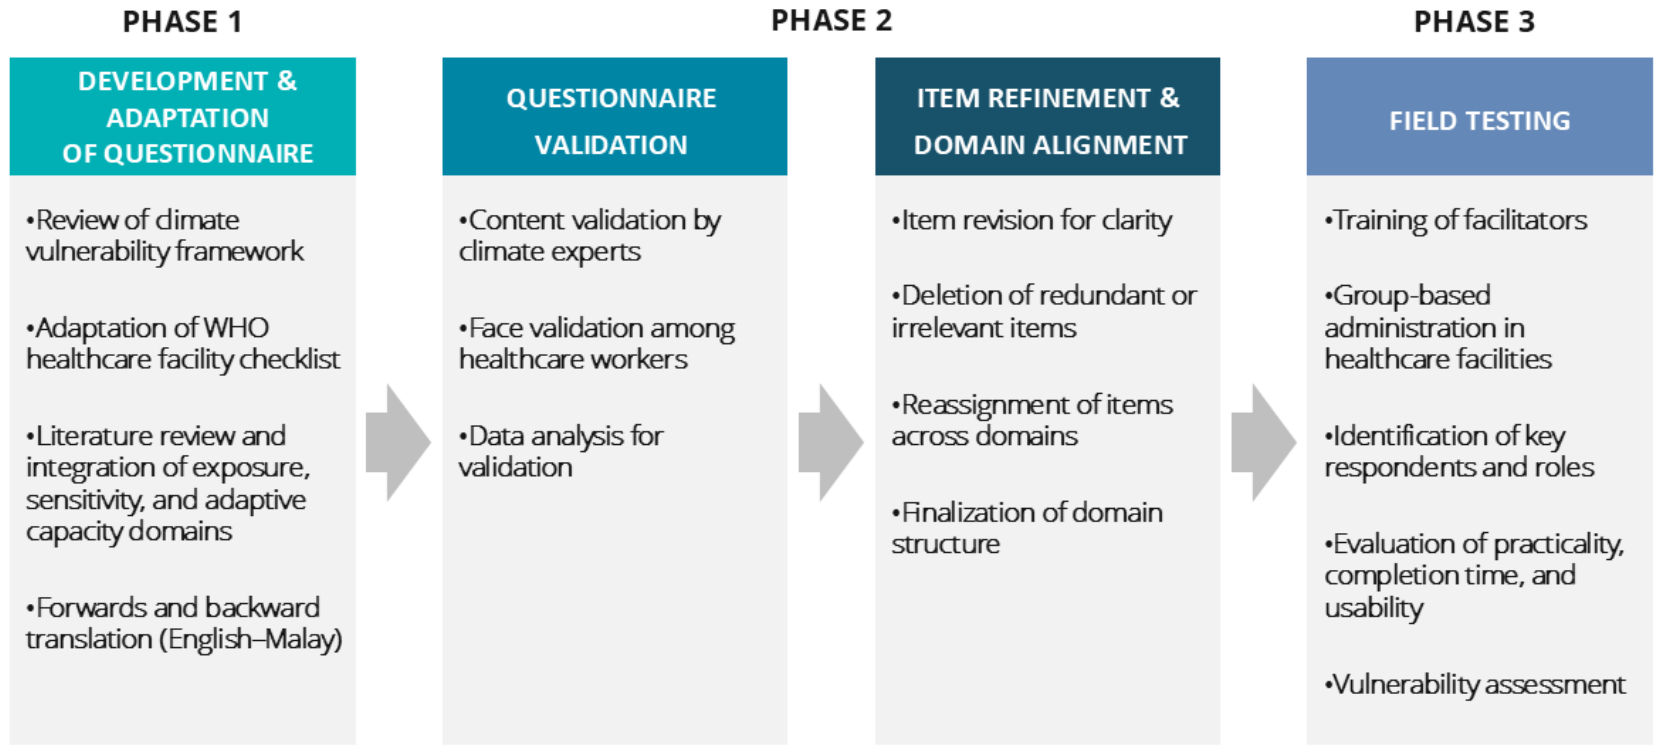
Figure 1. Workflow for the VITAL-HCF development, validation, and field testing.
Climate 14 00155 g001
Figure 2. Healthcare facility vulnerability framework.
Climate 14 00155 g002
Figure 3. Spatial distribution of HCF vulnerability to floods and hot weather and heatwaves in the Sepang district. (A) Location of the study area in Peninsular Malaysia. (B) Location of Facilities A, B, and C in the central region of Peninsular Malaysia. (C) Heatwave vulnerability index of the three healthcare facilities (D) Flooding vulnerability index of the three healthcare facilities.
Climate 14 00155 g003
Figure 4. Exposure, sensitivity and adaptive capacity index for the HCFs.
Climate 14 00155 g004
Table 1. Content and face validation outcomes of the healthcare facility climate vulnerability assessment tool.
DomainClimate HazardComponentContent Validation Face Validation
No. of Items ReviewedI-CVI RangeS-CVI/AveAction Following Content ValidationRevised S-CVII-FVI RangeS-FVI/AveAction Following Face ValidationFinal No. of Indicators
Exposure--131.001.001 item removed (inapplicable for index calculation)1.000.80–1.000.872 items revised for clarity12
Sensitivity--160.43–1.000.835 items removed (inapplicable for index calculation)0.960.80–1.000.903 items revised for clarity11
Adaptive CapacityHot weather & heatwavesHealth workforce180.33–1.000.794 items revised (clarity),
2 removed (redundancy), 1 moved to infrastructure,
2 reassigned to health workforce
0.950.90–1.000.992 items revised for clarity17
WASH 200.16–1.000.614 items revised (clarity),
10 removed (redundancy and inapplicable)
0.900.90–1.000.982 items revised for clarity10
Energy services170.33–1.000.604 items revised (clarity), 7 removed (redundancy and inapplicable)0.920.90–1.000.991 item revised for clarity10
Infrastructure 360.33–1.000.824 items revised (clarity), 12 removed (redundancy and inapplicable), 2 moved to health workforce, 1 reassigned to infrastructure0.930.90–1.000.992 items revised for clarity23
Overall 910.16–1.000.71-0.930.90–1.000.99-60
FloodingHealth workforce320.67–1.000.882 items revised (clarity), 3 removed (redundancy), 1 moved to energy service, 1 reassigned to health workforce0.920.90–1.000.985 items revised for clarity29
WASH 310.16–1.000.728 items revised (clarity), 8 removed (redundancy and inapplicable), 1 moved to infrastructure0.950.90–1.000.991 item revised for clarity22
Energy services150.50–1.000.882 items revised (clarity), 1 removed (redundancy), 1 reassigned to energy0.940.90–1.000.992 items revised for clarity15
Infrastructure 660.33–1.000.886 items revised, 11 removed (redundancy and inapplicable), 1 moved to health workforce, 1 reassigned to infrastructure0.920.90–1.000.995 items revised for clarity55
Overall 1440.33–1.000.84- 0.930.90–1.000.99-121
I-CVI = Item-level Content Validity Index; S-CVI/Ave = Scale-level Content Validity Index; I-FVI = Item-level Face Validity Index; S-FVI/Ave = Scale-level Face Validity Index. CVI values were used diagnostically to guide item revision, deletion, and reorganization rather than as a confirmatory threshold.
Table 2. Indicators by vulnerability domains.
DomainsItems
Exposure
  • Facility prone to inland flood
  • Distance from nearest river
  • Facility prone to coastal flood
  • Distance from nearest coastline
  • Number of floods in the past 5 years
  • Precipitation data (secondary data)
  • Hydroclimate projection for flood (secondary data)
  • Hydroclimate projection for sea-level rise (secondary data)
  • Hot weather and heatwave events (secondary data)
  • Highest level of hot weather and heatwave data (secondary data)
  • Temperature data (secondary data)
  • Relative humidity data (secondary data)
Sensitivity
  • Building age
  • Number of stories
  • Number of population coverage
  • Number of doctors per 1000 population
  • Number of specialists per capita
  • Type of hospital
  • Average number of patients daily
  • Bed occupancy rate
  • Number of hospital beds per 1000 residents
  • Type of ventilation used in the facility
  • Frequency of power outages
Adaptive Capacity
  • Health workforce
    Human resources
    Capacity development
    Communication and awareness raising
  • Waste and WASH management
    Monitoring and assessment
    Risk management
    Health and safety regulation
  • Energy services
    Monitoring and assessment
    Risk management
    Health and safety regulation
  • Infrastructure
    Adaptation of current system and infrastructure
    Promotion of new system and technologies
    Sustainability of healthcare operations
Table 3. Characteristics of Healthcare Facilities involved in the field testing.
CharacteristicsFacility AFacility BFacility C
Land useUrbanRuralUrban
Type of facilityHealth ClinicHealth ClinicHospital
Number of populations coverage94,1316000140,000
Building Age (years)23133
Number of units or departments10419
Average number of patients daily60060500
Total number of doctors244205
Number of doctors per capita2.556.614.6
History of flood eventsNoYesNo
Frequency of flood events in the past 5 years010
History of hot weather and heatwave eventsYesYesYes
Frequency of hot weather and heatwave events in the past 5 years>3 times>3 times>3 times
Disclaimer/Publisher’s Note: The statements, opinions and data contained in all publications are solely those of the individual author(s) and contributor(s) and not of MDPI and/or the editor(s). MDPI and/or the editor(s) disclaim responsibility for any injury to people or property resulting from any ideas, methods, instructions or products referred to in the content.