1. Introduction
Urban areas are increasingly exposed to thermal stress due to global warming and rapid urbanization [
1], particularly in tropical regions where high temperatures combine with elevated humidity levels [
2,
3]. These conditions significantly affect outdoor thermal comfort around buildings, with implications for pedestrian wellbeing [
4,
5], natural ventilation, and the environmental performance of the built environment [
6]. As a result, reliable tools for simulating microclimatic conditions in building surroundings have become essential for climate-responsive building and urban design.
Numerical microclimate models are widely used to evaluate environmental conditions in outdoor spaces adjacent to buildings [
7,
8], including courtyards, streets, and semi-open environments [
9]. A wide range of modelling approaches is currently available, including mesoscale atmospheric models (e.g., WRF [
10]), large-eddy simulation (LES) models such as PALM [
11], general-purpose CFD tools [
12,
13], and dedicated microclimate models [
14,
15]. These approaches differ substantially in their spatial scale, computational requirements, represented physical processes, and intended applications [
7,
16,
17]. Among these tools, ENVI-met has become the most widely used neighbourhood-scale microclimate model in urban climate research [
18]. Recent reviews consistently identify ENVI-met as the reference tool for evaluating outdoor thermal comfort and testing urban climate adaptation strategies because it explicitly couples airflow, radiation exchange, vegetation, soil processes, and surface-atmosphere interactions within a three-dimensional modelling framework while remaining computationally affordable for neighbourhood- scale applications [
7,
16,
19,
20]. Its ability to directly predict variables required for thermal comfort assessment, including mean radiant temperature (MRT), Physiological Equivalent Temperature (PET) [
21] and Universal Thermal Climate Index (UTCI) [
22] has led to its widespread adoption in urban and building environmental studies.
Despite these advantages and its widespread adoption in urban climate research, the predictive performance of ENVI-met remains strongly dependent on model configuration, meteorological forcing, and local environmental conditions. Consequently, rigorous experimental validation remains essential before the model can be confidently applied to support climate-responsive urban design, particularly in tropical environments where complex radiative and airflow processes may amplify simulation uncertainties. This study addresses 3 research gaps. First, despite its widespread use in building and urban environmental studies, the reliability of ENVI-met simulations remains strongly dependent on model configuration, meteorological inputs, and local environmental conditions [
19,
23]. Previous validation studies have generally reported good agreement between simulated and measured air temperature and relative humidity [
24], while larger discrepancies are often observed for wind speed [
9], mean radiant temperature (MRT) [
25,
26], and derived thermal comfort indices. These uncertainties are especially critical because radiation and airflow are key drivers of outdoor thermal comfort around buildings. Another limitation concerns the propagation of microclimate simulation uncertainties into outdoor thermal comfort indicators. While previous studies often report errors for individual variables, few investigations have quantified how uncertainties in air temperature, radiation, and airflow combine to influence thermal comfort indices such as UTCI.
Second, although ENVI-met has been applied in many climatic contexts, rigorous experimental validation studies remain relatively limited, particularly in hot and humid tropical environments, which represent less than 8% of studied cases [
27]. Tropical climates present additional challenges for microclimate modelling due to strong solar radiation and high humidity levels. Improving the understanding of these uncertainties is essential for ensuring the reliable use of simulation tools in climate-responsive building design. These conditions can amplify uncertainties in both wind and radiation fields, particularly in the context of small tropical islands where coastal effects play a major role in local airflow dynamics.
Third and even more importantly, most existing validation studies rely on a small number of measurement locations [
28,
29] and short simulation periods, often restricted to daytime conditions [
30,
31]. As a result, the spatial variability of model performance within built environments remains poorly documented. In particular, validation approaches based on one or two monitoring points provide limited information about the spatial consistency of microclimate simulations within urban neighbourhoods. Yet outdoor thermal conditions around buildings are strongly influenced by local morphology, shading conditions, and airflow patterns, which may produce substantial variations in model accuracy at short spatial scales. Consequently, there is currently a lack of studies analysing the spatial distribution of simulation errors within a neighbourhood and identifying the urban configurations for which ENVI-met simulations are most reliable.
The present study addresses these research gaps through a detailed validation of ENVI-met simulations conducted in a dense residential neighbourhood on Reunion Island. Field measurements from eleven low-cost weather stations are used to evaluate model performance across multiple environmental variables, including air temperature, relative humidity, wind speed, MRT, and the UTCI.
Compared with previous ENVI-met validation studies, this work provides three main scientific contributions. First, it proposes a spatially distributed validation framework based on eleven monitoring stations, allowing the spatial variability of model performance within a single urban neighbourhood to be quantified. Second, it combines model validation with an error-propagation analysis to determine how uncertainties in simulated microclimatic variables propagate into UTCI predictions and to identify the dominant sources of thermal comfort uncertainty. Third, it systematically evaluates the influence of key modelling assumptions, including wind boundary conditions, urban roughness representation, and model initialization, through dedicated sensitivity analyses. Together, these contributions provide a more comprehensive assessment of ENVI-met performance than conventional single-point validation studies and offer practical recommendations for its application in dense tropical urban environments.
2. Materials and Methods
2.1. Experimental Campaign and Monitoring Network
2.1.1. Study Area
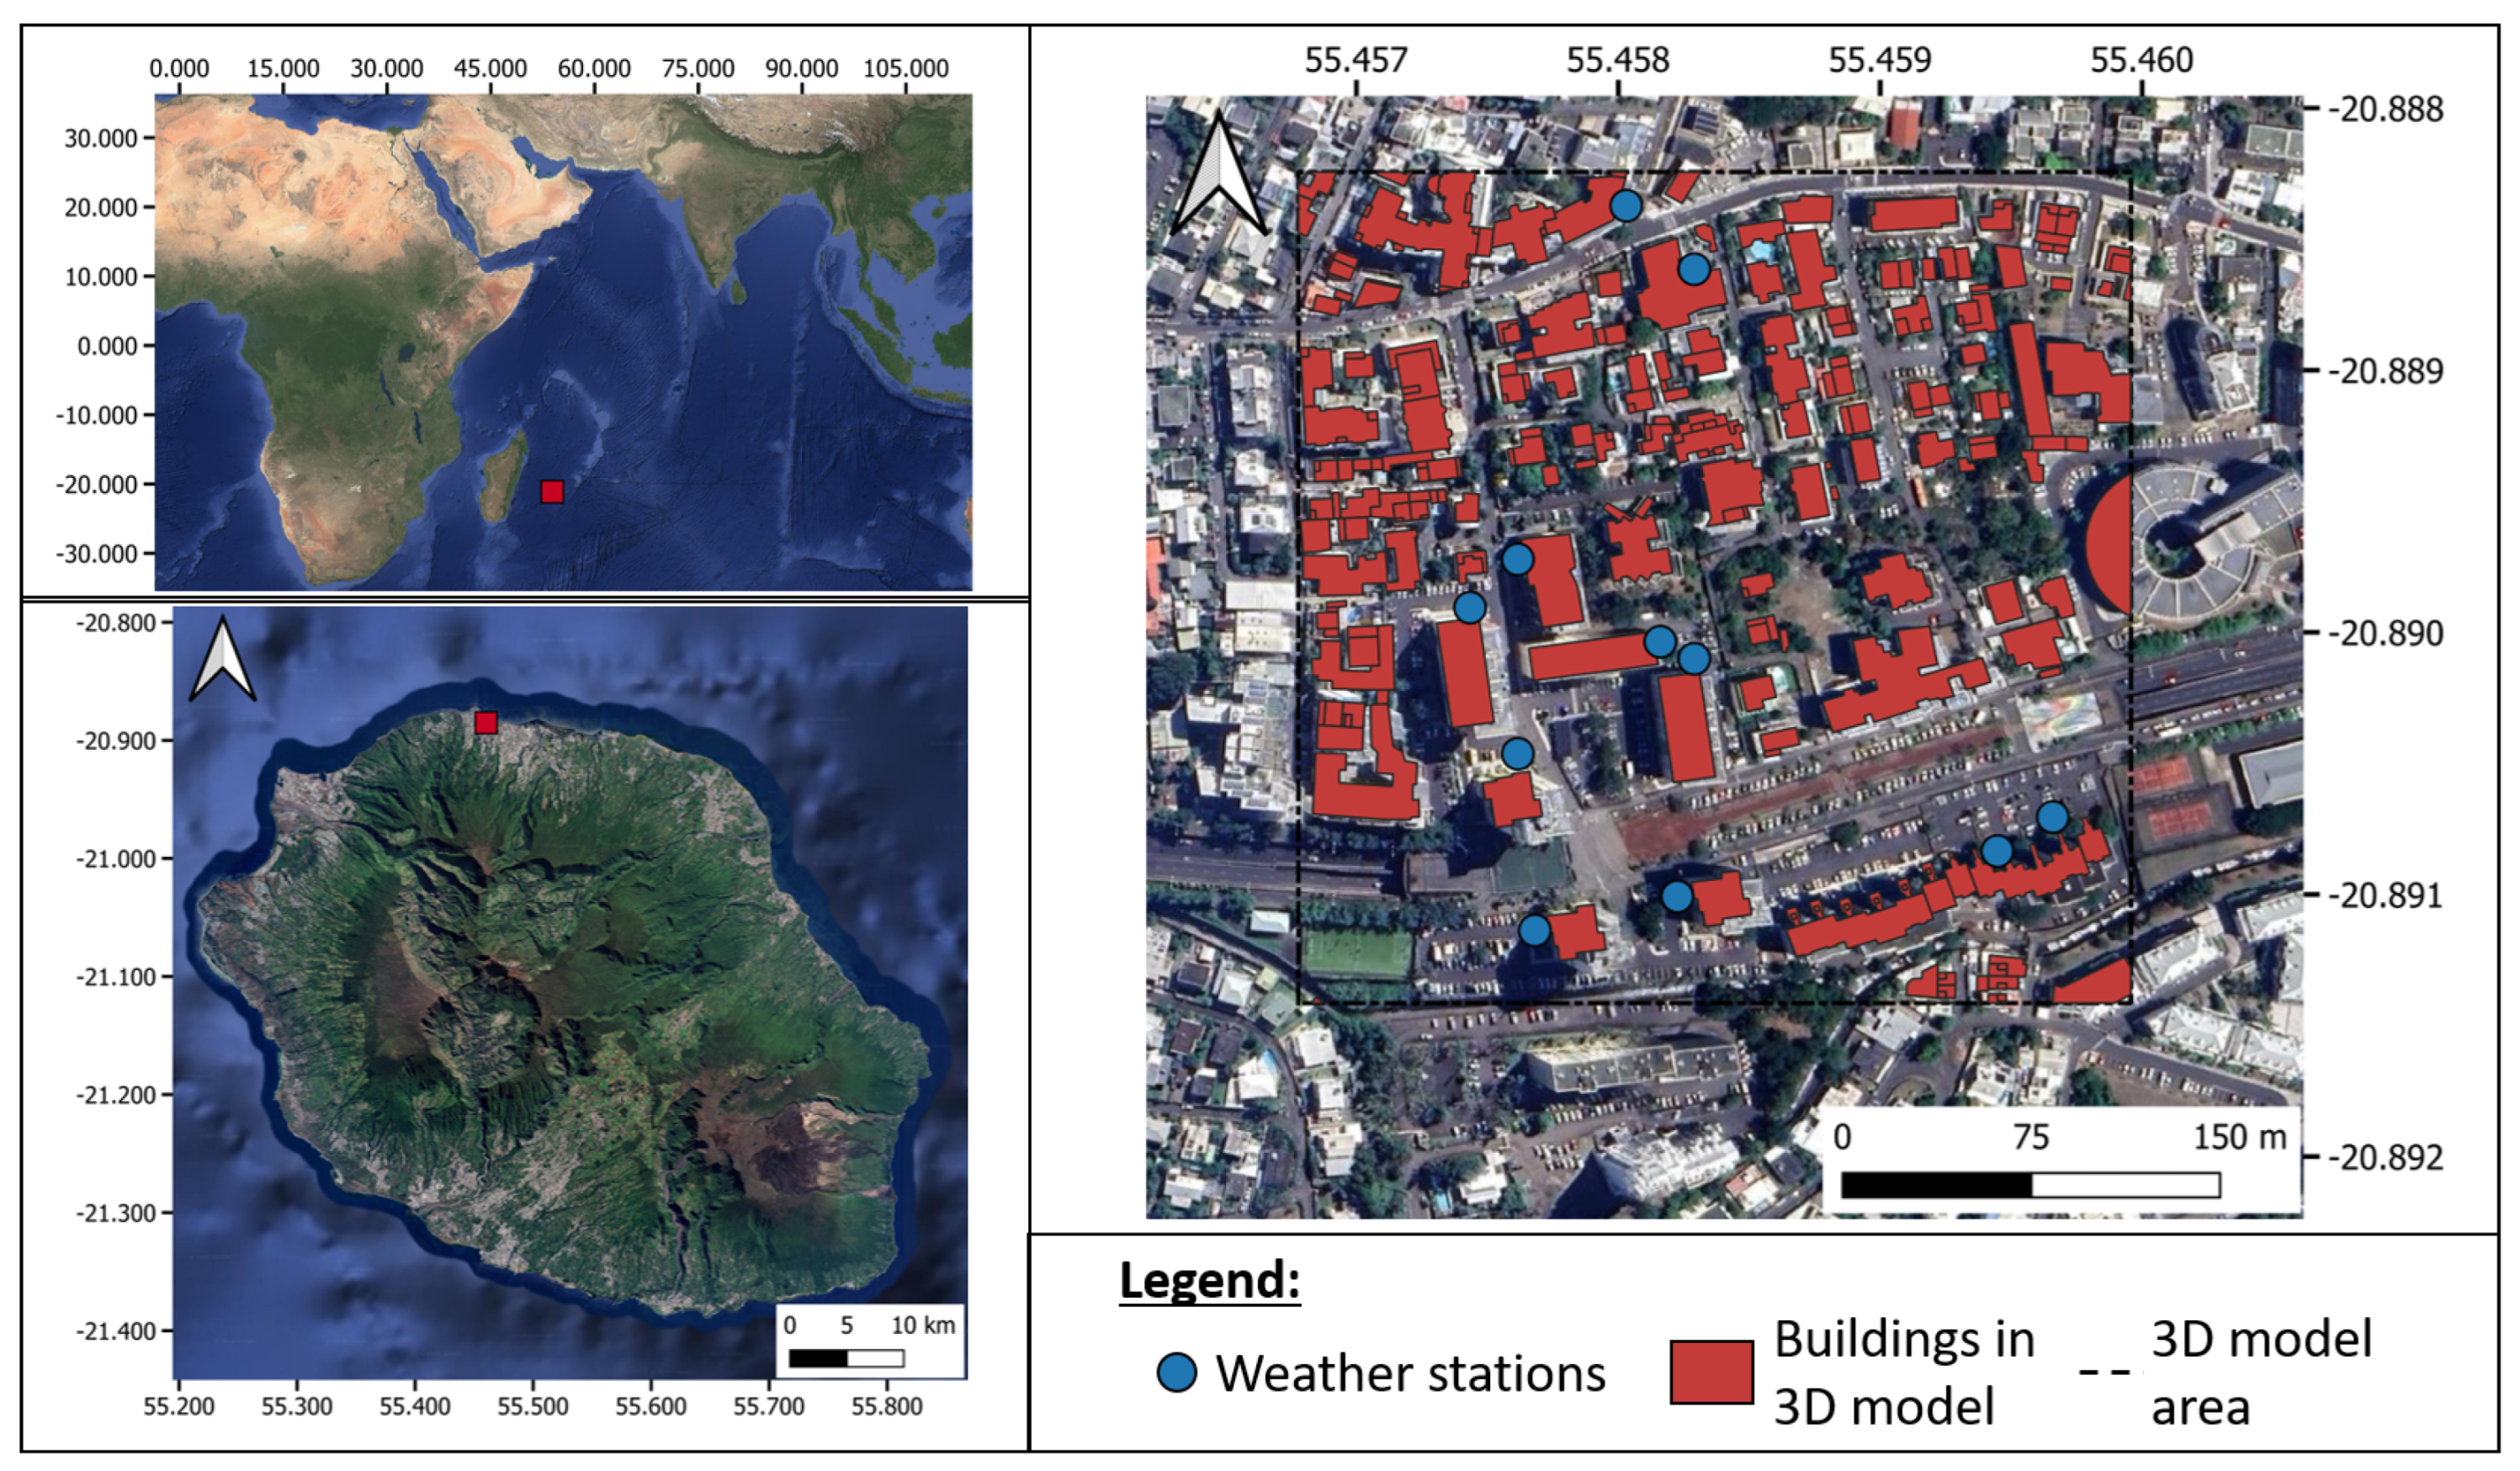
The experimental campaign was conducted on Reunion Island, a tropical island located in the southwest Indian Ocean (
Figure 1). The study site is the Le Ruisseau residential district in Saint-Denis, characterized by a dense urban morphology composed of multi-storey residential buildings, impervious surfaces, and limited vegetation. The area is representative of compact coastal tropical urban environments where outdoor thermal comfort in building surroundings is strongly influenced by solar exposure, airflow, and surface materials.
According to the Köppen climate classification, Reunion Island falls within a tropical savanna climate (Aw), characterized by high solar radiation, elevated humidity levels, and moderate to strong trade winds [
32]. These climatic conditions create complex microclimatic interactions around buildings and make the site particularly relevant for evaluating the reliability of microclimate simulation tools in tropical coastal environments.
The district covers approximately 0.12 km
2 and includes residential buildings up to nine stories high, with impervious surfaces representing roughly 60% of the land cover and tree canopy coverage below 5%. The area corresponds to a compact high-rise urban morphology (LCZ 1), characterized by dense building blocks, narrow street canyons, high imperviousness, and limited vegetation [
33]. This urban form is typical of many post-1970s collective residential developments found throughout Reunion Island [
34,
35] and is also representative of compact residential districts commonly encountered in many tropical coastal cities [
36,
37,
38], where high urban density and limited available land promote vertical development and reduced vegetation cover.
2.1.2. Monitoring Network
To capture the spatial variability of microclimatic conditions around buildings, a dense monitoring network composed of eleven low-cost weather stations was deployed throughout the neighbourhood. The monitoring strategy was designed to characterize local outdoor micro-environments in close proximity to residential buildings rather than idealized canyon-center conditions.
Stations were installed on residential building façades at approximately 3 m above ground level. This installation strategy was primarily driven by operational constraints commonly encountered in dense urban environments, including vandalism risk, accessibility, maintenance requirements, electrical autonomy, and long-term deployment stability [
36,
39].
Although this configuration does not strictly correspond to standard pedestrian-level biometeorological measurements performed at 1.1–1.5 m height in open canyon conditions, the sensors remained located within the urban canopy layer and therefore captured microclimatic conditions representative of near-building outdoor spaces frequently occupied by pedestrians. Measurements should thus be interpreted as representative of localized residential outdoor micro-environments rather than undisturbed canyon-scale atmospheric conditions. Because the objective of the present study is to validate ENVI-met against field observations, simulated variables were extracted at the closest available model height (approximately 3 m above ground) for direct comparison with the monitoring data. The validation therefore evaluates the model’s ability to reproduce near-building outdoor microclimatic conditions representative of residential environments rather than standard pedestrian-level reference conditions [
36].
To limit direct conductive and radiative influence from building surfaces, sensors were positioned approximately 40–60 cm away from the façade using dedicated mounting poles. Sensor orientation and placement were additionally optimized to avoid permanent direct solar obstruction from balconies or architectural overhangs while ensuring sufficient solar exposure for photovoltaic power supply. South-facing façades were avoided whenever possible to ensure adequate battery charging stability during long-term deployment. The anemometers were mounted on the same supporting poles, approximately 40–60 cm from the façade. Although this configuration reduces the direct influence of the wall on the measurements, the presence of the supporting pole and the proximity of the building may still locally modify the airflow through small-scale acceleration and turbulence effects. These installation-induced disturbances are therefore considered as an additional source of uncertainty in the wind speed measurements.
Each station recorded air temperature, relative humidity, globe temperature, and wind speed. Globe temperature measurements were used to estimate mean radiant temperature (MRT) following ISO 7726 procedures [
40], while UTCI values were subsequently calculated from the measured and derived microclimatic variables. MRT and UTCI should therefore be interpreted as derived thermal indicators rather than direct in-situ measurements.
The sensors used in the monitoring stations were previously calibrated and validated following the laboratory and field protocols presented in [
41], ensuring methodological continuity with previous deployments in tropical urban environments. Calibration procedures included climatic chamber tests for air temperature and relative humidity sensors, wind tunnel calibration for anemometers, and intercomparison with reference instruments. The resulting measurement uncertainties are summarized in
Table 1 and remain comparable to ISO 7726 requirements for outdoor thermal environment monitoring.
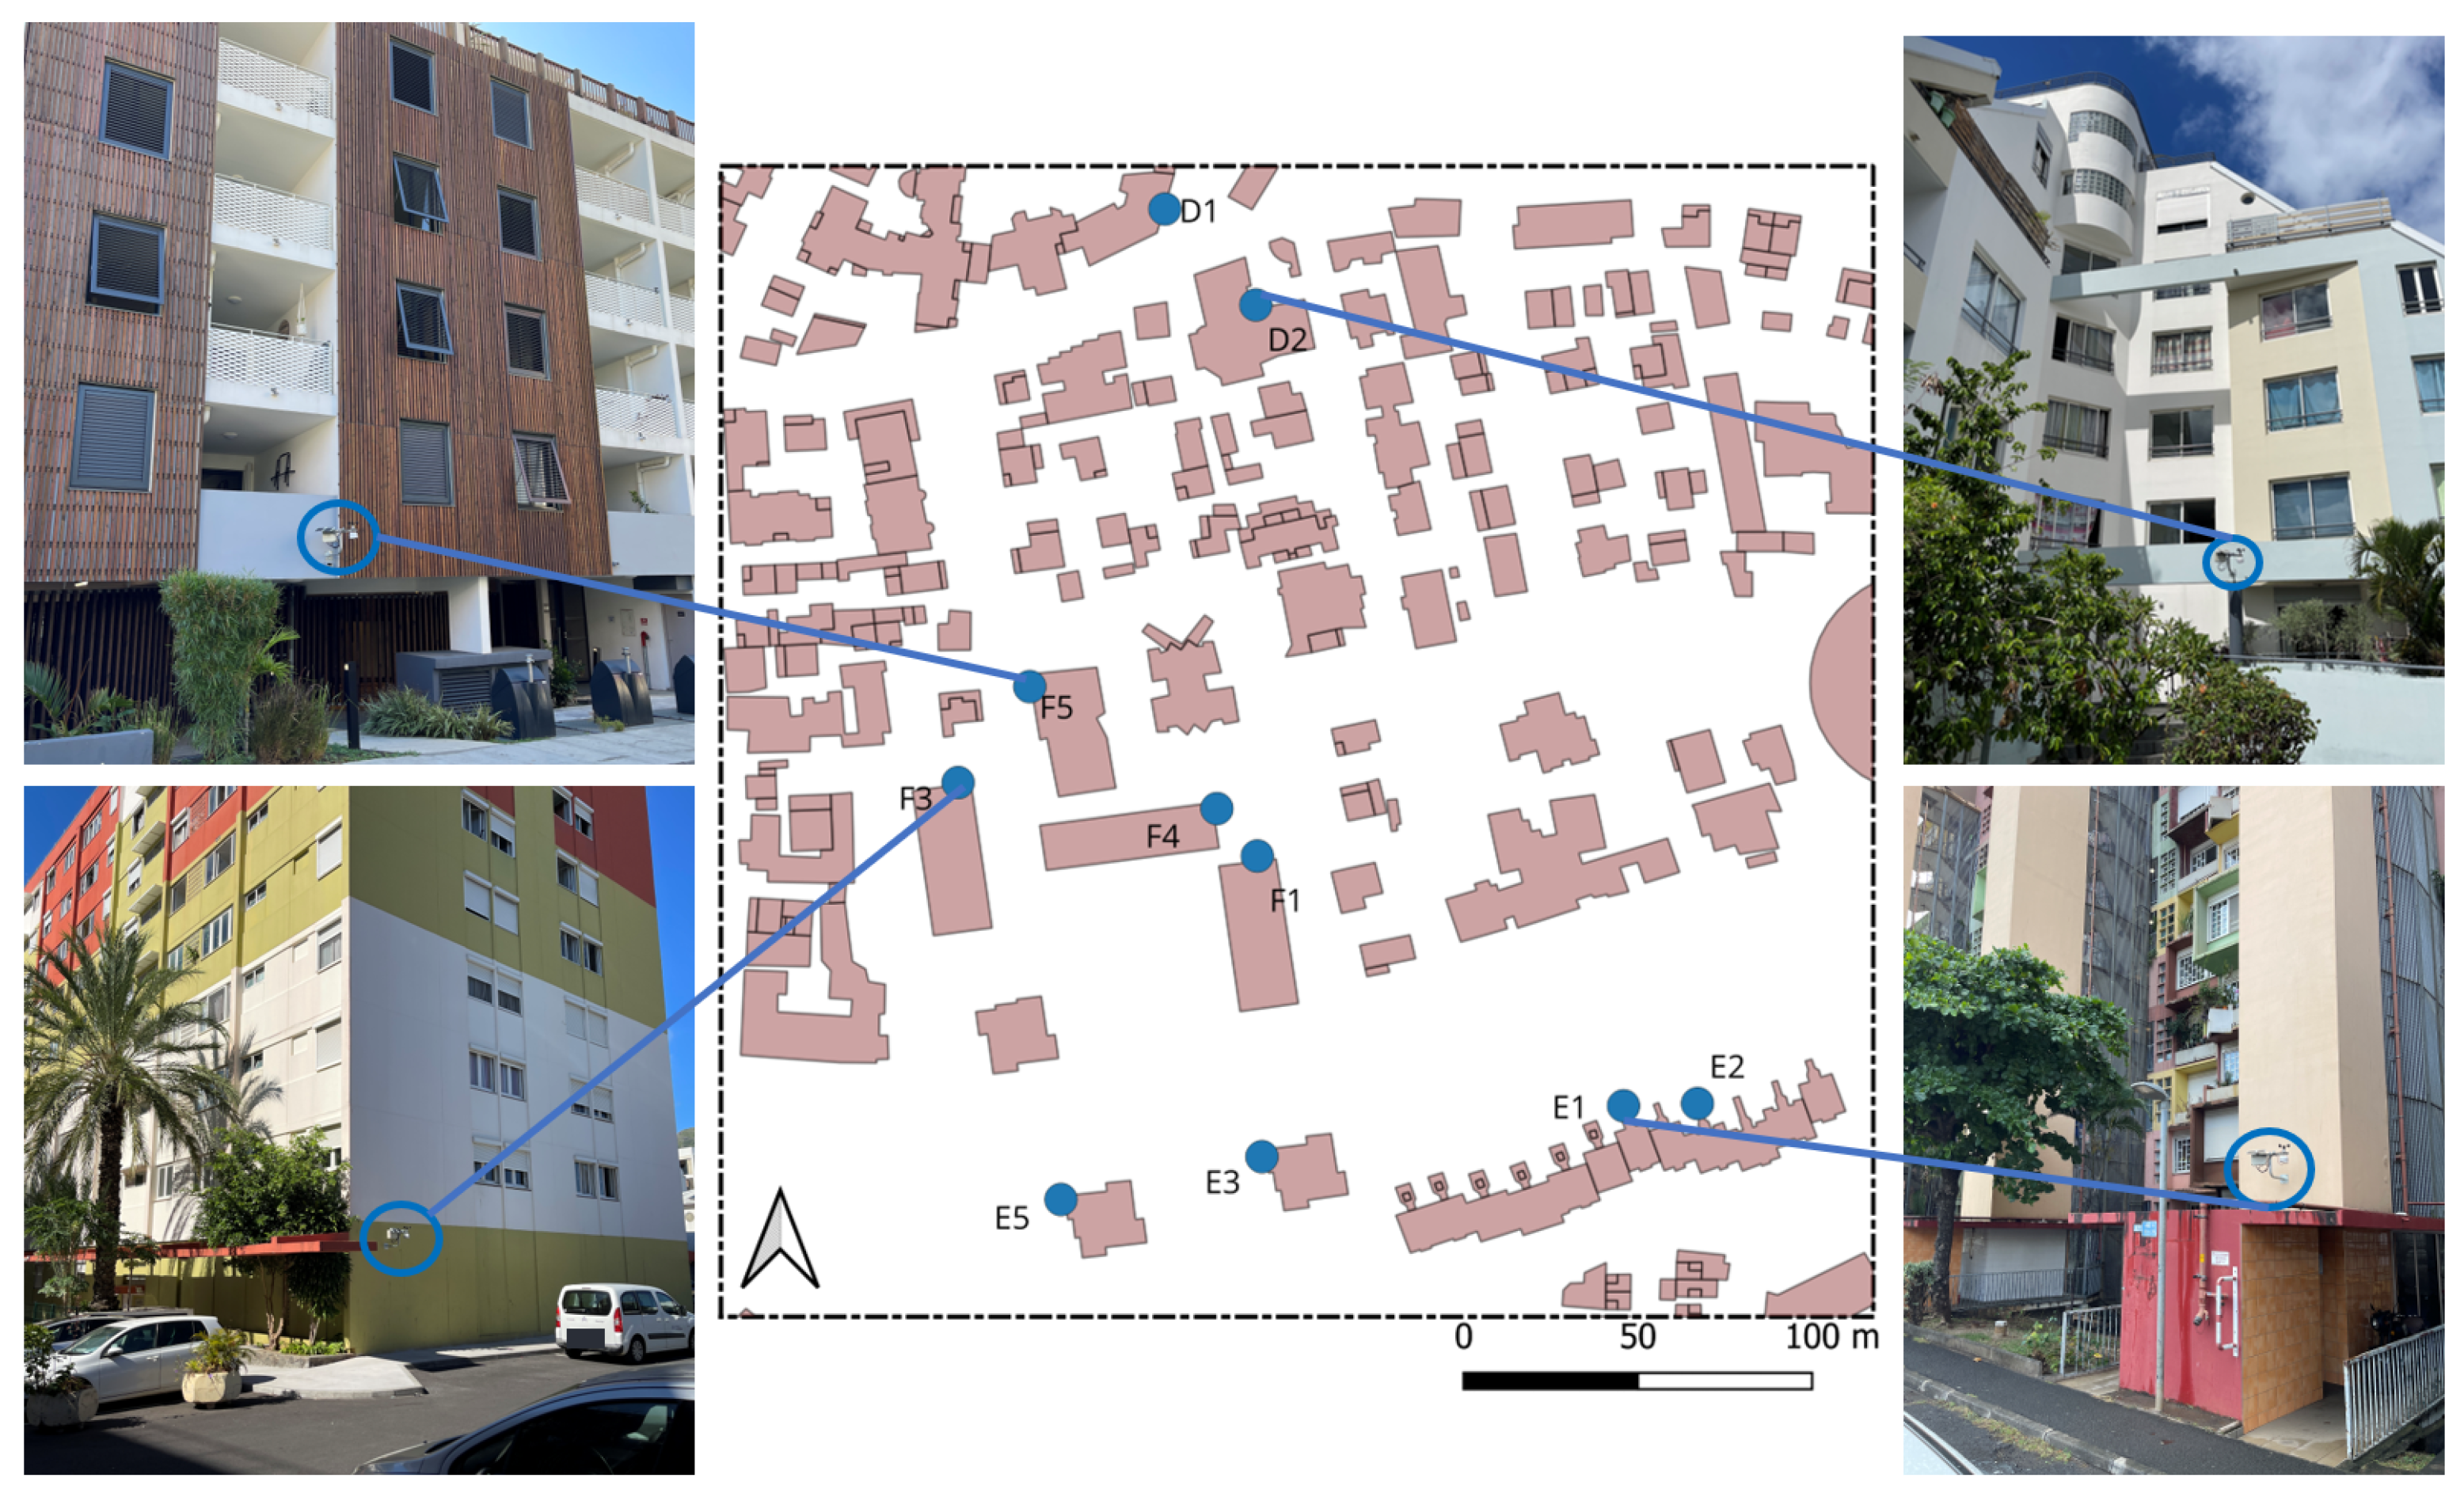
The stations were spatially distributed to capture a range of microclimatic situations associated with contrasting façade orientations, shading conditions, vegetation presence, and local ventilation regimes (
Figure 2). Rather than maximizing homogeneous spacing, the deployment strategy aimed to document the diversity of microclimatic conditions generated by the dense urban morphology of the district. Several stations were intentionally installed in partially shaded or confined environments in order to characterize the strong local variability of radiative and ventilation conditions typically observed within tropical urban canopies.
2.1.3. Measurement Period and Data Processing
The monitoring campaign was conducted between October 2024 and February 2025, covering different phases of the tropical climatic cycle, including the transition season (October), the hot and humid season (December and February), and the onset of the austral winter.
Environmental variables were recorded at 10-min intervals to ensure high temporal resolution. To enable direct comparison with ENVI-met outputs, which are generated at hourly time steps, observational data were filtered to retain only full-hour timestamps. No additional temporal smoothing was applied. This approach ensured strict temporal consistency between simulated and measured datasets while preserving the intrinsic variability of the observed microclimatic conditions.
2.2. Envi-Met Model Configuration
2.2.1. Digital Model of the District
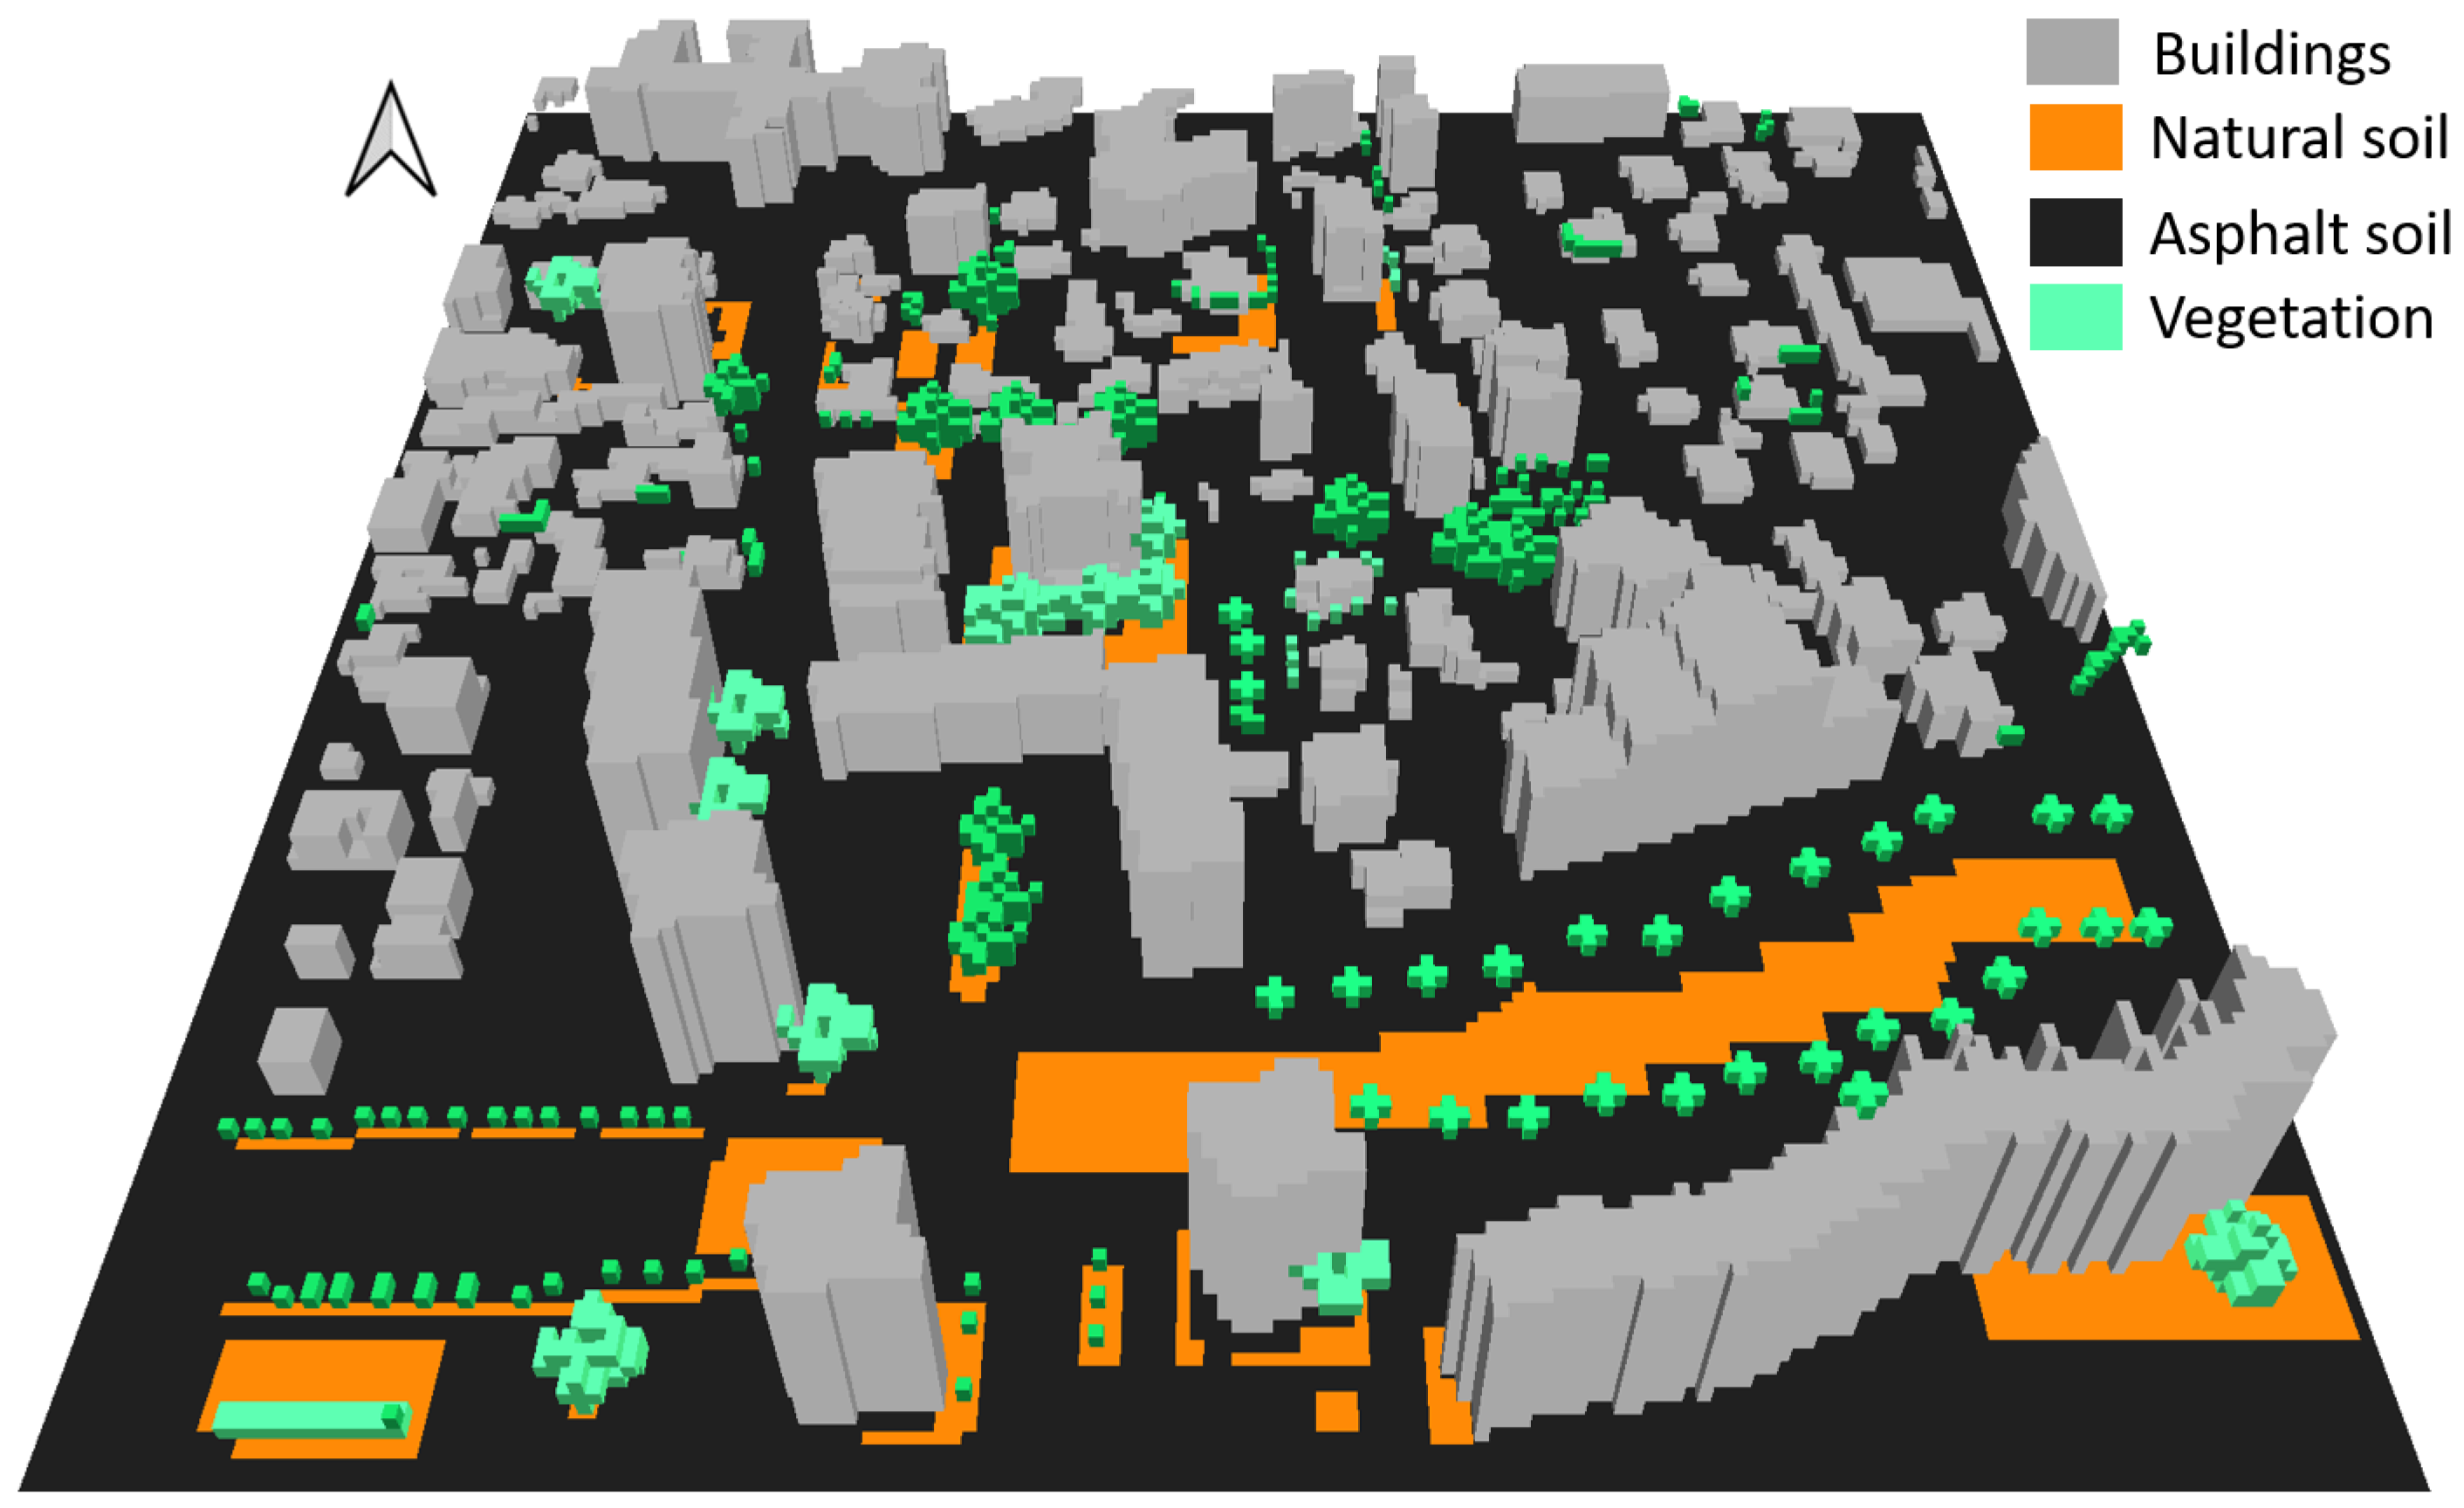
A three-dimensional numerical model of the Le Ruisseau district was developed using ENVI-met (version 5.6). The neighbourhood geometry was reconstructed from geographic data and field observations, and simplified to represent buildings, streets, open spaces, and vegetation relevant to pedestrian-level microclimate interactions (
Figure 3).
The computational domain covers approximately 304 m × 344 m (about 0.12 km2), with a uniform horizontal grid resolution of 2 m × 2 m. This resolution was selected as a compromise between geometric detail and computational feasibility for multi-day simulations, while allowing explicit representation of building volumes and street canyons.
The vertical grid resolution was set to 3 m. To better resolve canopy-layer processes, the lowest vertical cell was split into five thinner sublayers, improving representation of near-ground airflow and surface–atmosphere exchanges. Above 40 m, a telescopic grid stretching (stretching factor 0.2) was applied to progressively increase cell height while preserving numerical stability. The domain height reached approximately 150 m.
Simulated variables were extracted from the ENVI-met grid cell corresponding to the monitoring station location. Owing to the subdivision of the lowest vertical cell into five thinner sublayers, all variables were extracted from the fourth vertical sublayer (k = 4), corresponding to a height of approximately 2.7 m above ground, which provides the closest representation of the sensor installation height (approximately 3 m). Owing to the 2 m × 2 m horizontal grid resolution, the exact sensor offset (40–60 cm from the façade) could not be explicitly represented. Consequently, the comparison was performed using the centre of the corresponding computational cell, which may not fully resolve the strong airflow gradients occurring in the immediate vicinity of building façades.
Buildings were assigned ENVI-met default wall constructions with moderate thermal properties to ensure homogeneous material representation across the district. Sealed surfaces (roads and pavements) were modelled using ENVI-met asphalt/concrete materials, while permeable areas were represented using loamy soil. Vegetation elements were implemented using ENVI-met plant models based on field surveys. This choice was made to evaluate the performance of ENVI-met under a standard modelling configuration, thereby avoiding site-specific calibration that could improve the agreement with the measurements.
Radiative exchanges were simulated using ENVI-met’s standard radiative scheme, including the Index View Sphere (IVS) approach for MRT calculation [
9,
26]. This scheme accounts for shading, surface reflection, longwave emission, vegetation effects, and multiple radiative exchanges between urban elements [
42]. However, the accuracy of reflected shortwave radiation remains dependent on the spatial resolution of the model and on the prescribed surface optical properties.
The main model parameters are summarized in
Table 2.
2.2.2. Meteorological Forcing and Boundary Conditions
Meteorological forcing data were obtained from the Météo-France weather station located at Gillot Airport, approximately 5 km from the study area. The station provides hourly measurements of air temperature, relative humidity, wind speed and direction, and cloud cover. Cloud cover observations were used by ENVI-met to parameterize the incoming shortwave radiation through its internal radiation model. Direct measurements of incoming shortwave and longwave radiation were not available at the meteorological station and therefore could not be prescribed as boundary conditions.
These variables were used in ENVI-met full-forcing mode to drive the simulations. In this configuration, time-varying boundary conditions are imposed at the domain boundaries and top layer, allowing dynamic interaction between synoptic meteorological conditions and neighbourhood-scale processes.
Although the reference station is located in an open coastal environment, it constitutes the only available source of continuous meteorological data for the Saint-Denis area on Reunion Island and is commonly used as regional forcing input. The recorded wind conditions capture the dominant synoptic and coastal circulation patterns affecting the northern coast of Reunion Island, including the trade-wind and sea-breeze regimes. However, the transformation of these regional flows by the island topography and the urban roughness between the airport and the study district cannot be represented through the available boundary forcing data. Consequently, discrepancies may arise between the imposed boundary conditions and the local airflow within the neighbourhood, particularly for wind speed. The influence of these boundary conditions on model performance is evaluated through sensitivity analyses presented in
Section 2.5.
2.2.3. Simulation Periods and Initialization
Three simulation periods were analysed, corresponding to the October, December, and February monitoring campaigns (
Table 2). Each simulation covered a continuous 72-h period in order to capture both daytime and nighttime microclimatic dynamics. Simulations were initialized in the morning at 7:00 and run continuously using ENVI-met’s full-forcing configuration. Multi-day simulations were selected to allow thermal and dynamical adjustment of the model before validation results were analysed.
To evaluate the influence of model initialization, additional sensitivity tests were performed by varying the duration of the spin-up period. The baseline simulations presented in this study were therefore conducted without a dedicated spin-up period, allowing the influence of model initialization to be assessed independently through the sensitivity analysis presented in
Section 2.5.
The Universal Thermal Climate Index (UTCI) was computed using the ENVI-met BioMet module based on simulated environmental variables. The default BioMet human parameters were used, corresponding to an adult male aged 35 years, 1.75 m tall and weighing 75 kg, with a clothing insulation of 0.9 clo, a standing posture, and a metabolic rate of 1.48 met (164.5 W). All simulated variables were then extracted at grid cells corresponding to the monitoring station locations using a dedicated automated Python-based post-processing workflow developed for this study. The script enabled systematic extraction, temporal alignment, and formatting of hourly simulation outputs for direct comparison with observational data.
2.3. Validation Methodology
Model performance was assessed using commonly adopted statistical indicators in urban climate model validation studies [
19,
43], including:
1. Root Mean Square Error (RMSE) quantifies the square root of the average squared differences between simulated and observed values, giving more weight to large errors. A lower RMSE indicates a better fit between model predictions and observations:
where
is the simulated value and
is the experimentally measured value.
2. Mean Absolute Error (MAE) provides the average of the absolute differences between simulated and observed values, offering a simple interpretation of average model error:
3. Mean Bias Error (MBE) indicates the average bias of the model. A positive value suggests overestimation, while a negative one indicates underestimation:
4. Mean Absolute Percentage Error (MAPE) expresses the error as a percentage, making it easier to compare across variables or units:
5. Willmott’s Index of Agreement (
d) [
43] quantifies the accuracy of a model by considering the absolute variation of the errors relative to the maximum possible deviation. A value of
d index close to 1 indicates a strong agreement. It is defined as follows:
where
is the mean of the observed values.
6. Coefficient of Determination (
) represents the proportion of variance in the observed data that can be explained by the simulation. Higher values imply stronger correlation:
These metrics provide a comprehensive evaluation of ENVI-met performance across multiple microclimatic variables and thermal comfort indicators.
2.4. Error Propagation Analysis
To investigate how microclimate simulation errors propagate to thermal comfort prediction, an error-propagation analysis was performed using the pooled hourly validation dataset across all monitoring stations.
Instantaneous simulation errors were computed as the difference between simulated and measured values for air temperature, relative humidity, wind speed, derived MRT, and UTCI.
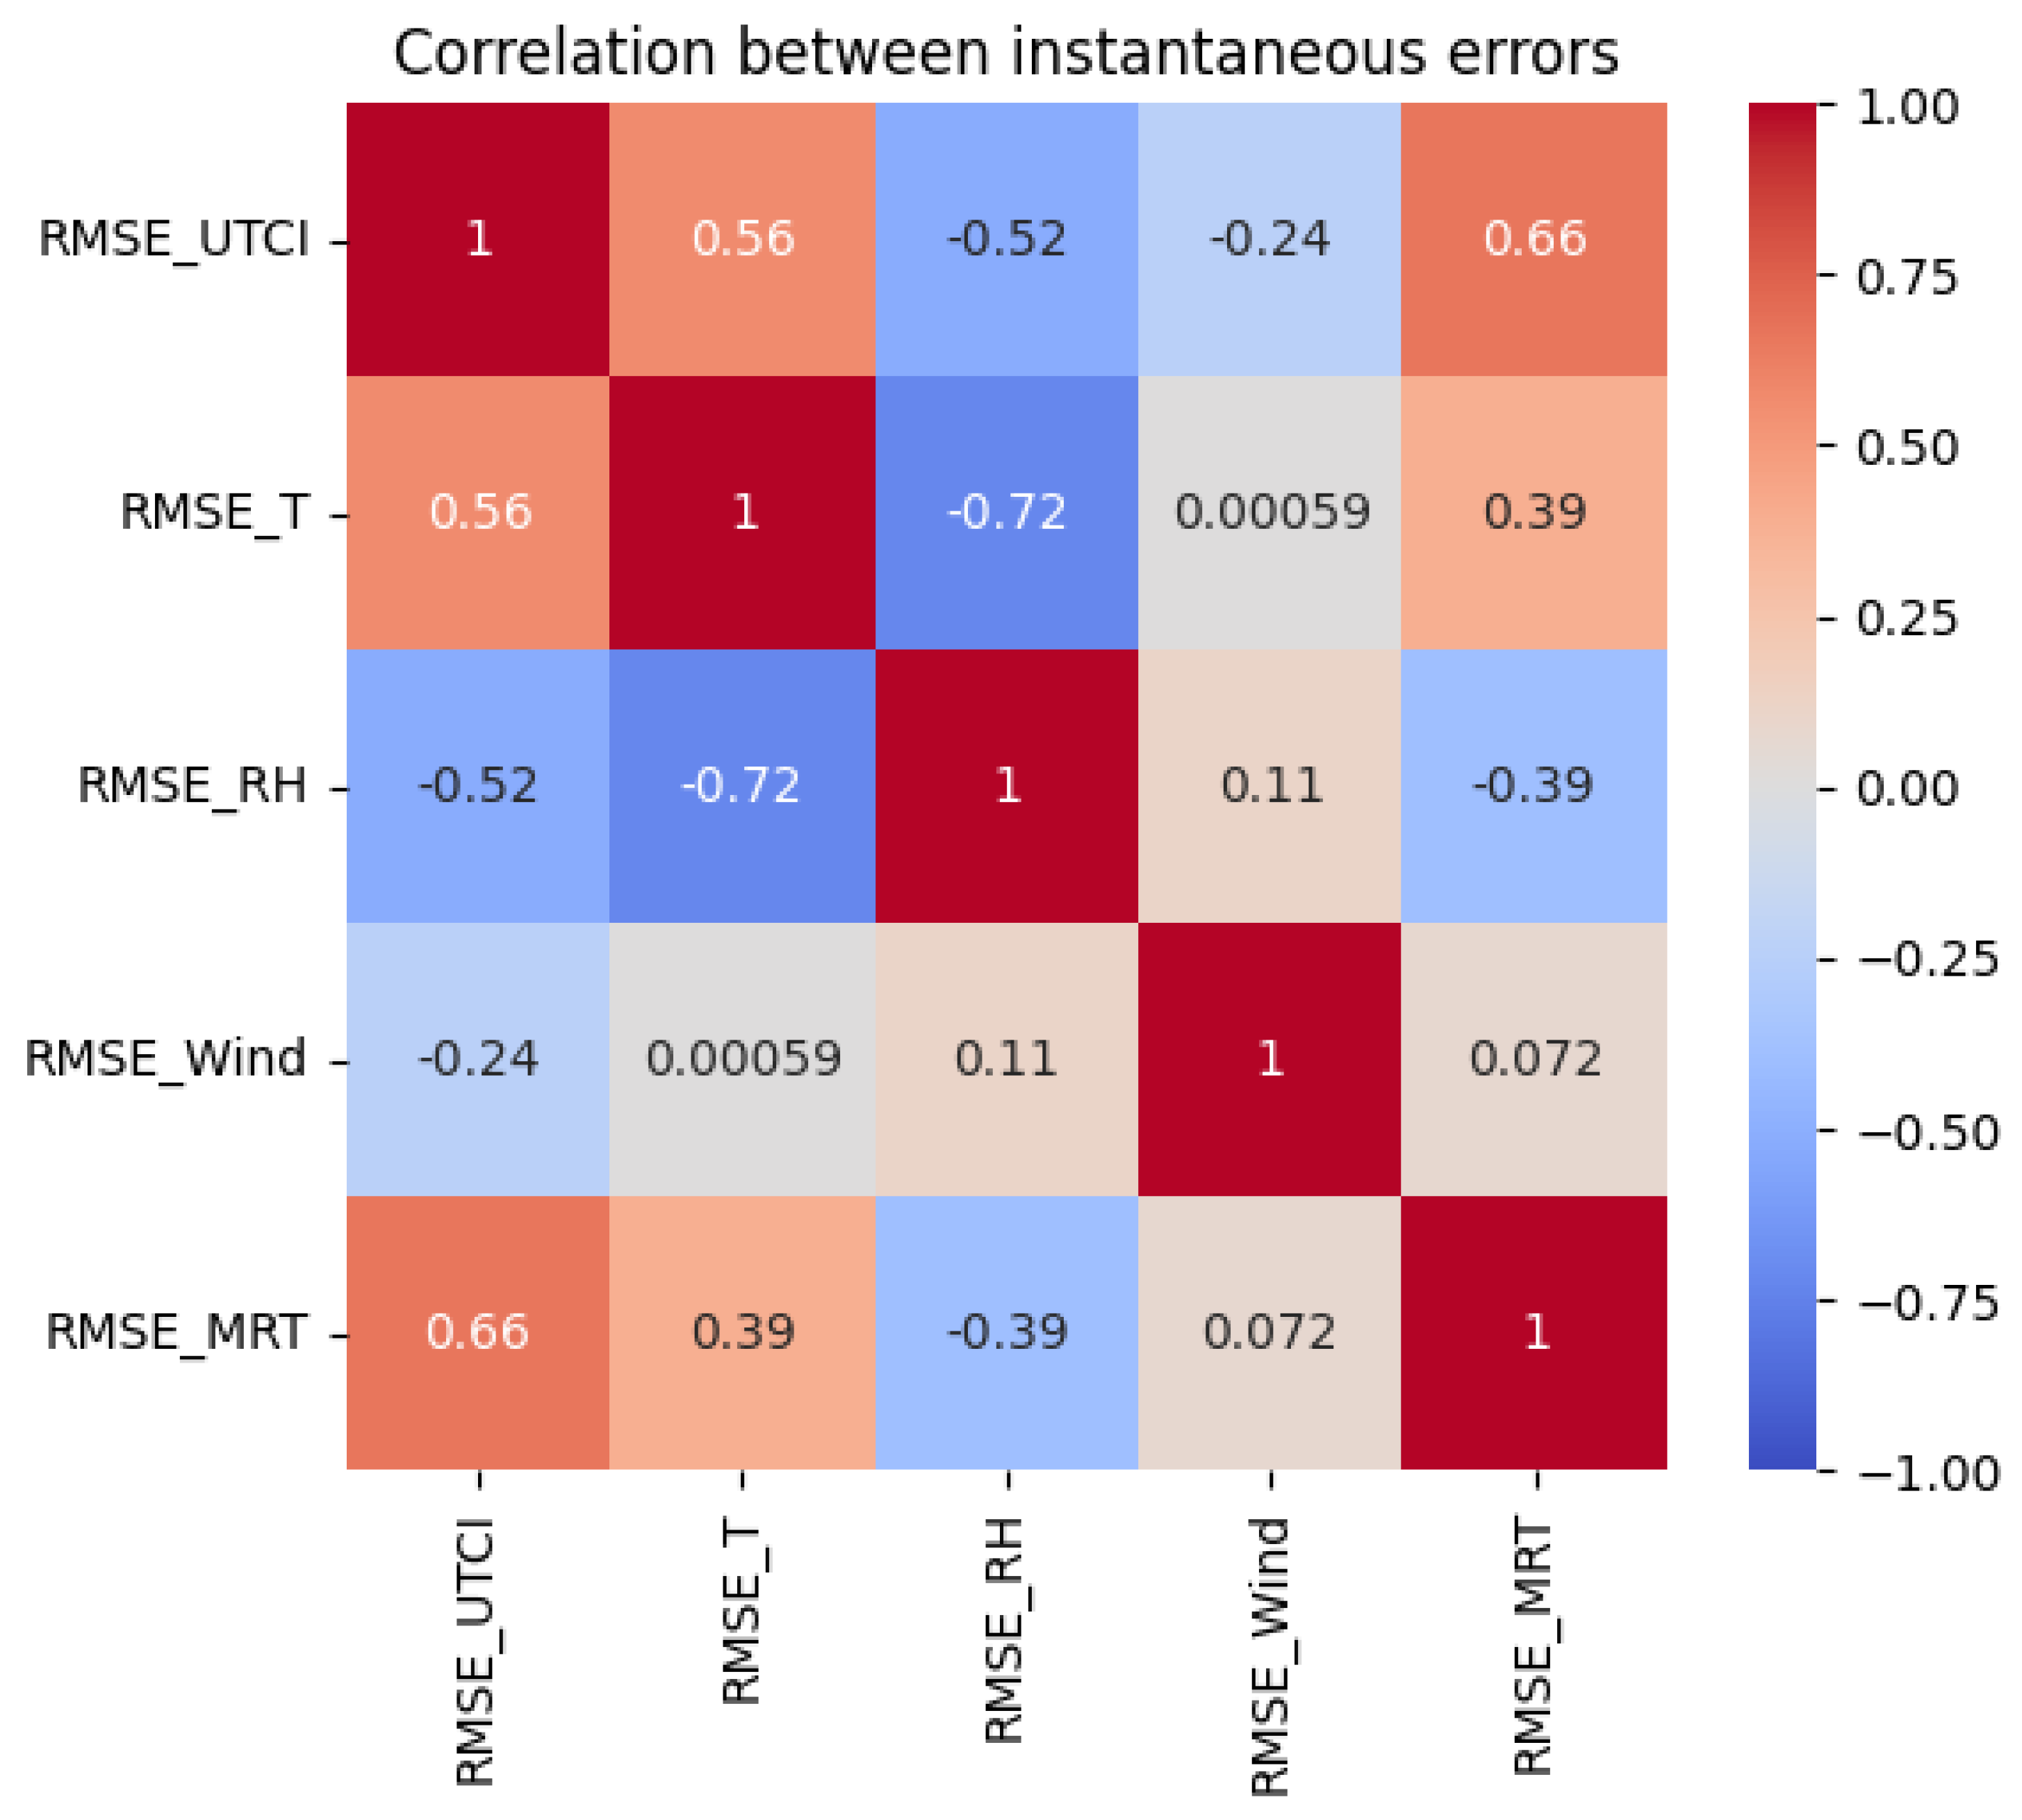
Pearson correlation coefficients were first calculated to identify relationships between errors in microclimatic variables and UTCI error. A multiple linear regression model was then fitted using UTCI error as the dependent variable and errors in air temperature, relative humidity, wind speed, and MRT as explanatory variables. The regression model was estimated using ordinary least squares (OLS). To compare the relative importance of predictors independently of their units, a standardized regression analysis was also performed after z-score normalization of all variables.
Because the UTCI formulation is intrinsically non-linear, the multiple linear regression should be interpreted as a first-order approximation of the local relationships between microclimate simulation errors and UTCI errors over the range of meteorological conditions observed during the field campaign. Its objective is to identify the relative influence of each predictor rather than to reproduce the complete non-linear UTCI formulation.
2.5. Sensitivity Analysis Methodology
To better understand the sources of uncertainty in ENVI-met simulations, a sensitivity analysis was conducted focusing on modelling assumptions known to influence microclimate predictions in urban environments. The analysis specifically investigated the influence of wind boundary conditions, urban roughness representation, and model initialization (spin-up period).
A baseline simulation configuration was first defined using the meteorological forcing data provided by the Météo-France weather station located near Gillot Airport, without any preprocessing of the incoming wind speed. This baseline configuration reflects the standard ENVI-met workflow when only regional meteorological observations are available. Sensitivity tests were then performed to evaluate whether introducing urban roughness corrections to the boundary forcing improves the model performance.
Three sensitivity experiments were conducted. (1) First, to evaluate the influence of wind forcing at neighbourhood scale, two alternative approaches were tested in addition to the baseline configuration: a nested modelling approach and an empirical correction of wind speed based on urban roughness effects. (2) Spin-up period test.
2.5.1. Nested Modelling Approach
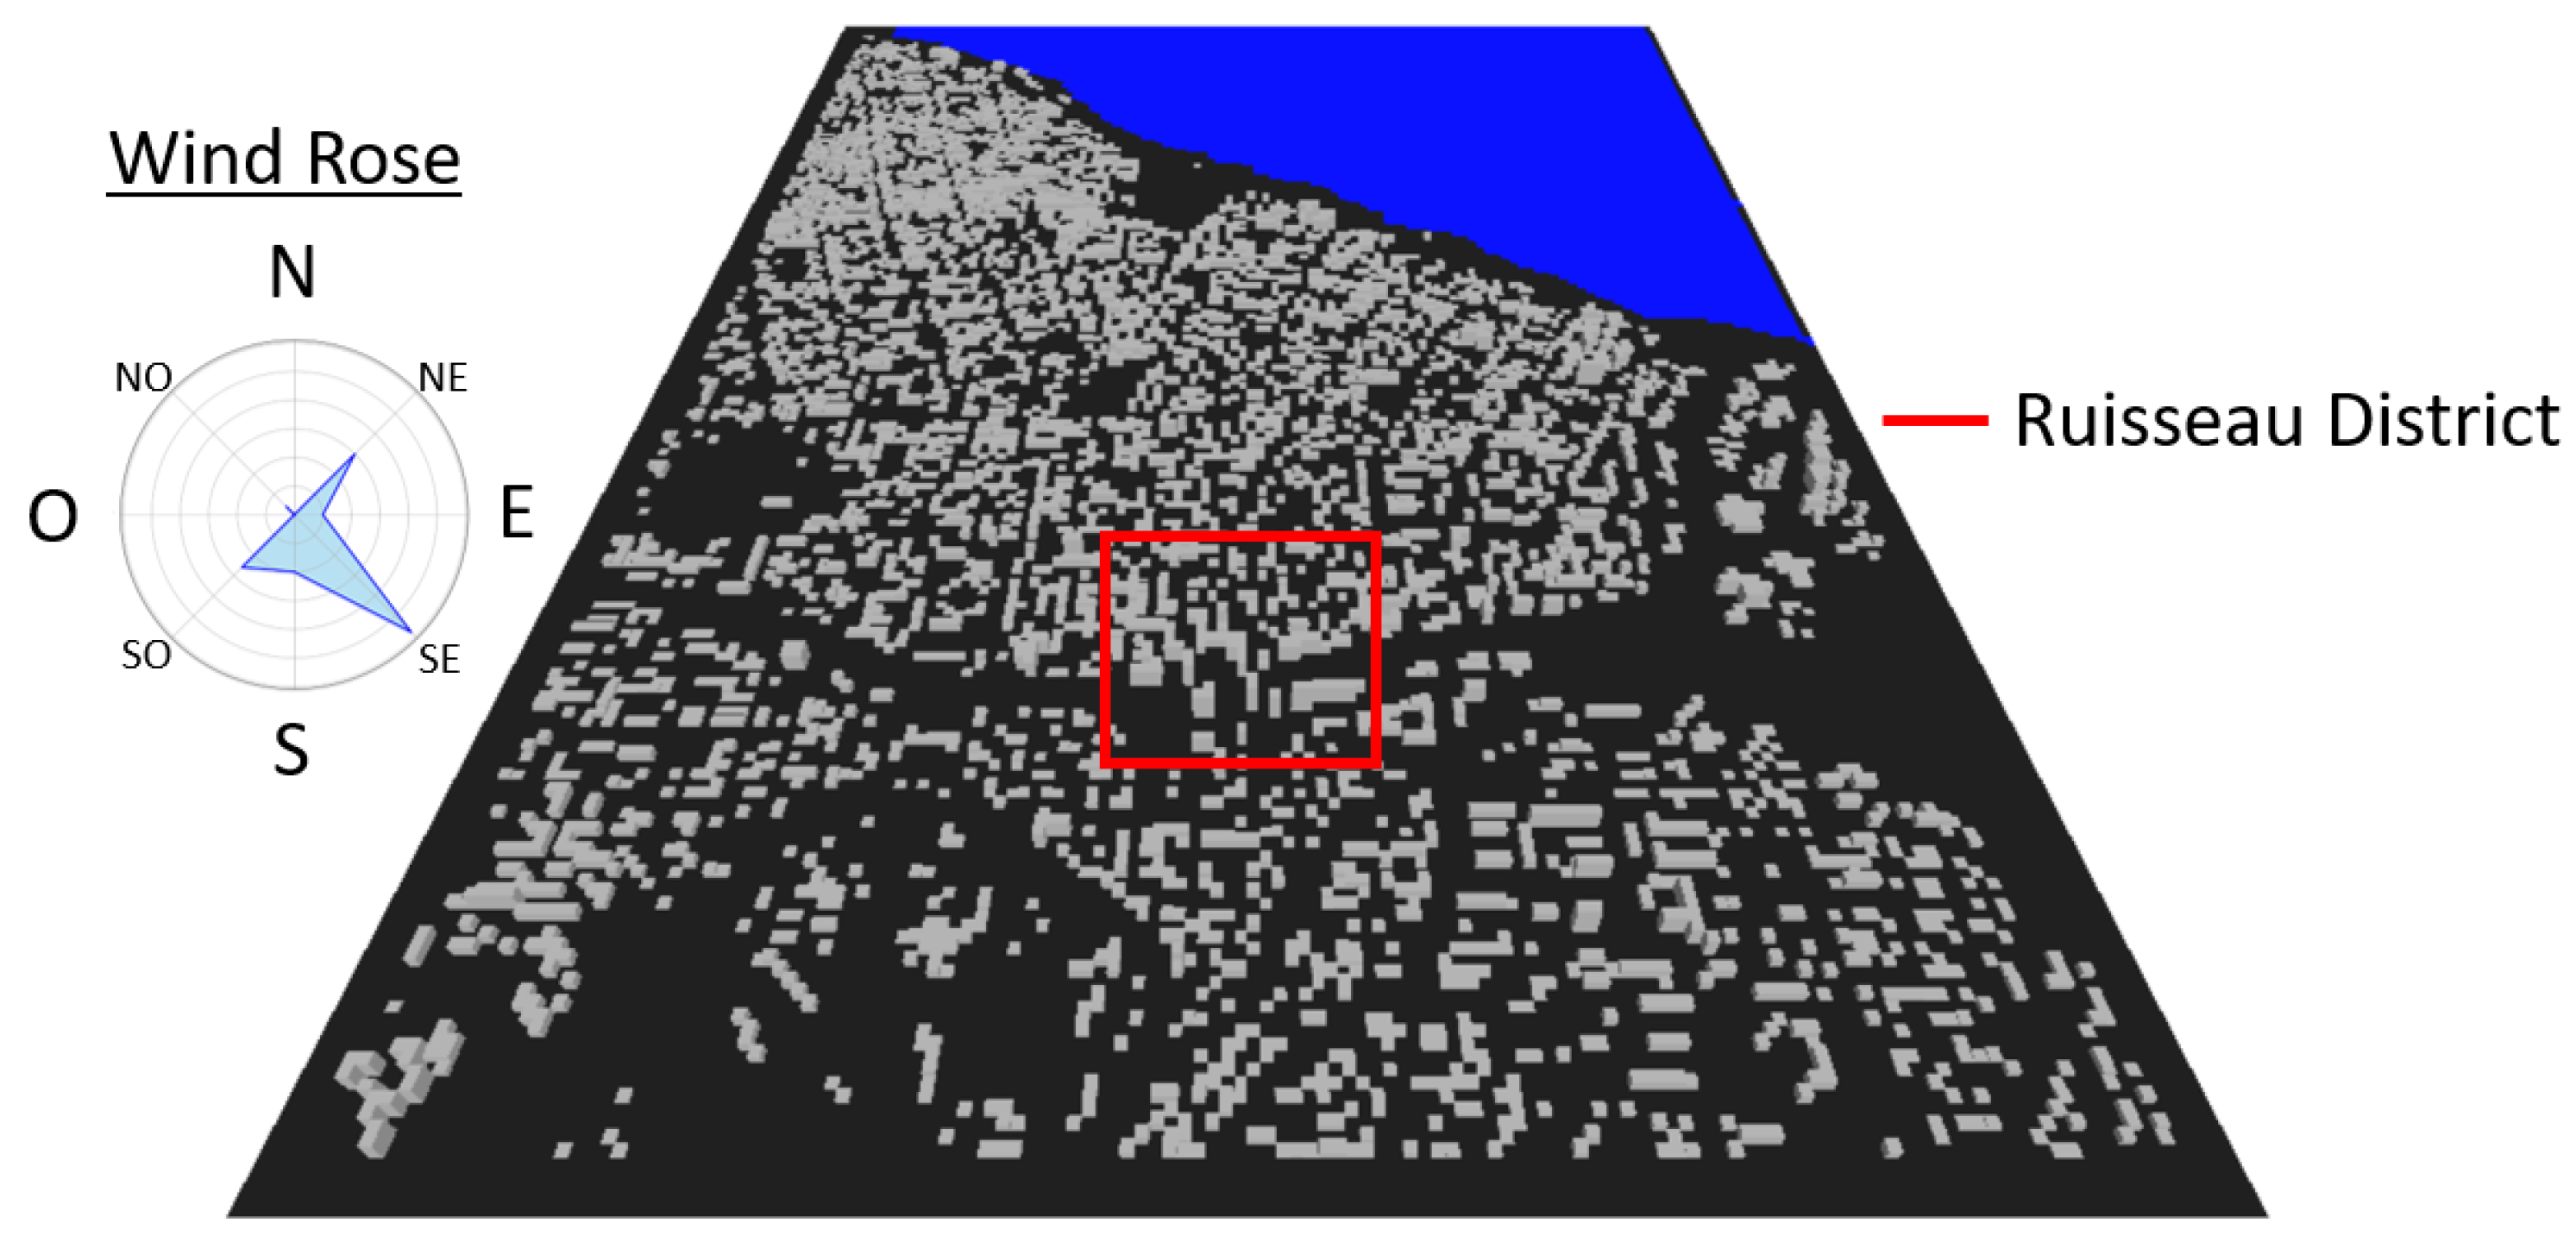
A parent ENVI-met model was developed at mesoscale in order to better represent the influence of surrounding urban morphology on airflow before simulating the neighbourhood-scale domain. The parent model covers an area of approximately 1960 m × 2786 m with a horizontal grid resolution of 14 m × 14 m (
Figure 4). The study district was positioned near the centre of this domain to account for wind inflow from multiple directions.
This configuration was chosen based on the wind rose recorded at the Gillot weather station, which indicates dominant winds from the South-East but also contributions from the South-West and North-East. Placing the district at the centre of the parent domain allows the surrounding urban roughness to influence airflow development regardless of wind direction.
A 72-h simulation was performed on the parent domain using meteorological forcing data from the Gillot weather station. At the end of this simulation, wind speed values were extracted along the boundaries of the neighbourhood domain for each hourly timestep.
These extracted wind speeds were used to adjust the meteorological forcing file applied to the neighbourhood-scale model. Wind directions were kept unchanged, while wind speed values were modified according to the dominant wind direction at each timestep. For example, when the dominant wind originated from the North, wind speed values were averaged along the North boundary of the parent domain. For South-East wind conditions, values from the South and East boundaries were averaged before being used as input for the local simulation.
This procedure allows the influence of surrounding urban roughness on wind forcing to be partially incorporated into the neighbourhood-scale simulation.
2.5.2. Urban Roughness Influence on Wind Input
In addition to the nested modelling approach, an empirical correction of wind speed was applied to meteorological forcing data in order to account for wind attenuation within the urban canopy layer and altitude differences between the reference weather station and the study district.
Previous studies have shown that wind speed measured in open terrain is typically reduced by 50–60% within dense urban environments due to surface roughness and building-induced drag [
44,
45]. Empirical relationships have been proposed to describe this attenuation in different contexts [
46,
47].
In the present study, a site-specific empirical coefficient was derived from field measurements and simulation results obtained during the October monitoring period. The following relationship was used to correct the wind forcing data:
where
represents wind speed measured at 10 m height at the Gillot meteorological station and
represents the estimated wind speed at the same height within the Le Ruisseau district.
This coefficient accounts for both the influence of urban roughness and the altitude difference between the Gillot weather station (approximately 5 m above sea level) and the study district (approximately 30 m above sea level). The correction was applied directly to hourly wind speed values in the meteorological forcing file used by ENVI-met, while wind direction was kept unchanged.
This empirical correction represents a first-order approximation of the combined effects of urban roughness and altitude on the incoming wind field. A single attenuation coefficient was adopted for all simulation periods and therefore does not account for possible variations related to wind direction, atmospheric stability, or seasonal changes in the regional flow. Nevertheless, the objective of this approach was not to develop a universal wind correction model, but rather to evaluate whether a simple roughness correction could improve ENVI-met performance under operational modelling conditions.
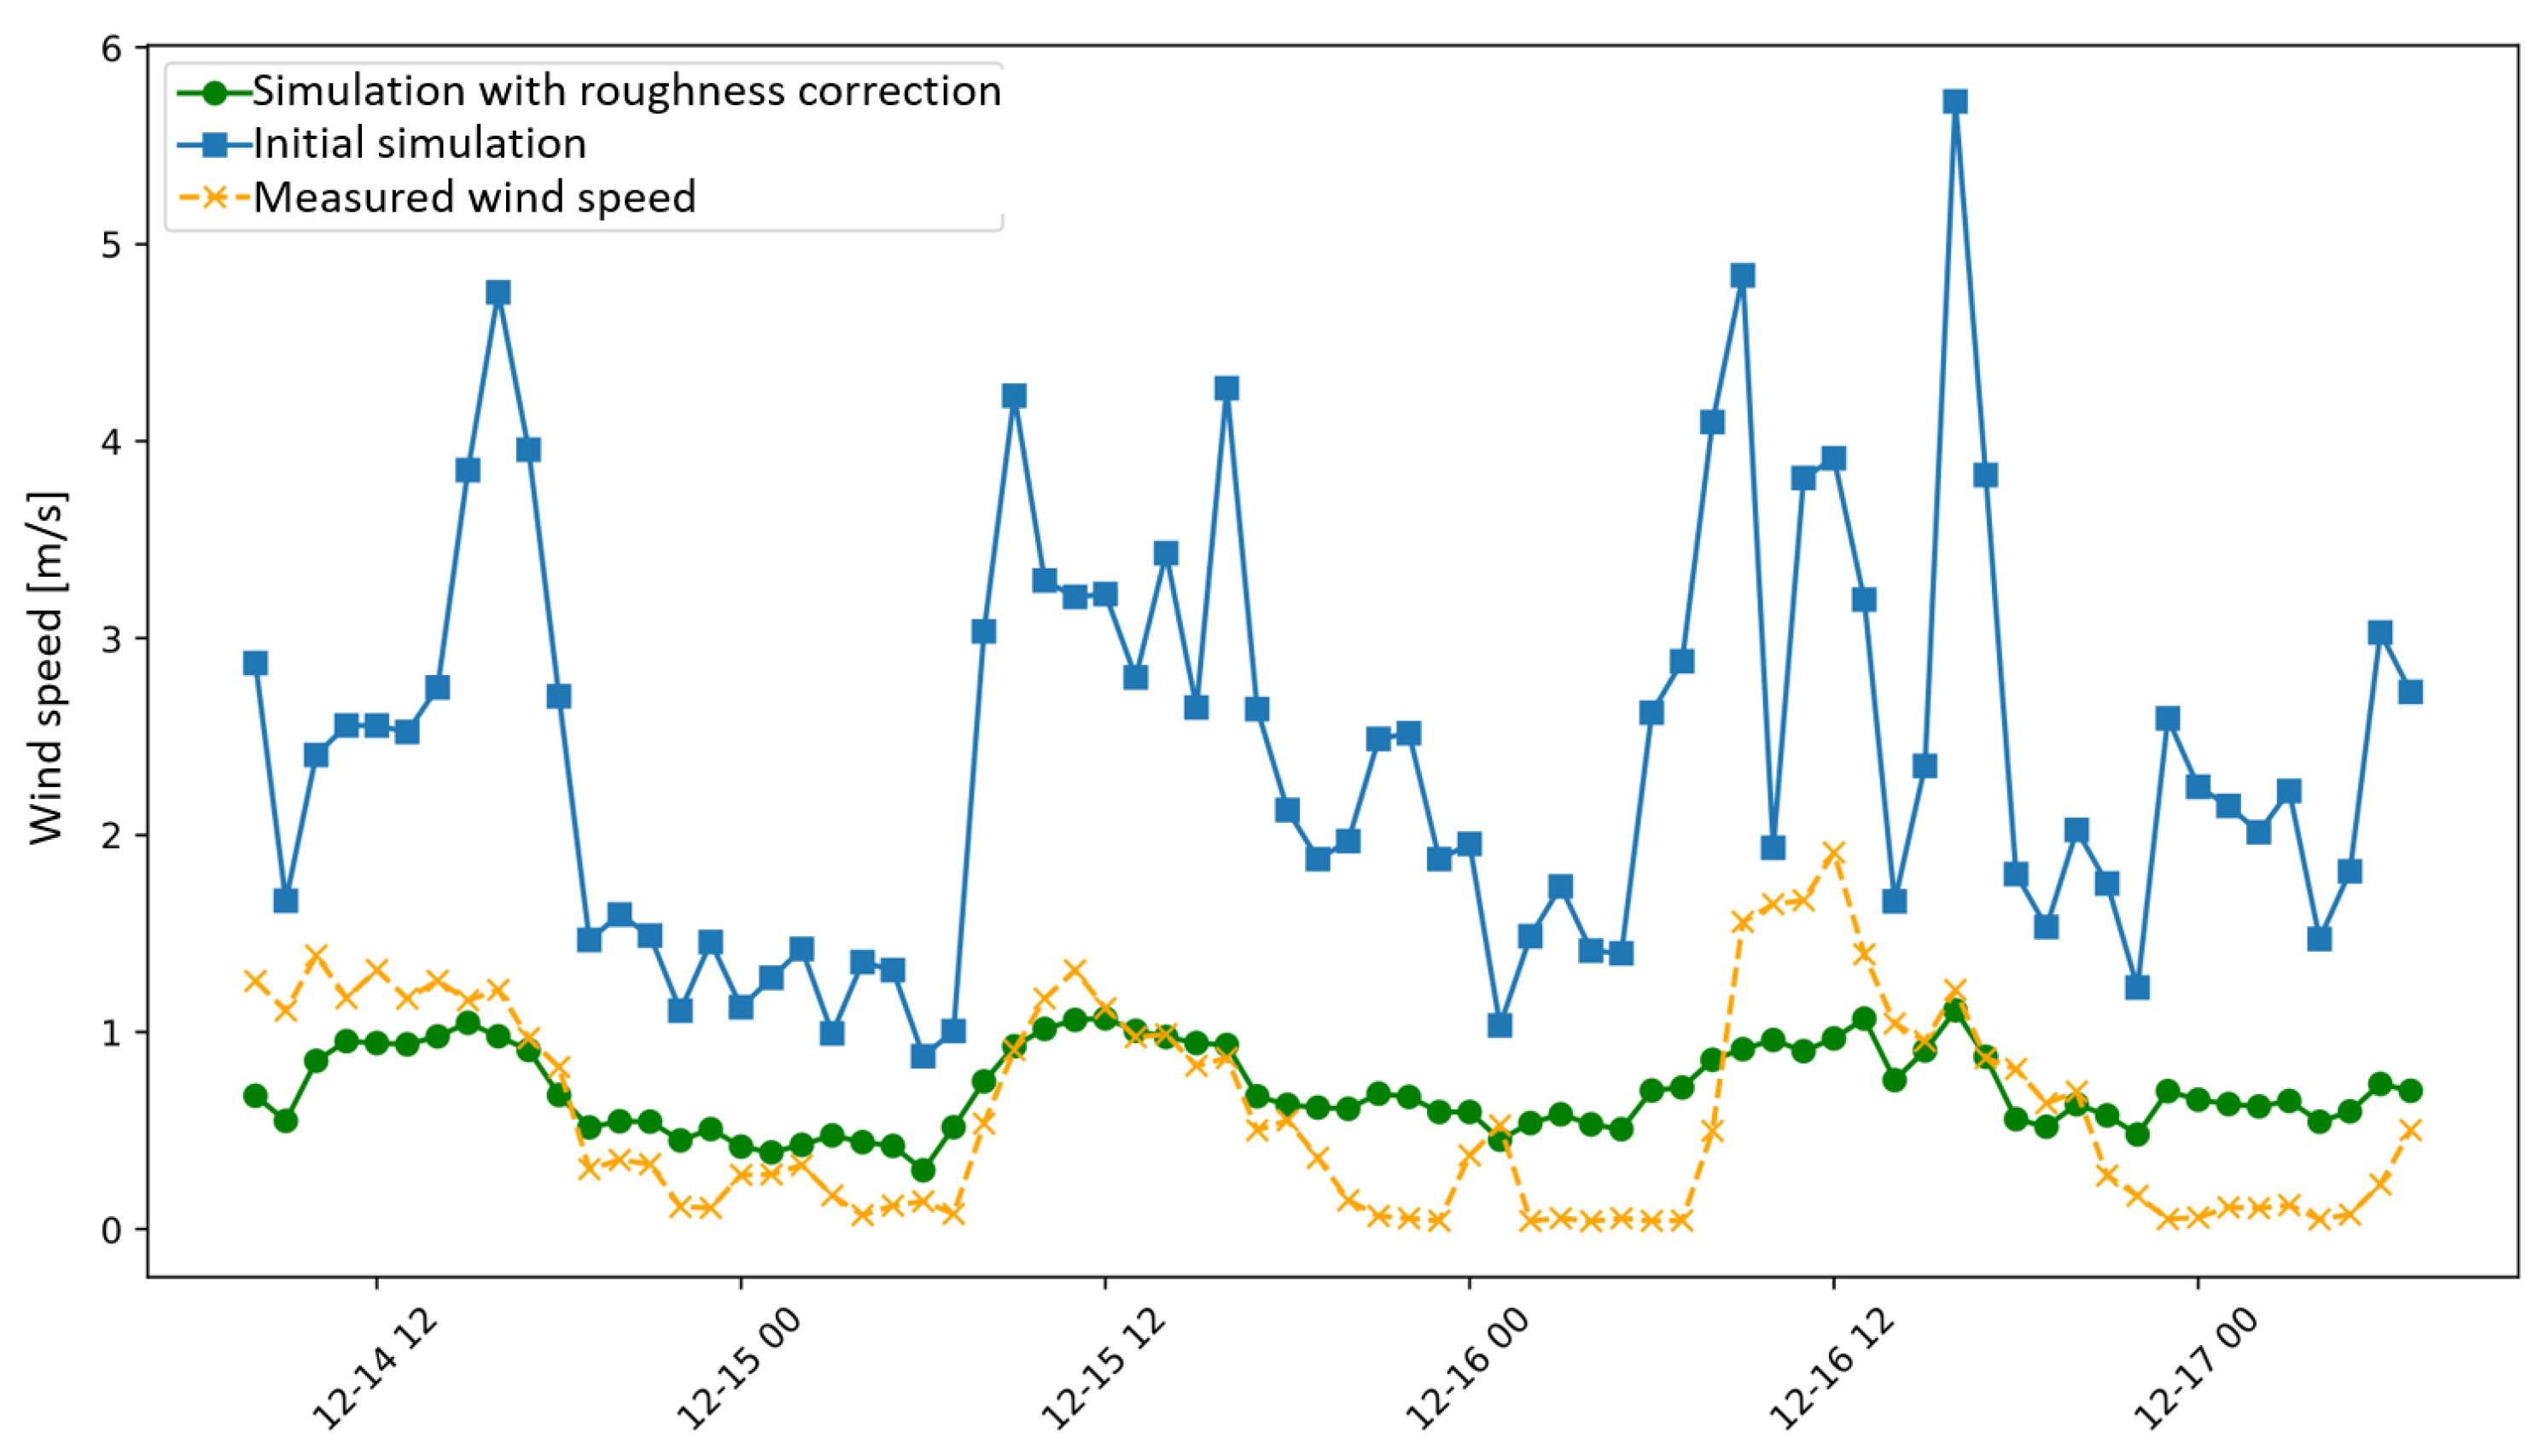
To evaluate the robustness of this empirical correction, the adjusted wind forcing data were applied to an independent 72-h simulation period (December case study) using the same model configuration.
2.5.3. Model Initialization (Spin-Up Period)
Because the baseline simulations were performed without a dedicated spin-up period, a specific sensitivity analysis was conducted to assess whether model initialization influences ENVI-met performance under the present full-forcing configuration. The influence of model initialization was evaluated through a dedicated sensitivity experiment focusing on the duration of the pre-initialization period. Three simulation configurations were tested using the same meteorological forcing conditions:
(1) simulation without pre-initialization (24-h simulation), (2) simulation with a 6-h spin-up period (30-h simulation), (3) simulation with a 24-h spin-up period (48-h simulation).
All simulations were conducted in full-forcing mode using meteorological data from the reference weather station. To ensure comparability between configurations, model performance was evaluated over the same 24-hour validation period, corresponding to the measurement window.
Simulation accuracy was assessed using the statistical indicators described in the Validation Methodology Section, focusing on air temperature and relative humidity.
4. Discussion
4.1. ENVI-Met Performance for Outdoor Thermal Comfort in Tropical Environments
The present study extends previous ENVI-met validation studies by combining a spatially distributed field validation, uncertainty propagation analysis, and dedicated sensitivity experiments within a single validation framework. While previous studies have generally focused on the agreement between simulated and observed microclimatic variables at one or a limited number of monitoring locations [
31,
48,
49], the present work additionally investigates the spatial variability of model performance, the propagation of simulation errors to outdoor thermal comfort indices, and the influence of key modelling assumptions on simulation accuracy.
4.1.1. Air Temperature and Relative Humidity
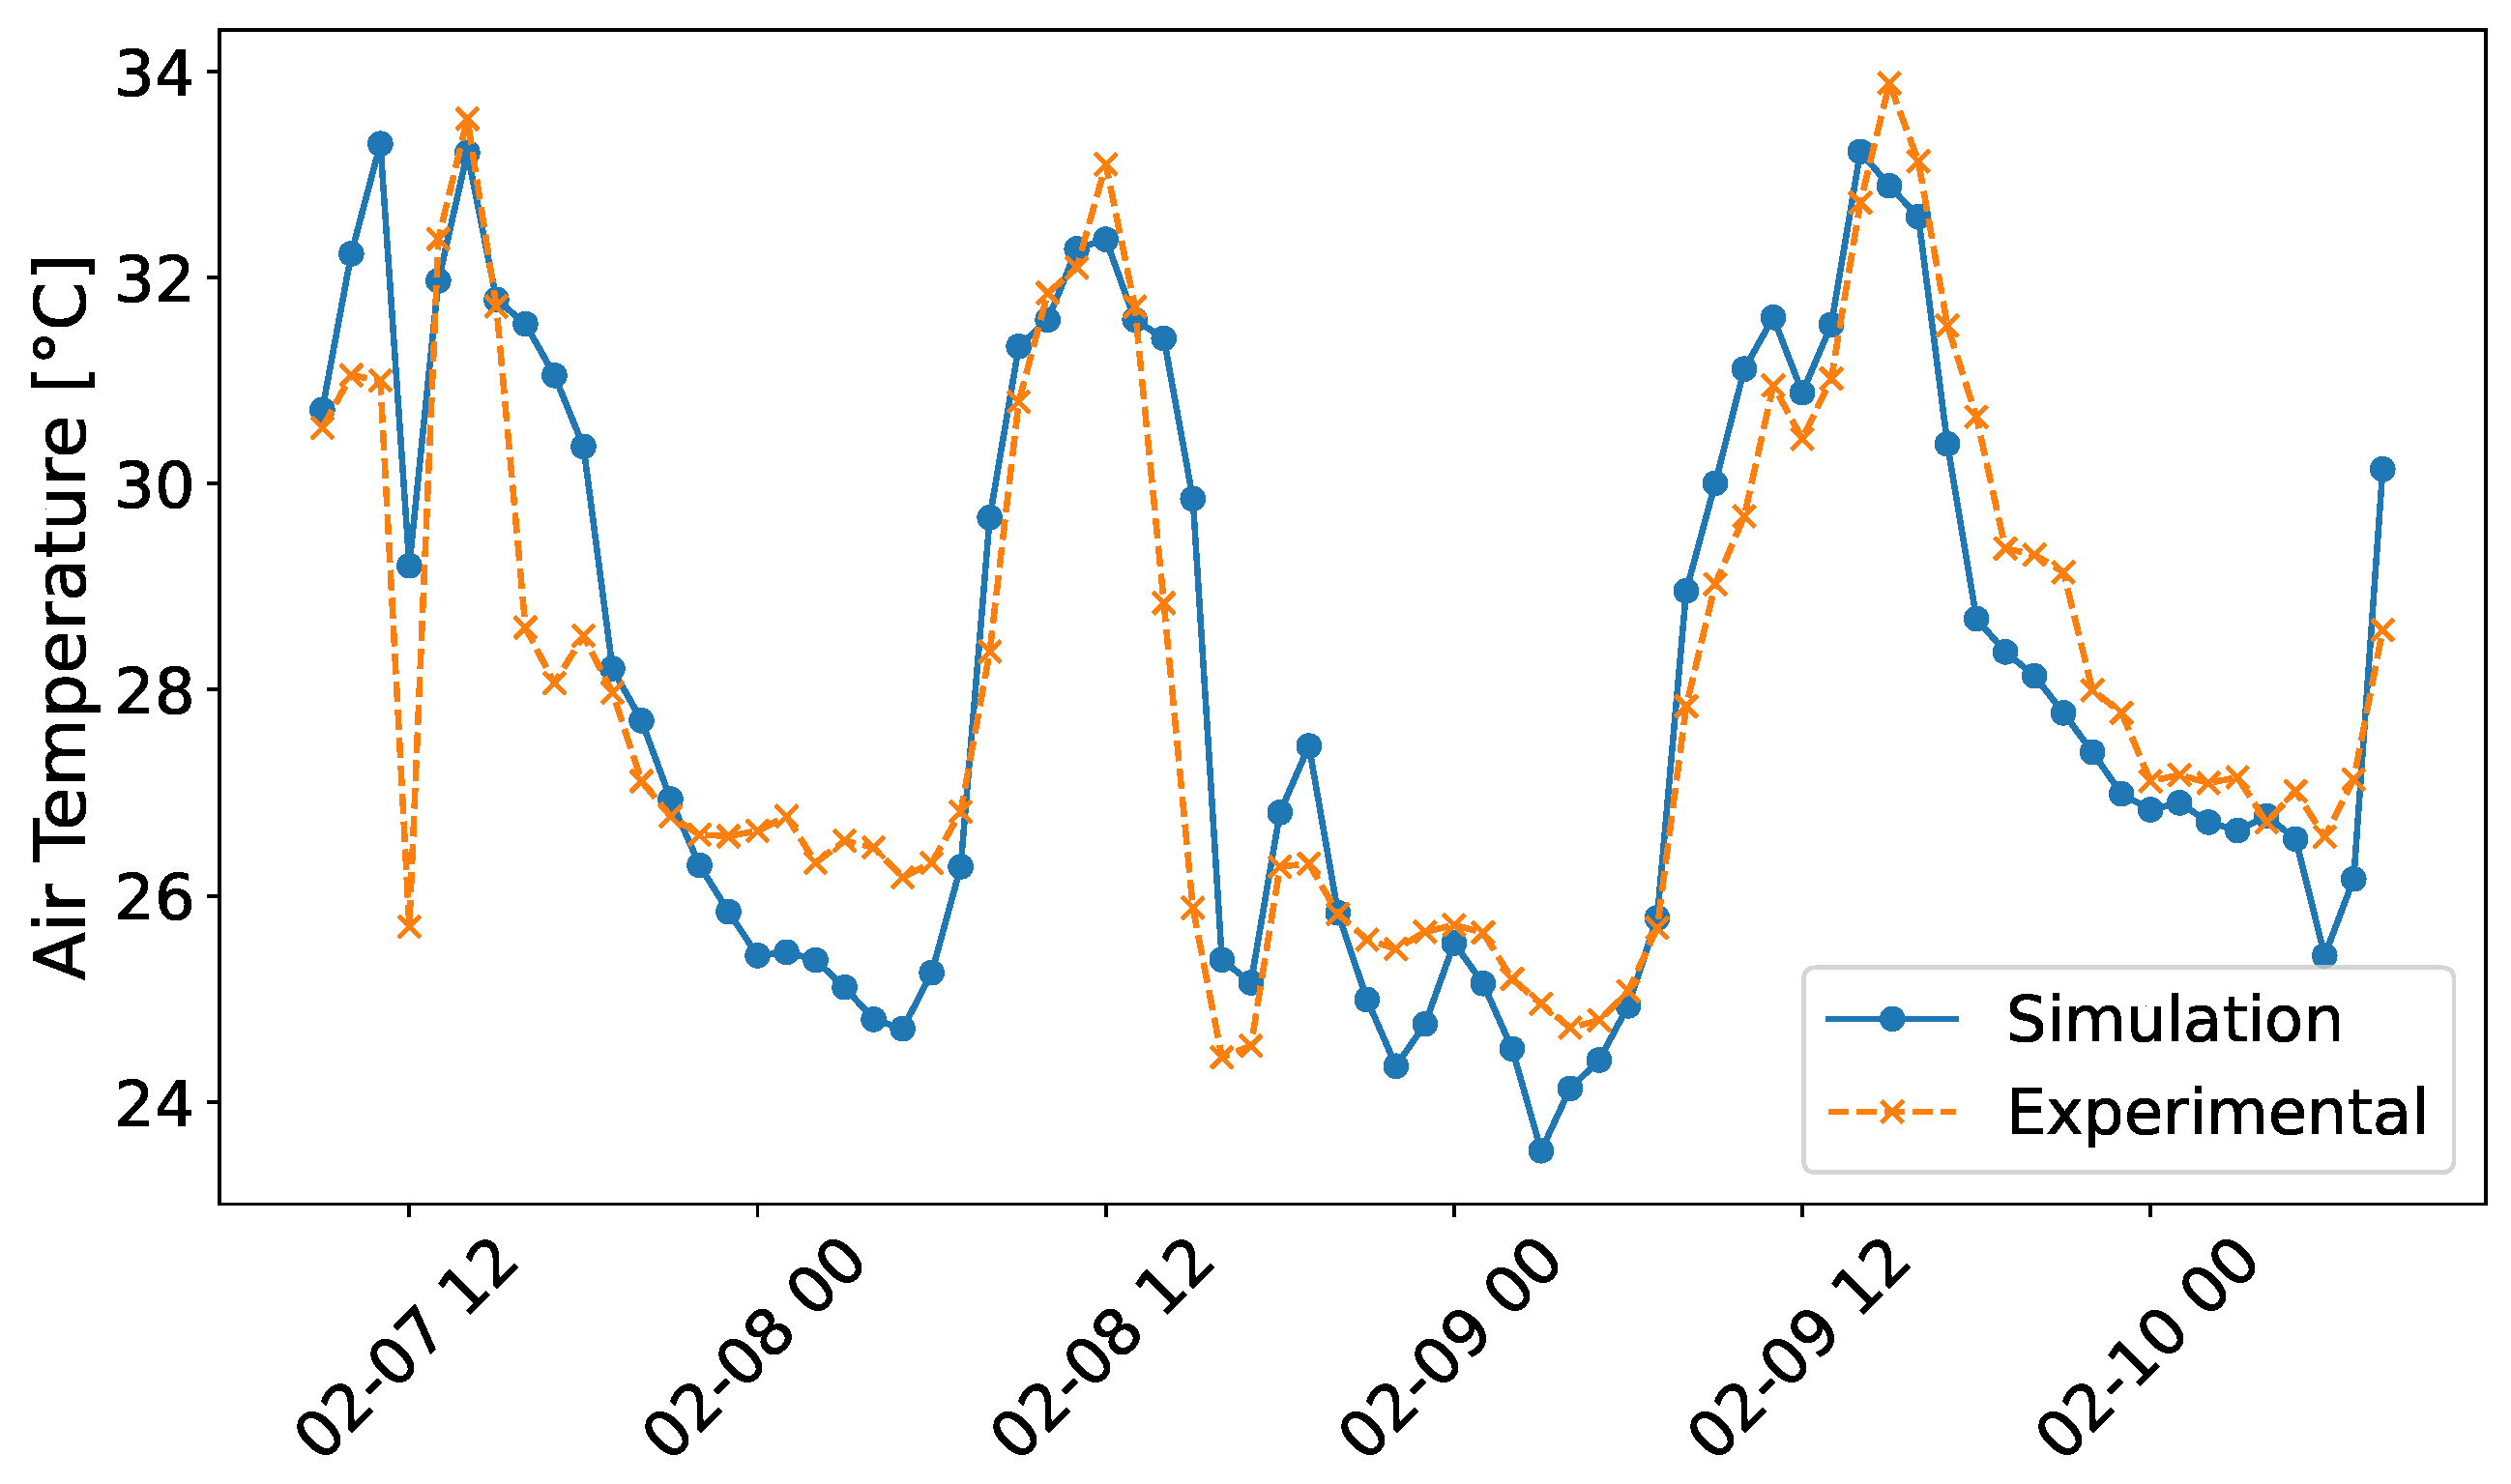
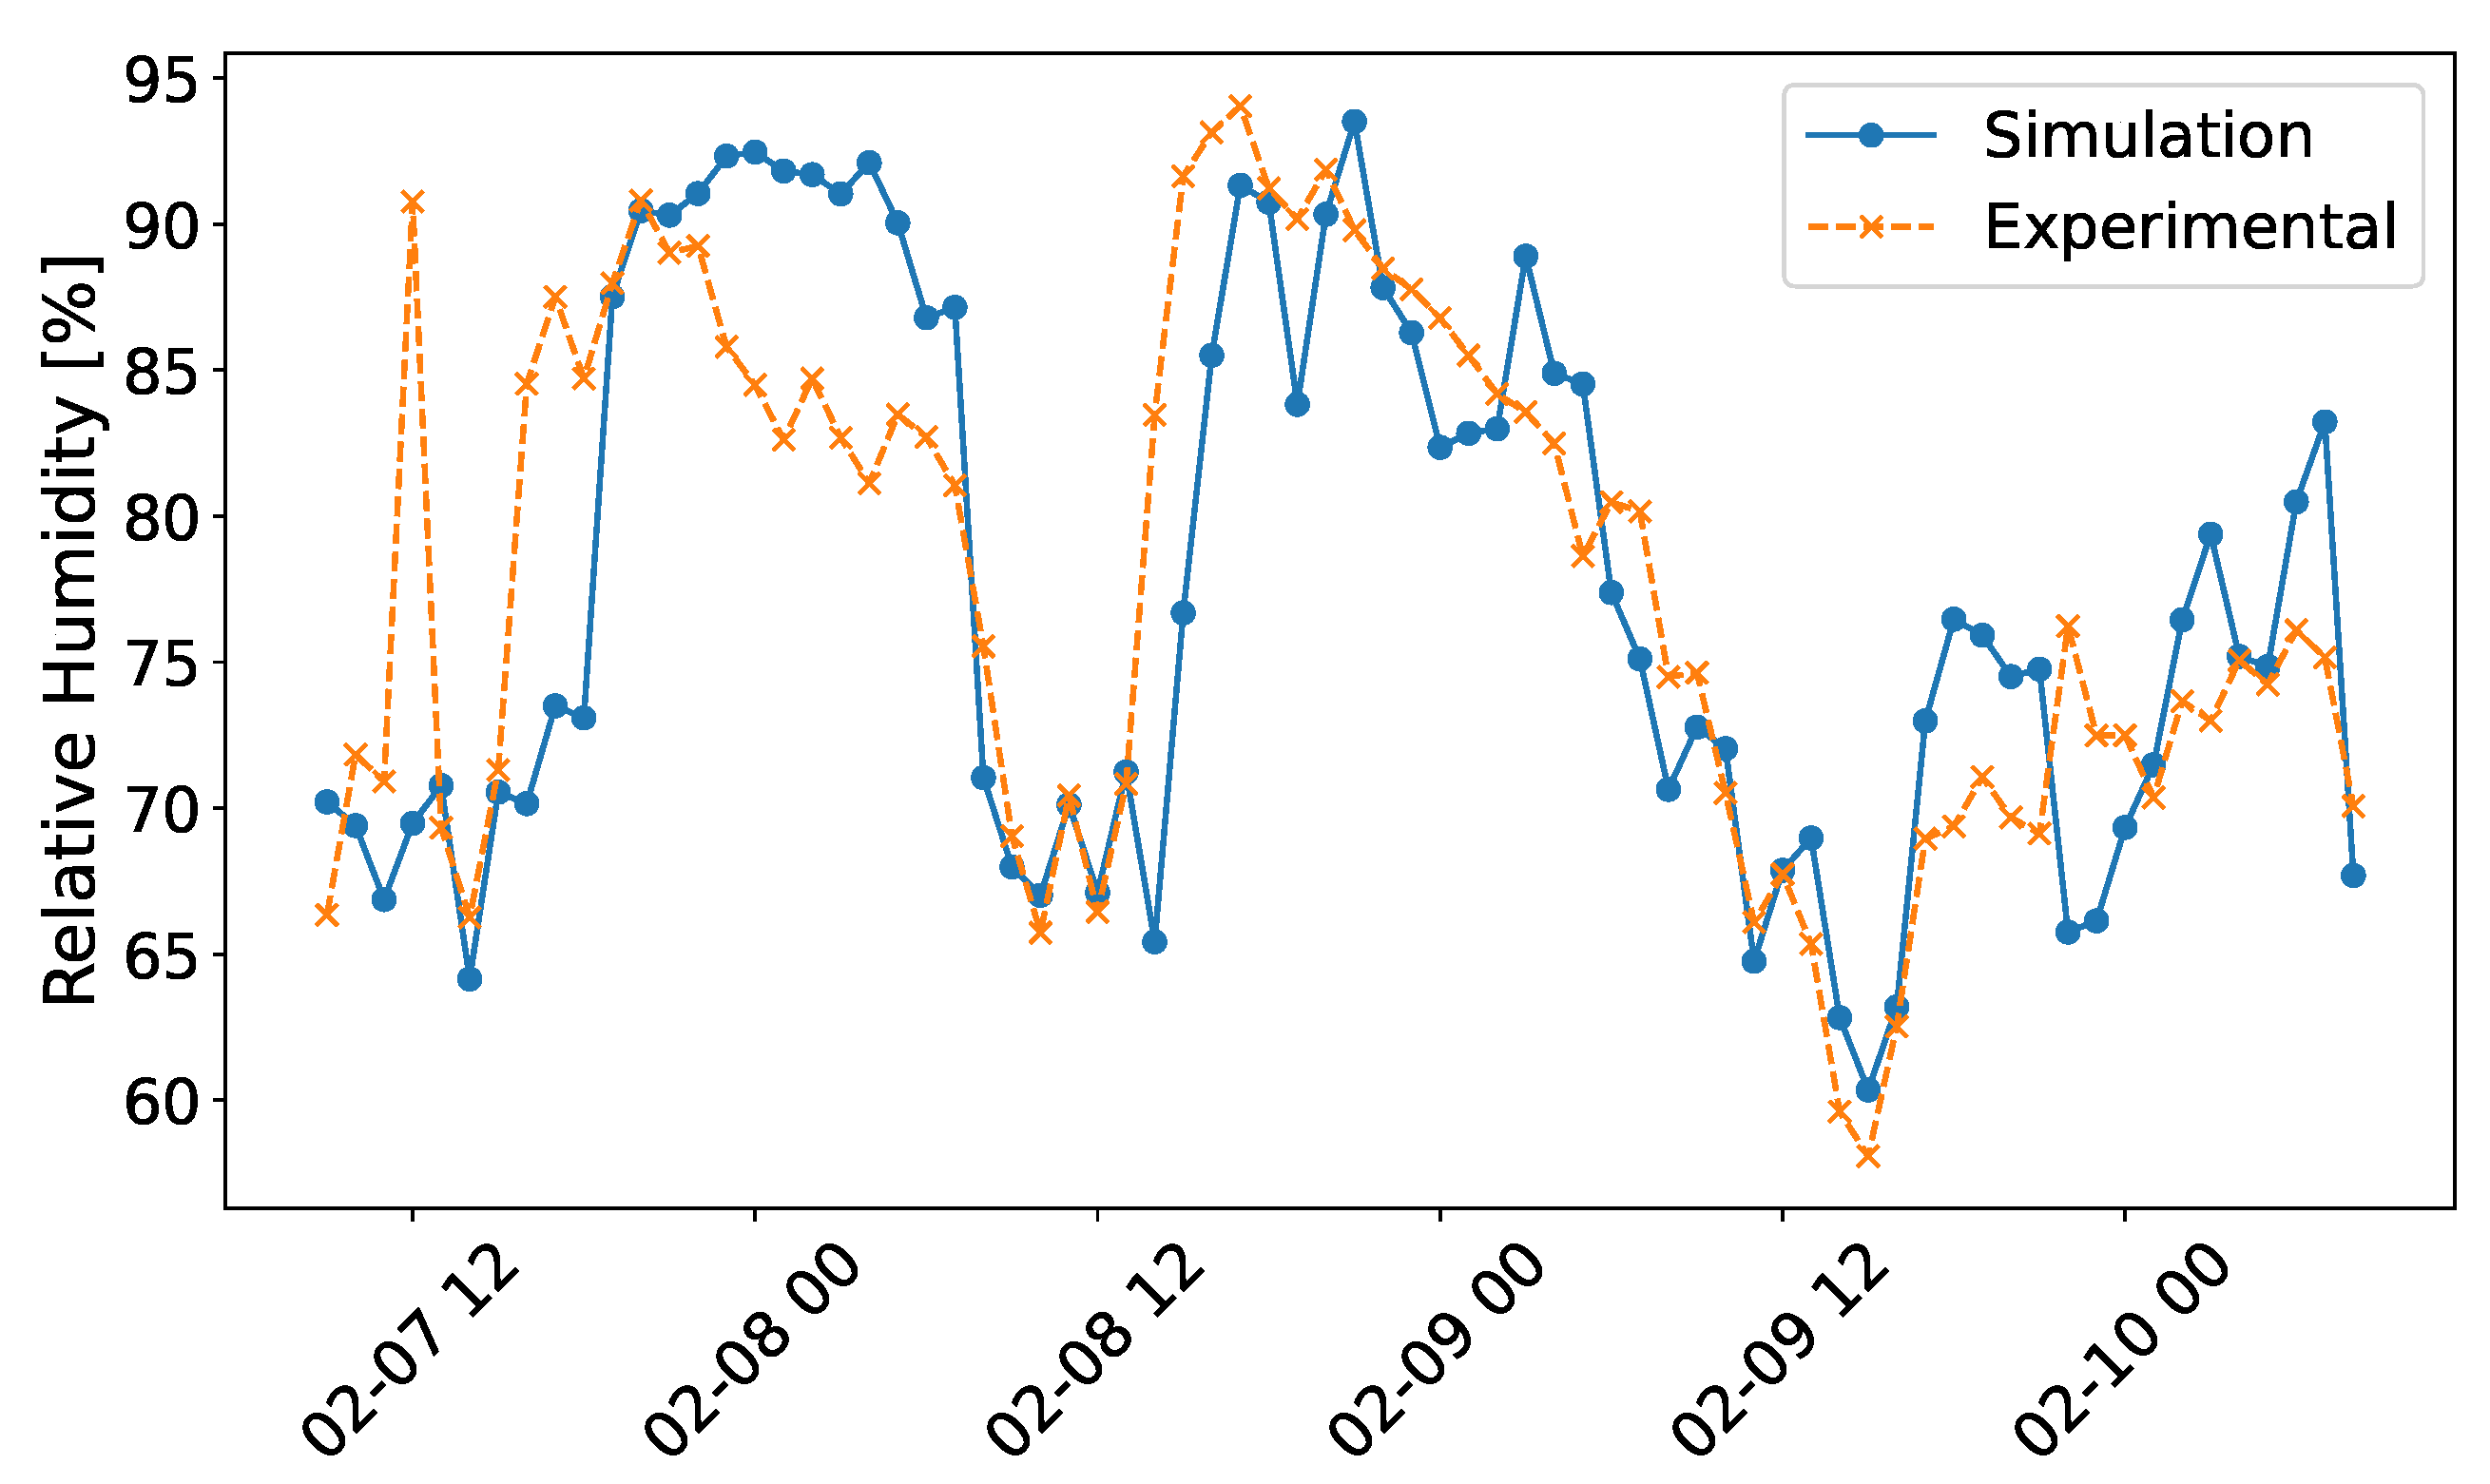
The results confirm that ENVI-met reproduces air temperature and relative humidity with good accuracy across the monitoring network, with RMSE values of approximately 1.2–1.5
C for air temperature and 5–7% for relative humidity. These values fall well within the range reported by previous validation studies conducted in various climatic contexts. Recent studies report air temperature RMSE values ranging from 0.37
C [
50] to 4.52
C [
51], with most investigations reporting values between 0.8 and 2
C [
24,
26,
28,
52]. Similarly, relative humidity RMSE values reported in the literature typically range between 1 and 9% [
9,
53,
54].
The agreement observed in the present study therefore confirms that ENVI-met remains robust for simulating neighbourhood-scale thermodynamic variables, even under hot and humid tropical conditions. This behaviour is consistent with previous studies suggesting that air temperature and humidity are primarily controlled by large-scale energy and moisture balances that are less sensitive to local geometric details than airflow or radiative exchanges.
4.1.2. Wind Speed
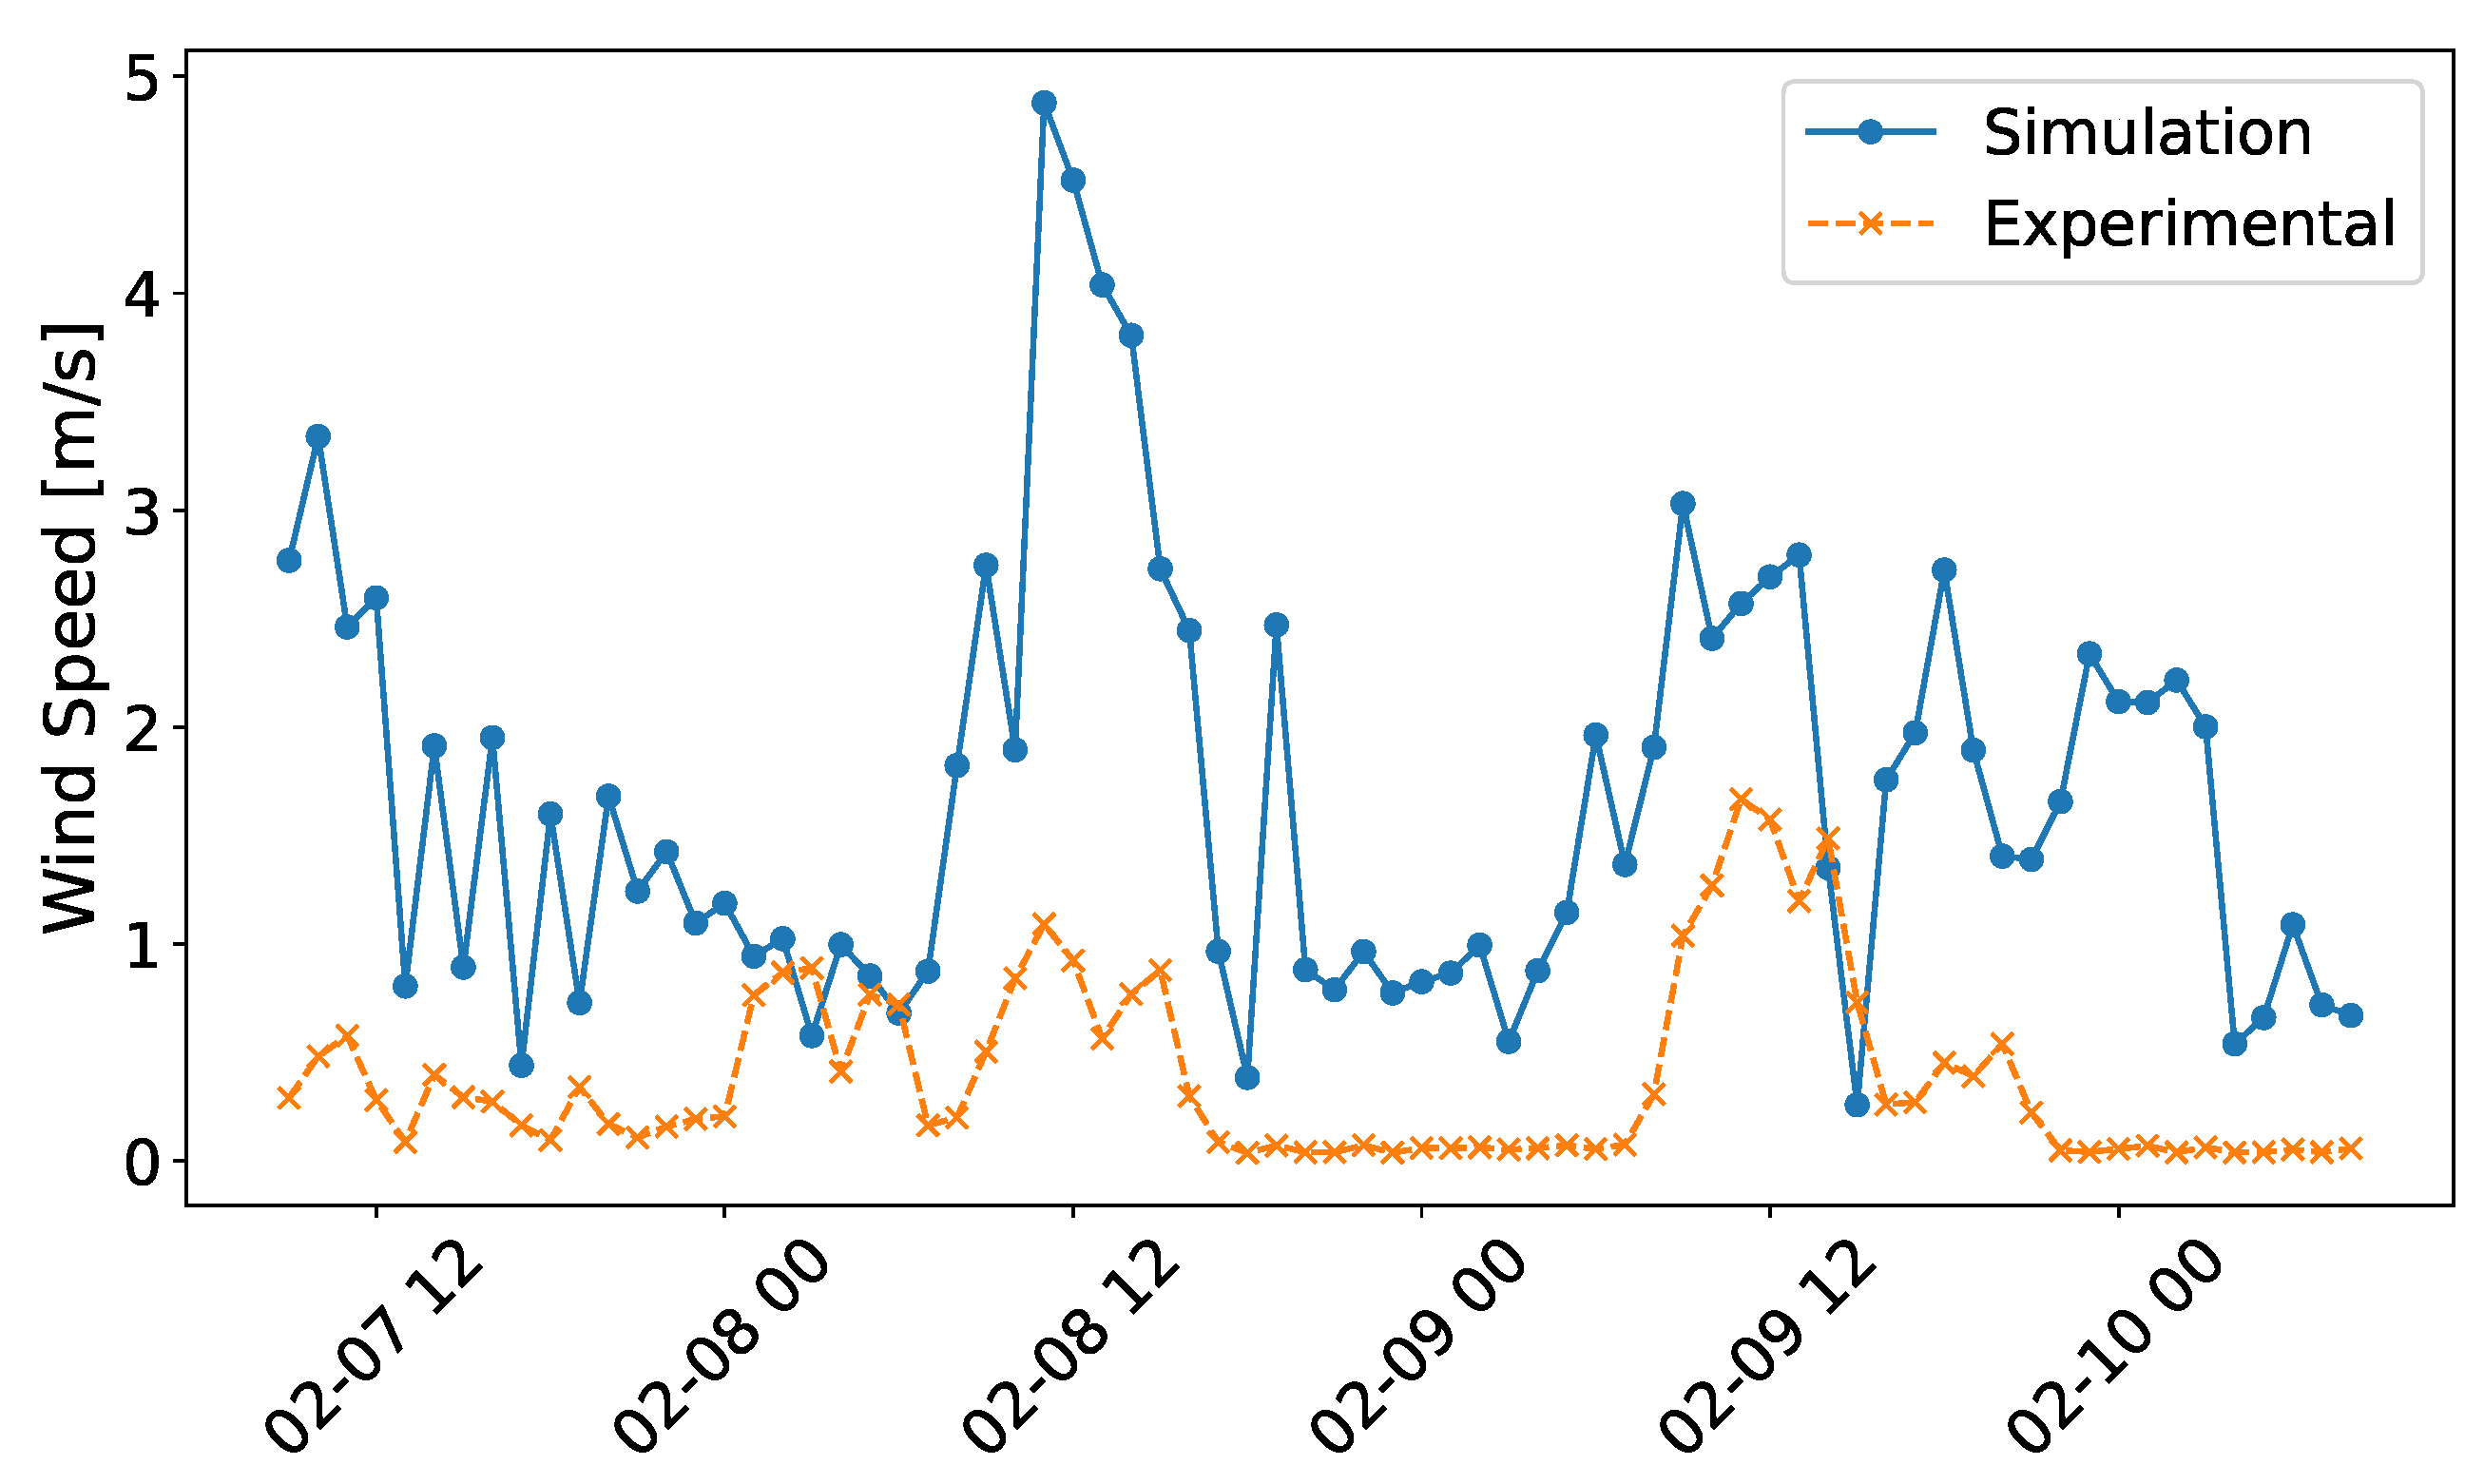
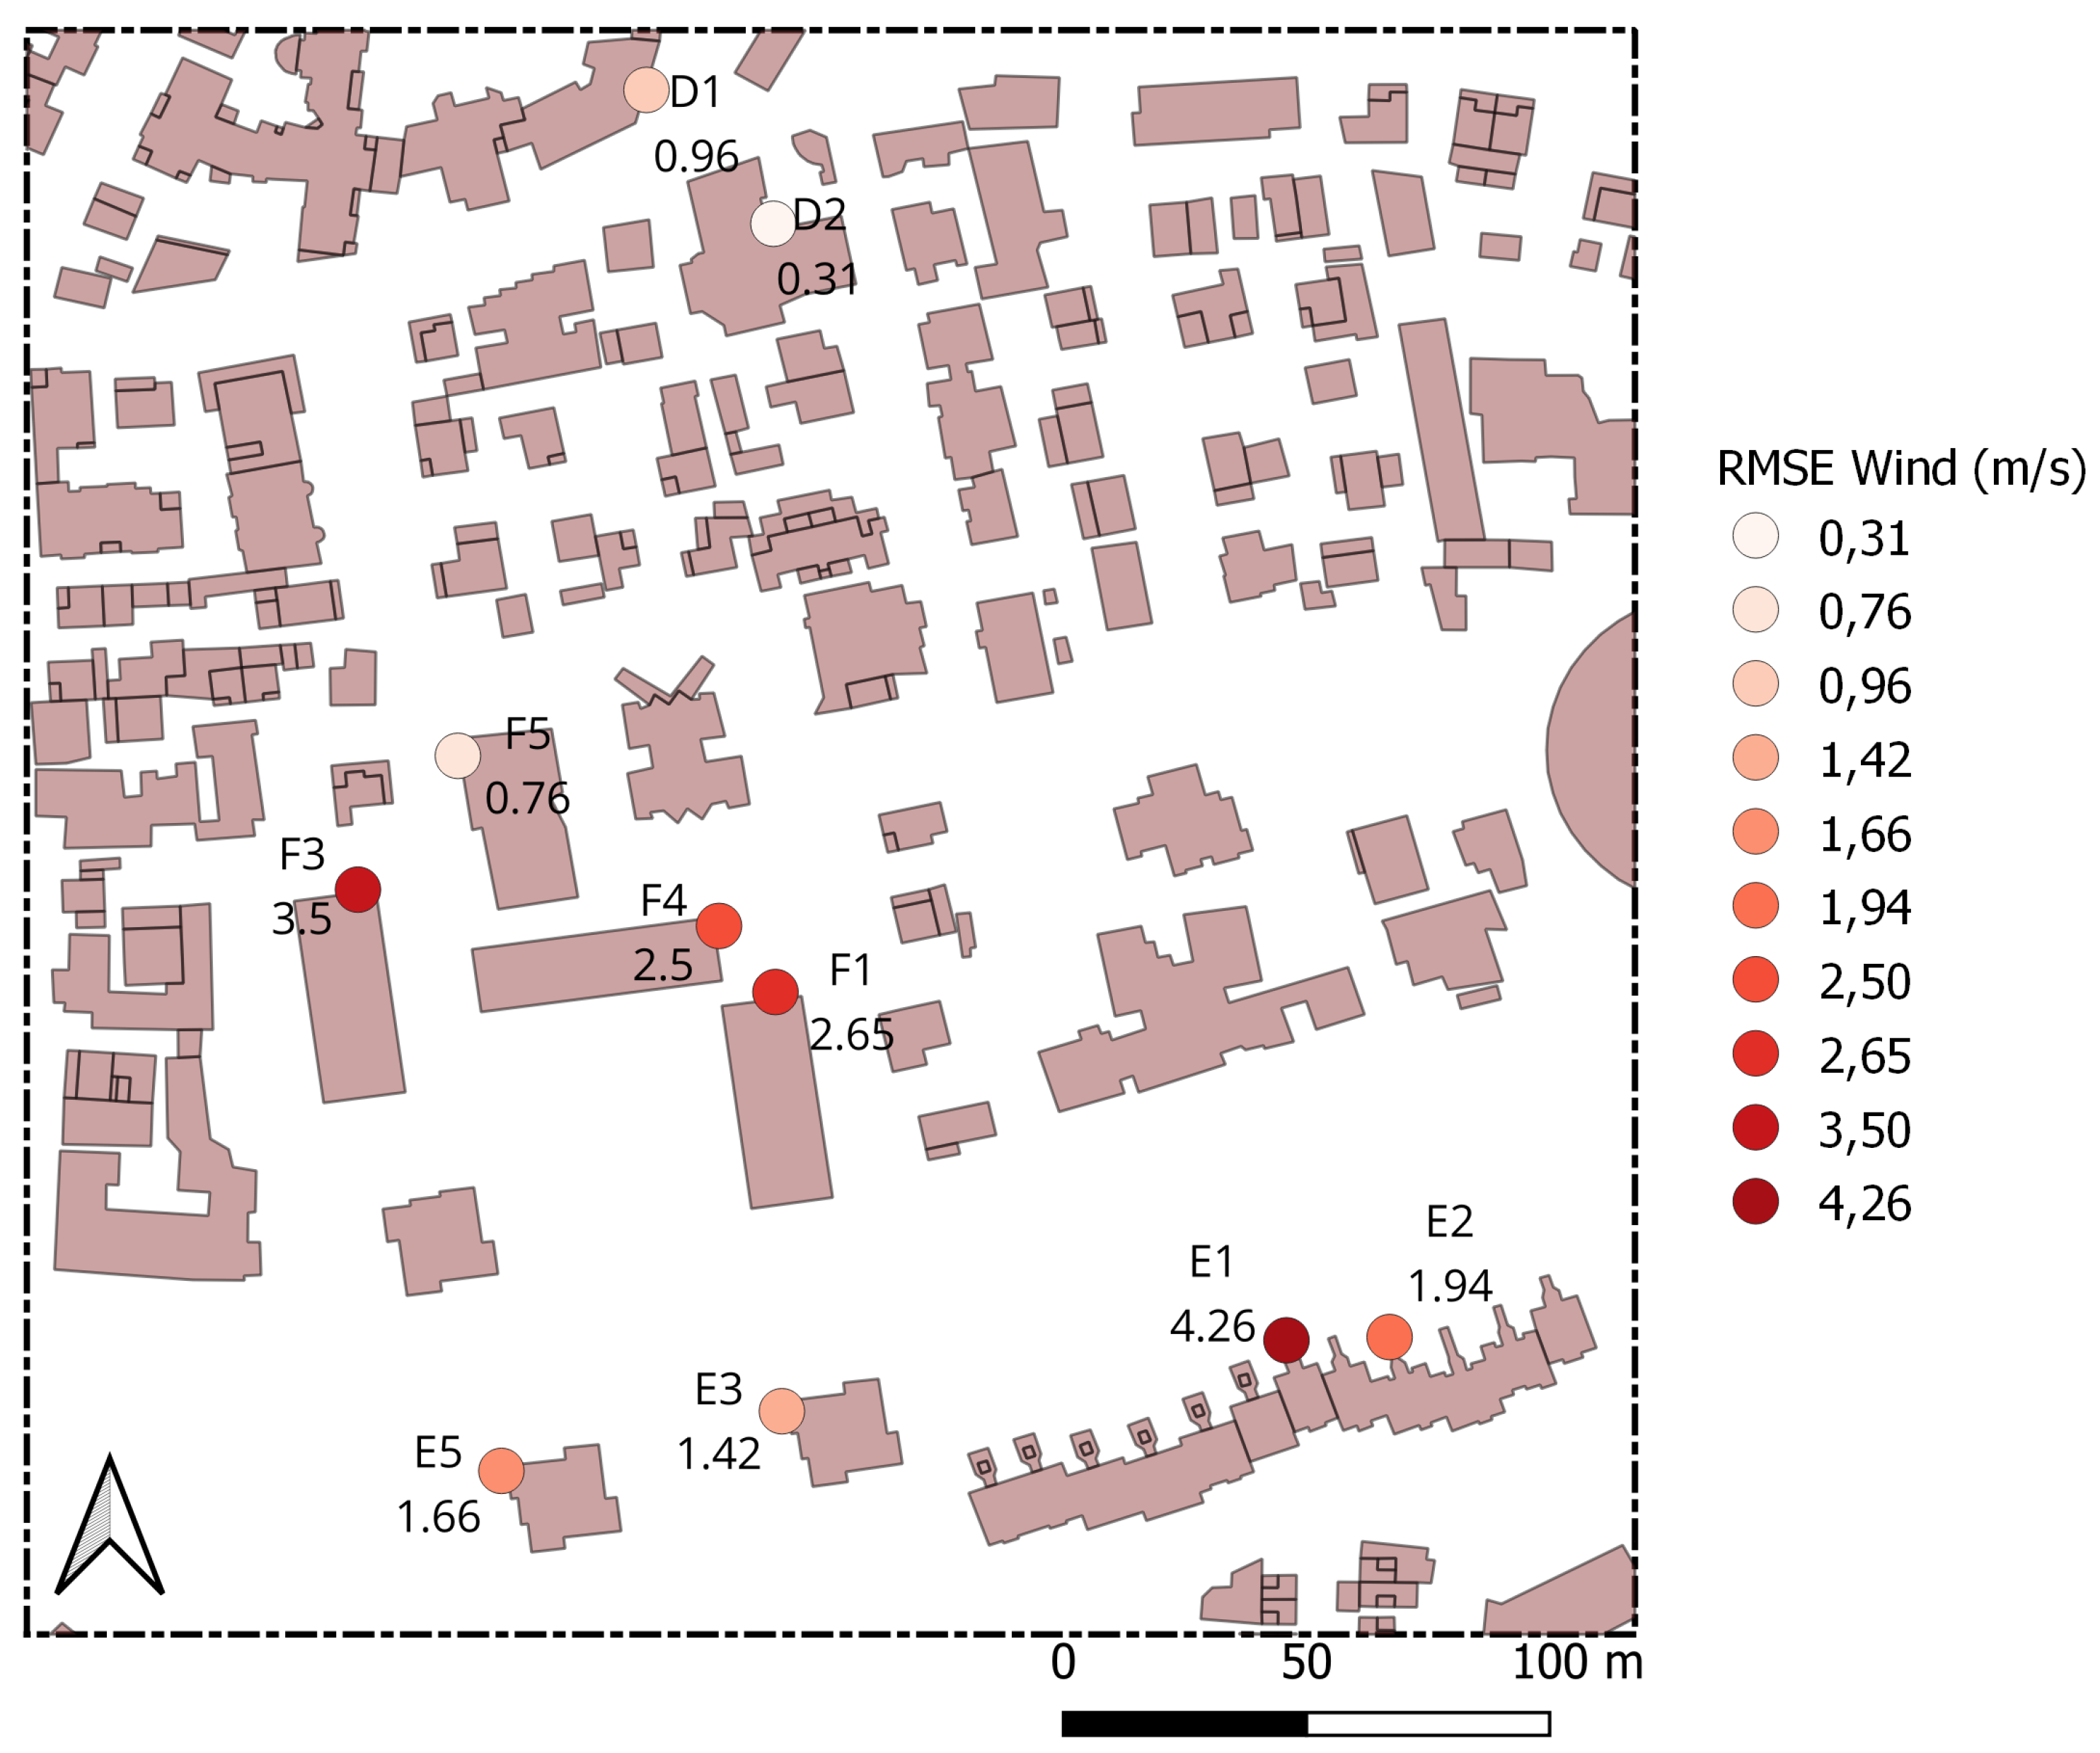
In contrast, wind speed remains one of the most challenging variables to reproduce accurately using ENVI-met. Wind speed RMSE values observed across the monitoring network ranged from 0.31 to 4.26 m s
−1 depending on local urban exposure, with most stations exhibiting errors between approximately 0.5 and 2 m s
−1. These values are generally consistent with the range reported in previous validation studies, where wind speed RMSE values typically vary between 0.3 and 2 m s
−1 [
9,
53,
54,
55]. The largest discrepancies were observed only for a limited number of highly confined or locally accelerated flow configurations, highlighting the strong spatial sensitivity of wind simulation accuracy within dense urban environments. Similar difficulties have nevertheless been reported in several studies, with correlation coefficients frequently remaining below 0.5 despite acceptable mean errors [
9,
56].
Several factors probably explain these larger discrepancies. First, the meteorological forcing originated from the Gillot Airport station, located in an open coastal environment where wind conditions differ substantially from those encountered inside dense urban canopies. Consequently, the imposed boundary conditions do not fully account for the progressive attenuation of airflow induced by upstream urban roughness, vegetation, and topography. Second, tropical island environments introduce additional complexity through the interaction between synoptic trade winds, sea breezes, orographic effects, and urban-scale circulations. Such processes occur over spatial scales larger than the ENVI-met computational domain and cannot be explicitly resolved by neighbourhood-scale simulations using uniform boundary forcing. Finally, the largest wind errors were systematically observed in confined environments characterized by vegetation, irregular building spacing, and recirculation zones. This observation agrees with previous studies showing that ENVI-met reproduces organized canyon flows more accurately than weak and highly turbulent airflow structures within complex urban canopies [
9,
57]. This result illustrates one of the main contributions of the present study, namely that a validation based on a single monitoring location would have substantially underestimated the true uncertainty associated with urban airflow simulations.
4.1.3. Mean Radiant Temperature
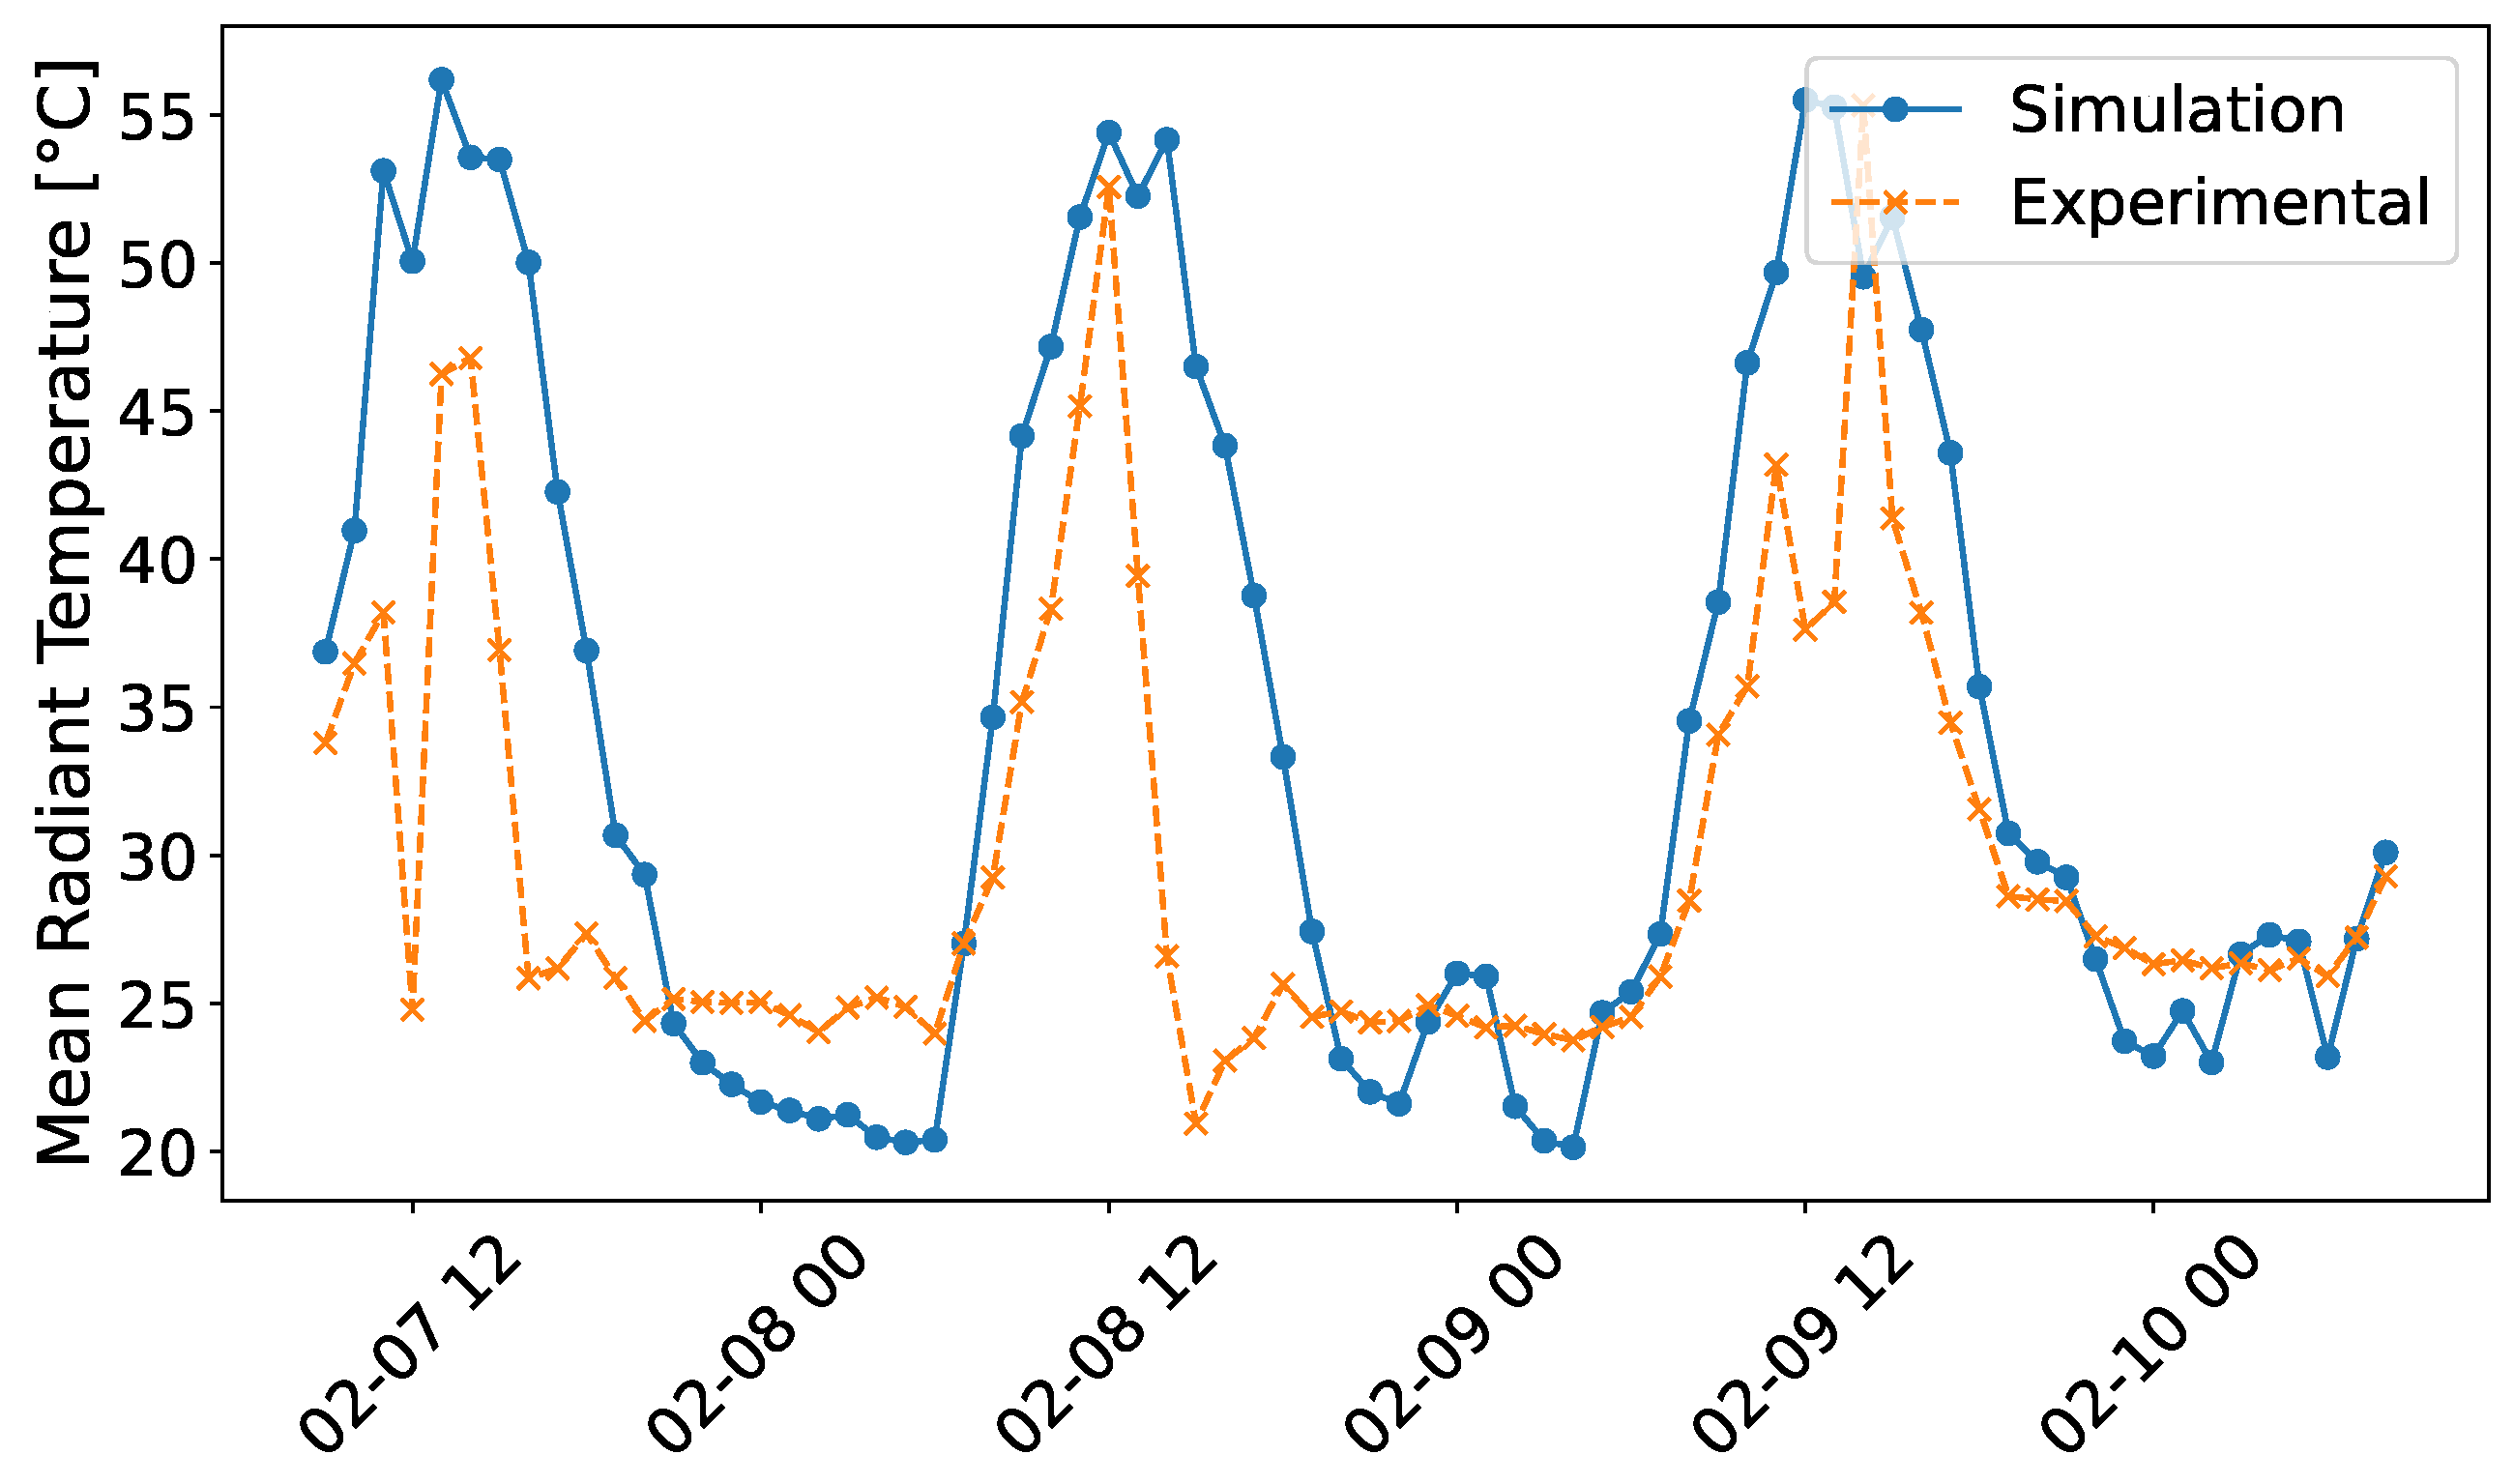
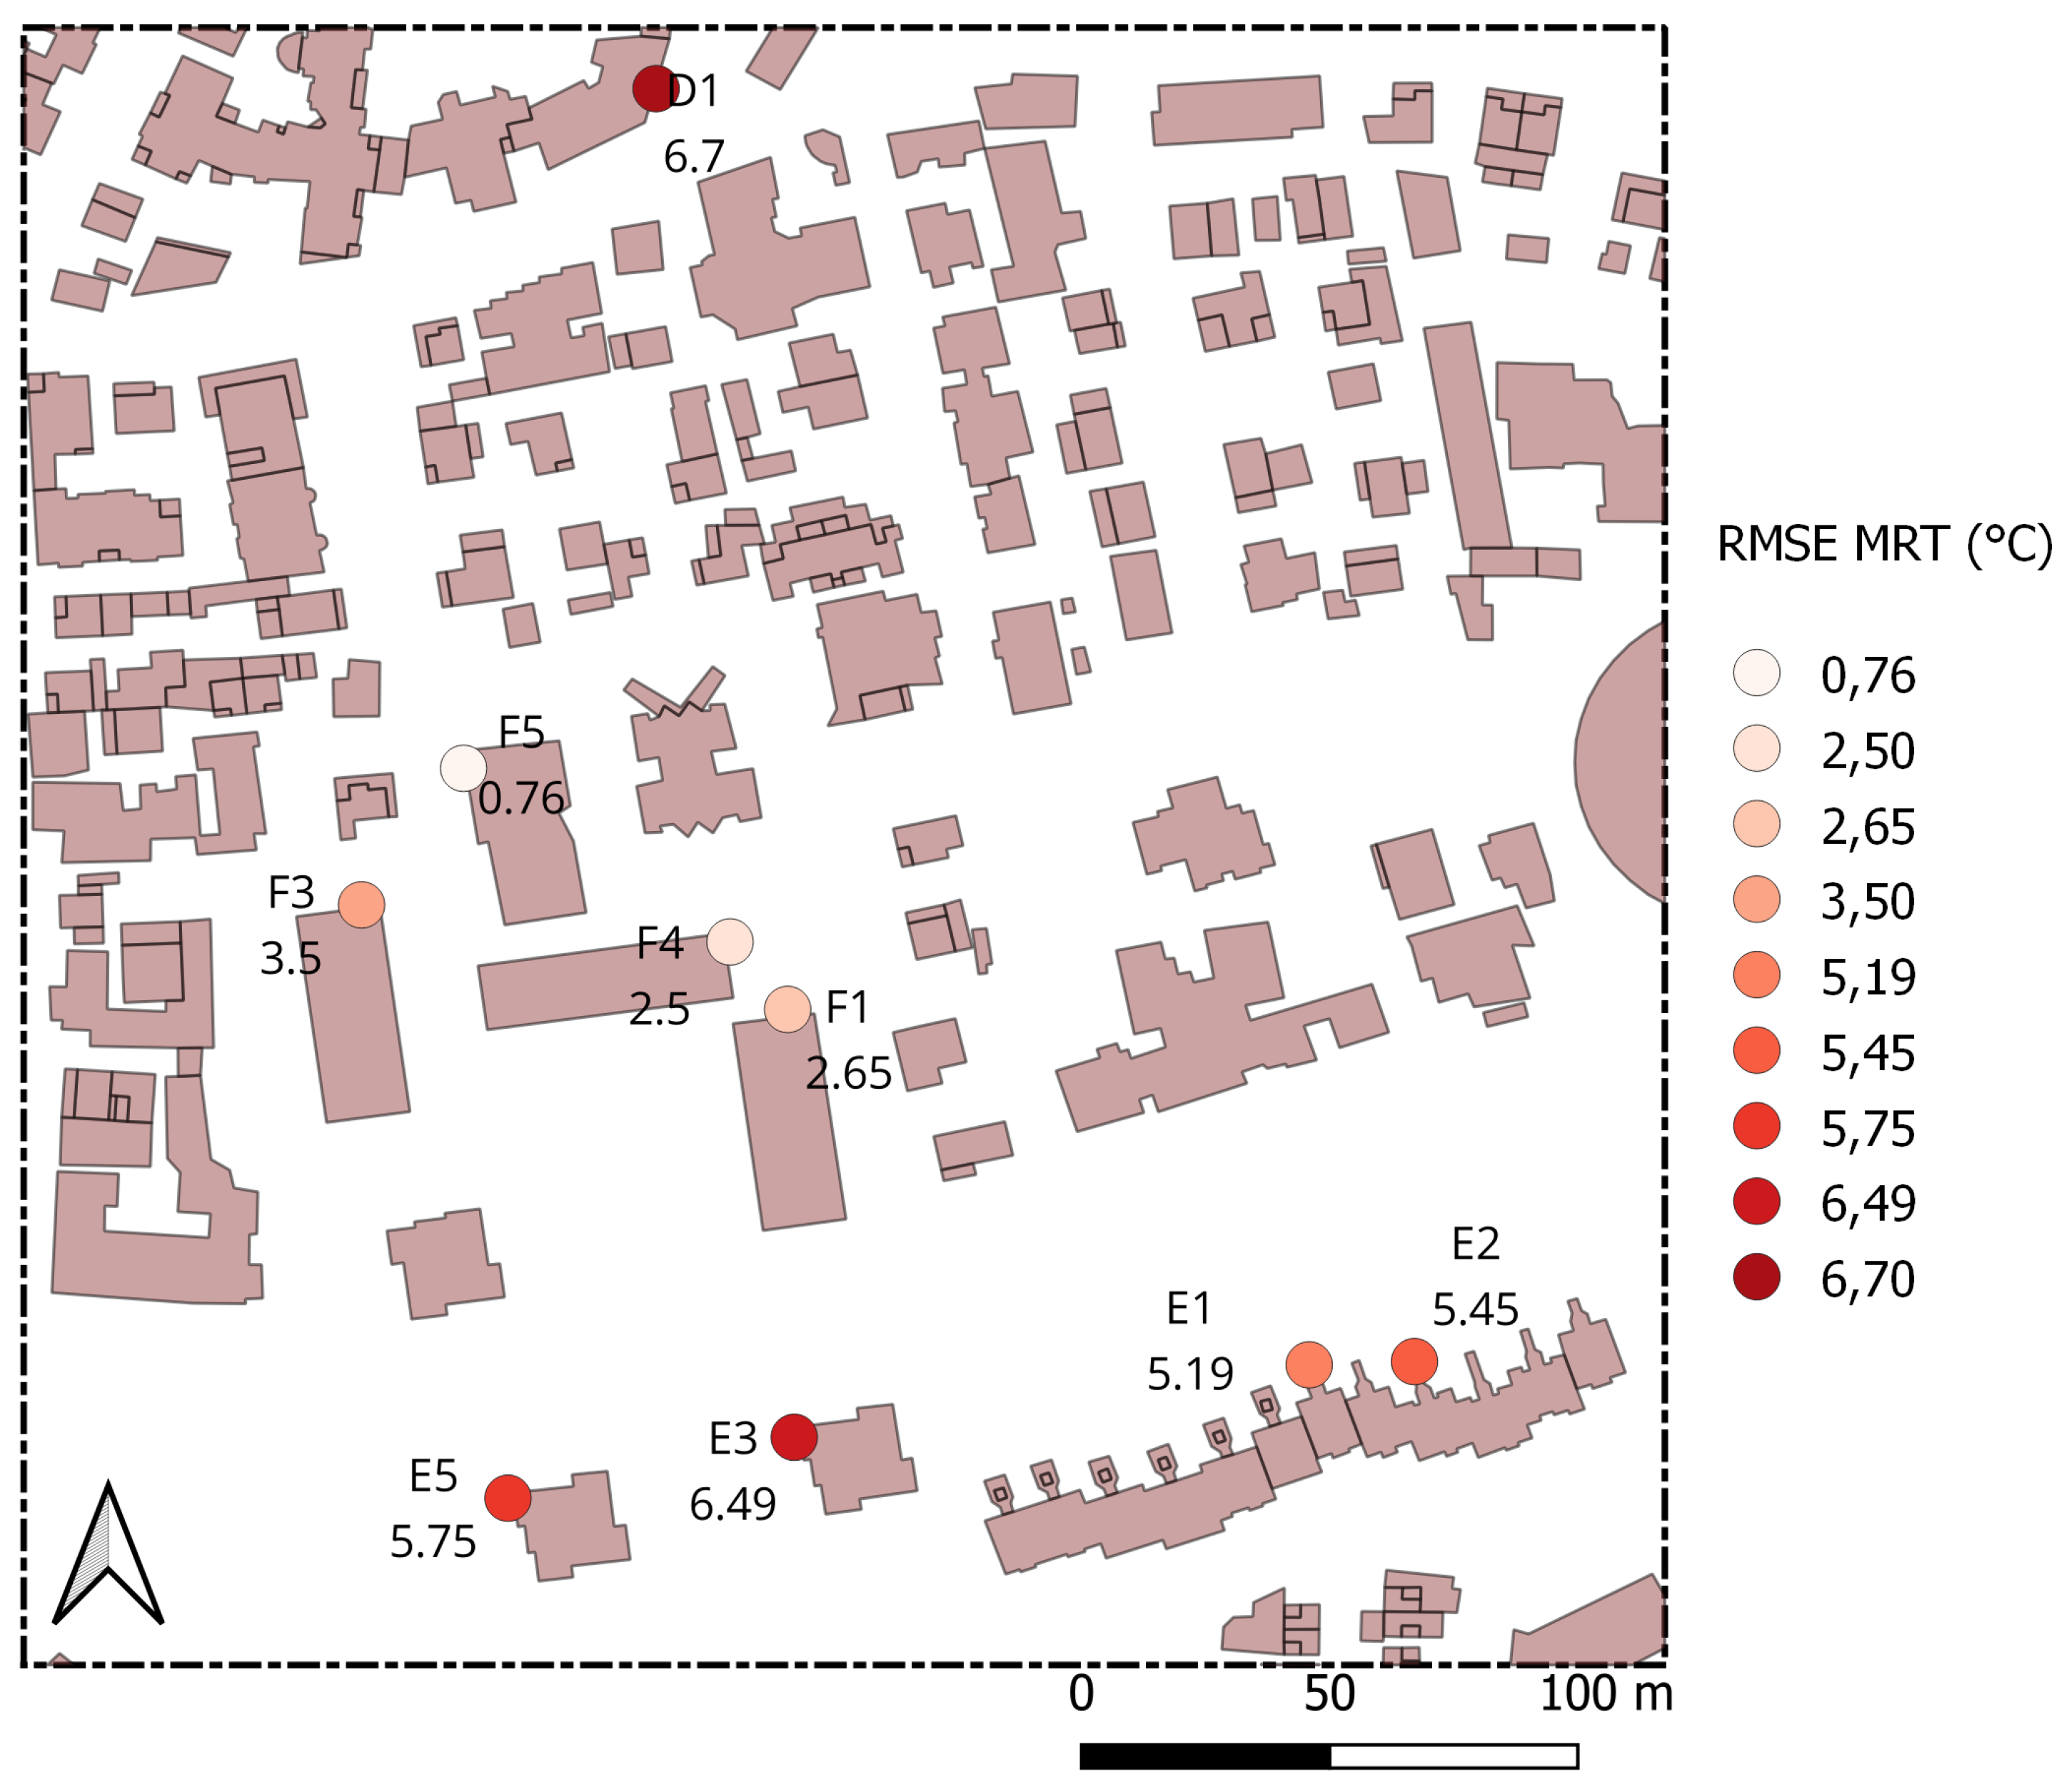
Similarly, MRT remains one of the main sources of uncertainty in outdoor thermal comfort simulations. The maximum MRT RMSE observed in the present study reached 8
C in confined urban environments. These values are fully consistent with previous validation studies, where MRT RMSE typically ranges from 3 to 13
C depending on urban morphology and measurement methodology [
9,
25,
26,
28,
54,
55,
58].
The magnitude of MRT errors reported in the literature generally exceeds those observed for air temperature and humidity, confirming that radiative exchanges remain one of the most difficult processes to simulate in urban environments. Several studies have highlighted the strong sensitivity of MRT predictions to surface optical properties, vegetation representation, shading geometry, and atmospheric radiation inputs [
25,
26,
42]. In the present study, these limitations are likely amplified by the strong solar radiation characteristic of tropical climates, where small errors in shading representation may generate large differences in absorbed shortwave radiation. The use of cloud cover rather than direct measurements of incoming shortwave and longwave radiation as forcing variables may have further contributed to the observed discrepancies.
The spatial analysis additionally revealed that the largest MRT errors occurred in confined environments combining buildings and vegetation, where rapidly evolving shadow patterns and multiple radiative interactions create highly heterogeneous thermal environments over very short distances. Similar findings were reported by [
25,
28], who observed substantially larger MRT errors in shaded and morphologically complex environments than in open spaces.
4.1.4. UTCI
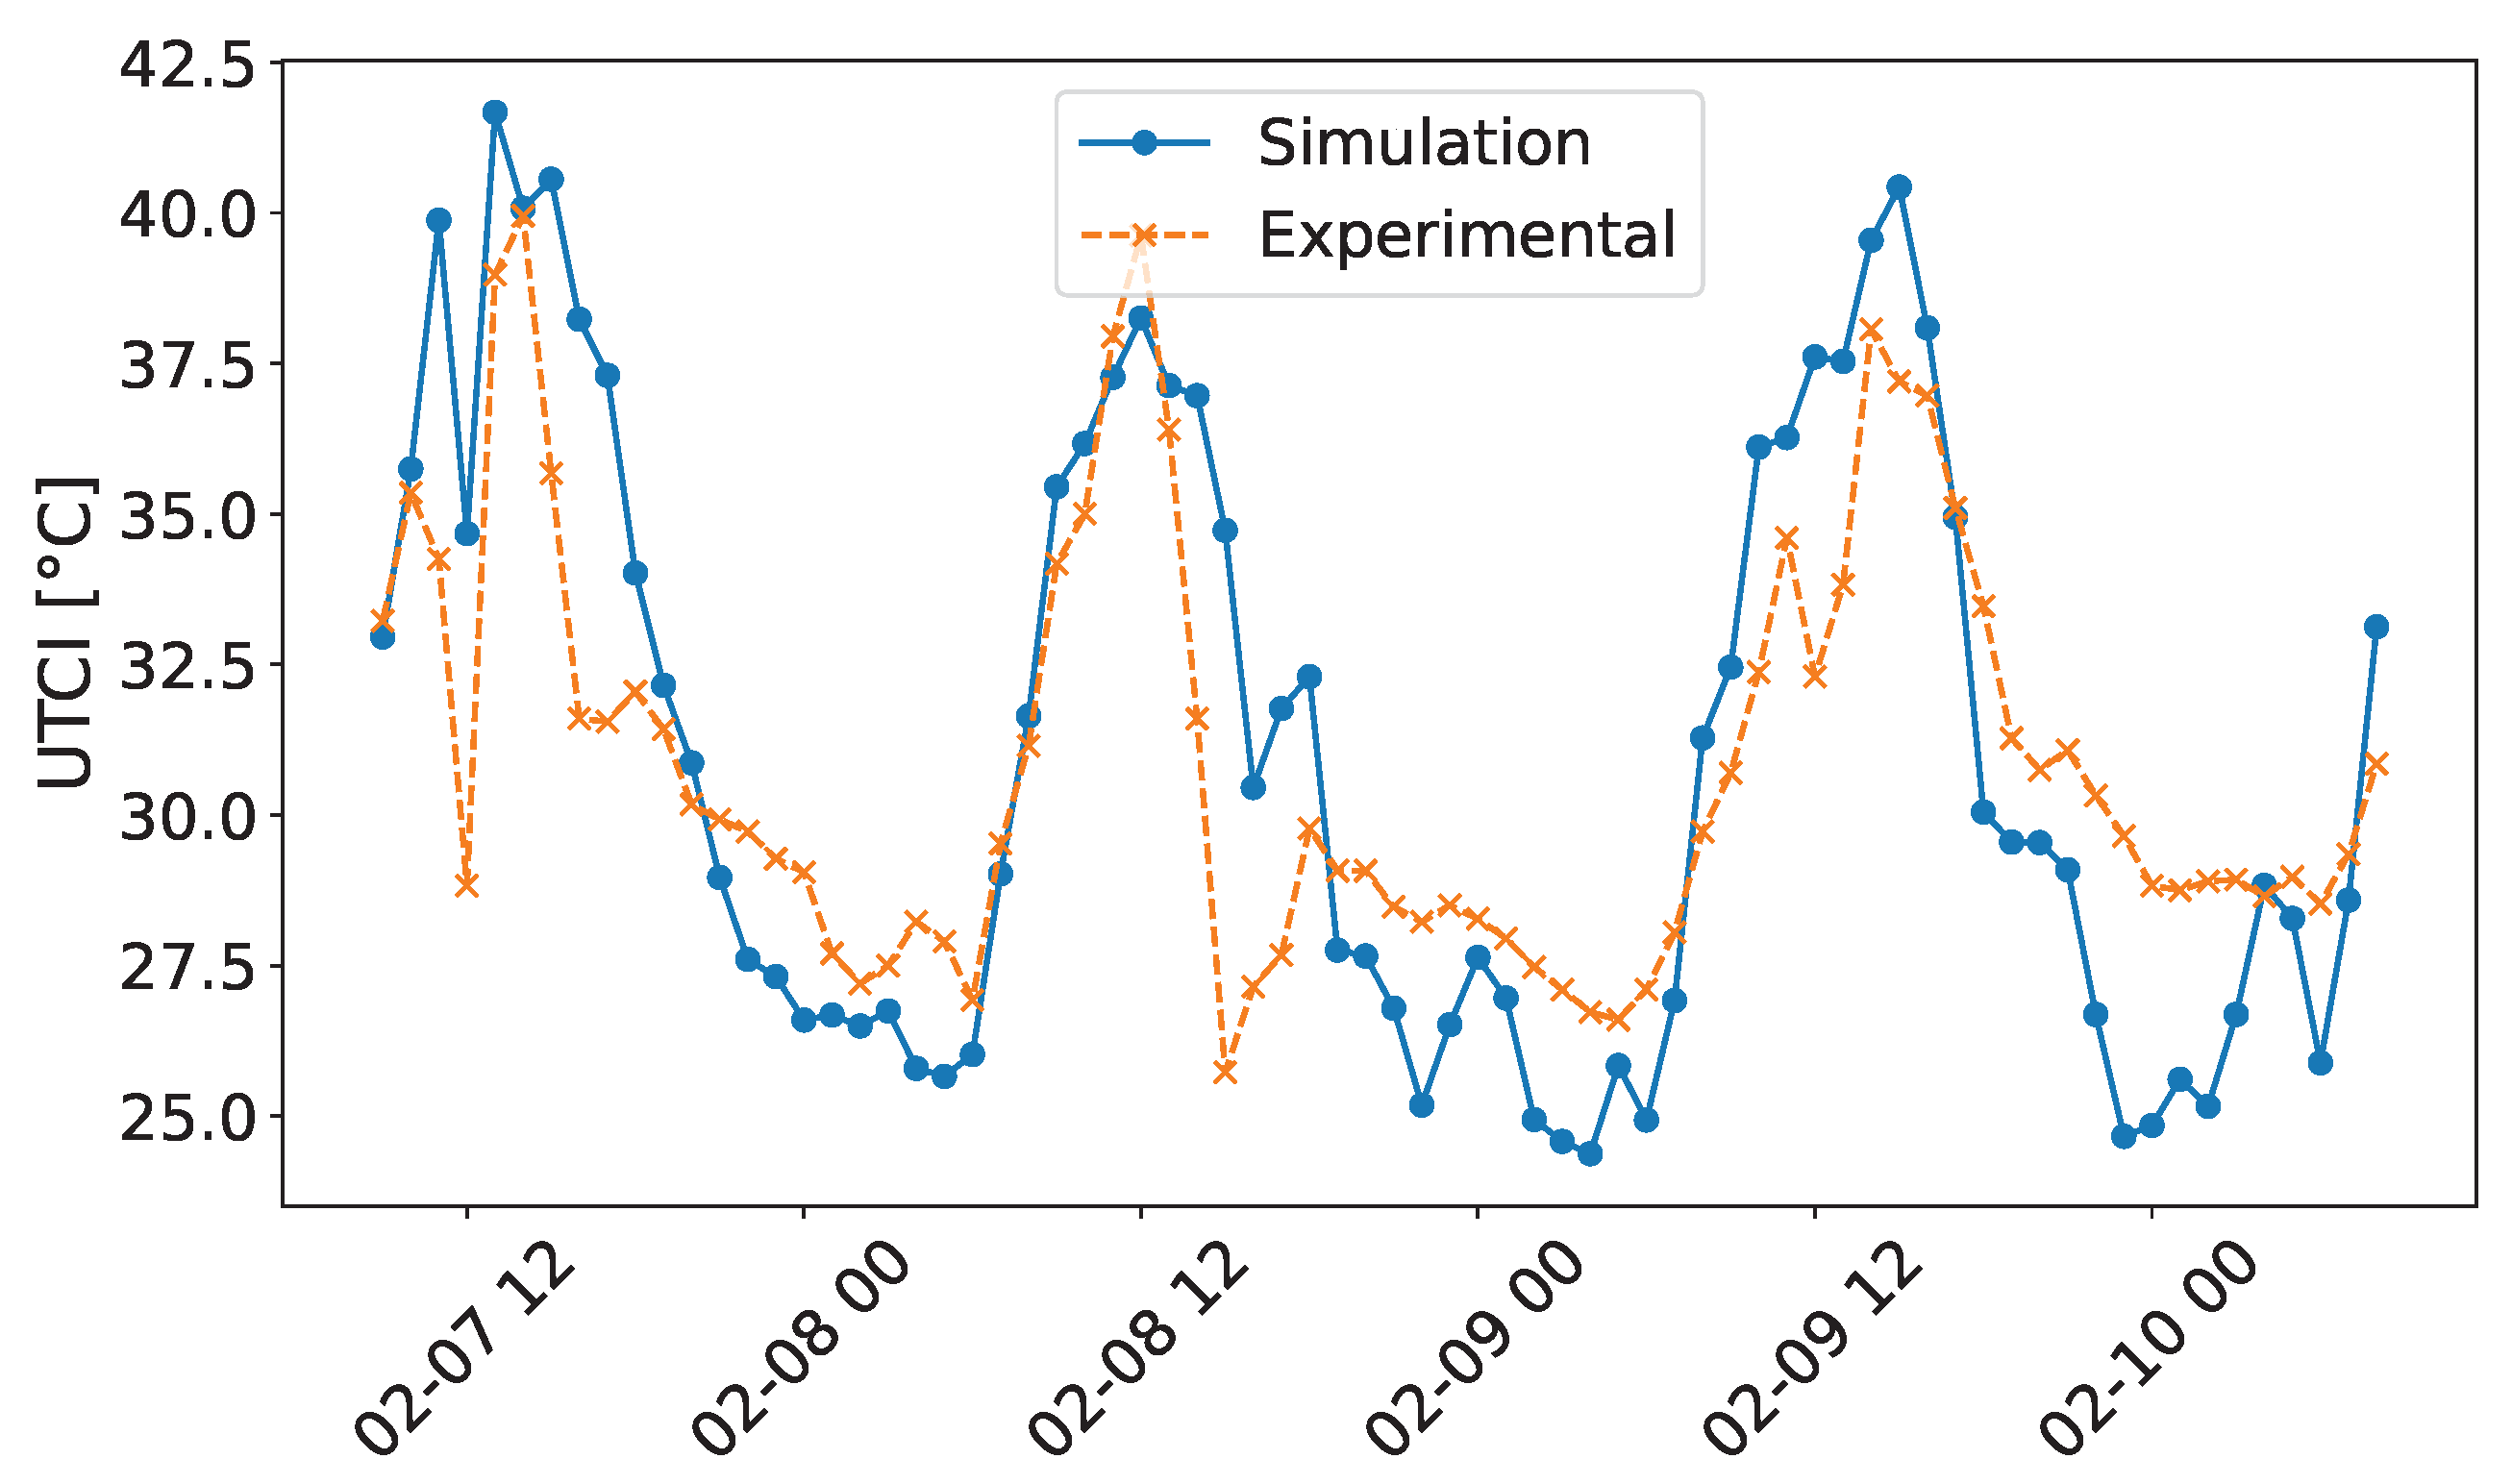
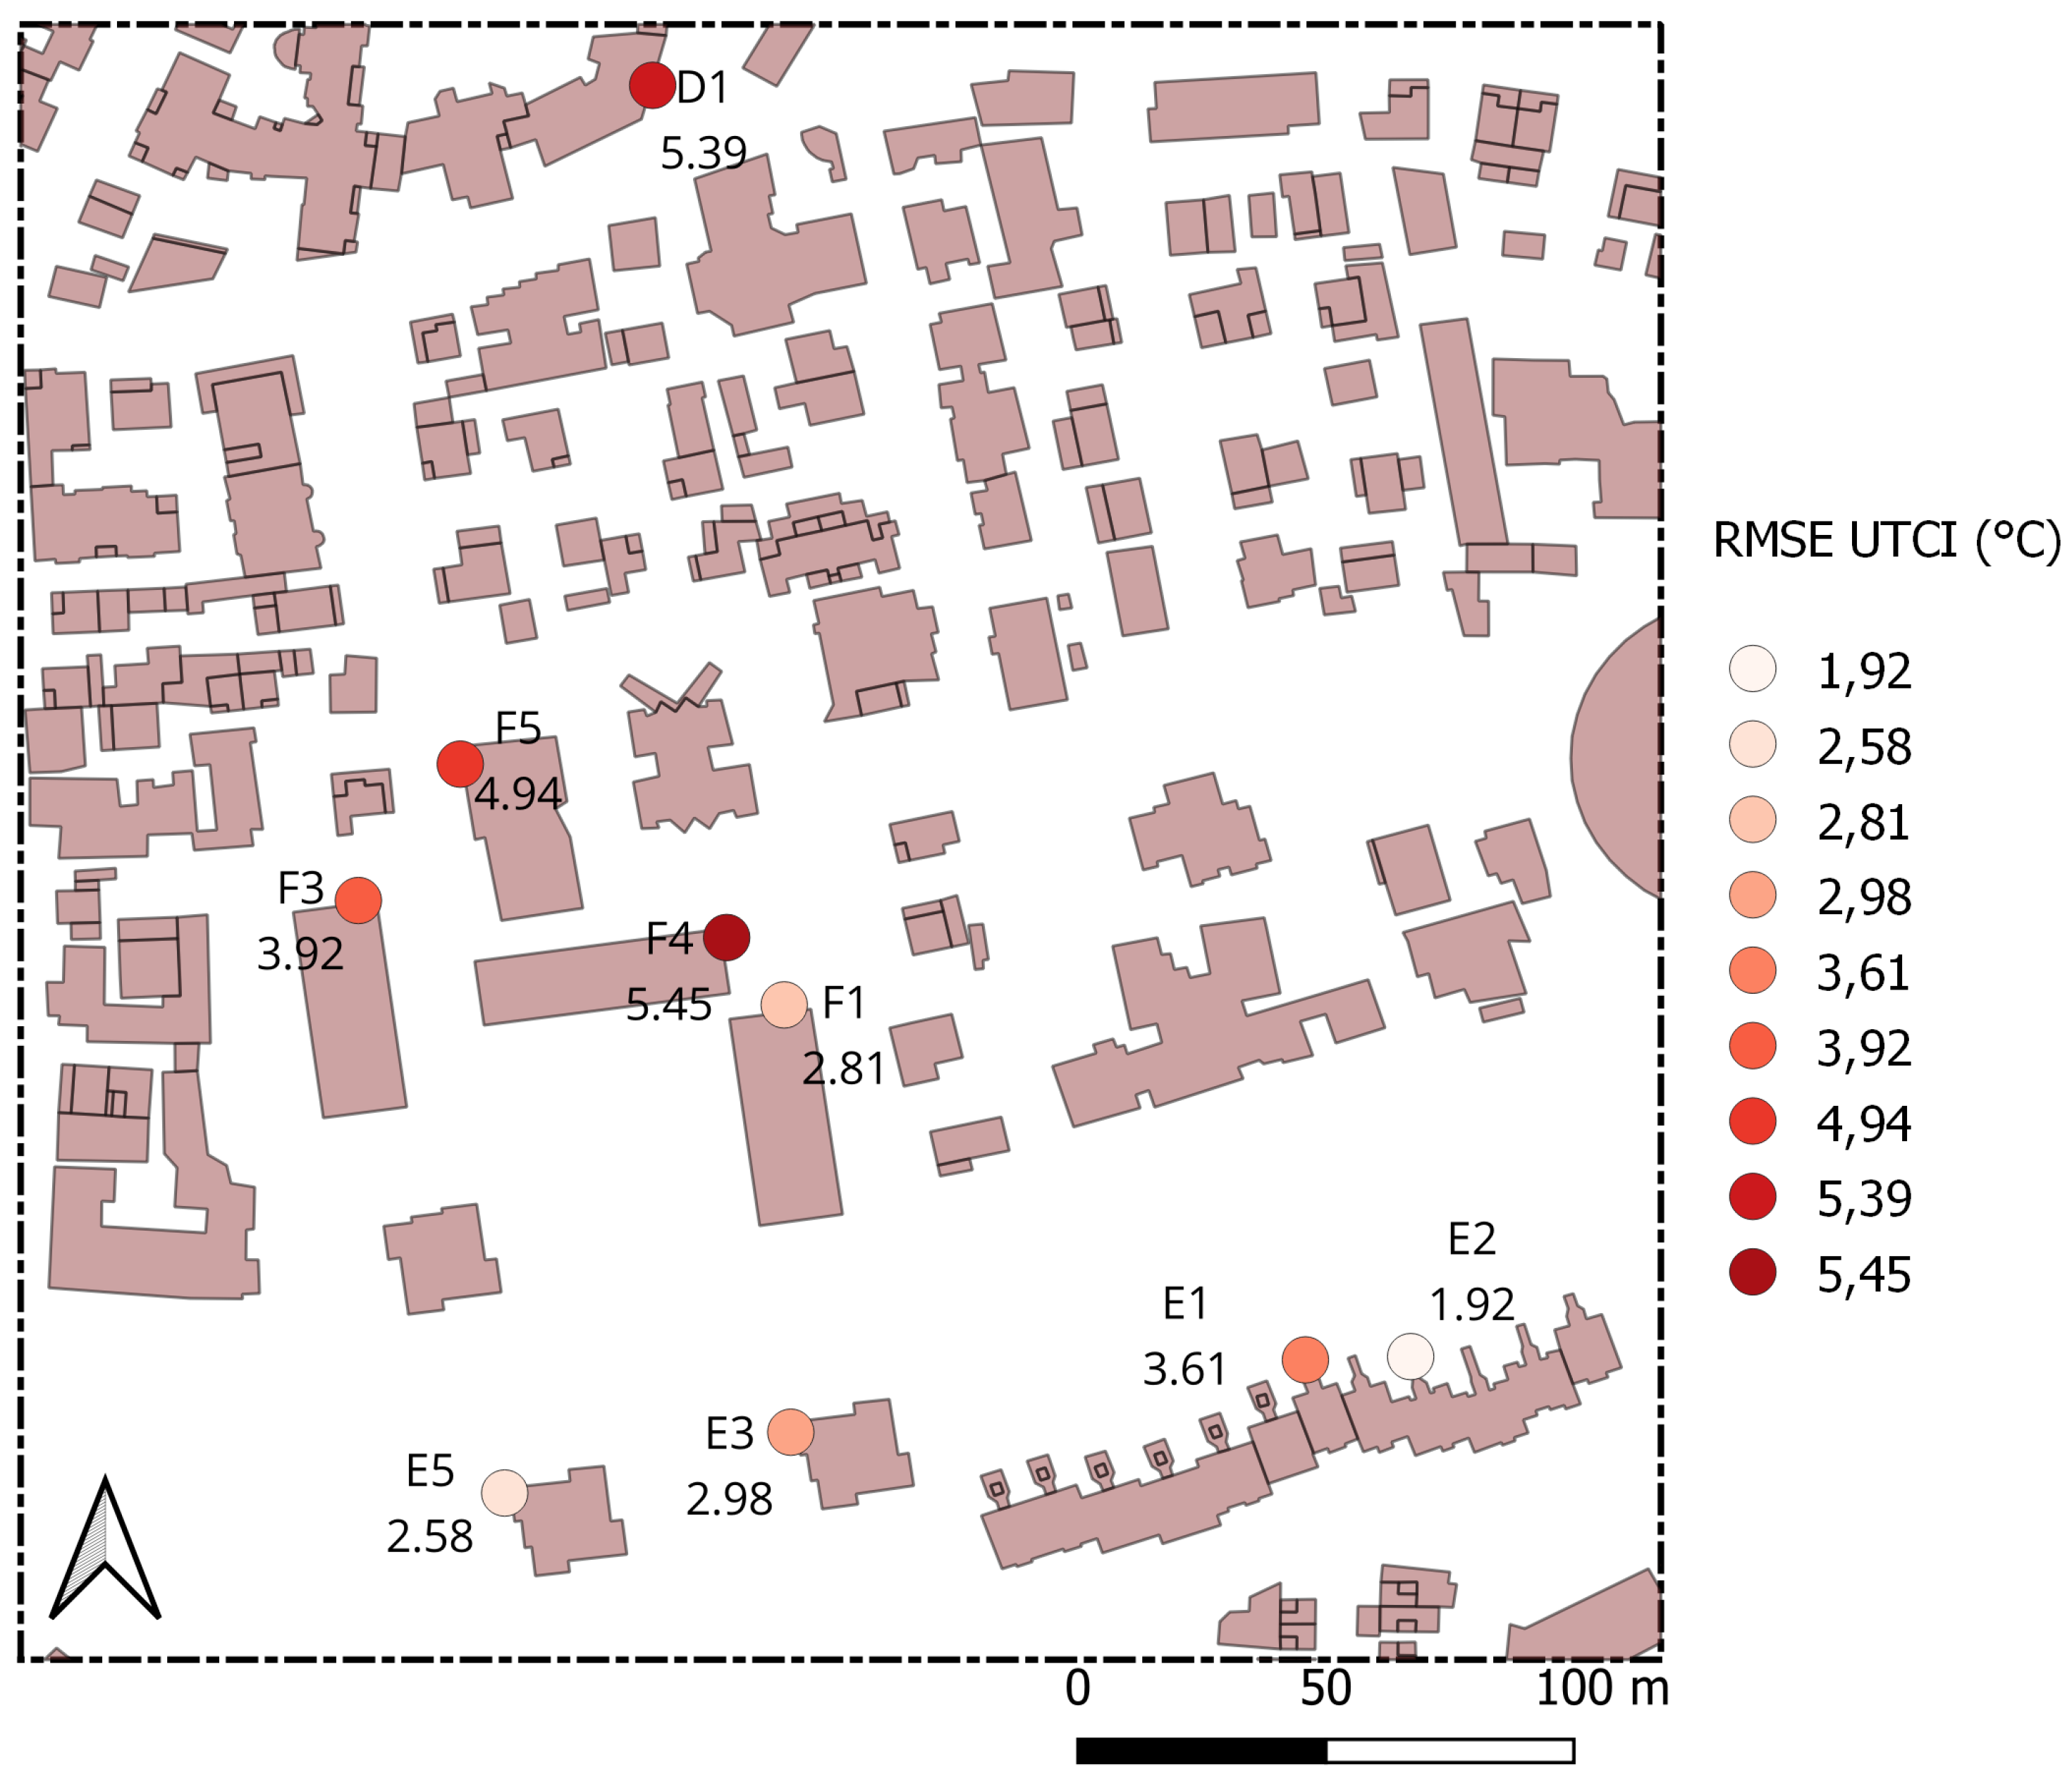
These uncertainties directly propagate to thermal comfort predictions, with UTCI RMSE values between 2 and 5.5
C. Although relatively few ENVI-met validation studies have evaluated UTCI directly, the values obtained here remain comparable to the limited results currently available in the literature. For example, ref. [
28] reported UTCI RMSE values ranging from 1.48 to 2.17
C depending on shading conditions. The somewhat larger UTCI errors observed in the present study probably reflect both the greater complexity of the tropical radiative environment and the inclusion of nighttime periods in the validation dataset. Indeed, previous studies frequently restrict validation to daytime hours only, whereas the present analysis covers continuous 72-h periods and therefore includes periods characterized by weak winds and rapidly changing radiative conditions.
Nevertheless, the model shows a satisfactory agreement for UTCI, with a Willmott index of agreement around 0.8, comparable to values reported in the literature [
28]. This suggests that, despite uncertainties in individual variables, ENVI-met indicates satisfactory skill in reproducing the temporal dynamics of outdoor thermal stress.
These results therefore contribute to addressing the current lack of ENVI-met validation studies focusing on outdoor thermal comfort in coastal tropical urban environments, while providing quantitative benchmarks for model performance across multiple microclimatic variables.
4.2. Importance of Spatially Distributed Validation
A key contribution of this study is the analysis of spatial variability of model performance across a dense monitoring network. While ENVI-met validation studies commonly rely on one or two measurement locations, the present results demonstrate that model accuracy varies significantly within a single neighbourhood.
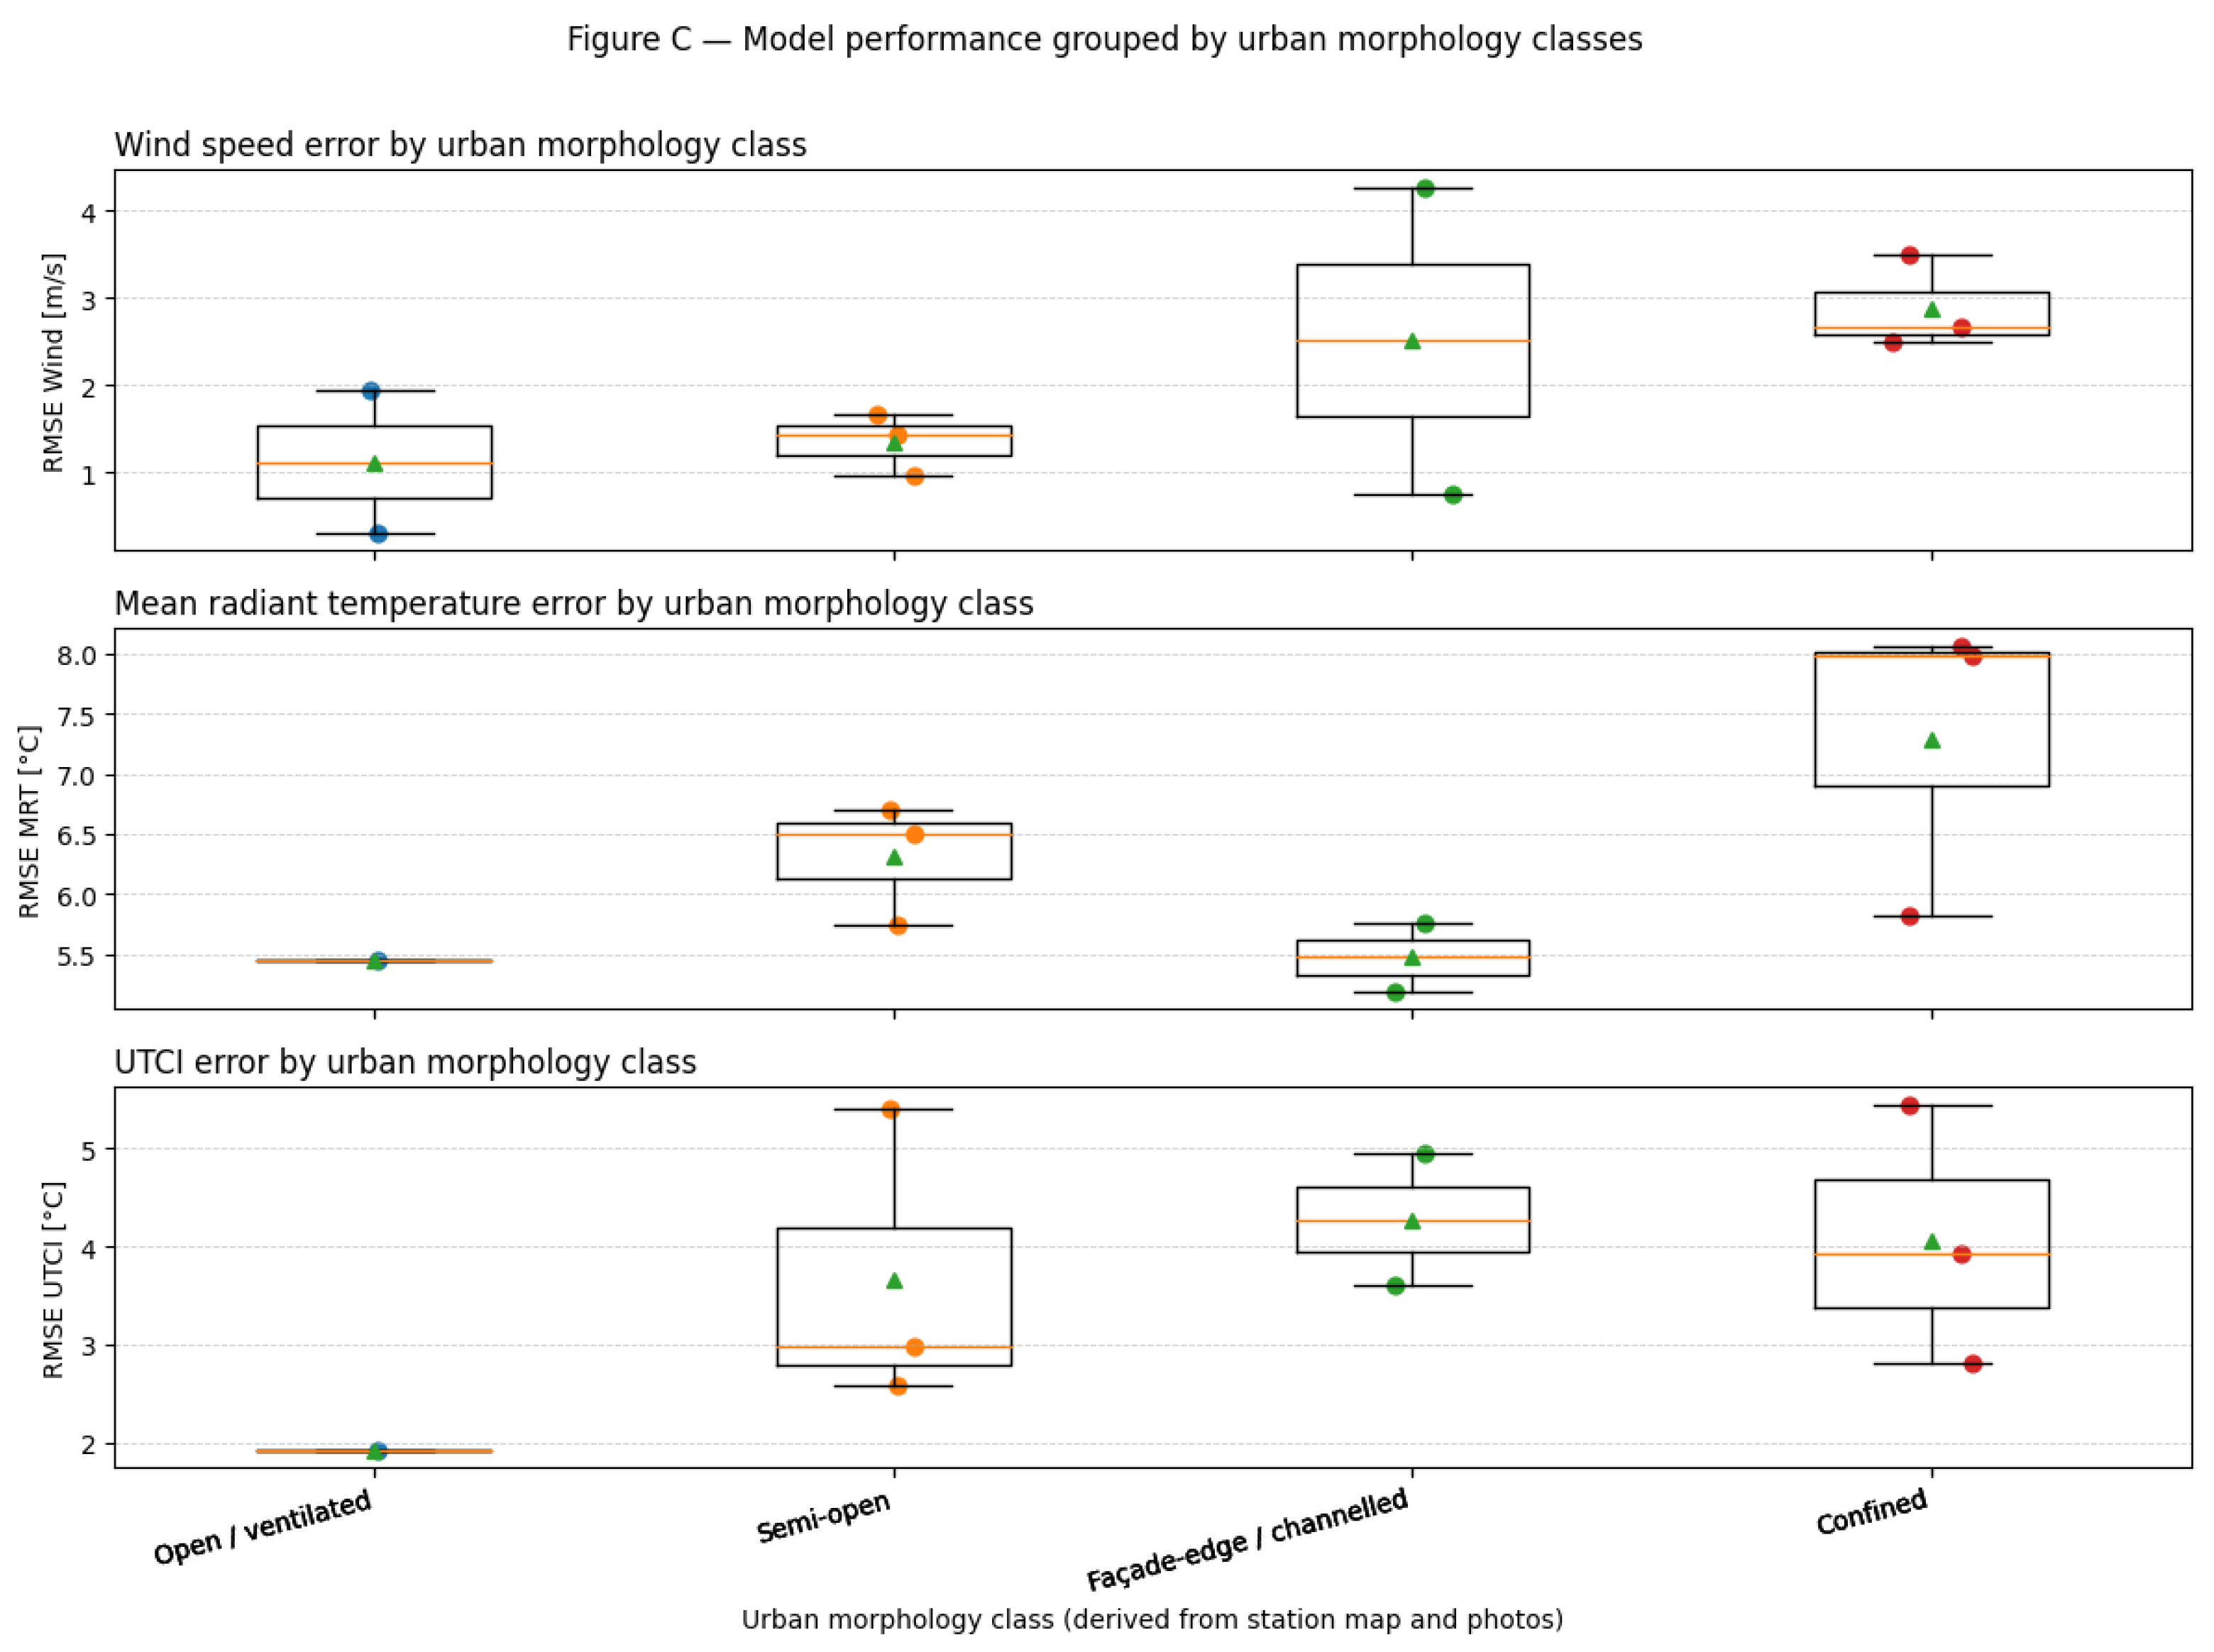
Wind speed RMSE varies by more than one order of magnitude between stations, from 0.31 m s−1 in open environments to more than 4 m s−1 near building edges. Mean radiant temperature errors also show strong spatial variability, ranging from approximately 5 to 8 C depending on local shading conditions.
The morphology-based analysis shows that confined environments and façade-edge locations systematically produce larger errors than open or semi-open configurations. These findings demonstrate that local urban geometry plays a critical role in determining simulation accuracy.
This spatial variability highlights the limitations of validation approaches based on single-point comparisons and suggests that multi-point monitoring is necessary to properly assess model reliability at neighbourhood scale. The methodology developed in this study therefore represents an extension of conventional ENVI-met validation approaches by combining multi-point observations, morphology-based analysis, uncertainty propagation and sensitivity assessment within a unified validation framework.
4.3. Propagation of Microclimate Simulation Errors to Thermal Comfort
The error-propagation analysis confirms, under coastal tropical urban conditions, that radiative processes play a dominant role in UTCI uncertainty propagation. The present results provide quantitative evidence of how microclimate simulation errors propagate to outdoor thermal comfort predictions within a dense tropical urban environment.
The regression analysis shows that approximately 62% of the variance in UTCI error can be explained by combined errors in air temperature, wind speed, relative humidity, and MRT. Standardized regression coefficients indicate that MRT errors represent the dominant contributor to UTCI uncertainty, followed by air temperature and wind speed, while relative humidity has a negligible influence under the studied winter conditions.
These results are consistent with the physical formulation of UTCI [
59], which combines radiative exchange, air temperature and convective heat transfer. The strong influence of MRT highlights the importance of accurate radiation modelling in tropical environments characterized by high solar exposure.
However, while MRT errors represent the dominant source of uncertainty, they are mainly controlled by local shading conditions and radiative exchange processes that are difficult to constrain through boundary forcing data. This aligns with recent advances showing that reliable MRT estimation depends on accurately resolving multi-directional radiative fluxes, a process that remains inherently challenging in dense urban environments due to complex geometry and atmospheric variability [
42].
In contrast, wind speed errors, although secondary, remain statistically significant and can be directly influenced by modelling choices such as meteorological forcing and urban roughness representation. This makes wind modelling a particularly relevant target for model improvement.
4.4. Influence of Wind Boundary Conditions and Urban Roughness
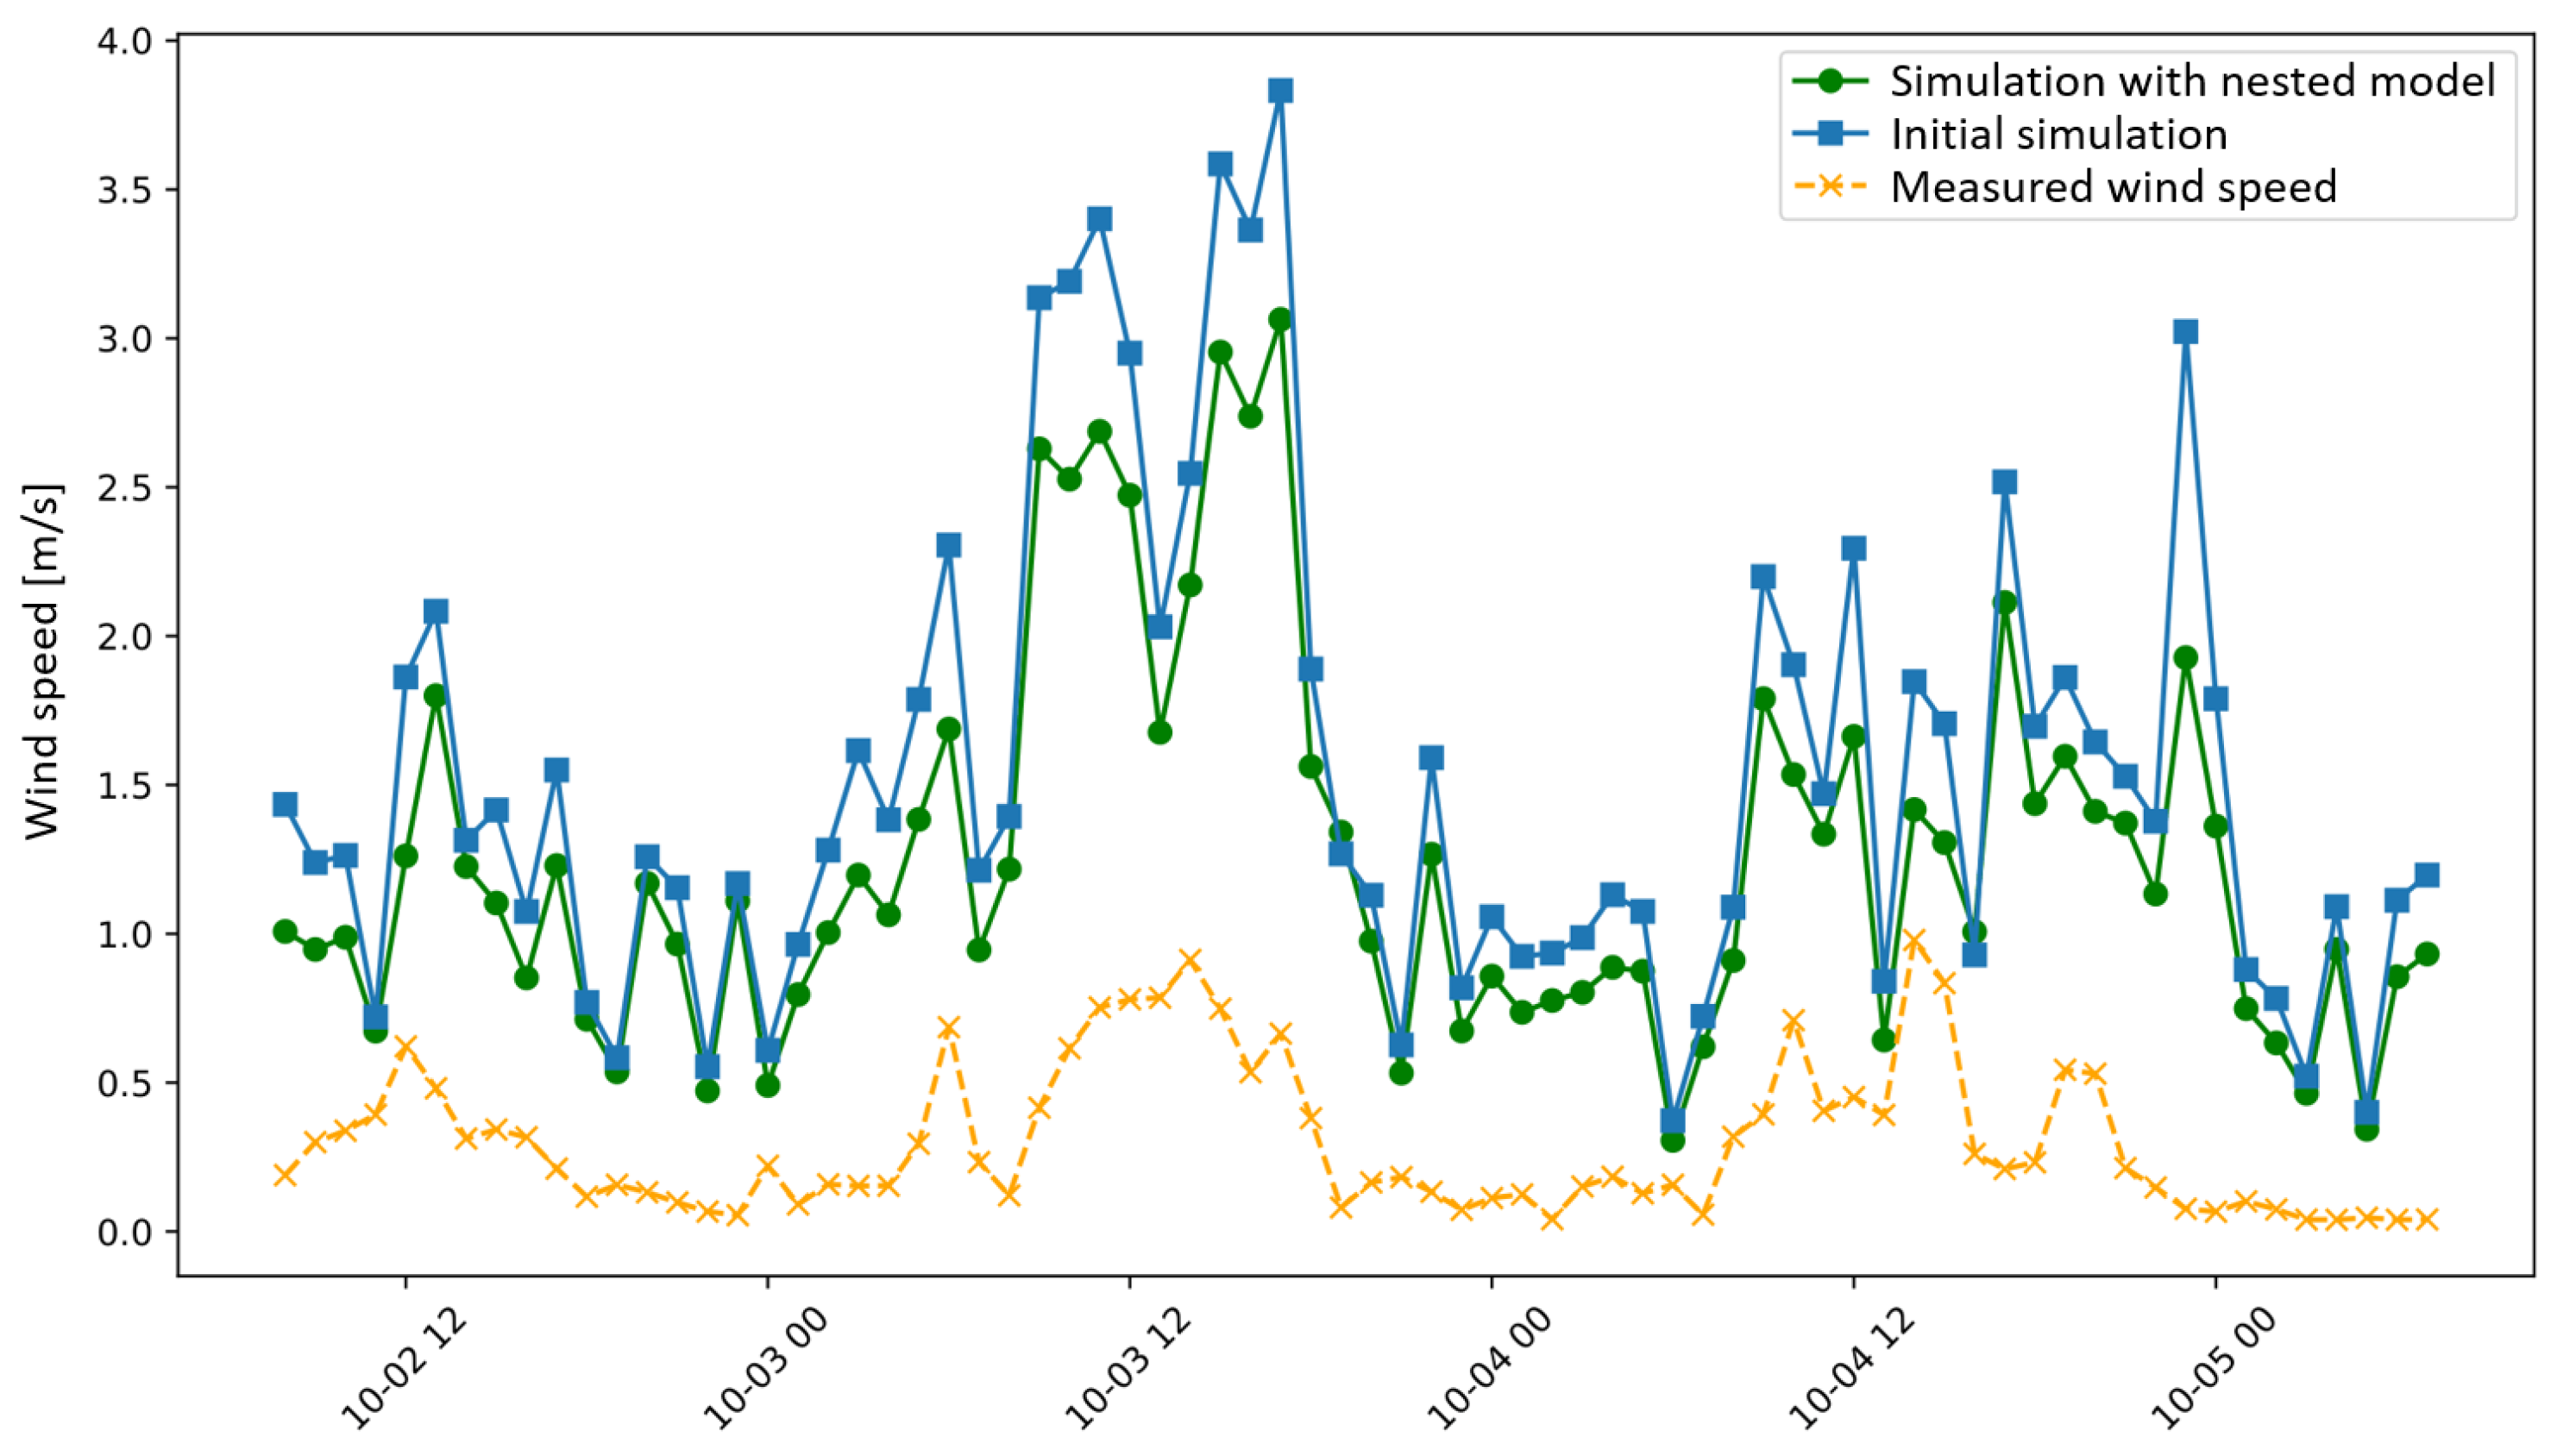
The sensitivity experiments confirm that wind boundary conditions represent one of the main sources of uncertainty in neighbourhood-scale ENVI-met simulations. Using meteorological forcing measured in open terrain leads to a systematic overestimation of wind speed within the urban canopy layer, reflecting the strong attenuation of airflow caused by buildings and surface roughness. This limitation is consistent with previous studies highlighting that meteorological data from peripheral or open-field stations are often not representative of local urban conditions, particularly in dense districts [
29]. This issue is further amplified in tropical environments, where airflow is strongly modulated by complex urban geometry and coastal influences.
The empirical roughness correction significantly reduces wind-speed errors, with RMSE decreasing from approximately 2.7 m s−1 to less than 1 m s−1 in the December simulation period. This result demonstrates that simple adjustments of meteorological forcing can substantially improve model performance by partially accounting for urban-induced flow attenuation. However, the use of a single, constant roughness correction remains a simplified representation of the urban boundary layer.
In reality, urban roughness effects are highly anisotropic and depend on wind direction and local morphology. Advanced approaches based on direction-dependent roughness parameters have been shown to improve the representation of airflow in complex urban environments [
60], suggesting that the simplified correction used in this study could be further refined to better capture directional flow patterns.
The nested modelling approach also reduces wind magnitude, confirming that large-scale urban roughness influences airflow entering the neighbourhood domain. However, temporal correlation remains weak, indicating that small-scale turbulence and local flow structures remain difficult to reproduce at the spatial resolution used in this study. This limitation highlights the difficulty of bridging scales between regional meteorological forcing and local urban airflow dynamics.
In this context, recent studies have explored multi-scale and coupled modelling approaches to improve boundary condition representation. For instance, the use of urban canopy or mesoscale models such as the Urban Weather Generator allows rural meteorological data to be transformed into urban-specific forcing conditions [
29], while more advanced frameworks involve dynamic coupling between microclimate models and building energy simulations to account for feedback mechanisms between urban form, airflow, and heat exchanges [
61].
While simple empirical corrections can significantly improve wind-speed magnitude, a more robust representation of wind boundary conditions likely requires direction-dependent parameterization and multi-scale modelling approaches. This remains a key challenge for improving the reliability of ENVI-met simulations in dense coastal tropical urban environments.
4.5. Influence of Model Initialization
The sensitivity analysis indicates that extending the spin-up period does not significantly improve simulation accuracy for air temperature and relative humidity.
This result suggests that, when ENVI-met simulations are driven by full meteorological forcing, the model rapidly adjusts to boundary conditions and does not require long stabilization periods. This finding challenges common modelling practice, where spin-up periods of 3–24 h are often recommended [
25,
29,
55,
62]. Under the tropical conditions investigated here, shorter initialization periods appear to be sufficient. Reducing spin-up duration could therefore decrease computational cost without compromising simulation accuracy, which is particularly relevant for large simulation domains or long-term studies.
4.6. Implications for Urban Climate Modelling and Design Practice
The results of this study provide practical guidance for both urban climate modellers and urban planners using ENVI-met for outdoor thermal comfort assessment in tropical environments.
From a modelling perspective, the findings highlight the critical role of wind boundary conditions. Using meteorological data from open-terrain weather stations can lead to substantial overestimation of airflow within dense urban areas. Applying simple roughness-based corrections or integrating locally representative wind data substantially improves wind-speed magnitude while temporal variability remains poorly reproduced. In this context, the increasing availability of low-cost weather stations offers strong potential for deploying site-specific monitoring campaigns to improve model forcing, particularly in tropical regions where spatial variability is high and data availability remains limited.
In addition, the results demonstrate that ENVI-met simulations should be interpreted with caution in absolute terms. While the model reliably reproduces temporal dynamics and relative differences between locations or design scenarios, uncertainties in wind and radiative processes can lead to significant deviations in predicted comfort levels. Therefore, model outputs are particularly well suited for comparative analyses, but less reliable for predicting absolute thermal comfort thresholds without local calibration.
From an urban design perspective, the spatial analysis of model performance provides important insights into where simulation results are more or less reliable. Open and well-ventilated environments are generally better reproduced, while confined spaces such as courtyards and deep urban canyons show the largest uncertainties due to complex airflow patterns and heterogeneous shading conditions. In these configurations, both ventilation and radiative trapping effects are difficult to capture accurately, which directly impacts thermal comfort assessment.
These findings suggest that special attention should be given to the geometric representation of shading elements and urban morphology when using ENVI-met to evaluate design strategies based on radiative mitigation (e.g., vegetation, shading devices). More generally, the results emphasize the importance of combining simulation outputs with field observations whenever possible, especially in complex urban configurations.
4.7. Limitations
Several limitations should be acknowledged when interpreting the results of this study.
First, the experimental campaign relied on a network of low-cost weather stations. Although the sensors were previously calibrated and validated against reference instruments following ISO 7726 recommendations, additional uncertainties may remain, particularly for low wind speed conditions and radiative measurements under strong tropical solar exposure. Wind speed measurements are especially sensitive in dense urban environments where airflow is often weak and highly variable at short spatial and temporal scales. Moreover, MRT was derived from globe temperature measurements rather than directly measured using a six-direction net radiometer. While globe thermometers are widely used in outdoor thermal comfort studies because of their robustness and practicality, they provide only an indirect estimate of the radiative environment and may not fully capture the anisotropic radiation field and significant lateral shortwave and longwave fluxes occurring in dense urban canopies. Consequently, part of the discrepancies observed for MRT may originate from experimental measurement uncertainty in addition to limitations of the numerical model itself. In addition, the globe thermometer method requires local wind speed measurements to estimate the convective heat exchange around the globe following ISO 7726 procedures. The uncertainty of the low-cost anemometers (±0.5 m/s) may therefore propagate into the MRT calculation, particularly under weak wind conditions frequently observed within dense urban canopies where wind speeds are often below 1 m/s. Under these conditions, relative errors in the estimated convective heat transfer coefficient may become significant and contribute to uncertainties in the experimental MRT values used for model validation.
Second, measurements were conducted at approximately 3 m above ground level rather than at the standard pedestrian-level heights commonly recommended for biometeorological assessment (typically 1.1–1.5 m). This installation height was selected to reduce vandalism risk and ensure stable long-term deployment on residential building façades. Although the sensors remained located within the urban canopy layer and captured representative near-building outdoor microclimatic conditions, the resulting validation should be interpreted as representative of residential micro-environments at approximately 3 m above ground rather than standard pedestrian-level exposure. Consequently, caution should be exercised when extrapolating the reported UTCI accuracy directly to pedestrian-height thermal comfort assessments. In addition, the monitoring stations were installed approximately 40–60 cm away from building façades using supporting poles. While this configuration was necessary to reduce the direct thermal influence of the walls, it may locally modify the airflow owing to pole-induced turbulence and near-wall velocity gradients. Furthermore, these small-scale flow features cannot be explicitly resolved by the 2 m horizontal grid used in ENVI-met, so the simulated wind speed was extracted from the centre of the corresponding grid cell. Part of the discrepancies observed for wind speed may therefore result from the mismatch between the measurement configuration and the spatial resolution of the numerical model.
Third, meteorological forcing data were obtained from the Météo-France station located at Gillot Airport, approximately 5 km from the study district. While this station represents the only continuous and reliable source of meteorological observations for the Saint-Denis area, its open coastal environment differs substantially from the dense urban morphology of the study site. Consequently, boundary forcing may not fully reproduce local airflow structures, radiative conditions, or cloud variability within the neighbourhood. Part of the observed discrepancies in wind speed and MRT may therefore result from the mismatch between regional forcing conditions and local urban microclimate processes. The empirical wind-speed correction investigated in this study also relies on a constant attenuation coefficient derived from a single monitoring campaign. Although this simple approach substantially improves the simulated wind field, it does not account for directional roughness effects, atmospheric stability, or temporal variations in urban flow attenuation. More advanced approaches based on direction-dependent aerodynamic roughness parameterization or dynamic wind correction strategies could further improve the representation of urban airflow.
In addition, the validation was conducted in a single dense residential neighbourhood (LCZ 1) located in a coastal tropical island environment strongly influenced by trade winds and maritime conditions. Although this neighbourhood is representative of a common urban morphology on Reunion Island, the reported model performance should not be considered representative of all tropical urban environments. Model accuracy is expected to depend on local urban morphology, vegetation, street geometry, and regional climatic conditions. Consequently, additional validation studies across other Local Climate Zones (LCZs), tropical cities, and climatic contexts are needed before broader conclusions on ENVI-met performance in tropical environments can be established.
Finally, some limitations are also related to the ENVI-met modelling framework itself. Although ENVI-met reproduces thermodynamic variables with satisfactory accuracy, the model shows limited ability to capture highly transient airflow structures, recirculation zones, and local turbulence within confined urban canopies. In addition, urban materials were represented using the default ENVI-met material database rather than site-specific thermophysical properties. This choice was made to evaluate the model under a standard and reproducible configuration that is representative of typical engineering practice, where detailed material databases are rarely available. Although locally calibrated material properties could potentially improve agreement with observations, such an approach would reduce the general applicability and reproducibility of the proposed validation framework. Residual errors in reflected shortwave radiation may also remain due to the 2 m grid resolution and the simplified representation of façade and surface optical properties, particularly in dense urban configurations where small-scale reflective elements and lateral radiative exchanges are important. Future work could therefore investigate the influence of site-specific material characterization, together with direction-dependent roughness parameterization, locally measured forcing data, and multi-scale modelling strategies coupling mesoscale and neighbourhood-scale simulations.
5. Conclusions
This study investigated the reliability of ENVI-met for outdoor thermal comfort assessment in a dense coastal tropical urban environment using a spatially distributed monitoring network and a multi-variable validation framework.
Results show that ENVI-met reproduces air temperature and relative humidity with good accuracy at neighbourhood scale (RMSE of 1.2–1.5 C and 5–7%), while wind speed and mean radiant temperature exhibit larger uncertainties and strong spatial variability depending on local urban morphology. Wind speed errors are highly sensitive to boundary conditions, whereas MRT deviations are primarily driven by complex radiative processes and heterogeneous shading.
The multi-point validation demonstrates that model performance can vary substantially within a single neighbourhood, with wind speed RMSE ranging from 0.3 to more than 4 m s−1. This highlights the limitations of single-point validation and the need for spatially distributed measurements when assessing model reliability.
Error-propagation analysis shows that 62% of UTCI error variance is explained by combined microclimate simulation errors. Radiative conditions emerge as the dominant contributor to thermal comfort uncertainty, followed by air temperature and wind speed, while relative humidity plays a negligible role under the studied tropical conditions.
Sensitivity analyses confirm that wind boundary conditions are a major source of uncertainty. A simple roughness-based correction significantly improves wind speed magnitude (RMSE reduction exceeding 60%), whereas spin-up duration has negligible influence under full-forcing conditions. More broadly, the proposed validation framework based on multi-point measurements, uncertainty propagation, and sensitivity analyses can be transferred to other study sites and may facilitate future validation campaigns across different tropical urban contexts.
All things considered, the present results indicate that ENVI-met can reliably reproduce the main thermodynamic characteristics of the investigated dense tropical residential neighbourhood when appropriate modelling practices are adopted. However, the reported performance should be interpreted within the specific context of this study and should not be directly generalized to other tropical urban environments. Model accuracy is expected to vary with urban morphology, Local Climate Zone (LCZ), vegetation, and regional climatic conditions. Additional validation studies conducted in other tropical cities and across a wider range of urban forms are therefore required to establish the broader applicability of ENVI-met for tropical urban climate modelling.