Article

Extreme Precipitation in China (1960–2020): Spatiotemporal Evolution and Atmosphere–Ocean Circulation Drivers


1
State Key Laboratory of Soil and Water Conservation and Desertification Control, College of Soil and Water Conservation Science and Engineering (Institute of Soil and Water Conservation), Northwest A&F University, Yangling 712100, China
2
Institute of Soil and Water Conservation, Chinese Academy of Sciences and Ministry of Water Resources, Yangling 712100, China
3
Key Laboratory of Water Cycle and Related Land Surface Processes, Institute of Geographic Sciences and Natural Resources Research, Chinese Academy of Sciences, Beijing 100101, China
4
College of Natural Resources and Environments, Northwest A&F University, Yangling 712100, China
*
Author to whom correspondence should be addressed.
Climate 2026, 14(6), 112; https://doi.org/10.3390/cli14060112
Submission received: 26 March 2026 / Revised: 7 May 2026 / Accepted: 16 May 2026 / Published: 23 May 2026
(This article belongs to the Section Weather, Events and Impacts)

Highlights

What are the main findings?
  • Seven extreme precipitation indices showed increasing trends in China (1960–2020) with abrupt changes after 2010, while CWD decreased significantly.
  • ENSO-PNA, SCSMMI-WPSHI, and ENSO-NAO-EASMI were identified as the primary circulation drivers of extreme precipitation.
What is the implication of the main finding?
  • The intensification of extreme precipitation in southeastern China calls for region-specific disaster mitigation strategies.
  • Non-stationary teleconnections between precipitation and circulation indices highlight the need for regularly updated forecast frameworks.

Abstract
Amid the ongoing acceleration of climate change over recent decades, extreme precipitation events have become more frequent and intense on a global scale, triggering severe natural hazards and considerable socioeconomic damage. Nevertheless, how extreme precipitation has evolved at the national level over long time spans, and what role atmosphere–ocean teleconnections play in driving regional differences, remains insufficiently explored. This study addresses that knowledge gap by conducting a comprehensive assessment of eight ETCCDI-based extreme precipitation indices (PRCPTOT, CWD, R20, R95p, R99p, RX1day, RX5day, and SDII) across six climatic sub-regions of China (Northeast, North, East, Central South, Northwest, and Southwest) over 1960–2020, drawing on daily records from 695 quality-controlled meteorological stations. Key atmospheric and oceanic circulation drivers were further diagnosed and their joint influence was quantified via multiple wavelet coherence (MWC). The analysis shows that five of the eight indices (CWD, R95p, R99p, RX1day, and RX5day) underwent statistically significant fluctuating changes (p < 0.05) throughout the 61-year record. Seven indices, all except CWD, demonstrated upward tendencies, with mutation points clustering after 2010, most notably between 2011 and 2016. Wavelet power spectra indicates elevated energy concentrations at multiple time scales, although only CWD exhibited a statistically significant periodicity of approximately 8–10 a (p < 0.05 against red noise). In terms of spatial patterns, index magnitudes generally increased along a northwest-to-southeast gradient. Stations registering significant upward shifts were concentrated in East and Central South China, whereas significant downward shifts appeared mainly in North China and the northern portion of East China. An altitude-dependent pattern was also detected: CWD rose with elevation, while the remaining indices declined sharply below 1288 m, fluctuated in the 1288–2090 m band, and dropped again above 2090 m. Wavelet coherence analysis uncovered significant resonance between extreme precipitation and four circulation indices—SCSMMI, WPSHI, PNA, and NAO. MWC further identified three driver combinations—ENSO-PNA, SCSMMI-WPSHI, and ENSO-NAO-EASMI—as the most influential, acting both individually and synergistically. These results furnish an empirical basis for forecasting, preventing, and managing precipitation-related disasters across China under future climate scenarios.

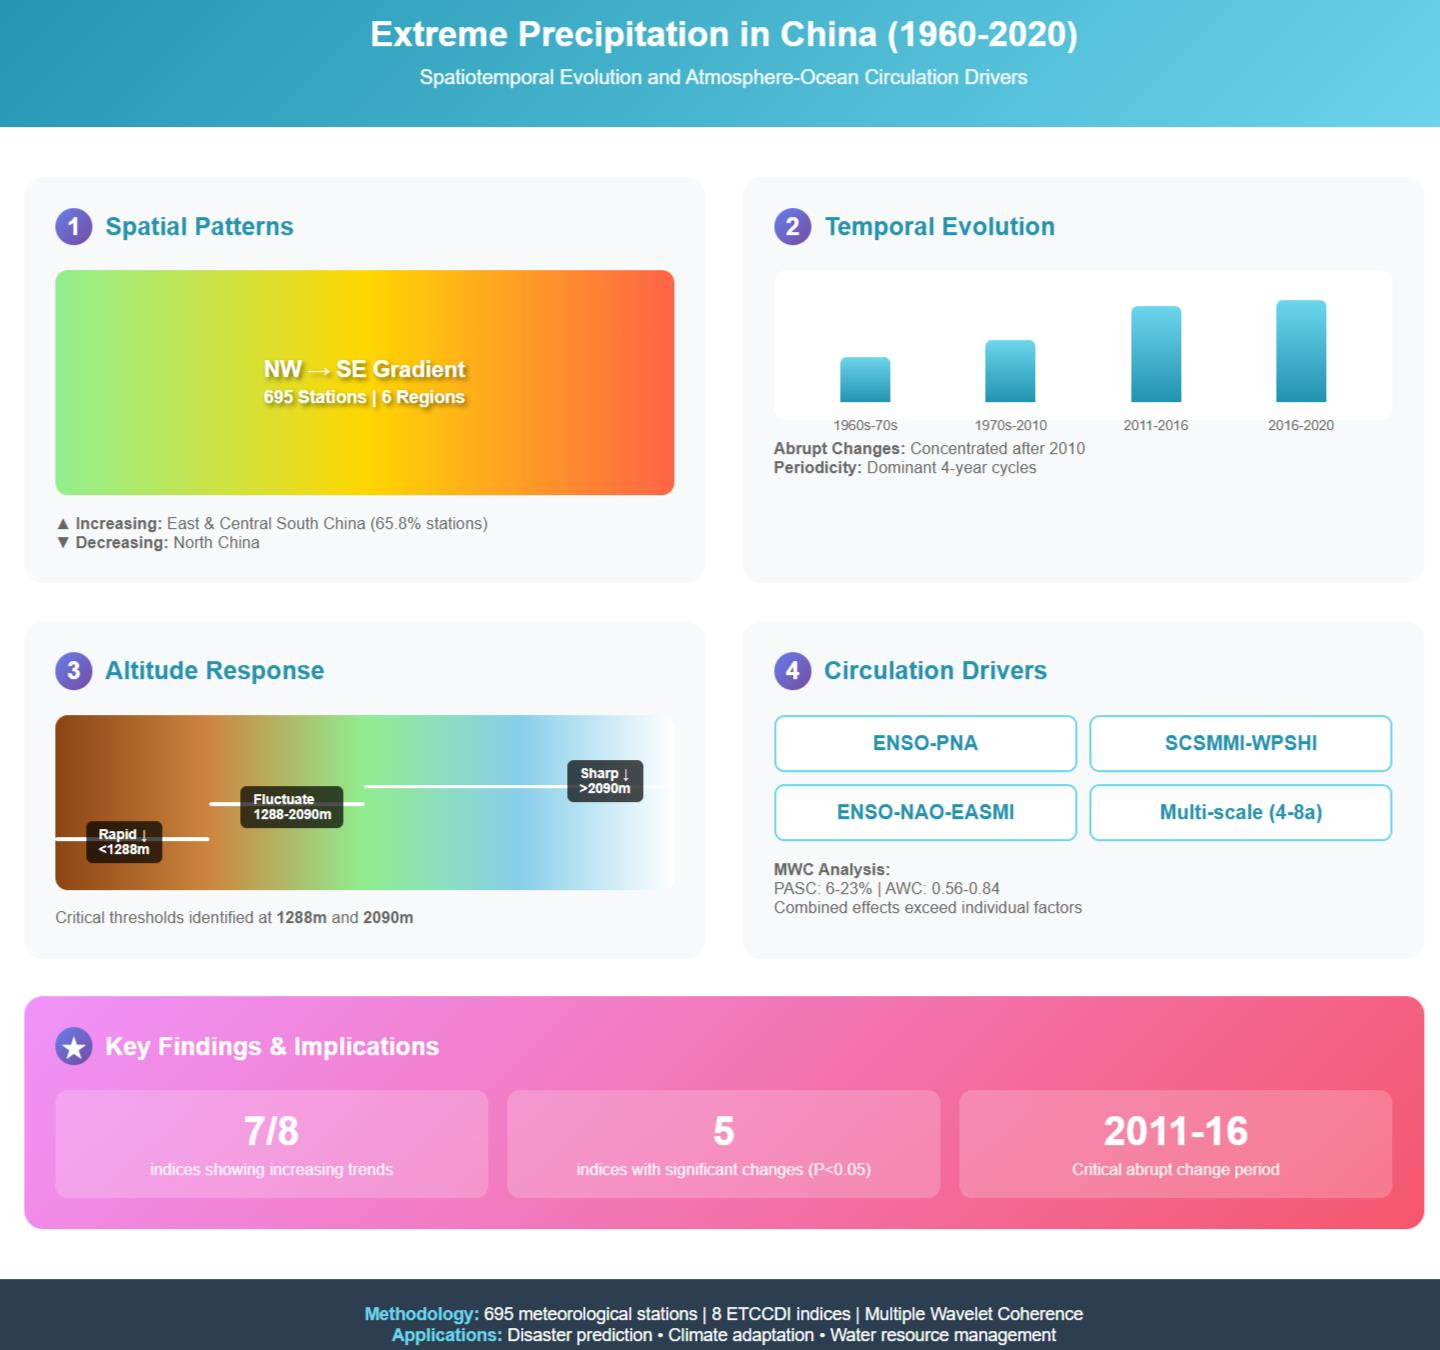
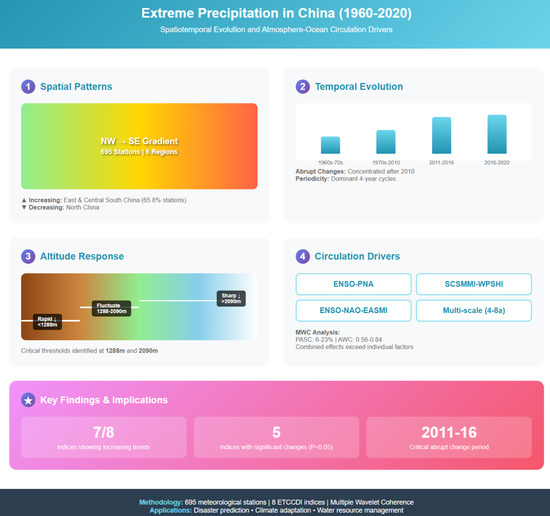
Graphical Abstract

1. Introduction

Over the past two decades, a conspicuous rise in both the recurrence and strength of extreme precipitation has been documented on a global scale—even comparatively modest shifts in these events can exert far-reaching consequences on agricultural output, economic activity, societal well-being, and human safety [1,2,3,4,5]. The IPCC Sixth Assessment Report projected a continued upward trajectory of global mean precipitation [6], a trend that is expected to amplify rainfall variability and elevate the likelihood of extreme episodes. Complementary analyses have demonstrated that anthropogenic warming is a major contributor to this heightened climate variability, leading to progressively more frequent and severe precipitation extremes [7]. Recent events underscore the urgency of addressing this issue. In April 2024, unprecedented heavy rains in arid regions of Pakistan, Afghanistan, and the United Arab Emirates resulted in a significant loss of life. Following this, in June 2024, Southern China experienced three successive severe rainfall events, and by July, extensive rainfall led to widespread, devastating floods across the Yangtze River, Huaihe River, and Yellow River basins. These incidents illustrate the critical need for an in-depth understanding of regional and national variations in extreme precipitation events, especially in high-risk areas. Addressing their variations is essential for implementing precise, effective countermeasures aimed at mitigating the adverse effects of these severe, increasingly extreme precipitation events.
Within China, the overall magnitude of precipitation extremes has followed an upward trajectory [8,9,10,11], yet this national-level trend conceals pronounced inter-regional contrasts. Southern China, and the Yangtze River Basin in particular, has experienced an intensification of extreme rainfall [12,13], whereas weakening signals have been reported across northern and northeastern China as well as the eastern fringe of the Northwest [14,15]. A notable limitation of previous work is that individual studies have typically focused on specific sub-regions and employed disparate indicator sets and analytical frameworks [16,17], which hampers systematic cross-regional comparison and makes it difficult to formulate coordinated mitigation strategies at the national scale. Consequently, a unified investigation that applies a consistent set of indices and methods across all major climatic zones of China is warranted.
Currently, methods for identifying and quantifying extreme precipitation events can be broadly categorized into three types. The first type is the absolute threshold method, which defines extreme events based on fixed precipitation amounts (e.g., daily precipitation exceeding 50 mm), offering straightforward physical interpretation but limited comparability across climatologically diverse regions due to spatial heterogeneity in baseline precipitation [7]. The second type is the percentile-based method, which defines extremes relative to a locally derived statistical threshold (e.g., the 95th or 99th percentile of daily precipitation), thereby accounting for regional climatic differences; however, the results are sensitive to the choice of reference period and baseline distribution assumptions [7]. The third type is the use of standardized index systems, most notably the set of climate extreme indices developed by the Expert Team on Climate Change Detection and Indices (ETCCDI) under the framework of the World Meteorological Organization (WMO), which has become the internationally recognized standard for monitoring and comparing climate extremes across regions and time periods [6].
In this study, we adopt the ETCCDI framework for the following reasons. First, these indices have been rigorously defined and widely validated across global and regional studies [18], enabling direct cross-regional and cross-study comparisons that are not possible when different thresholds or methods are applied. Second, the ETCCDI framework simultaneously captures multiple dimensions of extreme precipitation—including frequency (R20), duration (CWD), and intensity (RX1day, RX5day, SDII, R95p, R99p, PRCPTOT)—providing a comprehensive characterization of precipitation extremes that single-metric approaches cannot achieve. Third, the RClimDex software associated with this framework facilitates standardized data quality control and index calculation [19], ensuring methodological consistency across the 695 meteorological stations used in this study.
Worldwide extreme precipitation events exhibit significant variability which is profoundly influenced by large-scale atmospheric circulation patterns. These patterns include the El Niño-Southern Oscillation (ENSO), North Atlantic Oscillation (NAO), Pacific Decadal Oscillation (PDO), and Arctic Oscillation (AO). Current research on extreme precipitation drivers has frequently relied on correlation analyses to underscore the pivotal role of large-scale circulation patterns [20,21,22,23]. However, these bivariate methods inherently assume stationary linear relationships and examine atmospheric factors in isolation, potentially obscuring their interactive and scale-dependent effects. This study addresses these limitations by integrating multiple wavelet coherence (MWC) techniques, which enable simultaneous evaluation of how multiple circulation drivers (ENSO, NAO, PNA, SCSMMI, WPSHI) jointly influence extreme precipitation across different temporal scales. Unlike conventional approaches, MWC can identify time-localized coherence patterns and quantify the relative contribution of individual versus combined atmospheric forcing in non-stationary settings [24,25].
The overall objectives of this study are to analyze the past-60-year trends of extreme precipitation in various regions across China and based on a suite of precipitation-related indices recommended by the Expert Team on Climate Change Detection and Indices (ETCCDI) and to reveal the correlations between their change trends with atmosphere–ocean circulation patterns. The spacial aims of this study are to: (1) characterize the spatial distribution patterns of extreme precipitation indices across sub-six regions in China; (2) quantify regional differences and identify areas with significant trend changes; (3) investigate altitude-dependent variations in precipitation extremes; and (4) delineate high-risk zones for targeted disaster management. The results are expected to provide a better understanding of change trends of extreme precipitation events in terms of amount, frequency, and intensity, which can provide a scientific basis for the identification of extreme precipitation events and support for disaster prevention and mitigation.

2. Data Sources and Analysis Methods

2.1. Study Area

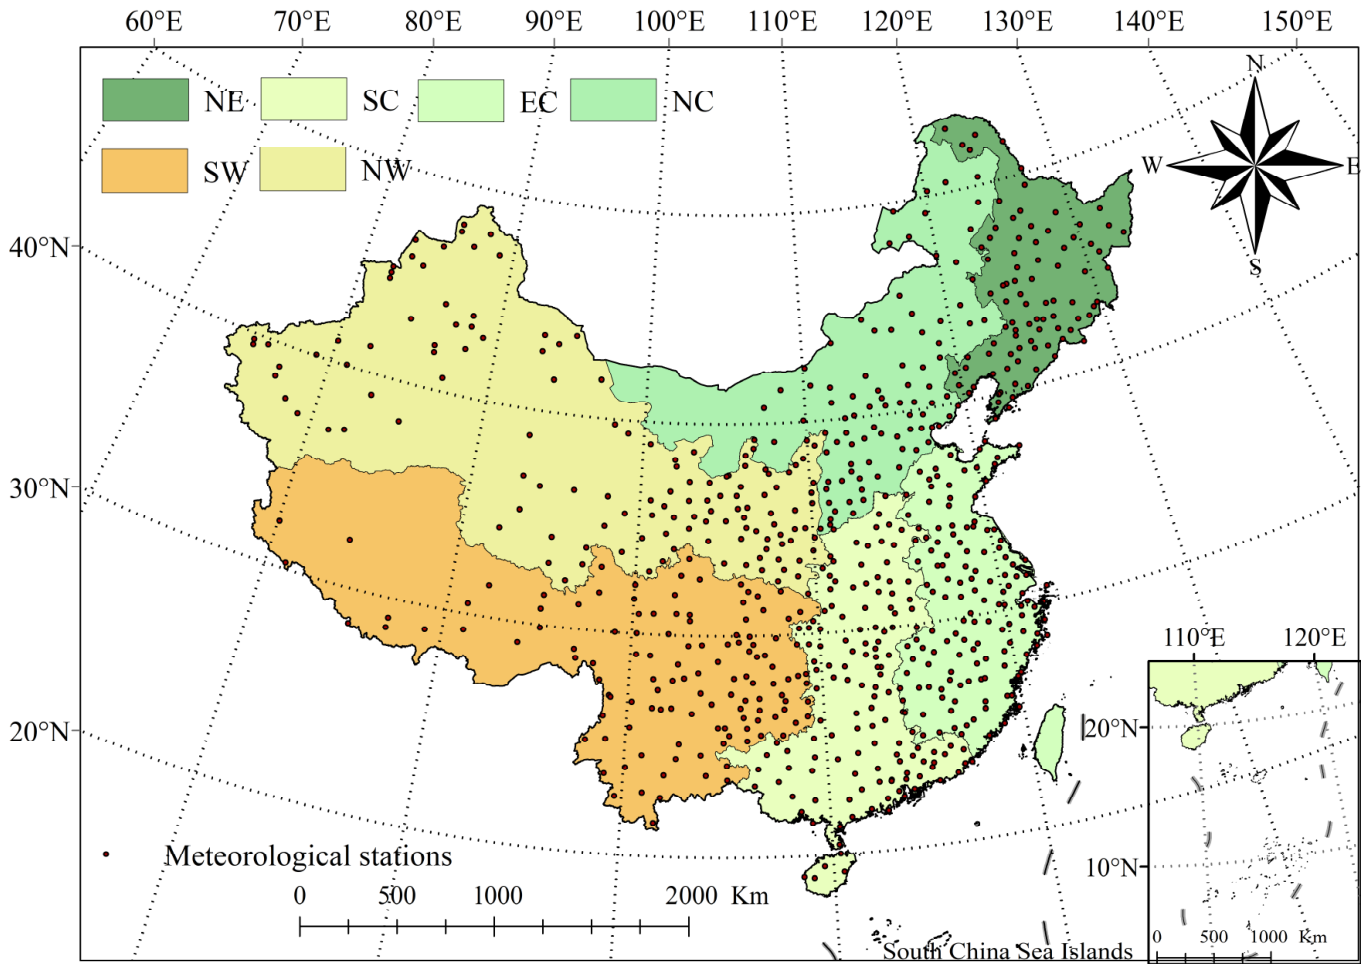
According to the division of six regions in China by the Center for Resources and Environmental Sciences and Data, Chinese Academy of Sciences (www.resdc.cn, accessed on 25 July 2021), the six sub-regions in this study were determined. The distribution of the six regions and meteorological stations is shown in Figure 1. The six sub-regions are: (1) Northeast China (NE)—characterized by a temperate monsoon climate with cold winters and warm summers, including Heilongjiang, Jilin, and Liaoning provinces; (2) North China (NC)—a semi-arid to sub-humid region encompassing Beijing, Tianjin, Hebei, Shanxi, and Inner Mongolia; (3) East China (EC)—a humid subtropical-to-temperate zone along the eastern coast including Shandong, Jiangsu, Zhejiang, Anhui, Fujian, Jiangxi, and Shanghai; (4) Central South China (SC)—a humid subtropical region including Henan, Hubei, Hunan, Guangdong, Guangxi Zhuang Autonomous Region, and Hainan; (5) Northwest China (NW)—an arid to semi-arid continental region including Xinjiang, Gansu, Qinghai, Ningxia Hui Autonomous Region and Shaanxi; and (6) Southwest China (SW)—a region of complex terrain including Sichuan, Yunnan, Guizhou, Tibet Autonomous Region, and Chongqing (Figure 1).

2.2. Data Source and Quality Control

Daily precipitation records for this investigation were drawn from the China Surface Climate Data archive (version 3.0), released by the National Meteorological Science Data Center (http://data.cma.cn). The archive encompasses 699 ground-based weather stations distributed across mainland China; records from Hong Kong, Macao, and Taiwan were unavailable. All observational data conform to the protocols jointly defined by the WMO and the China Meteorological Administration and cover the period 1960–2020. The dataset has been subjected to comprehensive quality assurance—encompassing outlier detection and internal-consistency verification which are widely recognized as a reliable foundation for Chinese climate studies [26]. Instrumentation and measurement protocols were standardized across stations. Nonetheless, historical disruptions have left gaps in some station records. To preserve analytical robustness, a two-stage screening procedure was applied prior to index computation. The criteria applied were: (1) any station with data loss exceeding 10% in a given year was excluded from that year’s analysis; and (2) only stations with more than 40 years of consistent data were considered. Consequently, among 699 stations, four stations had records ending before 2010 and they were excluded. Finally, 695 stations were selected in this study. This meticulous approach to data selection ensures the quality and reliability of the data used in further analyses.

2.3. Definition of Extreme Precipitation Indices

A suite of climate-extreme indicators was formulated under the auspices of the WMO during the Climate Change Monitoring conferences held between 1998 and 2001; this suite has since been adopted as the international benchmark for climate-extremes research. Of the 27 core indices in the framework, eight precipitation-related indicators were selected for the present analysis (Table 1): R20 (number of very heavy precipitation days), maximum 1-day precipitation (RX1day), maximum 5-day precipitation (RX5day), consecutive wet days (CWD), simple daily intensity index (SDII), very wet day precipitation (R95p), extremely strong precipitation (R99p), and wet-day precipitation (PRCPTOT). The RCLimDex software (version 1.0) was employed to manage the quality of the daily precipitation data. Using this software, the extreme precipitation indices for the selected meteorological stations were calculated according to the established definitions for each extreme climate index [19]. Subsequently, the extreme precipitation indices for each region were derived by computing the arithmetic average of the indices from the chosen stations. This methodological approach ensures a standardized assessment of extreme precipitation trends across different regions.

2.4. Atmosphere–Ocean Circulations

For this study, monthly scale atmospheric circulation indices for the period 1960–2020 were selected. These indices were sourced from the National Oceanic and Atmospheric Administration website (NOAA) (http://www.esrl.noaa.gov/psd/data/climateindices/list/, accessed on 7 March 2022), encompassing a comprehensive suite of indicators that are influential in understanding the climatic conditions affecting China. The indices include the Arctic Oscillation index (AO), Southern Oscillation index (SOI), North Atlantic Oscillation index (NAO), Pacific Decadal Oscillation index (PDO), Northern Oscillation index (NOI), Pacific North American index (PNA), Western Pacific index (WP), and Ocean Niño index (ONI), covering almost all potential atmospheric factors pertinent to the climate dynamics in China [27,28]. Additionally, seasonal-scale atmospheric circulation indices, particularly focused on monsoon activity, were incorporated. These indices comprise the East Asian Summer Monsoon Index (EASMI), the South China Sea Summer Monsoon Index (SCSSMI), and the intensity and area indices of the Western Pacific Subtropical High (WPSHII, WPSHIA). The data for these indices were obtained from the Earth Science and Engineering Data Sharing Service System (https://data.casearth.cn/, accessed on 11 March 2022), thus providing a robust framework for analyzing both temporal and spatial aspects of atmospheric influence on regional climate trends.
For the monsoon indices (SCSMMI, EASMI, WPSHII, WPSHIA), summer (June–August) mean values were used, as these indices are physically defined for the boreal summer season and their influence on precipitation in China is predominantly expressed during this period. For the large-scale oscillation indices (AO, NAO, ENSO/ONI, PDO, PNA, SOI, NOI, WP), values derived from the monthly data obtained from NOAA were used. This approach follows established practice in long-term trend studies [24,27].

2.5. Data Analysis

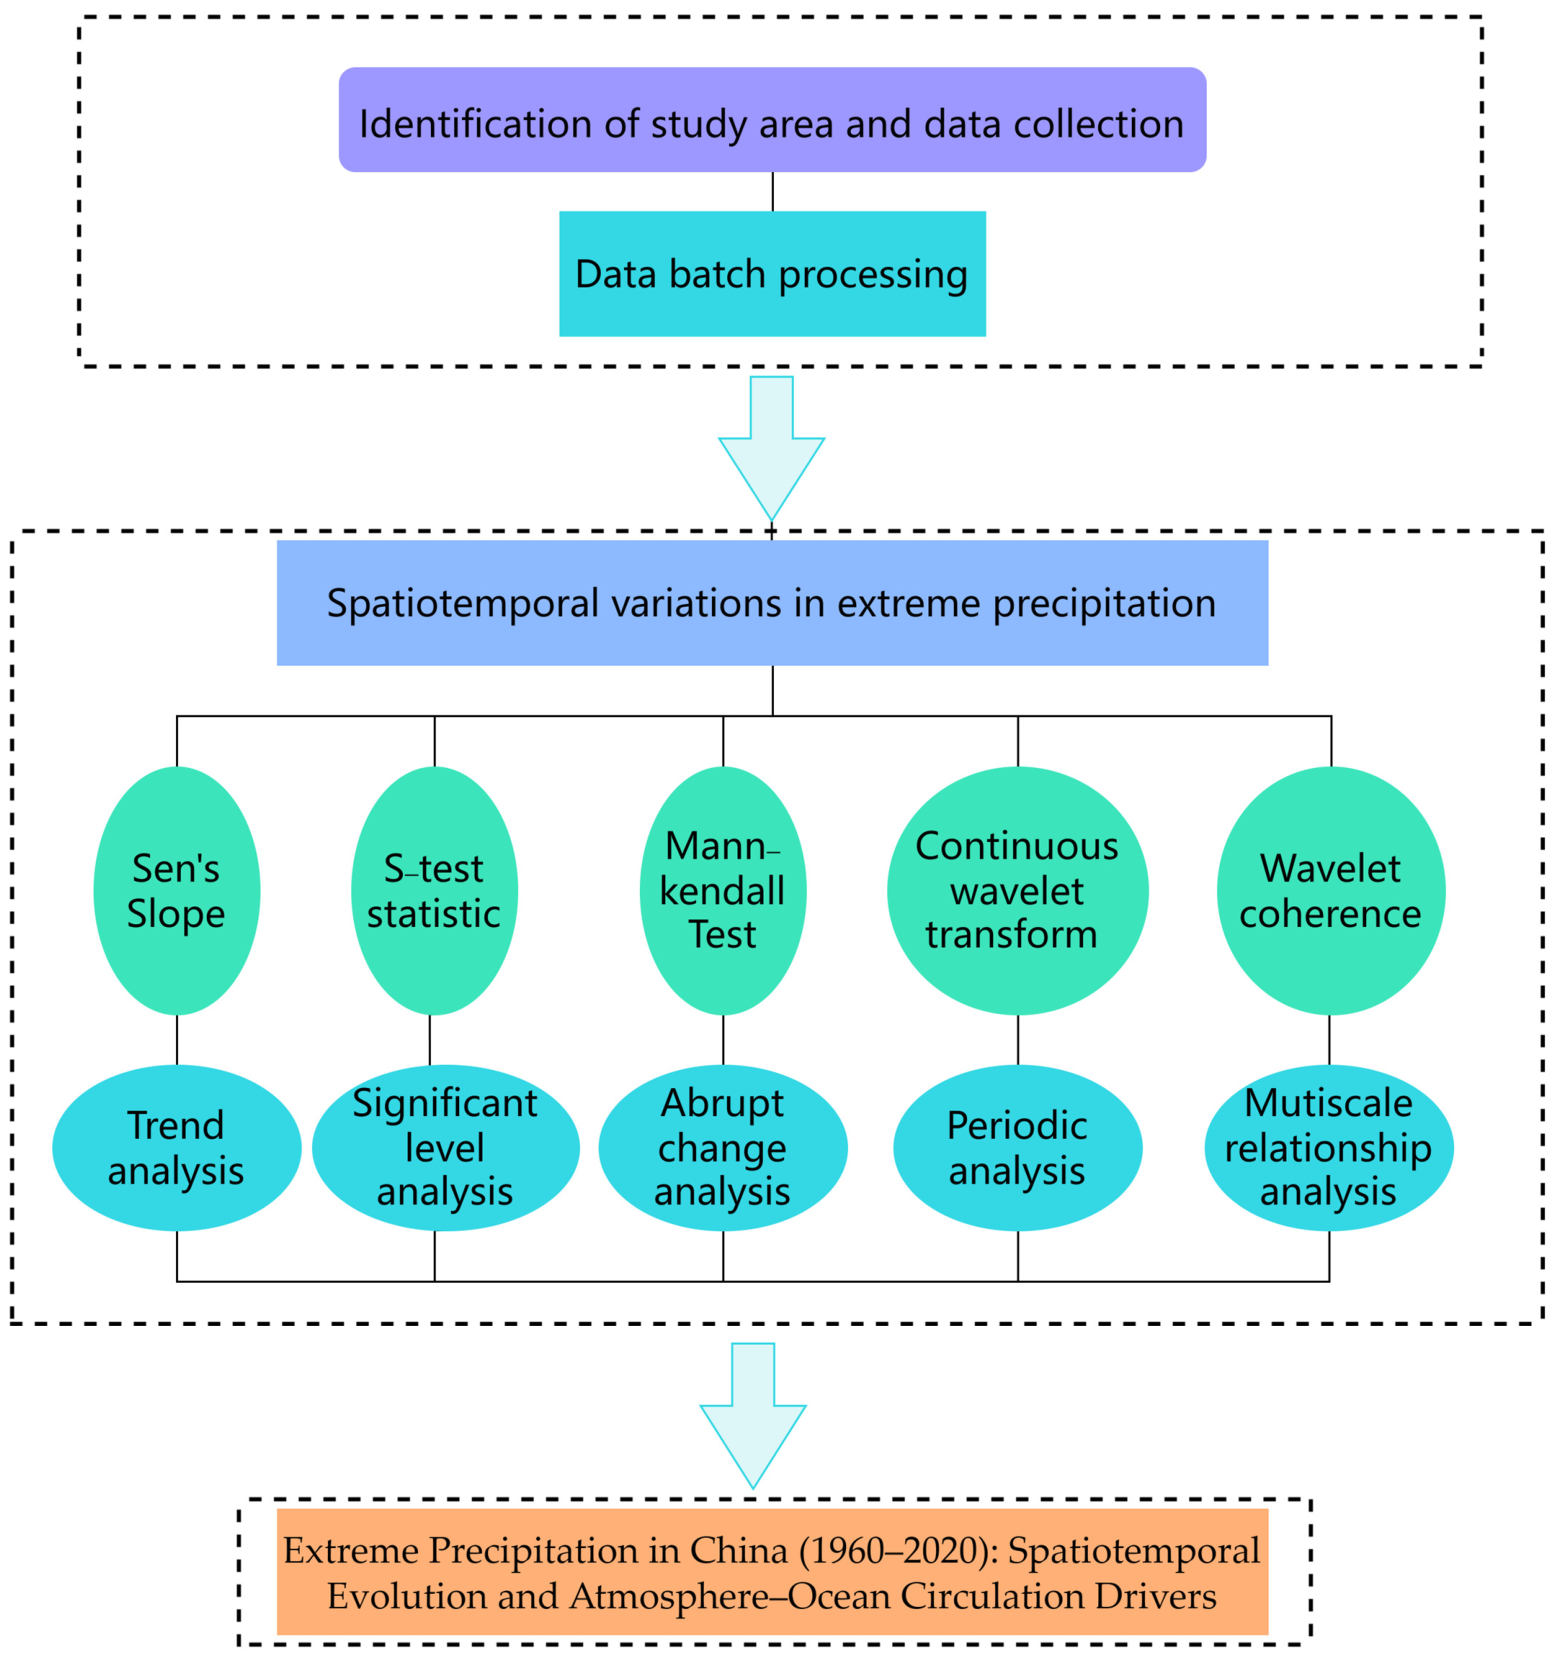
A combination of mathematical and statistical techniques was adopted to characterize the space–time variability of precipitation extremes and to elucidate their links with large-scale ocean–atmosphere forcing over China. The analytical workflow is outlined in Figure 2.
Trend magnitudes were estimated with the Sen slope estimator [29], a nonparametric approach valued for its computational efficiency and robustness against outlier contamination—properties that make it well suited to decadal-to-centennial hydroclimatic records. Linear associations and time-varying coupling between precipitation-extreme and circulation indices were examined through Pearson correlation coefficients in conjunction with wavelet-based techniques. Continuous wavelet transforms (CWT) served to decompose the spectral content of each precipitation index, revealing the dominant oscillatory modes and their temporal localization. Wavelet transform coherence (WTC) and its multivariate extension, multiple wavelet coherence (MWC), were then applied to disentangle the influence of individual versus combined circulation drivers at scale-specific and time-localized levels. The Wavelet coherence analysis employs a series of smoothed self-wavelet and cross-wavelet power spectra to calculate the wavelet coefficients of each variable at various scales, providing a detailed view of the interdependencies between extreme precipitation and atmospheric patterns over time.
Similar to WTC, MWC determines the correlation between the response variable and multiple predictor variables utilizing the auto and cross-wavelet power spectra at different scales and spatial (or temporal) locations [30]. The matrix of the smoothed cross-wavelet power spectra between the response variable Y and multiple predictor variables X can be defined as
w ( Y , X )   ( s , τ ) = w ( Y , X 1 )   s , τ w Y , X 2   s , τ w ( Y , X q )   ( s , τ )
where w (s, τ) denotes the smoothed cross-wavelet power spectra between the response variable Y and multiple predictor variables X at scale s and spatial (or temporal) location τ. In this study, Y is extreme precipitation indices, and X denotes the predictor variables (climate index).
Trend direction and abrupt-change detection were carried out with the Mann–Kendall test [31,32], a rank-based nonparametric test widely endorsed by the WMO for hydrometeorological time-series analysis. Under this framework, a positive test statistic Z indicates an upward tendency and a negative Z a downward tendency; |Z| > 1.96 signals significance at the α = 0.05 level [33]. Spatial interpolation of index magnitudes and their linear trends was performed via inverse-distance weighting (IDW) within the ArcGIS 10.5 geostatistics module.

3. Results

3.1. Temporal Variation Characteristics in Extreme Precipitation Indices

3.1.1. Interannual Variations in Extreme Precipitation Indices

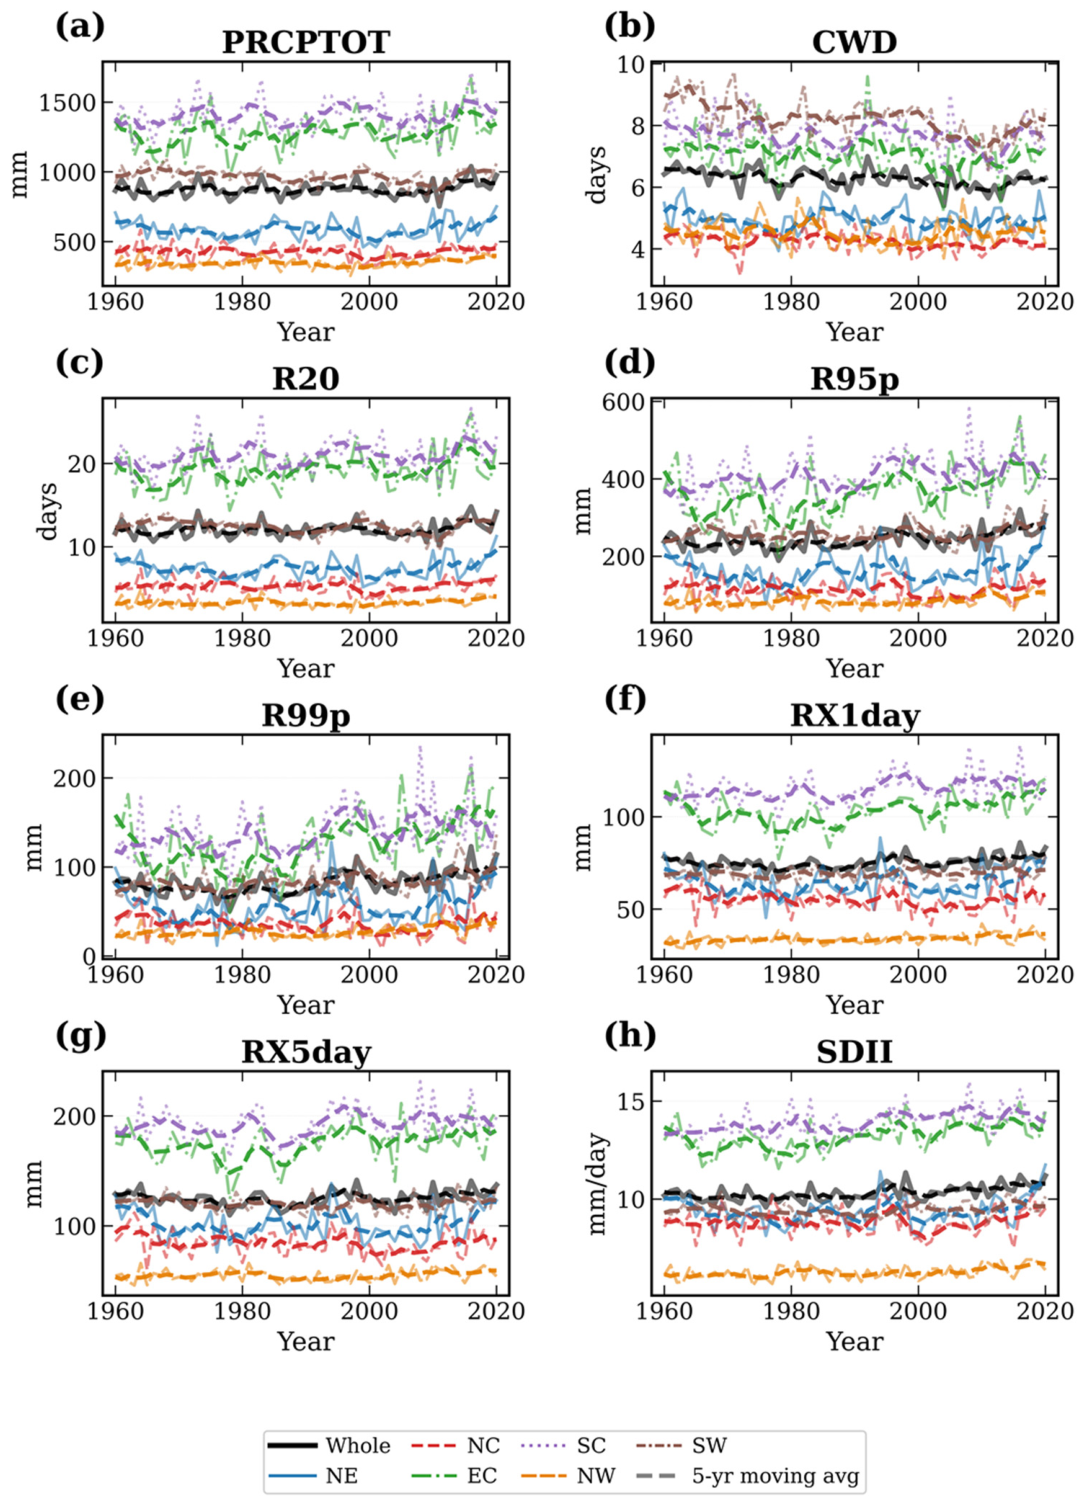
Figure 3 and Table 2 summarize the 61-year trajectories of the eight indices at the national and sub-regional scales. The indices such as PRCPTOT, R20, R95p, R99p, RX1day, RX5day, and SDII displayed increasing trends, whereas CWD exhibited a decreasing trend. Specifically, the rates for R95p, R99p, RX1day, and SDII were significantly positive, recorded at 6.86 mm/decade, 3.80 mm/decade, 0.77 mm/decade, and 0.11 mm/day/decade respectively (p < 0.01). Conversely, PRCPTOT, R20, and RX5day showed non-significant increases at rates of 5.58 mm/decade, 0.12 days/decade, and 0.85 mm/decade, respectively. The decrease in CWD was significant, showing a decline rate of −0.07 days/decade (p < 0.01).
The interannual fluctuations within the six sub-regions demonstrated consistent patterns over several periods, although the magnitude and specific trends differed among regions. Notably, PRCPTOT trended downwards from 1960 to 1970, remained fluctuating yet stable from 1970 to 2010, and then trended upwards from 2010 to 2020. CWD decreased from 1960 to 2010, but increased thereafter. R20, on the other hand, showed decreasing fluctuations from 1960 to 1970, increasing fluctuations from 1970 to 2010, and a clear upward trend post-2010. The trends for R95p and R99p were similarly characterized by an initial drop from 1960 to 1970, stability from 1980 to 2010, and a rise post-2010. RX1day, RX5day, and SDII followed a pattern of fluctuating decline, overall stability, and then a rise. With the exception of CWD, the trends for the remaining seven indices could be summarized into three phases: a fluctuating decline during the 1960s to 1970s, a period of fluctuation with a stable mean value or an initial increase followed by a decrease from the 1970s to around 2010, and a distinct rising fluctuation from 2010 to 2020. Thus, the extreme precipitation indices in China from 1960 to 2020 exhibited interannual fluctuations without a significant overarching trend, though wavelet analysis revealed that most of these fluctuations did not exceed the red-noise background at the 95% confidence level (see Section 3.1.3).
In the specific sub-regions, the annual variability of each extreme precipitation index allowed for distinctions in magnitude and local trends. In Eastern China, significant upward trends were noted for PRCPTOT, R20, R95p, R99p, RX1day, RX5day, and SDII, with variation rates of 20.04 mm/decade, 0.37 days/decade, 16.98 mm/decade, 8.54 mm/decade, 1.78 mm/decade, 3.01 mm/decade, and 0.22 mm/day/decade respectively. In South China, R95p, R99p, RX1day, and SDII increased at rates of 10.90 mm/decade, 5.67 mm/decade, 1.50 mm/decade, and 0.20 mm/day/decade, respectively. The rates of increase for R95p, R99p, RX1day, and SDII in Northwest China were 3.01 mm/decade, 1.79 mm/decade, 0.60 mm/decade, and 0.07 mm/day/decade, respectively. In Southwest China, while CWD decreased at a rate of −0.19 days/decade, R95p increased by 3.13 mm/decade. The trends in extreme precipitation indices in Northeast and Northern China were not significant.

3.1.2. Abrupt Change Analysis of Extreme Precipitation Indices

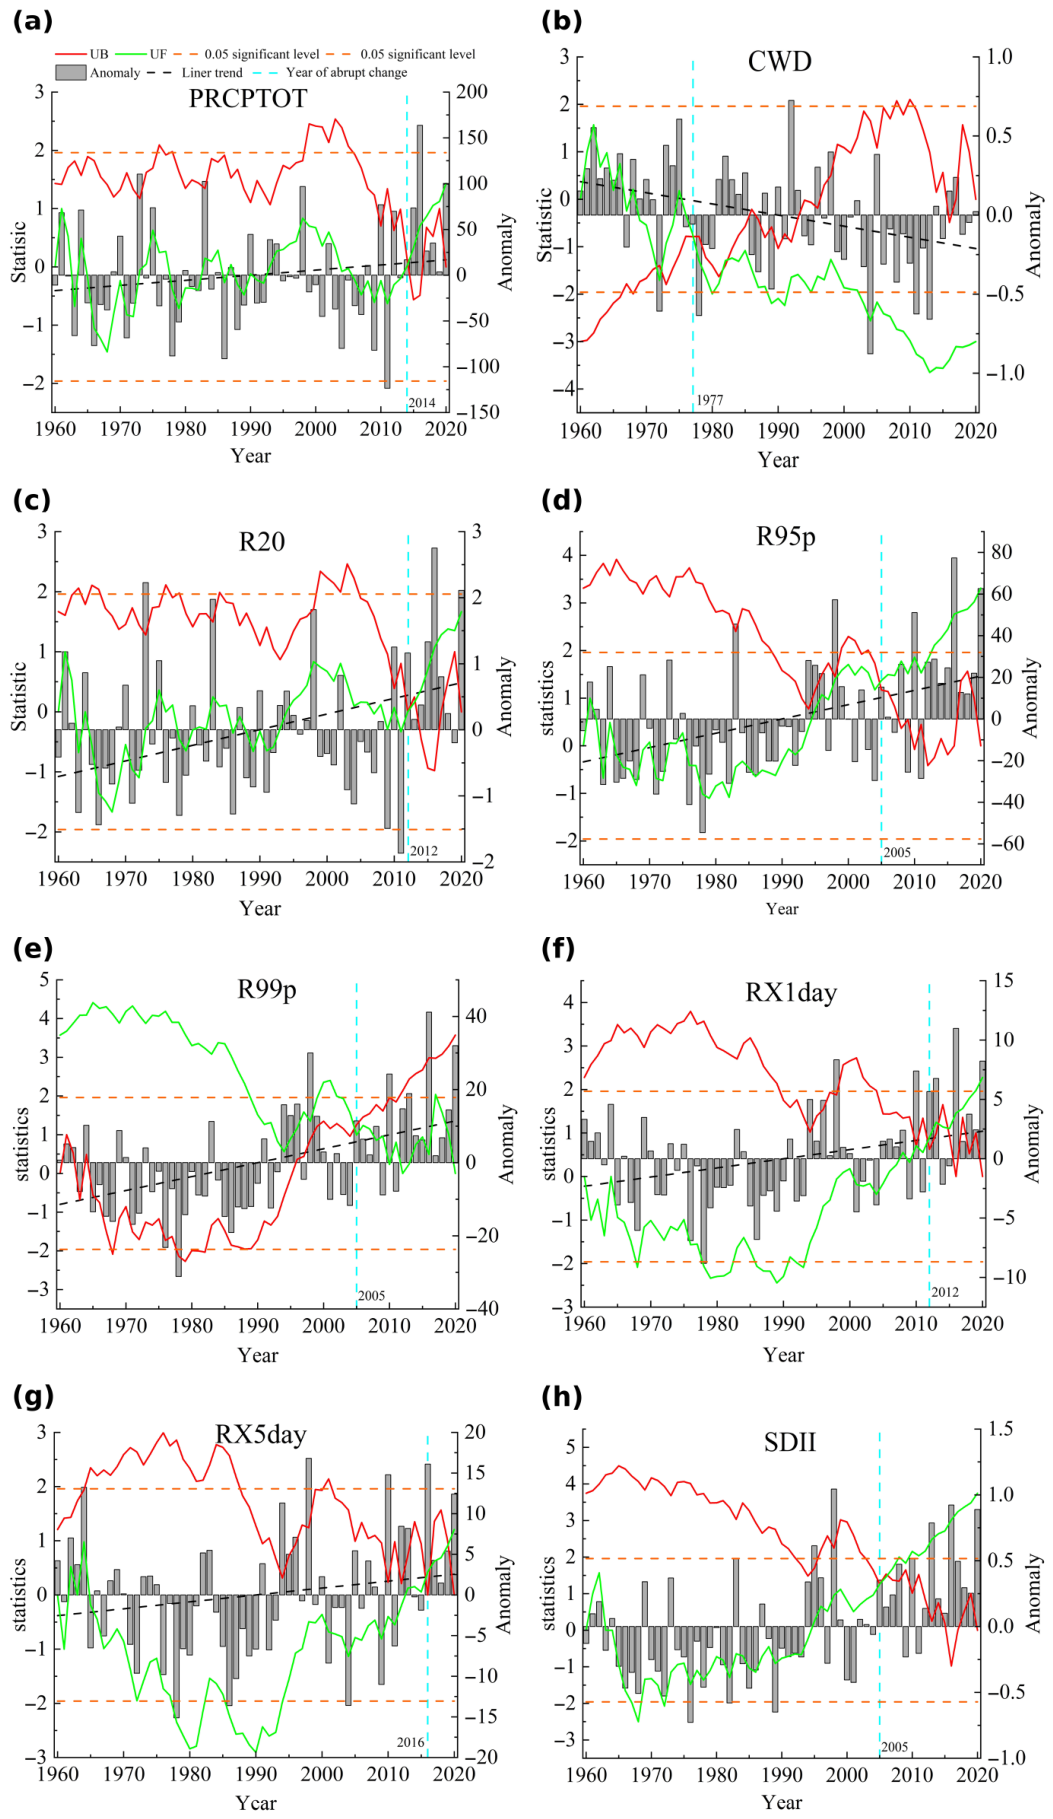
Table 3 shows the annual distribution of abrupt changes in the extreme precipitation indices. Except for CWD, the seven extreme precipitation indices changed abruptly after the 21st century. The earliest mutation occurred in CWD in 1982, and the latest mutation occurred in RX5day in 2016. CWD experienced “more to less” mutations, while the other indices experienced “less to more” mutations.
Figure 4 shows the annual variation in each extreme precipitation index and the M-K test. PRCPTOT mutation increased from 2014; R20 mutation increased from 2015, 2012, and 2011, respectively. The mutations of R95p and R99p increased in 2005; the mutations of RX1day and RX5day increased in 2012 and 2016, respectively. SDII increased abruptly from 2005; CWD mutations decreased in 2001 and 1977, respectively. The intersection of the UF and UB curves for all indices was within the significance horizontal line and passed the significance test of 0.05, so the mutations in all indices were significant. It was worth noting that all of the indices with mutational increases occurred after 2000, and PRCPTOT, R20, RX1day, and RX5day occurred between 2011 and 2016.

3.1.3. Periodic Changes in Extreme Precipitation Indices

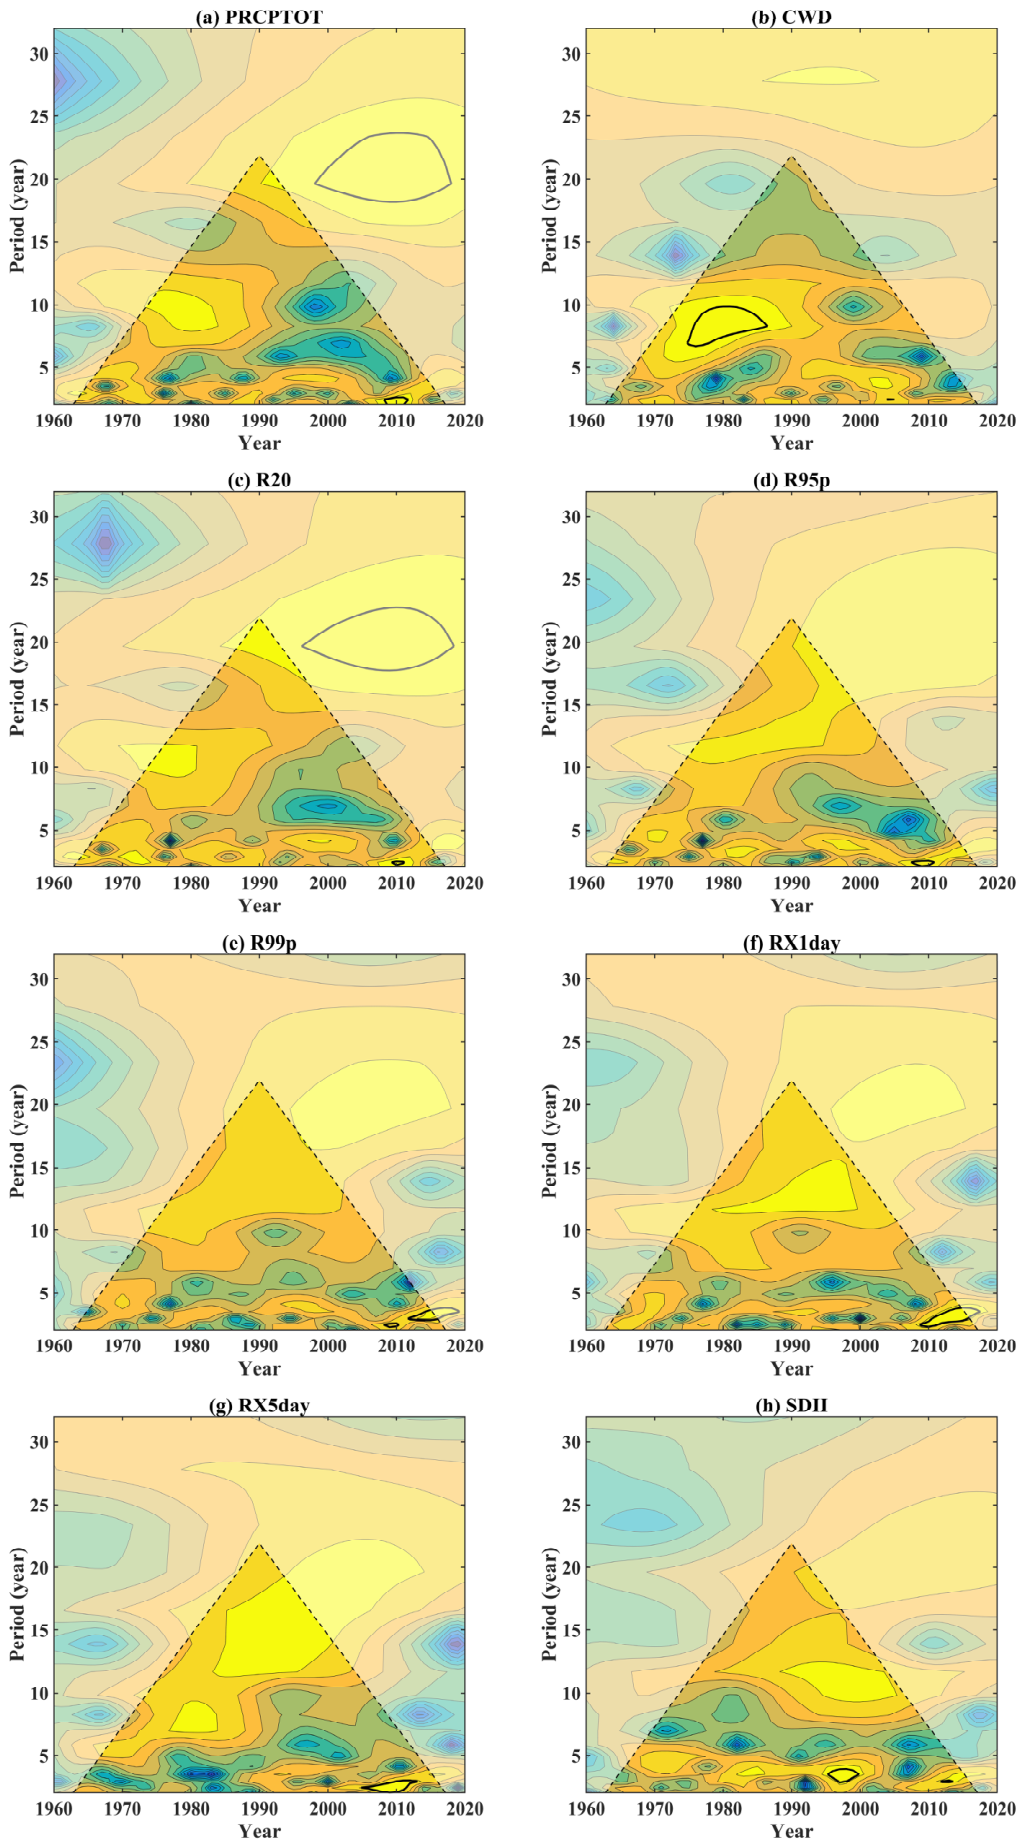
Continuous wavelet transform (CWT) was used to determine the periodic change in extreme precipitation indices, and statistical significance was tested against a red-noise (AR1) background spectrum at the 5% level. The wavelet power spectrum (WPS) of each extreme precipitation index is shown in Figure 5, where thick black contours enclose regions of statistically significant power and the dashed lines delineate the cone of influence (COI).
Within the COI, CWD exhibited a statistically significant periodicity of approximately 8–10 a during 1975–1995 (Figure 5b), representing the only index with a robust periodic signal confirmed by the significance test. The remaining seven indices displayed elevated wavelet power at various time scales but did not pass the 95% significance test against red noise within the COI. Specifically, PRCPTOT and R20 showed concentrated power at approximately 10–20 a within the COI, but these signals were not statistically distinguishable from a red-noise process (Figure 5a,c). R95p, R99p, RX1day, RX5day, and SDII exhibited broad power concentration at 8–20 a cycles centered around 1980–1995 within the COI (Figure 5d–h), with R99p, RX1day, and SDII showing localized significant power at short periods (approximately 2–3 a) near 2015–2020. The apparent long-period signals (>20 a) visible in several indices fell outside the COI and are therefore unreliable due to edge effects. These results suggest that the periodic fluctuations in most extreme precipitation indices do not significantly exceed background red-noise variability, while CWD displays a distinctive quasi-decadal oscillation that warrants further investigation into its physical drivers.

3.2. Spatial Variation Trend of Extreme Precipitation Indices

3.2.1. Spatial Distribution of Extreme Precipitation Indices

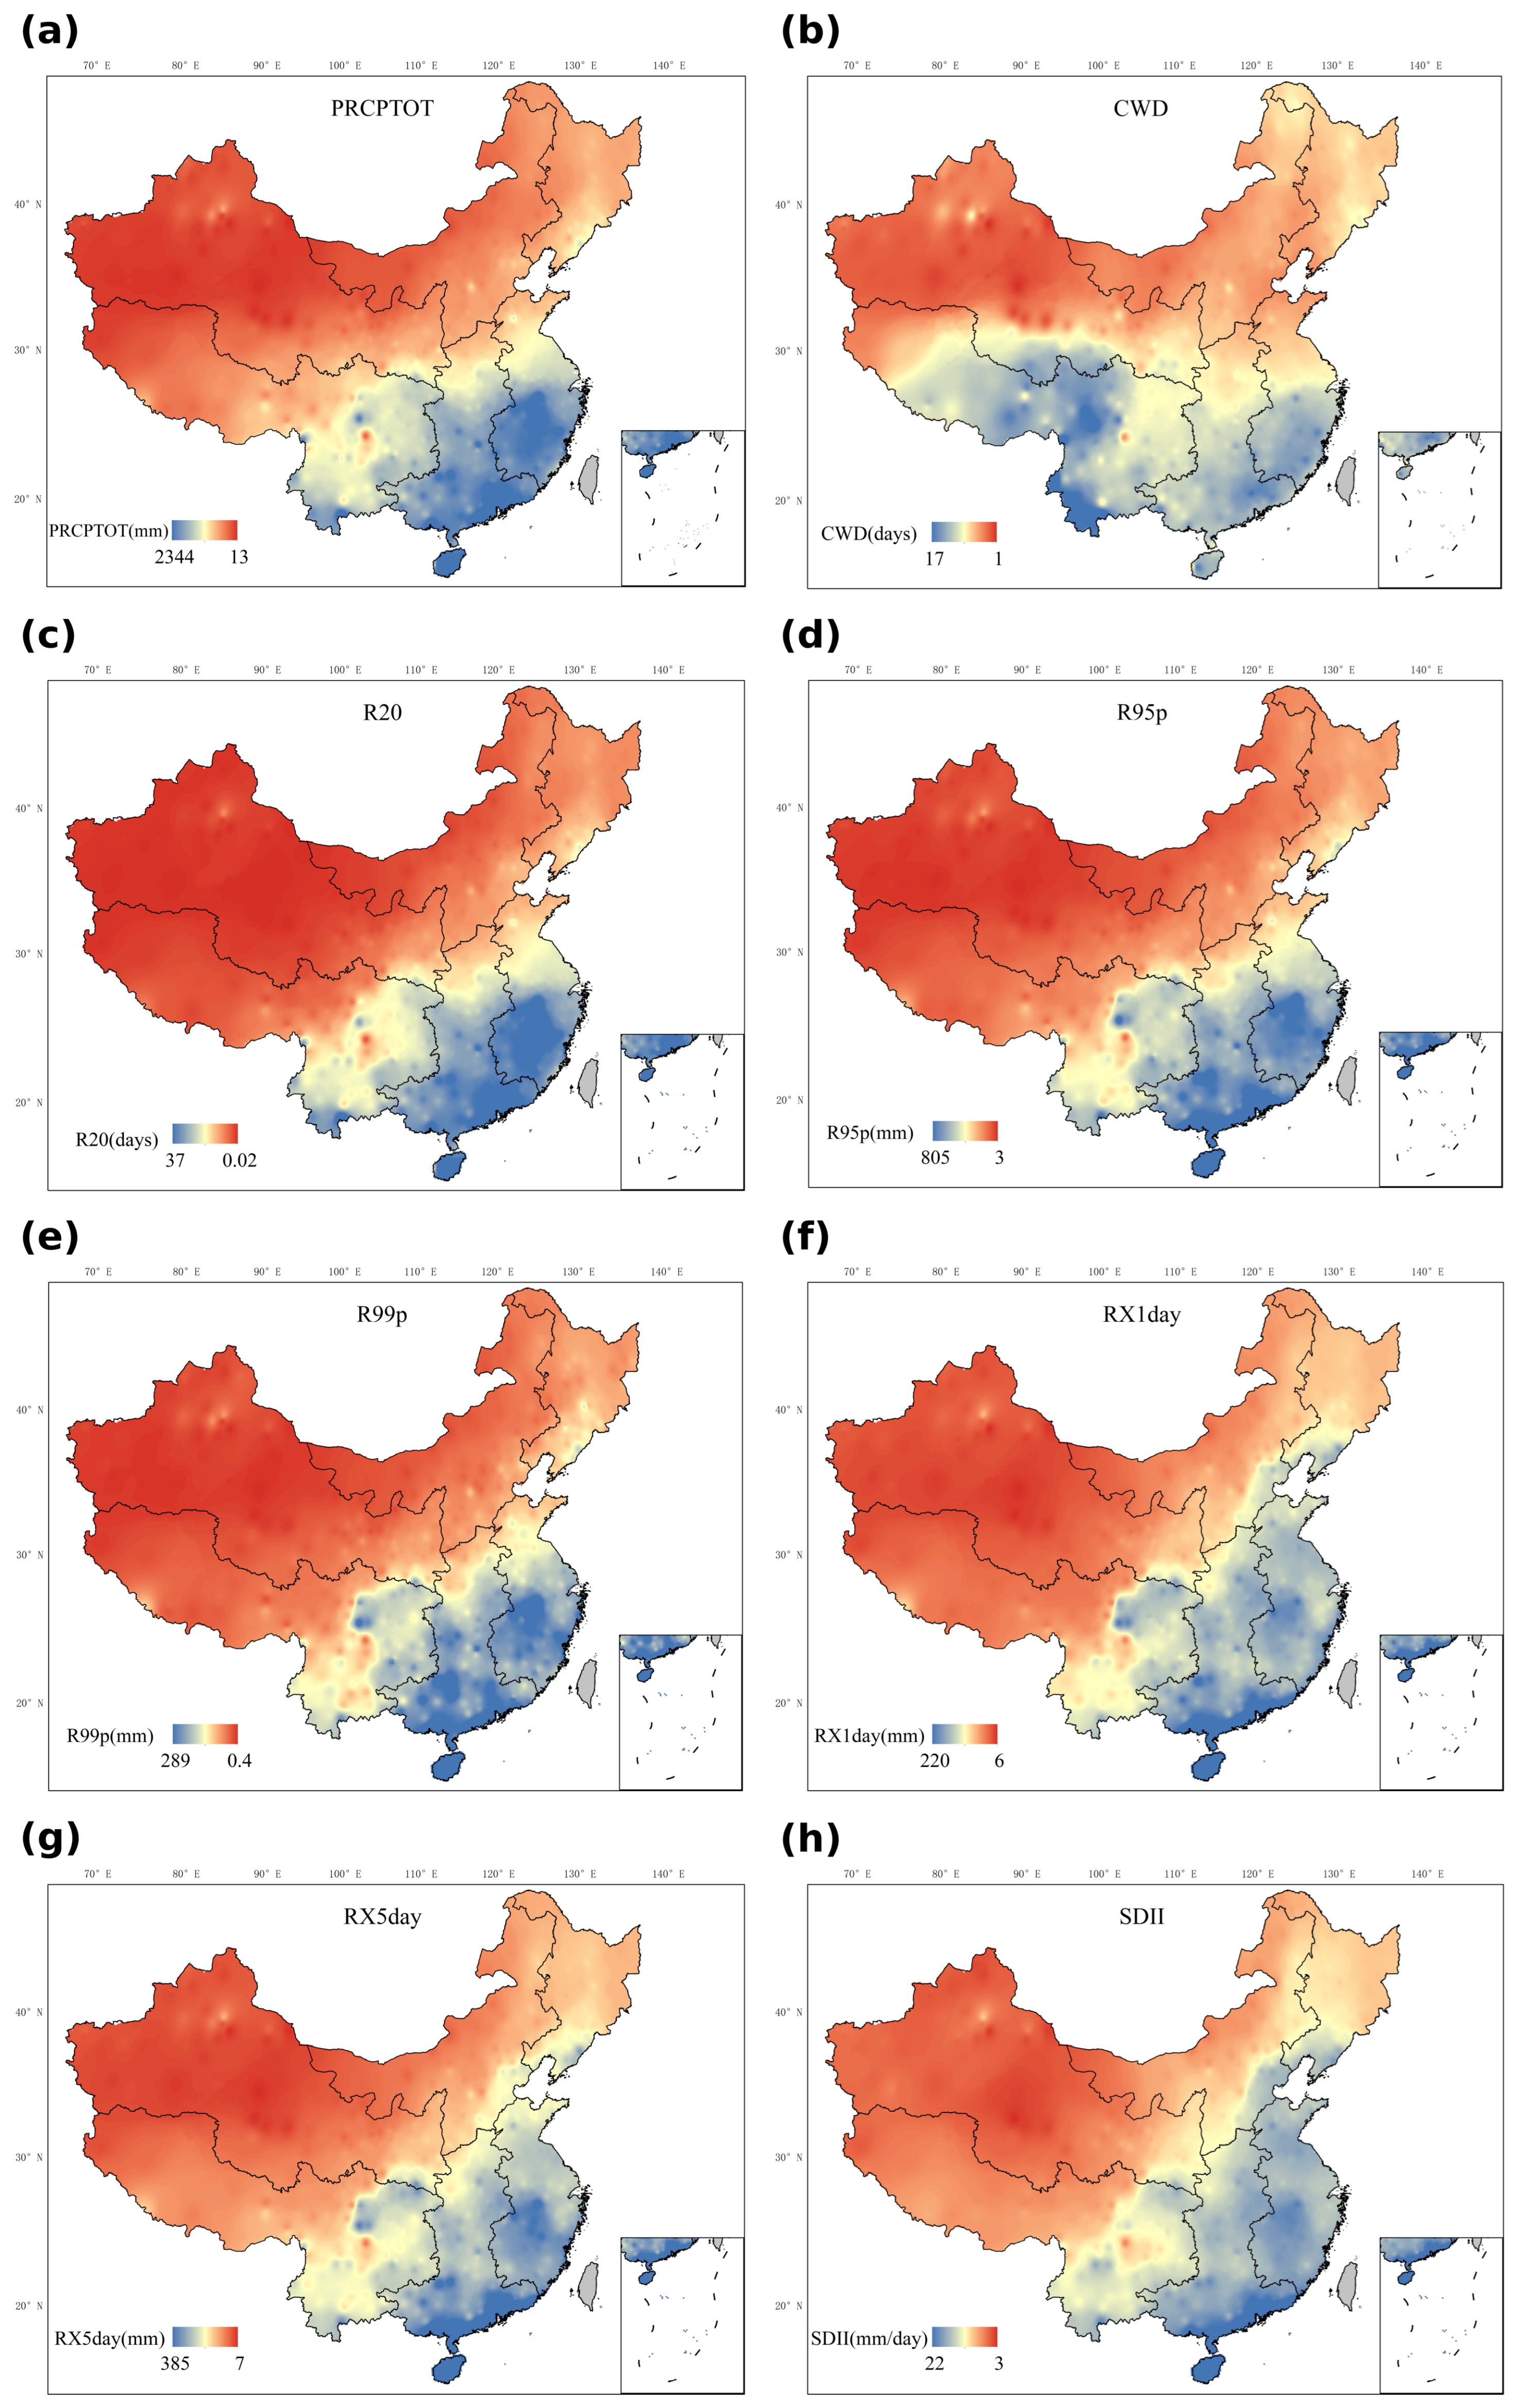
The spatial distribution of the annual values of each extreme precipitation index is shown in Figure 6. The annual values of the other extreme precipitation indices generally declined from northwest to southeast or from south to north. The regions with higher annual values of PRCPTOT, R20, R95p, R99p, RX1day, RX5day and SDII were mainly located in the central and southern parts of East China, and the central and southern parts of Central South China. The annual distribution characteristics of extreme precipitation were similar to the spatial distribution characteristics of annual precipitation in China. It was mainly affected by land and sea locations, showed longitudinal zonal differentiation, and was to some extent affected by topography and geomorphology. For example, the extreme precipitation indices in Southwest China had a closed region of high or low value, which is related to the influence of complex terrain conditions and water vapor transport conditions on precipitation.

3.2.2. Change Trend of Extreme Precipitation Indices

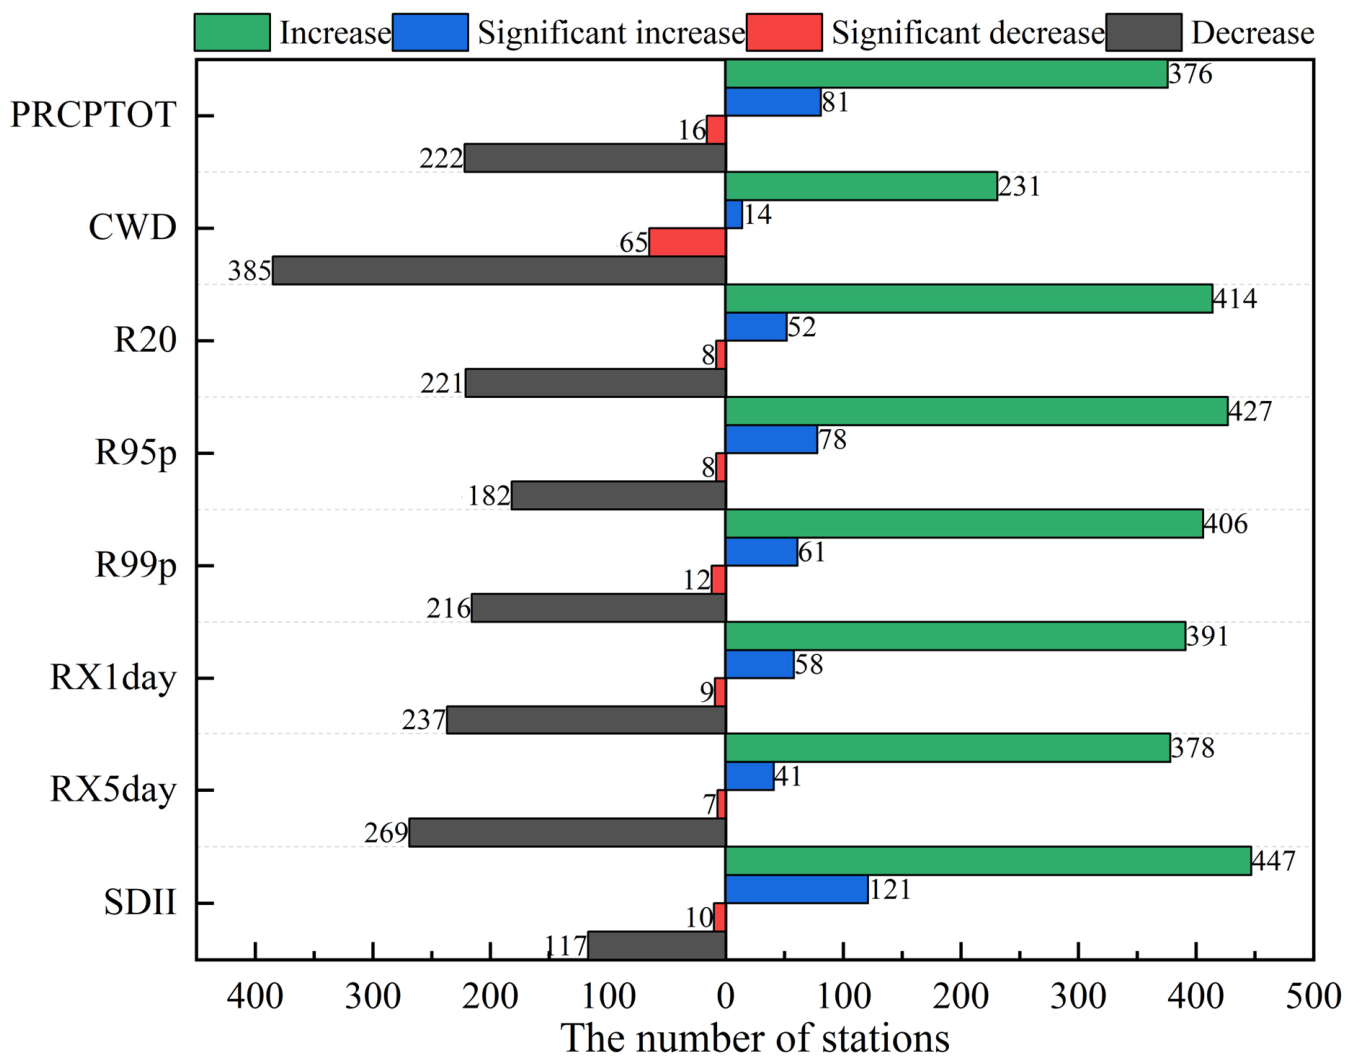
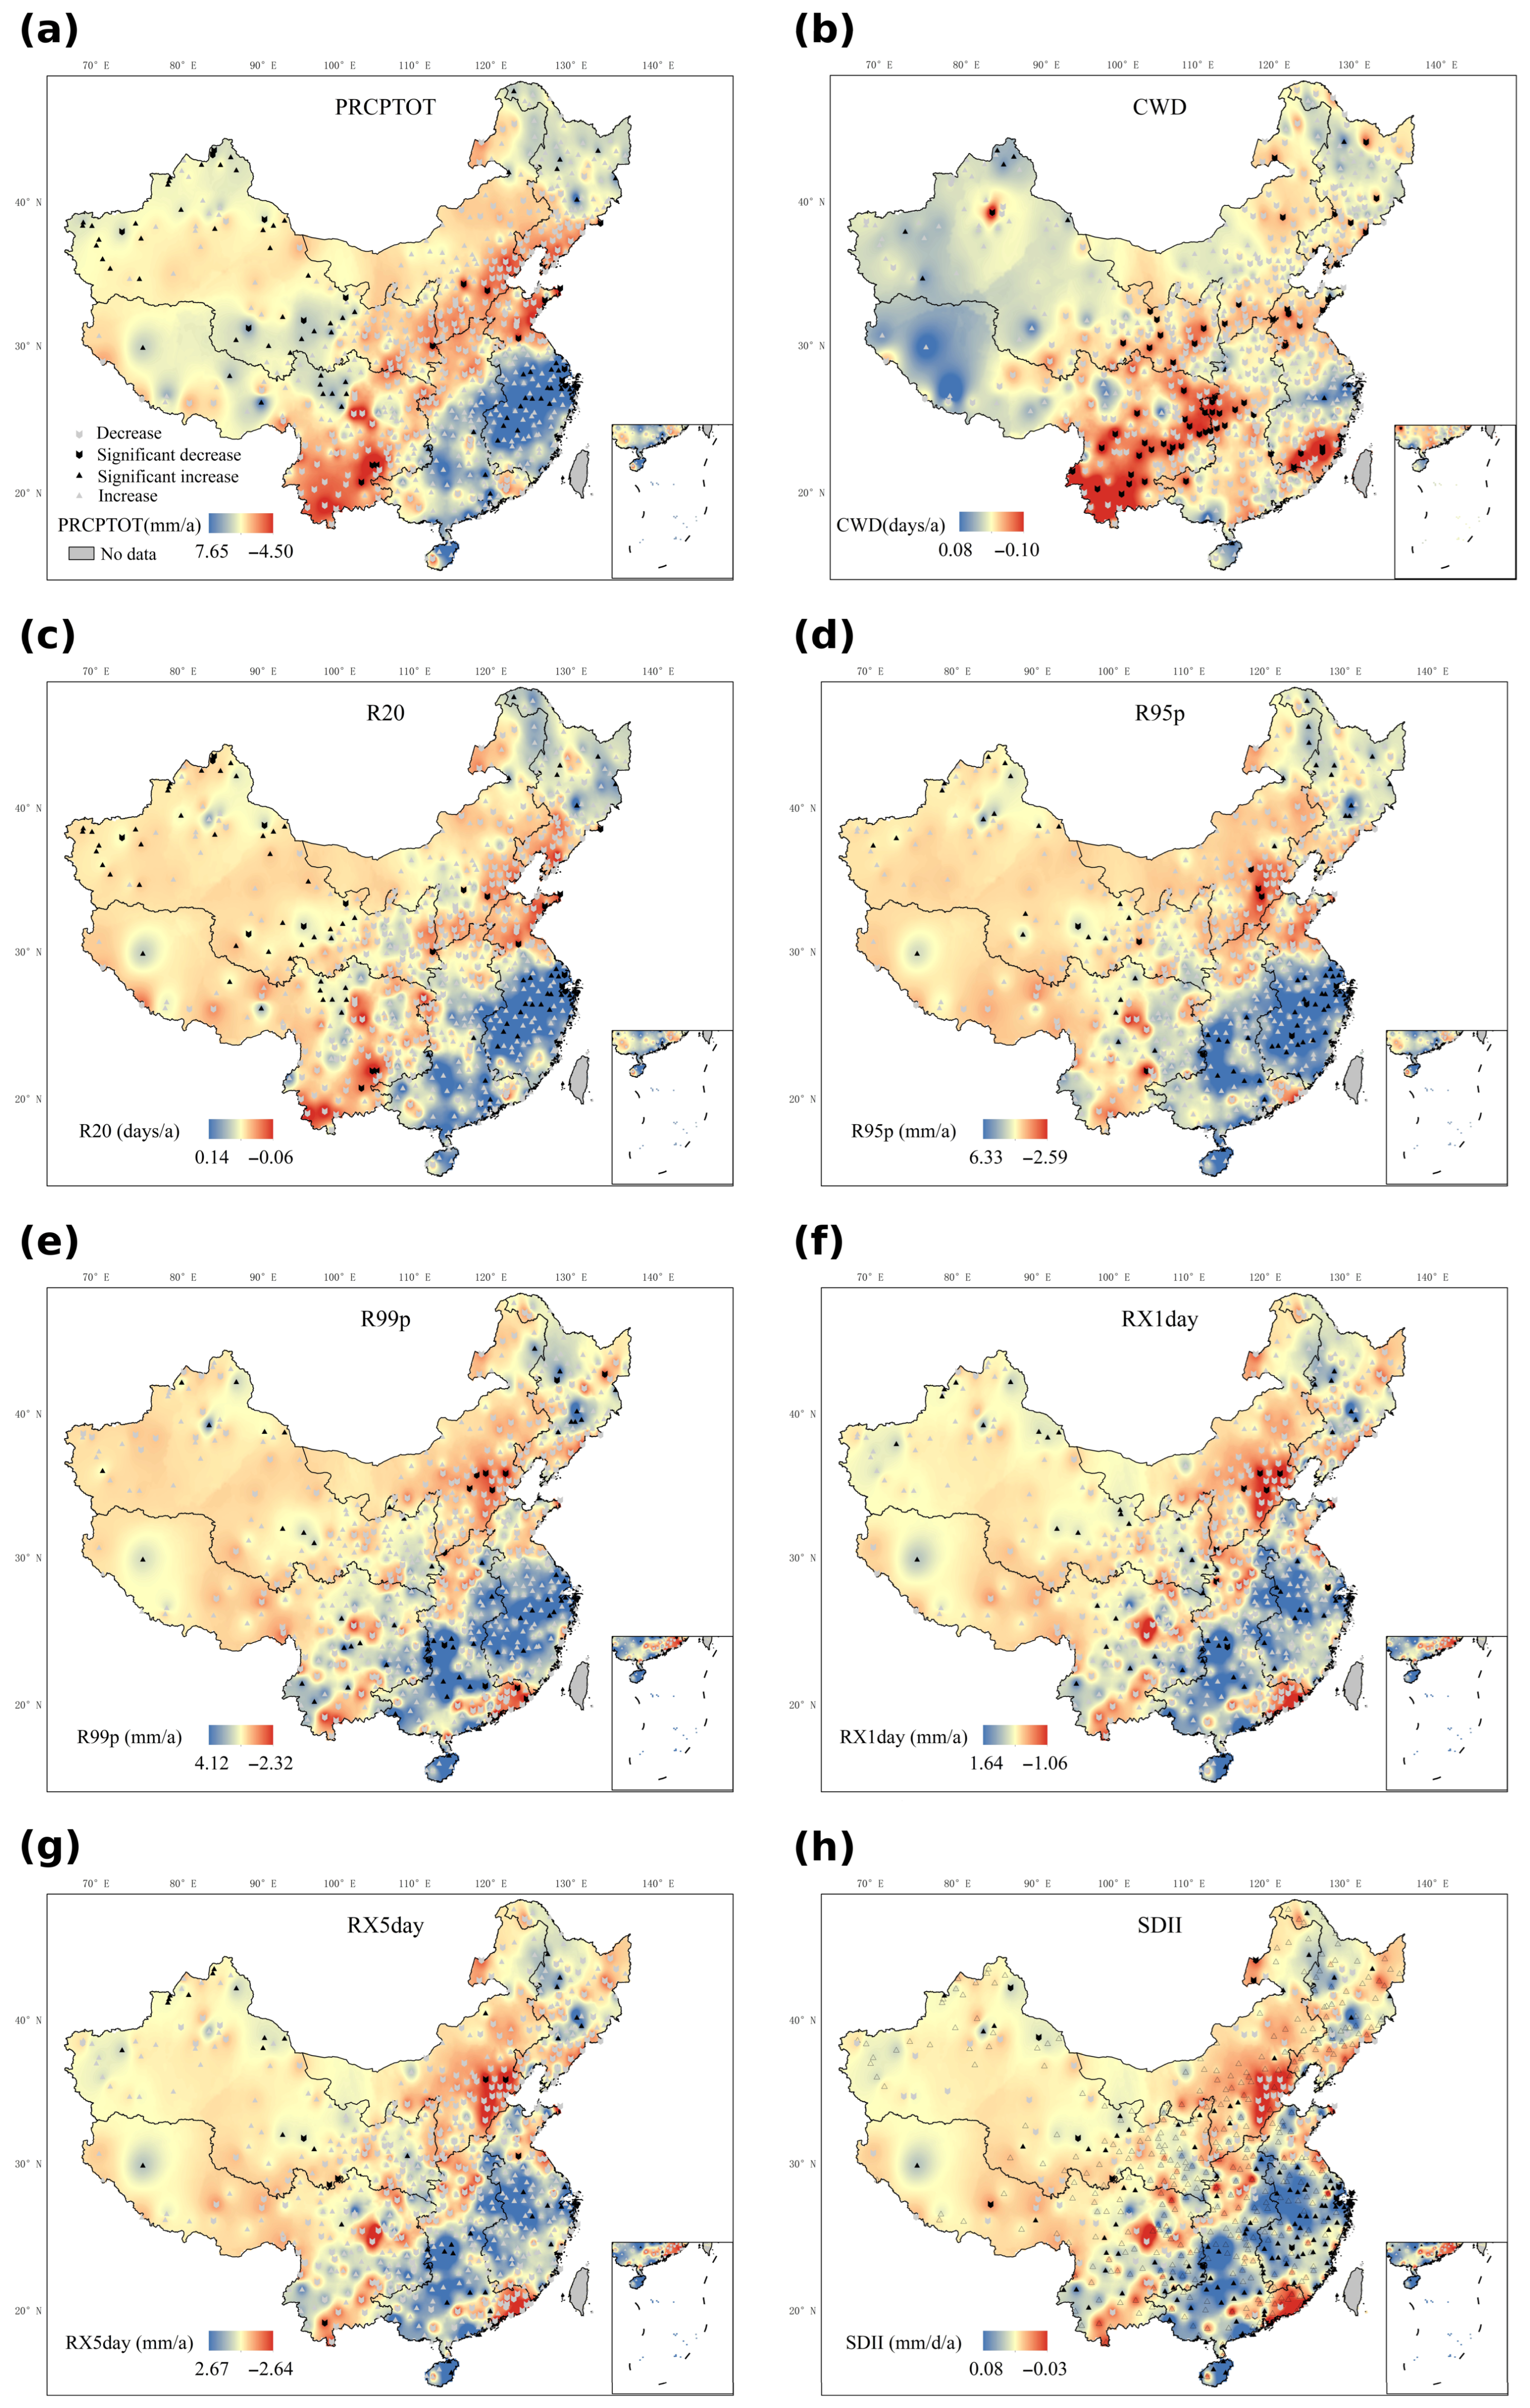
Figure 7 illustrates the number of stations across China exhibiting varying trends for each extreme precipitation index from 1960 to 2020. Figure 8 further elaborates on the spatial distribution of these trends. For PRCPTOT, a majority (65.8%) of the stations showed an increasing trend, with 11.7% experiencing significant increases. Spatially, the increases in PRCPTOT were predominantly located in the central and southern parts of East China, the southern areas of Central and South China, central and northern parts of Northeast China, central and eastern Qinghai–Tibet Plateau, and northern Northwest China. Conversely, significant decreases were observed in the southern part of North China, northern East China, and southern Southwest China (Figure 8a). For CWD, 64.7% of stations showed a decline, with 9.4% marked as significantly decreasing. Regions with notable decreases were mainly confined to the central and southern Southwest China, and southern central South China, with additional scattered areas from eastern Northwest China to northern East China (Figure 8b). Notably, most areas in Northwest China displayed an upward trend in CWD, though few were significant. In terms of Rainy Days Count (R20), 67.1% of stations reported increasing trends, of which 7.5% were substantially significant. The areas predominantly affected by significant increases were central and eastern East China, southern central and southern China, and northern Northeast China, with scattered occurrences in Qinghai–Tibet Plateau, Northwest China, and Southwest China (Figure 8c). The trends for R95p and R99p were similarly aligned; 72.7% and 67.2% of stations respectively showed overall increasing patterns, with significant increases recorded at 10.4% and 11.2% of stations respectively. These increases were largely concentrated in the central and southern parts of East China, and central and southern parts of Central South China, with notable increments also evident in eastern Southwest China, eastern Northwest China, and central and northern Northeast China. The significant declines were predominantly situated in the southern part of North China and the northern part of East China (Figure 8d,e). For RX1day and RX5day, the stations with increasing trends constituted 64.6% and 60.3%, respectively, with significant upticks seen in 8.3% and 5.9% of stations. The significant increases for these indices were predominantly found in central and southern East China, central and southern central South China, and the central and northern portions of Northeast China, with additional increases scattered across eastern and southern Southwest China (Figure 8f,g). Lastly, the Simple Daily Intensity Index (SDII) saw the highest proportion of stations with increasing trends, at 81.7%, and 17.4% displaying significant rises. The spatial distribution of these significant increases spanned most areas of East China and Central South China, with a notable presence in the middle and northern parts of Northeast China and scattered increases elsewhere (Figure 8h).

3.3. Relationship Between Extreme Precipitation Indices and Altitude

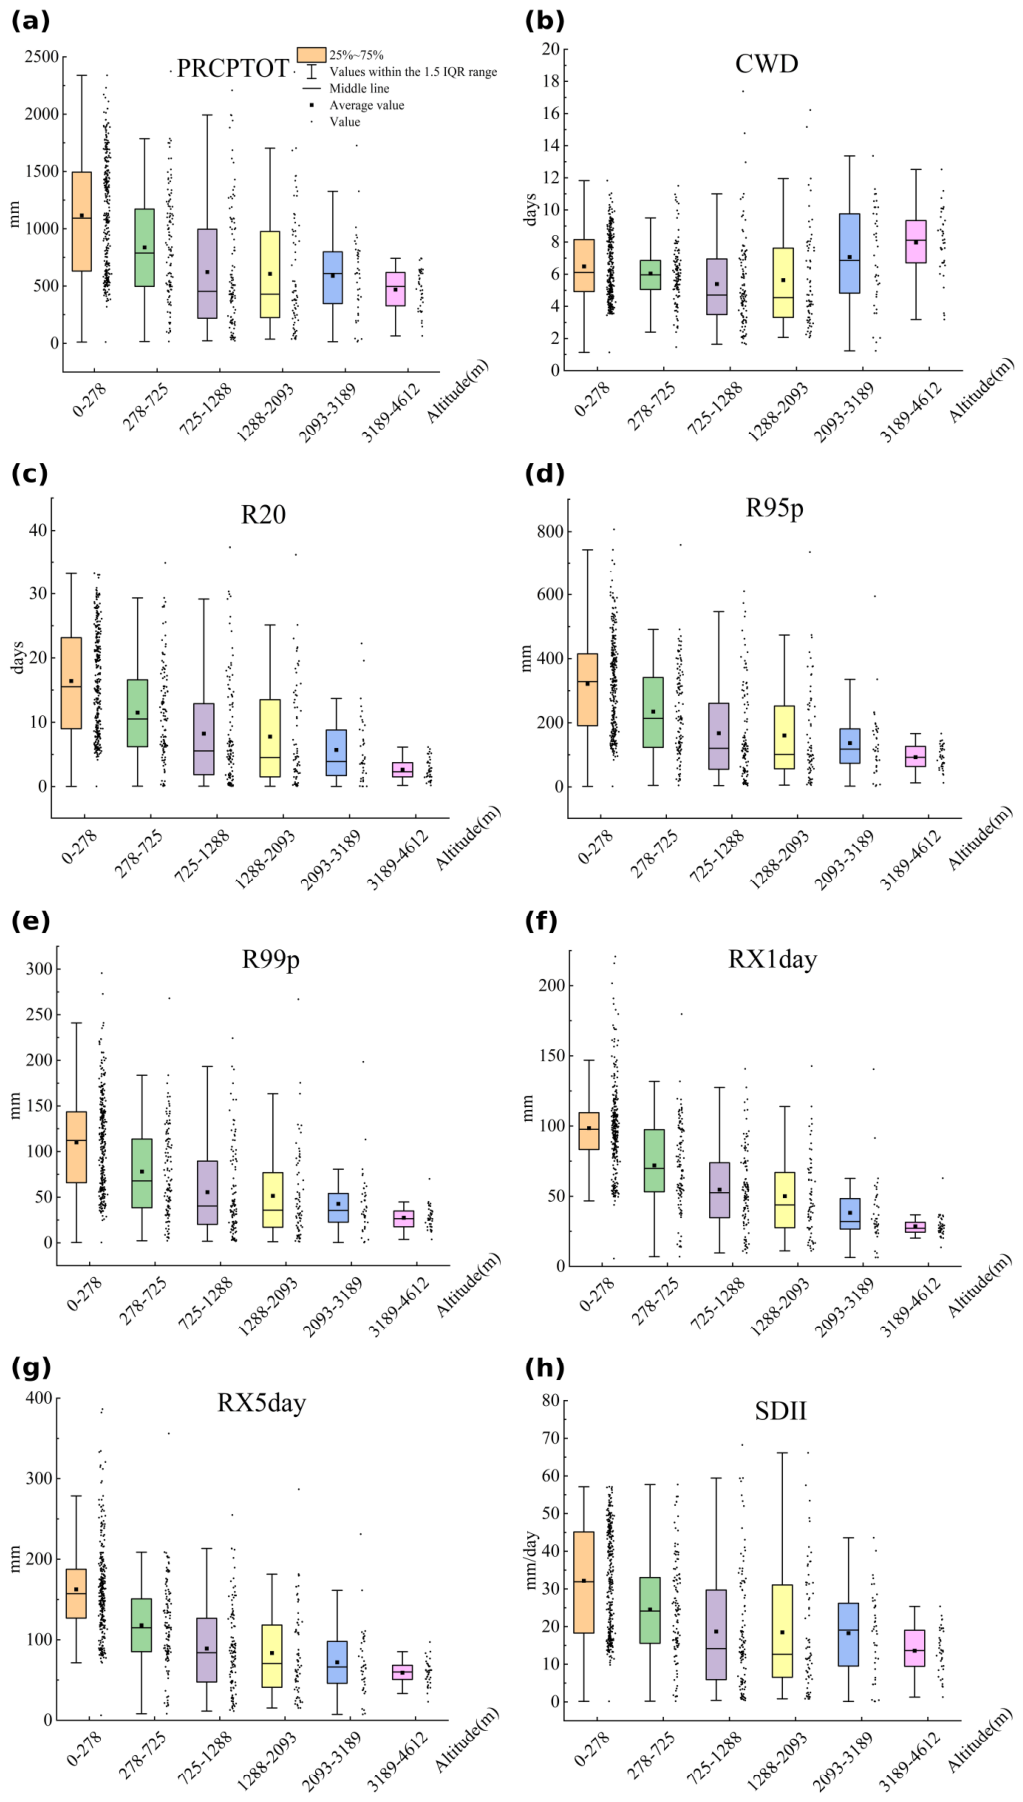
Figure 9 presents statistical analyses of extreme precipitation indices at various elevations. Excluding consecutive wet days (CWD), the highest average values for other extreme precipitation indices were observed at the lowest elevation range, from 0 to 278 m. The mean value of CWD initially decreased and then increased with rising altitude, exhibiting a downward trend from 0 to 1288 m and an upward trend from 1288 to 4612 m. The altitude-related patterns of other indices were similarly discernible. Initially, there was a rapid decrease from 0–278 m to 278–725 m to 725–1288 m, followed by a period of stability from 1288 to 2093 m, and then a sharp decline from 2093–3189 m to 3189–4612 m. These observations underscore the profound impact of altitude on the spatial distribution and magnitudes of extreme precipitation indices across different elevational zones.

3.4. Atmosphere–Ocean Circulation Drivers of Extreme Precipitation Indices

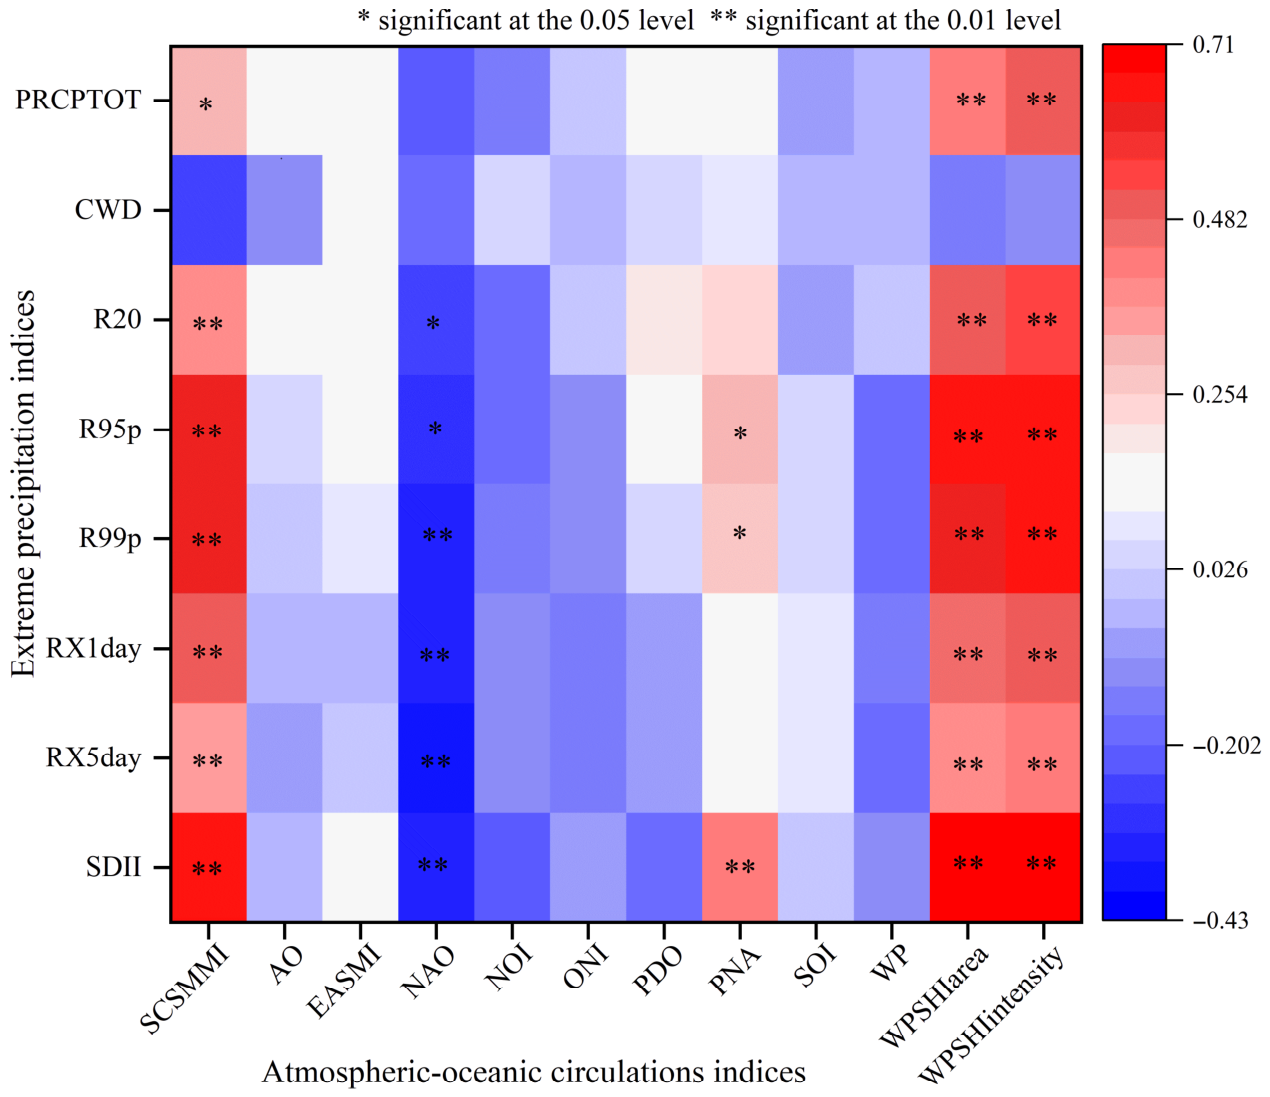
In this study, apart from CWD, which exhibited no significant correlation with the area and intensity of the WPSHI, the other seven extreme precipitation indices demonstrated significant correlations with the atmosphere–ocean circulation index (p < 0.01) as depicted in Figure 10. Notably, except for CWD (no significant correlation) and PRCPTOT (p < 0.05), the other six extreme precipitation indices showed a significant relationship with the SCSMMI (p < 0.01). Specifically, R99p, RX1day, RX5day, and SDII correlated significantly with the North Atlantic Oscillation (NAO) (p < 0.01), while R20 and R95p displayed significant correlations with the NAO (p < 0.05). Furthermore, R99p and SDII were significantly associated with PNA (p < 0.01), and R95p also showed a significant correlation with the PNA (p < 0.05). To quantitatively assess the multiscale correlations between the eight extreme precipitation indices and five key atmosphere–ocean circulation indices, Wavelet Transform Coefficients (WTC) were utilized. The cross-wavelet power analysis diagram (Figure 11) further elucidates these correlations across both time and frequency dimensions. A total of 26 WTCs were calculated (not all shown here).
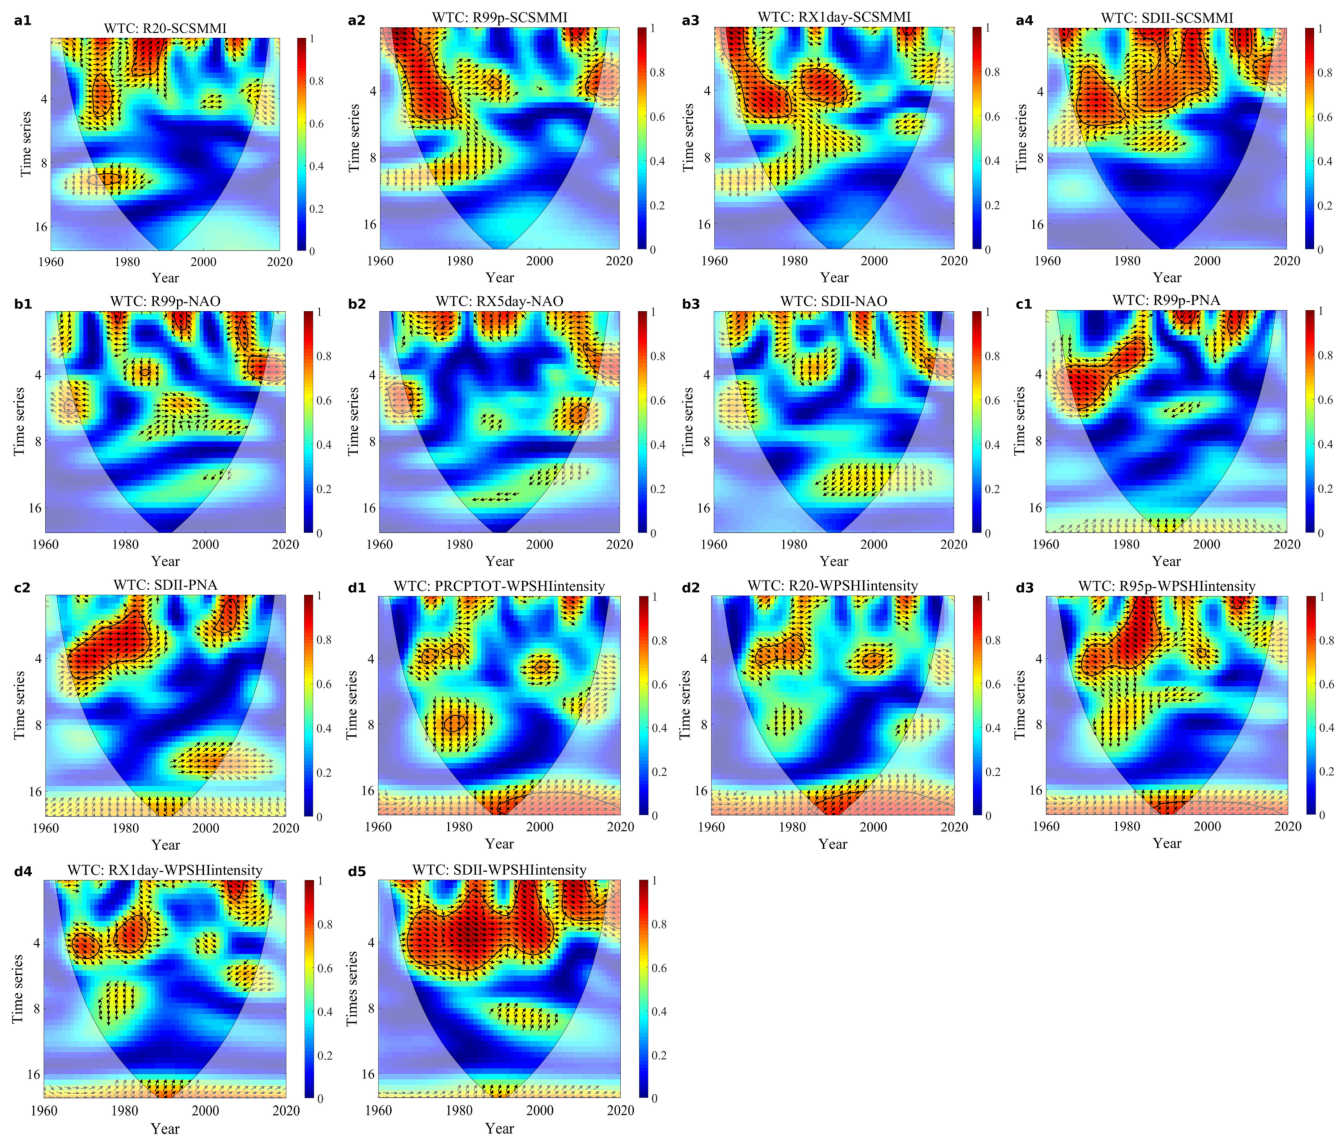
Figure 11a illustrates the wavelet coherence spectrum between extreme precipitation indices and the SCSMMI. Here, R20, R99p, RX1day, and SDII demonstrate a positive correlation with the SCSMMI, particularly significant in the 0–4 a cycle frequency range. SDII exhibits a consistent cycle of 0–6 a from 1970 to 2000, and a continuous 0–4 a cycle from 2005 to 2020. Figure 11b presents the wavelet coherence spectrum for extreme precipitation indices and the NAO. It highlights that R99p, RX5day, and SDII are significantly negatively correlated with the NAO. According to the wavelet power map, R99p is associated with an approximated 3 a cycle around 2010 and a 3–5 a cycle from 2011 to 2020. RX5day correlates with a 5–7 a cycle from 1960 to 1970 and maintains a 3–5 a cycle from 2010 to 2020, similar to the cycle identified with SDII within the same period. Figure 11c displays the wavelet coherence spectrum between extreme precipitation indices and the PNA. R99p and SDII show a significant positive correlation with the PNA during 1960–1980, with a presumed 4–6 a cycle during 1960–1970 and a 3–4 a cycle during 1970–1980. Additionally, a positive correlation with SDII during 2000–2010 corresponds with a 0–2 a cycle. Figure 11d illustrates the wavelet coherence spectrum of extreme precipitation indices and the WPSHI. The indices show a positive correlation with the WPSHI, passing the significance test at a frequency of 0–4 a cycle. The outcomes from additional WTC analyses are provided as Figure S1.
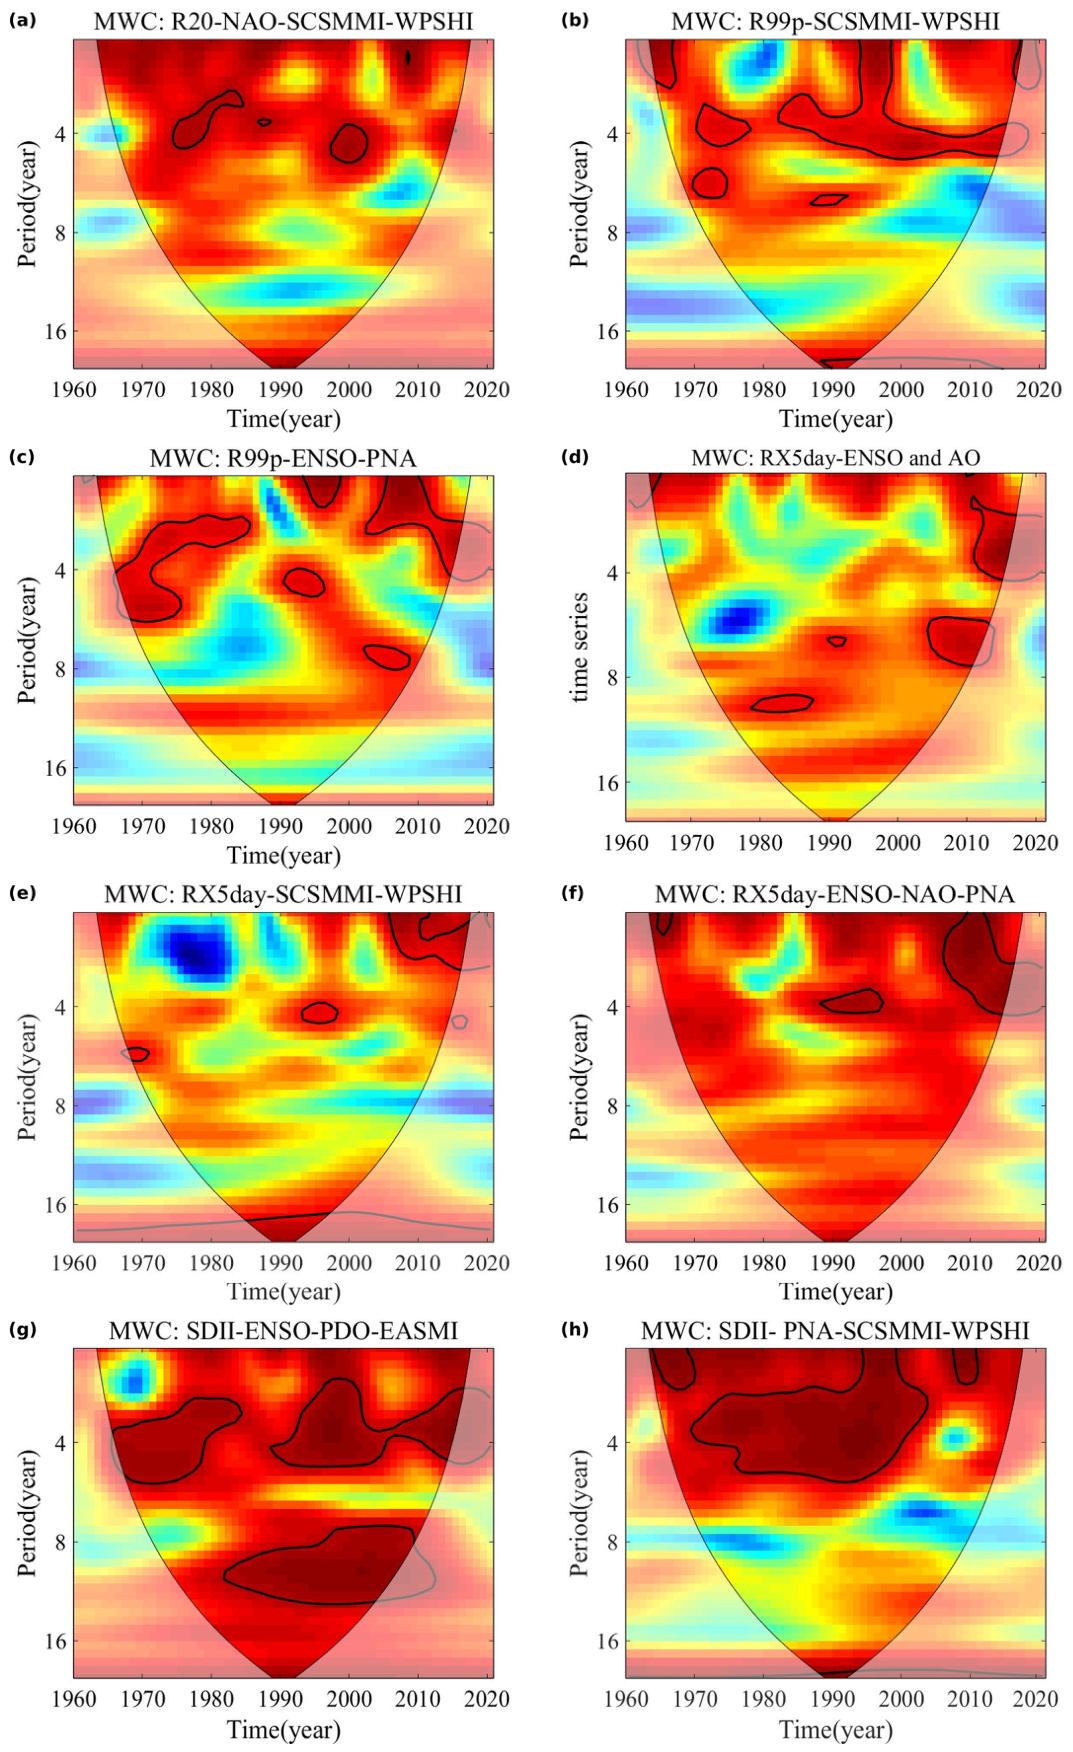
The previous bivariate wavelet coherence WTC suggested that there were close relations between extreme precipitation indices and the SCSMMI, NAO, PNA and WPSHI; for the combined effects of two or three circulation factors, the PASC and AWC of MWC were 6–23% and 0.56–0.84 (Table 4), for most indices, the results were greater than that for any individual factor. For R20, the PASC value (0.08) with the NAO-SCSMMI was better than other combinations or individual factors. Similarly, for the combined effects of three circulation factors, the PASC values became smaller for most indices than the combined effects of two circulation factors—such as the NAO-SCSMMI-WPSHI for CWD (0.08 to 0.02), the PNA-SCSMMI-WPSHI for R99p (0.11 to 0.09), and the ENSO-AO-PNA (0.07 to 0.07). An exception was that the ENSO-PDO-EASMI for SDII appeared to have greater impacts than two circulation factors (0.20 to 0.23). In consequence, the combined effects of two circulation factors had greater impact on extreme precipitation indices, the circulation factors influencing R20, P99p, RX5day and SDII were the NAO-SCSMMI, SCSMMI-WPSHI, ENSO-PNA, SCSMMI-WPSHI, ENSO-AO, ENSO-AO-PNA and ENSO-PDO-EASMI.
The combination of the PNA-SCSMMI-WPSHI mainly influenced R99p at time scales of 4 a and 6 a for RX5day. The combination of the ENSO-PDO-EASMI presented the greatest AWC (0.72) and PASC (23%) for SDII and mainly influenced at time scales of 4 a and 8 a (Figure 12); this greatest combination added a period of 8–10 a compared to any of these single factors (Figure 11), which may be mainly affected by the ENSO. Extreme precipitation indices were mainly affected by the ENSO at small time scales and the WPSHI and SCSMMI at large time scales.

4. Discussion

4.1. Zonal Differentiation of Extreme Precipitation Indices

In this study, the temporal and spatial distributions of extreme precipitation in China from 1960 to 2020 were systematically analyzed. Nationally, all seven intensity-related and frequency-related indices registered upward tendencies—with R95p, R99p, RX1day, and SDII reaching statistical significance—while the duration-based CWD index declined significantly, pointing to a shift toward shorter yet more intense wet spells. The trends identified in this study are broadly consistent with those reported for other regions in China (Table 5) and monsoon-dominated regions worldwide. In India, studies using the same ETCCDI framework have found significant increases in the intensity and frequency of heavy precipitation events (R95p, RX1day) over central India during the monsoon season, accompanied by a decrease in the frequency of low-to-moderate rainfall events and a declining trend in CWD [34,35]. These patterns closely mirror the findings of the present study for South and East China, where intensity indices (R95p, R99p, RX1day) show increasing trends while CWD exhibits a nationwide decline (Table 5). In Mexico, positive trends in extreme precipitation indices (RX1day, R95p) have been reported in tropical cyclone-affected coastal regions, alongside decreasing total precipitation in interior areas [36,37], a pattern analogous to the contrasting trends observed between coastal southeastern China and inland northwestern China in the present study. These cross-regional comparisons suggest that the intensification of precipitation extremes under global warming is a robust feature across monsoon and tropical cyclone systems, despite differences in geographic and climatic settings. However, sub-regional analysis within China revealed diverse trends in extreme precipitation indices, influenced by various factors. Previous studies have suggested that these variances could be attributed to differences in trend calculation methods [38], as well as the effects of atmospheric circulation, topography, and local climatic conditions [14,39]. Notably, eastern and southern China exhibited the steepest increases in extreme precipitation indices. Early studies indicated that a weakened East Asian summer monsoon may limit the northward extension of summer wind patterns, leading to increased extreme precipitation along the eastern coast [40]. Additionally, typhoons had been identified as a significant influencer of extreme precipitation events in these regions [41]. Urban areas like the Yangtze River Delta and Pearl River Delta had experienced notable intensifications in extreme precipitation, partly driven by regional urbanization processes which can amplify precipitation intensity [42]. Moreover, variations in extreme precipitation may also be linked to global air–sea heat flux transport [43,44]. Interestingly, an increasing trend in the CWD index was observed in the inland northwest region of China, alongside varied significant increases and decreases in other extreme precipitation indices. The temporal and spatial irregularity of precipitation, combined with the region’s fragile ecological environment, caused a risk of secondary disasters, underscoring the need for comprehensive management and mitigation strategies in these vulnerable areas.

4.2. Effects of Altitude on Extreme Precipitation Indices

Altitude is a crucial factor in topography and exhibits a significant correlation with extreme precipitation indices. Numerous studies have shown that variations in extreme precipitation events were closely linked to elevation changes [45,46]. Considering the uneven altitude distribution of meteorological stations, this study employed the natural break point method to categorize altitude into six distinct groups. This method utilized statistical formulas to identify natural clusters of attribute values, effectively minimizing variation within the same category while maximizing it between different categories [47]. The altitudes of meteorological stations in the study area range from 1.8 m to 4612.2 m. Previous studies indicated that higher elevation regions (>2000 m) typically record lower extreme precipitation amounts compared to lower elevation regions (<1000 m) in the central Himalayas [48]. Similar results were obtained in this study; extreme precipitation events at lower elevation regions should be worthy of attention and prevention.

4.3. Atmosphere–Ocean Circulation Patterns Drive Extreme Precipitation Indices

Overall, the extreme precipitation indices in China were significantly positively correlated with the WPSHI, SCSMMI and PNA, and negatively correlated with the NAO, but not significantly correlated with other atmosphere–ocean indices. Among them, SDII and R99p had a significant correlation with most of the atmosphere–ocean circulation indices, indicating that atmosphere–ocean circulation patterns were also important drivers affecting the change in extreme precipitation indices. In general, this study found that there was a certain resonance period between extreme precipitation indices and the ENSO, EASM, AO, and PDO. However, it should be noted that the wavelet power spectra of most individual extreme precipitation indices did not exhibit statistically significant periodicities against a red-noise background (Figure 5), indicating that the apparent periodic fluctuations in these indices are largely attributable to stochastic climate variability rather than deterministic oscillatory behavior. The significant resonance periods identified through WTC and MWC analyses (Figure 11 and Figure 12) therefore reflect the coherence between indices and circulation drivers at specific time–frequency domains, rather than inherent periodicities of the precipitation indices themselves. These findings further substantiated the complex and nonlinear relationships between extreme precipitation events and atmospheric–oceanic circulations. Previous studies pointed out that the WPSHI, originating from the Pacific Ocean, and the SCSMMI, originating from the South China Sea, were primary meteorological forces driving extreme precipitation events in China, while the northeasterly wind in northern China strengthened, and in turn weakened the northern and eastern extent of the westerly jet stream and any southwesterly flow from the ocean [26,49]. This situation was likely to result in heavier precipitation in southern China while simultaneously reducing moisture transport to northern regions, effectively explaining the observed positive correlations between extreme precipitation indices and both WPSHI and SCSMMI. These insights confirmed that variations in extreme precipitation were intricately linked to atmospheric–oceanic circulation patterns, a conclusion that was consistent with findings from recent studies [46,50,51]. This complex interplay highlights the importance of considering atmospheric dynamics in understanding and predicting precipitation patterns across diverse temporal and spatial scales.
Early studies indicated that the correlations between extreme precipitation events and climate oscillations such as the ENSO and NAO, and PNA might be attributed to atmospheric teleconnections [52,53,54]. The NAO involves disturbances in the zonal winds across the Atlantic, driven by pressure variations between the subtropical high and the subpolar low. Notably, some studies demonstrated that years with strong NAO activity often coincide with the El Niño events [55]. During the El Niño years, weakened summer winds and a southern displacement of the monsoon rain belt result in fewer typhoons, potentially leading to droughts in coastal regions and hot, dry conditions in northern China, thereby reducing overall summer precipitation across the country. This phenomenon could explain the significant negative correlation observed between extreme precipitation indices and the NAO. Additionally, the PNA acted as a ‘bridge’ that enables ENSO influences to extend into the stratosphere [49]. When the PNA is in a positive phase, it is often associated with increased precipitation in eastern and southern China. This relationship provides a basis for understanding the significant negative correlation between extreme precipitation indices and the PNA. Moreover, it was observed that in certain years, atmospheric circulation factors exerted a minimal influence on extreme precipitation indices, suggesting that these events were influenced not only by atmospheric circulations but potentially by other factors as well. The exact mechanisms of these influences require further investigation to gain a comprehensive understanding of the factors affecting extreme precipitation and their interplay.
In the WTC analysis, the arrows indicate phase relationships at a given time scale. For a period of T years, an upward arrow (↑, 90° phase angle) indicates that the extreme precipitation index leads the circulation index by T/4 years; a downward arrow (↓) indicates a lag of T/4 years. For example, in the R20–SCSMMI WTC within the 0–4 a band, the predominantly rightward arrows indicate a near-simultaneous in-phase relationship, consistent with direct monsoon forcing of heavy precipitation events. The transition from a simultaneous (rightward arrows, ~1960–1990) to a leading relationship (upward-tilted arrows, post-2000) in R20–SCSMMI may reflect a structural shift in the monsoon–precipitation coupling under accelerated warming, as the East Asian summer monsoon has weakened since the 1990s [40].
Phase reversals (e.g., from rightward to leftward arrows across time periods) indicate that the direction of the teleconnection is non-stationary—a key finding that justifies the use of wavelet coherence over simple Pearson correlation. For instance, the NAO–extreme precipitation relationship shifts from negative (anti-phase) to positive (in-phase) at certain time scales in specific periods, likely reflecting the modulation of NAO impacts by ENSO state [55]. These non-stationary relationships underscore the limitation of using time-invariant correlation methods and highlight the importance of MWC analysis for prediction applications.
The identified combination of atmospheric circulation factors has provided substantial insights into the changes in extreme precipitation indices. However, the PASC did not achieve maximal values with the increased combination of these factors. This suggests that while atmospheric circulation patterns significantly influence precipitation changes, their overall interactions are complex and not fully captured by the existing models. For instance, South China is notably influenced by multiple large-scale circulations such as the ENSO [56], the PDO [57], and AO [58], all of which are key drivers of precipitation variations [59]. However, the relationships between the NAO, PDO, and ENSO are multifaceted, showing that the impacts of the PDO and NAO are not consistently related to ENSO activities [22,60]. Additionally, the circulation factors selected may not adequately represent the complete range of atmospheric patterns affecting different regions of China simultaneously. For example, phenomena such as the strengthening of anticyclonic circulation and rapid global warming are significant contributors to global climate change [50]. Furthermore, human activities also play a crucial role in influencing extreme climatic conditions today. Increased aerosol concentrations and a warming climate have expedited glacier melting, intensified land evaporation, and enhanced atmospheric water vapor content. These changes are particularly evident in northwest China, where they contribute to the rising intensity and frequency of precipitation events [61]. In conclusion, the relationships between extreme precipitation indices and atmospheric circulation patterns are intricate and extend beyond mere atmospheric influences to encompass anthropogenic factors, highlighting the need for a multifaceted approach in analyzing precipitation changes.

4.4. The Limitations and Prospects

The study employed consistent indicators, temporal scales, and trend analysis methodologies to elucidate the trends and rates of the eight extreme precipitation indices recommended by the ETCCDI both regionally and nationally across China. Additionally, it analyzed the impact of atmospheric–oceanic circulations on extreme precipitation events. The findings were comparable, providing a crucial scientific foundation to devise effective countermeasures aimed at mitigating the adverse impacts of these changes. Looking forward, it is essential to conduct targeted analyses that consider the unique characteristics of different regions affected by diverse atmospheric–oceanic circulations. The geospatial heterogeneity of ground observation sites, particularly the sparse distribution across western China, introduces uncertainties in the representativeness of regional findings. This limitation necessitates dedicated investigations to validate result reliability in topographically complex areas. Furthermore, the current unavailability of hourly precipitation datasets constrains our capacity to analyze short-duration extreme precipitation events. Future research should prioritize the integration of high-temporal-resolution precipitation records to better characterize sub-daily precipitation extremes. Notably, with the ongoing proliferation of extreme precipitation indices (e.g., intensity–duration–frequency metrics and percentile-based thresholds), comparative analyses employing multiple standardized indices are recommended to enhance the robustness of extreme precipitation assessments. Moreover, projecting changes in future extreme precipitation indices is critical, given their significant implications for soil erosion control, sustainable water resource management, and disaster prevention. These forward-looking steps are vital for adapting to and managing the expected shifts in precipitation patterns, ultimately helping to safeguard environmental health and human safety.

5. Conclusions

The escalating toll of precipitation extremes worldwide underscores the imperative to deepen our understanding of their long-term behavior and forcing mechanisms. Focusing on China, this work traced the 1960–2020 trajectories of eight ETCCDI and diagnosed their large-scale circulation drivers using wavelet-based methods. East China and the central sector of South China emerged as hot spots of intensifying extremes, with especially pronounced upward shifts after 2010, flagging these regions for heightened disaster preparedness. Wavelet analysis further revealed that most extreme precipitation indices did not exhibit statistically significant periodicities against a red-noise background, except for CWD, which showed a significant quasi-decadal oscillation (~8–10 a) during 1975–1995, suggesting distinct underlying physical mechanisms governing the temporal variability of precipitation duration versus intensity. Among the circulation factors examined, SCSMMI, WPSHI, PNA, and NAO were identified as the most influential, implying that operational forecasts of precipitation extremes across China would benefit from close monitoring of these teleconnection modes. This study offers several specific insights for understanding and responding to extreme precipitation in China under a changing climate. First, this study proposes that intensity-related indices (R95p, R99p, RX1day, SDII) are increasing while the duration index CWD is decreasing nationwide, suggesting that future precipitation extremes will be characterized by shorter but more intense episodes. Second, southeastern China shows significant intensification of extreme precipitation, whereas northwestern China exhibits a wetting trend driven mainly by increased total precipitation rather than extreme intensity. This regional divergence highlights the need for region-specific adaptation strategies. Third, wavelet coherence analysis reveals non-stationary teleconnections between extreme precipitation and large-scale circulation indices (SCSMMI, NAO, ENSO), suggesting that statistical forecast models based on fixed climate-mode relationships may lose predictive skill over time. Seasonal forecast frameworks should therefore be updated regularly to account for these evolving relationships. Together, these findings provide a scientific basis for targeted disaster risk reduction and climate-resilient infrastructure planning across China.

Supplementary Materials

The following supporting information can be downloaded at: https://www.mdpi.com/article/10.3390/cli14060112/s1, Figure S1: Wavelet coherence (XWT) between extreme precipitation indices and atmosphere- ocean circulations in China from 1960 to 2020.

Author Contributions

Conceptualization, F.Z.; Methodology, R.Z., S.P., X.X. and J.F.; Software, R.Z. and S.P.; Validation, F.Z.; Formal analysis, R.Z.; Investigation, R.Z.; Data curation, F.Z.; Writing—original draft, R.Z.; Writing—review & editing, R.Z., F.Z., S.P., X.X. and J.F.; Visualization, R.Z.; Supervision, F.Z. and S.P.; Project administration, F.Z.; Funding acquisition, F.Z. All authors have read and agreed to the published version of the manuscript.

Funding

This research was funded by the program of Natural Science Foundation of China (No. U2243210) and funded by National Key R&D Program of China (Grand No. 2022YFD1500102).

Data Availability Statement

Data will be made available on request.

Acknowledgments

The authors thank the Climate Data Center of the CMA for providing the meteorological data.

Conflicts of Interest

The authors declare that they have no known competing financial interests or personal relationships that could have appeared to influence the work reported in this paper.

Abbreviations

PRCPTOT, wet-day precipitation; R20, number of very heavy precipitation days; CWD, consecutive wet days; SDII, simple daily intensity index; RX1day, maximum 1-day precipitation; RX5day, maximum 5-day precipitation; R95p, very wet day precipitation; R99p, extremely wet day precipitation; IPCC, Intergovernmental Panel on Climate Change; ETCCDI, the Expert Team on Climate Change Detection and Indices; WMO, the World Meteorological Organization; WTC, wavelet transform coherence; MWC, multiple wavelet coherence.

References

  1. Guan, Y.; Zhang, X.; Zheng, F.; Wang, B. Trends and variability of daily precipitation and extremes during 1960–2012 in the Yangtze River Basin, China. Int. J. Climatol. 2017, 37, 1282–1298. [Google Scholar] [CrossRef]
  2. Zhong, K.; Zheng, F.; Wu, H.; Qin, C.; Xu, X. Dynamic changes in temperature extremes and their association with atmospheric circulation patterns in the Songhua River Basin, China. Atmos. Res. 2017, 190, 77–88. [Google Scholar] [CrossRef]
  3. Wang, X.; Hou, X.; Wang, Y. Spatiotemporal variations and regional differences of extreme precipitation events in the coastal area of China from 1961 to 2014. Atmos. Res. 2017, 197, 94–104. [Google Scholar] [CrossRef]
  4. Osburn, L.; Hope, P.; Dowdy, A. Changes in hourly extreme precipitation in Victoria, Australia, from the observational record. Weather Clim. Extrem. 2021, 31, 100294. [Google Scholar] [CrossRef]
  5. Ren, Z.; Zhao, H.; Mu, X.; Shi, K.; Jin, X. Characteristics of extreme precipitation and its effects on soil and water retention in Sichuan, China under multiple climate change elements. Ecol. Indic. 2025, 176, 113702. [Google Scholar] [CrossRef]
  6. IPCC. Climate Change 2022: Impacts, Adaptation, and Vulnerability; Cambridge University Press: Cambridge, UK, 2022. [Google Scholar]
  7. Donat, M.G.; Alexander, L.V.; Yang, H.; Durre, I.; Vose, R.; Dunn, R.J.H.; Willett, K.M.; Aguilar, E.; Brunet, M.; Caesar, J.; et al. Updated analyses of temperature and precipitation extreme indices since the beginning of the twentieth century: The HadEX2 dataset. J. Geophys. Res. Atmos. 2013, 118, 2098–2118. [Google Scholar] [CrossRef]
  8. Gao, T.; Xie, L. Spatiotemporal changes in precipitation extremes over Yangtze River basin, China, considering the rainfall shift in the late 1970s. Glob. Planet. Chang. 2016, 147, 106–124. [Google Scholar] [CrossRef]
  9. Wu, X.; Guo, S.; Yin, J.; Yang, G.; Zhong, Y.; Liu, D. On the event-based extreme precipitation across China: Time distribution patterns, trends, and return levels. J. Hydrol. 2018, 562, 305–317. [Google Scholar] [CrossRef]
  10. Shi, J.; Cui, L.; Wen, K.; Tian, Z.; Wei, P.; Zhang, B. Trends in the consecutive days of temperature and precipitation extremes in China during 1961–2015. Environ. Res. 2018, 161, 381–391. [Google Scholar] [CrossRef]
  11. Shi, J.; Cui, L.; Tian, Z. Changes in the temperature and precipitation extremes in China during 1961–2015. Quat. Int. 2019, 527, 64–78. [Google Scholar] [CrossRef]
  12. Xu, F.; Zhou, Y.; Zhao, L. Spatial and temporal variability in extreme precipitation in the Pearl River Basin, China from 1960 to 2018. Int. J. Climatol. 2022, 42, 797–816. [Google Scholar] [CrossRef]
  13. Xu, X.; Du, Y.; Tang, J.; Wang, Y. Variations of temperature and precipitation extremes in recent two decades over China. Atmos. Res. 2011, 101, 143–154. [Google Scholar] [CrossRef]
  14. Wang, H.; Chen, Y.; Chen, Z. Spatial distribution and temporal trends of mean precipitation and extremes in the arid region, northwest of China, during 1960–2010. Hydrol. Process. 2013, 27, 1807–1818. [Google Scholar] [CrossRef]
  15. Song, X.; Song, S.; Sun, W.; Mu, X.; Wang, S.; Li, J.; Li, Y. Recent changes in extreme precipitation and drought over the Songhua River Basin, China, during 1960–2013. Atmos. Res. 2015, 157, 137–152. [Google Scholar] [CrossRef]
  16. Ren, Y.; Zhang, J.; Fu, J.; Peng, S.; Li, Z. Spatiotemporally varied extreme precipitation events simultaneously controlled by multiple circulation factors in China’s Loess Plateau. Int. J. Climatol. 2022, 42, 6351–6372. [Google Scholar] [CrossRef]
  17. Yang, X.; Xu, Z.; Liu, W.; Liu, L. Spatiotemporal characteristics of extreme precipitation at multiple timescales over Northeast China during 1961–2014. Water Clim. Chang. 2017, 8, 535–556. [Google Scholar] [CrossRef]
  18. Alexander, L.V.; Zhang, X.; Peterson, T.C.; Caesar, J.; Gleason, B.; Klein Tank, A.M.G.; Haylock, M.; Collins, D.; Trewin, B.; Rahimzadeh, F.; et al. Global observed changes in daily climate extremes of temperature and precipitation. J. Geophys. Res. Atmos. 2006, 111, D05109. [Google Scholar] [CrossRef]
  19. Wang, X.L.; Feng, Y. RHtests_dlyPrcp User Manual; Climate Research Division, Environment Canada: Toronto, ON, Canada, 2013.
  20. Li, B.; Chen, Y.; Chen, Z.; Xiong, H.; Lian, L. Why does precipitation in Northwest China show a significant increasing trend from 1960 to 2010? Atmos. Res. 2016, 167, 275–284. [Google Scholar] [CrossRef]
  21. Liu, S.; Huang, S.; Huang, Q.; Xie, Y.; Leng, G.; Luan, J.; Song, X.; Wei, X.; Li, X. Identification of the non-stationarity of extreme precipitation events and correlations with large-scale ocean-atmospheric circulation patterns: A case study in the Wei River basin, China. J. Hydrol. 2017, 548, 184–195. [Google Scholar] [CrossRef]
  22. Cheng, Q.; Zhong, F.; Wang, P. Potential linkages of extreme climate events with vegetation and large-scale circulation indices in an endorheic river basin in Northwest China. Atmos. Res. 2021, 247, 105256. [Google Scholar] [CrossRef]
  23. Wei, W.; Zou, S.; Duan, W.; Chen, Y.; Li, S.; Zhou, Y. Spatiotemporal variability in extreme precipitation and associated large-scale climate mechanisms in Central Asia from 1950 to 2019. J. Hydrol. 2023, 620, 129417. [Google Scholar] [CrossRef]
  24. Nalley, D.; Adamowski, J.; Biswas, A.; Gharabaghi, B.; Hu, W. A multiscale and multivariate analysis of precipitation and streamflow variability in relation to ENSO, NAO and PDO. J. Hydrol. 2019, 574, 288–307. [Google Scholar] [CrossRef]
  25. Dong, H.; Huang, S.; Wang, H.; Shi, H.; Singh, V.P.; She, D.; Huang, Q.; Leng, G.; Gao, L.; Wei, X.; et al. Effects of interaction of multiple large-scale atmospheric circulations on precipitation dynamics in China. Sci. Total Environ. 2024, 923, 171528. [Google Scholar] [CrossRef]
  26. Zhao, Y.; Zou, X.; Cao, L.; Xu, X. Changes in precipitation extremes over the Pearl River Basin, southern China, during 1960–2012. Quat. Int. 2014, 333, 26–39. [Google Scholar] [CrossRef]
  27. You, Q.; Kang, S.; Aguilar, E.; Pepin, N.; Flügel, W.; Yan, Y.; Xu, Y.; Zhang, Y.; Huang, J. Changes in daily climate extremes in China and their connection to the large-scale atmospheric circulation during 1961–2003. Clim. Dyn. 2011, 36, 2399–2417. [Google Scholar] [CrossRef]
  28. Shao, Y.; Mu, X.; He, Y.; Sun, W.; Zhao, G.J.; Gao, P. Spatiotemporal variations of extreme precipitation events at multi-time scales in the Qinling-Daba mountains region, China. Quat. Int. 2019, 525, 89–102. [Google Scholar] [CrossRef]
  29. Sen, P.K. Estimates of the regression coefficient based on Kendall’s tau. J. Am. Stat. Assoc. 1968, 63, 1379–1389. [Google Scholar] [CrossRef]
  30. Hu, W.; Si, B.C. Technical note: Multiple wavelet coherence for untangling scale-specific and localized multivariate relationships in geosciences. Hydrol. Earth Syst. Sci. 2016, 20, 3183–3191. [Google Scholar] [CrossRef]
  31. Sang, Y.-F.; Wang, Z.; Liu, C. Comparison of the MK test and EMD method for trend identification in hydrological time series. J. Hydrol. 2014, 510, 293–298. [Google Scholar] [CrossRef]
  32. Jhajharia, D.; Dinpashoh, Y.; Kahya, E.; Choudhary, R.; Singh, V.P. Trends in temperature over Godavari river basin in southern peninsular India. Int. J. Climatol. 2014, 34, 1369–1384. [Google Scholar] [CrossRef]
  33. Zhao, G.J.; Hormann, G.; Fohrer, N.; Zhang, Z.X.; Zhai, J.Q. Streamflow trends and climate variability impacts in Poyang Lake Basin, China. Water Resour. Manag. 2010, 24, 689–706. [Google Scholar] [CrossRef]
  34. Roxy, M.K.; Ghosh, S.; Pathak, A.; Athulya, R.; Mujumdar, M.; Murtugudde, R.; Terray, P.; Rajeevan, M. A threefold rise in widespread extreme rain events over central India. Nat. Commun. 2017, 8, 708. [Google Scholar] [CrossRef]
  35. Falga, R.; Wang, C. The rise of Indian summer monsoon precipitation extremes and its correlation with long-term changes of climate and anthropogenic factors. Sci. Rep. 2022, 12, 11547. [Google Scholar] [CrossRef]
  36. Ruiz-Alvarez, O.; Singh, V.P.; Enciso-Medina, J.; Ontiveros-Capurata, R.E.; Santos, C.A.C. Observed trends in daily extreme precipitation indices in Aguascalientes, Mexico. Meteorol. Appl. 2020, 27, e1838. [Google Scholar] [CrossRef]
  37. Colorado-Ruiz, G.; Cavazos, T. Trends of daily extreme and non-extreme rainfall indices and intercomparison with different gridded data sets over Mexico and the southern United States. Int. J. Climatol. 2021, 41, 5711–5730. [Google Scholar] [CrossRef]
  38. Li, Z.; He, Y.; Wang, P.; Theakstone, W.; An, W.; Wang, X.; Lu, A.; Zhang, W.; Cao, W. Changes of daily climate extremes in southwestern China during 1961–2008. Glob. Planet. Chang. 2012, 80–81, 255–272. [Google Scholar] [CrossRef]
  39. Chen, F.; Chen, H.; Yang, Y. Annual and seasonal changes in means and extreme events of precipitation and their connection to elevation over Yunnan Province, China. Quat. Int. 2015, 374, 46–61. [Google Scholar] [CrossRef]
  40. Zhang, R. Changes in East Asian summer monsoon and summer rainfall over eastern China during recent decades. Sci. Bull. 2015, 60, 1222–1224. [Google Scholar] [CrossRef]
  41. Pei, F.; Li, X.; Liu, X.; Hu, Z.; Xia, Y.; Liu, L.; Wang, K.; Zhou, Y.; Xu, L. Detection and attribution of extreme precipitation changes from 1961 to 2012 in the Yangtze River Delta in China. Catena 2018, 169, 183–194. [Google Scholar] [CrossRef]
  42. Zhou, L.; Jiang, Z.; Li, Z.; Yang, X. Numerical simulation of urbanization climate effects in regions of east China. Chin. J. Atmos. Sci. 2015, 39, 596–610. [Google Scholar]
  43. Gao, T.; Xie, L. Multivariate regression analysis and statistical modeling for summer extreme precipitation over the Yangtze River basin, China. Adv. Meteorol. 2014, 2014, 269059. [Google Scholar] [CrossRef]
  44. Gao, T.; Xie, L.; Liu, B. Association of extreme precipitation over the Yangtze River Basin with global air–sea heat fluxes and moisture transport. Int. J. Climatol. 2016, 36, 3020–3038. [Google Scholar] [CrossRef]
  45. Ferguglia, O.; Palazzi, E.; Arnone, E. Elevation dependent change in ERA5 precipitation and its extremes. Clim. Dyn. 2024, 62, 8137–8153. [Google Scholar] [CrossRef]
  46. Mei, C.; Liu, J.; Chen, M.; Wang, H.; Li, M.; Yu, Y.D. Multi-decadal spatial and temporal changes of extreme precipitation patterns in northern China (Jing-Jin-Ji district, 1960–2013). Quat. Int. 2018, 476, 1–13. [Google Scholar] [CrossRef]
  47. Jenks, G.F. The data model concept in statistical mapping. Int. Yearb. Cartogr. 1967, 7, 186–190. [Google Scholar]
  48. Regmi, S.; Bookhagen, B. The spatial pattern of extreme precipitation from 40 years of gauge data in the central Himalaya. Weather Clim. Extrem. 2022, 37, 100470. [Google Scholar] [CrossRef]
  49. Yang, X.; Zhang, Y.; Liu, L. Changes in precipitation extremes over the Chinese Loess Plateau. J. Geophys. Res. Atmos. 2014, 119, 1–18. [Google Scholar]
  50. Sun, W.; Mu, X.; Song, X.; Wu, D.; Cheng, A.; Qiu, B. Changes in extreme temperature and precipitation events in the Loess Plateau (China) during 1960–2013 under global warming. Atmos. Res. 2016, 168, 33–48. [Google Scholar] [CrossRef]
  51. Tong, S.; Li, X.; Zhang, J. Spatial and temporal variability in extreme temperature and precipitation events in Inner Mongolia (China) during 1960–2017. Sci. Total Environ. 2019, 649, 75–89. [Google Scholar] [CrossRef]
  52. Chen, J.; Lu, G.; Wu, Z.; He, H. Inner-annual distribution characteristics of the extreme precipitation processes events over the Yangtze River Basin. Resour. Environ. Yangtze Basin 2014, 23, 588–594. [Google Scholar]
  53. Rao, J.; Ren, R. A decomposition of ENSO’s impacts on the northern winter stratosphere: Competing effect of SST forcing in the tropical Indian Ocean. Clim. Dyn. 2016, 46, 3689–3707. [Google Scholar] [CrossRef]
  54. Ren, Z.; Zhao, H.; Mu, X.; Shi, K.; Jin, X. Spatiotemporal variations of extreme weather events and climate drivers in the Three Gorges Reservoir Area and its surrounding regions from 1960 to 2020. Atmos. Res. 2024, 304, 107379. [Google Scholar] [CrossRef]
  55. Wang, B.; Wu, R.; Fu, X. Pacific–East Asian teleconnection: How does ENSO affect East Asian climate? J. Clim. 2000, 13, 1517–1536. [Google Scholar] [CrossRef]
  56. Duan, L.; Zheng, J.; Li, W.; Liu, T.; Luo, Y. Multivariate properties of extreme precipitation events in the Pearl River basin, China: Magnitude, frequency, timing, and related causes. Hydrol. Process. 2017, 31, 3662–3671. [Google Scholar] [CrossRef]
  57. Wu, X.; Mao, J. Interdecadal modulation of ENSO-related spring rainfall over South China by the Pacific decadal oscillation. Clim. Dyn. 2016, 47, 3203–3220. [Google Scholar] [CrossRef]
  58. Yang, H. The significant relationship between the Arctic Oscillation (AO) in December and the January climate over South China. Adv. Atmos. Sci. 2011, 28, 398–407. [Google Scholar] [CrossRef]
  59. He, S.; Wang, Z.; Wang, D.; Liao, W.; Wu, X.; Lai, C. Spatiotemporal variability of event-based rainstorm: The perspective of rainfall pattern and concentration. Int. J. Climatol. 2022, 42, 6258–6276. [Google Scholar] [CrossRef]
  60. Xiao, M.; Zhang, Q.; Singh, V.P. Spatiotemporal variations of extreme precipitation regimes during 1961–2010 and possible teleconnections with climate indices across China. Int. J. Climatol. 2017, 37, 468–479. [Google Scholar] [CrossRef]
  61. Ming, J.; Xiao, C.; Du, Z.; Yang, X. An overview of black carbon deposition in High Asia glaciers and its impacts on radiation balance. Adv. Water Resour. 2013, 55, 80–87. [Google Scholar] [CrossRef]
Figure 1. Distribution of the meteorological stations within the six divisions of China: Northeast (NE), North China (NC), Northwest China (NW), Southwest (SW), Central South (SC), and East China (EC).
Climate 14 00112 g001
Figure 2. Methodology of this study.
Climate 14 00112 g002
Figure 3. Interannual variation in extreme precipitation indices in China and six sub-regions from 1960 to 2020. (a) PRCPTOT; (b) CWD; (c) R20; (d) R95p; (e) R99p; (f) RX1day; (g) Rx5day; (h) SDII. Note: Dashed line: 5-year moving average. The definitions and explanations of each indicator can be found in Table 1.
Climate 14 00112 g003
Figure 4. Interannual variation and Mann–Kendall (MK) mutation test of extreme precipitation indices in China from 1960 to 2020. (a) PRCPTOT; (b) CWD; (c) R20; (d) R95p; (e) R99p; (f) RX1day; (g) Rx5day; (h) SDII.
Climate 14 00112 g004
Figure 5. Wavelet power spectrum (WPS) of continuous wavelet transform (CWT) of extreme precipitation indices in China from 1960 to 2020. (a) PRCPTOT; (b) CWD; (c) R20; (d) R95p; (e) R99p; (f) RX1day; (g) Rx5day; (h) SDII. The thick black contour designates the 5% significance level against a red-noise background spectrum. The dashed black line indicates the cone of influence (COI), beyond which edge effects become significant and results should be interpreted with caution.
Climate 14 00112 g005
Figure 6. Spatial distribution of annual extreme precipitation indices values in China and six sub-regions during 1960–2020. (a) PRCPTOT; (b) CWD; (c) R20; (d) R95p; (e) R99p; (f) RX1day; (g) Rx5day; (h) SDII.
Climate 14 00112 g006
Figure 7. The number of stations with different trends of extreme precipitation indices from 1960 to 2020.
Climate 14 00112 g007
Figure 8. Spatial distribution of variation trend of extreme precipitation indices in China and sub-regions from 1960 to 2020. (a) PRCPTOT; (b) CWD; (c) R20; (d) R95p; (e) R99p; (f) RX1day; (g) Rx5day; (h) SDII.
Climate 14 00112 g008
Figure 9. Boxplots of the height bands of the extreme precipitation indices classification. (a) PRCPTOT; (b) CWD; (c) R20; (d) R95p; (e) R99p; (f) RX1day; (g) Rx5day; (h) SDII.
Climate 14 00112 g009
Figure 10. Correlations between extreme precipitation indices and atmosphere–ocean circulations in China during 1960–2020.
Climate 14 00112 g010
Figure 11. Wavelet coherence (WTC) between extreme precipitation indices and atmosphere–ocean circulations in China from 1960 to 2020. (a) WTC between extreme precipitation indices and SCSMMI; (b) WTC between extreme precipitation indices and NAO; (c) WTC between extreme precipitation indices and PNA; (d) WTC between extreme precipitation indices and WPSHI intensity. The thick black outline depicts the 0.05 confidence level; → indicates in-phase relationship; ← indicates anti-phase relationship; ↑ indicates that the extreme precipitation index leads the circulation index by T/4 years (where T is the period); ↓ indicates that the extreme precipitation index lags behind the circulation index by T/4 years.
Climate 14 00112 g011
Figure 12. Wavelet coherence between atmospheric circulation factors and extreme precipitation indices. Thin solid lines demarcate the cones of influence and thick solid lines show 95% confidence levels. (a) MWC between R20–NAO–SCSMMI–WPSHI; (b) MWC between R99p–SCSMMI–WPSHI; (c) MWC between R99p–ENSO–PNA; (d) MWC between RX5day–ENSO–AO; (e) MWC between RX5day–SCSMMI–WPSHI; (f) MWC between RX5day–ENSO–NAO–PNA; (g) MWC between SDII–ENSO–PDO–EASMI; (h) MWC between SDII–PNA–SCSMMI–WPSHI.
Climate 14 00112 g012
Table 1. Definitions of extreme precipitation indices recommended by the World Meteorological Organization.
CharacteristicIndexDescriptive NameDefinitionUnits
Frequency
Duration
R20Number of very heavy
precipitation days
Annual number of days when
daily precipitation ≥ 20 mm
days
CWDConsecutive wet daysMaximum number of
consecutive wet days
days
IntensitySDIISimple daily intensity
Index
Average precipitation
on wet days
mm/day
RX1dayMaximum 1-day
Precipitation
Annual maximum 1-day
precipitation
mm
RX5dayMaximum 5-day
Precipitation
Annual maximum 5-day precipitationmm
R95PVery wet day
Precipitation
Annual total precipitation
when RR > 95th percentile
mm
R99PExtremely wet day
Precipitation
Annual total precipitation
when RR > 99th percentile
mm
PRCPTOTWet-day precipitationAnnual total PRCP in wet daysmm
Table 2. Mean trend magnitudes of extreme precipitation in China and six sub-regions from 1960 to 2020.
Slope
IndexWholeNENCECSCNWSW
PRCPTOT5.583.11−1.6620.04 *10.834.78−7.55
CWD−0.07 **−0.02−0.05−0.07−0.07−0.02−0.19 **
R200.120.060.030.37 *0.260.06−0.10
R95p6.86 **4.40−0.9516.98 **10.90 **3.01 *3.01
R99p3.80 **2.56−0.998.54 **5.67 *1.79 **3.13 **
RX1day0.77 **0.52−0.701.78 **1.50 *0.60 **0.43
RX5day0.850.33−1.283.01 *1.920.53−0.25
SDII0.11 **0.070.040.22 **0.20 **0.07 **0.05
Note: The units of slope of RX1day, RX5day, R95p, R99p and PRCPTOT are mm/decade, and SDII is mm/day/decade, while R10, R20, CDD and CWD are days/decade. * Significant at the 0.05 level; ** significant at the 0.01 level. The definitions and explanations of each index can be found in Table 1.
Table 3. Detection and statistics of extreme precipitation indices mutation in China from 1960 to 2020.
Extreme Precipitation IndicesYear of Abrupt ChangeZ ValueSlope βTrend
PRCPTOT20140.28230.5962
CWD1977−0.4704−0.0073
R2020120.53310.0127
R95p20050.0940.6865
R99p2005−0.03140.3351
RX1day2012−1.160.067
RX5day2016−0.84680.0772
SDII20050.15680.011
Note: ↑ indicates upward trend ↓ indicates downward trend.
Table 4. Percent area of significant coherence (PASC) and average wavelet coherence coefficient (AWC), for the wavelet coherence between extreme precipitation indices and two or three atmospheric circulation factors. The 5 percent area of significant coherence (PASC) and average wavelet coherence coefficient (AWC), for the wavelet coherence between extreme precipitation indices and two or three atmospheric circulation factors. The highest PASC value of MWC is shown in bold.
IndicesCirculation FactorsPASCAWC
R20SCSMMI-WPSHI0.060.65
NAO-PNA0.030.56
NAO-SCSMMI0.080.62
NAO-SCSMMI-WPSHI0.020.76
R99pSCSMMI-WPSHI0.110.66
PNA-SCSMMI-WPSHI0.090.76
ENSO-PNA0.110.66
ENSO-PNA-WPSHI0.060.82
RX5daySCSMMI-WPSHI0.070.65
PNA-SCSMMI-WPSHI0.040.79
ENSO-AO0.070.68
ENSO-AO-PNA0.070.82
ENSO-NAO-PNA0.060.79
SDIISCSMMI-WPSHI0.20.66
PNA-SCSMMI-WPSHI0.170.76
NAO-PNA0.070.59
ENSO-PDO0.20.84
ENSO-PDO-EASMI0.230.72
Table 5. Comparison of trends in extreme precipitation indices from this study and other works in China.
This StudyGlobeChinaNorthwest ChinaSouth ChinaCentral and South ChinaNortheast ChinaSouthwest China
Index1960–20201951–20031961–20051960–20101960–20181960–20121960–20101960–2008
PRCPTOT5.5810.59 *3.216.82 *−26.33 16.500.03
CWD−0.07 * 0.05 *−0.22−0.16 *0.00−0.08 *
R200.12 −0.25 0.10
R95p6.86 *4.07 *4.06 *3.01 *−6.017.78 *13.700.04
R99p3.80 * −0.176.59 *12.800.05 *
RX1day0.77 *0.85 *1.370.63 *0.581.43 *0.50
RX5day0.850.551.900.98 *0.461.50 *1.300.03
SDII0.11 *0.050.060.05 *0.180.11 *−0.200.03
Data source[18][27][14][12][1][15][38]
Note: * Values for trend significant at the 0.05 level.
Disclaimer/Publisher’s Note: The statements, opinions and data contained in all publications are solely those of the individual author(s) and contributor(s) and not of MDPI and/or the editor(s). MDPI and/or the editor(s) disclaim responsibility for any injury to people or property resulting from any ideas, methods, instructions or products referred to in the content.