Article

Filling the Gaps: Creating a Consistent Rainfall Dataset for Maranhão State, Brazil (1987–2023)

by
Gunter de Azevedo Reschke
1,*,
Carlos Wendell Soares Dias
2,
Ronaldo Haroldo Nascimento de Menezes
3,
Fabricio Pires Chagas
4 and
Celso Henrique Leite Silva-Junior
1,4,5
1
BIONORTE Network Graduate Program, Federal University of Maranhão, São Luís 65080-805, MA, Brazil
2
Graduate Program in Agricultural Sciences, State University of Maranhão, São Luís 65055-310, MA, Brazil
3
Department of Agricultural Engineering, State University of Maranhão, São Luís 65055-310, MA, Brazil
4
Graduate Program in Biodiversity and Conservation (PPGBC), Federal University of Maranhão, São Luís 65080-805, MA, Brazil
5
Instituto de Pesquisa Ambiental da Amazônia (IPAM), SCN 211, Bloco B, Sala 201, Brasília 70836-520, GO, Brazil
*
Author to whom correspondence should be addressed.
Climate 2026, 14(3), 63; https://doi.org/10.3390/cli14030063
Submission received: 21 October 2025 / Revised: 18 December 2025 / Accepted: 19 December 2025 / Published: 3 March 2026

Abstract

This study presents the development and validation of a consistent rainfall database for Maranhão State, Brazil, covering historical records from 1987 to 2023 obtained from 100 rainfall stations (90 from ANA and 10 from INMET). A total of 314 missing records across 74 stations were corrected using the Regional Weighting method, restricted to stations within the same Homogeneous Precipitation Region (HPR). The consistency of the reconstructed series was verified using the Double Mass method, which yielded coefficients of determination (R2) above 0.97 for all stations, confirming the robustness of the procedure. Statistical analyses with the Mann–Kendall test and Sen’s Slope estimator did not identify significant long-term trends, although weak positive slopes were detected in some regions (e.g., HPR3: +9.98 mm/year; HPR6: +3.70 mm/year), while HPR10 showed a negative slope (−0.99 mm/year). The novelty of this work lies in consolidating the first homogeneous and validated rainfall database for Maranhão, providing a reliable foundation for assessing regional climate variability. The results provide a solid foundation for future applications, including drought monitoring, agricultural planning, water resource management, and adaptation strategies under climate change scenarios.

1. Introduction

The availability of continuous, consistent, and spatially representative rainfall series is one of the fundamental pillars for climatological, hydrological, and environmental studies in tropical regions [1,2,3]. In the tropics, where rainfall variability is high and modulated by large-scale phenomena such as the El Niño–Southern Oscillation (ENSO), the Atlantic Dipole, and the Pacific Decadal Oscillation (PDO), the acquisition of complete and reliable datasets becomes even more critical for understanding climate dynamics and their socio-environmental impacts [4,5]. However, the absence of continuous records remains one of the major constraints for long-term hydrometeorological analyses, especially in areas with sparse and historically irregular observational networks, as is the case in several parts of Brazil [6,7].
The incompleteness of meteorological and rainfall station records is widely documented in national and international literature [8], representing a critical limitation for hydrological model calibration, evapotranspiration estimates, trend analysis, and extreme climate studies [9]. Recent research has emphasized that untreated or inadequately treated data gaps introduce significant biases, hinder reproducibility, and compromise the use of time series in climate change assessments. Therefore, gap filling represents a fundamental step to ensure the quality and reliability of data used in climate analyses.
In response to this challenge, several gap-filling methods have been refined over recent decades. Traditional approaches such as Linear Regression, Normal Ratio, Regional Weighting, and Inverse Distance Weighting (IDW) remain widely used due to their simplicity and good performance in regions with reasonable station density [10,11]. More recent approaches incorporate advanced techniques, including geostatistical models, machine learning, satellite-based analyses, and multisensor data fusion. The field of hydrology has also embraced the advancements of machine learning (ML) and artificial intelligence (AI) with ongoing developments to incorporate ML and AI into hydrological modeling, especially using long short-term memory (LSTM) network [12] as well as hybrid (AI + process-informed) systems [13].
The integration of surface and satellite data has also been explored to improve gap filling. For instance, ref. [14] proposed a model combining regional intelligent optimization, topographic analysis, and neural networks to reconstruct global precipitation fields, effectively addressing data gaps at different scales. This model significantly enhanced precipitation estimates, especially in mountainous regions with scarce observational data.
Several studies based on the Soil and Water Assessment Tool (SWAT) have been conducted for Pernambuco in the Capibaribe River Basin, using simulations of future land-use change and climate change scenarios to operationalize Hydrological Response Units [15,16,17,18,19,20,21]. However, these studies demonstrated the need for improved precipitation gap-filling procedures as input for the system.
Despite recent methodological advances in integrating surface stations, satellite products, reanalysis datasets, and data imputation techniques, many Brazilian states still lack consolidated rainfall databases with systematic quality control to support robust climatological analyses at the sub-state scale [22].
In Maranhão, this gap is even more evident: although national databases (ANA, BDMEP/INMET) list hundreds of rainfall stations in the state, the spatial distribution is uneven, and many time series contain long operational interruptions and missing records, hindering the construction of a standardized and continuous state-level database. Furthermore, the state exhibits high rainfall variability, with annual totals below 800 mm in central–southern areas and above 2200 mm along the Amazon coastal sector, combined with strong physiographic diversity, including humid coastal zones, floodplains, central plateaus, and transitional Cerrado landscapes [23]. This mosaic of conditions makes rainfall regionalization and the use of rigorous consistency and gap-filling methods such as double mass analysis, homogeneous precipitation region (HPR) delineation, and advanced statistical imputation indispensable before diagnosing climate trends or extremes [24].
In this context, the present study advances the literature by developing and validating the first consistent, statewide rainfall database for Maranhão, covering the period 1987–2023. The work integrates the following: (i) the collection and organization of data from 100 ANA and INMET stations; (ii) the identification and filling of 314 missing values using the Regional Weighting Method; (iii) regional consistency verification through the Double Mass Curve approach; (iv) a statistical analysis of rainfall variability and trends across ten Homogeneous Precipitation Regions (HPRs). By providing a consistent, methodologically robust database, this study helps overcome historical gaps in understanding Maranhão’s rainfall variability, gaps highlighted by previous studies but not yet systematically resolved.
Moreover, the resulting dataset provides essential support for hydrological assessments, the application of drought indices such as the SPI, wildfire analyses, and the development of future climate change scenarios. Therefore, this study not only addresses methodological limitations identified in the literature but also establishes a foundational framework for future environmental research in the state.

2. Materials and Methods

2.1. Datasets

The observed precipitation data, including daily and monthly totals, were obtained from a 37-year historical series spanning the period from 1987 to 2023, using the most recent interval available to minimize discrepancies between historical records and projections of future climate change scenarios.
Precipitation records were sourced from the database of the National Water and Basic Sanitation Agency (ANA), which provided 90 rain gauge stations retrieved from the online HidroWeb platform, and from the National Institute of Meteorology (INMET), which contributed 10 meteorological stations, totaling 100 stations. Data processing followed the guidelines of the World Meteorological Organization technical document (WMO-No. 1203, 2017) [25], which establishes procedures for calculating standard and provisional climatological normals. Table 1 presents the list of all rainfall and climatological stations located in the state of Maranhão and neighboring areas that were used in the database of this study.
The ANA dataset refers exclusively to rain gauge stations. In contrast, the INMET dataset includes one climatological station that provides, in addition to precipitation, other meteorological variables such as air temperature and humidity. Figure 1 illustrates the spatial distribution of these stations across the state of Maranhão and its neighboring states (Pará, Tocantins, and Piauí).
According to technical standards, climatological normals are defined as “average values calculated over a relatively long and uniform period, comprising at least three consecutive decades”. Standard climatological normals correspond to consecutive 30-year intervals (for example, 1901–1930, 1931–1960, and so on). For stations that do not have a complete 30-year record, whether due to operational interruptions or other causes, provisional normals may be calculated, provided that at least 10 years of continuous observations are available [26].
Although agroclimatology is the technical field that benefits most directly from climatological normals, virtually all human activities depend on this information, from productive sectors to public health, sports, and recreation. In this study, precipitation data for the period 1987–2023 were used as the foundation for the analyses.

2.2. Methods of Analysis

After data collection, the rainfall and climatological stations were cataloged, and the information was structured into a matrix using electronic spreadsheets. The analysis of the monthly series revealed the presence of missing values resulting from interruptions in several stations within the study area. To address these inconsistencies, statistical techniques for gap filling and consistency verification were applied. To ensure greater robustness, the concept of Homogeneous Precipitation Regions (HPRs) in Maranhão, proposed by [27], was adopted. This classification enabled the grouping of stations according to their rainfall regimes, resulting in ten distinct HPRs.

2.2.1. Gap Filling (Regional Weighting Method)

Gap filling in time series does not imply the creation of new data, but rather the estimation of missing values. As highlighted by [10], this procedure must preserve the intrinsic characteristics of the original series, such as variability, seasonal patterns, and correlations with neighboring stations. According to [11], both the Regional Weighting Method and Linear Regression require nearby stations with complete records to establish correlations for estimating missing data.
In addition, previous studies emphasize that gap-filling procedures should rely on nearby stations within a limited spatial radius to preserve climatological coherence, in line with WMO recommendations, typically not exceeding 150 km [16,25]. The Regional Weighting Method employs linear regressions using data from the three nearest neighboring stations, incorporating distance as a weighting factor [11].
Accordingly, to complete the monthly precipitation data for the 1987–2023 period, the Regional Weighting Method was applied to fill the identified gaps. The estimates were based on stations belonging to the same HPR, following Equation (1):
P f = 1 / 3 P 1 P 1 M + P 2 P 2 M + P 3 P 3 M P f M
where
  • Pf—Missing precipitation value;
  • P1, P2, P3—Precipitation values for the month or year to be corrected at three neighboring stations within the same HPR;
  • P1M, P2M, P3M—Historical mean precipitation at the corresponding stations for that month or year;
  • PfM—Historical mean precipitation at the station with missing data, for the same month or year.
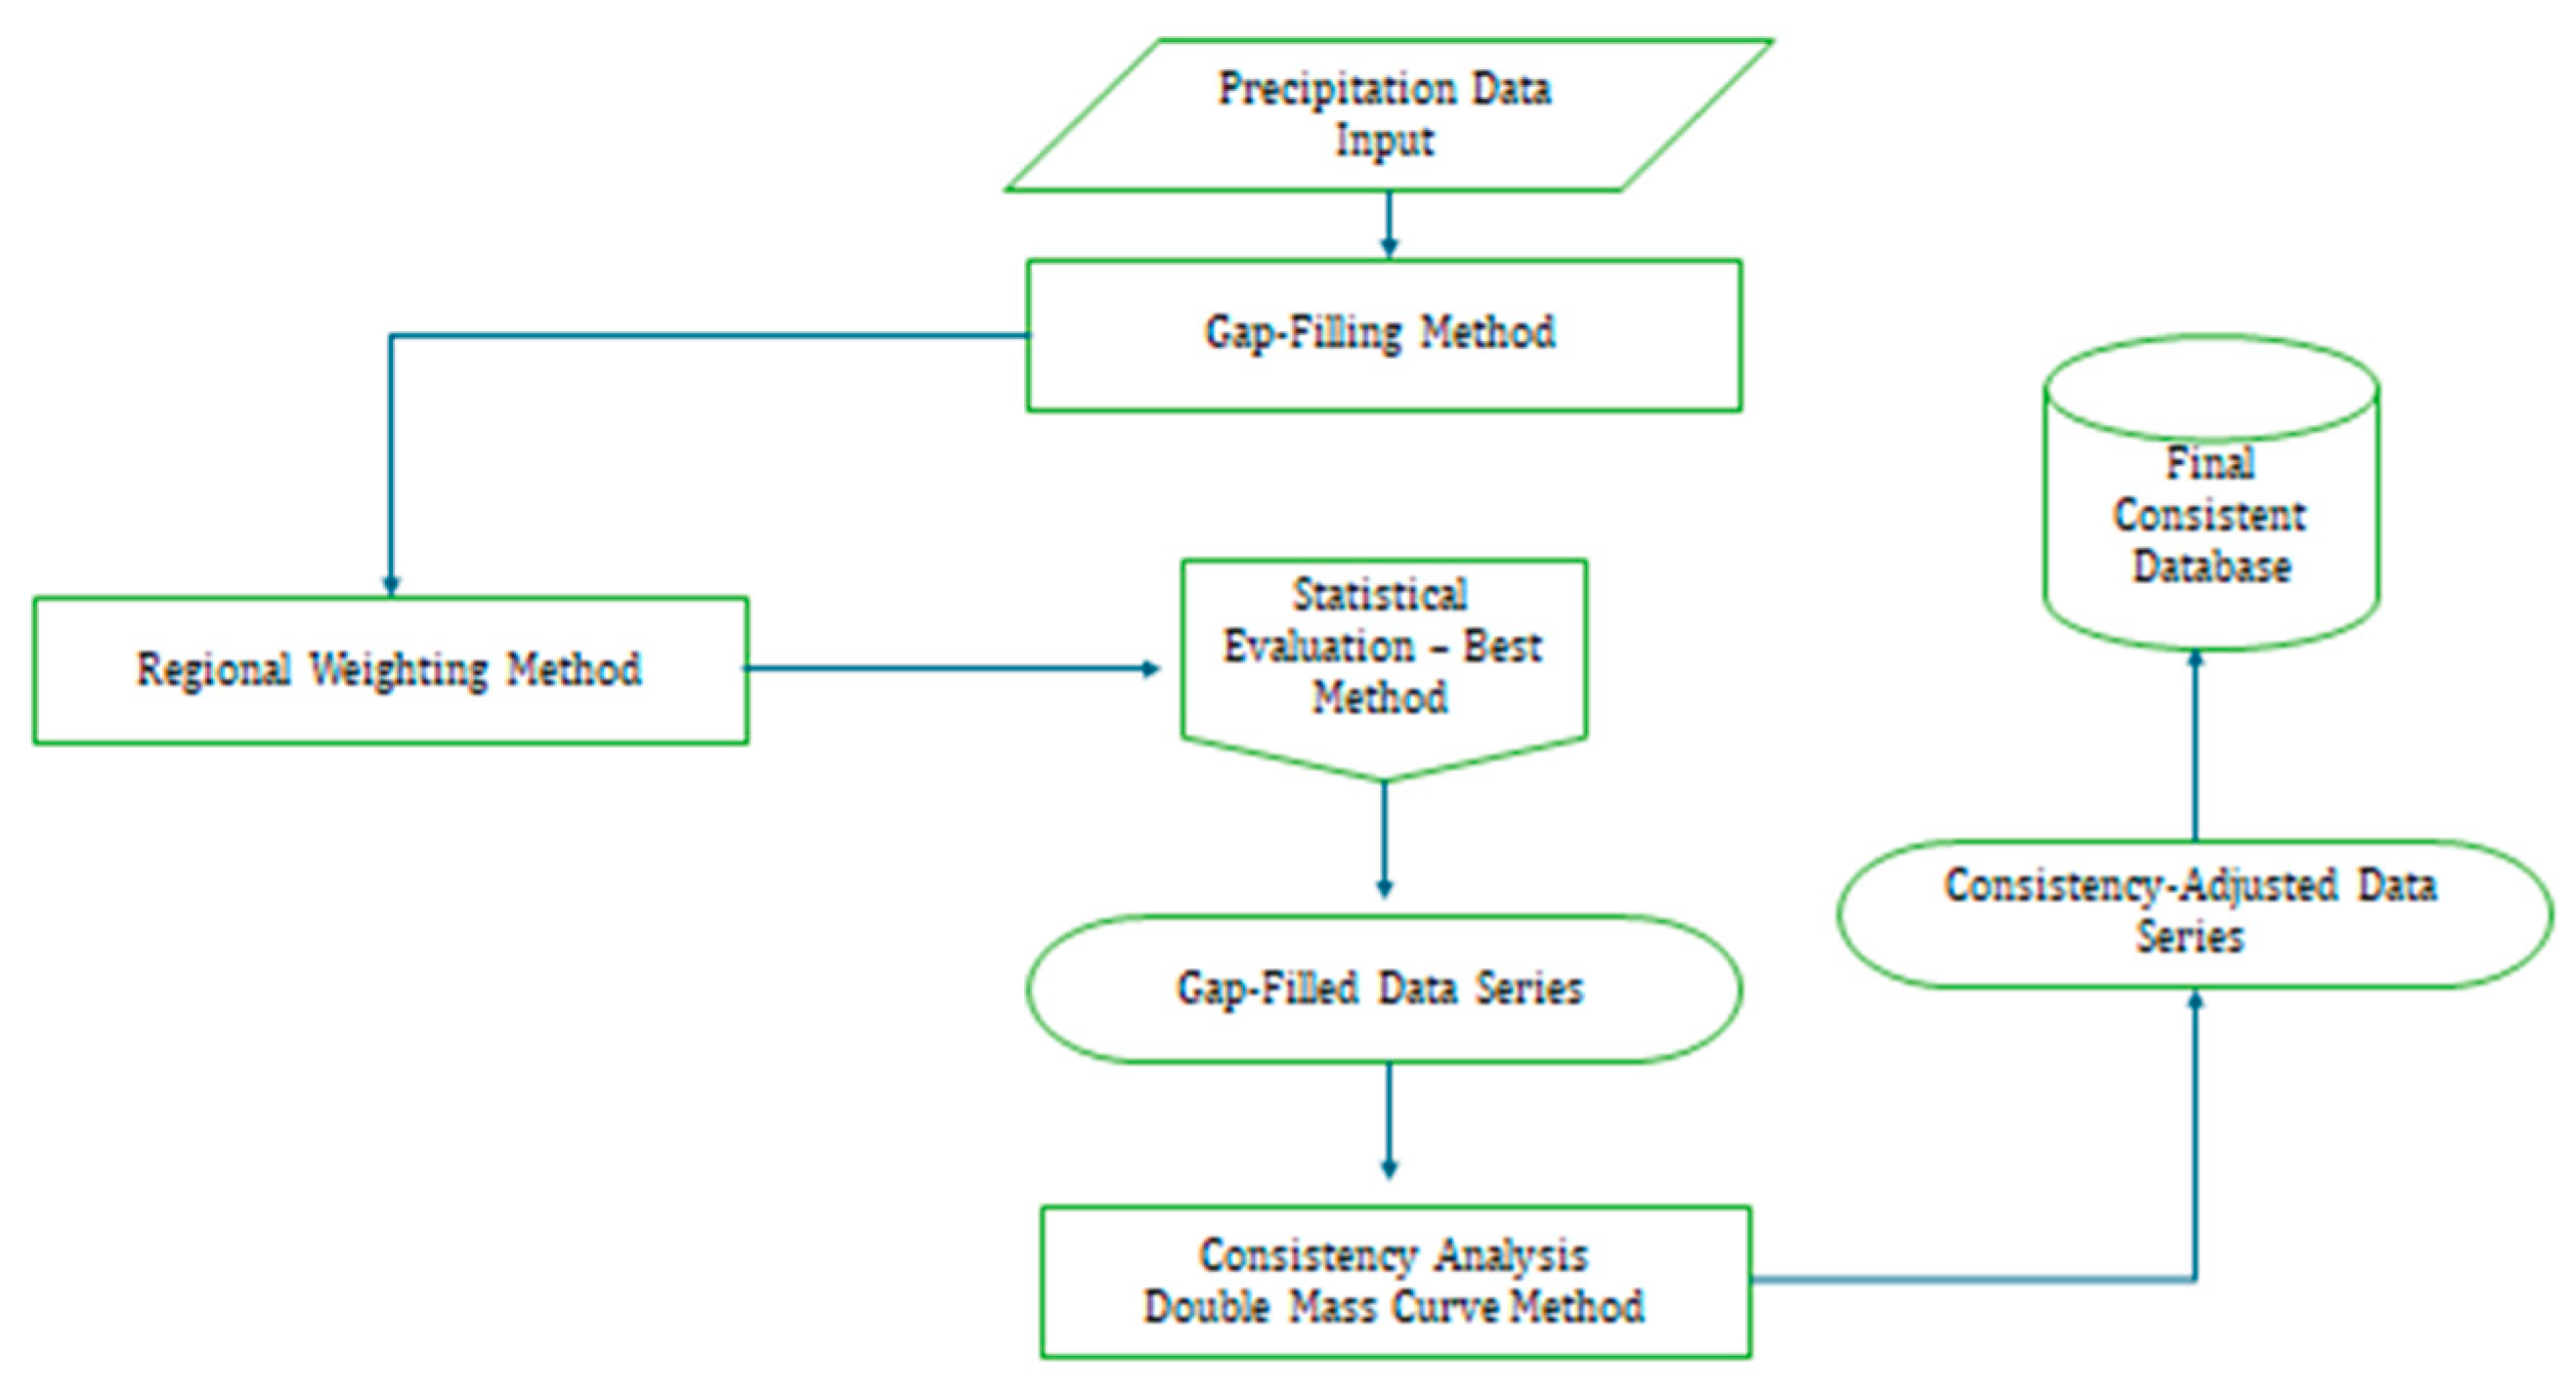
The methodological process adopted in this study is summarized in the flowchart presented in Figure 2, which sequentially organizes the steps involved in the construction, gap filling, and validation of the rainfall database.

2.2.2. Rainfall Data Consistency (Double Mass Method)

The Double Mass method is employed to verify the homogeneity of rainfall data relative to nearby reference stations. This procedure consists of constructing cumulative plots that compare the annual totals of the station under evaluation with those of nearby, reliable stations located within a meteorologically homogeneous region, with the objective of confirming whether the analyzed data are consistent with the regional climatological context.
After gap-filling, regional consistency was assessed by comparing each station with a reliable reference station located between 2.66 km and 137.79 km away. The Double Mass method was applied to detect potential changes in precipitation behavior over time or in measurement conditions. Ideally, proportionality between cumulative series should produce a straight line when represented graphically. For each case, stations were grouped according to their respective HPRs, and the nearest reference station was used for comparison. Annual cumulative totals were plotted in Cartesian graphs, with the accumulated values of the analyzed station on the y-axis and those of the reference station on the x-axis. Consistency adjustments were performed according to Equation (2):
P c o r r = P a c u m + M a M o × Δ P o
where
  • Pcorr—Adjusted accumulated precipitation;
  • Pacum—Value of the ordinate corresponding to the intersection of the two trends;
  • Ma—Slope of the desired trend;
  • Mo—Slope of the original trend;
  • ΔPo—Difference (PoPa), where Po is the accumulated value to be corrected and Pa is the accumulated value of the desired trend.

2.2.3. Homogeneous Precipitation Regions (HPRs)

Cluster Analysis (CA) is widely recognized as one of the most effective methods for identifying homogeneous regions based on a variable of interest. It enables the grouping of stations with similar behavior and the detection of hidden spatial patterns in the dataset. Principal Component Analysis (PCA) can be used in combination with CA, supporting the identification of homogeneous areas in a simple and robust manner.
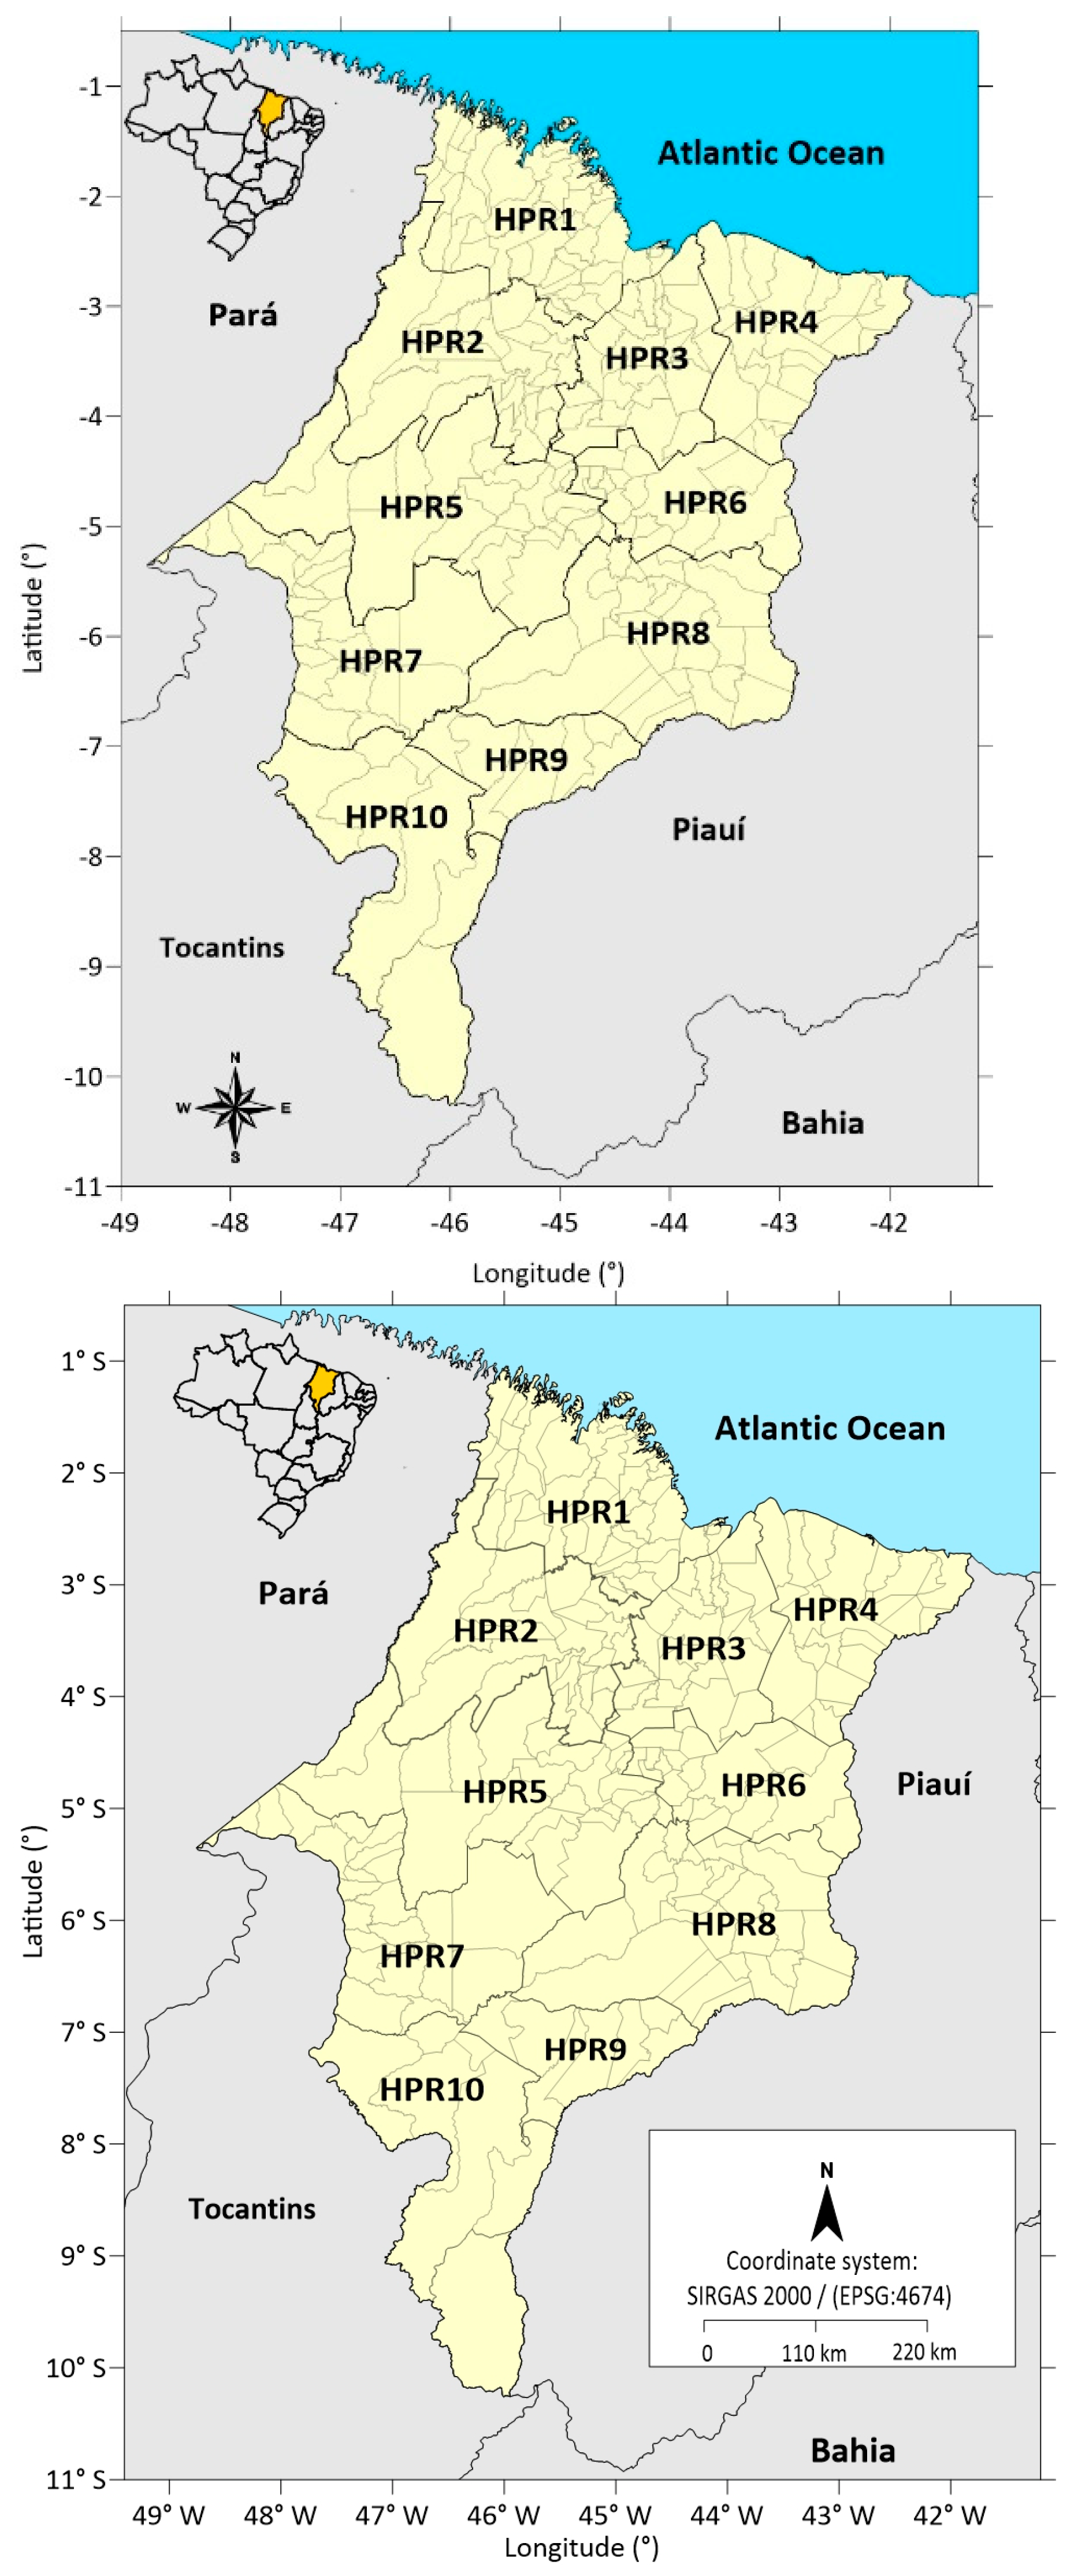
The delineation of homogeneous regions based on their physical and climatic characteristics may serve two primary purposes: (i) hydrological description, and (ii) regionalization for broader applications [28]. In this study, the HPRs were defined through multivariate analysis techniques, specifically PCA and cluster analysis, resulting in the identification of ten HPRs distributed across the state of Maranhão, as shown in Figure 3 and summarized in Table 2.
To define the homogeneous precipitation regions, monthly rainfall data were subjected to PCA to identify the main modes of spatial variability, represented by principal components that explained most of the rainfall variance, following the criterion adopted by [29], also known as the latent root criterion. Subsequently, the principal components that accounted for the highest proportion of total rainfall variability were used as input for cluster analysis to delineate homogeneous precipitation regions. Each region grouped meteorological stations that were most similar to one another and distinct from stations in other regions.
The number of regions to be considered was evaluated through discriminant analysis in order to assess the quality of the classification scheme, verifying whether the formed regions were effectively distinct, internally cohesive, and whether their stations were correctly classified. Based on this assessment, the ten homogeneous precipitation regions used in this study were established.

2.2.4. Mann–Kendall Test

The Mann–Kendall test was applied to detect monotonic trends in rainfall time series for each of the ten HPRs. It is based on the calculation of the statistic S, determined by summing the signs of the differences between all possible pairs of observations in the series. For each pair of values (xj and xi, with j > i), the sign function assumes the value +1 if xj > xi, −1 if xj < xi, and 0 if xj = xi. The summation of these comparisons yields the statistic S, which indicates the direction of the trend: positive values denote an increasing trend, negative values a decreasing trend, and values near zero suggest the absence of a monotonic trend.
The variance of the statistic S (Var(S)) is calculated considering the total number of observations, with adjustments made when ties occur. The standardized value of S is obtained through the Z-statistic, which follows a standard normal distribution. Its calculation depends on three conditions: Z = (S − 1)/√Var(S) when S > 0; Z = (S + 1)/√Var(S) when S < 0; and Z = 0 when S = 0. Statistical significance is assessed using the critical values of the normal distribution at the chosen significance level (α). Absolute Z-values greater than Zα/2 indicate statistically significant trends. In this study, significance was evaluated at the 5% level (α = 0.05).

2.2.5. Sen’s Slope Estimator

Sen’s Slope Estimator [30] is a non-parametric statistical method used to quantify the magnitude of trends in precipitation time series. It is particularly robust for datasets with non-normal distributions and resistant to the influence of extreme values (outliers). The procedure consists of calculating the slope between all possible pairs of points in the series, considering their temporal differences. The median of these individual slopes is adopted as the final trend estimate, representing the rate of change in precipitation over time.
The interpretation of the estimator is straightforward: positive values indicate an increasing trend, whereas negative values indicate a decreasing trend. This method is commonly applied alongside the Mann–Kendall test, which evaluates the statistical significance of the detected trend. Due to its simplicity, robustness, and broad applicability, Sen’s Slope estimator is widely used in meteorological and climatological studies to assess changes and variability in rainfall regimes [31,32].

3. Results

3.1. Gap Filling

After the selection of rainfall stations in Maranhão and surrounding areas, they were classified into their respective Homogeneous Precipitation Regions (HPRs), as shown in Table 3. The following distribution was identified: HPR1 (Western Coastal Zone)—13 stations; HPR2 (Baixada Maranhense Lowlands)—8 stations; HPR3 (Rosário and Itapecuru Mirim)—11 stations; HPR4 (Lower Parnaíba Maranhense)—9 stations; HPR5 (Upper Mearim and Grajaú)—12 stations; HPR6 (Caxias, Codó, and Coelho Neto)—5 stations; HPR7 (Imperatriz and Porto Franco)—10 stations; HPR8 (Chapadas of Upper Itapecuru)—15 stations; HPR9 (Chapadas das Mangabeiras)—6 stations; and HPR10 (Gerais de Balsas)—11 stations.
This classification of stations into HPRs was necessary to apply gap-filling techniques, data consistency checks, and subsequent statistical analyses.
After classification, the months with missing records between 1987 and 2023 were identified for each HPR, and these gaps were subsequently filled (complete tables are provided in the Supplementary Materials). It is important to clarify that the gap-filling method used in this study does not generate fictitious data; rather, it estimates values based on statistically robust relationships among neighboring stations. This procedure is consistent with [33], which prioritized the use of available data and filled only the gaps that were effectively present. Of the 100 stations evaluated, 26 exhibited no missing months, whereas 74 presented at least one gap, with a maximum of 14 missing months. These gaps were corrected using the Regional Weighting Method, in which stations belonging to the same HPR served as reference for estimating the missing values (Table 4).
For demonstration purposes, the procedure adopted for gap filling is illustrated below. The station identified with a missing record for the month of March was 244012, corresponding to the municipality of São Bento. The supporting stations used for gap filling were 245010, 245011, and 82280, associated with the municipalities of Pinheiro, Santa Helena, and São Luís, respectively. Using the regional weighting method, the missing value was estimated according to the following equation:
P f = 1 / 3 P 1 P 1 M + P 2 P 2 M + P 3 P 3 M P f M
where
  • P1P_1P1 = March 2012 precipitation at station 245010 = 224.4 mm;
  • P2P_2P2 = March 2012 precipitation at station 245011 = 165.9 mm;
  • P3P_3P3 = March 2012 precipitation at station 82280 = 331.7 mm;
  • P1MP_{1M}P1M = Mean March precipitation (1987–2023) at station 245010 = 313.8 mm;
  • P2MP_{2M}P2M = Mean March precipitation (1987–2023) at station 245011 = 327.8 mm;
  • P3MP_{3M}P3M = Mean Marchprecipitation (1987–2023) at station 82280 = 460.2 mm;
  • PfMP_{fM}PfM = Mean March precipitation (1987–2023) at the target station 244012 = 376.2 mm.
  • By substituting these values into Equation (1), the estimated precipitation for the missing record is obtained as Pf = 243.5 P_f = 243.5 Pf = 243.5 mm.
The same procedure was applied to all stations with missing records to reconstruct the respective data series. However, due to the large number of stations, only those with missing values and the corresponding reference stations used for gap filling within HPR1 are presented here (Table 5).
The results demonstrate the effectiveness of the Regional Weighting Method in recomposing the monthly precipitation series between 1987 and 2023, while preserving statistical consistency and the local rainfall pattern. The careful application of this method, considering only stations belonging to the same HPR, ensures spatial homogeneity and minimizes potential biases associated with regional climatic differences.

3.2. Consistency Analysis

Preliminary analyses of the rainfall data revealed the presence of monthly gaps in most of the evaluated stations (74 stations, representing 74% of the total). These gaps were successfully corrected using the Regional Weighting Method.
After gap-filling, an assessment of the annual consistency of precipitation data was performed for the stations that will subsequently be used to compute the Standardized Precipitation Index (SPI), with the objective of evaluating drought severity, whether associated with fire activity or not and investigating future rainfall trends in the state of Maranhão.
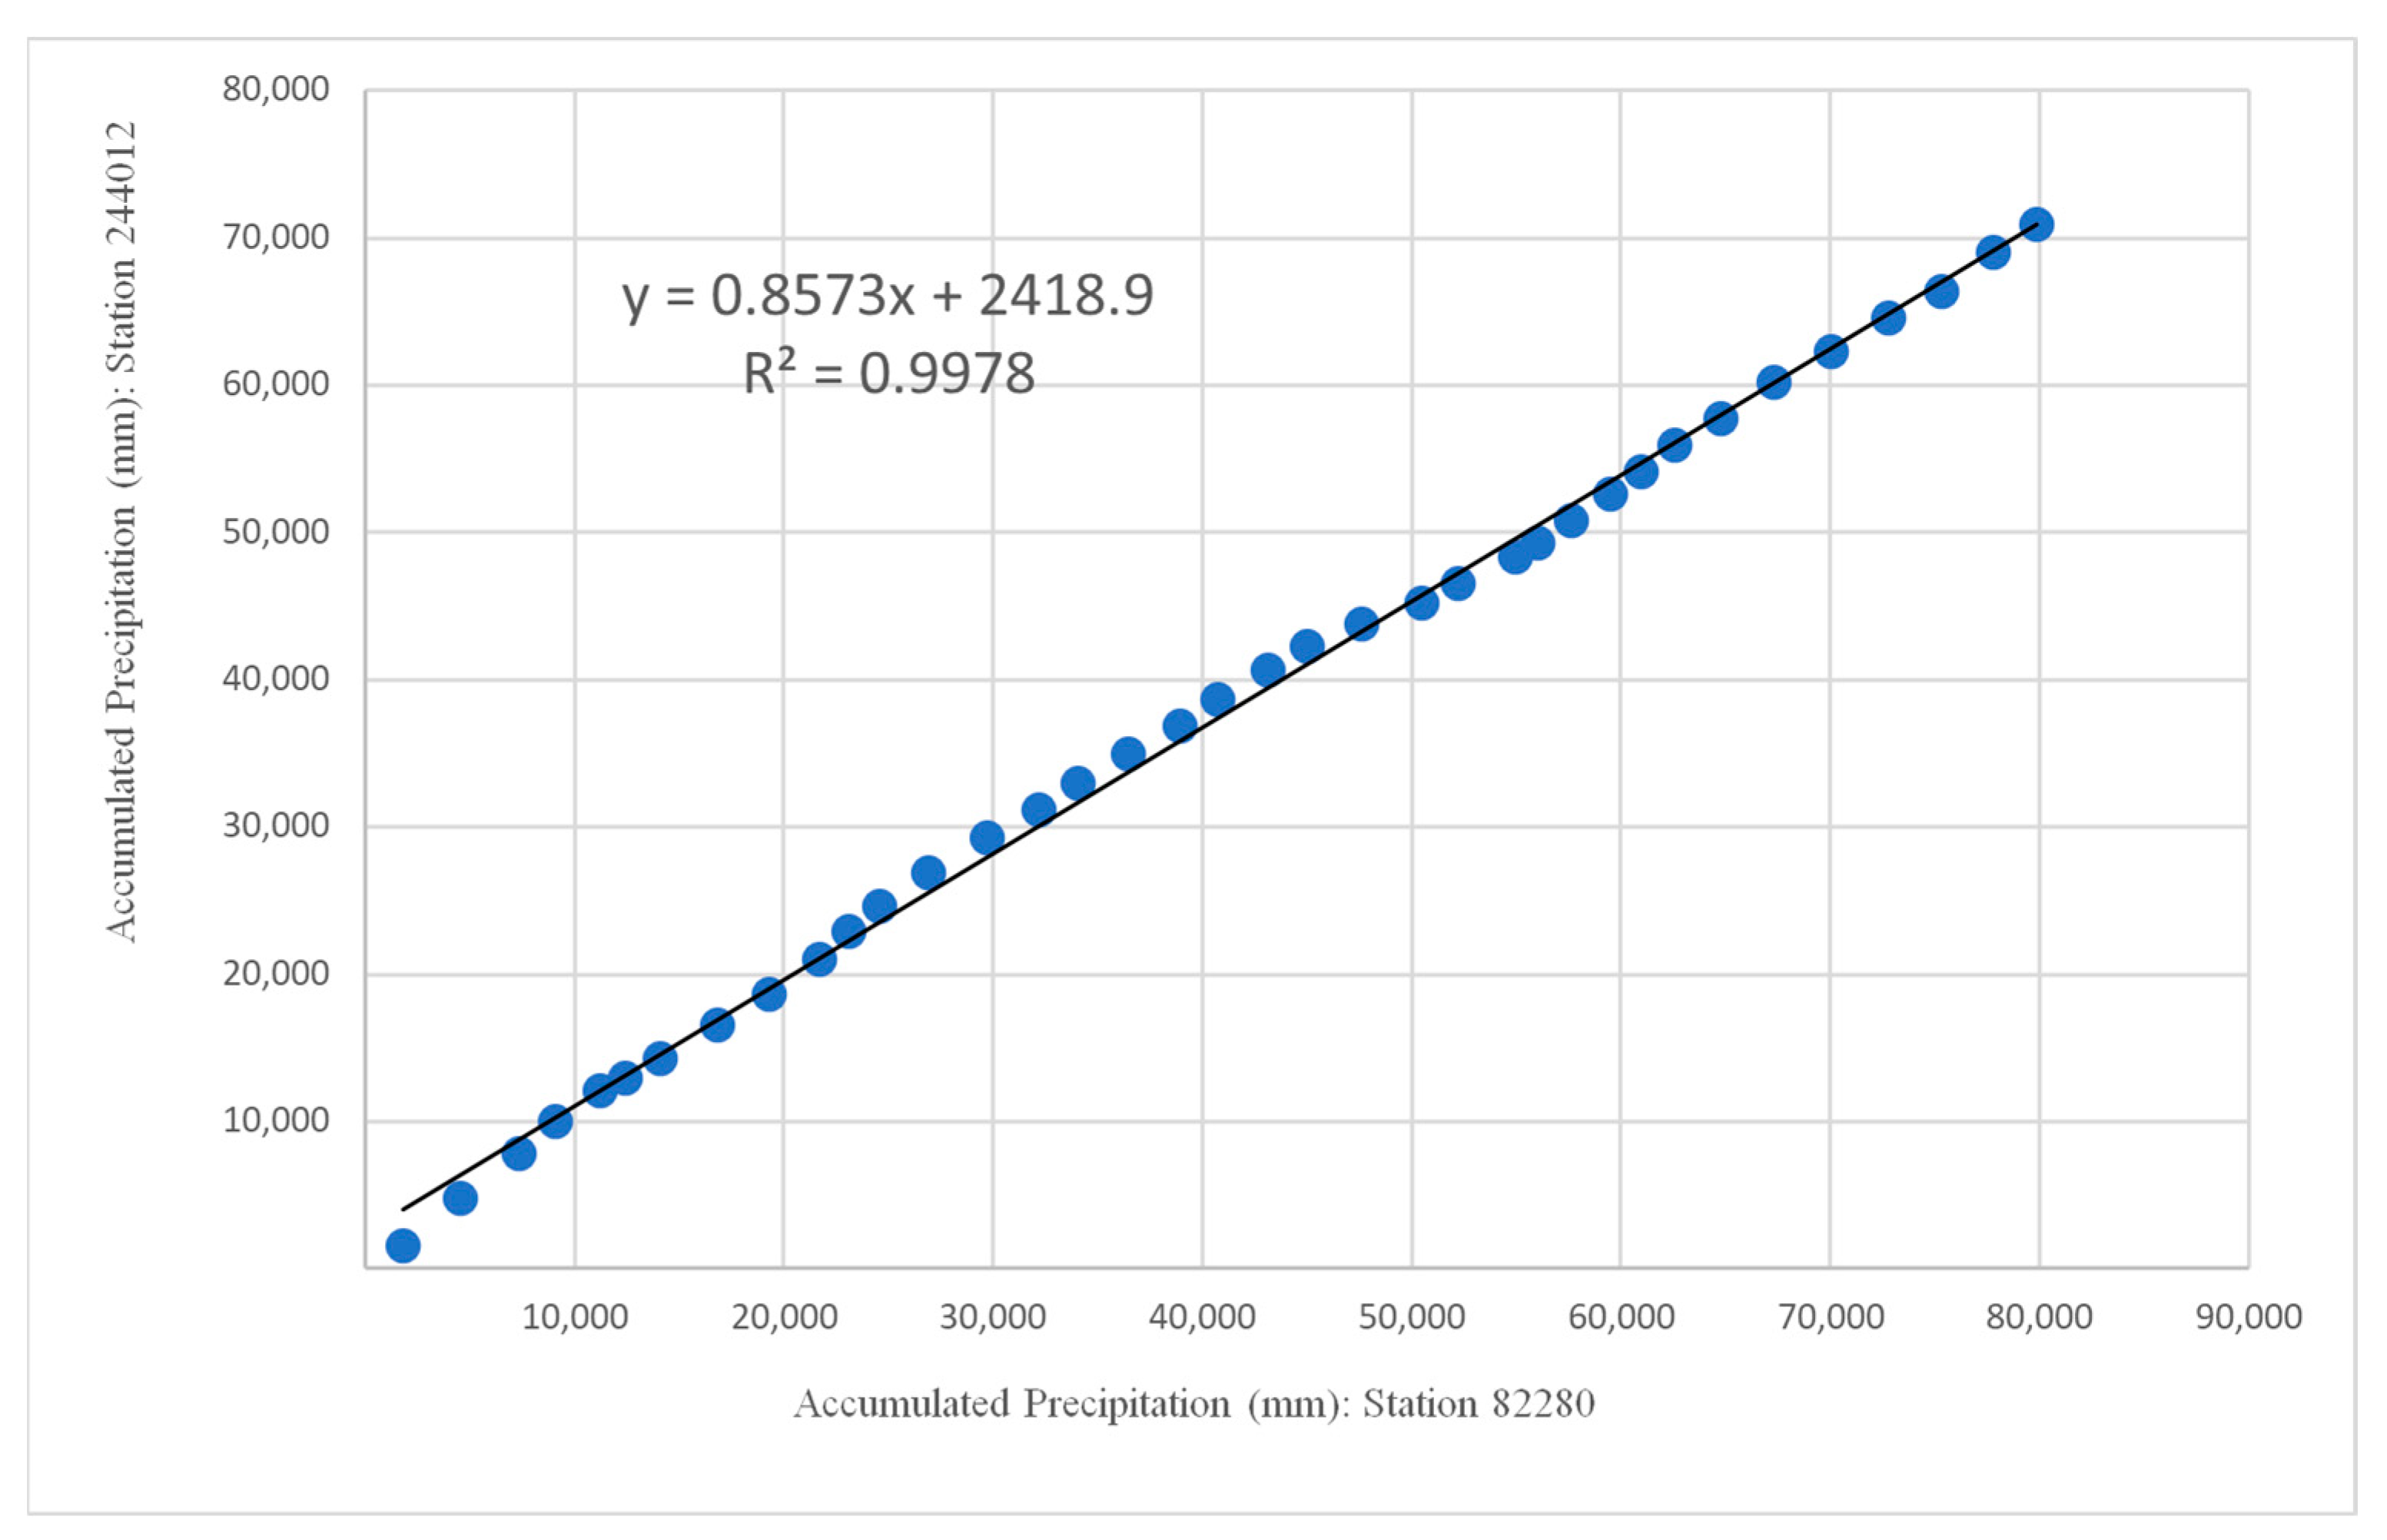
Due to the large number of stations analyzed (100 in total), the results of the Double Mass Curve test used to verify data consistency are presented here only for station 244012, located in the municipality of São Bento and classified within HPR1 (Western Coastal Zone). The reference station used for comparison was 82280 (São Luís), which exhibited a complete, gap-free series within the same pluviometrically homogeneous region.
The results, shown in Figure 4, demonstrate that the rainfall data from station 244012 are proportional to those of the reference station, thereby confirming their statistical consistency. This finding also reinforces the effectiveness of the gap-filling procedure, as the reconstructed values align with the linear trend of the reference series.
The behavior of the data illustrated in Figure 4 (scatterplot) highlights the effectiveness of the Regional Weighting Method. To further support this finding, the coefficient of determination (R2) was calculated from the correlation function, yielding values close to 1.0, corresponding to a consistency level greater than 99%. Table 6 presents the regression equations and the respective stations used in the rainfall consistency analysis.
In this study, the highest coefficient of determination (R2 = 0.9998) was observed for stations 444001 (Coroatá) and 543002 (Parnarama—Lagoa), belonging to HPR3 and HPR8, respectively. Conversely, the lowest value was found for station 646006 (Fazenda Sempre Viva), located in the municipality of Grajaú and classified within HPR7, with R2 = 0.9782. The linear behavior of the data and the high R2 values, consistently close to 1.0, indicate regional homogeneity and consistency within the historical series, as also reported by [34].
Therefore, based on the procedures performed, the Regional Weighting Method is confirmed to be effective for filling precipitation data gaps in climatological stations across Maranhão and adjacent regions.

3.3. Analysis of the Mann-Kendall Test

The analysis of annual mean rainfall time series, segmented into ten Homogeneous Precipitation Regions (HPRs), reveals patterns characterized by high interannual variability and the absence of statistically significant trends during the 1987–2023 period. Descriptive statistics indicate that annual mean rainfall varies substantially across regions, ranging from 1036.4 mm in HPR9 to 2072.8 mm in HPR1, reflecting the climatic heterogeneity of Maranhão State (Table 7).
The non-parametric Mann–Kendall test, applied to detect monotonic trends in the series, did not indicate the presence of statistically robust trends in any of the HPRs analyzed (p > 0.05). The highest estimate of Kendall’s tau (τ = 0.198) was observed in HPR3, suggesting a weak positive but statistically non-significant trend (p = 0.087). The other regions exhibited τ values ranging from −0.024 to 0.096, supporting the hypothesis of temporal stability in the rainfall series (Table 8).
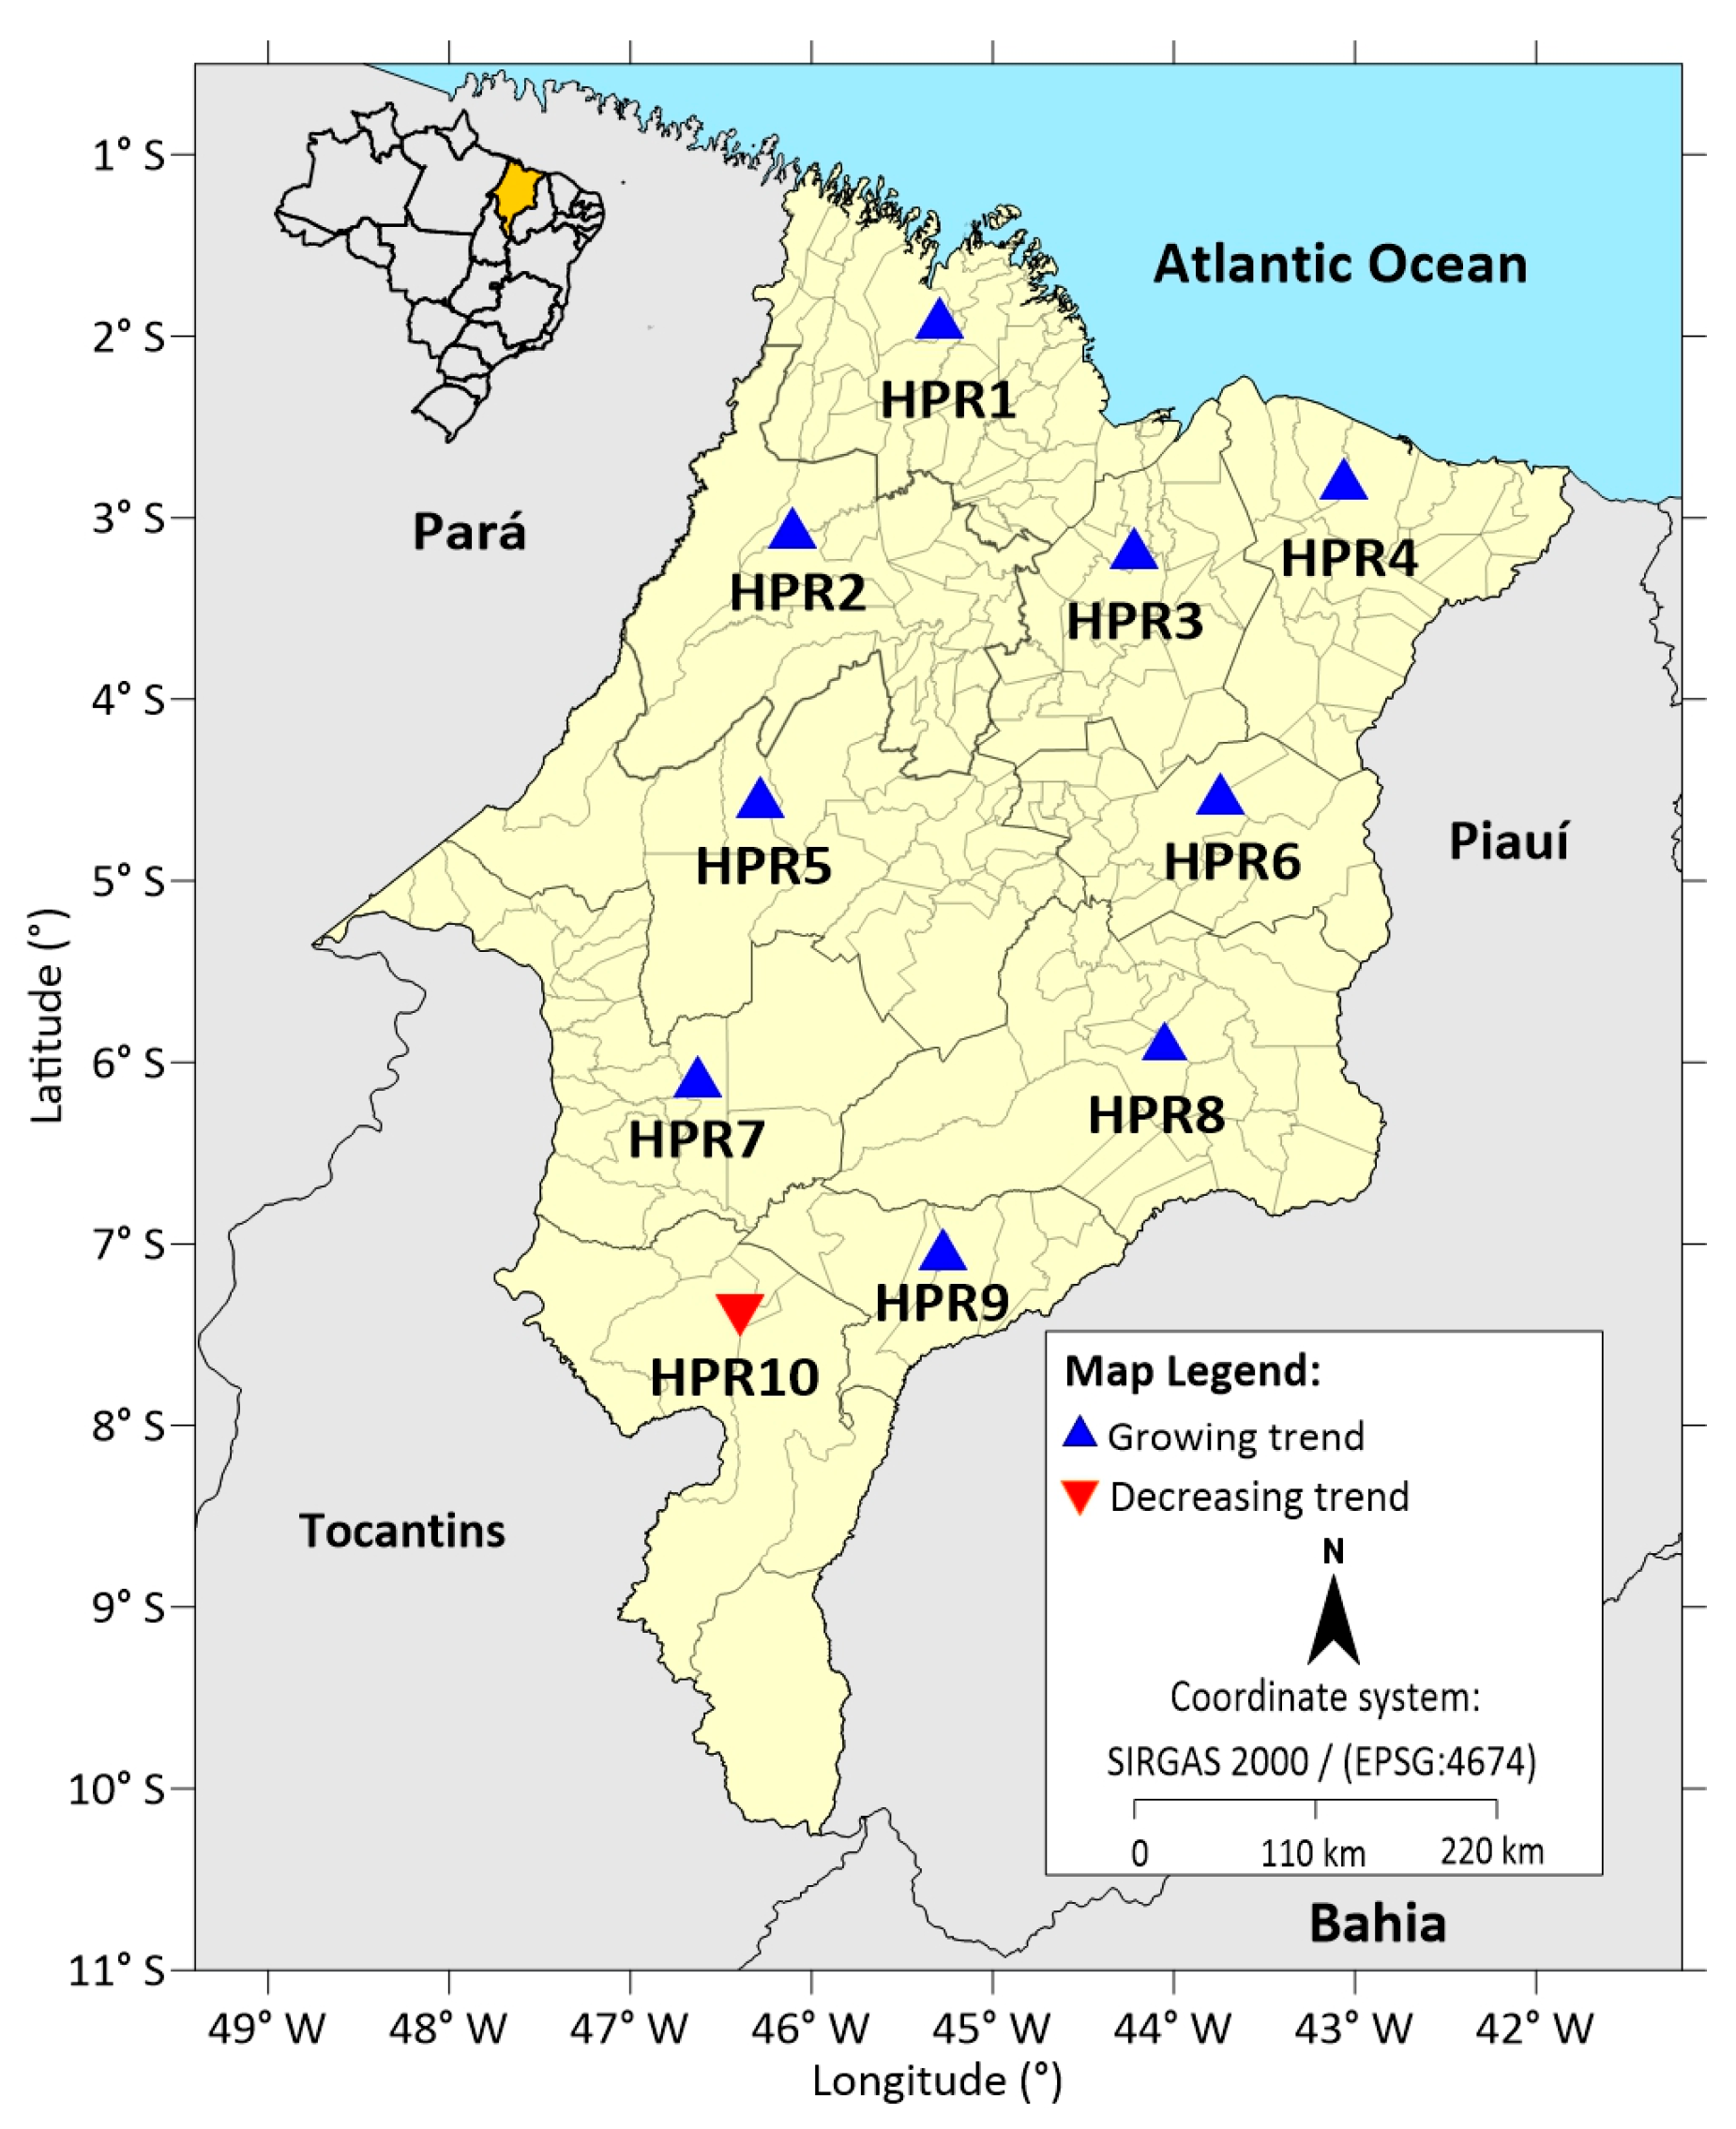
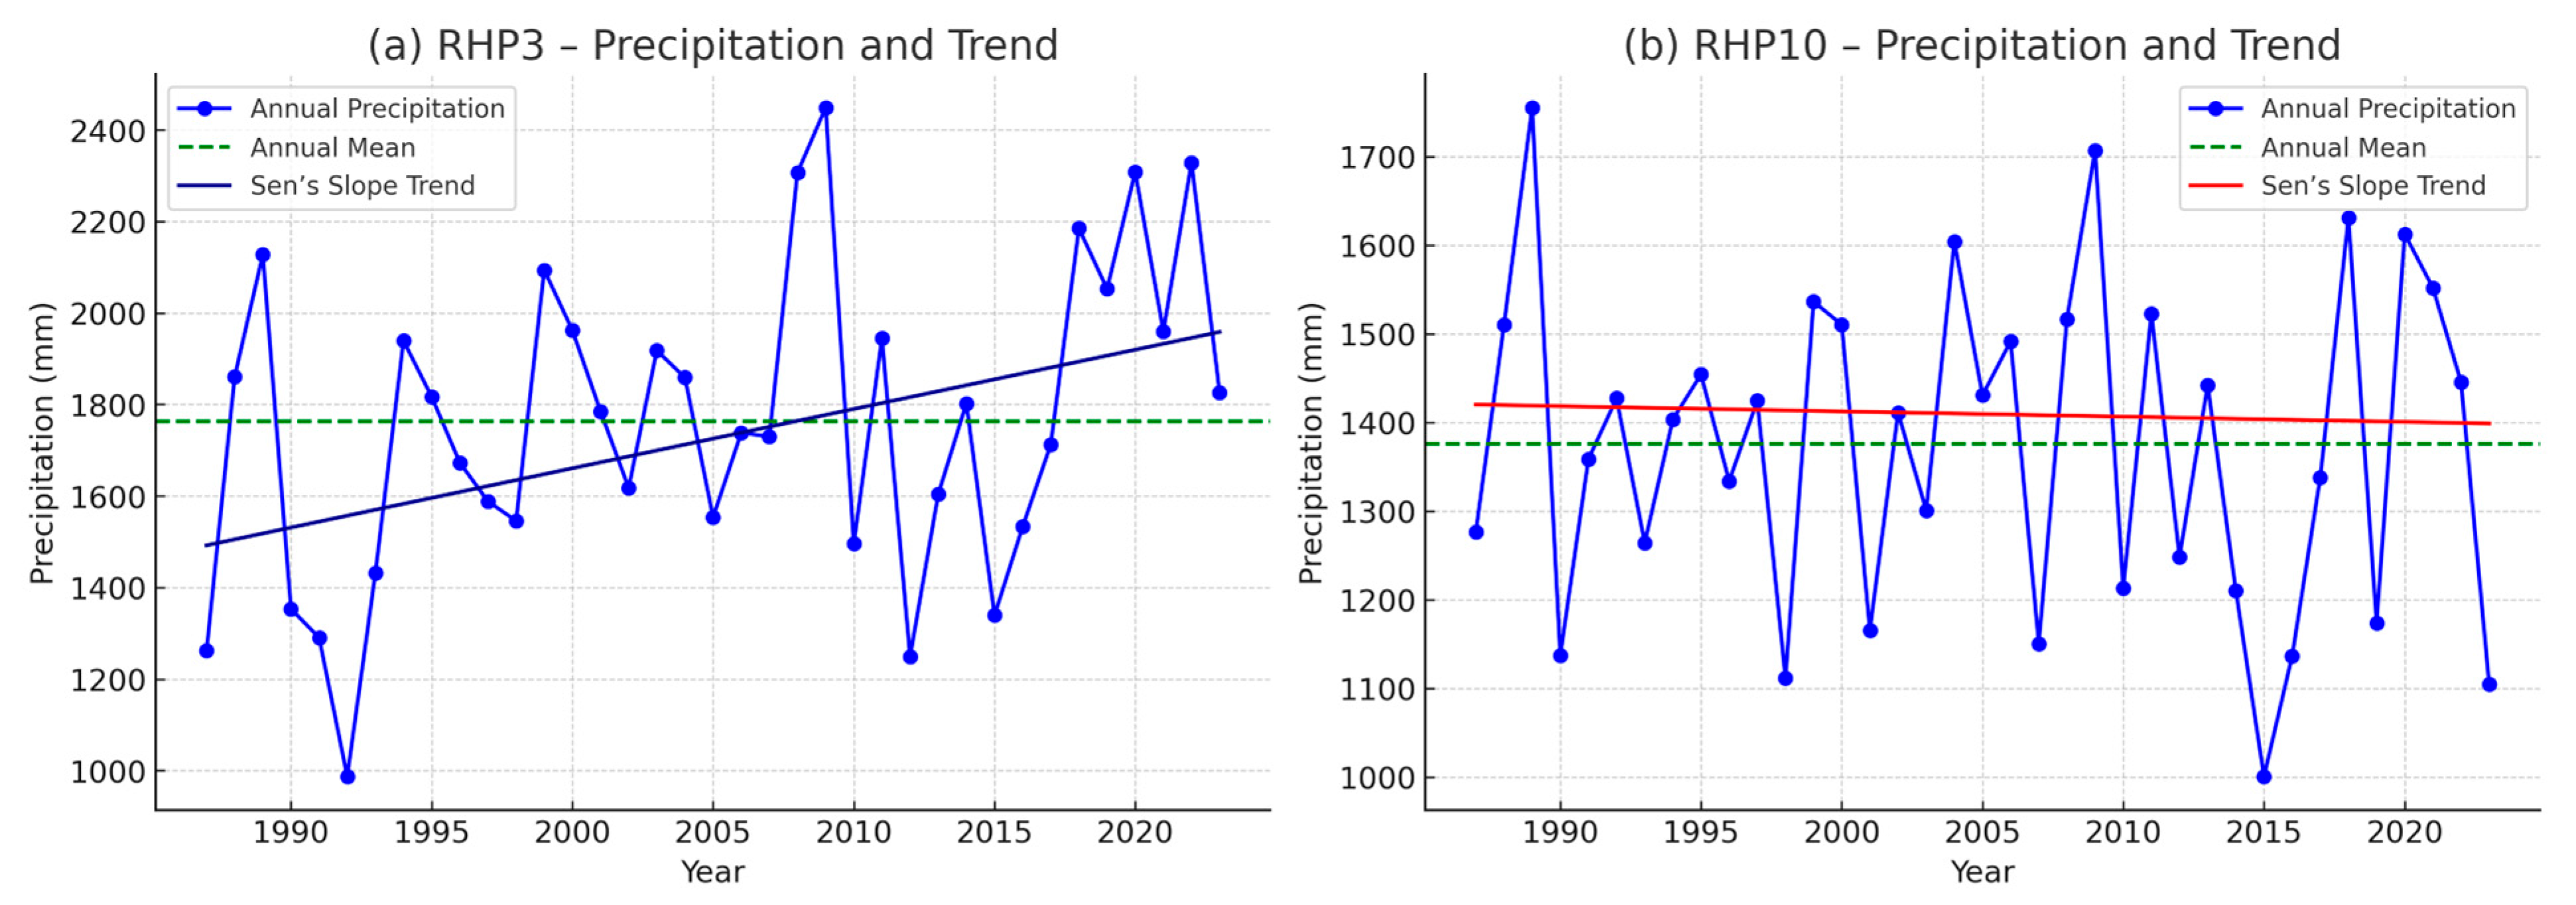
Estimates from Sen’s slope further reinforce this interpretation, showing low magnitudes and confidence intervals that include zero across all HPRs, which implies the absence of significant trends. For instance, the maximum slope was identified in HPR3 (9.981 mm·year−1), while HPR10 exhibited the only negative slope (−0.990 mm·year−1), both of which were without statistical significance.
These results are consistent with the literature, which highlights high interannual and intra-annual climate variability as a factor that hinders the detection of long-term rainfall trends in tropical regions [35,36,37]. The influence of large-scale atmospheric forcings, such as the El Niño–Southern Oscillation (ENSO), the Pacific Decadal Oscillation (PDO), and the North Atlantic Oscillation (NAO), contributes to the modulation of rainfall regimes, often masking potential signals of long-term climate change.
The spatial distribution of Sen’s slope trends across the ten Homogeneous Precipitation Regions (HPRs) reveals a predominantly positive pattern over Maranhão. Most regions (HPR1–HPR9) exhibit upward-pointing symbols, indicating increasing precipitation trends of varying magnitudes, particularly in the northern and central sectors of the state. These growing trends are concentrated from the coastal belt (HPR1–HPR4) toward the central plateau (HPR5–HPR7), suggesting a broad regional tendency toward gradual rainfall intensification. In contrast, only HPR10, located in the southernmost portion of Maranhão along the border with Tocantins, displays a downward-pointing symbol, reflecting a decreasing precipitation trend. This isolated negative signal emphasizes a north–south contrast in rainfall behavior, with the southern Cerrado-transition zone emerging as the only area where annual precipitation may be declining Figure 5.
The analysis of the ten Homogeneous Precipitation Regions (HPRs) reveals a pronounced spatial heterogeneity in rainfall distribution. HPR1 stands out as the wettest region, with an annual mean of 2072.8 mm, followed by HPR2 and HPR3, which also exhibit high totals (above 1760 mm) and greater variability in HPR3.
The central regions (HPR4 to HPR7) present intermediate values, with annual means ranging from 1280 to 1482 mm, reflecting the transition between the wetter northern sector and the drier interior.
In contrast, HPR8 and HPR9 exhibit the lowest annual means (between 1191.5 and 1036.4 mm).
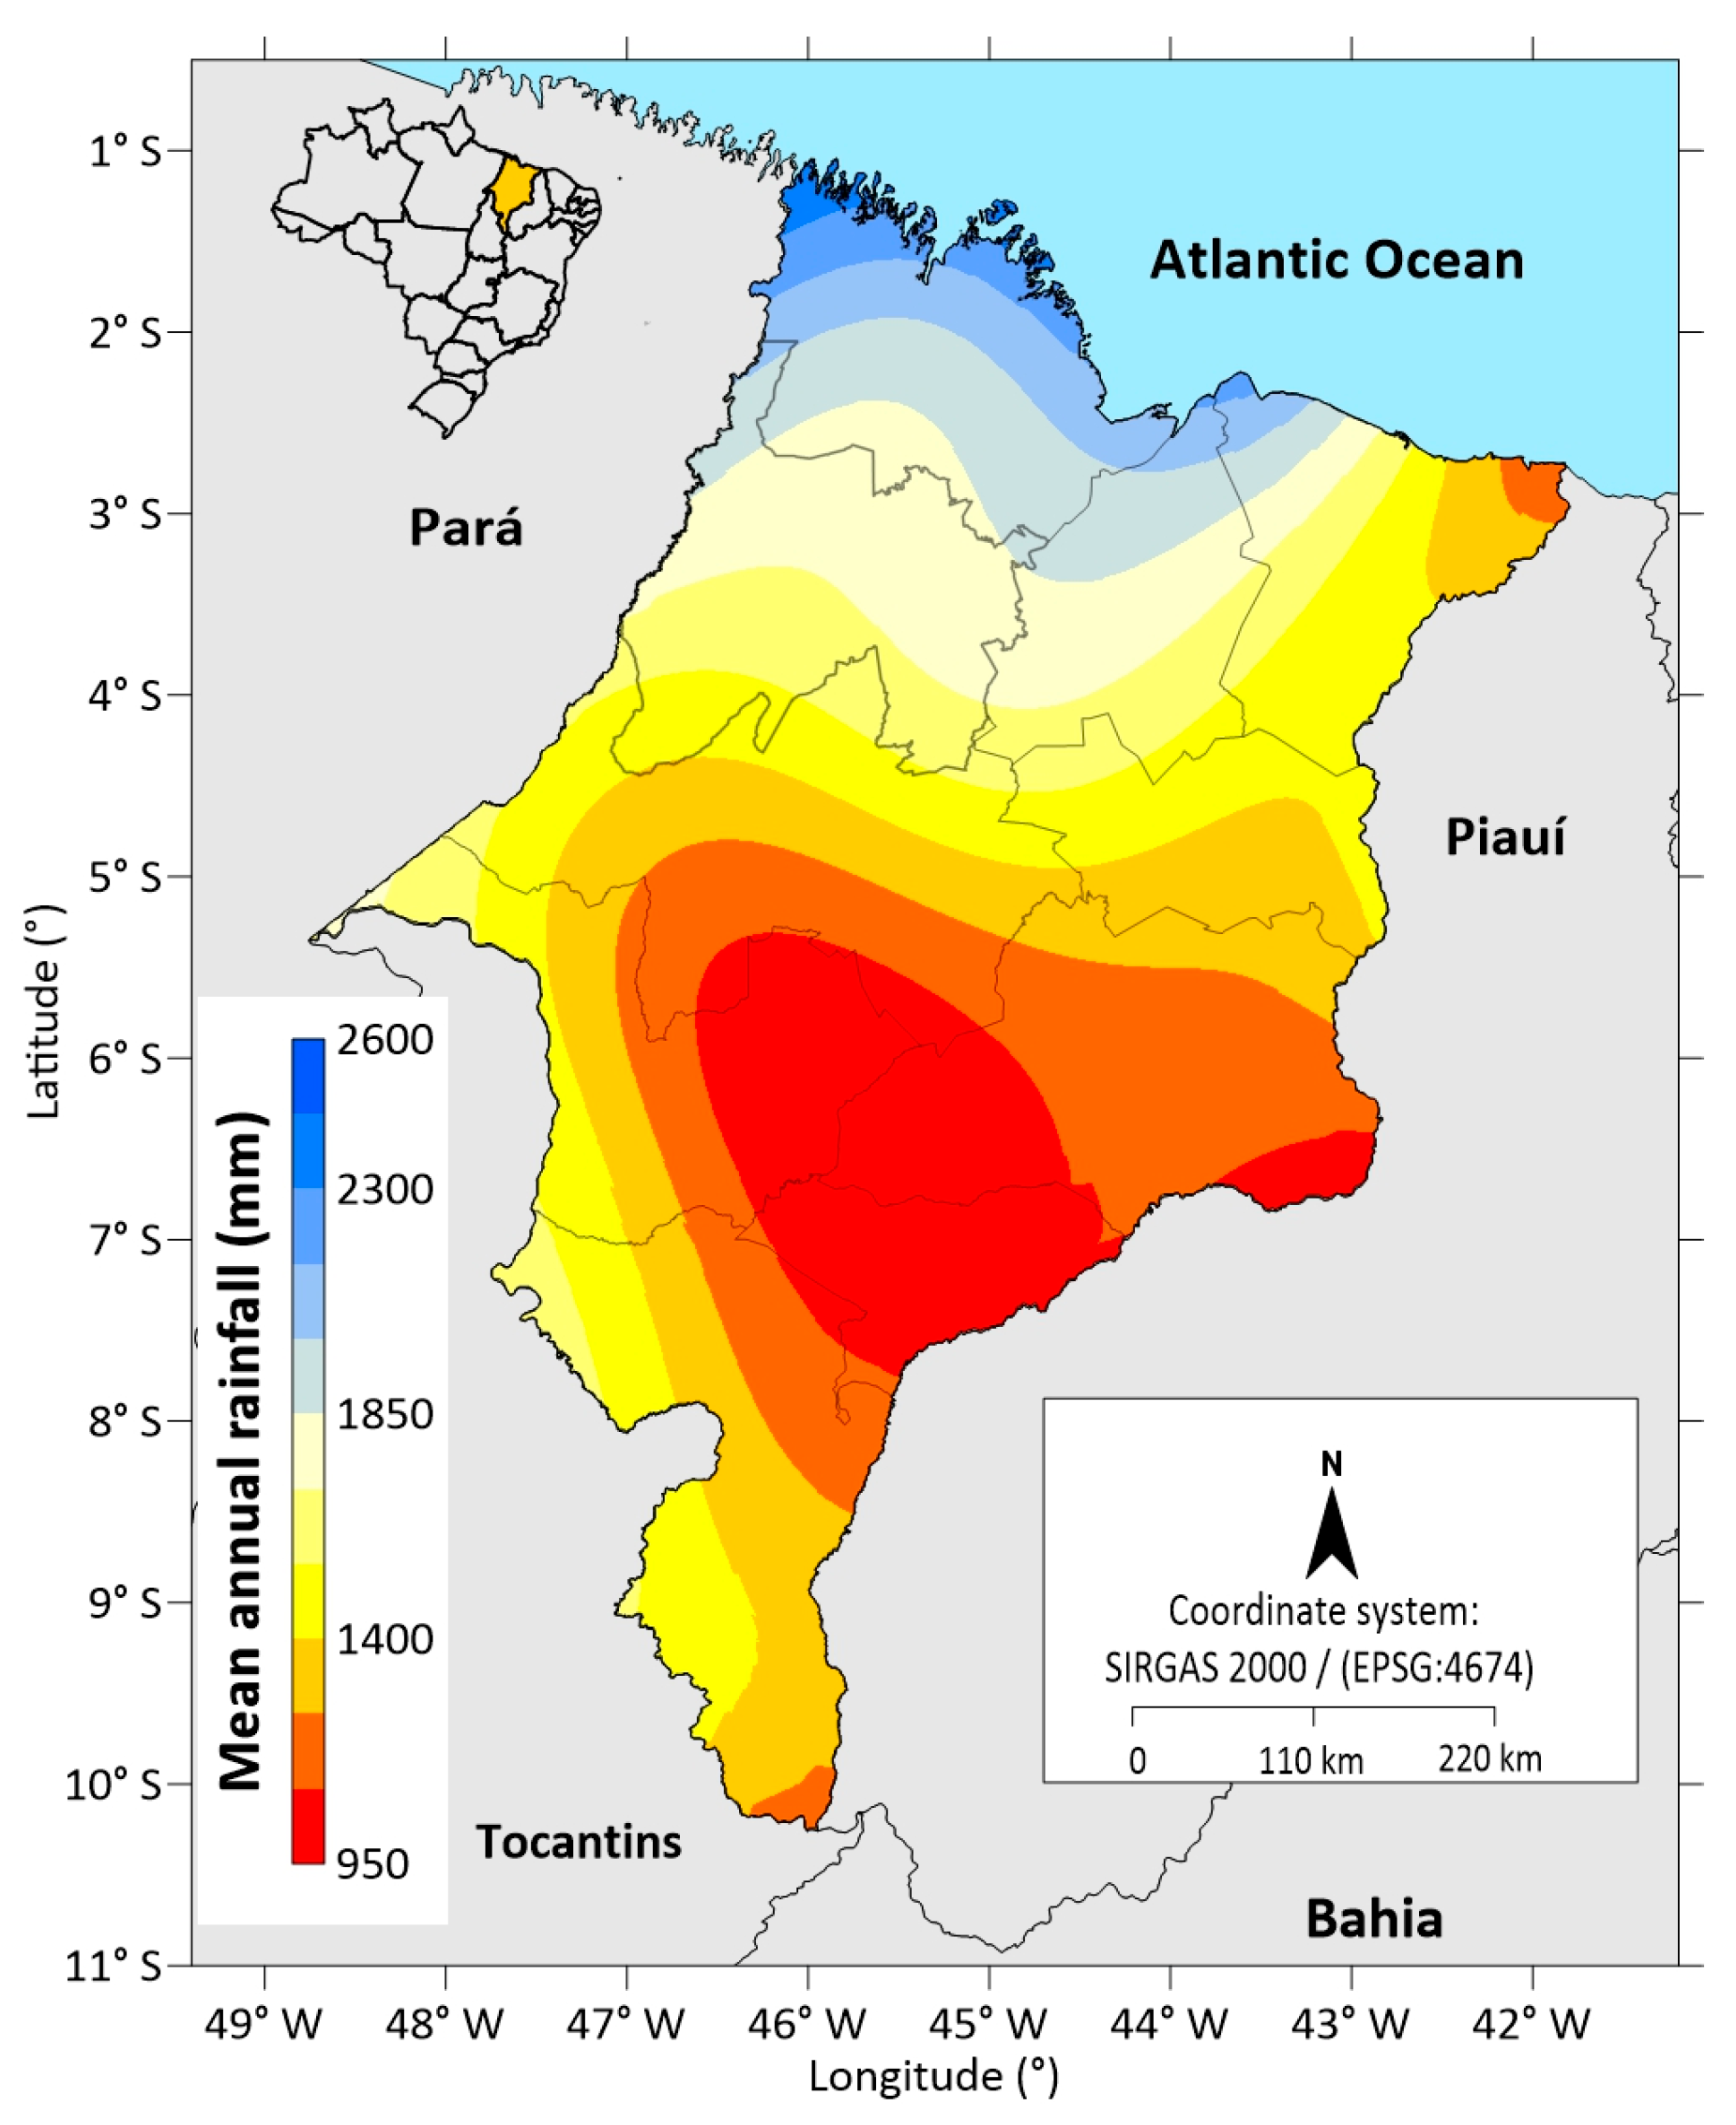
Overall, a decreasing north–south precipitation gradient is observed, associated with the weakening of maritime influences and the increasing continentality across the state of Maranhão (Figure 6).

3.4. Temporal Trends Analysis (Sen’s Slope Method)

The analysis of temporal trends in the annual precipitation series, using Sen’s Slope Estimator, enabled the quantification of rates of change over the period 1987–2023 across the ten Homogeneous Precipitation Regions (HPRs). Overall, nine of the ten regions exhibited positive slopes, indicating a slight increase in annual rainfall totals over the past decades. The exception was HPR10, which showed a negative slope of approximately −0.99 mm·year−1, suggesting a potential reduction in annual precipitation in this region.
The highest rates of increase were observed in HPR3 (+9.98 mm·year−1), followed by HPR6 (+3.70 mm·year−1) and HPR7 (+3.26 mm·year−1), indicating that these areas experienced more pronounced increments in annual rainfall. In contrast, HPR1, HPR2, HPR4, HPR5, HPR8, and HPR9 exhibited positive but low-magnitude slopes, ranging from +1.46 to +2.86 mm·year−1. These results suggest relative climatic stability in these regions, although small positive trends may, over time, lead to meaningful changes in the regional hydrological balance.
The behavior observed in HPR10 is particularly noteworthy, as it contrasts with the other regions and indicates a potential downward trend in water availability. This pattern may be associated with climate variability, land-use and land-cover changes, or the influence of large-scale atmospheric systems that modulate regional precipitation. Figure 7a,b illustrates the contrasting slopes of HPR3 and HPR10, highlighting through the zero-reference line which regions exhibit positive and negative tendencies. These findings reinforce the importance of continuous climate monitoring and the integration of such information into water-resources management policies, particularly in the context of increasing climate variability and environmental change.
The absence of statistically significant trends should not be interpreted as evidence of climatic invariability. Rather, it reflects the limitations imposed by the temporal extent of the series and the high natural variability of the regional climate system. Thus, the results of this study contribute to a deeper understanding of regional rainfall dynamics and highlight the need for ongoing assessments incorporating statistical models for structural break detection and analyses based on projected climate scenarios, in order to better understand the potential trajectories of variability and climate change across the HPRs examined.

4. Discussion

Rainfall distribution in Maranhão results from the combined influence of tropical atmospheric systems and strong environmental gradients, ranging from the Amazon–Atlantic coastal zone in the north to the Cerrado highlands in the south. Factors such as maritime influence, continentality, topography, and vegetation cover intensify this heterogeneity. Recent studies show a greater recurrence of rainfall in the northern sector, associated with the ITCZ and the influx of Atlantic moisture [38,39,40], whereas the southern region exhibits greater susceptibility to drought due to its more continental character and marked interannual variability [41]. Current research also indicates that Maranhão is part of a dynamic ecotone between the Amazon and Cerrado biomes, where latitudinal gradients and environmental changes reinforce contrasts in the rainfall regime [42].
The results of this study highlight the importance of consolidating consistent historical time series for hydrometeorological analyses in Maranhão. The application of the Regional Weighting Method proved effective for gap-filling, preserving statistical coherence and yielding high coefficients of determination (R2 > 0.97). This performance is comparable to that reported for other regions of Brazil [11,33], reinforcing the applicability of this method in tropical environments characterized by high rainfall variability.
The consistency assessment using the Double Mass Curve method further validated the robustness of the adjusted data, minimizing the risk of bias in the interpretation of precipitation trends. This procedure is particularly relevant in areas with systematic observation gaps, such as Maranhão, where the density of the rainfall network remains below the standards recommended by the World Meteorological Organization (WMO).
The Mann–Kendall statistical test and Sen’s Slope Estimator did not reveal significant long-term trends for the state as a whole, corroborating previous studies that point to strong interannual variability modulated by large-scale climate teleconnections such as the El Niño–Southern Oscillation (ENSO), the Pacific Decadal Oscillation (PDO), and the North Atlantic Oscillation (NAO) [35,36,37].
However, the behavior observed in HPR10, which exhibited a negative slope (−0.99 mm·year−1), suggests a potential signal of reduced water availability, warranting further investigation with higher spatial and temporal detail, including the integration of land-use and land-cover data.
Conversely, the positive slopes observed in HPR3 (+9.98 mm·year−1) and HPR6 (+3.70 mm·year−1) indicate that local climate variability may mask long-term tendencies, reinforcing the need for longer time series, structural break detection analyses, and integration with regional climate modeling.
In addition, the pronounced spatial heterogeneity in annual rainfall ranging from 1027 mm (HPR9) to more than 2047 mm (HPR1), highlights the importance of rainfall regionalization as a fundamental criterion in hydrometeorological studies in Maranhão.
The contrast between HPR3 and HPR10 underscores the spatial heterogeneity of rainfall trends across the state. The positive slope in HPR3 (+9.98 mm·year−1) suggests a gradual increase in rainfall, possibly influenced by the higher frequency of regional convective systems. In contrast, the negative trend in HPR10 (−0.99 mm·year−1) points to a potential decline in water availability, consistent with the region’s greater sensitivity to dry spells and land-use change. These findings show that different HPRs respond unevenly to dominant climatic mechanisms, requiring more detailed spatial analyses and integration with land-cover information to clarify the persistence and impacts of such trends.
Rainfall seasonality in Maranhão exhibits strong regional contrasts. In the south, the rainy season occurs mainly between October and April under the influence of the South Atlantic Convergence Zone (SACZ), responsible for organizing summertime convection in central Brazil [43]. In the north, rainfall begins between December and January and extends until July, dominated by the seasonal migration of the ITCZ, which controls peak rainfall between February and May along the Amazon coastal belt.
This configuration is modulated by transient systems such as Upper Tropospheric Cyclonic Vortices (UTCVs), which play an important role in the pre-rainy season by enhancing or inhibiting convection [44], and Easterly Wave Disturbances (EWDs), which contribute to late-season rainfall between May and July [45]. The irregular activity of these systems may delay the onset of the rainy season in the north or compromise its regularity in the south, favoring dry spells with direct impacts on rainfed agriculture.
Thus, this study not only provides a consolidated rainfall database for Maranhão but also presents a set of methodological procedures that can be replicated in other tropical regions with similar observational limitations. The results indicate that potential signals of regional climate change are likely to emerge in a spatially heterogeneous manner, reinforcing the need for continuous monitoring and more robust complementary analyses, including structural break tests, multiscale approaches, and regional climate modeling.

5. Conclusions

This study developed and validated the first consistent, observation-based rainfall database for the state of Maranhão, covering 37 years of observations (1987–2023) from 100 ANA and INMET stations. The integrated application of the Regional Weighting Method and the Double Mass Curve proved highly effective, resulting in reconstructed series with coefficients of determination exceeding 0.97, a performance comparable to that reported in recent hydrometeorological imputation studies in Brazil and abroad [10,16].
The analysis of the Homogeneous Precipitation Regions revealed pronounced spatial heterogeneity, with maximum rainfall concentrated in the northern sector (HPR1–HPR3) and lower values in the central–southern regions (HPR8–HPR10). This pattern is consistent with previous findings that characterize Maranhão as a climatic ecotone between the Amazon and Cerrado biomes. Although statistically significant trends were not detected for the study period, small positive slopes (HPR3, HPR6) and a negative slope in HPR10 suggest the potential emergence of regional climate-change signals, in line with recent discussions on hydroclimatic variability in Northeast and Central Brazil.
The consolidated rainfall database represents a substantial advancement, enabling more robust climatological analyses in a region historically affected by observational gaps and limited station coverage. Its use is strategic for applications in drought monitoring, environmental impact assessments, agricultural planning, and climate-adaptation policy design, as highlighted by recent studies on water-resources management in tropical regions.
Future research should integrate this database with complementary analyses involving climate and drought indices, particularly the Standardized Precipitation Index (SPI) and the Standardized Precipitation Evapotranspiration Index (SPEI). These indices have become essential tools for identifying water deficits across multiple temporal scales, allowing the characterization of short-term meteorological droughts as well as longer-term hydrological and agricultural processes. In the Brazilian context, recent studies underscore the usefulness of these indices for detecting climate anomalies, supporting operational monitoring, and evaluating impacts on ecosystems and productive sectors. Applying these indicators to the database consolidated here may reveal multiscale variability patterns and contribute to more sensitive diagnostics of drought dynamics in Maranhão.

Supplementary Materials

The following supporting information can be downloaded at https://www.mdpi.com/article/10.3390/cli14030063/s1. Table S1: Number of months with missing data in Region 1; Table S2: Number of months with missing data in Region 2; Table S3: Number of months with missing data in Region 3; Table S4: Number of months with missing data in Region 4; Table S5: Number of months with missing data in Region 5; Table S6: Number of months with missing data in Region 6; Table S7: Number of months with missing data in Region 7; Table S8: Number of months with missing data in Region 8; Table S9: Number of months with missing data in Region 9; Table S10: Number of months with missing data in Region 10.

Author Contributions

Conceptualization, G.d.A.R. and R.H.N.d.M.; Methodology and Formal Analysis, G.d.A.R. and C.W.S.D.; Data Curation, G.d.A.R. and C.W.S.D.; Writing—Original Draft Preparation, G.d.A.R.; Writing—Review and Editing, G.d.A.R., R.H.N.d.M., F.P.C. and C.H.L.S.-J.; Supervision, C.H.L.S.-J. All authors have read and agreed to the published version of the manuscript.

Funding

This research was financed in part by the Coordination for the Improvement of Higher Education Personnel–Brazil (CAPES), Finance Code 001. C.H.L.S.-J. was supported by the National Council for Scientific and Technological Development (CNPq; Processes 304664/2024-3, 400634/2024-4, and 401741/2023-0).

Data Availability Statement

The rainfall data used in this study are publicly available from the National Water and Sanitation Agency (ANA; https://www.snirh.gov.br/hidroweb, accessed on 18 December 2025.) and the National Institute of Meteorology (INMET; https://bdmep.inmet.gov.br). The processed datasets generated and analyzed during this study are available in the Zenodo repository (https://doi.org/10.5281/zenodo.17370721).

Acknowledgments

The authors thank the State and Federal Universities of Maranhão for their institutional support. Special thanks are due to the National Water and Sanitation Agency (ANA) and the National Institute of Meteorology (INMET) for providing the rainfall datasets used in this study. The authors also acknowledge the Maranhão Research Foundation (FAPEMA) and the Coordination for the Improvement of Higher Education Personnel (CAPES) for scholarship support. Institutional support from the BIONORTE Network Graduate Program is also gratefully acknowledged. Finally, the authors thank the editors and anonymous reviewers for their careful evaluation and constructive comments, which significantly improved the quality and clarity of this manuscript.

Conflicts of Interest

The authors declare no conflict of interest.

References

  1. Cunha Junior, R.O.; Firmino, P.R.A. Simulação de valores ausentes em series temporais de precipitação para avaliação de métodos de imputação. Rev. Bras. Climatol. 2022, 30, 691–714. [Google Scholar] [CrossRef]
  2. Xiang, Y.; Chen, J.; Li, L.; Peng, T.; Yin, Z. Evaluation of eight global precipitation datasets in hydrological modeling. Remote Sens. 2021, 13, 2831. [Google Scholar] [CrossRef]
  3. Sarnighausen, V.C.R.; Gomes, F.G.; Dal Pai, A.; Rodrigues, S.A. Estimativa da evapotranspiração de referência para Botucatu-SP por meio de modelos de regressão. Rev. Bras. Climatol. 2021, 28, 766–787. [Google Scholar] [CrossRef]
  4. Mello, Y.R.; Kohls, W.; Oliveira, T.M.N. Uso de diferentes métodos para o preenchimento de falhas em estações pluviométricas. Bol. Geogr. 2017, 35, 112–121. [Google Scholar] [CrossRef]
  5. dos Santos, S.R.Q.; Braga, C.C.; Sansigolo, C.A.; dos Santos, A.P.P. Determinação de regiões homogêneas do índice de precipitação normalizada (SPI) na Amazônia Oriental. Rev. Bras. Meteorol. 2017, 32, 111–122. [Google Scholar] [CrossRef]
  6. Correa, M.J.; Lima, K.C.; Silva, J.M.; Medeiros, G.C. Filling of faults in climatological air temperature series in brazilian state capitals from 1980 to 2017. Rev. Bras. Climatol. 2021, 29, 251–272. [Google Scholar]
  7. Pereira, A.R.B.; Costa, C.T.F.; Firmino, P.R.A.; Studart, T.M.C. Preenchimento de falhas em séries de dados meteorológicos de estações automáticas. Rev. Bras. De Climatol. 2024, 35, 22–44. [Google Scholar] [CrossRef]
  8. Barboza, T.O.C.; Ferraz, M.A.J.; Pilon, C.; Vellidis, G.; Valeriano, T.T.B.; dos Santos, A.F. Advanced farming strategies using NASA POWER data in Peanut-Producing regions without surface meteorological stations. AgriEngineering 2024, 6, 438–454. [Google Scholar] [CrossRef]
  9. Mallick, J.; Talukdar, S.; Alsubih, M.; Salam, R.; Ahmed, M.; Kahia, N.B.; Shamimuzzaman, M. Analysing the trend of rainfall in Asir region of Saudi Arabia using the family of Mann-Kendall tests, innovative trend analysis, and detrended fluctuation analysis. Theor. Appl. Climatol. 2020, 143, 823–841. [Google Scholar] [CrossRef]
  10. Vieira, S.A.; Osório, D.M.M.; Quevedo, D.M.; Adam, K.N.; Pereira, M.A.F. Metodologia de imputação de dados hidrometeorológicos para análise de series históricas—Bacia do rio dos sinos, RS, Brasil. Rev. Bras. Climatol. 2018, 23, 189–204. [Google Scholar]
  11. Ely, D.F.; Limberger, L.; Mangili, F.B.; Gamero, P.; Schmengler, M. Análise de métodos para o preenchimento de falhas aplicados em series de dados pluviométricos do estado do Paraná (Brasil). Raega—O Espaço Geográfico Análise 2021, 51, 122–142. [Google Scholar] [CrossRef]
  12. Kratzert, F.; Klotz, D.; Brenner, C.; Schulz, K.; Herrnegger, M. Rainfall—Runoff modelling using long short-term memory (LSTM) networks. Hydrol. Earth Syst. Sci. 2018, 22, 6005–6022. [Google Scholar] [CrossRef]
  13. Slater, L.J.; Arnal, L.; Boucher, M.A.; Chang, A.Y.; Moulds, S.; Murphy, C.; Nearing, G.; Shalev, G.; Shen, C.; Speight, L.; et al. Hybrid forecasting: Blending climate predictions with AI models. Hydrol. Earth Syst. Sci. 2023, 27, 1865–1889. [Google Scholar] [CrossRef]
  14. Wang, J.; Chen, J.; Shen, P.; Guan, X.; Liu, X.; Massari, C.; Wang, Z.; Feng, M.; Wang, Q.; Lu, Y.; et al. Regional-scale intelligent optimization and topography impact in restoring global precipitation data gaps. Commun. Earth Environ. 2025, 6, 671. [Google Scholar] [CrossRef]
  15. Farias, C.; Miranda, R.; Viana, J.; Lins, F.; Pereira, J.A.; Ursulino, B.; Srinivasan, R. Calibration of SWAT Model in the Pernambuco state watersheds to support the SUPer system. Rev. Bras. Geogr. Física 2023, 16, 3572–3592. [Google Scholar] [CrossRef]
  16. Duarte, L.V.; Formiga, K.T.M.; Costa, V.A.F. Comparison of Methods for Filling Daily and Monthly Rainfall Missing Data: Statistical Models or Imputation of Satellite Retrievals? Water 2022, 14, 3144. [Google Scholar] [CrossRef]
  17. Silva, J.F.; Reis, J.V.; Santos, T.O.; Ferreira, H.S.; Leitão, M.M.V.B.R.; Galvíncio, J.D.; Candeias, A.L.B. Ação automáticos GEE-SEBAL e do sistema de unidades de resposta hidrológica para Pernambuco (SUPer) para regiões hídricas de Serra Talhada no estado de Pernambuco. Geogr. Ens. Pesqui. 2022, 26, e33. [Google Scholar] [CrossRef]
  18. Silveira, N.; Tibúrcio, I.; Soares, G.; Galvíncio, J.; Santos, D.; Montenegro, S. Temporal Analysis of Water Quality for the Nilo Coelho Reservoir, Terra Nova, Pernambuco, Brazil. Water 2023, 15, 2899. [Google Scholar] [CrossRef]
  19. Tibúrcio, I.M.; Silveira, N.T.; Dos Santos, T.O.; Miranda, R.Q.; Galvíncio, J.D. Balanço hídrico e mudanças climáticas no semiárido pernambucano: Aplicabilidade do sistema de unidades de respostas hidrológicas para Pernambuco (SUPer). Rev. Bras. Geogr. Fís. 2023, 16, 1657–1670. [Google Scholar] [CrossRef]
  20. Silveira, N.T.; Soares, G.A.S.; Bandim, C.G.A.; Santana, S.H.C.; Galvíncio, J.D. Influence of Climate Change on Water Quality in Terra Nova River Basin, Pernambuco, Brazil. Sci. Plena 2024, 20, 099901. [Google Scholar] [CrossRef]
  21. Vasco, G.; Miranda, R.Q.; Viana, J.F.S.; Bressiani, D.; Mendiondo, E.M.; Silva, R.M.; Galvíncio, J.D.; Silva, S.F.; Montenegro, S.M.G.L. Multi-model ensemble for long-term statistical trend analysis of observed gridded precipitation and temperature data in the São Francisco River Basin, Brazil. Rev. Bras. Recur. Hídricos 2024, 29, e37. [Google Scholar] [CrossRef]
  22. Figueiro, L.S.P.; Santos, L.C. Quality of grid-based meteorological data in Brazil: A study in climatically contrasting regions. Rev. Agrogeoambiental 2025, 17, e20251970. [Google Scholar] [CrossRef]
  23. Monteiro, A.P.; Campos, K.C.; Lemos, J.J.S.; Sousa, E.C.; Lessa, L.C.R. Produção agropecuária e precipitações no estado do Maranhão: Uma análise multivariada a partir dos censos agropecuários de 2006 e 2017. Eco. Reg. 2023, 11, 359–377. [Google Scholar] [CrossRef]
  24. Alves, L.M.; Chadwick, R.; Moise, A.; Brown, J.; Marengo, J.A. Assessment of rainfall variability and future change in Brazil across multiple timescales. Int. J. Climatol. 2020, 41, E1875–E1888. [Google Scholar] [CrossRef]
  25. World Meteorological Organization (WMO). Guidelines on the Calculation of Climate Normals; WMO-No. 1203; WMO: Geneva, Switzerland, 2017. [Google Scholar]
  26. INMET. Climatological Normals of Brazil: 1961–1990; INMET: Brasília, Brazil, 2009. [Google Scholar]
  27. de Menezes, R.H.N. Agroclimatic Characterisation and Analysis of Agricultural Yield in Maranhão State, Brazil. Ph.D. Thesis, Universidade Federal de Campina Grande, Campina Grande, Brazil, 2009. [Google Scholar]
  28. Gomes, E.P.; Blanco, C.J.C.; Pessoa, F.C.L. Regionalization of precipitation with determination of homogeneous regions via fuzzy c-means. Rev. Bras. Recur. Hídricos 2018, 23, e51. [Google Scholar] [CrossRef]
  29. Kaiser, H.F. The application of electronic computers to factor analysis. Educ. Psychol. Meas. 1960, 20, 141–151. [Google Scholar] [CrossRef]
  30. Sen, P.K. Estimates of the regression coe cient based on Kendall’s tau. J. Am. Stat. Assoc. 1968, 63, 1379–1389. [Google Scholar] [CrossRef]
  31. Campos, J.O.; Chaves, H.M.L. Tendências e variabilidades nas series históricas de precipitação mensal e anual no bioma cerrado no período 1977–2010. Rev. Bras. Meteorol. 2020, 35, 157–169. [Google Scholar] [CrossRef]
  32. da Silva, G.R.A.; da Silva, F.S.; Duarte, J.M.; Tavares, A.R.F. Análise de tendências nas series históricas de precipitação e curva de permanência de vazão no município Cachoeira do Piriá, Pará. Res. Soc. Dev. 2021, 10, e38210615850. [Google Scholar] [CrossRef]
  33. Araújo, A.R.; Dutra, R.M.S.; Pereira, U.C.; Nunes, F.G.; Ferreira, M.E. Análise de métodos de preenchimento de falhas em dados pluviométricos para a região de planejamento sudoeste de Mato Grosso, Brasil. Rev. Bras. Geogr. Fís. 2023, 16, 2271–2286. [Google Scholar] [CrossRef]
  34. Mendes, A.T.; Junior, J.C.Z. Caracterização do regime pluviométrico do município de Araguaína—TO. Rev. Bras. Meteorol. 2019, 34, 449–458. [Google Scholar] [CrossRef]
  35. do Carmo, M.V.N.S.; Lima, C.H.R. Caracterização espaço-temporal das secas no nordeste a partir da análise do índice SPI. Rev. Bras. Meteorol. 2020, 35, 233–242. [Google Scholar] [CrossRef]
  36. Rodrigues, B.D.; Coutinho, M.D.L.; Sakamoto, M.S.; Jacinto, L.V. Uma análise sobre as chuvas no Ceará baseada nos eventos de El Niño, La Niña e no dipolo do servain durante a estação chuvosa. Rev. Bras. Climatol. 2021, 28, 507–519. [Google Scholar] [CrossRef]
  37. de Souza Neto, P.F.; da Silva, D.F.; Almeida, H.R.R.C. Análise da variabilidade climática dos oceanos Atlântico e Pacífico. Rev. Bras. Geogr. Fís. 2021, 14, 1861–1879. [Google Scholar] [CrossRef]
  38. Santos, M.R.S.; Vitorino, M.I.; Pereira, L.C.C. Spatiotemporal variation in the precipitation of the Amazon coastal zone: Use of remote sensing and multivariate analysis. Rev. Bras. Climatol. 2019, 25, 35–53. [Google Scholar] [CrossRef]
  39. Assene, F.; Koch-Larrouy, A.; Dadou, I.; Tchilibou, M.; Morvan, G.; Chanut, J.; Costa da Silva, A.; Vantrepotte, V.; Allain, D.; Tran, T.K. Internal tides off the Amazon shelf—Part 1: The importance of the structuring of ocean temperature during two contrasted seasons. Ocean Sci. 2024, 20, 43–67. [Google Scholar] [CrossRef]
  40. Freitas, P.P.; Cirano, M.; Teixeira, C.E.P.; Melres, S.J.R.; Sousa, A.K.C.S.; Gomes, V.J.C.; Guerrero-Martin, C.A.; Koch-Larrouy, A. Spatial and temporal variability of hydrodynamics on the Amazon Continental Shelf: An observational approach. Cont. Shelf Res. 2025, 291, 105491. [Google Scholar] [CrossRef]
  41. Correia Filho, W.L.F.; Oliveira-Junior, J.F.; Santiago, D.B.; Terassi, P.M.B.; Teodoro, P.E.; Gois, G.; Blanco, C.J.C.; Souza, P.H.A.; Costa, M.S.; Gomes, H.B.; et al. Rainfall variability in the Brazilian northeast biomes and their interactions with meteorological systems and ENSO via CHELSA product. Big Earth Data 2019, 3, 315–337. [Google Scholar] [CrossRef]
  42. Marengo, J.A.; Jimenez, J.C.; Espinoza, J.-C.; Cunha, A.P.; Aragão, L.E.O. Increased climate pressure on the agricultural frontier in the Eastern Amazonia–Cerrado transition zone. Sci. Rep. 2022, 12, 457. [Google Scholar] [CrossRef]
  43. Verdan, I. Zona de Convergência do Atlântico Sul: Uma revisão sistemática e de discurso. Rev. Bras. Climatol. 2025, 36, 313–340. [Google Scholar] [CrossRef]
  44. Lyra, M.J.A.; Arraut, J.M. Estudo sinótico e da estrutura vertical de um Vórtice Ciclônico de Altos Níveis ocorrido em Janeiro de 2016. Rev. Bras. Meteorol. 2023, 38, e38230092. [Google Scholar] [CrossRef]
  45. Silva, A.S.; Da Silva, E.M.; Leal-Junior, J.B.V.; Sales, D.C.; Moura, I.J.M.; Alves, J.M.B. Distúrbios Ondulatórios de Leste no Nordeste Brasileiro: Um estudo de caso utilizando modelagem numérica de mesoescala. Rev. Bras. Meteorol. 2021, 36, 637–649. [Google Scholar] [CrossRef]
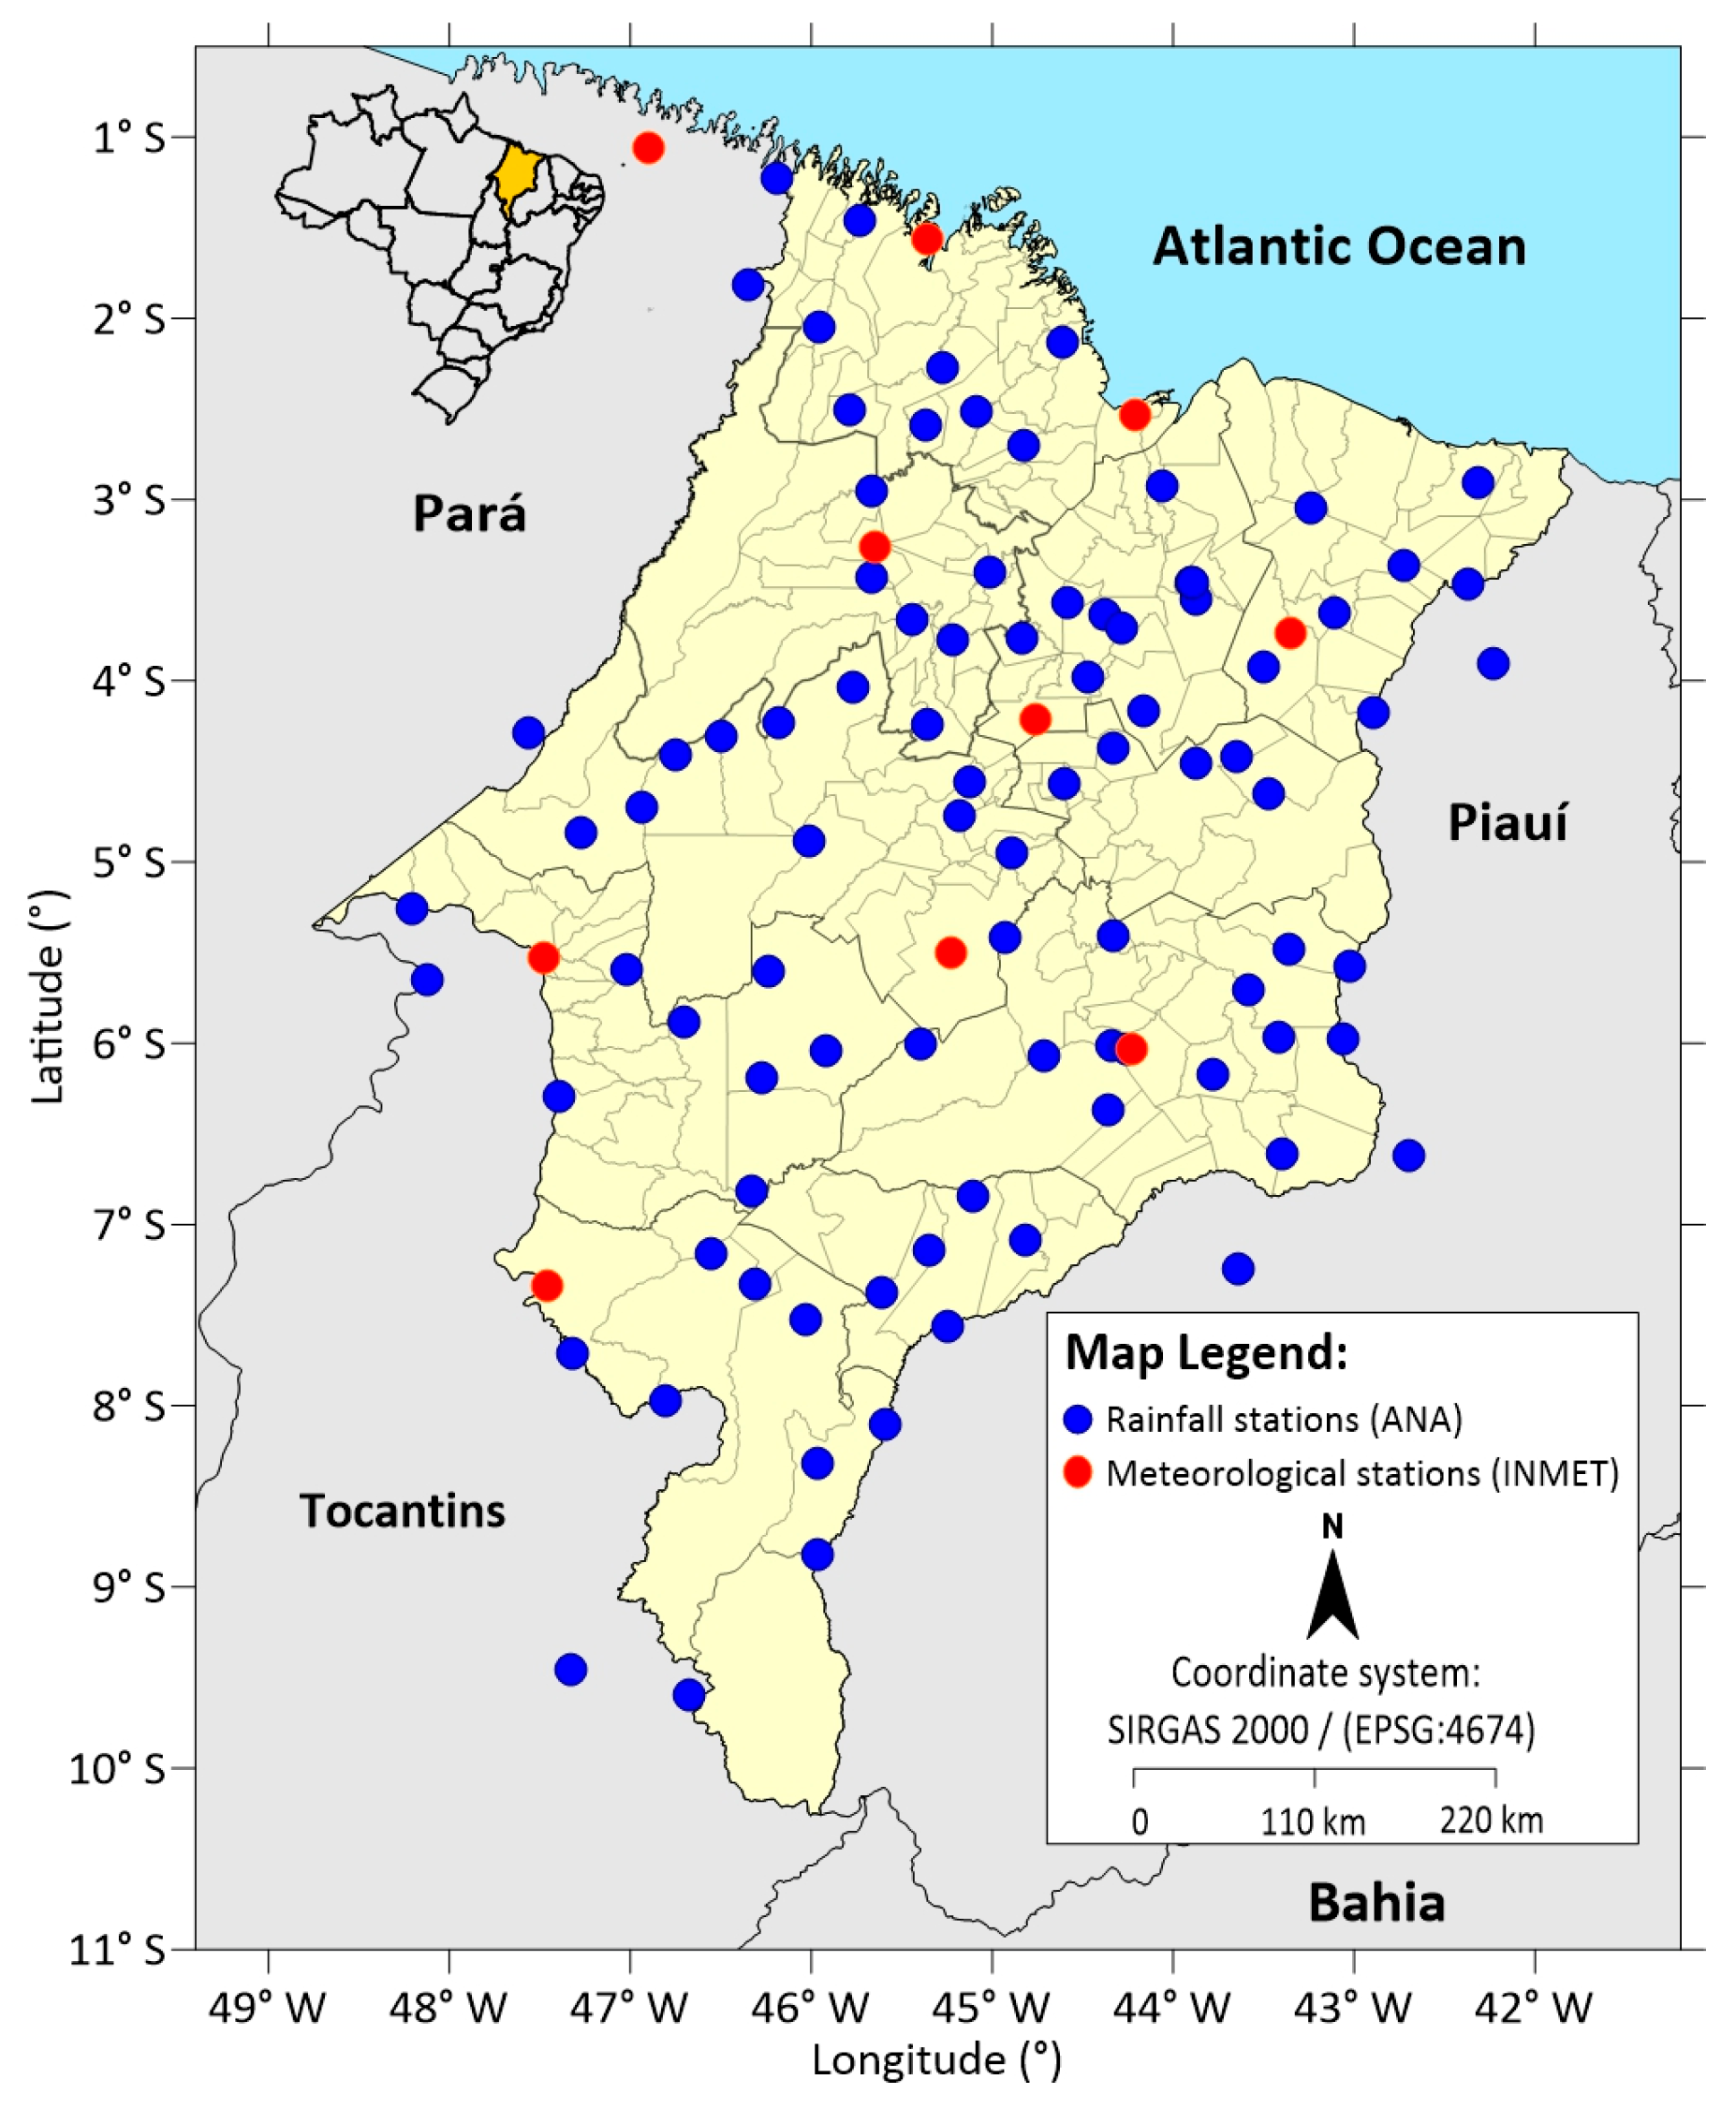
Figure 1. Spatial distribution of rainfall and meteorological stations in Maranhão and neighbouring states.
Climate 14 00063 g001
Figure 2. Flowchart of the methodological steps of the study.
Climate 14 00063 g002
Figure 3. Homogeneous Precipitation Regions (HPRs) in Maranhão State.
Climate 14 00063 g003
Figure 4. Double Mass analysis to verify rainfall data consistency at station 244012, using station 82280 as a reference, both located in HPR1.
Climate 14 00063 g004
Figure 5. Spatial distribution of Sen’s slope trends across the Homogeneous Precipitation Regions (HPRs) in Maranhão State, highlighting areas with increasing (blue) and decreasing (red) precipitation tendencies.
Climate 14 00063 g005
Figure 6. Spatial distribution of mean annual rainfall in Maranhão State during the 1987–2023 period.
Climate 14 00063 g006
Figure 7. Temporal trend analysis of annual rainfall series in HPR3 (a) and HPR10 (b) of Maranhão State, for the period 1987–2023.
Climate 14 00063 g007
Table 1. List of rainfall and climatological stations in the state of Maranhão and neighboring areas used in this study.
AgencyStation CodeMunicipality—State (UF)LongitudeLatitudeAltitudeRecord Length (Years)
National Institute of Meteorology (INMET)82460Bacabal—MA−44.76−4.2125.0737
82571Barra do Corda—MA−45.23−5.50153.0037
82765Carolina—MA−47.46−7.34103.5637
82382Chapadinha—MA−43.35−3.74103.5037
82676Colinas—MA−44.23−6.03179.7537
82564Imperatriz—MA−47.48−5.53123.3037
82280São Luís—MA−44.21−2.5350.8637
82198Turiaçu—MA−45.36−1.5644.0637
82376Zé Doca—MA−45.65−3.2645.2837
82145Tracuateua—PA−46.90−1.0636.0037
National Water and Sanitation Agency (ANA)146009Viseu—PA−46.19−1.23*37
146008Viseu—PA−46.34−1.82*37
447001Dom Eliseu—PA−47.57−4.29*37
548001São Sebastião do Tocantins—TO−48.21−5.2610937
548000Araguatins—TO−48.13−5.6512237
647000Tocantinópolis—TO−47.39−6.2912637
145006Cândido Mendes—MA−45.73−1.46*37
244011Guimaraes—MA−44.61−2.13*37
244012São Bento—MA−44.82−2.703237
245001Monção—MA−45.66−2.95*37
245003Cândido Mendes—MA−45.96−2.051437
245007Turiaçu—MA−45.78−2.50*37
245009Pinheiro—MA−45.37−2.59*37
245010Pinheiro—MA−45.09−2.52*37
245011Santa Helena—MA−45.27−2.27*37
343001Vargem Grande—MA−43.87−3.5515837
343003Nina Rodrigues—MA−43.90−3.4611237
343004Vargem Grande—MA−43.89−3.463937
344004Cantanhede—MA−44.38−3.633137
344007Pirapemas—MA−44.29−3.7114537
344010Presidente Juscelino—MA−44.06−2.9316237
344011São Mateus do Maranhão—MA−44.47−3.9817637
344012Miranda do Norte—MA−44.58−3.5716237
344013Vitória do Mearim—MA−44.83−3.77*37
345000Bela Vista do Maranhão—MA−45.22−3.773937
National Water and Sanitation Agency (ANA)345006Pindaré Mirím—MA−45.44−3.662337
345012Cajarí—MA−45.01−3.402537
345013Monção—MA−45.67−3.424637
346002Bom Jardim—MA−46.18−4.2328737
444001Coroatá—MA−44.17−4.163437
444005Pedreiras—MA−44.61−4.576037
444008Barra do Corda—MA−44.89−4.958237
444013Peritoró—MA−44.33−4.3818737
445001Santa Luzia—MA−45.77−4.034537
445007Lago da Pedra—MA−45.18−4.7410537
445008Arame—MA−46.01−4.8911737
445009Lago da Pedra—MA−45.13−4.568637
445010Vitorino Freire—MA−45.36−4.245537
446000Santa Luzia—MA−46.49−4.306737
446001Santa Luzia—MA−46.75−4.4119237
446002Santa Luzia—MA−46.94−4.7018937
447002Imperatriz—MA−47.27−4.84*37
543011Passagem Franca—MA−43.42−5.9722037
544009Graça Aranha—MA−44.34−5.4110037
546006Grajaú—MA−46.24−5.6012237
546007Sítio Novo—MA−46.70−5.8826337
644015Mirador—MA−44.71−6.0717237
645003Loreto—MA−45.11−6.84*37
645004Grajaú—MA−45.92−6.0424037
646005Fortaleza dos Nogueiras—MA−46.33−6.8240037
342007Luzilândia—PI−42.37−3.463637
National
Water and Sanitation Agency
(ANA)
343010Chapadinha—MA−43.50−3.9322837
343011Urbano Santos—MA−43.24−3.047137
343009Mata Roma—MA−43.11−3.638737
342009Santa Quitéria do Maranhão—MA−42.72−3.365537
242002Tutóia—MA−42.31−2.905637
342002Esperantina—PI−42.23−3.906437
442010Miguel Alves—PI−42.89−4.175037
544006Barra do Corda—MA−44.93−5.4210337
443012Aldeias Altas—MA−43.47−4.637037
443006Codó—MA−43.88−4.46*37
443011Codó—MA−43.65−4.4214037
547005Buritirana—MA−47.02−5.5928837
645002Fernando Falcão—MA−45.39−6.0023737
646006Grajaú—MA−46.27−6.1922537
643011Barão de Grajaú—MA−43.40−6.6123237
543004Buriti Bravo—MA−4359−5.7114937
543002Parnarama—MA−43.36−5.488037
643012Passagem Franca—MA−43.78−6.1821637
644007Mirador—MA−44.36−6.3716937
644012Mirador—MA−44.34−6.0114237
644003Colinas—MA−44.25−6.0313037
543009Palmeirais—PI−43.02−5.5710437
543010Palmeirais—PI−43.06−5.988537
742012Francisco Ayres—PI−42.69−6.6224037
744000São Félix de Balsas—MA−44.81−7.0820237
National Water and Sanitation Agency (ANA)745005São Raimundo das Mangabeiras—MA−45.61−7.3722437
745003Ribeiro Gonçalves—PI−45.24−7.5623037
745004Sambaíba—MA−45.35−7.1423037
743009Jerumenha—PI−43.64−7.2515037
746006Balsas—MA−46.03−7.5226337
746008Riachão—MA−46.55−7.1648237
746009Balsas—MA−46.31−7.3334037
747001Goiatins—TO−47.32−7.7118537
845003Tasso Fragoso—MA−45.97−8.3236037
845004Tasso Fragoso—MA−45.59−8.10*37
845005Alto Parnaíba—MA−45.97−8.8228537
847002Campos Lindos—TO−46.81−7.9729037
946003Lizarda—TO−46.67−9.6062037
947001Rio Sono—TO−47.32−9.4632037
* Missing information (altitude not available).
Table 2. Homogeneous Precipitation Regions (HPRs) with their designations and number of municipalities.
Homogeneous RegionDesignationNumber of Municipalities
HPR1Western Coastal Zone42
HPR2Baixada Maranhense Lowlands24
HPR3Rosário and Itapecuru Mirim25
HPR4Lower Parnaíba Maranhense23
HPR5Upper Mearim and Grajaú24
HPR6Caxias, Codó and Coelho Neto18
HPR7Imperatriz and Porto Franco21
HPR8Chapadas of Upper Itapecuru26
HPR9Chapadas das Mangabeiras7
HPR10Gerais de Balsas7
Table 3. Rainfall and climatological stations by Homogeneous Precipitation Region (HPR) are used for gap filling, data consistency, and statistical analysis.
HPR1HPR2HPR3HPR4HPR5HPR6HPR7HPR8HPR9HPR10
145006245001343001242002346002443006546006543002645003746006
146008345000343003342002444008443011546007543004743009746008
146009345006343004342009445007443012547005543009744000746009
244011345012344004343009445008444005548000543010745003747001
244012345013344007343010445009444013548001543011745004845003
245003445001344010343011446000 645004544009745005845004
245007445010344011442010446001 646005643011 845005
24500982376344012543004446002 646006643012 847002
245010 34401382382447001 647000644003 946003
245011 444001 447002 82564644007 947001
82145 82460 544006 644012 82765
82198 82571 644015
82280 645002
742012
82676
Table 4. Number of stations used, with available data and the total number of missing months in each HPR.
Homogeneous Precipitation (HPRs)No. of Stations UsedNo. of Stations with Missing DataNo. of Months with Data Gaps
HPR 1130848
HPR 2080519
HPR 3110725
HPR 4090520
HPR 5120939
HPR 6050523
HPR 7100757
HPR 8151333
HPR 9060513
HPR 10111037
TOTAL10074314
Table 5. Stations used in the gap-filling analysis based on the Regional Weighting Method in the Homogeneous Precipitation Region—HPR1: Western Coastal Zone.
Station with Missing DataStations Used for Gap Filling
245010—Pinheiro244012—São Bento
82280—São Luis
245011—Santa Helena
244012—São Bento245009—São Luis
245010—Pinheiro
245011—Santa Helena
244011—Guimarães245010—Pinheiro
82280—São Luis
82198—Turiaçu
245007—Turiaçu (Rio Paruá/BR 316)245010—Pinheiro
245003—Maracaçumé
245011—Santa Helena
245009—Pinheiro (Pimenta)244012—São Bento
245010—Pinheiro
245011—Santa Helena
82198—Turiaçu145006—Cândido Mendes
82280—São Luis
245011—Santa Helena
82145—Tracuateua—PA145006—Cândido Mendes
245003—Maracaçumé
146009—Viseu—PA
146008—Viseu (Alto Bonito)—PA145006—Cândido Mendes
245003—Maracaçumé
146009—Viseu—PA
Table 6. Stations used in the consistency analysis based on the Double Mass Curve Method: Homogeneous Precipitation Region (HPR1)—Western Coastal Zone.
Station to Be AdjustedReference StationRegression Equation
244012—São Bento82280—São Luisy = 0.8573x + 2418.9; R2 = 0.9978
244011—Guimarães82280—São Luisy = 1.0692x + 1981.7; R2 = 0.9983
245007—Rio Paruá245003—Maracaçuméy = 1.0507x − 1790.3; R2 = 0.9984
245009—Pimenta245011—Santa Helenay = 0.9291x + 1794.7; R2 = 0.9988
245010—Pinheiro245011—Santa Helenay = 0.9681x + 1640.1; R2 = 0.9992
82198—Turiaçu145006—Cândido Mendesy = 0.9434x − 1799.6; R2 = 0.9995
82145—Tracuateua145006—Cândido Mendesy = 1.0405x − 631.84; R2 = 0.9997
146008—Alto Bonito245003—Maracaçuméy = 1.2082x − 2986.6; R2 = 0.9914
Table 7. Statistical summary of the ten HPRs in Maranhão State.
HPRsObserved YearsMissing DataMinimumMaximumMeanStandard Deviation
HPR13701640.92435.32072.8279.4
HPR23701634.11879.51766.383.3
HPR33701631.22090.11765.8118.3
HPR43701312.41665.61482.0109.8
HPR53701085.91651.31334.8163.3
HPR63701352.61537.21463.561.8
HPR7370828.11710.81280.0244.5
HPR83701000.81313.41191.573.2
HPR9370993.91081.21036.430.4
HPR103701126.21746.31375.9209.2
Table 8. Results of the Mann–Kendall trend test (two-tailed) applied to the ten HPRs in Maranhão State.
TrendHPR1HPR2HPR3HPR4HPR5HPR6HPR7HPR8HPR9HPR10
Kendall’s tau0.0240.0420.1980.0330.0690.0840.0960.0630.093−0.024
S1628132224656644262−16
Var(S)5846.05846.05846.05846.05846.05846.05846.05846.05846.05846.0
p-value (bicaudal)0.8440.7240.0870.7840.5560.4720.4100.5920.4250.844
Disclaimer/Publisher’s Note: The statements, opinions and data contained in all publications are solely those of the individual author(s) and contributor(s) and not of MDPI and/or the editor(s). MDPI and/or the editor(s) disclaim responsibility for any injury to people or property resulting from any ideas, methods, instructions or products referred to in the content.