Article

Frequency Analysis and Trend of Maximum Wind Speed for Different Return Periods in a Cold Diverse Topographical Region of Iran

by
Leila Alimohamadian
1 and
Raoof Mostafazadeh
2,*
1
Department of Natural Resources, Faculty of Agriculture and Natural Resources, University of Mohaghegh Ardabili, Ardabil 5951816687, Iran
2
Department of Natural Resources, Faculty of Agriculture and Natural Resources, Water Management Research Center, University of Mohaghegh Ardabili, Ardabil 5951816687, Iran
*
Author to whom correspondence should be addressed.
Climate 2025, 13(7), 138; https://doi.org/10.3390/cli13070138
Submission received: 25 May 2025 / Revised: 26 June 2025 / Accepted: 1 July 2025 / Published: 2 July 2025
(This article belongs to the Special Issue Wind‑Speed Variability from Tropopause to Surface)

Abstract

This study examines the trends and statistical characteristics of daily maximum wind speed across various synoptic stations in Ardabil Province, Iran, with diverse topography. Using daily wind speed data from multiple synoptic stations, the research focuses on three primary objectives: assessing changes in daily maximum wind speed, fitting various statistical distributions to the data, and estimating wind speed values for different return periods. In this research, the temporal changes were evaluated while analyzing the frequency of the data, and then the maximum wind speed values were calculated and analyzed for different return periods by fitting frequency distributions. The analysis reveals notable variability in maximum wind speeds across stations. The trend analysis, conducted using the nonparametric Mann–Kendall method, reveals significant positive trends in maximum wind speed at Meshgin-Shahr and Sareyn (p < 0.05). Meanwhile, data from Khalkhal station displays a significant decreasing trend, while other stations, like Ardabil and Parsabad, show no meaningful trends. According to the statistical distributions analysis, the Fisher–Tippett T2 mirrored distribution demonstrates the best fit for Ardabil, with an absolute difference of 2.52%, while the Laplace distribution yields the lowest discrepancies for Bilesavar (3.50%) and Ardabil Airport (3.83%). This ranking indicates that, despite similar first-ranked distributions in some stations, secondary models show variability, suggesting localized influences on wind speed that modify distributional fit. As a conclusion, the Laplace (std) distribution stands out as the best-fit model for several stations, showing relative consistency across several stations. These findings demonstrate the necessity of site-specific statistical modeling to accurately represent wind speed patterns across the diverse landscapes of Ardabil Province. Based on the results, comparing the wind characteristics in the study area with those of other regions in Iran, as well as analyzing the reported trends, can be useful in determining the impact of the region’s climatic conditions and topography on wind patterns. This research offers key insights into wind speed variability and trends in Ardabil, crucial for climate adaptation and risk management of extreme wind events.

1. Introduction

1.1. Background

Accurate estimation of maximum wind speeds is essential in analyzing climate hazards and many design projects such as buildings, bridges, wind turbines, and radio decks to ensure the safety and reliability of these structures and to avoid the construction costs of these buildings due to their over-design [1,2,3]. Wind speed is affected by land obstacles and complications, and also varies with changes in altitude from sea level in different regions [4]. In arid and semi-arid regions, although wind erosion is influenced by several factors, such as earth conditions, earth topography, climate, and human management, wind speed plays a major role in exacerbating wind erosion [5]. Speed should be one of the most important climate variables in cases such as increased evaporation from the soil surface and water bodies, so determining the probability of occurrence and the velocity values of strong winds at different return periods is important [6]. Wind speed and direction are important meteorological factors for the study of safety analysis in areas with nuclear power plants [7]. In fact, wind directly affects the generation of electricity caused by wind power, so that the output power is proportional to the third power of the wind speed. Wind is a natural, intermittent, uncertain, and difficult source to control. Its origin comes from the pressure gradient between regions caused by the uneven warming of the sun on the earth’s surface. In addition, complex events such as land displacement, physical effects of mountains, obstacles, and earth roughness affect wind behavior [8]. Many factors contribute to the occurrence of wind storms. Meteorological factors, topographic factors, seasonal factors, urban morphology factors, and many other related factors require attention to identify the causes of strong winds [9]. High wind speeds are considered a threat to the integrity of structures, especially those located in open places such as bridges, wind turbines, and radio decks. In any design project for large structures, safety considerations must be balanced against the additional cost of “over-design”. Accurate estimation of the occurrence of high wind speeds is an important factor in achieving the correct balance [10].
Based on long-term historical data, return periods help assess the risk of natural hazards such as cyclones and hydroclimatic events [11]. They are typically estimated using statistical distributions applied to observed data, such as wind speeds [1,12]. Wind speed frequency analysis is key to assessing risk and minimizing cost in wind reduction projects [6]. The recurrence period in many codes and standards is usually 50 years [12,13].

1.2. Literature Review

Several studies have assessed maximum wind speed frequency across different return periods. Dukes and Palutikof [14] found that a one-step Markov chain model effectively simulates wind speeds, matching conventional analyses for 10- and 50-year periods, but underestimating longer return periods. Morton et al. [15] showed that the seasonal point process model improves accuracy in estimating wave height and wind speed in the North Sea. Della-Marta et al. [16] highlighted the importance of accurately assessing strong winds for safety, engineering, and insurance in the northeast Atlantic and Europe. Razali et al. [17] mapped annual wind speed changes at 12 Malaysian stations using the Gumbel distribution for 10, 30, 50, and 100-year return periods, finding a high risk of strong winds. Lee et al. [18] showed that the point-seasonal process model accurately estimates directional and seasonal wind speeds near the Barakah nuclear plant. Ekhtesasi and Ghaeminia [19] identified intense 100-year return period winds in western regions, linking them to synoptic and topographic factors, and found a logarithmic relation between speed and return period. Moradi [20] reported Bushehr station’s highest wind speed as 39 m/s in 1959 (207-year return period) and 35 m/s in 2014 (82-year return period). According to previous studies, the, wind speed analysis was carried out for different return periods. Evaluating trends and temporal changes in daily maximum wind speed across varying topographic conditions requires further research. Although valuable studies exist, comprehensive research on maximum wind speed variations in Iran’s cold, topographically diverse regions, especially Ardabil Province, is lacking. Understanding these local wind patterns is crucial for climate adaptation, structural design, and risk management. This study analyzes daily maximum wind speed data from Ardabil’s synoptic stations to assess temporal trends and statistical distributions across return periods, providing essential insights for managing wind risks and climate-adaptive planning in the region.

1.3. Scope and Objective

The maximum wind data is widely used in building engineering and structural design, as there is a need to follow the principles of wind resistance in the design and implementation of structures [21]. Ceilings, windows, and tall structures should be designed in such a way that they can withstand the forces caused by strong winds [22]. Estimating maximum wind speeds as one of the key components of meteorology is of particular importance in climate studies and forecasts [23]. Due to the diversity of topography and the effectiveness of climate variables in Ardabil Province, Iran, estimating and analyzing maximum wind speeds will play an effective role in identifying and predicting the potential for severe weather events, including hurricanes and tornadoes [24]. Accurate forecasting of maximum wind speeds is crucial for minimizing damage to infrastructure, guiding the placement of wind-sensitive structures, and ensuring safety in urban and rural areas. In agriculture, it helps assess soil erosion, dust transport, and crop health. In the energy sector, particularly wind energy, it informs turbine siting and design to maximize efficiency and reduce risk. Given the growing impact of strong winds on structures, infrastructure, and agriculture, precise regional analysis of maximum wind speeds in diverse topographies is crucial. This is especially true for Ardabil Province, where a cold climate and varied terrain cause significant spatial and temporal wind variations. Understanding these wind trends is essential for forecasting severe weather, managing hazards, and optimizing wind energy. This study analyzes temporal trends, fits statistical distributions, and estimates wind speeds for different return periods, providing tailored, practical insights to improve risk management and climate adaptation in Ardabil. In the present study, the following objectives are considered: (a) determining the trend of daily maximum wind speed changes, (b) fitting different statistical distributions to wind speed data, and (c) estimating wind speed values. The results can be useful in analyzing trends and differences in wind speed changes in the study area.

2. Materials and Methods

2.1. Data Used

Ardabil Province is located in the cold region of northwestern Iran. About two-thirds of the province of Ardabil has a mountainous topography with a high altitude difference, and the rest are flat and low-altitude areas [25]. The highest elevation of the study area is Sablan peak, with an altitude of approximately 4811 m. The presence of high mountains such as Sabalan, Talesh, Ghoshedagh, Bozghosh, Palangan, and Aghdagh has caused the climate of Ardabil Province to have special characteristics and be one of the coldest regions of Iran; it also has a high amount of precipitation, which has led to snow-covered heights in the study area. All available stations in Ardabil Province were used to study wind speed changes (Figure 1). Given the province’s diverse topography, from high mountains to wide plains, wind characteristics vary notably in speed and direction. Mountainous areas experience stronger, more variable winds, while plains have milder, more consistent flows. Valleys and peaks further create complex local wind patterns. Station selection was made to reflect this diversity and ensure reliable data for accurate wind analysis.
The precipitation in the province is about 330 mm, and the average temperature is about 14 degrees Celsius [26]. Ardabil Province has a diverse climate due to the complexity of natural conditions, vegetation cover, and geomorphological diversity, as well as the diversity of factors affecting the region’s meteorology and climate [27]. The two seasons of spring and winter are the rainy seasons of the region, and the most precipitation occurs in spring. The present study used daily wind speed data recorded at synoptic stations in Ardabil Province to conduct analyses. This study used daily maximum wind speed data from synoptic stations in Ardabil Province, provided by the Iran Meteorological Organization, with acceptable accuracy and quality. However, limited record lengths at some stations may introduce uncertainty in long-term return period estimates. Missing data were reviewed and processed by experts to ensure suitability for statistical and trend analyses. For future studies, extending record lengths and collecting higher-resolution data are recommended to improve analysis precision.
In Table 1, the general specifications of the daily maximum wind speed data recorded at the synoptic stations studied in the present study are presented.
The statistical characteristics of maximum wind speed data across synoptic stations in Ardabil Province show significant variability. The mean maximum wind speed is highest at Meshgin-Shahr (16.37 m/s) and lowest at Parsabad (9.20 m/s), indicating a considerable difference of 7.17 m/s between these two stations. Other stations, such as Bilesavar and Khalkhal, also show notable differences, with mean maximum daily wind speeds of 12.58 m/s and 8.78 m/s, respectively, indicating a regional variation in wind patterns influenced by local topography and meteorological conditions.
Meshgin-Shahr maximum wind data has the highest standard deviation at 2.77 m/s, showing more variability in wind speeds compared to other stations. In contrast, the lowest standard deviation is observed at Ardabil Airport at 1.98 m/s. This difference indicates that Meshgin-Shahr experiences more extreme wind conditions, whereas Ardabil Airport presents a more stable wind regime. Meshgin-Shahr exhibits a remarkably high kurtosis (8.93), showing a distribution with heavy tails, meaning it likely experiences more frequent extreme wind speeds. In contrast, Parsabad’s kurtosis is −0.53, indicating a flatter distribution with fewer extreme values. Additionally, the skewness at Meshgin-Shahr (2.29) implies a right-skewed distribution, meaning that while most wind speeds are moderate, there are significant occurrences of very high speeds, which poses potential risks for structures and safety. Understanding the variability in maximum wind speeds, standard deviations, and distribution characteristics helps identify areas at higher risk for extreme wind events.

2.2. Methodology

2.2.1. Analysis of PDF and CDF of Wind Speed Data

Probability density function (PDF) and cumulative distribution function (CDF) charts are useful tools for analyzing wind speed data [28,29]. The PDF shows the probability density at a particular point, but the CDF represents the cumulative probability up to a particular point. These charts help identify data distribution properties and better display and understand patterns in the data. The PDF graph shows the probability of certain values of wind speed occurring, while the CDF addresses the cumulative distribution of these values and shows what percentage of the data is less than a certain value. These graphs help assess the maximum wind speed at synoptic stations. The PDF and CDF graphs were drawn using R 4.4.1 software.

2.2.2. Trend Detection in Wind Speed Data

In this study, the Mann–Kendall method was used to evaluate the trend of maximum wind speed data in the synoptic stations of Ardabil Province. Due to its nonparametric nature, the Mann–Kendall method is very suitable for identifying meaningful trends in time data and is able to analyze data with fluctuations and missing values [30]. The study used the “Kendall” package in the R programming language. In graphical results, Tau and Sigma statistics are used as the main indicators of trends. Tau statistics indicate the degree of correlation and correlation between time data, with positive values indicating an upward trend and negative values indicating a downward trend. Also, Sigma (p-value) indicates the statistical meaningfulness of the identified trend; values less than 0.05 indicate the meaningfulness of the trend at the 95% level. The details of the Mann–Kendall method are as follows. The S statistics are usually used for a time series calculated statistically as [31,32]
S = i = 1 n 1 j = i + 1 n s i g n x j x k
s i g n θ = + 1 i f x j x k > 0 0 i f x j x k = 0 1 i f x j x k < 0
The statistic S is the sum of the signs of differences between every pair of data points that indicates the direction of the trend. xk and xj are the observed data values at times k and j, respectively, and n is the total number of observations in the time series. The function sign(θ) determines the direction of change between two data values: +1 if the second value is greater, −1 if it is smaller and 0 if they are equal.
In this study, we analyzed a dataset consisting of 20 values, allowing for the application of a normal approximation, specifically the Kendall Z-value, as the sample size exceeds the minimum requirement of 10. To calculate the Kendall Z-value, it is essential first to determine the variance of the S statistic, referred to as “VAR(S)” [33].
V a r S = 1 18 n ( n 1 ) ( 2 n + 5 ) i = 1 m t p t p 1 2 t p + 5
Var(S) is the variance of the statistic S which is used for normalization and calculation of the statistic Z. The equation accounts for the occurrence of tied values, which are values that are identical to each other. In this context, “n” denotes the total number of data points, “m” signifies the number of groups exhibiting equal trend values, and “tp” indicates the number of data points within the Pth group. By leveraging the values of VAR(S) and S, we can derive the Kendall test statistic (Z-value), providing a means to evaluate trends effectively [33].
Z s = S 1 V A R S ;    i f S > 0 0 ;         i f S = 0 S + 1 V A R S ;    i f S < 0
Zs is the normalized value of the statistic S and is used for testing the significance of the trend. To ascertain the trend in the data series, the acceptance of the null hypothesis will occur if the relationship is substantiated.
K e n d a l l   s t a t i s t i c s   Z s / 2
The significance of trends is evaluated using the absolute value of the Mann–Kendall (MK) test. If this value exceeds 1.96, the trend is deemed significant at the 5% level, while a value greater than 2.56 indicates significance at the 1% level. Furthermore, a positive Z statistic points to an upward trend in the data series, whereas a negative Z statistic suggests a downward trend [34].

2.2.3. Probability Distribution Analysis of Wind Speed Data

CumFreq software was used to determine and calculate wind speed during different return periods. The CumFreq model calculates cumulative frequency and processes the probability distribution of the data series. The software program fits a variety of cumulative frequency distributions, including linear, logarithmic, exponential, and double exponential forms. It encompasses distributions such as normal, log-normal, log-logistic, Cauchy, Pareto, Weibull, Frechet (Fisher–Tippett type II), Kumaraswamy, Gumbel, GEV, Erlang (Gamma), Burr, Dagum, Laplace, Student, Gompertz, exponential, Poisson, and Rayleigh, selecting the most suitable one through the best fit method [35]. Several of these distributions are particularly useful for extreme value analysis.
Users can also indicate a preference for a specific distribution. The CumFreq calculator model employs both logarithmic and exponential transformations of the data, automatically optimizing an exponent greater than 0. These generalized distributions offer significant flexibility but are rarely used in other fitting calculators, with the exception of the Burr distribution, which generalizes the Pareto distribution [3]. When the mathematical model identifies a discontinuous probability function, it allows users to introduce a breakpoint or threshold value, resulting in a segmented or composite frequency and probability distribution [36]. In this regard, maximum wind speed data was extracted from daily data during the statistical period studied at each synoptic station. The following is the value of the variable in different return periods calculated using the superior frequency distribution [37]. It should be noted that the best distribution of processed frequency was selected using the difference in the observational and computational values of the cumulative frequency. In the next step, the amount of daily wind speed was calculated in the return periods of 2, 5, 10, 25, 50, and 100 years using the CumFreq program. The CumFreq software was used to identify the best-fitting probability distribution and estimate its parameters. It specializes in cumulative frequency analysis and fits distributions using plotting positions. CumFreq can optimize distribution shapes through exponential and logarithmic transformations and use mixed distributions for complex data. Parameter estimation is automatic, minimizing the difference between observed and modeled cumulative frequencies, similar to least squares but better suited for frequency analysis. This well-established method is common in hydrological and climatic studies. The software’s ability to compare, rank distributions by fit, and provide clear, practical results makes it an optimal choice. In the process of selecting the appropriate statistical distribution for the data under study, statistical characteristics such as skewness and kurtosis, being intrinsic to climatological time series, were considered in determining the best-fitting distribution using the CumFreq software. Moreover, at certain stations, the relatively short length of the data series could affect the precision of the outcomes.

3. Results and Discussion

3.1. PDF and CDF Analysis

The PDF and CDF charts of the maximum daily wind speed data at the synoptic stations in Ardabil Province are shown in Figure 2.
The graphs presented in Figure 2 show the distribution of maximum wind speed in different stations in Ardabil Province, where the distribution of daily maximum wind speed values varies from station to station. Some stations (such as Meshgin-Shahr) have lower levels of speed limits (low and high). However, in some stations (such as Ardabil), the maximum daily wind speed fluctuations are higher, and the frequency of strong winds is higher. At most stations, the maximum speed distribution should be closer to the normal distribution. That is, the greater frequency of daily maximum speed values in the data is located around an average value.
Based on the information provided in Figure 2, in the Ardabil chart, the highest density of wind speed is around 10 to 15 units (kilometers per hour). Also, the cumulative density for Ardabil station indicates that 75 percent of wind speed observations in Ardabil were less than or equal to 15 units. In most of the studied stations, the wind speed distribution appears to have a high density within a specific range of speeds and then gradually decrease. For example, in Ardabil and Ardabil Airport, the highest wind speed density is around 10 to 15 km per h. Based on Figure 2, differences in wind speed distribution can be observed among various locations. For instance, the Meshgin-Shahr chart shows its density peak slightly shifted toward higher values (near 15 to 20) compared to Khalkhal, where the peak is slightly lower. This indicates differences in wind patterns in these areas. Using the cumulative distribution function, the probability of wind speed exceeding a specific value can be easily calculated. In summary, these charts are useful tools for understanding the statistical characteristics of maximum wind speed in the studied synoptic stations, providing valuable information on the distribution, density, and probabilities related to wind speed.

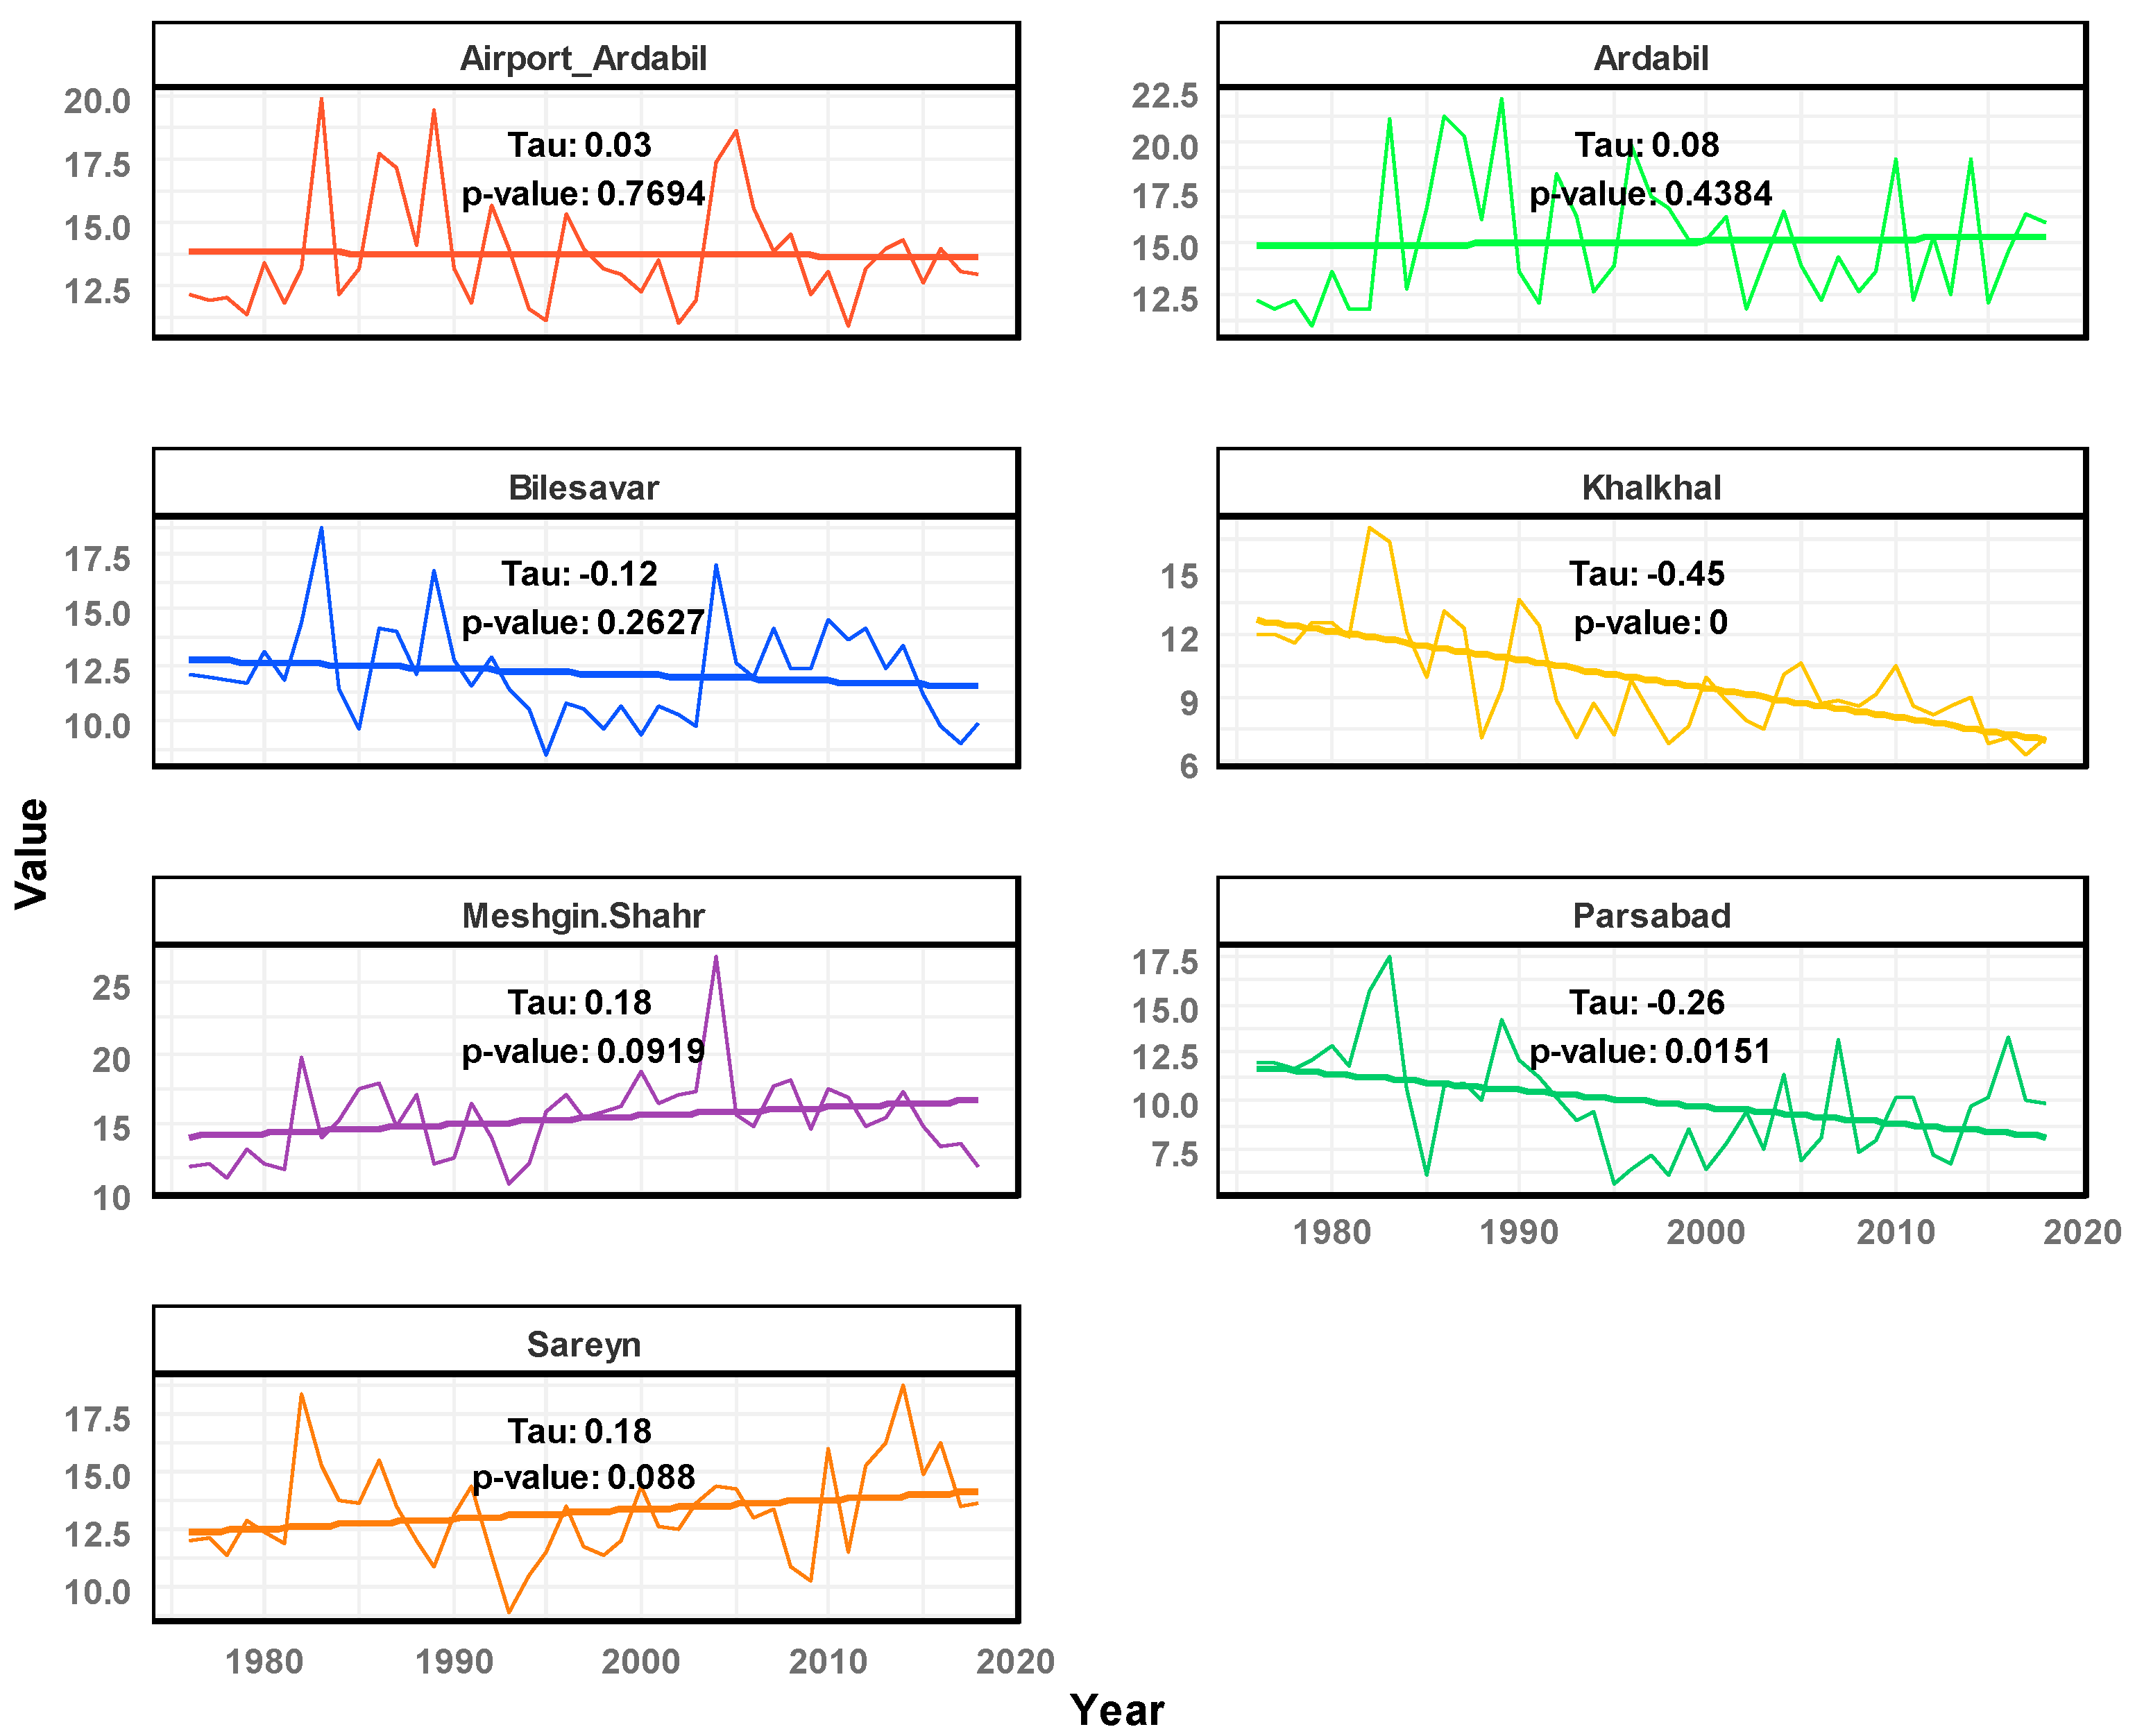
3.2. Trend Analysis of Maximum Wind Speed Data

The trend charts of daily maximum wind speed data at the synoptic stations in Ardabil Province are shown in Figure 3.
Based on the information provided in Figure 3, wind speeds at different stations show different changes. In Meshgin-Shahr and Sareyn, the positive Tau coefficient and the p-value are less than 0.05, which indicates an increasing trend; in other words, the maximum daily wind speed at these stations has increased over time. There is a downward trend in the stations of Bilesavar and Khalkhal, but this change is only meaningful in the station of Khalkhal at the level of 95 percent. At the stations of Ardabil, Parsabad, and Ardabil Airport, according to the results of the Mann–Kendall trend analysis test, the daily maximum wind speed changes have lacked a meaningful trend.
Figure 3 clearly shows various positive and negative trends in wind speed at different stations. For example, Khalkhal station, located in a mountainous and higher-elevation region, has experienced a significant decreasing trend in wind speed (Tau: −0.45, p-value: 0), which could be due to changes in local atmospheric circulation patterns. In contrast, Meshgin-Shahr and Sareyn stations, both situated in mountainous areas, show increasing trends (Tau: 0.18), although these are not statistically significant (p-value: 0.0919 and 0.088). This increase in wind speed could be due to changes in regional wind patterns or even local phenomena such as an increase in thermal currents over time. Parsabad station in the Moghan Plain, a flat and agricultural area, has experienced a significant decreasing trend in wind speed (Tau: −0.26, p-value: 0.0151). To provide a deeper perspective, the relationship between these trends and regional climatic characteristics, as well as the pattern of wind occurrence under the influence of various atmospheric factors and the dynamics of air masses affecting the formation of strong winds, should be considered.

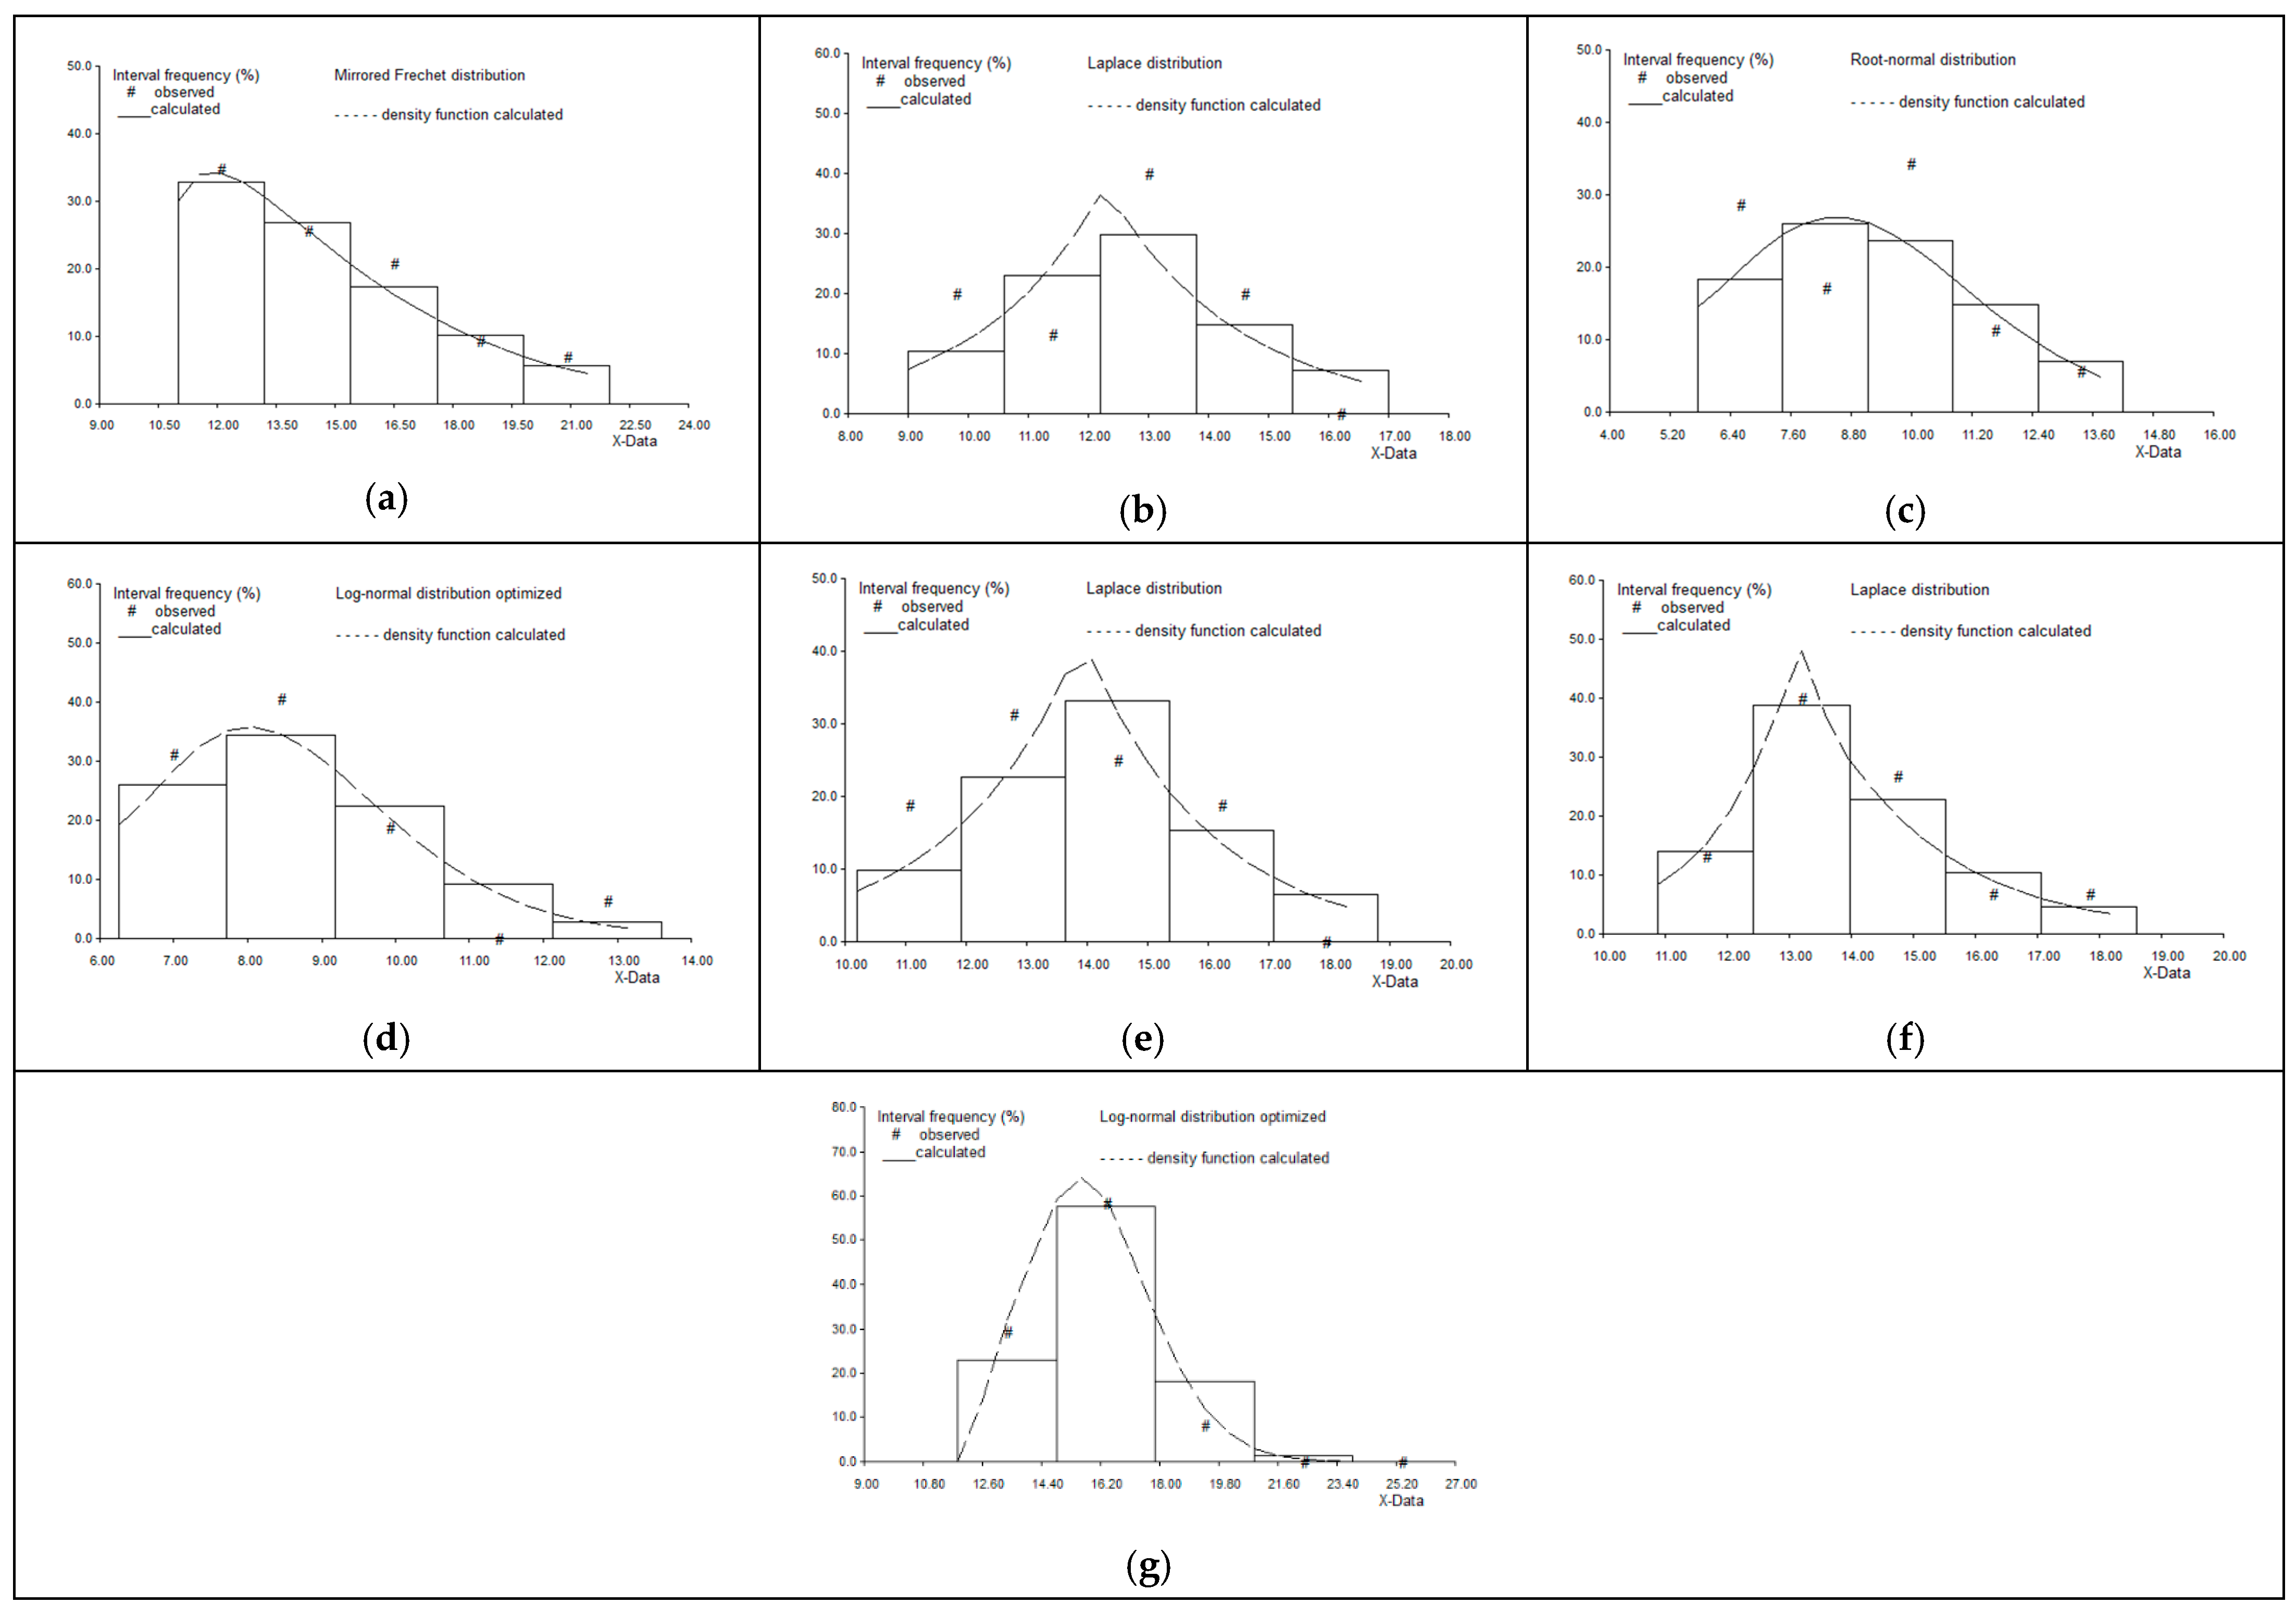
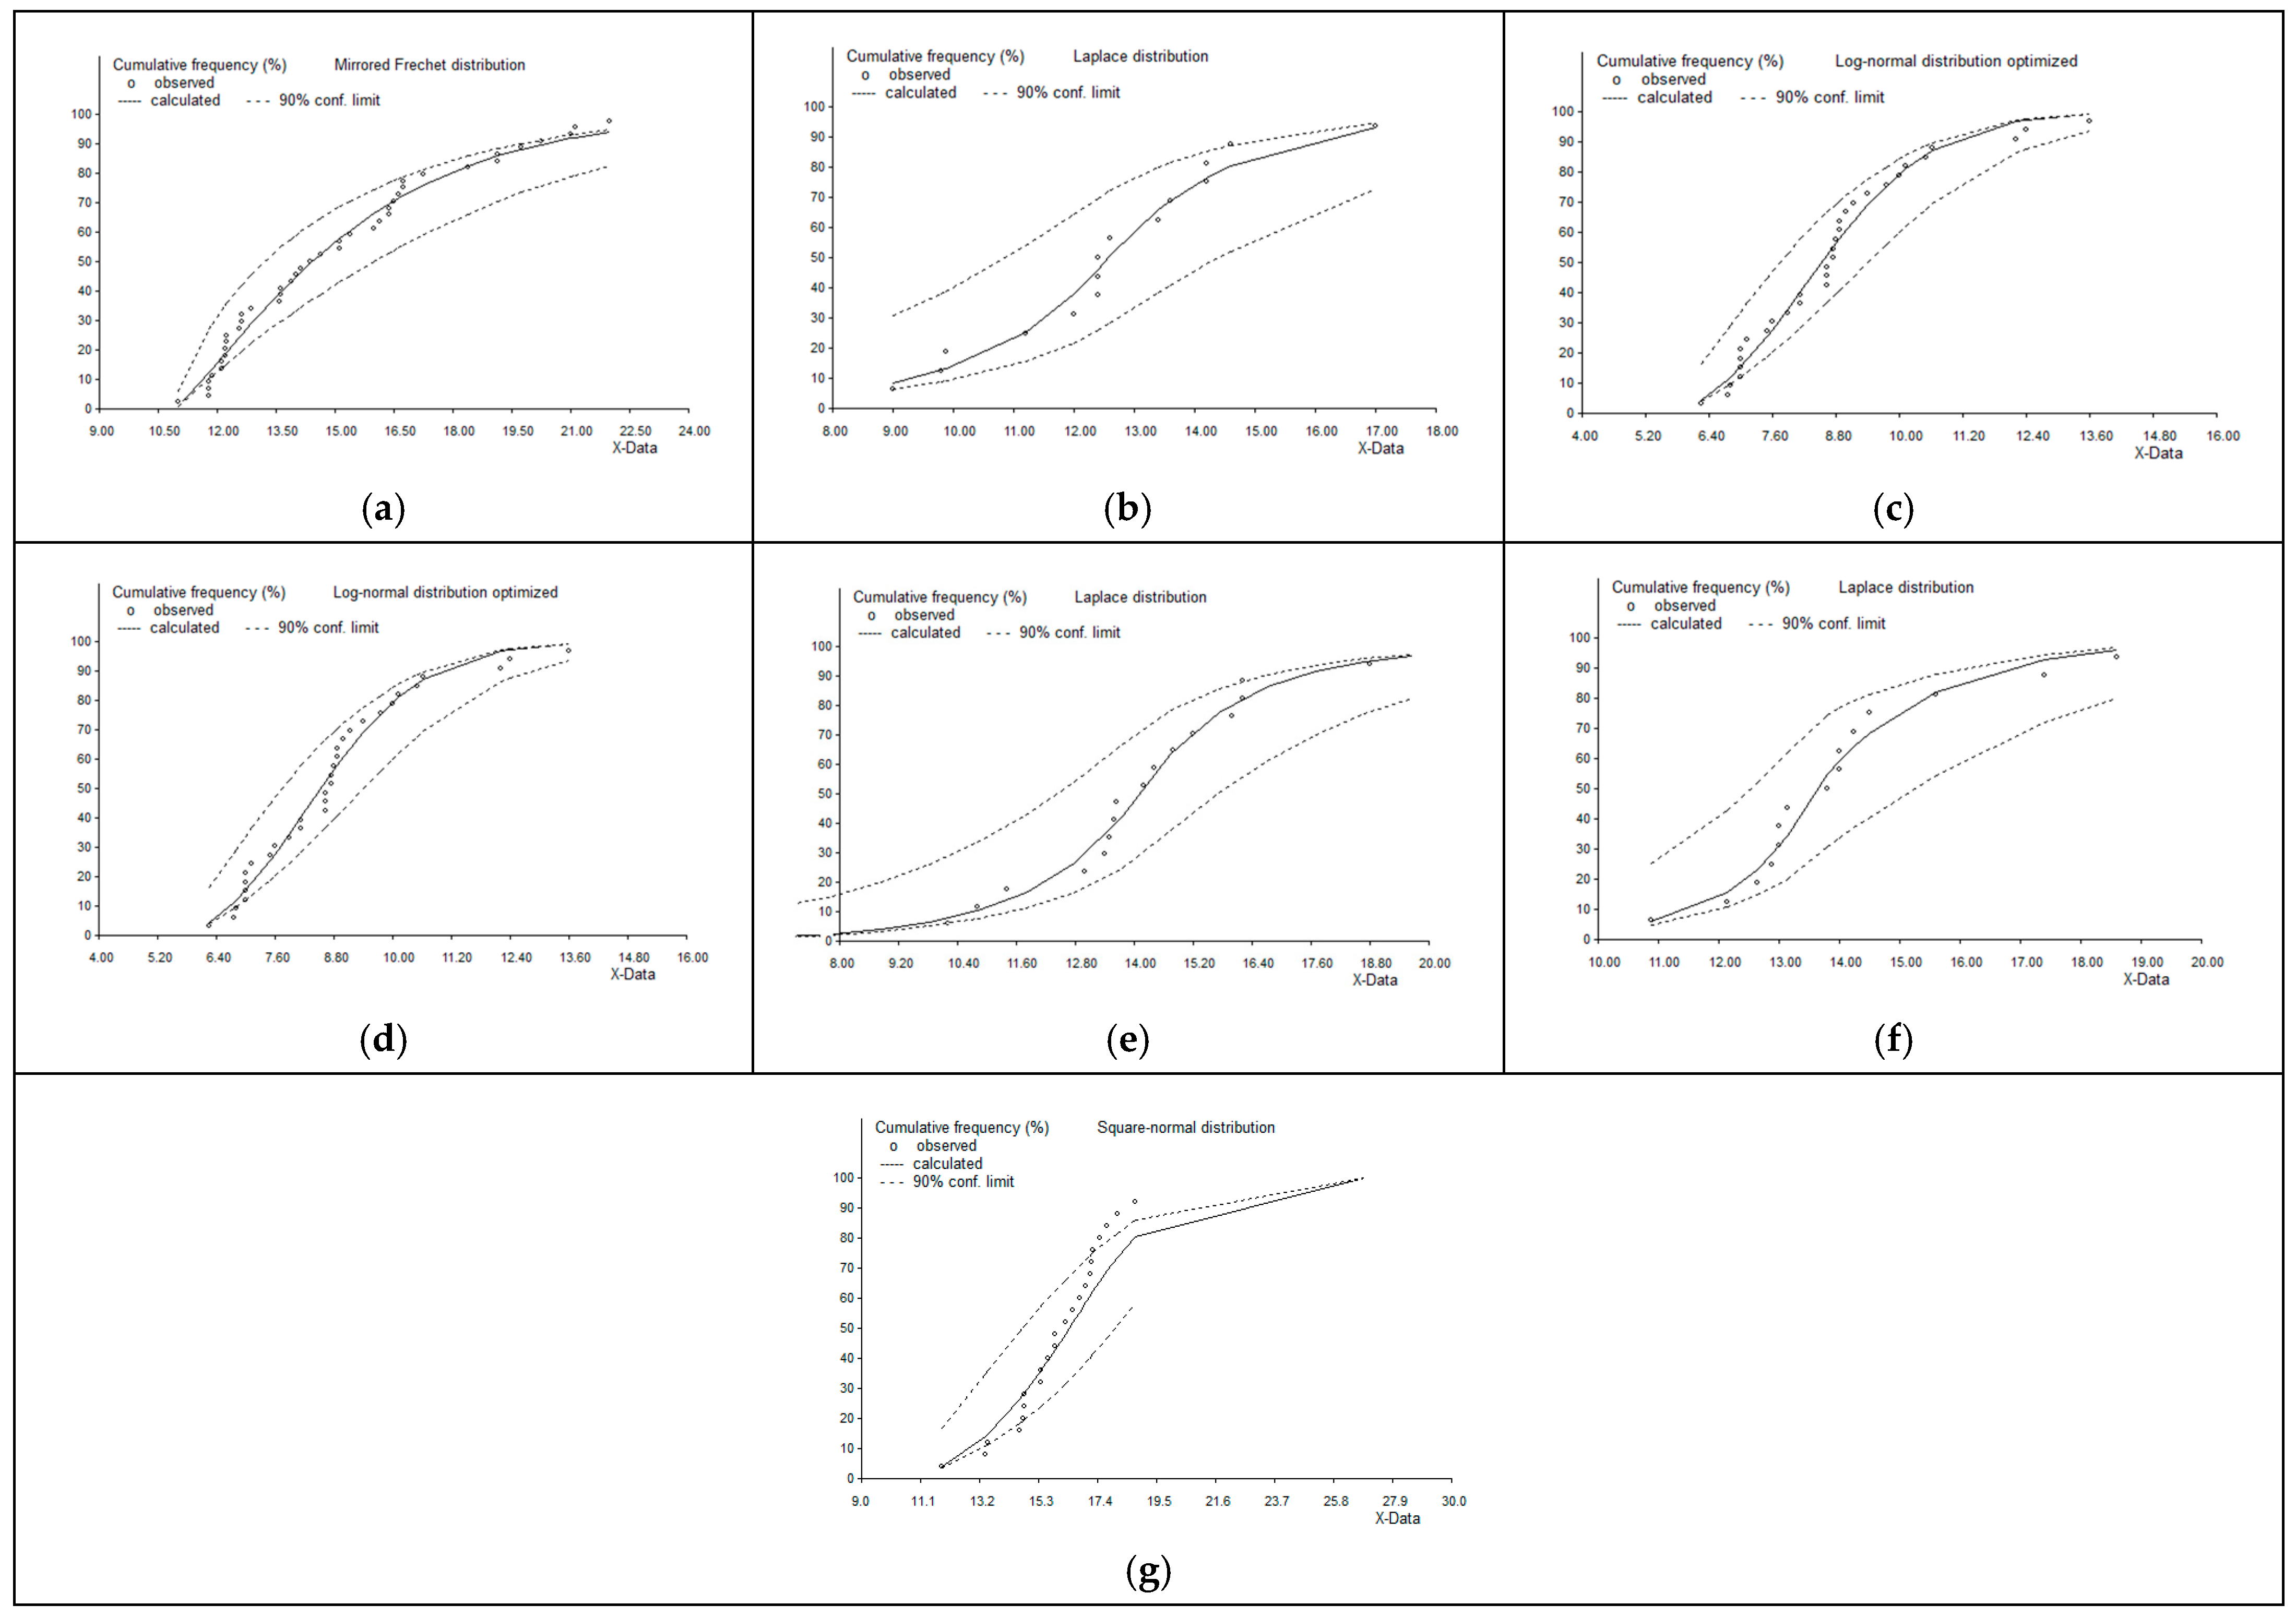
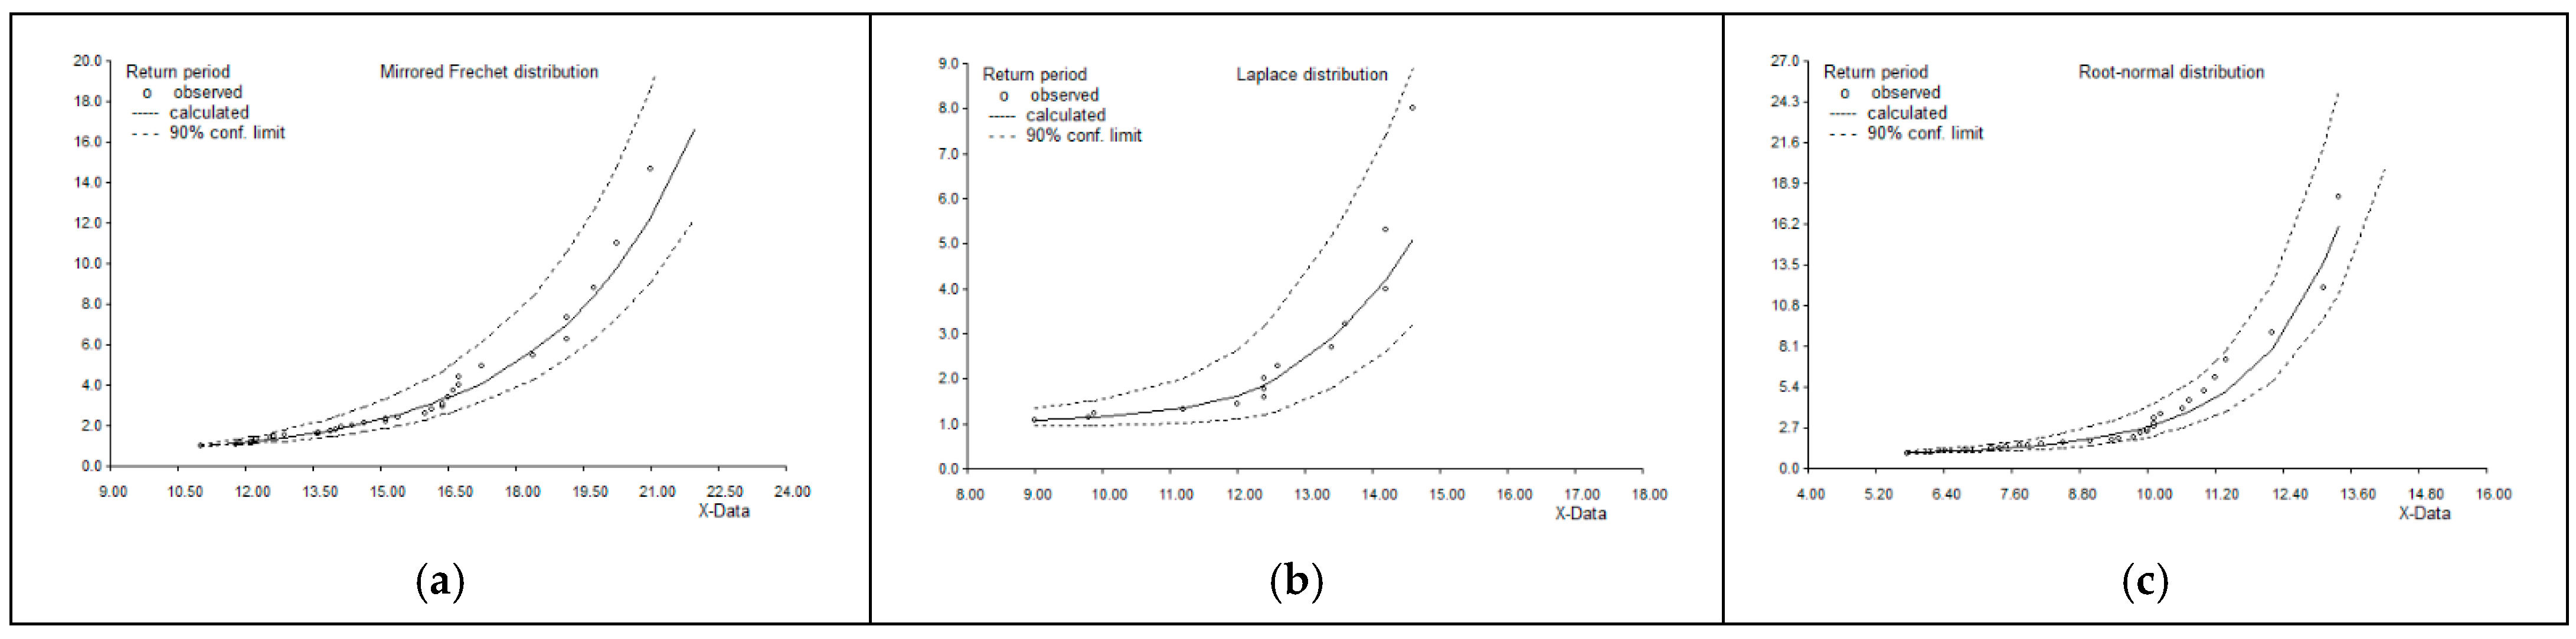
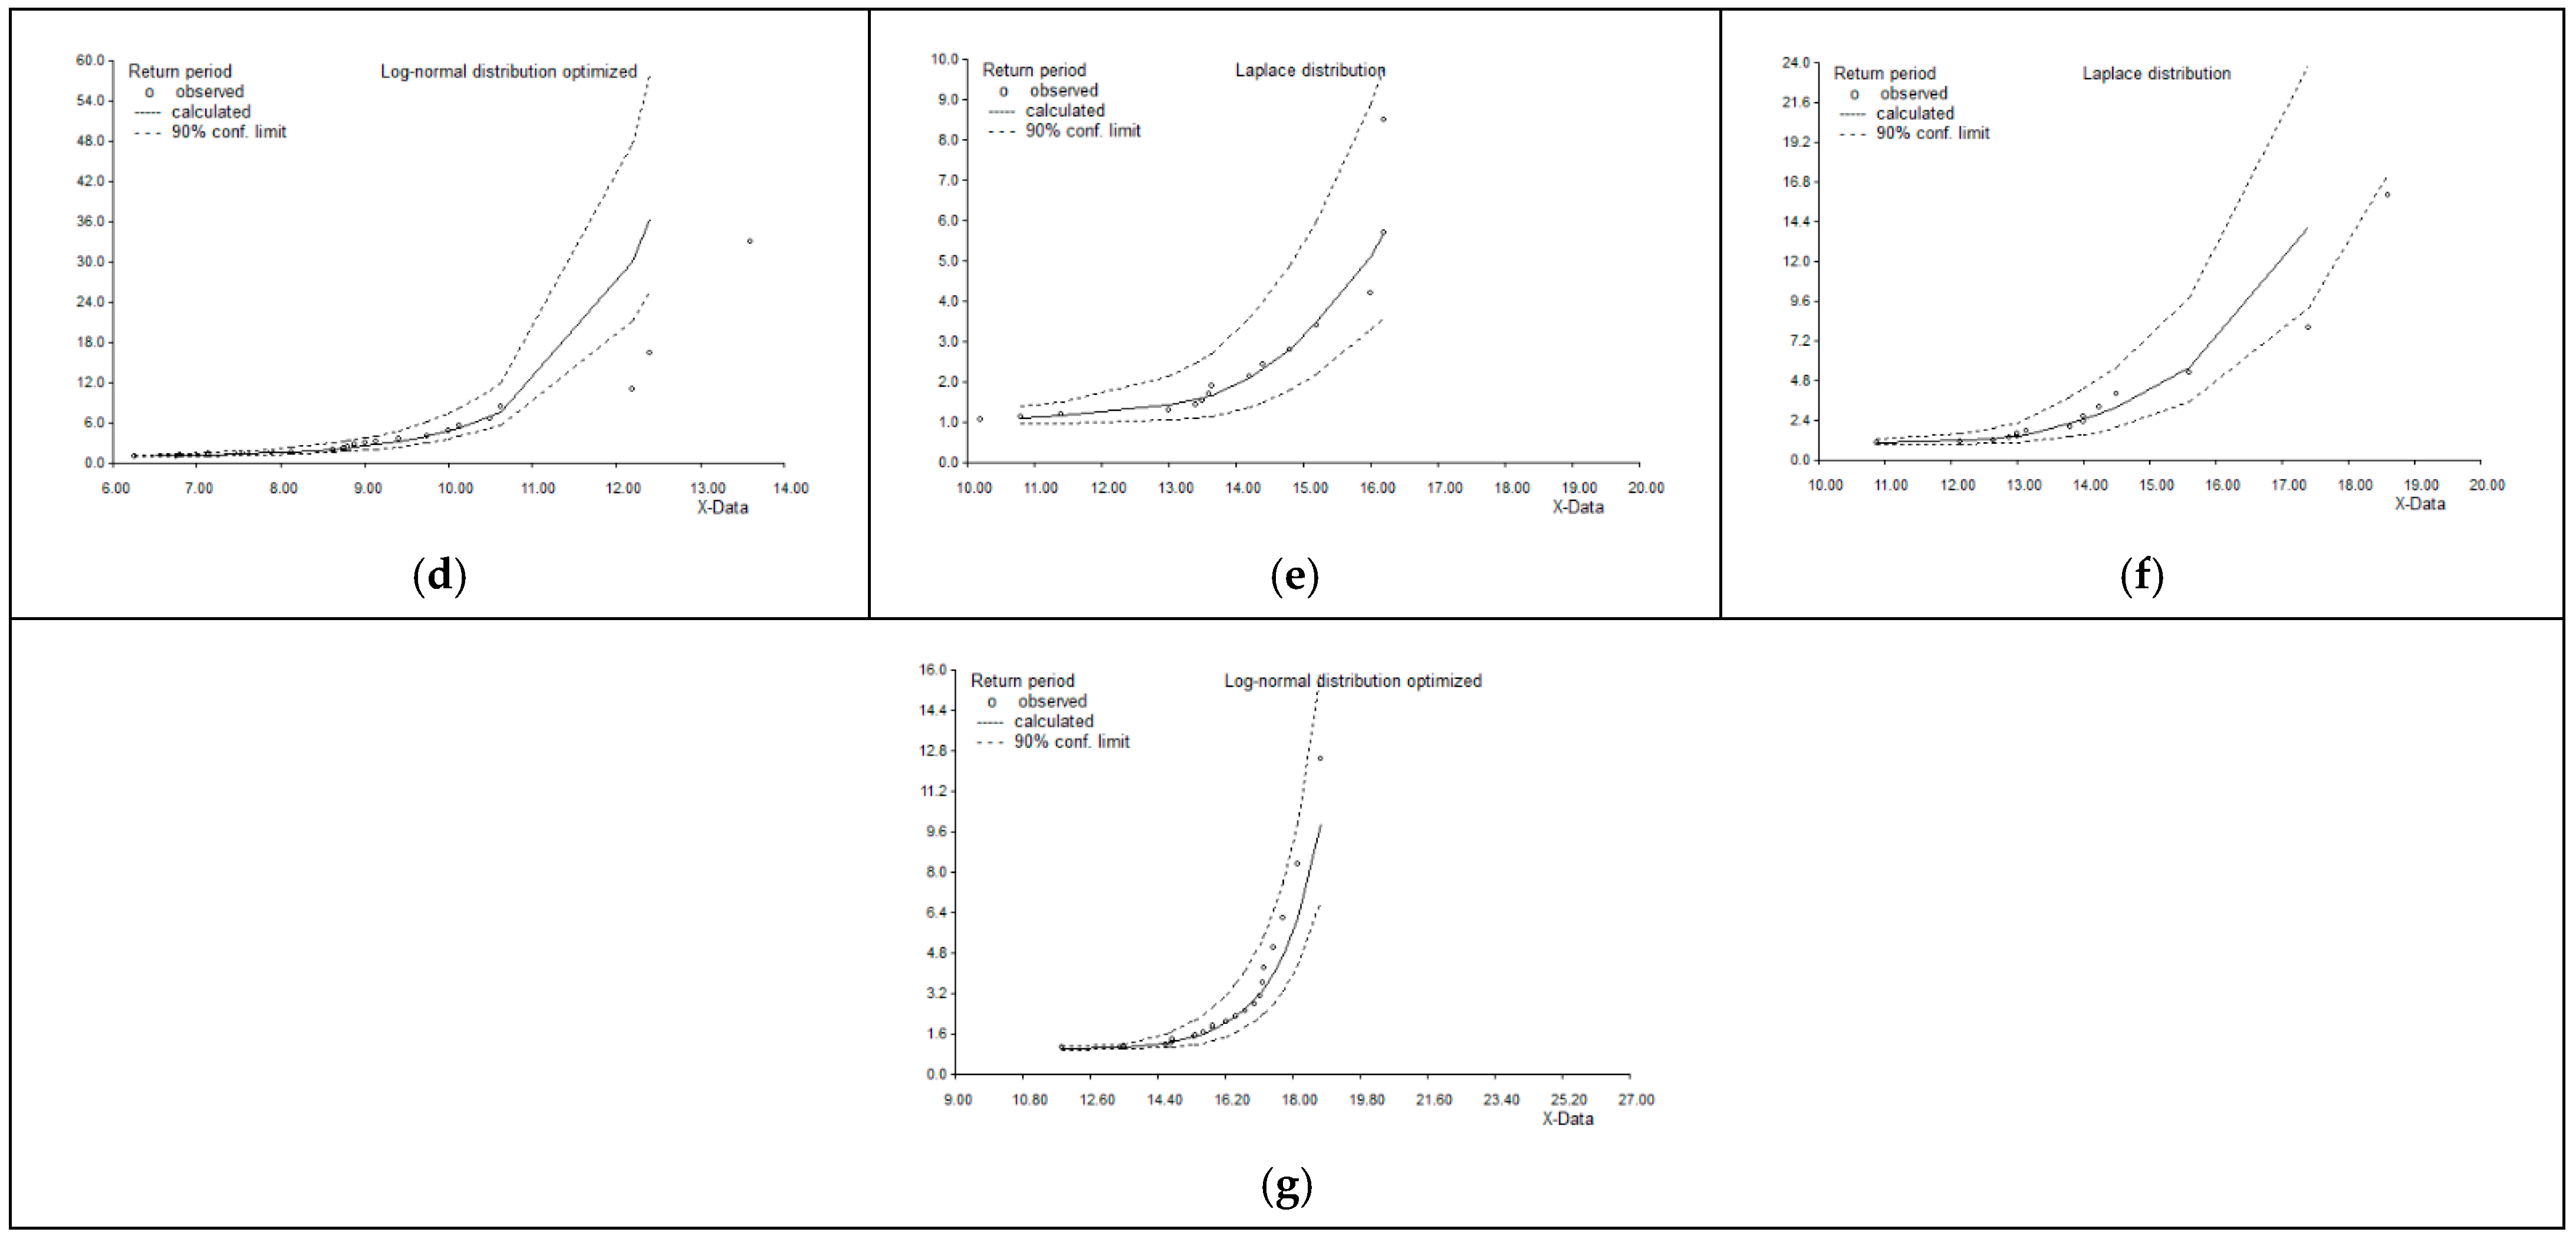
3.3. Probability Distribution Analysis of Maximum Wind Speed Data

The findings obtained from the present study on the ranking of superior statistical distributions along with the average absolute values of differences between computational cumulative frequency values and their observations in the stations studied are presented in Table 2.
Table 2 provides a ranking of statistical distributions best fitted to the maximum wind speed data for synoptic stations in Ardabil Province, showing differences in cumulative frequency values.
The table ranks statistical distributions fitted to daily maximum wind speed data from various synoptic stations in Ardabil Province, showing differences in cumulative frequency values. Notably, the Laplace (std) distribution ranks first for Bilesavar, Sareyn, and Ardabil Airport, suggesting that it best fits the data across these stations with low absolute differences (3.50% for Bilesavar, 2.78% for Sareyn, and 3.83% for Ardabil Airport). This consistency in the top-ranked distribution across multiple stations indicates shared statistical characteristics in wind speed behavior. For Ardabil and Khalkhal stations, the Fisher–Tippett Type II mirrored distribution ranks first, with a notably low absolute difference in Ardabil (2.52%) and a higher one in Khalkhal (3.20%). This distinction indicates some regional differences in wind speed distributions, as the Fisher–Tippett T2 distribution appears more suitable for representing the wind data at these particular stations. It suggests that wind patterns in Ardabil and Khalkhal may have more pronounced tail behavior than other areas. Examining the second-ranked distributions reveals further variation. For instance, while the generalized exponential (Poisson type) ranks second for Ardabil, with an absolute difference of 2.62%, the GEV distribution holds the second spot for Ardabil Airport, with a slightly higher difference (3.87%). This ranking indicates that, despite similar first-ranked distributions in some stations, secondary models show variability, suggesting localized influences on wind speed that modify distributional fit.
Significant differences in absolute values appear at lower-ranking distributions, especially for Ardabil Airport. For example, the generalized exponential distribution ranks thirteenth for Ardabil Airport, with a substantial difference of 6.46%, and the normal distribution ranks fifteenth, with an even higher difference (6.59%). These higher discrepancies in lower-ranked distributions imply that while the Laplace distribution fits Ardabil Airport’s wind data well, other distributions show much less alignment with observed frequencies.
As a conclusion, the Laplace (std) distribution stands out as the best-fit model for several stations, showing relative consistency across Bilesavar, Sareyn, and Ardabil Airport. Meanwhile, stations like Ardabil and Khalkhal differ, with the Fisher–Tippett T2 mirrored distribution in first place. This variation indicates the need for tailored approaches in wind speed calculation across regions, with the Laplace distribution proving particularly useful in multiple stations.
Table 2 shows how well different statistical distributions capture the tail behavior and central tendency of maximum wind speeds across stations. The low absolute differences in top-ranked distributions suggest a strong goodness-of-fit, particularly for Laplace and Fisher–Tippett types, which are known for modeling extreme values. The observed distributional variability between stations points to possible climatic gradients or orographic influences, especially between northern plains (like Bilesavar and Parsabad) and high-altitude stations (like Khalkhal and Sareyn). The presence of distributions like GEV, root-normal, and mirrored Weibull among top ranks at several stations signals the presence of both skewed and heavy-tailed characteristics in the wind data. This diversity in distributional fit implies that a single universal model cannot be generalized for the entire region.
In this study, various statistical distributions were evaluated for modeling maximum wind speed data at different stations, ranked by their average absolute error between observed and theoretical cumulative values (Table 2). The standard Laplace and mirrored Fisher–Tippett Type II distributions showed the best fit, capturing both probability density and quantile characteristics effectively. For instance, Laplace performed best at Bilesavar, Sareyn, and Ardabil Airport due to its ability to model heavy tails and sharp fluctuations. In contrast, the mirrored Fisher–Tippett T2 distribution ranked first at Ardabil and Khalkhal, indicating stronger extremes. These distribution choices reflect both statistical accuracy and regional climatic variability across Ardabil Province.
This study examined various statistical distributions for maximum wind speed data, selecting the best model based on the smallest relative difference between observed and predicted values. However, stronger tests like Anderson–Darling and criteria such as the AIC and BIC are recommended for more reliable selection, especially with hydrometeorological data containing extreme values. The main limitation was not using these advanced methods, which could improve accuracy. Future studies should apply these tests to enhance distribution selection, return period estimation, and trend analysis.
This study used CumFreq to fit statistical distributions to maximum wind speed data and estimate return period values. It minimizes differences between observed and modeled cumulative frequencies and supports shape optimization and mixed distributions. However, it should be noted that the accuracy of these distributions in predicting extreme events and long return periods (such as 50 or 100 years) may vary due to the heavy-tail characteristics of the data. Some distributions may perform well only within the range of observed data and may not be reliable for rare values. To improve the accuracy and reliability of predictions, it is recommended that future research employ more robust methods such as L-moments, which are more resistant to outliers and provide better criteria for selecting appropriate distributions, especially for extreme value data.
Figure 4 presents the interval distribution histogram of maximum wind speed values for the studied stations.
Figure 5 presents the findings from this study, depicting the cumulative distribution and confidence limits of maximum wind speed at the stations under study.
Figure 6 presents the maximum wind speed values observed across various return periods at the studied stations.
Maximum wind speed values for different return periods are shown based on the top-fitted distributions listed in Table 3.
In Figure 7, the histogram of computed maximum wind speed values for various return periods among the studied stations is presented.
The information presented in Table 3 and Figure 7 reveals that Ardabil station exhibits notable wind speeds, with maximum values increasing from 14.42 m/s at the 2-year return period to 27.49 m/s at the 100-year return period. In contrast, the Ardabil Airport station reports the lowest values throughout, starting at 8.53 m/s for the 2-year return period and reaching only 13.43 m/s at the 100-year return period, indicating a substantial difference of 14.06 m/s compared to Ardabil. Due to the limitation of the statistical period of the stations, in this study, wind speed values for long-term return periods have been avoided to avoid unstable estimates. For more accuracy in engineering analyses, only return periods up to 100 years have been investigated. It is suggested that in future studies, using combined or reconstructed data, longer return periods should be investigated to better meet the design needs of sensitive structures.
Bilesavar and Khalkhal stations demonstrate moderate wind speeds, with values that remain consistent but lower than those observed in Ardabil. Bilesavar shows maximum wind speeds ranging from 13.60 m/s for the 2-year return period to 21.22 m/s for the 100-year return period, while Khalkhal’s speeds are slightly higher, peaking at 21.15 m/s for the same return period. Notably, the differences between these stations and Ardabil are significant, particularly at higher return periods, where Bilesavar and Khalkhal lag behind by 6.27 m/s and 6.34 m/s, respectively.
Parsabad and Ardabil Airport exhibit the lowest wind speed values among all stations. Parsabad’s values range from 9.07 m/s at the 2-year return period to 15.91 m/s at the 100-year return period, while Ardabil Airport’s maximum is even lower. Ardabil consistently leads with the highest values, while Ardabil Airport records the lowest.

3.4. Implications and Future Research Directions

The examination of statistical distributions suitable for determining values during different periods of return helps to identify long-term changes and wind speed oscillation patterns and identify significant trends in it. In addition to engineering applications, these estimates are also important for risk analysis and management. Predicting maximum wind speeds during different return periods helps to make decisions on Crisis Management and design plans to reduce natural hazards, and plays a key role in reducing potential damage, especially in areas affected by seasonal winds or storms. Finally, using these estimates in urban planning and building standards improves infrastructure resilience to climate change and reduces economic losses and loss of life during strong winds. Information on maximum wind speeds is essential for weather services and weather warnings to prevent human and financial damage by predicting severe weather events. In future research it is necessary to examine the basic physical mechanisms that contribute to the observed changes in wind speed trends at synoptic stations in Ardabil, potentially involving advanced modeling techniques and high-resolution weather data to increase understanding of local influences. In addition, expanding the study and including a wider range of meteorological variables and their interactions could provide a more comprehensive assessment of the dynamics of maximum wind speeds, informing more effective climate adaptation strategies and risk management frameworks for extreme wind events in the region.

3.5. Limitations

The length of the data record significantly affects the accuracy of extreme value predictions in hydrometeorological analyses. Anghel [38] showed that shorter observational periods impact parameter estimates and quantiles, especially at low probabilities, with distributions like Gumbel being more sensitive. The study recommends L-moments for more stable parameter estimation in small samples. Soukissian and Tsalis [39] confirmed that L-moments outperform Maximum Likelihood (ML) for GEV parameter estimation when sample sizes are limited. Several studies stated that short samples can cause errors in parameter estimation, particularly for ML methods [39,40], thus favoring L-moments for limited data. Perrin et al. [41] and Devis-Morales et al. [42] suggest at least 30–35 years of data for reliable estimation of long return periods, though some studies find that 5–14 years may sometimes suffice [43]. Additionally, the Principle of Maximum Entropy (POME) has shown superior performance in predicting long-term quantiles compared to classical methods, especially for data with high variability [44].

4. Conclusions

The objective of this study was to determine the trend of daily maximum wind speed changes, fit different statistical distributions to the wind speed data, and estimate wind speed values within a topographically diverse region. Wind speeds at different stations show varying trends, with Meshgin-Shahr and Sareyn exhibiting a significant increasing trend over time. In contrast, Khalkhal shows a meaningful downward trend, while Ardabil, Parsabad, and Ardabil Airport demonstrate no significant changes in daily maximum wind speed. In conclusion, the analysis reveals that the Laplace (std) distribution is the best fit for the maximum wind speed data at Bilesavar, Sareyn, and Ardabil Airport, indicating consistent statistical characteristics across these stations. In contrast, Ardabil and Khalkhal are better represented by the Fisher–Tippett Type II mirrored distribution, indicating regional differences in wind speed behavior. This variation demonstrates the importance of tailored approaches in wind speed analysis, as different distributions may be more suitable depending on the specific station and its local conditions. Regarding the calculated maximum wind speed at different return periods, Ardabil station demonstrates significantly higher wind speeds compared to other stations, with values increasing from 14.42 m/s at the 2-year return period to 27.49 m/s at the 100-year return period, while Ardabil Airport shows the lowest values, ranging from 8.53 m/s to 13.43 m/s. The substantial differences in maximum wind speeds, particularly at higher return periods, indicate the distinct wind speed profiles across the synoptic stations in the region.

Author Contributions

Conceptualization, L.A. and R.M.; methodology, R.M.; software, L.A.; validation, R.M.; resources, R.M.; data curation, R.M.; writing—original draft preparation. L.A.; writing—review and editing; R.M.; visualization, L.A. and R.M.; supervision, R.M.; project administration, R.M. All authors have read and agreed to the published version of the manuscript.

Funding

This research received no external funding.

Data Availability Statement

All data generated or analyzed during this study are included in this published article.

Acknowledgments

We would like to express our sincere gratitude to the University of Mohaghegh Ardabili for the logistical support, which significantly contributed during the research work.

Conflicts of Interest

The authors declare no conflicts of interest.

References

  1. CAN/CSA-S6-06; Canadian Highway Bridge Design Code. Canadian Standards Association: Toronto, ON, Canada, 2006.
  2. Mo, H.M.; Hong, H.P.; Li, S.H.; Fan, F. Impact of annual maximum wind speed in mixed wind climates on wind hazard for mainland China. Nat. Hazards Rev. 2022, 23, 04021061. [Google Scholar] [CrossRef]
  3. Dubina, D.; Dinu, F. Reliability and Durability of Built Environment Under Impact of Climate Natural Hazards. In Proceedings of the 4th International Conference "Coordinating Engineering for Sustainability and Resilience" & Midterm Conference of CircularB “Implementation of Circular Economy in the Built Environment”, Timișoara, Romania, 29–31 May 2024; Springer Nature: Cham, Switzerland, 2024; pp. 20–36. [Google Scholar]
  4. Landberg, L. Short-term prediction of the power production from wind farms. J. Wind. Eng. Ind. Aerodyn. 1999, 80, 207–220. [Google Scholar] [CrossRef]
  5. WEPS. Wind Erosion Prediction System, Kansas State University. 1996. Available online: https://www.nrcs.usda.gov/sites/default/files/2023-01/WEPSUserGuide.pdf (accessed on 1 May 2025).
  6. Cornelis, W.M.; Gabriels, D. Optimal windbreaks design for wind-erosion control. J. Arid. Environ. 2005, 61, 315–332. [Google Scholar] [CrossRef]
  7. Lee, J.U.; Lee, K.H.; Kim, S.I.; Yook, D.S.; Ahn, S.M. Calculation of Wind Speeds for Return Period Using Weibull Parameter: A Case Study of Hanbit NPP Area. In Proceedings of the Transactions of the Korean Nuclear Society Spring Meeting, Jeju, Republic of Korea, 12–13 May 2016. [Google Scholar]
  8. De Freitas, N.C.; Silva, M.P.D.S.; Sakamoto, M.S. Wind speed forecasting: A review. Int. J. Eng. Res. Appl. 2018, 8, 4–9. [Google Scholar]
  9. Zakaria, N.H.; Salleh, S.A.; Asmat, A.; Chan, A.; Isa, N.A.; Hazali, N.A.; Islam, M.A. Analysis of wind speed, humidity and temperature: Variability and trend in 2017. IOP Conf. Ser. Earth Environ. Sci. 2020, 489, 012013. [Google Scholar] [CrossRef]
  10. Ranjbar, A.; Fattahi, E.; Rahimzadeh, F. Investigation of wind speed homogeneity in Iran meteorology stations. J. Meteorol. Atmos. Sci. 2018, 1, 146–162. [Google Scholar]
  11. Mazas, F. Extreme events: A framework for assessing natural hazards. Nat. Hazards 2019, 98, 823–848. [Google Scholar] [CrossRef]
  12. Li, C.Q.; Yang, W. Time-Dependent Reliability Theory and Its Applications; Elsevier: Amsterdam, The Netherlands, 2022. [Google Scholar]
  13. Gumbel, E.J. The return period of flood flows. Ann. Math. Stat. 1941, 12, 163–190. [Google Scholar] [CrossRef]
  14. Dukes, M.D.G.; Palutikof, J.P. Estimation of extreme wind speeds with very long return periods. J. Appl. Meteorol. Climatol. 1995, 34, 1950–1961. [Google Scholar] [CrossRef]
  15. Morton, I.D.; Bowers, J.; Mould, G. Estimating return period wave heights and wind speeds using a seasonal point process model. Coast. Eng. 1997, 31, 305–326. [Google Scholar] [CrossRef]
  16. Della-Marta, P.M.; Mathis, H.; Frei, C.; Liniger, M.A.; Kleinn, J.; Appenzeller, C. The return period of wind storms over Europe. Int. J. Climatol. A J. R. Meteorol. Soc. 2009, 29, 437–459. [Google Scholar] [CrossRef]
  17. Razali, A.M.; Sapuan, M.S.; Ibrahim, K.; Zaharim, A.; Sopian, K. Mapping of annual extreme wind speed analysis from 12 stations in Peninsular Malaysia. In Proceedings of the 9th WSEAS International Conference on System Science and Simulation in Engineering, Iwate, Japan, 4–6 October 2010; pp. 397–403. [Google Scholar]
  18. Lee, J.K.; Yook, D.; Lee, K.J.; Yun, J.I.; Beeley, P.A. Weibull parameter calculation and estimation of directional and seasonal wind speeds for the return period: A case study in the Barakah NPP area. Ann. Nucl. Energy 2015, 80, 62–69. [Google Scholar] [CrossRef]
  19. Ekhtesasi, M.R.; Ghaeminia, A.M. Mapping of possible maximum wind speed at different return periods in the central part of Iran. Desert Ecosyst. Eng. 2022, 6, 49–58. [Google Scholar]
  20. Moradi, M. Investigation of return period annual fastest wind speed in Bushehr stations. J. Clim. Res. 2019, 1397, 31–42. [Google Scholar]
  21. Deng, T.; Fu, J.; Zheng, Q.; Wu, J.; Pi, Y. Performance-based wind-resistant optimization design for tall building structures. J. Struct. Eng. 2019, 145, 04019103. [Google Scholar] [CrossRef]
  22. Cao, S. Strong winds and their characteristics. In Advanced Structural Wind Engineering; Springer: Tokyo, Japan, 2013; pp. 1–25. [Google Scholar]
  23. Palutikof, J.P.; Brabson, B.B.; Lister, D.H.; Adcock, S.T. A review of methods to calculate extreme wind speeds. Meteorol. Appl. 1999, 6, 119–132. [Google Scholar] [CrossRef]
  24. Ahmadi, M.; Baaghide, M.; Dadashi Roudbari, A.; Asadi, M. Modeling the role of topography on the potential of tourism climate in Iran. Model. Earth Syst. Environ. 2018, 4, 13–25. [Google Scholar] [CrossRef]
  25. Ghafari, S.; Ghorbani, A.; Moameri, M.; Mostafazadeh, R.; Bidarlord, M. Composition and structure of species along altitude gradient in Moghan-Sabalan rangelands, Iran. J. Mt. Sci. 2018, 15, 1209–1228. [Google Scholar] [CrossRef]
  26. Mehri, S.; Mostafazadeh, R.; Esmaliouri, A.; Ghorbani, A. Spatial and Temporal Variations of Base Flow Index (BFI) for the Ardabil Province river, Iran. J. Earth Space Phys. 2017, 43, 623–634. [Google Scholar] [CrossRef]
  27. Gimechi, S.; Mostafazadeh, R.; Alimohamadian, L. Analysis of extreme precipitation trends and probability distributions across return periods in northwest Iran. Geogr. časopis/Geogr. J. 2025, 77, 43–55. [Google Scholar] [CrossRef]
  28. Carta, J.A.; Ramirez, P.; Velazquez, S. A review of wind speed probability distributions used in wind energy analysis: Case studies in the Canary Islands. Renew. Sustain. Energy Rev. 2009, 13, 933–955. [Google Scholar] [CrossRef]
  29. Liang, Y.; Wu, C.; Zhang, M.; Ji, X.; Shen, Y.; He, J.; Zhang, Z. Statistical modelling of the joint probability density function of air density and wind speed for wind resource assessment: A case study from China. Energy Convers. Manag. 2022, 268, 116054. [Google Scholar] [CrossRef]
  30. Mostafazadeh, R.; Mehri, S. Trends in variability of flood coefficient in river gauge stations of Ardabil province, Iran. J. Watershed Manag. Res. 2018, 9, 82–95. [Google Scholar] [CrossRef]
  31. Kisi, O.; Ay, M. Comparison of Mann–Kendall and innovative trend method for water quality parameters of the Kizilirmak River, Turkey. J. Hydrol. 2014, 513, 362–375. [Google Scholar] [CrossRef]
  32. Barzegari, H.; Gandomkar, A.; Abbasi, A. Correlation between the average temperature of the Abargu-Sirjan Basin and the teleconnection patterns from the Atlantic Ocean. Water Soil Manag. Modell. 2023, 3, 270–285. [Google Scholar]
  33. Chattopadhyay, G.; Chakraborthy, P.; Chattopadhyay, S. Mann–Kendall trend analysis of tropospheric ozone and its modeling using ARIMA. Theor. Appl. Climatol. 2012, 110, 321–328. [Google Scholar] [CrossRef]
  34. Esgandari, R.; Esmali Ouri, A.; Mostafazadeh, R.; Choobeh, S. Assessment of temporal and spatial variations of precipition climate extreme indexes in the central part of Ardabil province. J. Environ. Sci. Stud. 2024, 9, 8119–8133. [Google Scholar]
  35. Atroosh, K.B.; Moustafa, A.T. An estimation of the probability distribution of Wadi Bana flow in the Abyan Delta of Yemen. J. Agric. Sci. 2012, 4, 80. [Google Scholar] [CrossRef]
  36. Oosterbaan, R.J. Software for generalized and composite probability distributions. Int. J. Math. Comput. Methods 2019, 4, 1–19. [Google Scholar]
  37. Mostafazadeh, R.; Pourganji, Z.; Esfandiari Darabad, F.; Aghaie, M. Change in flood hydrograph response due to variable precipitation amount during different return periods in Namin watershed. J. Environ. Sci. Stud. 2023, 8, 5869–5882. [Google Scholar]
  38. Anghel, C.G. Revisiting the use of the Gumbel distribution: A comprehensive statistical analysis regarding modeling extremes and rare events. Mathematics 2024, 12, 2466. [Google Scholar] [CrossRef]
  39. Soukissian, T.H.; Tsalis, C. Effects of parameter estimation method and sample size in metocean design conditions. Ocean. Eng. 2018, 169, 19–37. [Google Scholar] [CrossRef]
  40. Katz, R.W.; Parlange, M.B.; Naveau, P. Statistics of extremes in hydrology. Adv. Water Resour. 2002, 25, 1287–1304. [Google Scholar] [CrossRef]
  41. Perrin, O.; Rootzén, H.; Taesler, R. A discussion of statistical methods used to estimate extreme wind speeds. Theor. Appl. Climatol. 2006, 85, 203–215. [Google Scholar] [CrossRef]
  42. Devis-Morales, A.; Montoya-Sánchez, R.A.; Bernal, G.; Osorio, A.F. Assessment of extreme wind and waves in the Colombian Caribbean Sea for offshore applications. Appl. Ocean. Res. 2017, 69, 10–26. [Google Scholar] [CrossRef]
  43. Panchang, V.; Zhao, L.; Demirbilek, Z. Estimation of extreme wave heights using GEOSAT measurements. Ocean. Eng. 1998, 26, 205–225. [Google Scholar] [CrossRef]
  44. Singh, V.P.; Guo, H. Parameter estimation for 2-parameter log-logistic distribution (LLD2) by maximum entropy. Civ. Eng. Syst. 1995, 12, 343–357. [Google Scholar] [CrossRef]
Figure 1. Location of the study area and synoptic stations in northwest Iran. The blue areas at the top and bottom of the left-hand figure represent the Caspian Sea and the Persian Gulf, respectively.
Climate 13 00138 g001
Figure 2. PDF and CDF charts of the maximum daily wind speed data at the synoptic stations in Ardabil Province. Red line = CDF (Cumulative Distribution Function), Green line = PDF (Probability Density Function).
Climate 13 00138 g002
Figure 3. Trend charts of daily maximum wind speed data at the synoptic stations in Ardabil Province. The trend lines for different stations are presented in various colors. The hard lines represent the trend of the data, while the soft lines indicate the variations in the annual data values.
Climate 13 00138 g003
Figure 4. The frequency histograms of maximum daily wind speed at the studied stations. (a) Ardabil, (b) Bilesavar, (c) Parsabad, (d) Khalkhal, (e) Sareyn, (f) Ardabil Airport, (g) Meshgin-Shahr.
Climate 13 00138 g004
Figure 5. Cumulative distributions and confidence limits for maximum wind speed data at the studied stations. (a) Ardabil, (b) Bilesavar, (c) Parsabad, (d) Khalkhal, (e) Sareyn, (f) Ardabil Airport, (g) Mesh-gin-Shahr.
Climate 13 00138 g005
Figure 6. Maximum wind speed values across different return periods at the studied stations. (a) Ardabil, (b) Bilesavar, (c) Parsabad, (d) Khalkhal, (e) Sareyn, (f) Ardabil Airport, (g) Mesh-gin-Shahr.
Climate 13 00138 g006aClimate 13 00138 g006b
Figure 7. The histogram of computed maximum wind speed values for various return periods in the studied stations.
Climate 13 00138 g007
Table 1. Statistical characteristics of the maximum wind speed data of synoptic stations under study in Ardabil Province.
Stat/StationArdabilArdabil AirportBilesavarParsabadKhalkhalSareynMeshgin-Shahr
Recording Period1976–20182004–20182004–20181984–20181987–20182003–20181995–2018
Available period (years)43151535321624
Mean15.1013.9912.589.208.7814.0816.37
Standard Error0.460.510.540.370.310.550.56
Median14.3813.8012.409.508.6913.9116.06
Mode11.8013.0012.4010.137.0016.2015.88
Standard Deviation2.991.982.082.211.742.192.77
Sample Variance8.923.924.344.883.034.827.65
Kurtosis−0.461.310.28−0.530.980.368.93
Skewness0.711.060.140.341.000.132.29
Minimum11.0010.889.005.756.2510.2011.86
Maximum22.0018.6017.0014.2013.6018.8026.88
Table 2. Ranking of fitted statistical distributions and cumulative frequency differences for maximum wind speed data at synoptic stations.
RankArdabilAbs Diff (%)BilesavarAbs Diff (%)ParsabadAbs Diff (%)KhalkhalAbs Diff (%)SareynAbs Diff (%)Ardabil AirportAbs Diff (%)Meshgin-ShahrAbs Diff (%)
1Fisher–
Tippett T2 mirrored
2.52Laplace std3.50Gamma (Erlang) 3.29Log-normal opt.3.20Laplace std2.78Laplace std3.83Log-normal opt.2.98
2Generalized exp. (Poisson type) 2.62Generalized normal 3.77Root-normal opt.3.31Fisher–
Tippett T2
3.39Logistic3.65GEV3.87Generalized logistic3.04
3Burr generalized2.72Logistic3.87Generalized normal 3.33Gumbel generalized3.40Generalized logistic3.71Mirrored Weibull4.90Laplace std3.23
4GEV3.01Generalized logistic3.89Fisher–Tippett T33.34Mirrored Weibull3.47Cauchy3.72Fisher–Tippett T2 mirrored4.92Root-normal opt.3.44
5Gumbel generalized3.24Log-logistic4.13Log-normal opt. 3.40Fisher–Tippett T2 mirrored3.49Log-logistic3.78Log-normal opt.4.98Generalized Cauchy4.26
6Mirrored Weibull3.25Normal
opt.
4.16Gompertz generalized3.42Gumbel3.49Generalized Cauchy3.89Gumbel5.33Log-normal std.4.43
7Fisher–
Tippett T2
3.25Fisher–Tippett T2 mirrored4.18Normal opt.3.43Fisher–
Tippett T3
3.49Gumbel generalized3.90Fisher–
Tippett T3
5.33Normal opt.4.46
8Gumbel3.32Weibull4.19Fisher–Tippett T2 mirrored3.44Log-normal std.3.51Normal
opt.
3.90Log-normal std.5.60Cauchy4.52
9Fisher–
Tippett T3
3.32Normal std.4.25Gumbel
generalized
3.45Log-normal3.55Normal std3.97Log-logistic5.74GEV5.20
10Log-normal opt.3.35Gompertz generalized4.28Dagum generalized3.48GEV3.78Generalized normal 4.01Root-normal opt.6.05Log-logistic5.67
11Gamma (Erlang) 4.15Gumbel generalized 4.28Logistic4.68Burr generalized3.90Fisher–Tippett T34.03Fisher–Tippett T2 mirrored6.07Fisher–Tippett T2 mirrored5.97
12Log-logistic4.19Generalized Cauchy 4.37Generalized logistic3.69Root-normal opt.3.97Root-normal opt.4.03Cauchy6.38Normal std.6.27
13Root-normal opt.4.31Fisher–Tippett T34.38Weibull3.75Generalized logistic4.05Student 2 d.f.4.17Generalized exp. (Poisson type) 6.46Fisher-
Tippet T2
6.62
14Log-normal std.4.40Root-normal opt.4.39Log-logistic3.88Generalized exp. (Poisson type) 4.11Fisher–Tippett T2 mirrored4.18Burr generalized6.53Mirrored Weibull6.64
15Gompertz generalized4.68Cauchy4.41GEV3.89Laplace std4.47Gompertz generalized4.22Normal opt.6.59Gumbel7.70
Table 3. Maximum wind speed values in m/s for various return periods based on the best-fitted distributions at Ardabil synoptic stations.
Station/Return Period25102550100
Ardabil 14.4217.9220.3123.2825.4227.49
Bilesavar13.6015.6016.7318.5219.8721.22
Parsabad9.0711.3312.6014.0415.0115.91
Khalkhal12.5614.5716.0918.1019.6221.15
Sareyn14.1015.9417.3419.1820.5821.98
Ardabil Airport8.5310.0510.951212.7313.43
Meshgin-Shahr16.1717.6517.3719.1119.5819.99
Disclaimer/Publisher’s Note: The statements, opinions and data contained in all publications are solely those of the individual author(s) and contributor(s) and not of MDPI and/or the editor(s). MDPI and/or the editor(s) disclaim responsibility for any injury to people or property resulting from any ideas, methods, instructions or products referred to in the content.

