Article

Climate Evolution of Agricultural and Natural Areas of Southeastern Europe According to Pinna, Johansson and Kerner Climate Indices

by
Ioannis Charalampopoulos
* and
Fotoula Droulia
Laboratory of General and Agricultural Meteorology, Department of Crop Science, Agricultural University of Athens, 11855 Athens, Greece
*
Author to whom correspondence should be addressed.
Climate 2025, 13(6), 121; https://doi.org/10.3390/cli13060121 (registering DOI)
Submission received: 14 April 2025 / Revised: 23 May 2025 / Accepted: 6 June 2025 / Published: 9 June 2025

Abstract

:
The Southeastern European territory is under severe climatic pressure owing to accelerating dry–thermal trends. The present survey illustrates the spatial and temporal evolution of the climate regime over the natural and agricultural landcover of South-eastern Europe and individual countries (Albania, Bosnia Herzegovina, Bulgaria, Croatia, Greece, N. Macedonia, Montenegro, Romania, Serbia, and Slovenia). For this purpose, a high spatial resolution of the Johansson Continentality index, the Kerner Oceanity index and the Pinna Combinative index was first estimated over two climatic periods (1964–1993; 1994–2023). The Johansson index depicts increasing continentality over the southern and eastern regions, majorly by the spatiotemporal expansion of the Continental climate over the agricultural and natural areas of Bulgaria (respectively, from 49.9% to 73.7% and from 13.3% to 36.8%) followed by Serbia, Romania, and Greece. The Kerner index illustrates increasing continentality over most of the study area owing to the spatiotemporal increase in the Sub-Continental climate type over the agricultural and the natural regions of Bosnia Herzegovina (from 68.6% to 84% and from 41.4% to 63.2%), N. Macedonia, Slovenia and the natural areas of Croatia and Serbia. The extension of the Continental over the agricultural and natural areas of Romania is also shown. The Pinna index exhibits an increasing aridity trend, which is more intense in the central and eastern regions. This trend is demonstrated by the higher distribution of the Semi-Dry in the second period mostly over the agricultural and natural areas of Bulgaria (2.4% to 23.1% and 0.7% to 5.8%), and a remarkable expansion of the Moderate Wet climate over both area types of Romania (from 3.3% to 44.8% and from 5.6% to 15.2%) and Bosnia Herzegovina (from 13.7% to 33.5% and from 3.5% to 13.2%). This study’s results highlight the necessity for intensifying adaptation plans and actions aiming at the feasibility of agricultural practices and the conservation of natural areas.

1. Introduction

In universal comparison, the European continent demonstrates significantly faster warming trends [1]. According to the European Environment Agency [2], the average temperature in Europe has risen by 1.5 °C between 2006 and 2015, while land temperatures have increased over the 2013–2023 period by 2.1 to 2.2 °C. Concurrently, precipitation patterns across Europe exhibit a general increase in total precipitation with wetter conditions in northern Europe but also a significant decline in total precipitation and an intensified shift, especially since the 1980s, towards a drier climate over the southern regions [3,4,5,6,7]. Overall, during the past 6 decades, the southern and eastern parts of Europe have exhibited a notable tendency for drying, especially in summer and autumn [4].
As a result, the rise in warm temperature extremes (1.9% per decade), decrease in cold temperature extremes, significant increasing trend of extreme drought (3.8% per decade), and increased tendency of extreme precipitation over the Europe-Mediterranean region have been recorded in approximately the last 40-year period [8]. In recent decades, upward trends in aridity have been highlighted and accompanied by widespread droughts throughout Europe [9,10,11], which have generated complications in critical socio-economic sectors (e.g., water resources, agriculture, and industry) [12], amplifying the potential for sociopolitical and economic disruption in the future [13].
Future projections for Europe for the 2050s will describe an increase in the mean annual air temperature up to 2.5 °C and the trends towards drought. The precipitation range is expected between 142 and 3487 mm (vs. 162–3552 mm for the 2020s). In comparison, the annual evapotranspiration is projected to increase by 534 mm, with high annual values (>700 mm) identified for southern Europe. A northward extension of dry and arid European territories (e.g., southern and eastern Europe and particularly of the Hellenic peninsula, Romania, and Bulgaria) is also foreseen by the end of the 21st century, demonstrating thus, severe consequences on water resources [14,15,16].
Climate indices arise as indispensable means of spatial distribution description (mapping) of various climate types and of aridization status demonstration (e.g., aridity–humidity, continentality–oceanicity, or oceanity). The spatial distribution of the climate indices, in general, indicates the degree of wetness/dryness of a specific region’s climate along with its humidity/aridity. By exploiting the climate indices, the aridity and oceanic continentality may be defined [14]. The indices for climate identification have been successfully utilized both at the local and regional scales of south and southeast Europe [17,18,19,20]. Thus, the climate indices contribute to the current and future climate evolution investigations and the determination of the water resources regime and management [21,22,23,24,25,26].
Typical parameters associated with the variation in climate indices include geomorphology or the terrain, principally relief units (e.g., Mountains chains, plains, and hilly areas) and vast land masses or aqueous surfaces (e.g., oceans). Regarding Europe, the Atlantic Ocean majorly impacts the western part of the continent in terms of humidity, whereas the eastern part is characterized by intense continentality characteristics [19]. The Mediterranean predominantly influences the southern part of Europe. Air movement over the North Atlantic Ocean and the European continent, in conjunction with its orography, strongly influences the formation of the different climate types across Europe [14].
Aridity is the degree to which a climate lacks effective, life-promoting moisture (opposite of humidity, in the climate sense of the term) [27]. It is a climatic phenomenon due to the water deficit, adversely affecting global economic and non-economic sectors. Aridity alterations may significantly impact agriculture [22,23,28,29,30,31,32], natural vegetation formations [7,33,34,35], water management, and particularly the accessible water supplies, which consecutively influence ecosystem services, environmental vitality, human survival, and the overall societal, economic progress [31,36,37,38,39,40,41,42].
By accounting for the above, the employment of indices for the investigation of aridity rises as a fundamental necessity [43]. Aridity indexing comprises a simple way to describe the ratio of precipitation to temperature; it is highly effective for climate characterization, the assessment of areas vulnerable to desertification processes, but also for the investigation of past, present, and future aridity trends [44,45,46,47,48,49,50]. Several numerical indices have been proposed to quantify the degree of dryness and the aridity trend over local (e.g., Iaşi County—Romania, Vojvodina—Serbia), regional areas of interest (e.g., Europe, central and Southern Pannonian Basin, northwestern Serbia, and southern Bulgaria) [26,51,52,53,54,55,56] and on a global level [57].
Among standard aridity indices, the Pinna Combinative index (PINNA) [58] is an aridity–humidity index [17] applied to classify the climate in tropical and subtropical regions in Southern Europe [59]. It combines the de Martonne index (aridity–humidity index revealing the degree of moisture at the local scale) with the application of the total precipitation and the mean air temperature of the driest month of the year [19]. More specifically, it is calculated based on the annual amount of precipitation, the mean annual surface temperature, and the precipitation and air temperature of the driest month, providing annual aridity [51,60]. The PINNA best describes the areas and the seasons where irrigation is necessary and exhibits high applicability in the seasons deprived of irrigation [61], provides more focus on the aridity intensity, and makes the spatial comparison more meaningful [19].
The continentality term corresponds to the degree to which a point on the earth’s surface is subject to the impact of a landmass [62]. It describes climate conditions and their abrupt repercussions (extreme meteorological phenomena) [62]. Continentality is influenced by atmospheric circulation, the properties of the underlying surface, and the amplitude of the annual incoming solar radiation. Commonly, continentality is estimated by the daily temperature range or the difference between the average temperature values of the warmest and coldest months. Given that the latter increases with latitude, the fraction of the annual amplitude of the surface air temperature and the sine of latitude constitutes a convenient measure [62,63,64].
Continental climate conditions have been investigated for the description of climatic changes and the investigation of temporal regularities of continentality considering circulation factors, on a global level, over the mid and high latitudes of the Northern Hemisphere and over the entire and major parts of the European territory (e.g., central Europe) [65,66,67,68]. European country-level surveys on continentality have focused on climatic fluctuations and temporal changes (e.g., over Czechia, Slovakia) [69,70]. In the company of popular continentality indices, the Johansson Continentality index (JCI) is included in the vast category of thermal continentality indices [71] and represents a variant of the Gorczyński index, which has been adapted to better fit a specific region [72]. The index has been effectively applied to the climate distinction between continental and oceanic climates around the world [73,74,75]. Its reliability extends to regional, e.g., applications over Southeastern Europe [19,20], on the country level [21], and on local scale investigations [76], where it has demonstrated adequate characterizations of continentality gradients [73].
The Oceanicity (or Oceanity, Maritimity) describes the degree to which a point on the earth’s surface is in all respects subject to the influence of the sea and corresponds to the opposite term of continentality [19,77]. The Kerner Oceanity index (KOI) demonstrates a thermoisodynamic fraction of annual thermal amplitude (A) and spring–autumn thermal inertia, which has been developed upon the fact that marine (or maritime) climates are characterized by warmer autumn months as compared with spring months [17,19,78]. Small or negative KOI values express high continentality, whereas high values correspond to marine climate conditions [17]. The index is feasible in regions with distinct seasonal air temperature alterations [66]. It has been applied in local [17,78,79] and regional investigations [19,66,73,80] on climate classification, climate alterations, and variability of aridity. Its significance has also been highlighted in investigating the impact of coupled ocean-atmosphere phenomena, e.g., the ENSO (El Niño–Southern Oscillation) and the Indian Ocean Dipole (IOD) [80].
Overall, the utilization of knowledge on the aridization regime of an area, based on continentality and oceanicity characteristics, endorses the determination of the ecological risks and environmental restraints, allowing thus, sustainable nature management strategies in solving critical repercussions [81,82].
Considering that the Southern European region experiences the strongest warming temperature trends [83], the tripling of days with extreme heat and heat stress and the warming of hot extremes (by 2.3 °C on average across Europe from 1950 to 2018) [84], it becomes evident that the determination of the aridization status by estimations of the aridity–humidity and continentality–oceanity degree and trends over critical time periods and regions is considered crucial. It is highlighted that apart from very limited surveys on aridization at more extended spatial scales, e.g., over Southeastern Europe and entire Europe [14,19,20], the majority of investigations refer to small areas in Southeastern Europe. In addition, agriculture and natural landscape viability rely on environmental conditions, and corresponding climate indices originate as indispensable tools for mapping potentially susceptible regions and regions already prone to extreme weather incidents.
In view of the above pivotal issues, the present investigation aims at illustrating the spatiotemporal evolution of climate indices, the Pinna combinative index (PINNA), the Johansson Continentality index (JCI), and the Kerner Oceanity index (KOI), over Southeastern Europe and individual countries (Albania: AL, Bosnia Herzegovina: BA, Bulgaria: BG, Croatia: HR, Greece: EL, N. Macedonia: MK, Montenegro: ME, Romania: RO, Serbia: RS and Slovenia: SI) during two timeframes reflecting the earlier and recent past (p1: 1964–1993 and p2: 1994–2023, respectively). Within the above concept, there is a lack of relative research information with reference to the agricultural and natural areas of individual countries included in the territory of interest. Thus, in the present study, the specific indices’ exploitation outcomes may serve as valuable enlightenment for climate change surveys, agricultural and natural landscape sustainability, and water resource management.

2. Materials and Methods
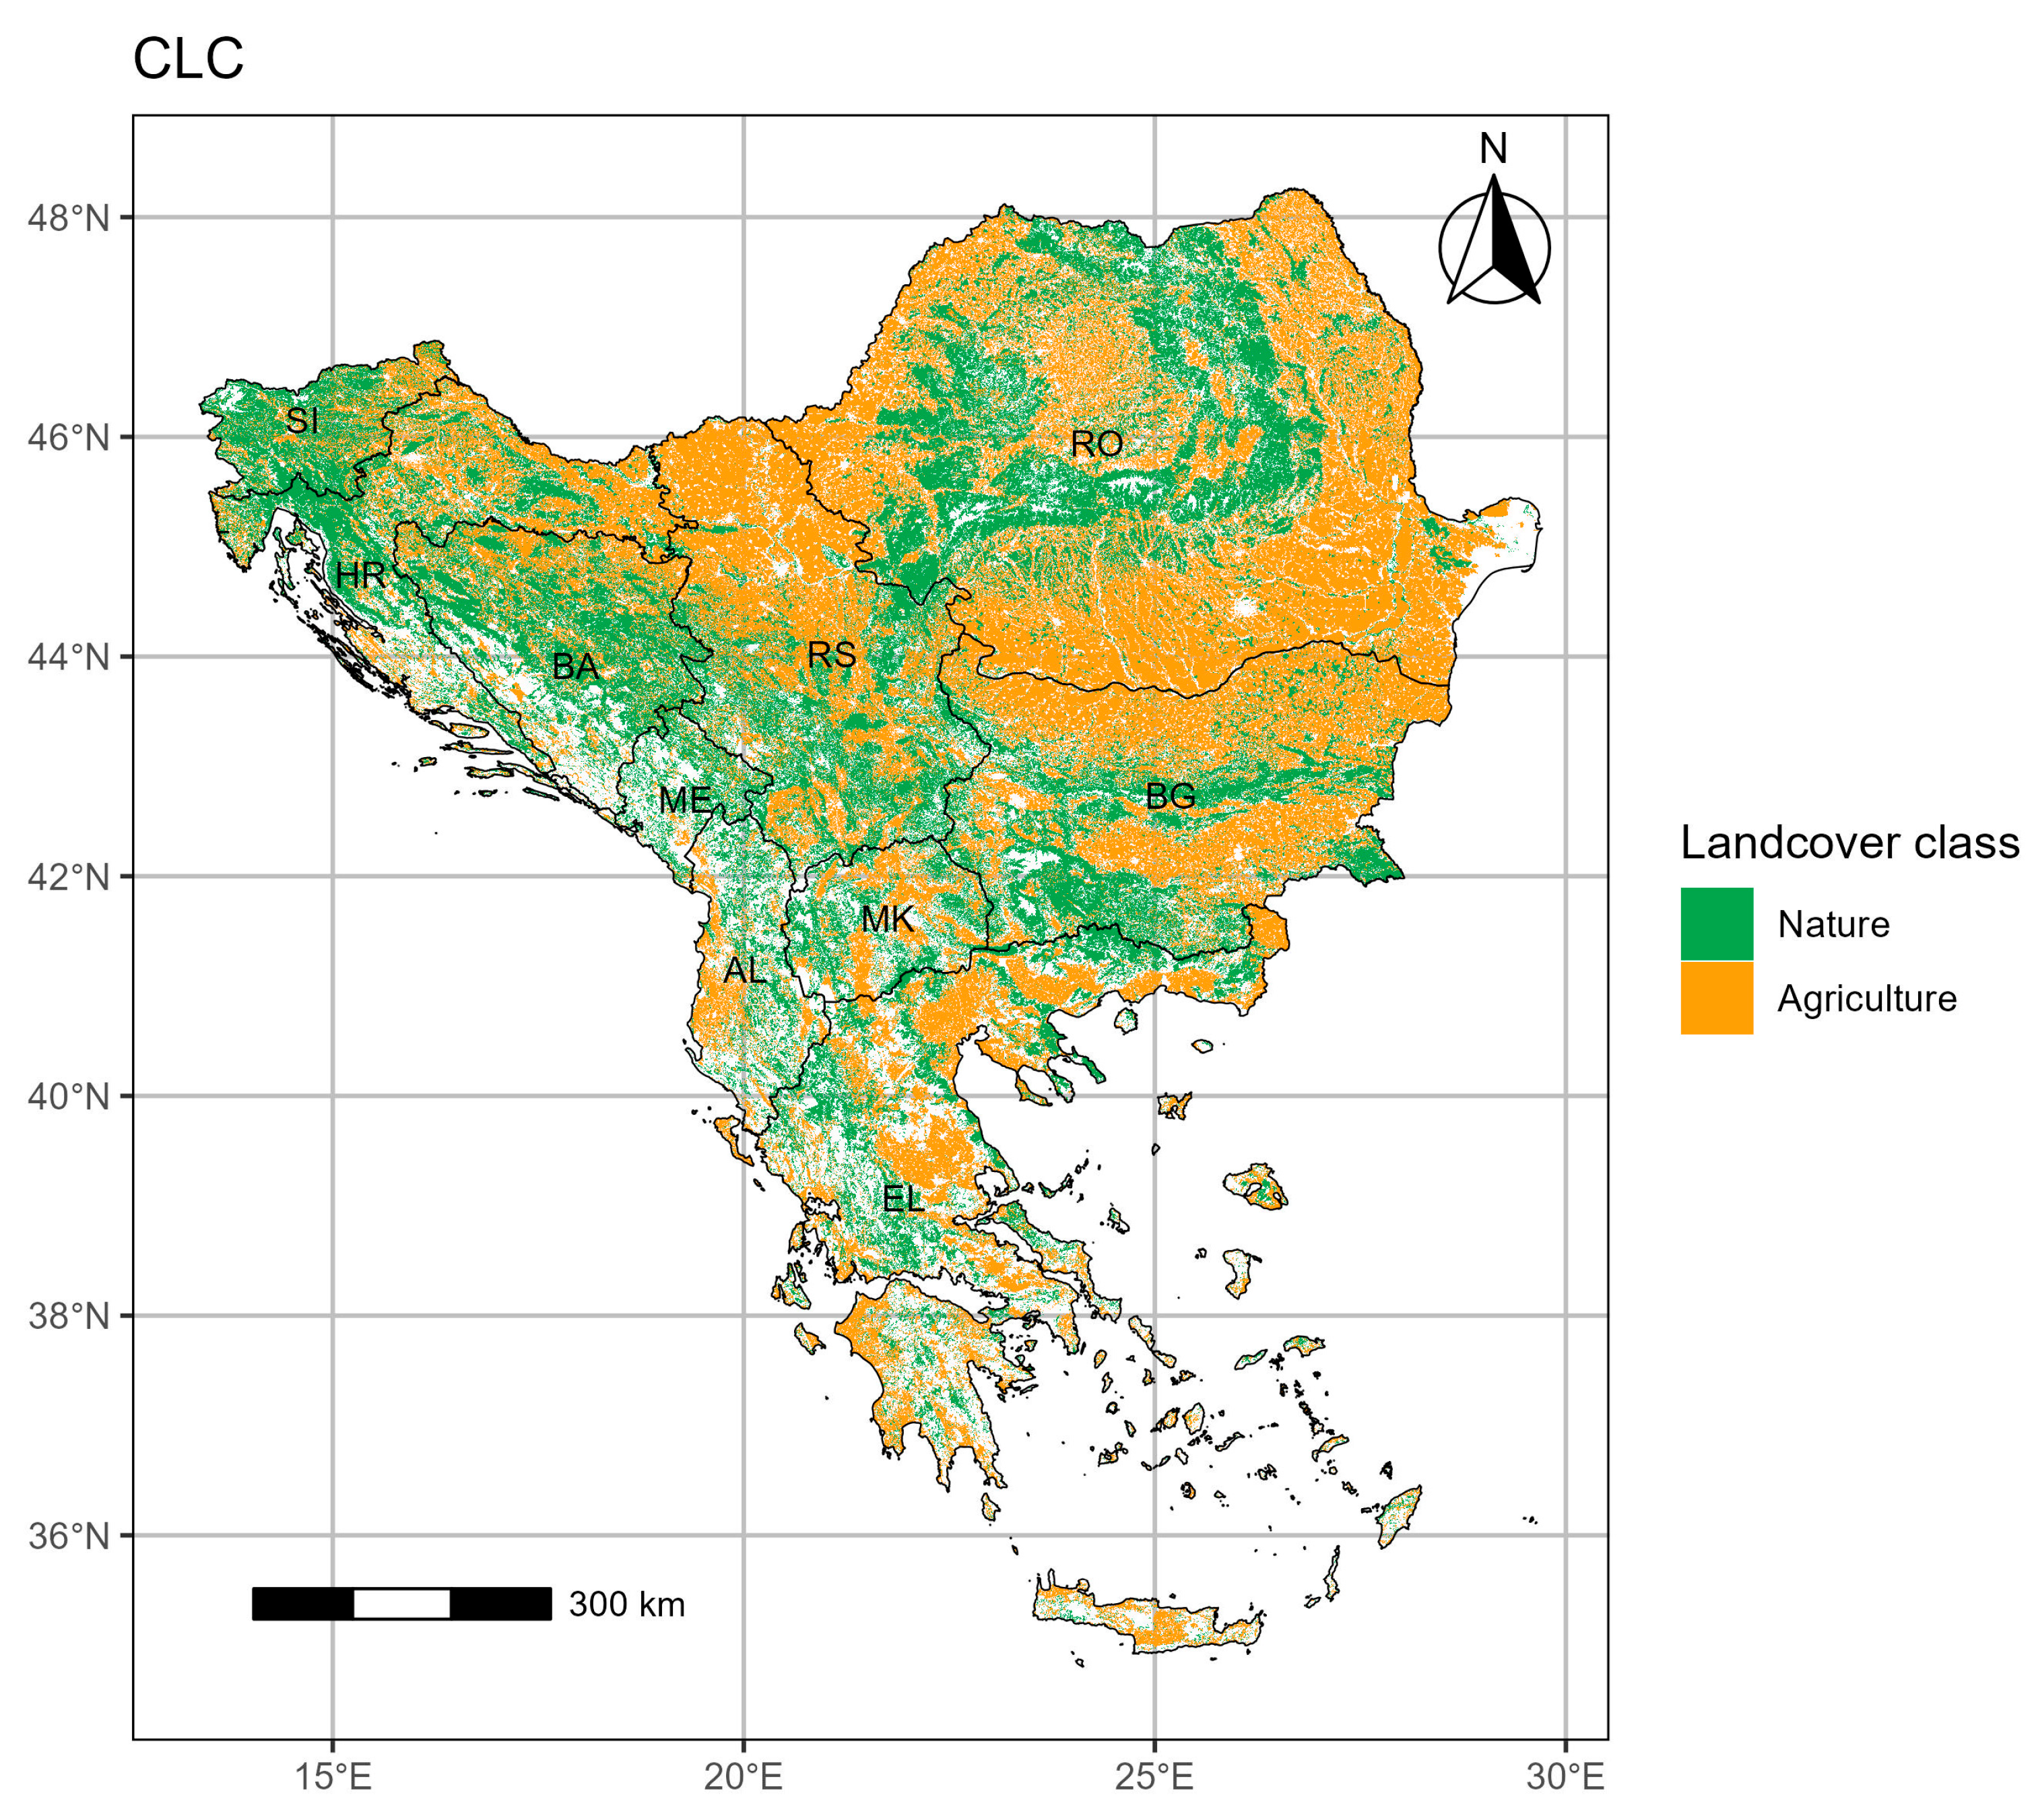
2.1. Study Area

The study area (Figure 1) includes the countries of the Balkans peninsula (Albania, Bosnia Herzegovina, Bulgaria, Croatia, Greece, N. Macedonia, Montenegro, Romania, Serbia and Slovenia) which is the northeastern part of the Mediterranean basin. As we can see from the CORINE land cover (2018) generalized map (Figure 1), the study area is covered almost evenly by agricultural and natural land. The study area selection reflects the high interest in the climatic variability of this region in terms of ecology and agricultural productivity.

2.2. Data and Methods

The present survey is based on the ERA5-Land [85] high-spatial-resolution (~9 km) reanalysis dataset (link: https://cds.climate.copernicus.eu/datasets/reanalysis-era5-land?tab=overview, accessed on 21 May 2025). Generally, we can describe this as an evolution of the ERA5 [86] dataset, which directly assimilates satellite observations from ground meteorological stations along with a modified version of the ECMWF weather prediction model. The ERA5-Land has hourly temporal resolution and serves parameters related to precipitation, radiation, air temperature, wind speed, and surface-level air pressure. It is one of the niche datasets and has been used for several studies focused on environmental conservation, agricultural applications, human health, urban environment, and more [86,87,88,89,90,91]. As mentioned above, the climatic periods we used for this study is p1: 1964–1993 and p2: 1994–2023 because we need to compare climatic periods (30 years of data).
To evaluate the climatic evolution of the Balkans area have been selected three indices the Johansson Continentality index (JCI), the Kerner Oceanicity index (KOI), and the Pinna Combinative index (PINNA). The above selection has been made considering that those indices can effectively capture the key climate dimensions of aridity–humidity and continentality–oceanicity, relevant to the dry–thermal trends in Southeastern Europe. These indices have successfully addressed the research gap concerning high-resolution climate evolution in agricultural and natural areas over recent critical periods.

2.2.1. The Johansson Continentality Index

The core concept of the index is the measure of the continent’s influence on climatic formation, and it has been applied in several climatic studies [17,92]. The JCI calculation formula is the following:
JCI = 1.7   ×   A sin φ 20.4
where A is the annual temperature range (Mean air temperature of the warmest month minus the mean air temperature of the coldest month), and φ is the latitude in radians. The range of JCI classes are presented in Table 1.

2.2.2. The Kerner Oceanity Index (KOI)

The second calculated index refers to oceanity (a complemented feature of continentality), and its formula is:
KOI = 100 ( T o T a ) A
where To is the mean air temperature of October, Ta is the mean air temperature of April, and the symbol A represents the annual temperature range [19,21] (KOI categories in Table 2).

2.2.3. The Pinna Combinative Index (PINNA)

The most demanding climatic index in terms of data and calculations is the Pinna Combinative index [17,19], which is a fraction of precipitation and air temperature according to the following formula:
PINNA = 1 2 P T + 10 + 12 P d T d + 10
when P is the annual precipitation, Pd is the precipitation of the driest month, T is the annual mean air temperature, and Td is the mean air temperature of the driest month of the year. This index is similar to the De Martonne index enriched by the driest month’s conditions, and its classification is described in Table 3.
Data management, along with the spatial calculations of the indices and the related statistics, have been made by R language scripts and terra and Tidyverse R packages [93,94,95]. The most demanding part of the calculations pipeline was identifying and mapping the driest month of the study area.

3. Results

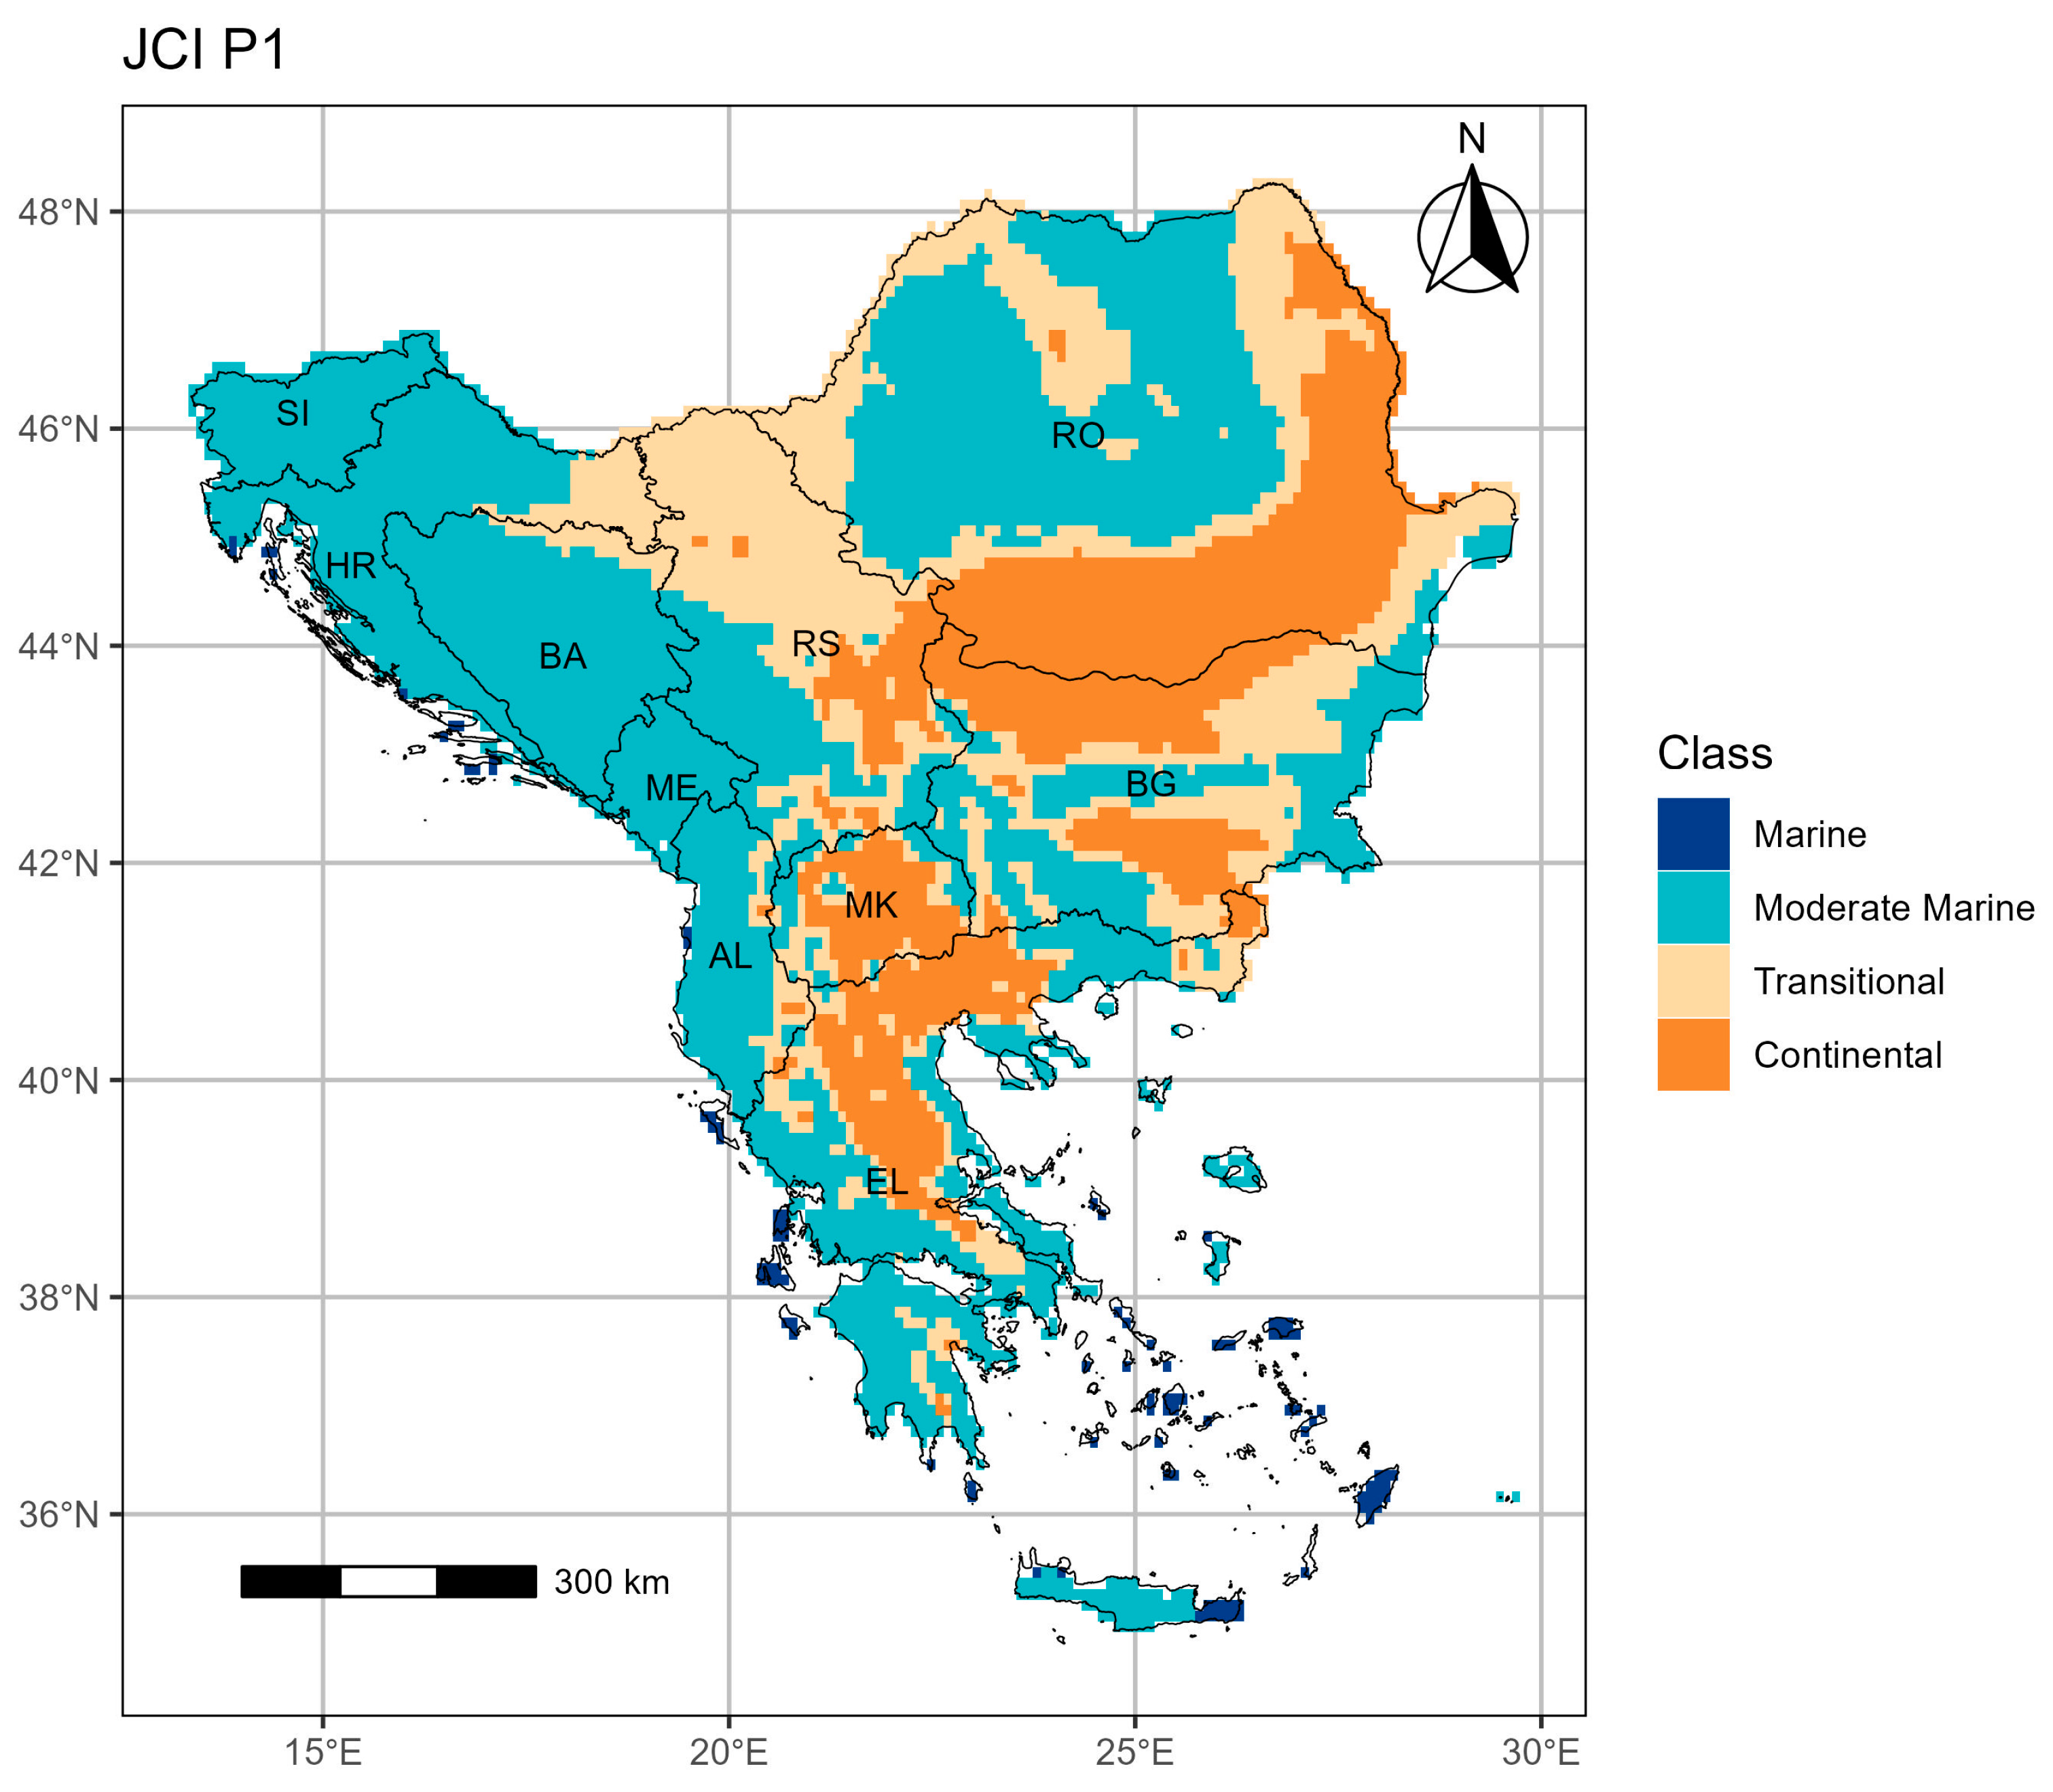
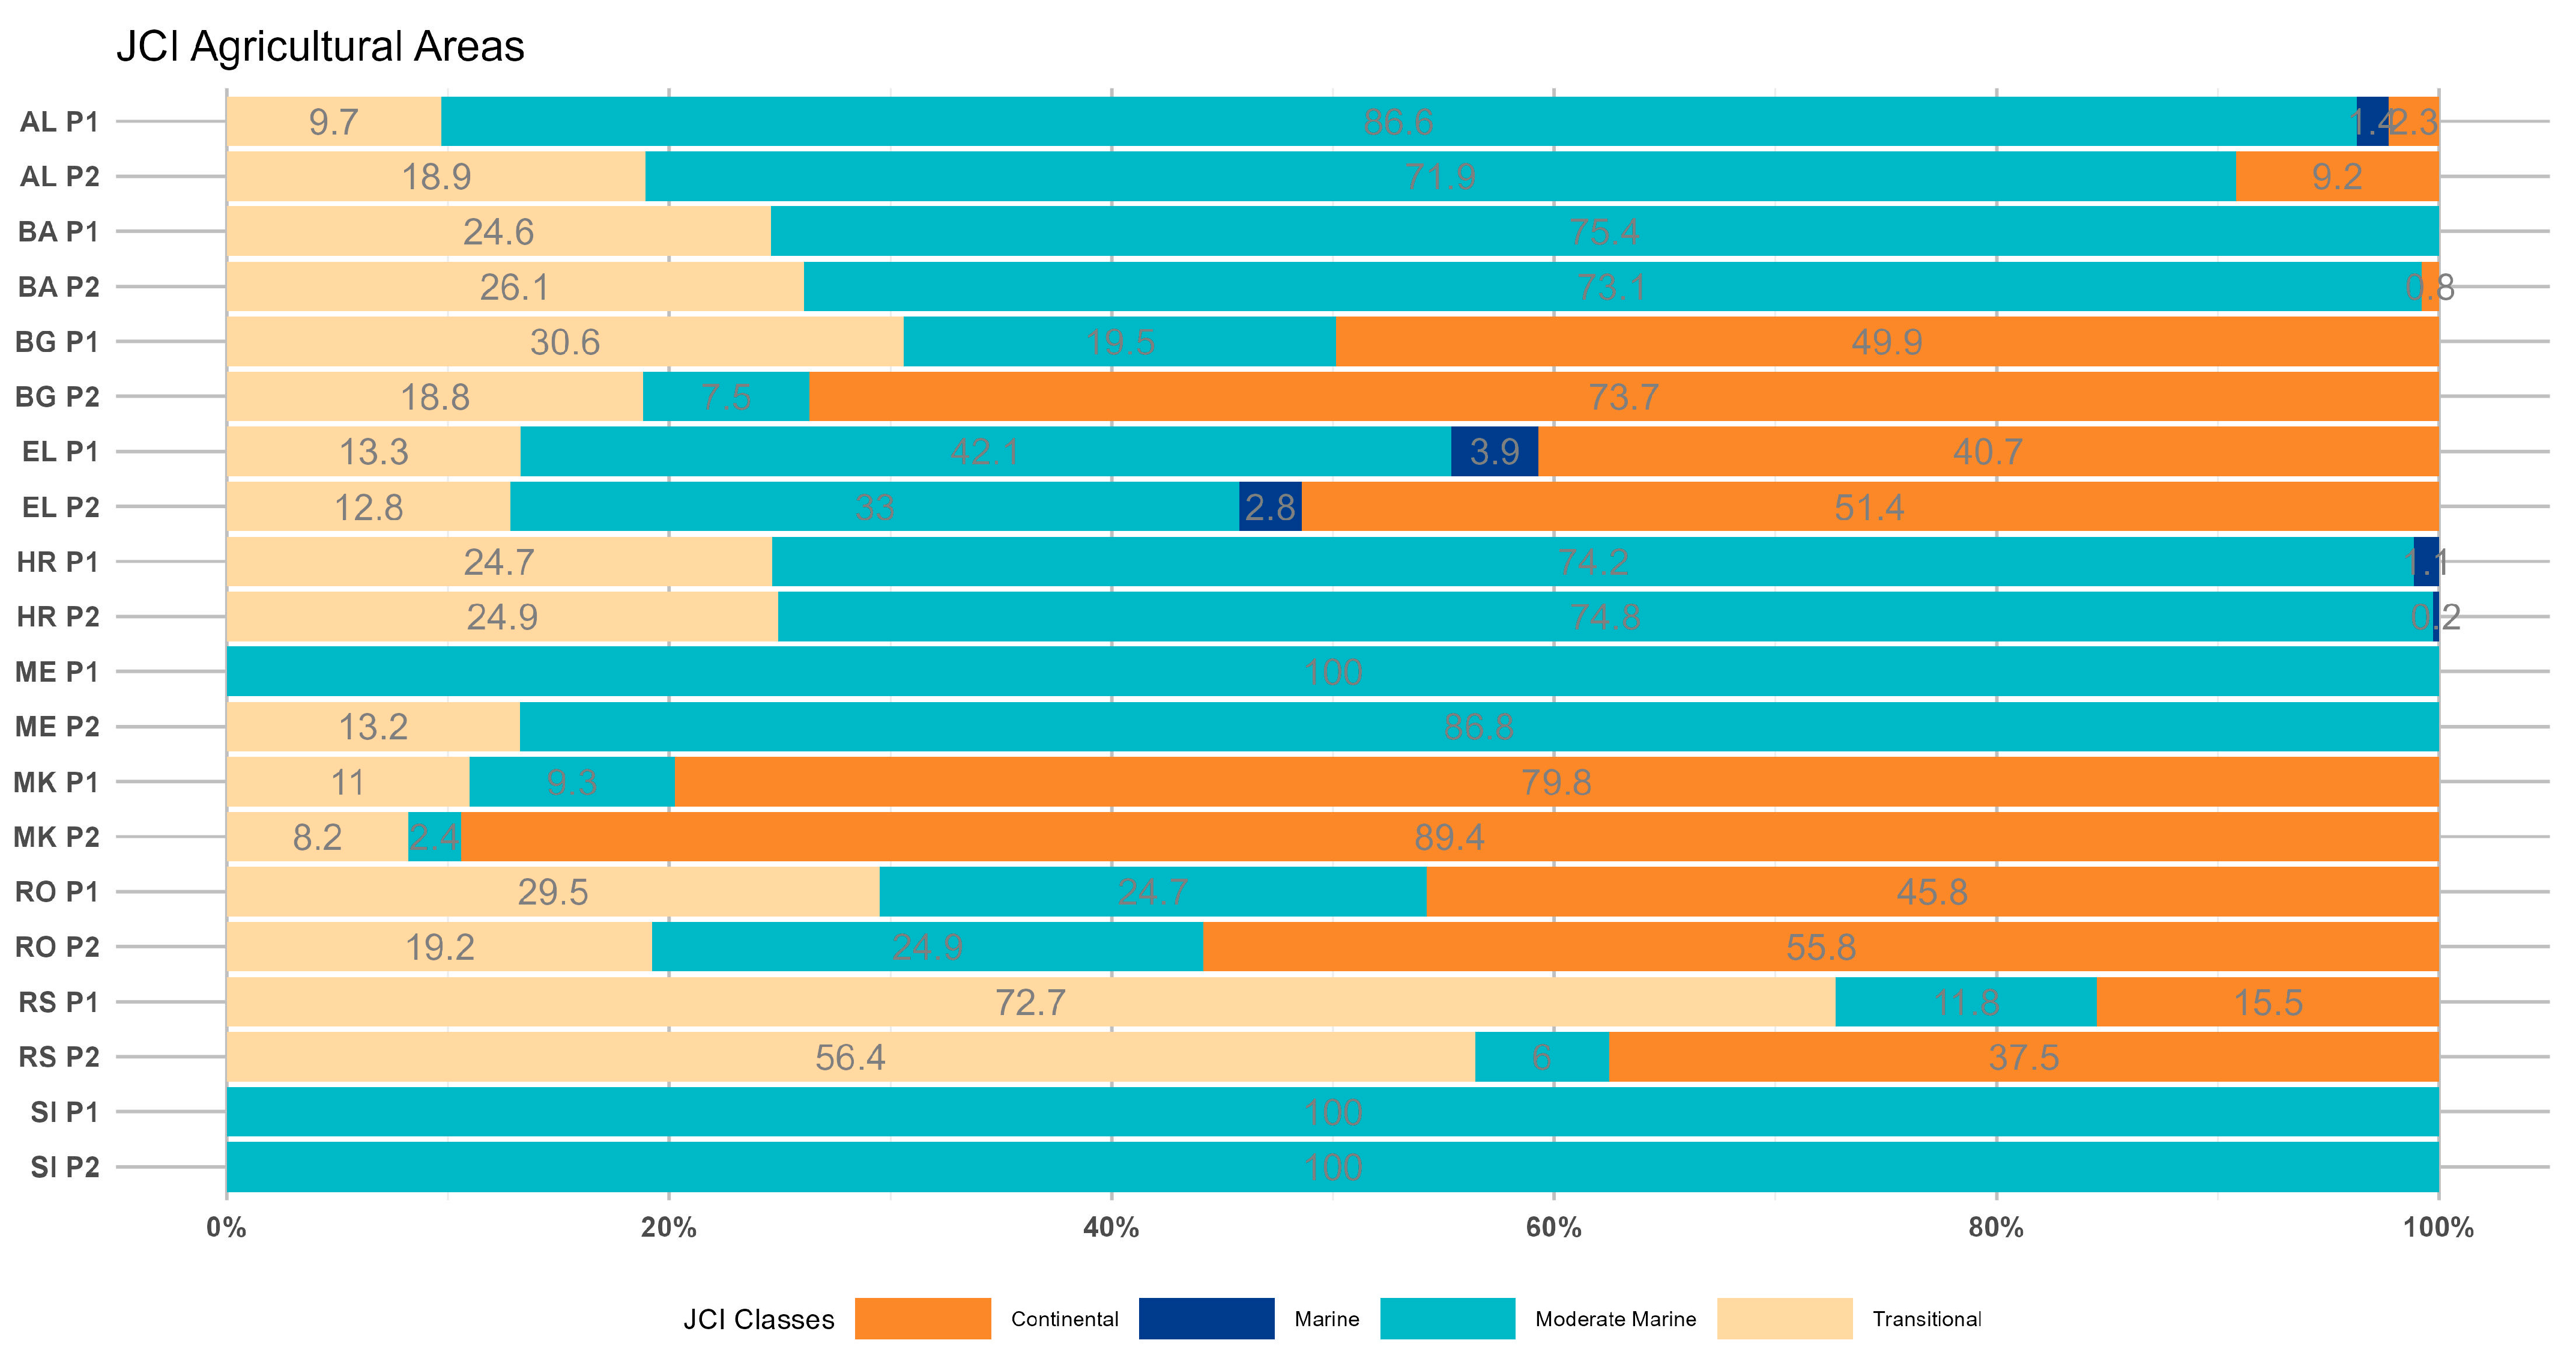
3.1. The Johansson Continentality Index (JCI)

3.1.1. JCI Period 1 (p1: 1964–1993)

According to the results illustrated in Figure 2, for p1 (1964–1993), the JCI classes over the natural and agricultural areas (henceforth abbreviated as AgrA and NatA, respectively) of Southeastern Europe (henceforth abbreviated as SEEu) correspond to the Marine, Moderate Marine, Transitional and Continental climate types. Oceanic influences, as described mainly by the Moderate Marine class, dominate the western countries, an extensive northeastern area, but also the southeastern coastal zones and eastern countries of the SEEu (overall attributed mainly to the presence of the Adriatic Sea, Ionian Sea, Aegean Sea, and Black Sea), over both AgrA and NatA, respectively (Figure 2).
More specifically, results in Figures 4 and 5 reveal significant Moderate Marine relative surface areas (%) over the AgrA and NatA of the SI (100% and 100%, respectively), HR (74.2% and 90.3%), BA (75.4% and 98.2%), ME (100% and 100%), AL (86.6% and 75.3%) and EL (42.1% and 55.4%). Furthermore, the Moderate Marine conditions are distributed mostly over the NatA of RO (75% vs. 24.7% over AgrA) and BG (53.7% vs. 19.5% over AgrA). Figure 1, Figure 2, Figure 3, Figure 4 and Figure 5 illustrate also that Continental encloses the Moderate marine great arc of the Carpathians features over the agricultural plains of southeastern RO (surface area of 45.8%) and of northern and southern BG (surface area of 49.9%). The Continental class covers almost the entire MK given high surface distributions over both AgrA (79.8%) and NatA (44.1%), while it characterizes extensive AgrA of EL (surface area of 40.7%). Transitional climatic conditions are mostly evident over the AgrA and NatA of RS (72.7% and 36.8%, respectively), secondly of BG (30.6% and 33%) and the AgrA of RO (29.5%). Finally, limited distributions of the Marine category are shown over the coastal agricultural zones of HR (1.1%), and AL (1.4%). The Marine conditions are also exhibited over both the AgrA and NatA of EL, concentrated in the Ionian and Aegean Islands.

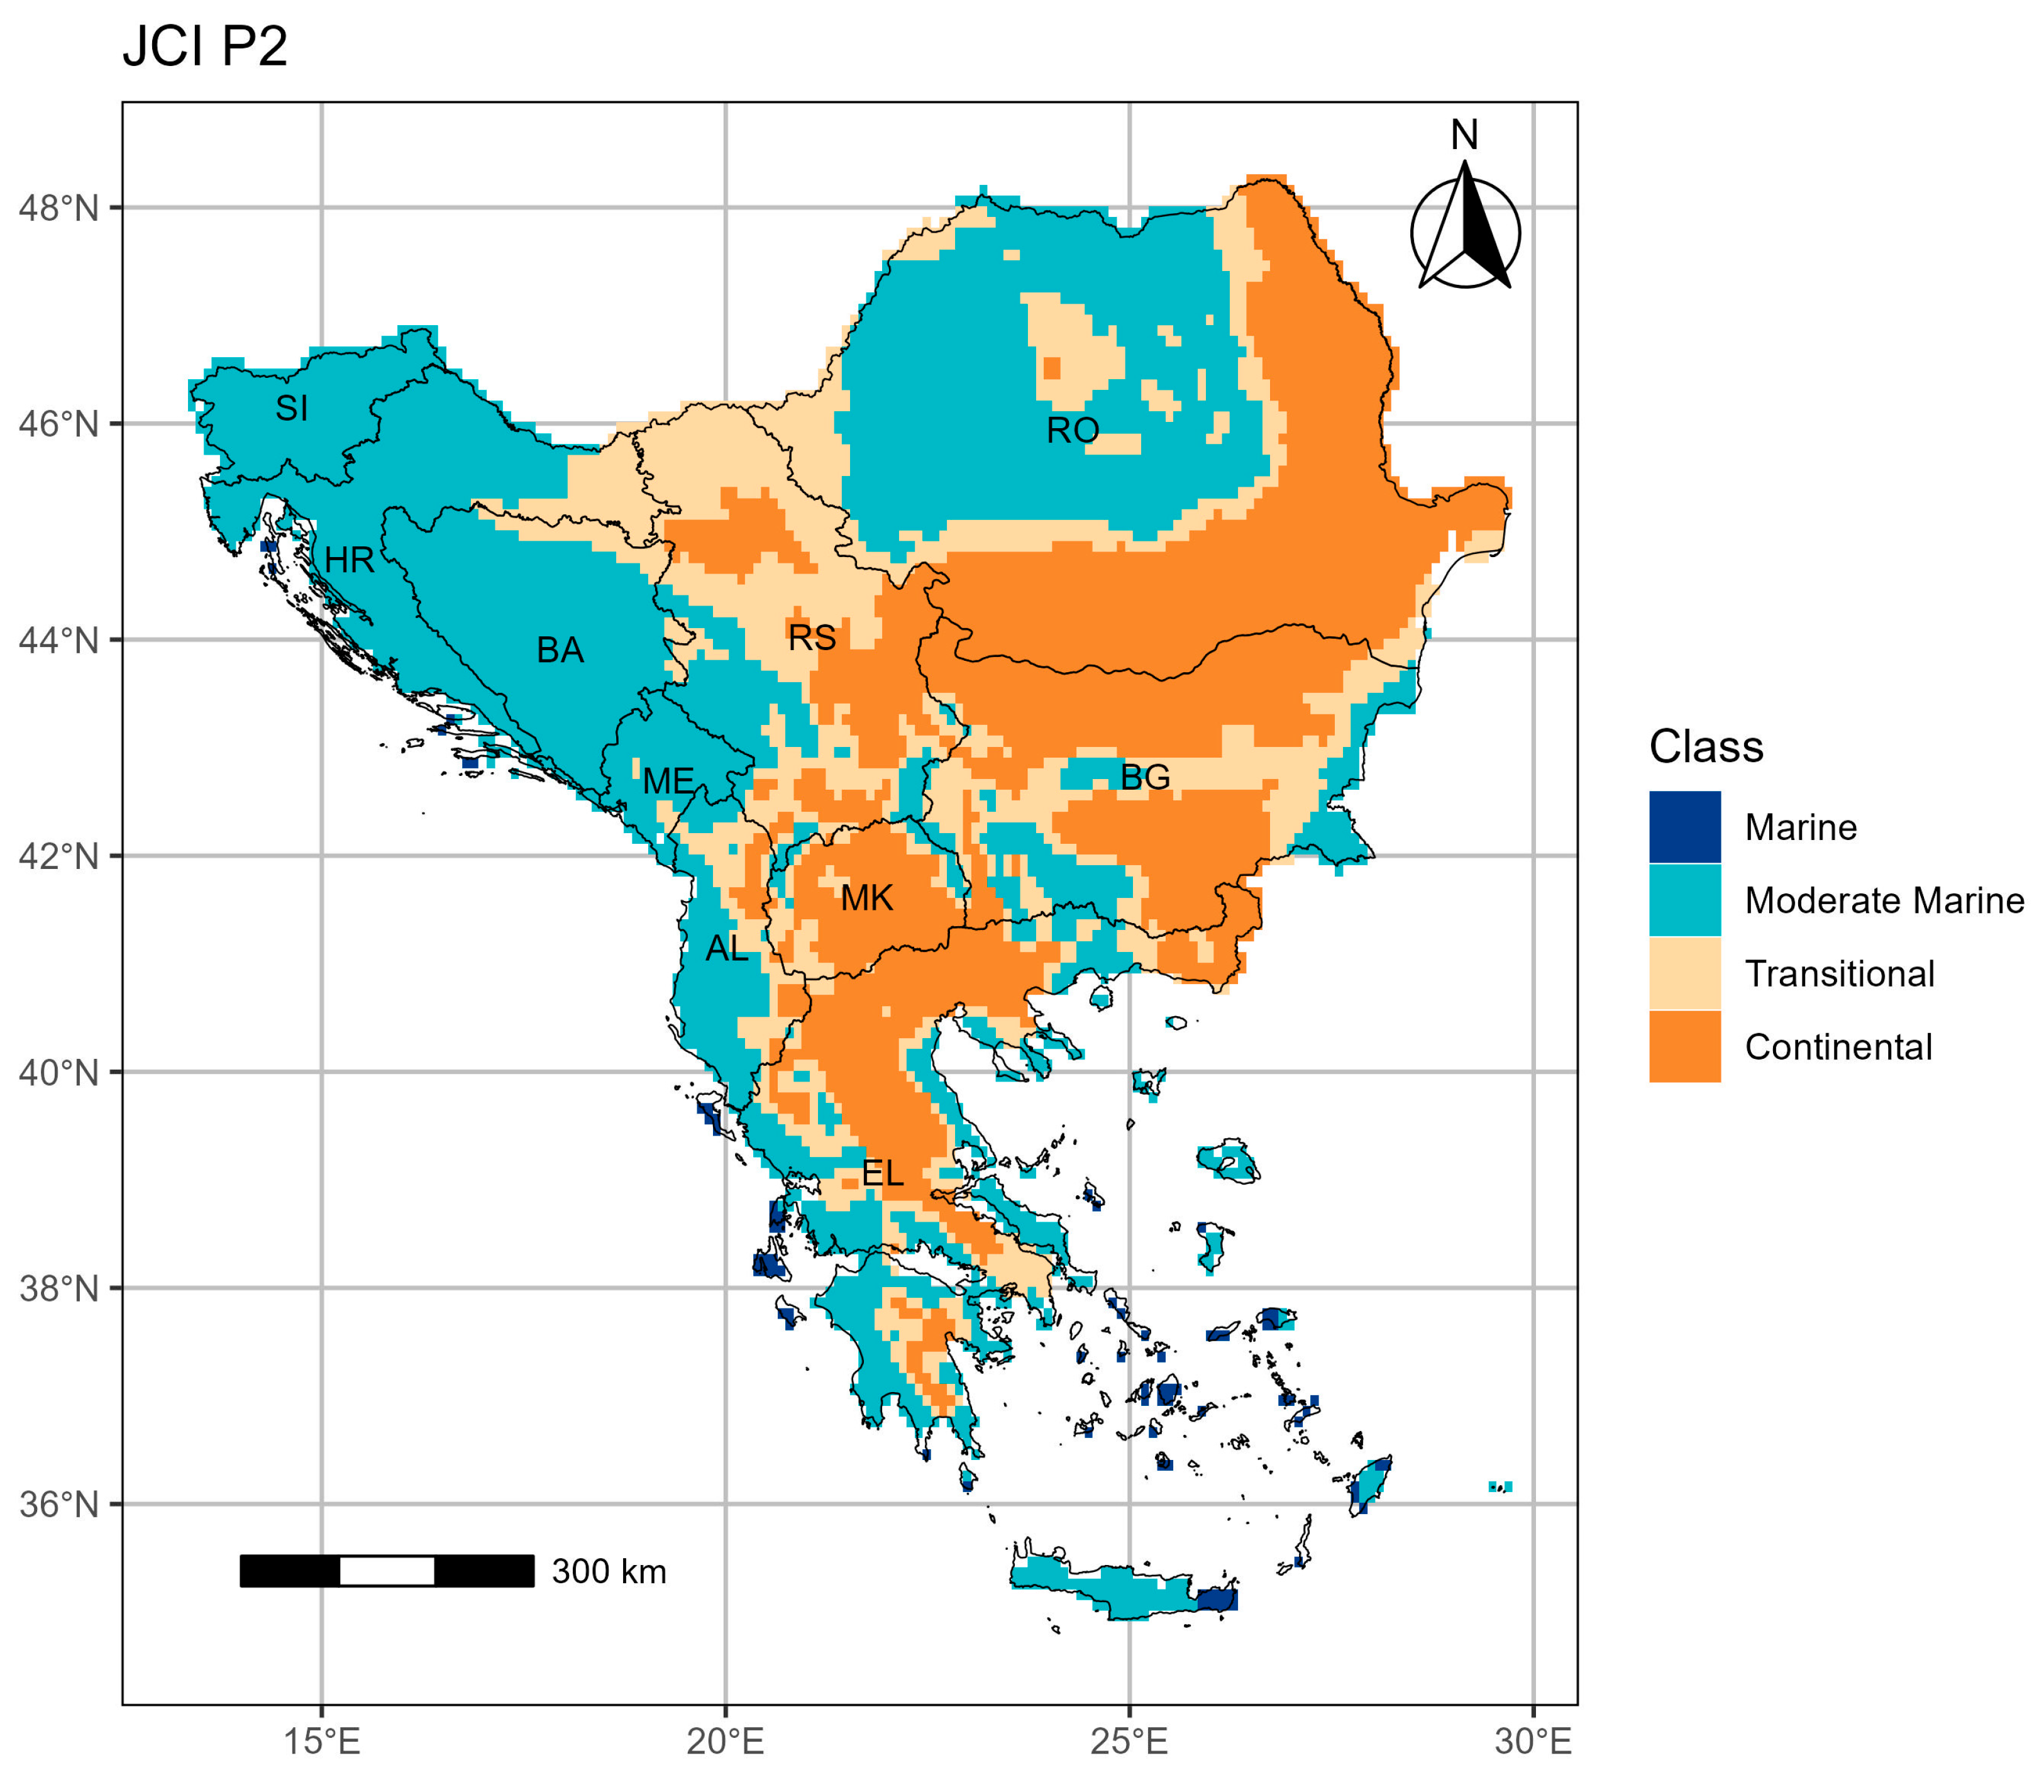
3.1.2. JCI Period 2 (p2: 1994–2023)

Comparisons of the JCI distribution between the p1 (1964–1993) and more recent p2 (1994–2023) (Figure 2 vs. Figure 3) reveal an increasing continentality trend, mainly over the southern and eastern regions of the SEEu. Higher distributions (Figure 4 and Figure 5) of the Continental class are most evident for both the AgrA and NatA of BG, respectively, from 49.9% relative surface area in p1 to 73.7% in p2 and from 13.3% in p1 to 36.8% in p2. The more expanded continental regime in p2 also occurs for RS (from 15.5% to 37.5% for the AgrA and from 14.6% to 27.6% for the NatA), RO (from 45.8% to 55.8% for the AgrA and from 6.5% to 13.6% for the NatA) and for EL (from 40.7% to 51.4% for the AgrA and from 19.8% to 36% for the NatA). Also, the significant trend towards continentality is shown for the NatA of AL (from 1.3% in p1 to 16.9% in p2) and MK (from 44.1% in p1 to 68.9% in p2). The continentality trend is also justified by the spatial increase in p2 of the Transitional category shown for both AgrA and NatA of AL (respectively, from 9.7% to 18.9% and from 23.4% to 37.1%) and for the NatA of EL (from 23% to 29.6%). Also, the same category appears over the AgrA of ME (13.2%), for the first time.
The resulting climate evolution towards more Continental climatic characteristics arises at the expense of the Moderate Marine regime (Figure 3), which was found to be highly distributed over the SEEu during p1 (Figure 2). Finally, estimations of the JCI between the two time periods also reflect unchanged Moderate Marine conditions for both the AgrA and NatA of the SI (Figure 4 and Figure 5).
Overall, according to estimations of the main differences between the two time periods investigated (Figure 6), it is apparent that the results of the JCI demonstrate a relatively neutral evolution over extended regions of the SEEu. The more continental regime is observable in the central and eastern domains, where the more continental climate conditions are shown to be evolved by 1 class of the JCI. On the country level, larger areas exhibiting the more continental evolution by 1 class of the JCI are detected over RS, BG, AL, and EL, while slightly detected areas appear as more continental by two classes of the JCI in RO, AL, BG, and EL. The marine conditions are illustrated only for the northwestern RO.

3.2. The Kerner Oceanicity Index (KOI)

3.2.1. KOI Period 1 (p1: 1964–1993)

Outcomes on the KOI estimations for p1 (1964–1993), demonstrate climate conditions over the AgrA and NatA of the SEEu falling within the Hyper-Oceanic, Oceanic, Sub-Continental, and Continental classes (Figure 7, Figure 8, Figure 9 and Figure 10). A significant part of the SEEu encompasses approximately the whole of RO, BG, and RS, along with substantial areas of SI, HR, BA, and MK are dominated by the Sub-Continental climate regime. As distributed, the Oceanic and the Hyper-Oceanic categories follow in descending order, primarily concentrated in the western part of the area investigated (Figure 7).
Based on analytical reference to the relative surface area per class and country over the AgrA (Figure 9) and NatA (Figure 10), significant spatial distributions of the Sub-Continental class result over RO (97.5% of AgrA and 93.1% of NatA), RS (95.4% and 83.7%), BG (91.6% and 75.5%), SI (88.24% and 60.8%), HR (83.3% and 50.7%), MK (73.1% and 38.8%) and BA (68.6% and 41.4%). As already mentioned, the Oceanic climate category dominates the western SEEu and more specifically, both the AgrA and NatA of ME (94.1% and 84.5%, respectively), AL (81.6% and 93.6%) and EL (55.3% and 78.5%) (Figure 1, Figure 9 and Figure 10). The Oceanic conditions are also developed over the AgrA and NatA of BA (31.4% and 58.6%, respectively), of MK (26.9% and 61.2%) and over less extended, mostly NatA, of SI (surface area of 39.2%), BG (24.5%), RS (16.3%) and RO (6.5%). The proximity to the sea (Figure 7) shapes Hyper-Oceanic climate conditions, as exhibited along the western coastal zone of the SEEu, over the Ionian Islands, and nearly the whole of the Aegean islands of EL. It is highlighted that the comparatively less extended Hyper-Oceanic category appears majorly over the western coastal, southern, and Aegean AgrA and NatA of EL (25.4% and 12.4%, respectively) and over the NatA of ME (14.5%). Finally, compared with the rest of the KOI climate classes, the Continental climate conditions appear much less and only over RO (1.3% of AgrA and 0.4% of NatA).

3.2.2. KOI Period 2 (p2: 1994–2023)

With reference to p1 (1964–1993) (Figure 7), observations on the distribution results of the KOI over the AgrA and NatA of the SEEu during p2 (1994–2023) reveal changes in the climate conditions (Figure 1 and Figure 8). These changes are interpreted as a decreasing oceanity trend justified mainly by the spatiotemporal decrease in the Oceanic and Hyper-Oceanic categories, majorly evident in the western part of the SEEu, in favor of the Sub-Continental and Continental climate regimes in the western and northeastern parts.
Between the p1 and p2 intervals investigated, the distribution increase in the Sub-Continental class (Figure 9 and Figure 10) is demonstrated for both the AgrA and NatA of BA (respectively, from 68.6% to 84% and from 41.4% to 63.2%), MK (from 73.1% to 82.1% and from 38.8% to 50.6%) and SI (from 88.2% to 99% and from 60.8% to 88.9%). This is also the case for the NatA of HR (from 50.7% to 66.3%) and RS (from 83.7% to 92.7%). The continentality trend is also highlighted for ME given the occurrence for the first time in p2 of the Sub-Continental conditions over both the AgrA (11.8%) and NatA (0.9%) and the concomitant absence of the Hyper-Oceanic conditions (from 5.9% in p1 to 0% in p2 over the AgrA and from 14.5% in p1 to 0% in p2 over the NatA). The spatiotemporal reduction in the Hyper-Oceanic category is also demonstrated for both AgrA and NatA of AL (18.4% to 9.2% and from 6.4% to 4.6%).
Additionally, Figure 9 and Figure 10 demonstrate a relative surface area increase in the Continental category for the AgrA and NatA of RO (from 1.3% to 7.9% and from 0.4% to 4.1%, respectively). At the same time, these conditions appear, for the first time, to a very low degree over the NatA of RS (0.3%). BG exhibits oceanity trends given the spatiotemporal increase in the Oceanic class over the AgrA (from 8% to 14.1%) and NatA (from 24.5% to 30.2%). A slight trend towards oceanity results also for EL, where a slight increase in the Oceanic regime is shown over the AgrA (from 55.3% in p1 to 58.8%) and a limitation of the Sub-Continental conditions over the NatA (from 9.1% to 4.6%).
Generally, KOI depicts an evolution towards more continental regimes, mostly over the western regions of the SEEu (Figure 11). Apparently, the neutral trend is shown over major parts of the area explored, while the oceanicity trend is shown over coastal sporadic eastern parts of the SEEu. By referring to individual countries, estimations on the main differences between the two time periods investigated demonstrate more continental conditions mainly over SI, HR, BA, ME, and to a lesser extent over RS, MK, AL, EL and RO. The trend of Sub-Continental class expansion in areas of countries such as HR and MK may cause stress in natural or crop vegetation. The more marine conditions are illustrated only for the southern/eastern BG and northern/eastern EL.

3.3. The Pinna Combinative Index (PINNA)

3.3.1. PINNA Period 1 (p1: 1964–1993)

Figure 12 shows that the dry month for p1 occurs gradually later in the year, following a north–southern direction over the SEEu. In general, the spatial distribution of the dry month corresponds to the winter period (mostly January and secondly February and December), Autumn (mostly October and secondly September), and lastly, March (detected only for central RO).
This status applies to all of RO and SI, most of BG and RS, and significant parts of HR, BA, and ME. The remaining area, which includes extensive areas of ME, BG, and approximately the entire MK, whole of AL, and EL, exhibit the dry month occurrence in the summer season, specifically, during July and August.
It is evident that the more adverse xerothermic conditions are developed over the southern half of the SEEu as the conditions of the summer dry months are further strengthened to their adversity by considering the increased temperature regime during July and August.
As depicted in Figure 13, the climate conditions of the areas investigated are characterized by the five PINNA categories from Wet to Dry (Wet, Moderate Wet, Moderate Dry, Semi-Dry, Dry). Overall, the wetter regimes are distributed mostly in the northern and western regions and less in the central regions of the SEEu. On the other hand, drier conditions are developed mostly over approximately the eastern half of the SEEu.
The PINNA’s relative surface area per class and country (Figures 16 and 17) demonstrates higher distributions of the Moderate Wet and notably the Wet class over the AgrA and NatA of SI, HR, BA, ME, AL, RS, and RO. The significantly extended surface area of the Wet conditions appears for both the AgrA and NatA of SI (100%, respectively), HR (79.6% of AgrA and 87.3% of NatA), BA (84.8% and 96.5%), ME (100% and 98.5%) and RO (53.2% and 87.3%). The Moderate Wet and Wet categories are almost evenly distributed among the AgrA of RS (31.9% and 38%, respectively) and NatA of RS (48.4% and 31.3%) and of AL (45.2% and 45.9%).
Towards the east of the area investigated (Figure 1 and Figure 13, Figures 16 and 17), significant parts are characterized by the Moderate Dry regime and are detected over the AgrA of AL (44.8%) and RO (43.1%), over both the AgrA and NatA of BG (78.2% and 36%, respectively), MK (43.2% and 52.6%) and EL (40.2% and 44.4%). The Moderate Dry conditions also influence quite an extended AgrA of RS (30.1%). Even drier conditions correspond to the Semi-Dry category, firstly impacting the AgrA of EL and MK (respectively, of 44.1% and 43.2%) and secondly, the NatA of EL and MK (19.1% and 9.5%). Finally, the Dry class is illustrated only over EL and, more specifically, over 8.5% of its AgrA and 3.1% of its NatA, majorly concentrated in central eastern and southern parts of the country (southern Attica, northeastern/southeastern Peloponnese, eastern Crete, and the Aegean Islands).

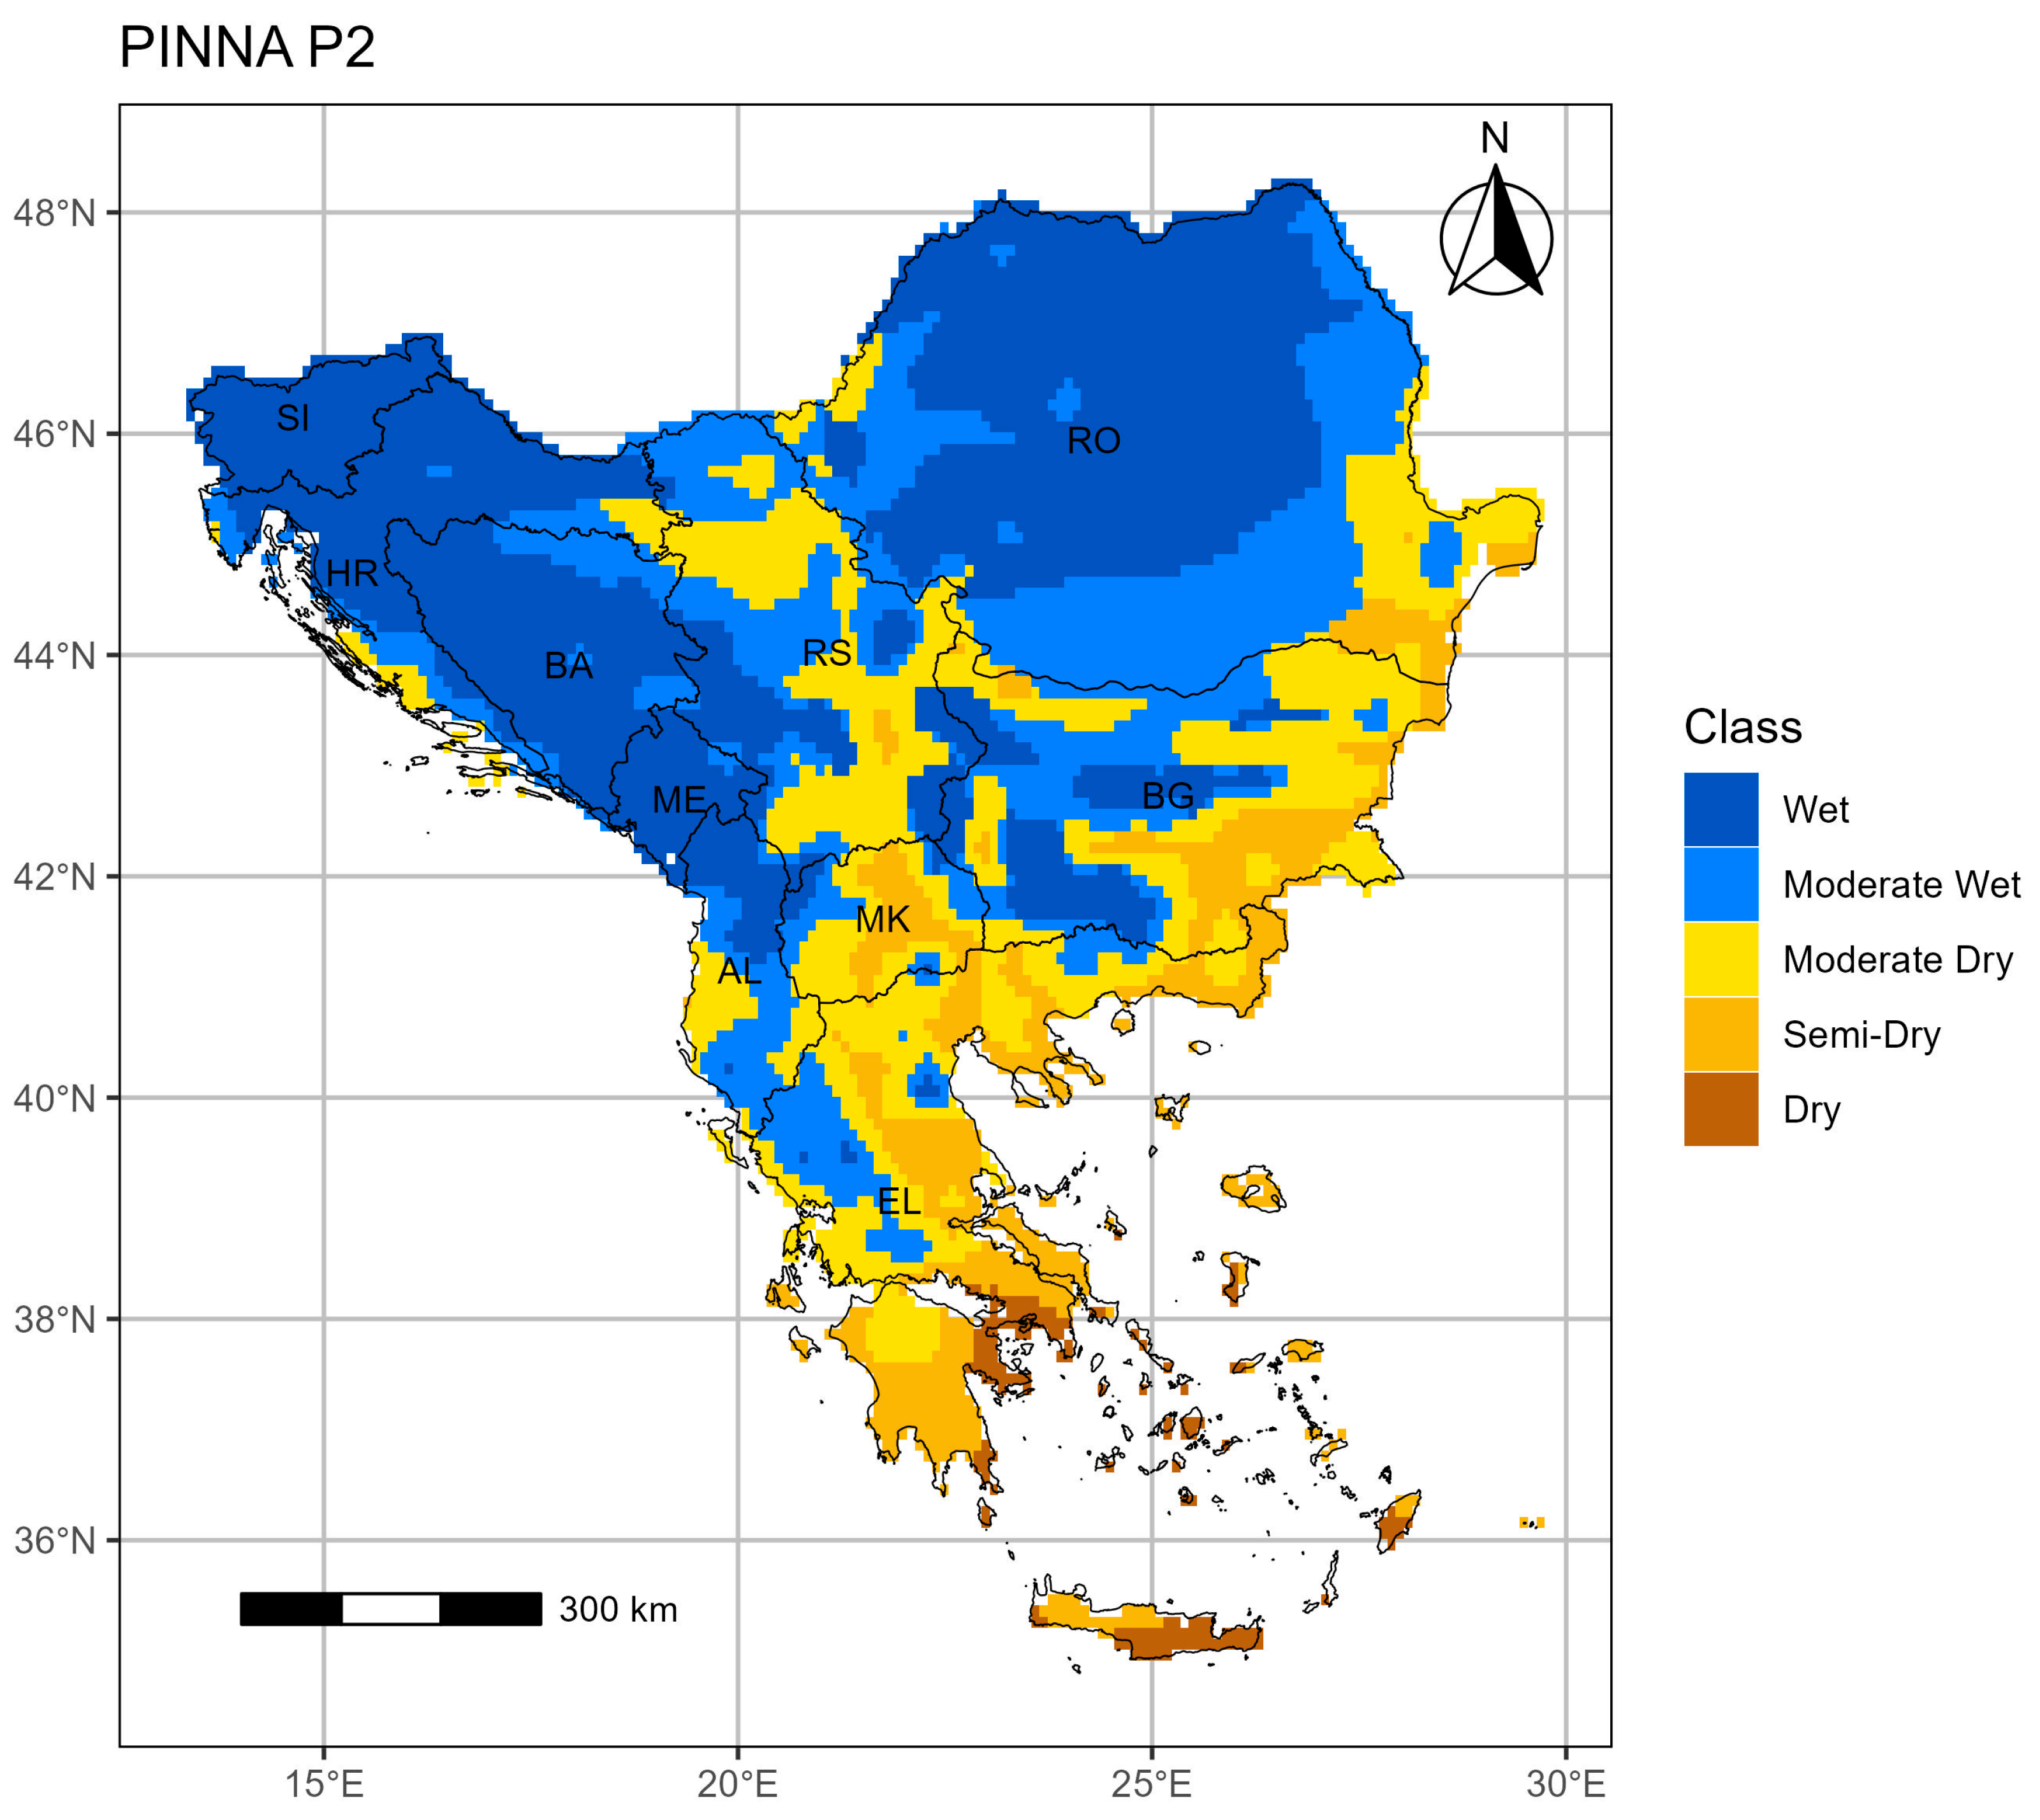
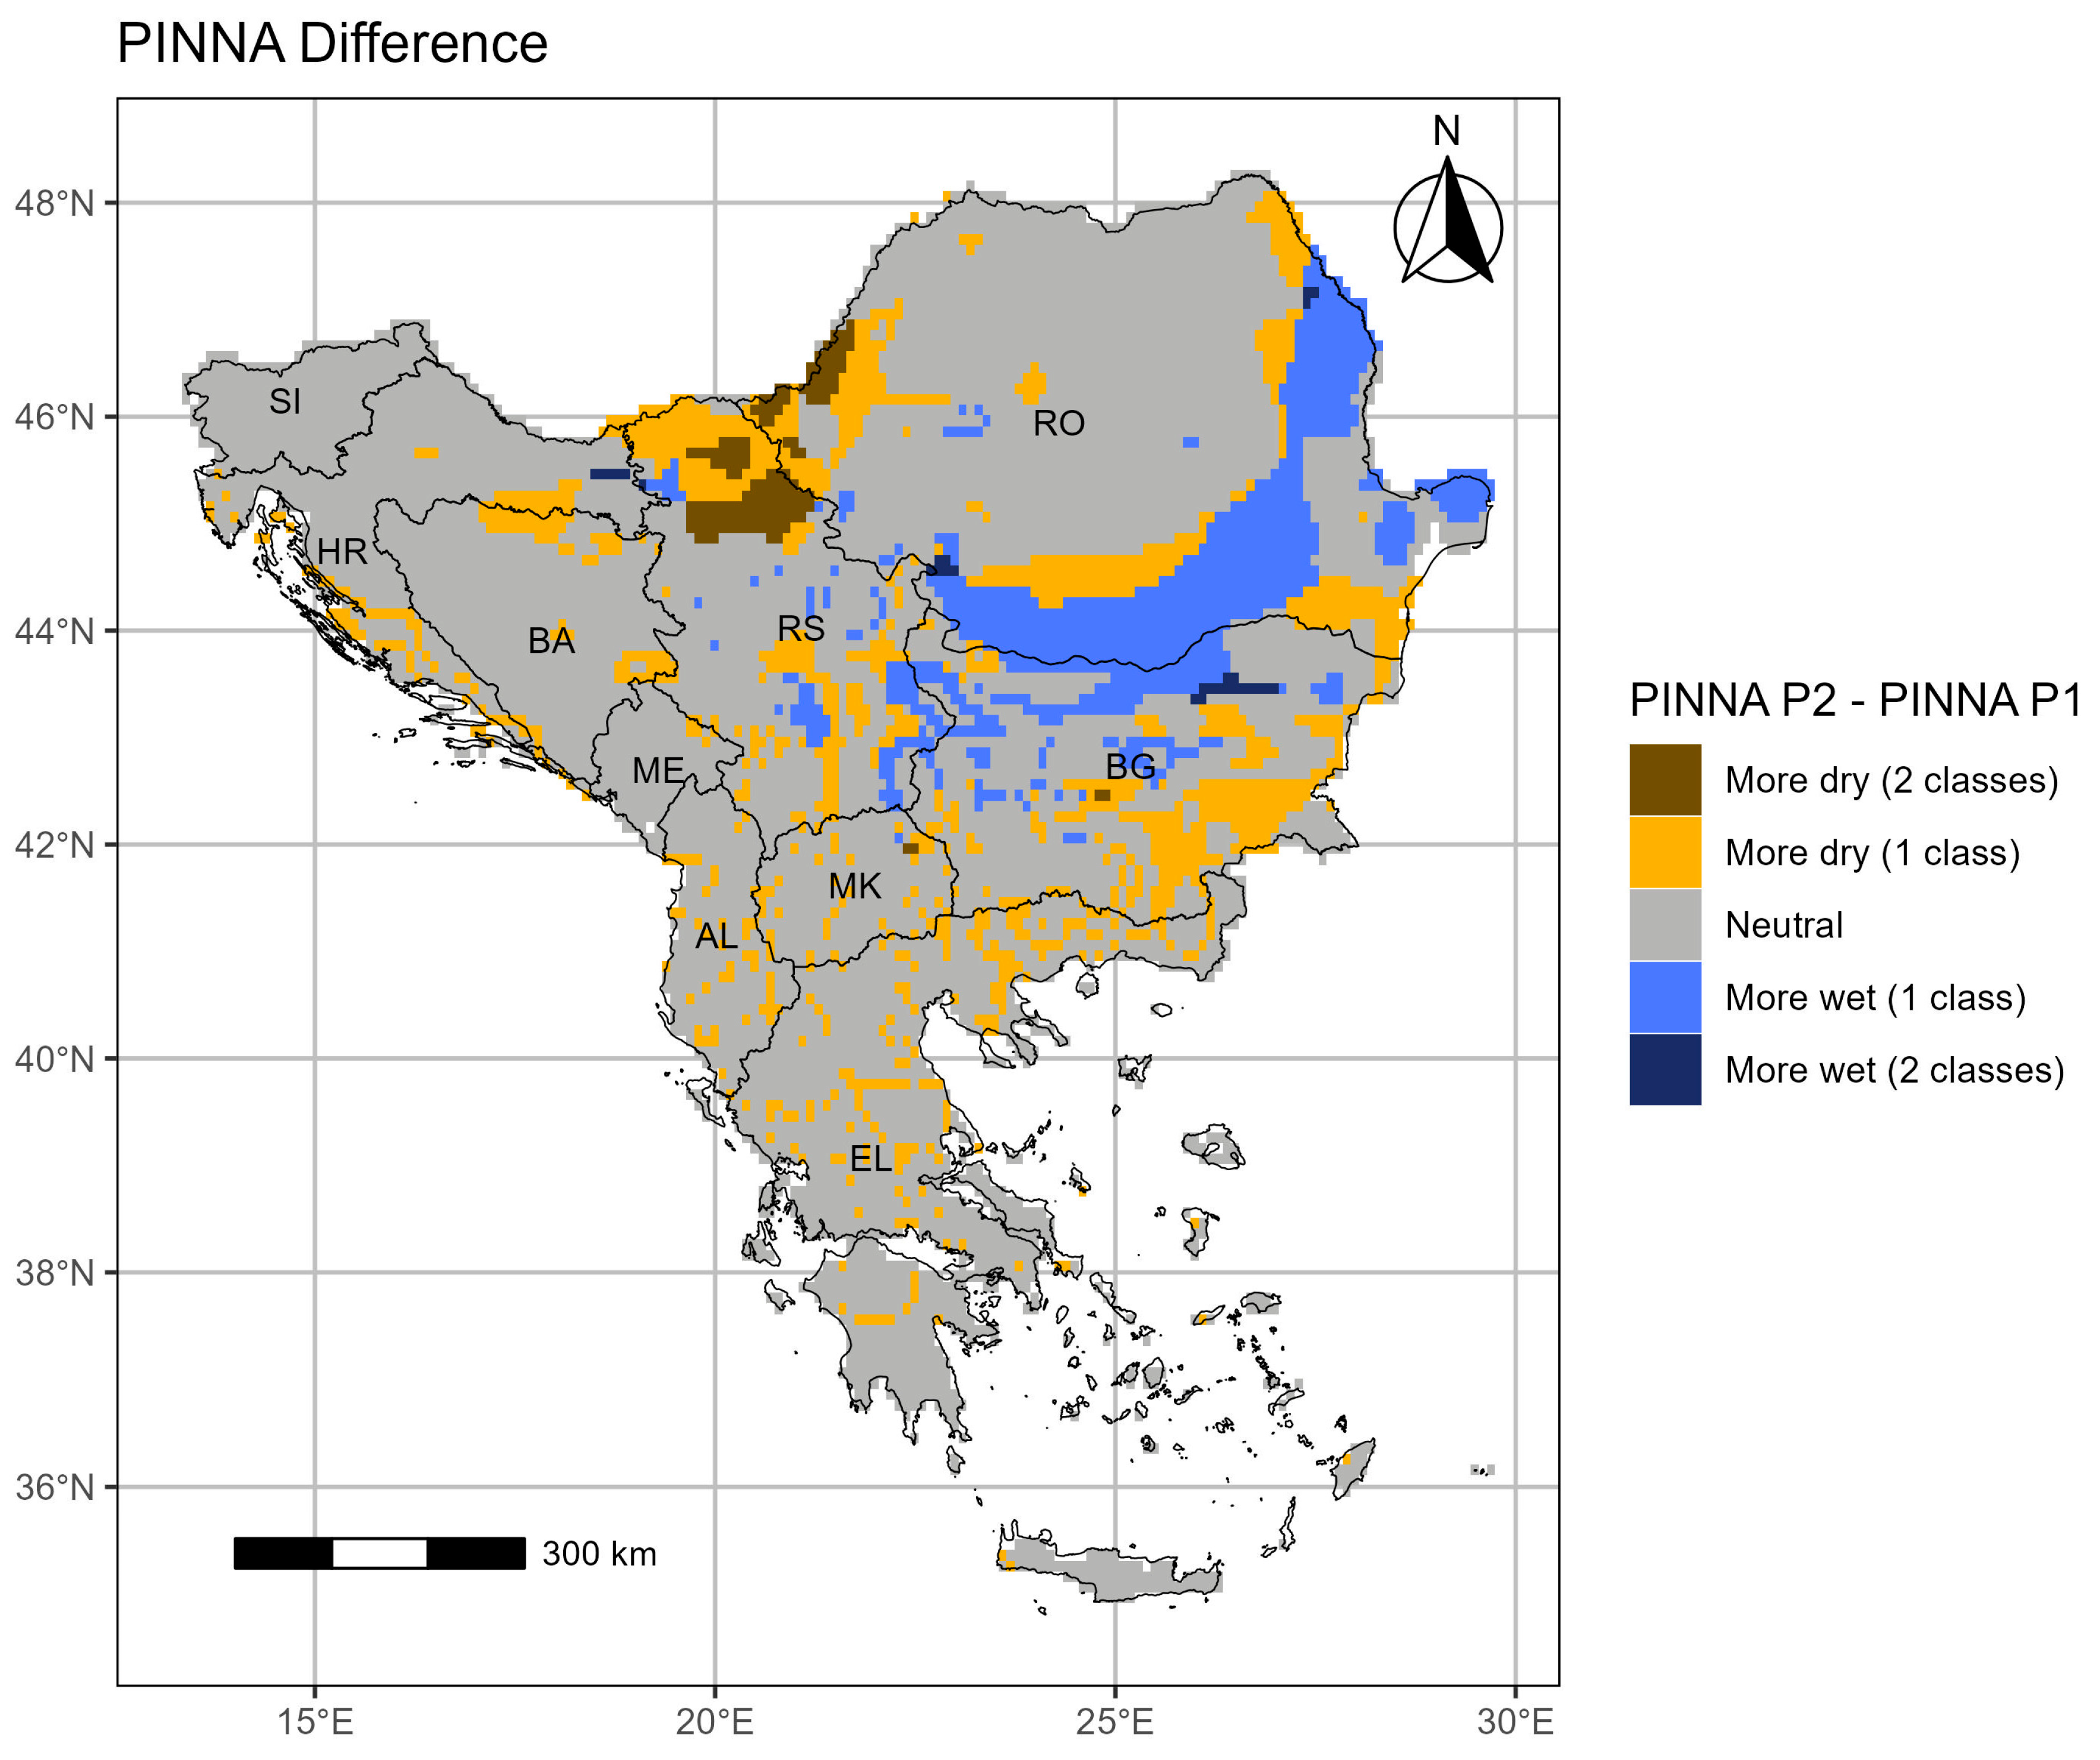
3.3.2. PINNA Period 2 (p2: 1994–2023)

In p2 (Figure 14) the dry month’s occurrence over the SEEu is demonstrated for an additional spring month (April) and summer month (June), impacting quite limited areas of northern RO and central eastern continental EL, respectively. Also, an extra winter month (November) is evidenced over the western, nearly half of BG, and eastern and northern RO.
The more recent p2 exhibits an overall northward and westward expansion of the areas with more xerothermic climate conditions corresponding to the dry month incidence within the summer period. As such, greater parts, mostly BA, ME, AL, RS, and EL, experience dry thermal pressure as they are impacted by the dry months of July and August.
Based on the PINNA classes’ distribution results for p2 (Figure 15), it is shown that an increasing aridity trend occurs with reference to the previous p1 (Figure 13). Overall, this tendency is more evident in central and eastern SEEu, where an increase in the Semi-Dry and Moderate Wet climate categories in the expense of the Wet conditions takes place in most cases.
A significantly higher distribution of the Semi-Dry class (Figure 16 and Figure 17) is exhibited for both the AgrA and NatA of BG, respectively, from 2.4% relative surface area in p1 to 23.1% in p2 and from 0.7% in p1 to 5.8% in p2. The spatially more expanded presence of the Semi-Dry conditions also occurs for both the AgrA and NatA of MK (respectively, from 43.2% to 51.1% and from 9.5% to 15.3%) and EL (respectively, from 44.1% to 54.5% and from 19.1% to 26.6%). This is also the case for the AgrA of RO (from 0.4% to 4%) and RS (from 0.01% to 1.6%). Also, a noteworthy spatiotemporal expansion of the Moderate Wet conditions impacts the AgrA and NatA of RO (respectively, from 3.3% to 44.8% and from 5.6% to 15.2%) and BA (respectively, from 13.7% to 33.5% and from 3.5% to 13.2%), and to a lesser extent, of HR (from 10.8% to 15.9% and from 7.8% to 15%) and MK (from 9.5% to 12.8% and from 27.2% to 29.6%). This is also the case only for the AgrA of BG (from 14% to 22.9%) and RS (from 31.9% to 41.6%), while the Moderate Wet class appears over the AgrA of ME for the first time (1.6%) and exhibits spatial increase over its NatA (from 1.6% to 5.3%). The Wet climatic conditions over SI remain practically unchanged, while very limited increase in the Dry conditions occurs mostly over the AgrA of EL (from 8.5% to 9.5%).
Estimations on the main differences between the two time periods investigated demonstrate the significant occupation of the neutral climate evolution over large areas of the SEEu (Figure 18). However, a substantial expansion of drier conditions by 1 class of the PINNA is evident throughout the territory. Also, the more wet regime by 1 class is highlighted for the central and eastern regions. The more intense climate evolution involving the drier and wetter conditions by of the two classes of the PINNA, between periods, is denoted, respectively, for northern RS, western RO, and very limited parts of RO and BG.

4. Discussion

The spatiotemporal evolution of the JCI, KOI, and PINNA has been investigated on a European scale, on a SEEU and country level and on a specific area extent.
Nistor [14] has utilized the JCI, KOI, and the PINNA for the aridity–humidity assessment over the 1990s (1961–1990) on a European scale. Based on the three analyzed indices, the southern and eastern parts of Europe consistently exhibit a dry climate. Both the JCI and KOI have verified Continental climate conditions in the east and southeast. The PINNA has indicated dry climate conditions in the eastern part of Europe along with the southern region, mainly the coastal lines. When referring to the up-to-present climate variations and the respective future situations (by 2050), the authors highlighted the drier regime expected to be developed in more territories of the continent, resulting in serious consequences on water resources of southern and eastern Europe, reflected in water availability decrease and groundwater recharge depletion.
Cheval [19] by means of the PINNA, JCI and KOI has evaluated the past and projected aridity changes in SEEu during the years 1961–2050 (1961–1990, 1991–2020, 2021–2050) at the 25 km spatial resolution. According to the PINNA results, a general pattern similar to the present investigation’s p1 (1964–1993) of the class distribution over the SEEu is demonstrated for the 1961–1990 interval. As such, the half northern and western parts of the SSEu (RO, RS, SI, HR, BA, ME, northern half of AL and BG, western EL) are characterized by the Wet to Moderate Dry climates, while the southern half and eastern regions (southern half of AL, MK, southern and eastern half of EL) fall within the Semi-Dry and Dry categories of the PINNA. By comparison of the 1961–1990 and 1991–2020 (present investigation’s p2: 1994–2023), an aridity trend is exhibited owing to a westward spatial expansion of the Moderate Dry conditions over RO, BG, AL, and MK. This is also the case for EL where the more adverse Semi-Dry category impacts approximately the entire EL except for a limited northwestern part characterized by Moderate Dry conditions. Results of the JCI for the 1961–1990 exhibit mostly a Continental regime and, to a lesser extent, Transitional conditions over the eastern half of the SEEu (most of RO, BG, MK, and the northern half of EL). The rest of the territory is influenced mostly by Moderate marine conditions. When comparing the 1961–1990 and 1991–2020 periods, a west–east transition to continentality is illustrated by the spatial increase in the Continental regime mostly over BG, MK and northeastern EL, but also by the increase in Transitional conditions over RS. The KOI outcomes for the years 1961–1990 demonstrated the dominance of the Continental climatic conditions over SEEu, spatially surrounded by the Moderate Continental characteristics majorly impacting areas adjacent to the Adriatic and Black Sea, including most of MK and northern EL. The remaining territory exhibits influences by the Moderate Oceanic and Oceanic climates with the latter appearing in southern EL. Illustrations for the following 1991–2020 period reveal a north–south shift from the Continental to the Moderate Continental climate type. This development is justified by the spatiotemporal increase in the latter mostly over BG, MK, and RS in the expense of the former type and the increase in the Oceanic in the expense of and Moderate Oceanic in southern SEEu (mostly over the southern half of EL).
Apostol and Sirghea [96] have highlighted the continental characteristics of Europe’s climate concerning the multiannual thermal averages. The spatiotemporal evolution of the Gorczyński continentality index (JCI in the present study) over a 50-year-old lapse time (1961–2010) revealed a significant temporal decrease in the Eastern half of the continent, pointing to the diminishing of thermal continentalism. The researchers emphasized the strong relation of the index with longitude.
Wypych [97], based on estimations of the thermal continentality Johansson–Ringleb index (modified version of JCI) for the 1901–2000 time-frame, has confirmed the weakening of oceanic influences from the West to the East of the European continent.
By applying a simple continentality index (difference between the monthly mean temperatures of the warmest and coldest month), Hirschi et al. [65] have demonstrated a more intense increase in thermal continentality in Eastern and Southeastern Europe during more recent decades (1995–2005) in comparison with the past (1948–2005), as shown in the present study.
Croitoru et al. [98] have employed the PINNA to identify the critical areas that are mostly prone to drought in crucial agricultural regions of RO and, more specifically, in 30 locations of the extra-Carpathian area. In agreement with the present study’s outcomes, results based on data over the years 1961–2007 illustrated that there are no dry regions, while the most vulnerable to semi-aridity are the southeastern regions (extreme east of the country, the Danube Delta), which fall within the category of the Semi-Dry climate. For the remainder area, the PINNA ranged between the values of 22 (in the southeastern and southwestern areas) and 40 (in the central southern and the northern areas).
Nistor et al. [99] have conducted a temporal analysis of the JCI and PINNA over 5 decades (1961–2013) in the Beliş district (Cluj County, Western Carpathians of RO). As also exhibited in the present study, overall, the climate indices indicated that very humid and marine climate conditions influence the Western Carpathians. More analytically, the authors refer to JCI values varying between 41.5 and 16.2, suggesting a transition from the continental to the Marine climate based on the representative value of 27.4 (over the 1961–2013 interval) which corresponds to the present study’s Moderate Marine conditions. The resulting PINNA representative value of 36 is indicative of the humid climate and corresponds to the present investigation’s Moderate Wet conditions.
Vlăduţ et al. [76] have investigated the spatial and temporal variability of several thermal continentality indices in southern RO (Romanian Plain, Dobrogea Plateau, and the Danube Delta) and northern BG (Danube Plain and the northern slopes of the Fore-Balkan foothills) during the years 1961 to 2015. In agreement with the present study’s illustrations, results based on the Gorczyński Continentality index (JCI) emphasized the Continental character of the climate in most of the areas studied. The authors pointed out that a more intense continentality (values of JCI > 40) is exhibited for the western and central sectors, especially along the Danube Valley. In contrast to the current study’s results which indicate a Sub-Continental regime, the average values of the KOI were negative in most of the stations investigated, indicating Continental climate conditions. However, the two studies agree with reference to the areas on the Black Sea coast characterized by the Oceanic climate category. Additionally, the authors highlighted that the stations exhibiting the highest JCI displayed some of the lowest KOI values, thus confirming the continental character of the climate. It was also reported that although the temperature increase was documented for the last two decades of the investigated period, the continentality trends were characterized as statistically insignificant.
Vlăduţ et al. [100] have also attempted the spatiotemporal occurrence evaluation of the aridity conditions in the same regions (southern RO and northern BG) by utilizing the PINNA for the 1961–2015 period. The PINNA values ranged between 30 and 35, corresponding to humid climate conditions within almost the entire area PINNA. Semi-Dry climate conditions were identified particularly for the shore of the Black Sea (Varna) and the Danube Delta (Tulcea), while dry conditions were only exhibited for the southeastern tip of RO (Sulina). These outcomes are consistent with the respective obtained for the specific region by Croitoru et al. [98] and Cheval et al. [19]. Similarly, in the present survey for the p1 (1964–1993), the drier conditions (Semi-Dry category) are found in the southeastern part of RO, while the less humid conditions (Moderate Dry category) dominate over the entire studied area. Although an increasing aridity trend is exhibited for the consecutive period (1994–2023), again the more humid conditions (Moderate Wet category) influence most of the studied area, while the dryer regime (Moderate Dry and Semi Dry categories) appears in the eastern part.
Vlăduţ and Licurici [101] have analyzed the spatial distribution and temporal variability of three aridity indices over Oltenia (Southwestern RO) based on the data covering the 1961–2015 time period. Among them, the PINNA indicated humid conditions throughout the area investigated when considering the basic categorization corresponding to the Dry (values PINNA less than 10), Semi-Dry (between 10 and 20), and Humid (above 20). Croitoru et al. [101] have demonstrated a similar territorial pattern for the extra-Carpathian regions for the 1961–2007 period. However, when Vlăduţ and Licurici [101] include the extra three PINNA categories for values above 20 (20.1–30: Moderately Dry; 30.1–40: Moderately Wet; >40: Wet) as performed in the present study, different climate regimes are shaped over the area of interest. Moderately Dry conditions appear along the Danube River, Moderately Wet conditions within the plain, piedmont and most of the Sub-Carpathians, while Wet conditions result for the western extremity of the Subcarpathians and in higher altitudes, as well as in the mountain area. These conditions result also in the present survey where the Moderate Dry class influences almost the entire study area (very limited distribution of Moderate Wet and Wet conditions) in p1 (1964–1993), giving ground in p2 (1994–2023), mostly to the Moderate Wet regime and to a lesser extent to the Wet conditions.
Vlăduţ [71] has assessed the thermal continentality in RO based on temperature data series covering the 1961–2018 interval. However, different employed indices (the simple continentality index, the Currey continentality quotient, the Ewert index of continentality, and the Ivanov index of thermal continentality) documented an upward continentality trend within most of the country. Downward trends only resulted in Transylvania and the northern extra-Carpathian areas.
Eremija et al. [102] examined the climate characteristics in the belt of mountain beech forests on Manjača (southwestern part of the Republic of Srpska, northern BA) over a ten-year old period (1971–1980). The researchers determined the degree of climate continentality based on the Kerner Thermodromic Coefficient or Thermodrom quotient (KP%). This index expresses the landmass influence degree (value of KP > 15% corresponds to the Maritime climate, whereas of KP < 15% to the Continental climate; the lower the value of KP is from 15%, the higher the degree of continentality). Results (KP = 9.8%) highlighted the study areas’ characterization by the Humid Continental-mountain climate. In the current study northern BA is impacted by the Sub-Continental climate in both time frames.
Hrnjak et al. [103] investigated the aridity tendency over Vojvodina (southeastern part of Pannonian Basin, northern RS) from 1949 to 2006. Their survey’s outcomes displayed no annual aridity trends over the 6 decades investigated, corresponding to the calculated values of PINNA (from 14.0 to 20.0). Lower values resulted for the northwestern and northeastern parts of Vojvodina (PINNA = 14.2 and 16.7, respectively). The higher values (19.8 and 21.0) corresponded to southern Vojvodina. By utilization of the basic categorization corresponding to the Dry (values PINNA < 10), Semi-Dry (between 10 and 20) and Humid (>20), the Semi-Dry Mediterranean with formal Mediterranean vegetation appeared as the most dominant climate type, while humid conditions characterized a small part of Southwestern Vojvodina. In the present survey, most of the area is characterized by the Wet class (in p1), which is substituted (in p2) by the drier Moderate Wet and lesser by the Moderate Dry classes. However, Hrnjak et al. [103] depicted no recent aridity changes, given the absent annual trends of the index’s calculated values. Similarly, although employing the Forestry Aridity index, Gavrilov et al. [104] have also shown no particular annual aridity trends over Vojvodina for the same interval (from 1949 to 2006).
Radaković et al. [105] analyzed the aridity in central RS (between Vojvodina, Kosovo and Metohija provinces) from 1949 to 2015. Based on the Dry (values PINNA < 10), Semi-Dry (between 10 and 20) and Humid (>20) classification, the annual PINNA identified Humid and Semi-Dry climate types with Mediterranean vegetation. The PINNA ranged between 17.1 and 40.4, with Western RS having the highest values (Zlatibor Mountain) and eastern RS the lowest (gradual decrease towards the east). Furthermore, no changes in the aridity trend were depicted. In the present study, calculations of the PINNA demonstrate the Wet, Moderate Wet, and Moderate Dry conditions in both p1 and p2 examined, with the drier Moderate Dry conditions appearing, in the 2nd interval, as influential over a more extended area of the central RS.
By examining a shorter timeframe, Bačević et al. [106] have highlighted the unchanged aridity trend over Kosovo and Metohija provinces (RS) in 35 years (1965–1999). Following calculations of the PINNA index, which ranged from 17.0 to 24.0, the climate types registered (based on the standard 3 classes categorization) involved the dominative Semi-Dry climate, with some Mediterranean vegetation in the southwest part and a small area of the Semi-Dry type in the central part of the investigated region. In the present study, the domination of the Moderate-Dry climate is apparent over the entire region in p1 (1964–1993)(respective 1965–1999 in Bačević et al.).
Gocić et al. [107] have analyzed the spatiotemporal patterns and trends of aridity in southern and eastern RS based on the calculation of 5 aridity indices, including the PINNA, according to temperature and precipitation data spanning from 1971 to 2022. Throughout the latter period, the PINNA spatial distribution demonstrated slight variation, ranging from 22.4 (at Vranje, Southern part of the study area) to 31.8 (at Kuršumlija Southwestern part). The resulting values of the index reflected consistent Humid conditions across the area investigated (values of PINNA > 20 reflected the Humid climate based on the 3 classes categorization). Similarly, in the present study, the Wet, Moderate Wet, and Moderate Dry classes are distributed over the area (corresponding to PINNA values > 20), with the latter conditions appearing spatially extended in p2.
For the comprehension of the changes in climate during 1951–2010, Burić et al. [108] have studied the specific climatic conditions over the entire Serbian territory based on the JCI, KOI, and PINNA. Results showed that the continentality effect is present in most of Serbia, while oceanicity is observed locally, mainly in the western and southwestern parts of the country. Furthermore, the demonstrated temperature increase, and precipitation decrease during the vegetation period in the second 30–year period (1981–2010), highlighted by arid climatic trends. Although Burić et al. exploited different indices’ classifications, the increasing aridity trend is in agreement with the present study given the spatiotemporal increase in the Continental, Sub-Continental and Moderate Dry categories, respectively by the calculated JCI, KOI and PINNA indices.
Luković et al. [109] have examined the spatial pattern and trend in aridity in ME from 1961 to 2020 as well as in the first and second half of this period (1961–1990, and 1991–2020). The results of the PINNA (based on the 3 classes categorization) indicated the dominance of the Humid climate over the entire country from 1961 to 2020. Furthermore, the index demonstrated slightly lower values for the most recent period (1991–2020), particularly in the easternmost part of the country. Results of the PINNA in the present survey reveal the dominance of the Wet conditions in both p1 and p2, and a slight extended appearance of the Moderate Wet over the northwestern part of the country in p2.
Burić et al. [110] studied Podgorica’s continentality (Southern ME) from 1951 to 2017. The considered thermal indices included the Gorczyński Continentality index (JCI) and the Kerner Thermodrom quotient (K%) (KP > 15%: Maritime climate; KP < 15%: Continental climate). According to the values of the JCI (33.5%) and K (8.3%), the climate of Podgorica has weak continental characteristics. The K indicated that the climate of Podgorica cannot be characterized as either Maritime or real Continental. The authors concluded that although the continent’s influence is present, the thermal continentality values are such that maritime impacts are primary and predominant. In the present study, both indices reveal a continentality trend over Podgorica owing to the transition between periods, from the Oceanic to the Sub-Continental conditions and from the Moderate Marine to the Transitional climate according to the computed KOI and the JCI indices, respectively.
Burić et al. [111] have also determined the degree of continentality characteristics of Danilovgrad (Bjelopavlića Plain, Southern ME) over the 1955–2011 time period. Results revealed the dominance of the continental influence on temperature, along with less pronounced oceanicity. Among other indices, continentality was estimated based on the Gorczyński Continentality index (k, transitional maritime with k from 0 to 33%, continental with k from 33 to 66%, and extreme continental k from 67 to 100%) and the Kerner Thermodrome quotient (K, K > 15%: Maritime climate; K < 15%: Continental climate). The estimated values (k of 33.5%, and K of 6.0%) corresponded to the Moderate Continental characteristics. The weaker Continental characteristics for Podgorica (K value of 8.3%) found in Burić et al. [110] were justified given that it is in higher proximity and more exposed to the influence of the Adriatic Sea than Danilovgrad.
Among several indices, Prodanova et al. [112] have also estimated the PINNA over north-central BG. The PINNA with threshold values of <10 corresponded to the Arid climate; of 10–20 to the Mediterranean Semi-Dry and of >20 to the Humid. The air temperature data covered 40 years (1931–1970), and precipitation data 54 years (1931–1985). Most stations resulted in PINNA values > 30 and as such, the investigators described the climate of north-central BG as Humid. Based on the present study’s Dry to Wet classification of the PINNA, an unchanged humid regime over the north-central part of BG is also documented as the Wet category influences the area in p1 and p2.
For the assessment of the climate of northern EL, Baltas (2007) [17], has applied the JCI, KOI and PINNA indices based on climate conditions occurring over 30 years (from 1965 to 1995). The KOI threshold value higher than 10 corresponded to the Oceanic regime. The JCI, when varied between 0 and 33, implied Marine conditions, when between 34 and 66 Continental, and when between 67 and 100 exceptionally Continental conditions. The PINNA, when less than 10 reflected Dry conditions and when varied between 10 and 20, pointed to the Semi-Dry Mediterranean climate with formal Mediterranean vegetation. The values of the JCI varied between 19 and 38 over the entire investigated area. Stations located in the interior of the area (at a distance from the sea) denoted Continental climate (index values > 33), while the rest of the stations corresponded to the Marine climate. This is in line with the present findings where the Continental class is distributed majorly in the interior of northern EL during the p1 (1964–1993) and appears framed mostly by the Moderate Marine conditions in areas adjacent to the sea. The KOI, which varied between 0.47 and 28.74, exhibited lower values distributed in the interior of the country, pointing to the Continental climate as the JCI. During p1, the presence of the drier Sub-Continental category is also illustrated in the present study for the interior northern part of the area examined, whereas the Oceanic climate appears as more spatially extended. According to Baltas the PINNA ranged from 10 to 20 corresponding to a Semi-Dry Mediterranean climate with formal Mediterranean vegetation in most of the stations, with the rest few stations of annual precipitation volume >1000 mm, found to exceed the value of 20. Overall, results illustrated a drier climate from the western to the eastern coast. In the present investigation, the presence of the Wet to Semi-Dry PINNA categories is documented, with Moderate Dry conditions appearing mostly expanded over northern EL. The drier conditions formed from the western to the eastern coast are also evident given the distribution of the more humid Moderate Wet climate in the west and the drier Moderate Dry and Semi-Dry climates in the east.
By utilizing the same classifications of the JCI, Baltas (2008) [21] has also analyzed the climatic conditions across Greece based on the spatial distribution of the index over a 30-year period (1965–1995). The JCI values varied between 15 and 38 over the entire country. Value of JCI ≥ 33 at 11 of the 40 stations in the northern part of the country denoted Continental climatic conditions as influenced by their proximity to the mountains or the continental part of Europe. The rest of the country was found to be impacted by the Marine climate regime.
Lappas et al. [113] have described the climate’s differentiation across the Water District of central-eastern Greece covering a 22-year study period (1980–2001). The authors exploited the spatial distribution of several climate indices including the JCI (k), the KOI and the PINNA. The climate was regarded as Marine for JCI between 0 and 33, as Continental for JCI between 34 and 66 and Exceptionally Continental for JCI between 67 and 100. The JCI values spanned between 8 and 34 over the coastal areas and from 34 to 80 over the continental areas, demonstrating, thus, the increasing continentality influenced by the distance from the coastal areas. These are in line with the present investigation given the domination, in p1 of the Moderate Marine climate in areas close to the Aegean Sea and the presence of the Transitional and Continental in the inner parts of the study area. Additionally, the current findings show a continentality trend owing to the partial substitution of the Moderate Marine by the Transitional and Continental climates in p2. In Lappas et al. [113] the KOI fell within the 8–22 values (for KOI > 10, the climate was considered Oceanic), with the higher values corresponding to the Oceanic climate over the lesser continental areas. Similarly, the corresponding current outcomes in p1 illustrate the influence of the Oceanic climate over the entire area except for very limited eastern coastal areas with Hyper-Oceanic. The latter is further westerly spatially expanded in p2. Finally, by considering the Dry (values PINNA < 10), Semi-Dry (between 10 and 20), and Humid (>20) categories, estimations of the PINNA (between 15 and 35) corresponded to the Semi-Dry and to the Humid climate, distributed mainly over the continental and coastal parts, respectively. These findings arise partly in the present work since the entire area is majorly characterized by the Semi-Dry and, to a lesser extent, by the Moderate Dry conditions in both periods examined.
Mavrakis et al. [114] have investigated climatic alterations over the Thriassio Plain, an industrial basin of the Eastern Mediterranean (Northwestern Athens, Greece) based on 60-year-old data (1958 to 2008). Results of the KOI showed a positive but insignificant trend and, thus, the Thriassio Plain’s climate could not be characterized as a Marine (for KOI > 10, the climate was considered Oceanic), despite its proximity to the sea (Elefsis Bay). The JCI values were >90 for 41 years and <90 for 7 years, characterizing the area as very Continental. The PINNA gave values of> 5 for 41 years and < 5 for 9 years (PINNA < 10: Dry climate; 10 ≤ PINNA ≤ 20: Semi-Dry climate) corresponding to the Semi-Dry Mediterranean with typical Mediterranean vegetation climate type. The authors concluded that the area exhibits continental characteristics as demonstrated by the KOI and JCI, while the PINNA confirmed the Semi-Dry climate. Respective KOI, JCI and PINNA results exhibited Oceanic, Transitional, and Dry climate regimes for both the p1 and p2.

5. Conclusions

In general, the findings of this survey lead to the following conclusions:
  • Independently of the employed index (JCI, KOI, or PINNA), the climatic footprint of the SEEu reveals spatiotemporal increasing continentality and aridity trends.
  • The spatiotemporal evolution of the indices based on ERA5-Land indicates the climate change patterns over the study area.
  • The exploited indices seriously contribute to realizing and comprehending the overall alterations of the climate undergone territorially and regionally.
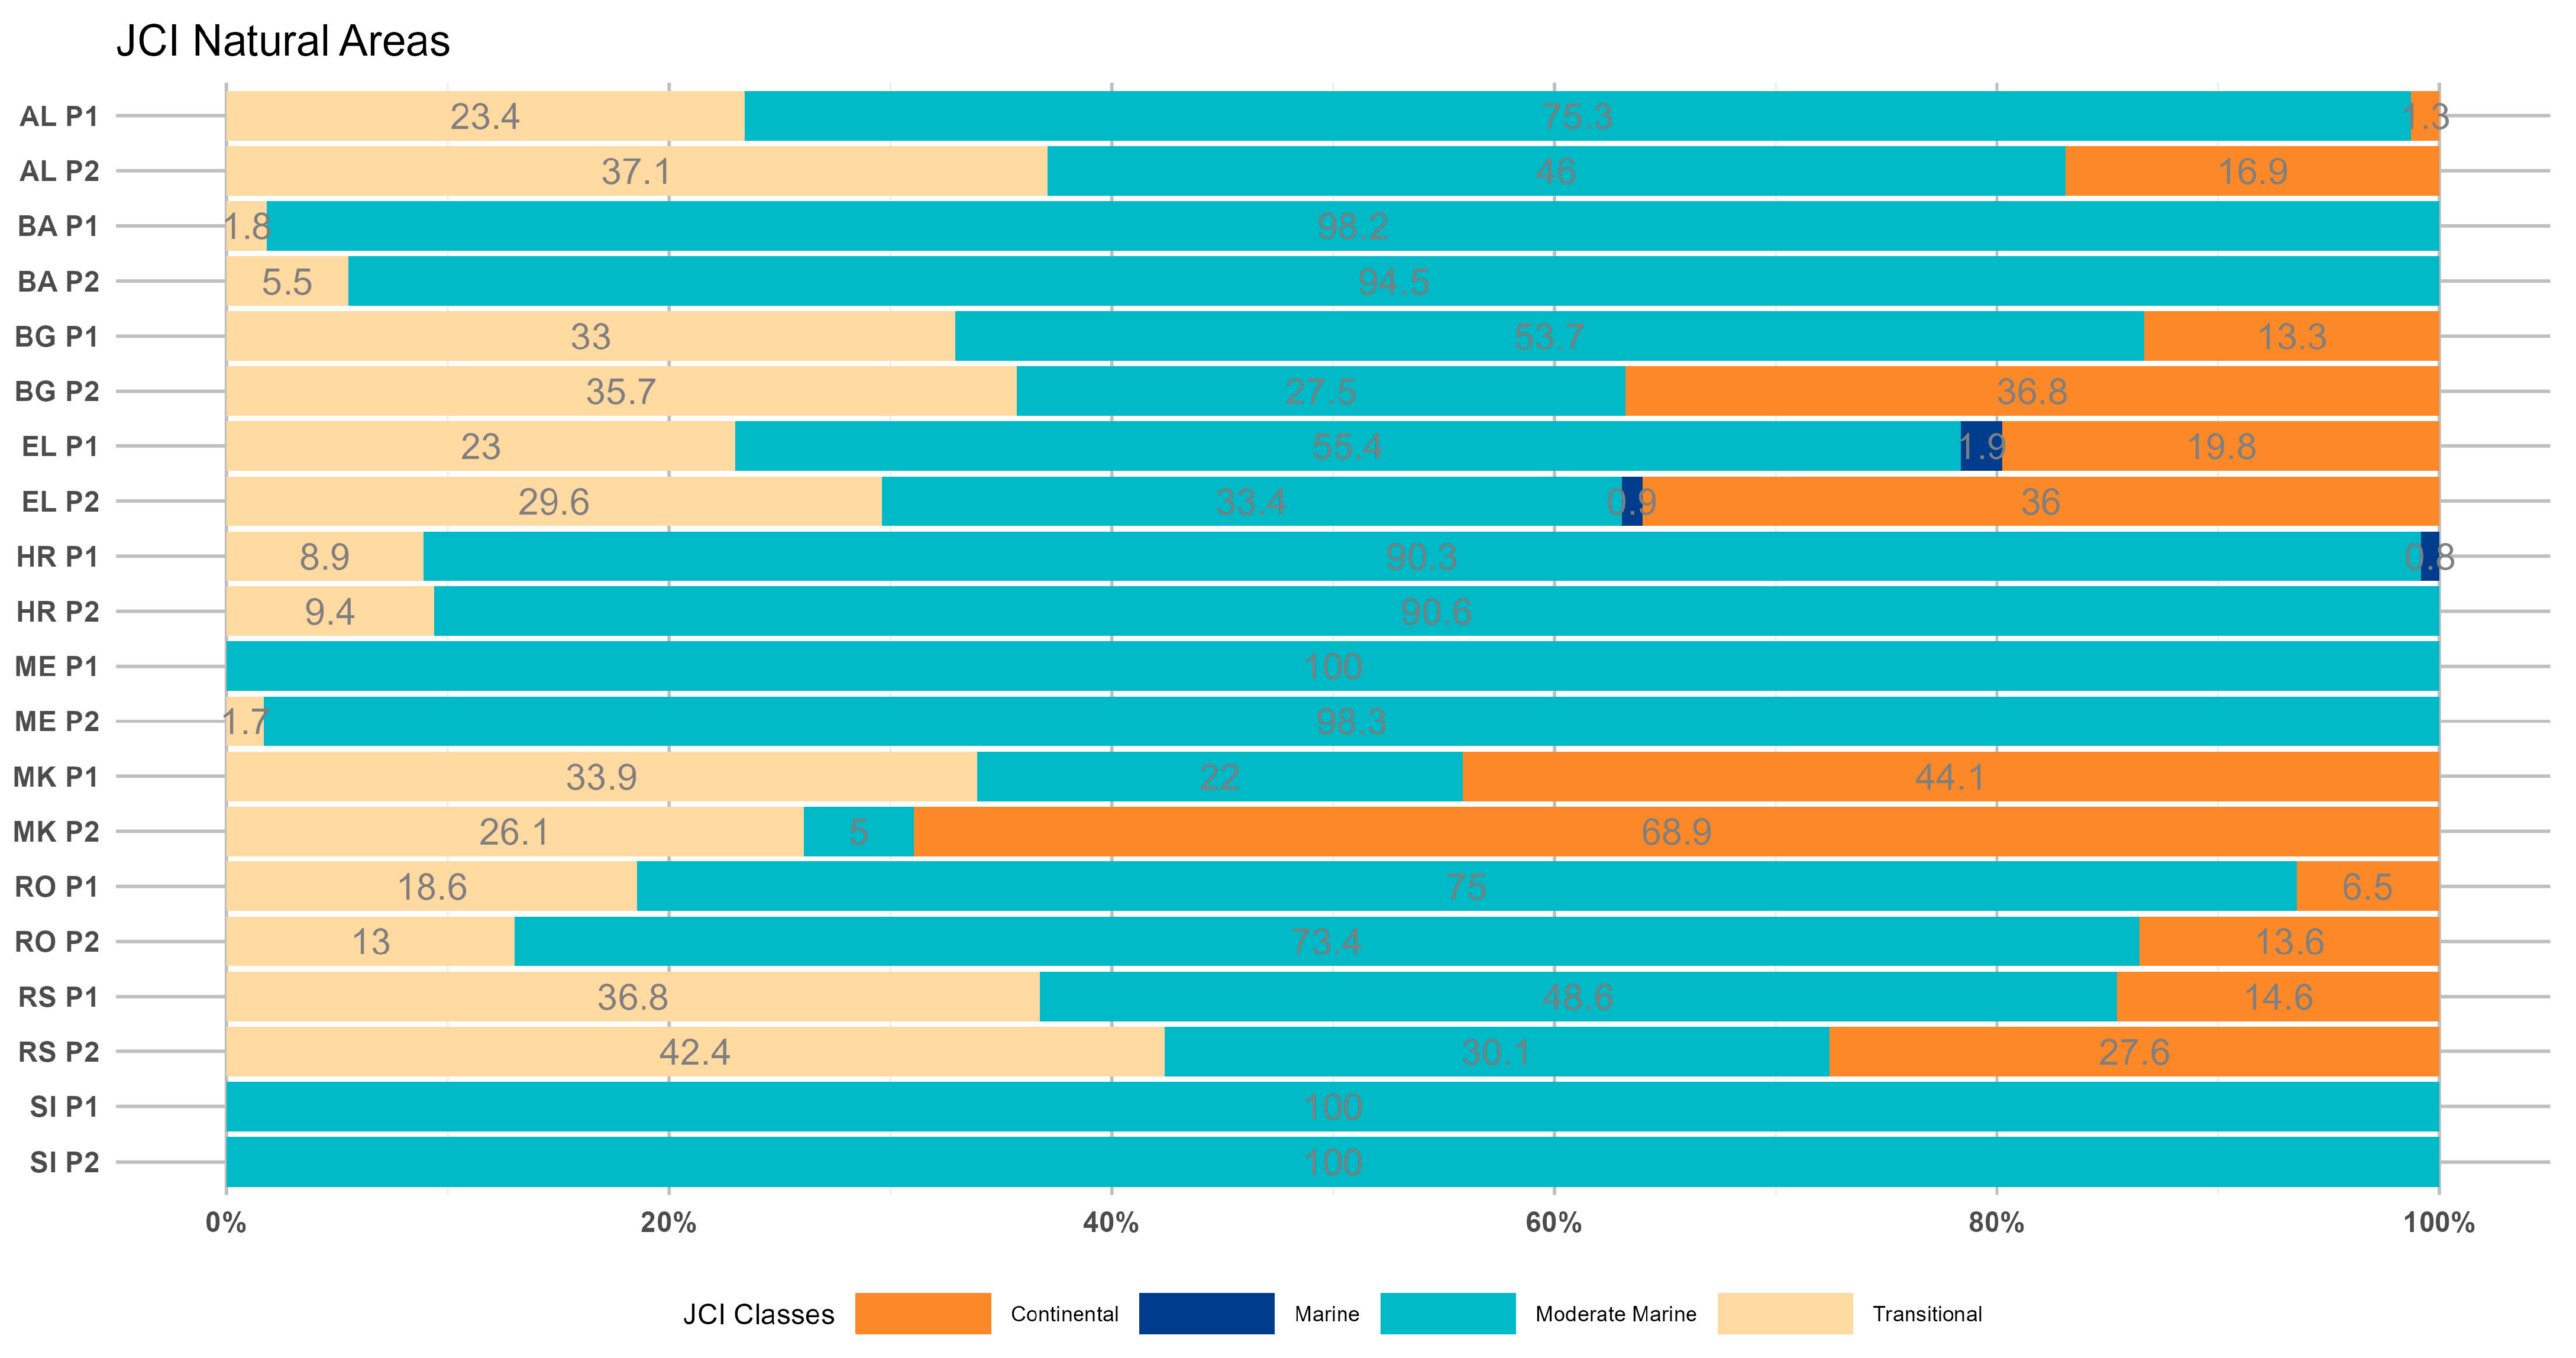
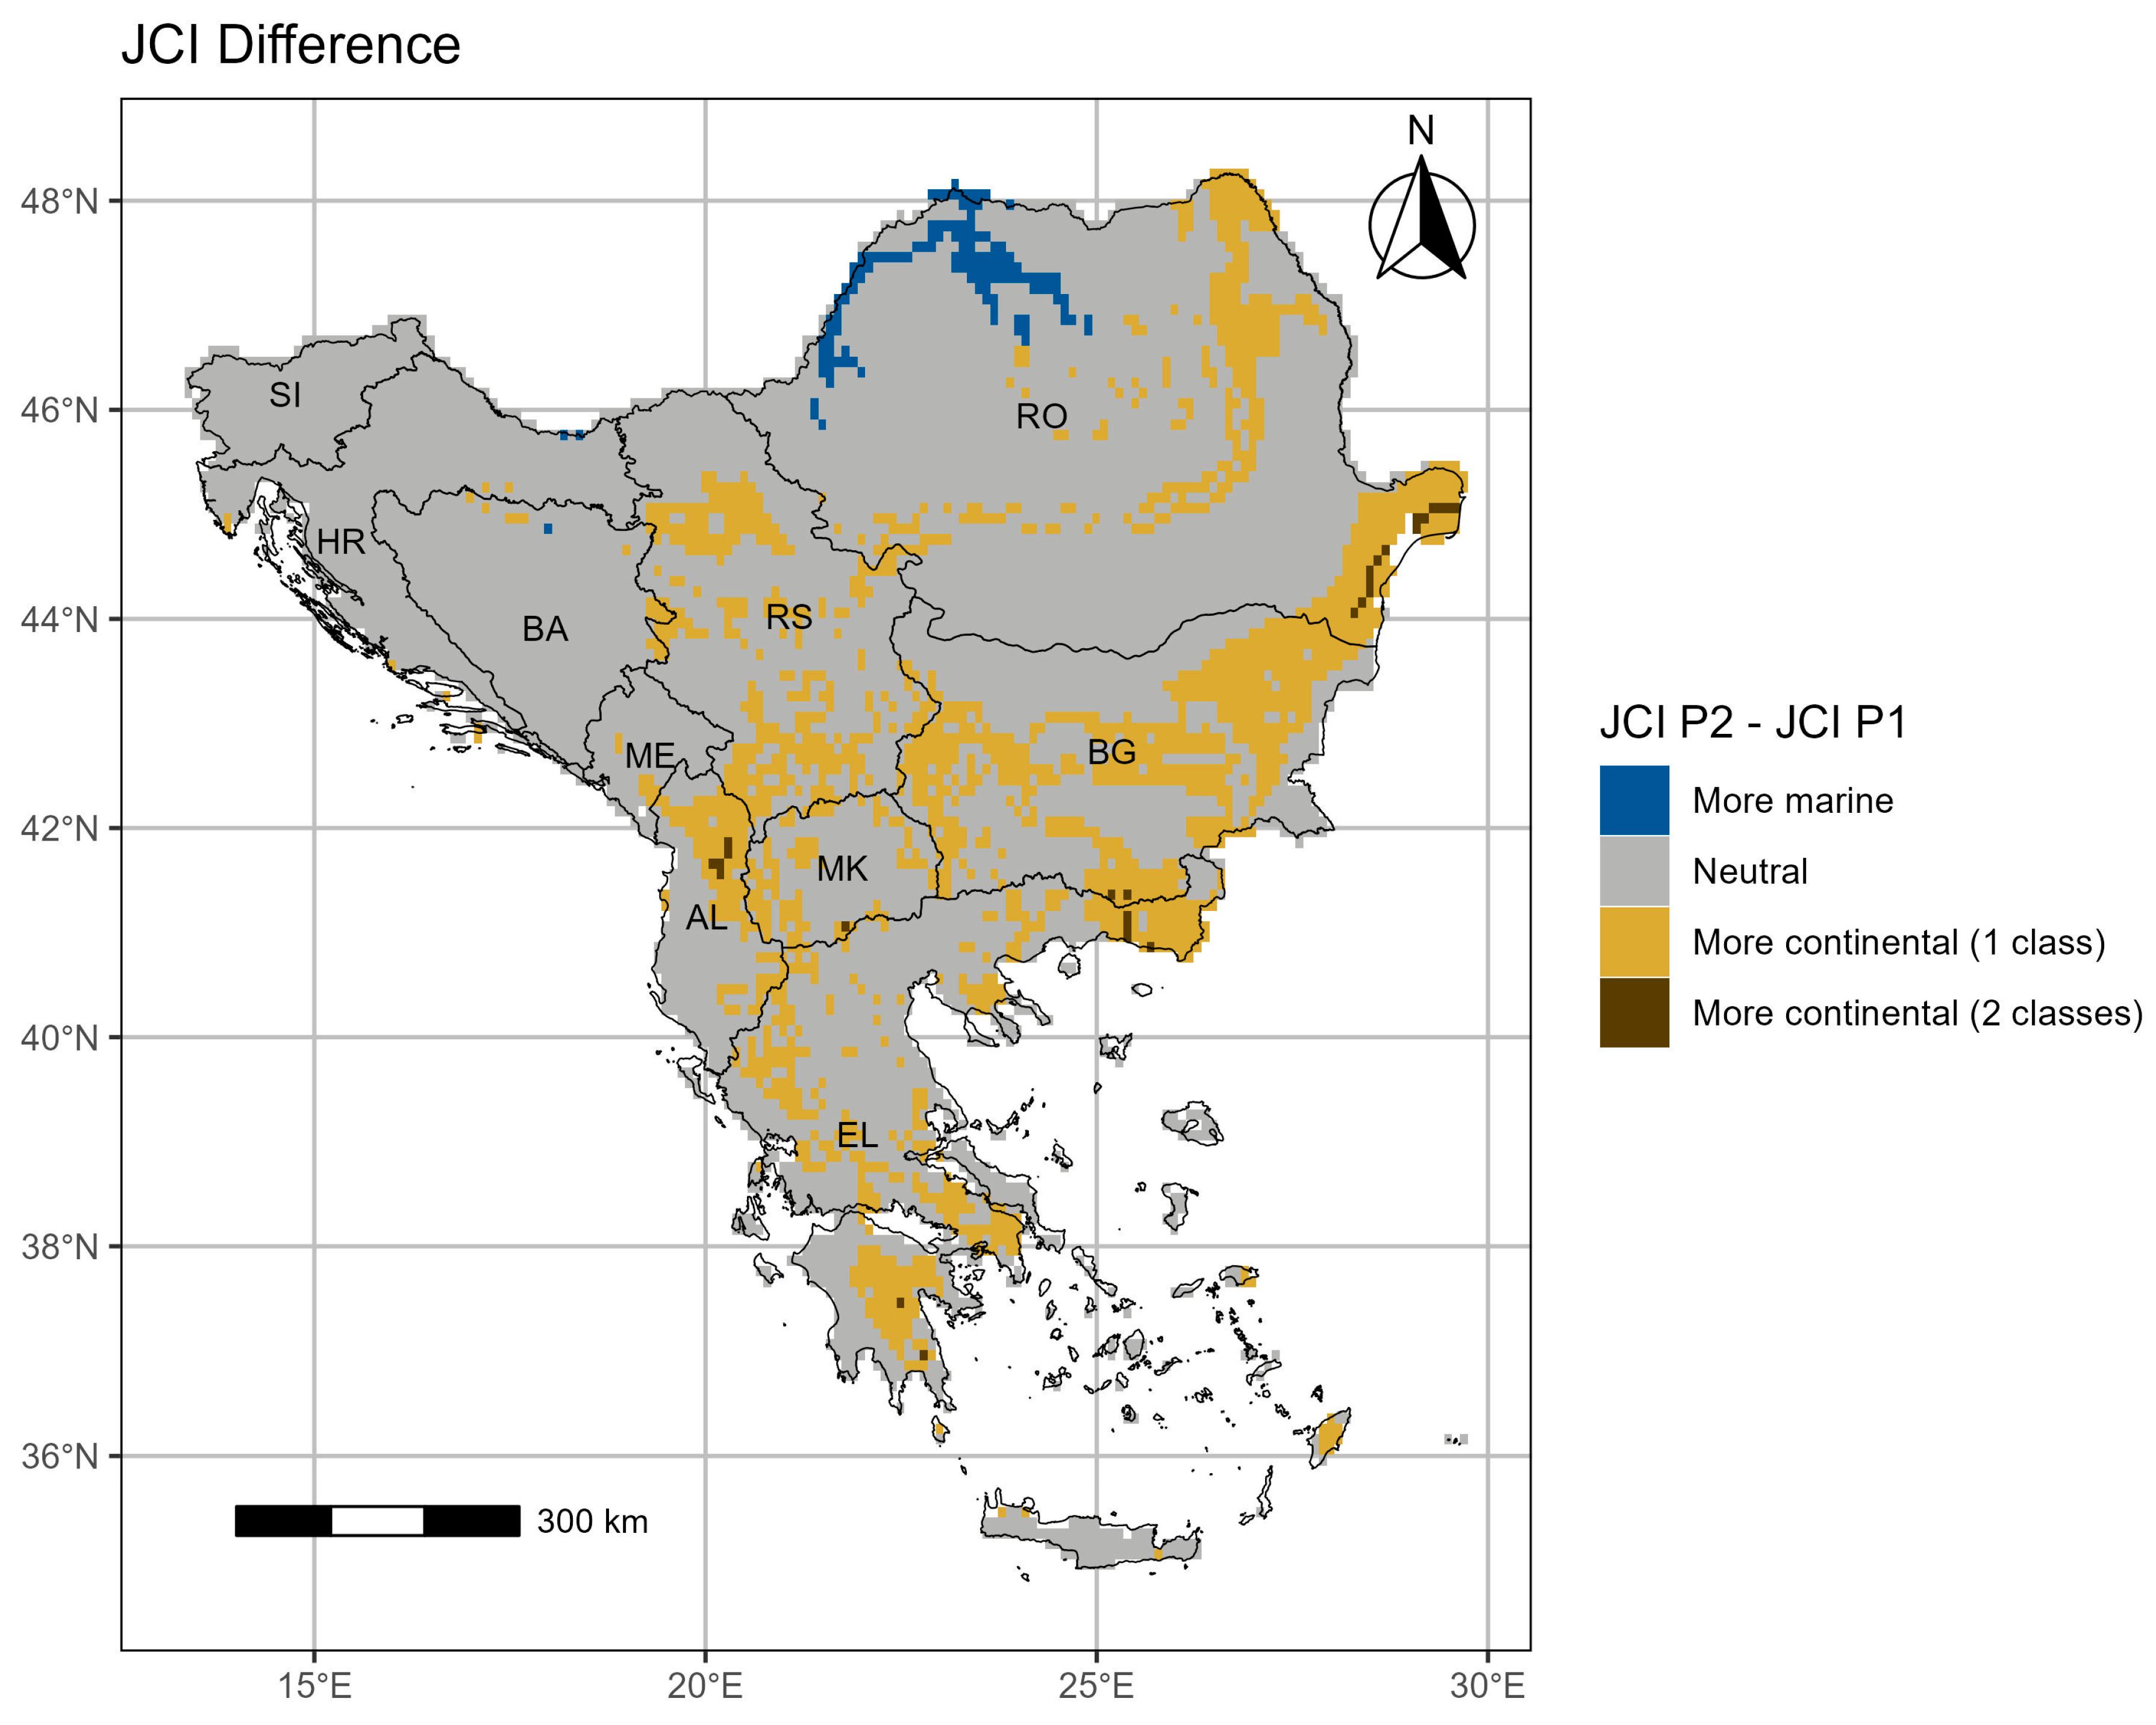
  • The JCI demonstrates an increasing continentality trend, mostly over the southern and eastern regions of the SEEu. This trend is basically shown by the spatiotemporal expansion of the Continental category over both the AgrA and NatA, majorly BG followed by RS, RO, and EL. This is exhibited also over the NatA of AL and MK. The changing climate towards intense continentality arises at the expense mostly of Moderate Marine conditions. The latter remains spatiotemporally stable over the SI.
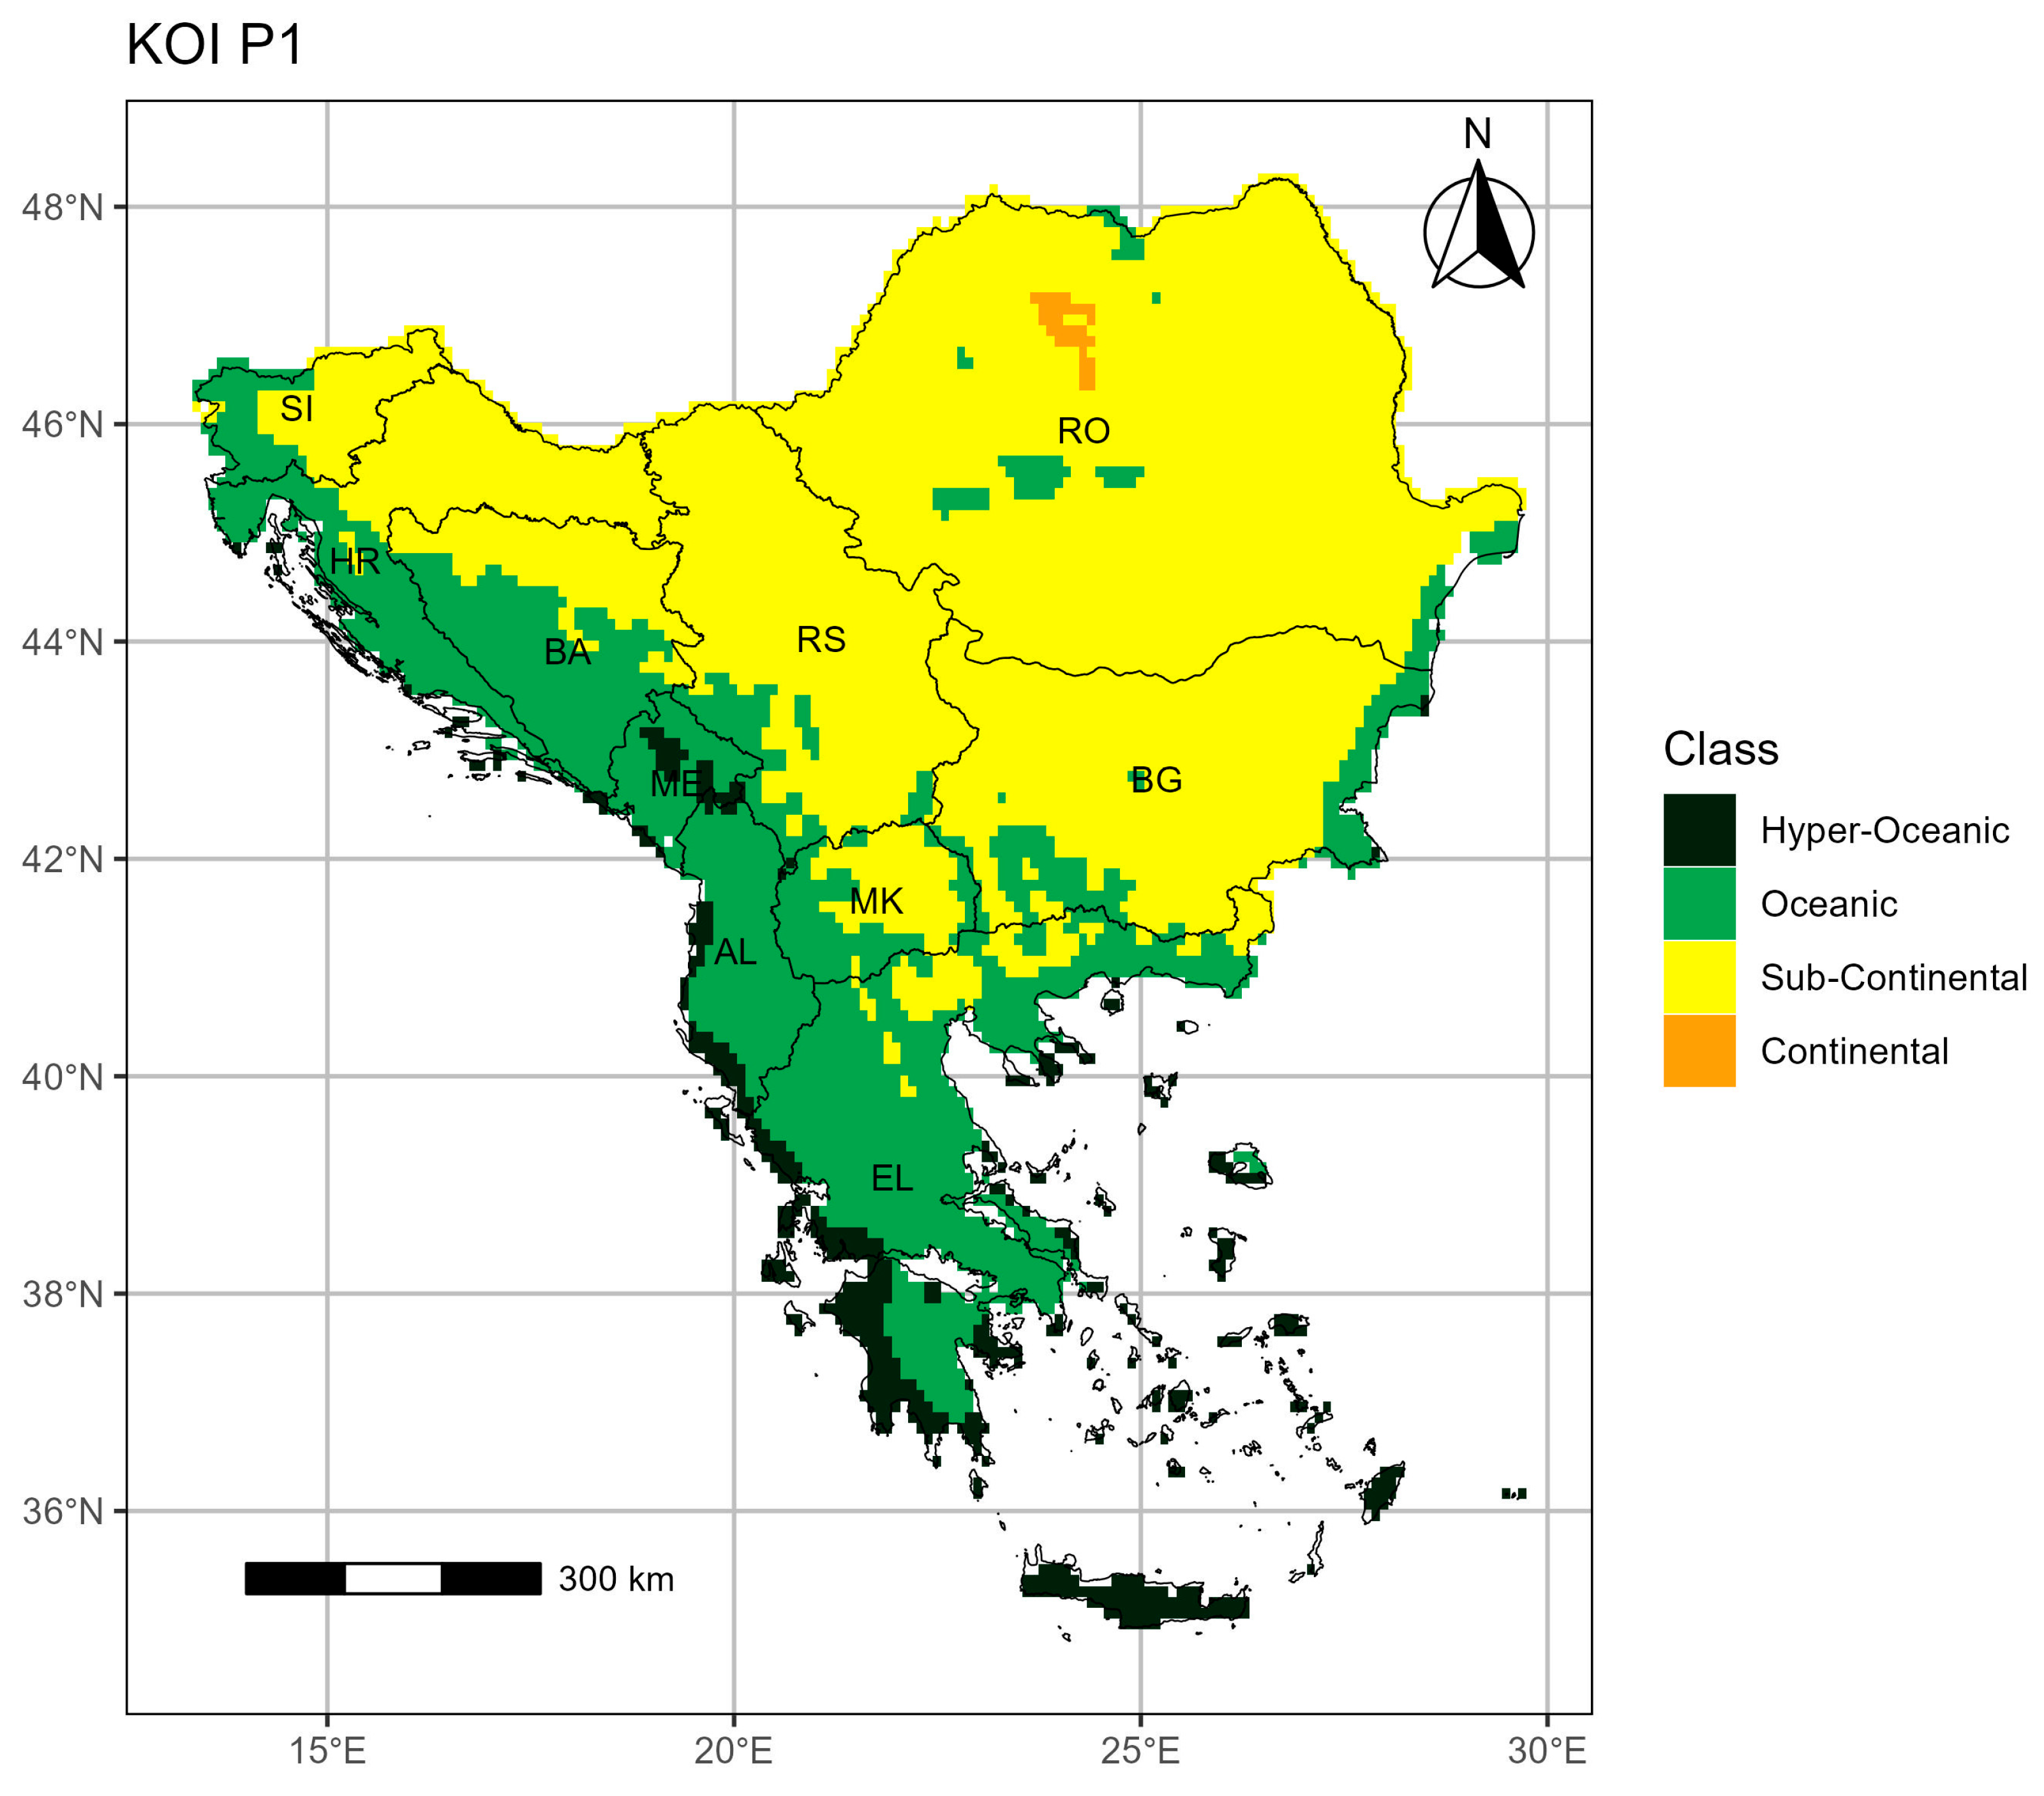
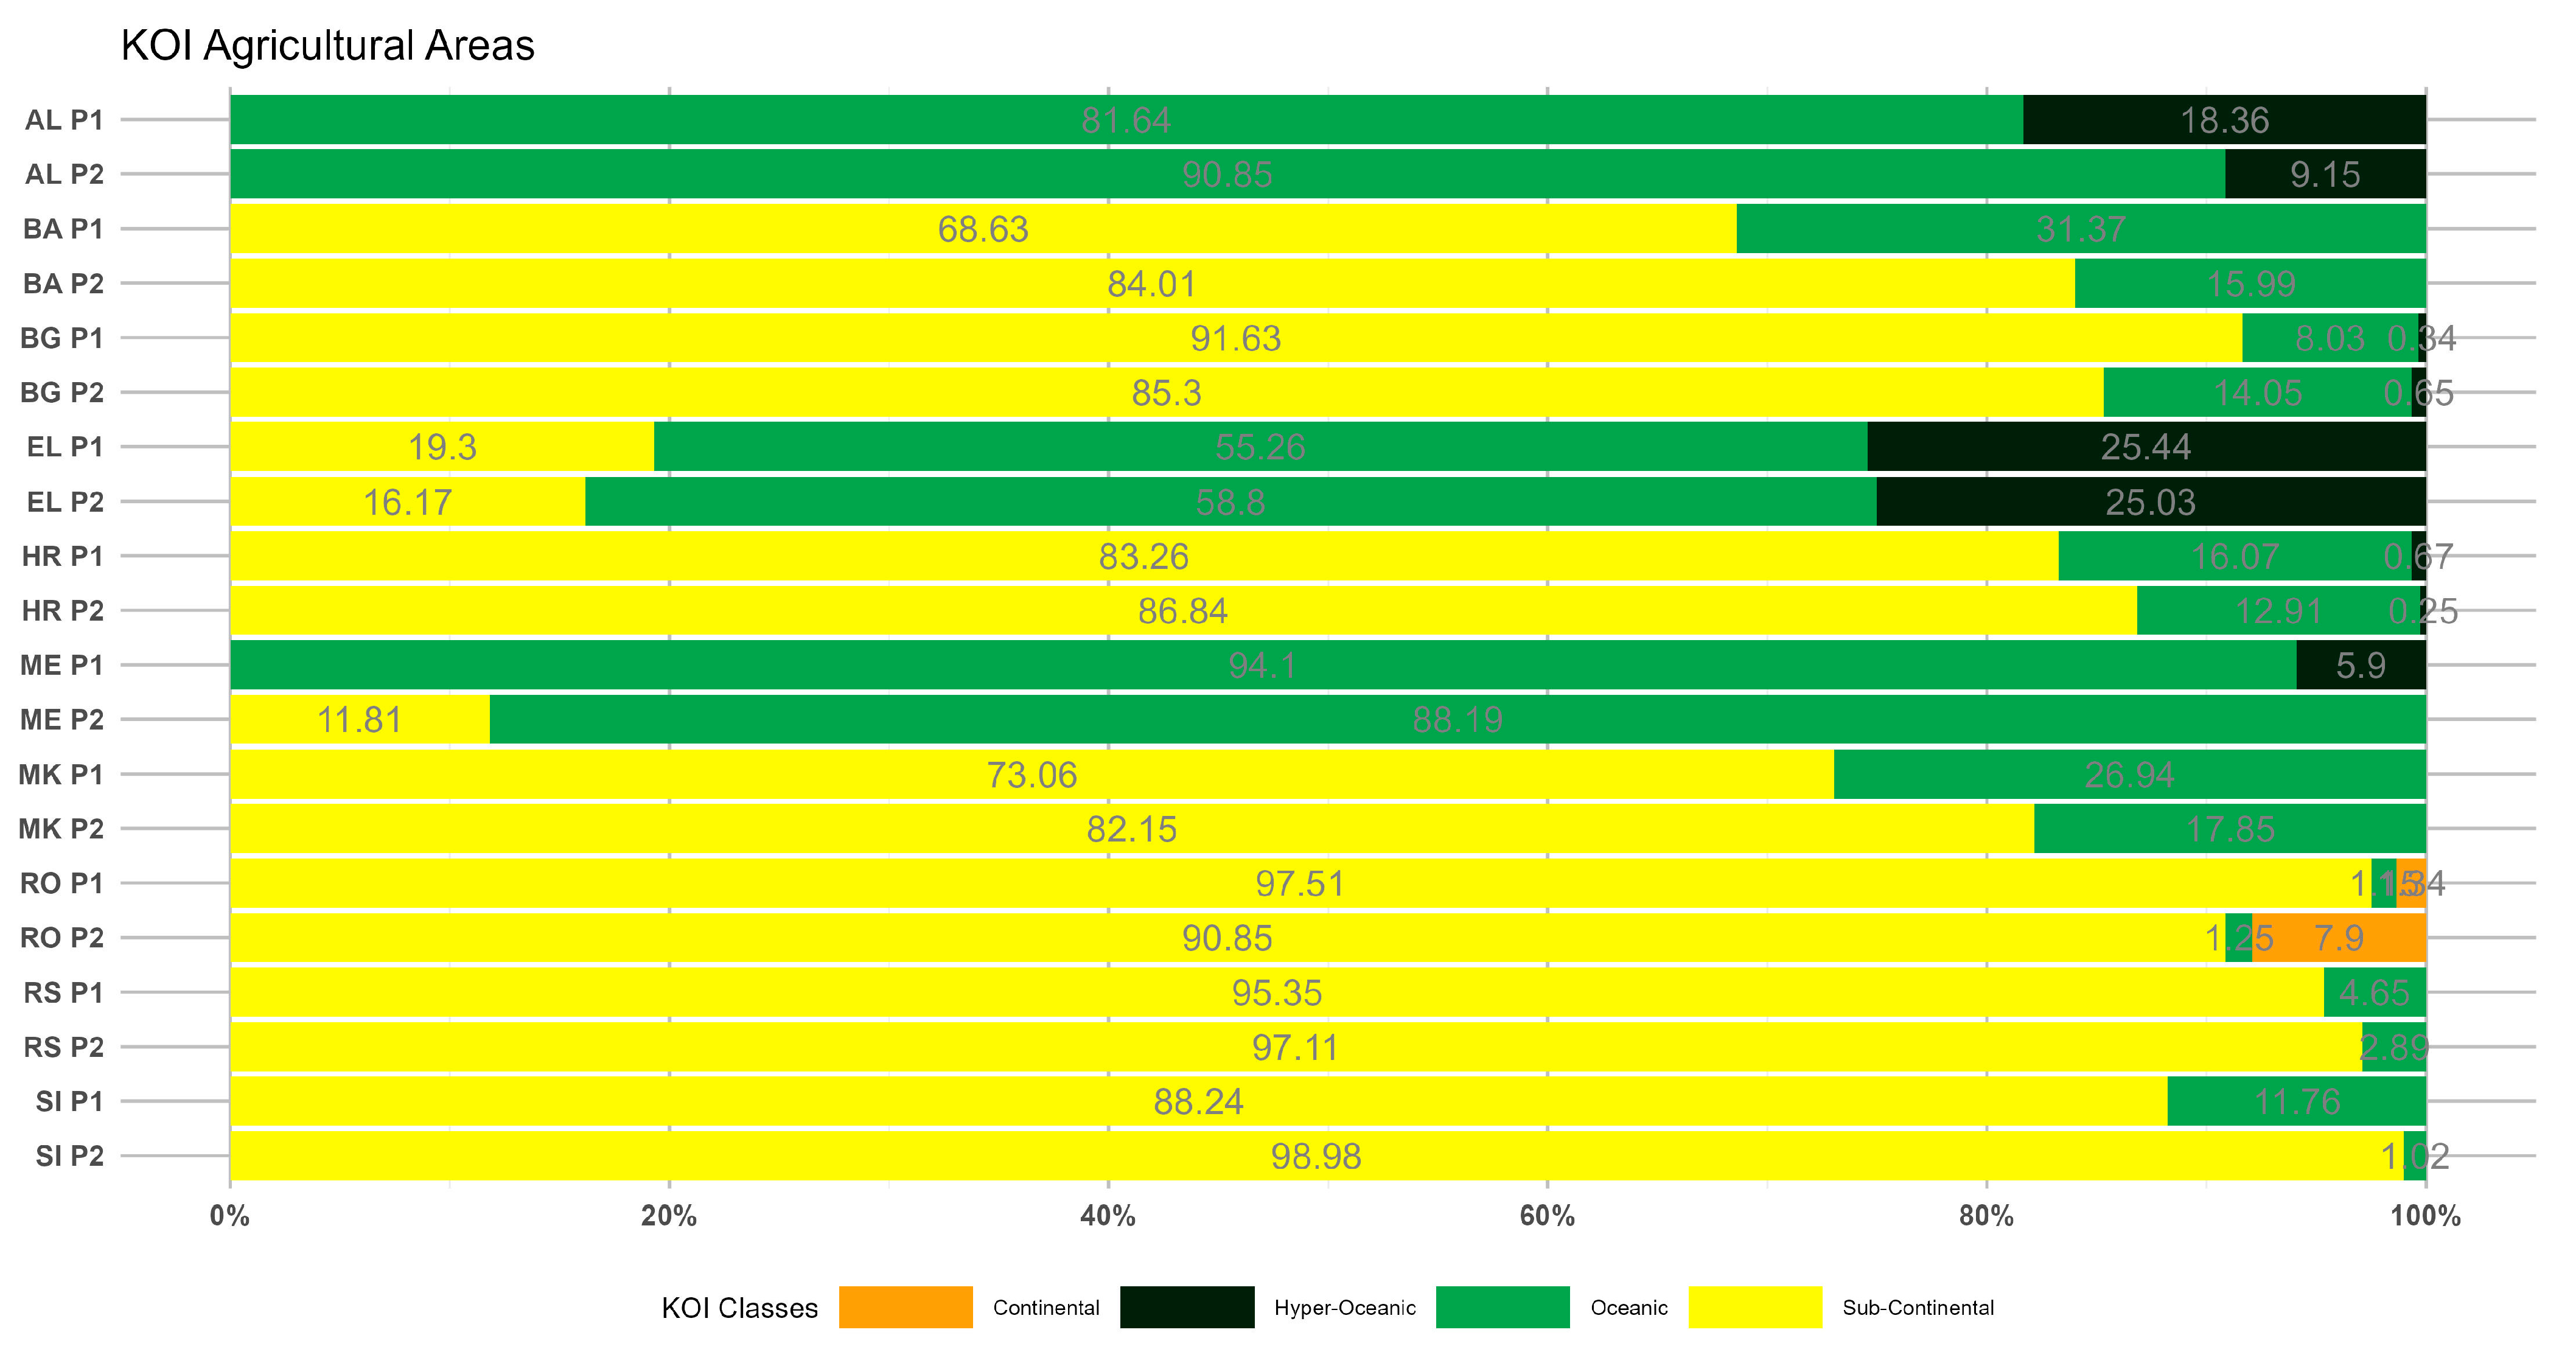
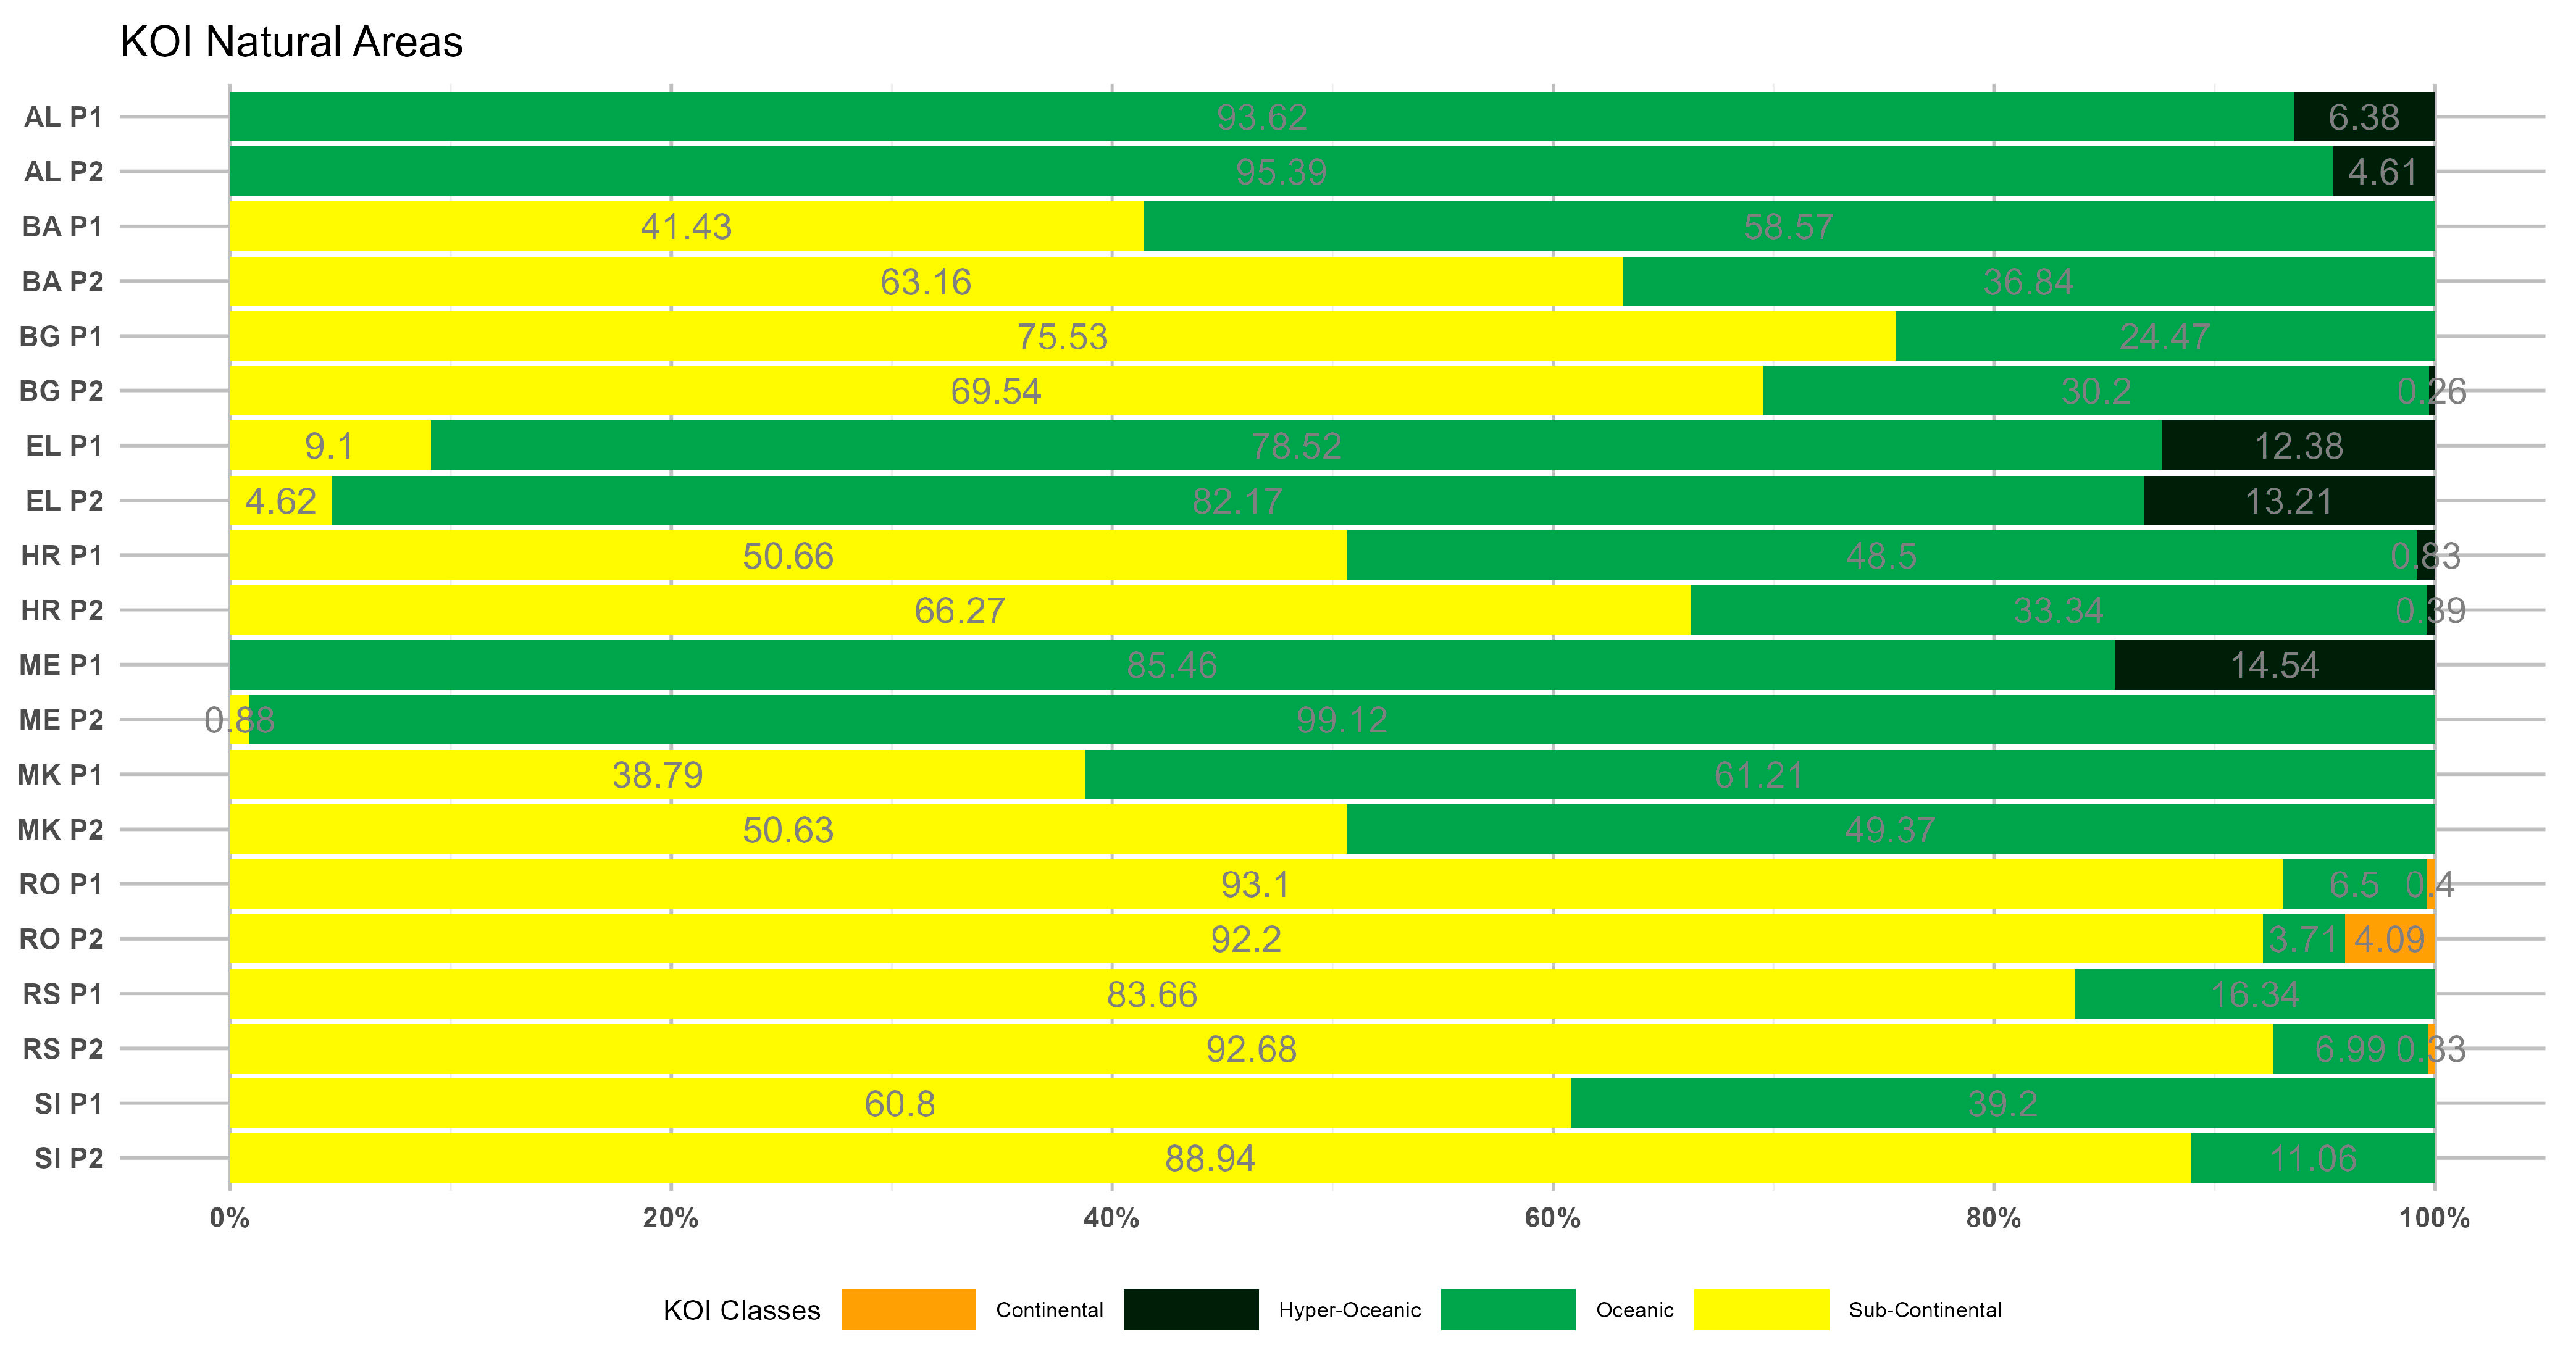
  • The KOI outcomes illustrate decreasing oceanicity (or increasing continentality) over most of the SEEu attributed to the spatial increase in the Sub-Continental and Continental regimes in the western and northern areas and the concomitant decrease in the Oceanic and Hyper-Oceanic categories over time. The Sub-Continental expansion is evident over both AgrA and NatA of BA, MK, SI but also over the NatA of HR and RS. The spatiotemporal expansion of the Continental category is exhibited over the AgrA and NatA of RO. On the contrary, oceanicity trends are shown over the AgrA and NatA of BG and, to a lesser extent, over the AgrA of EL.
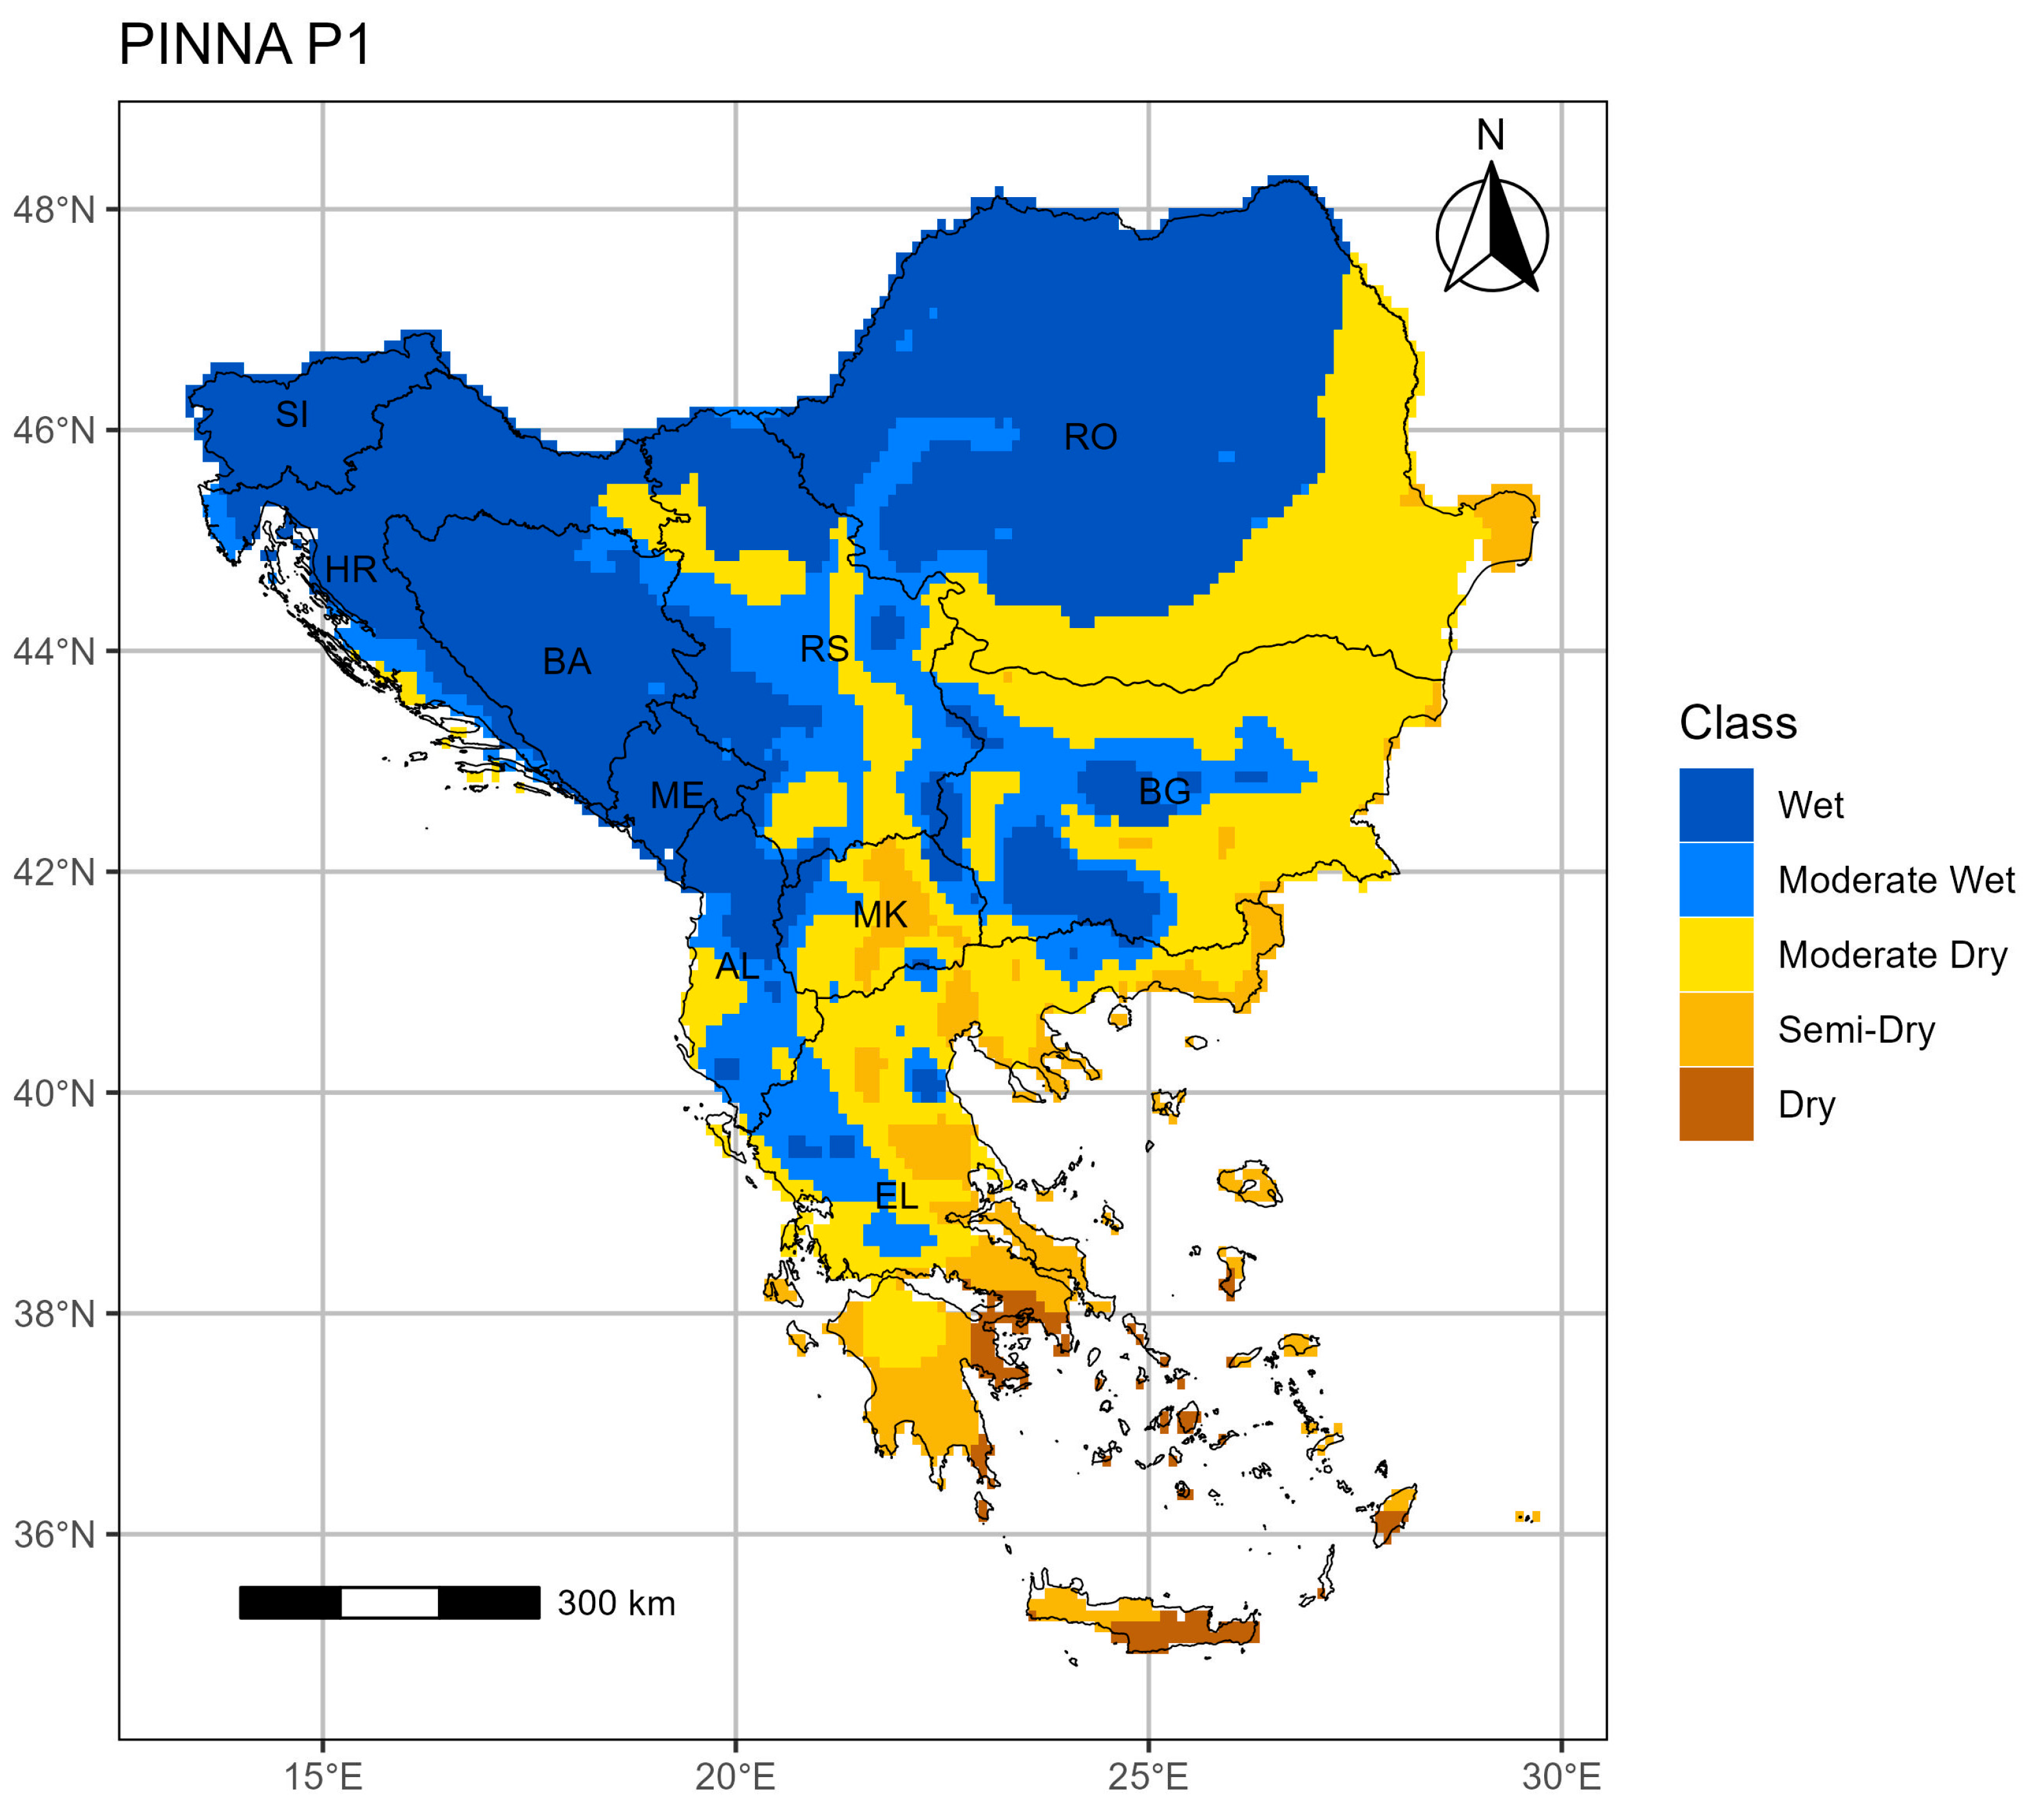
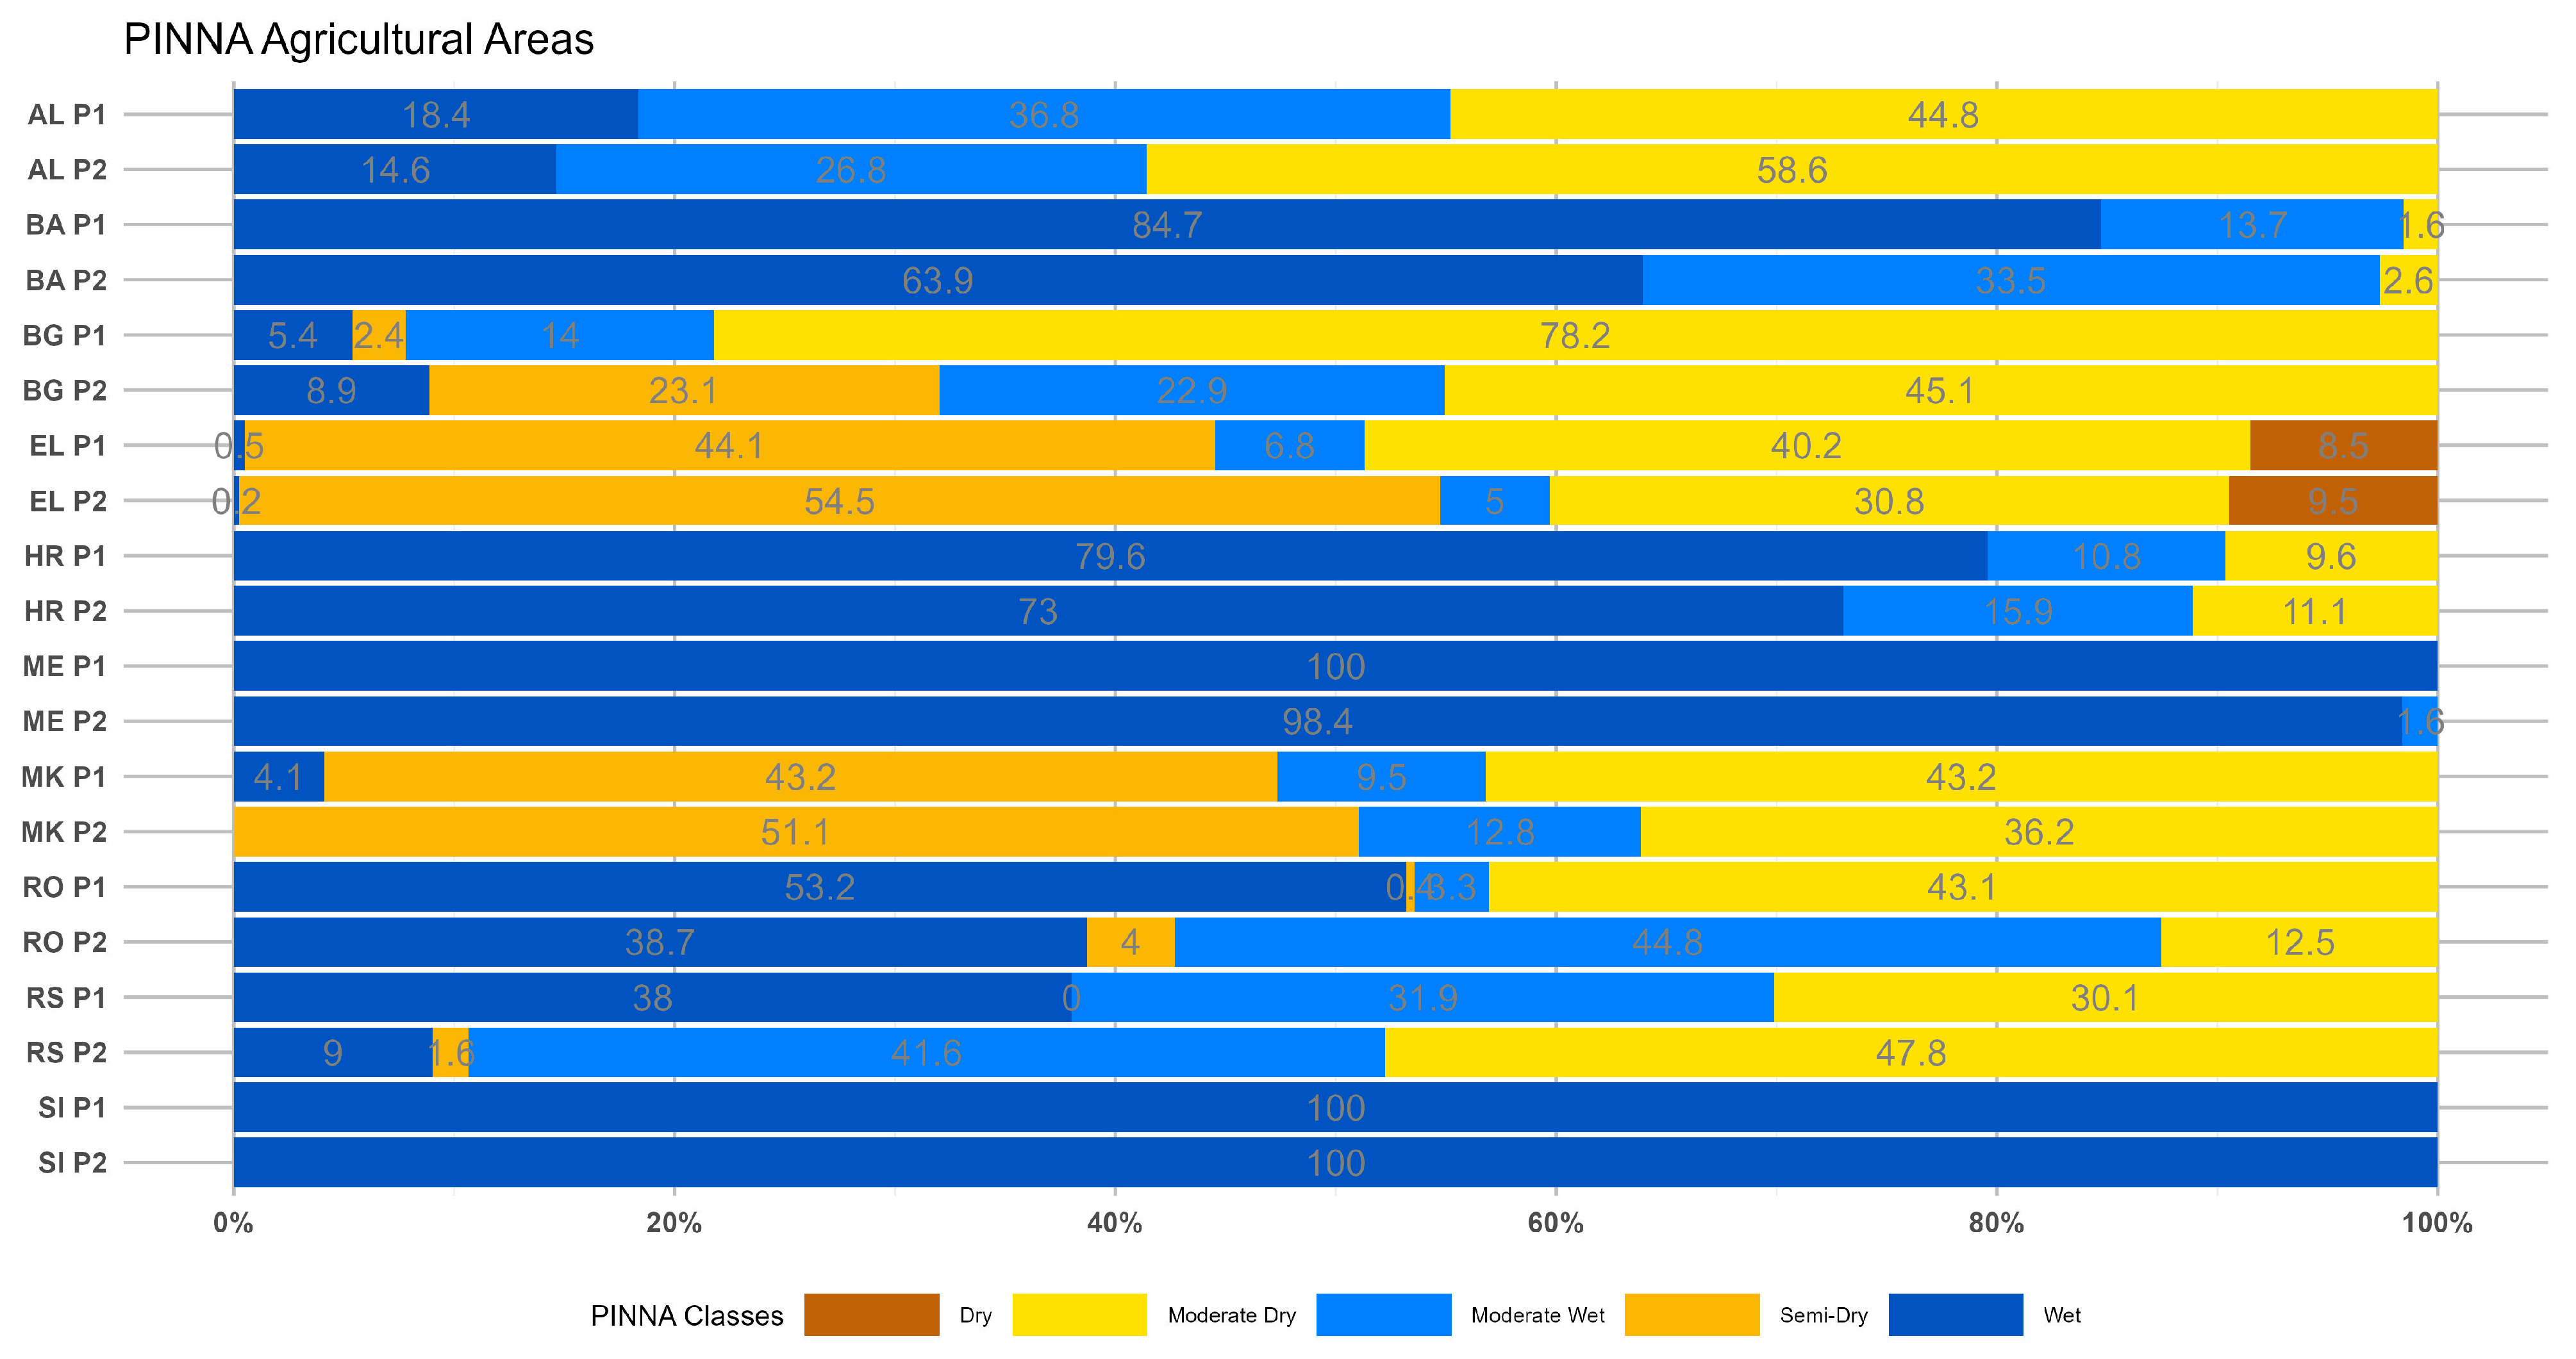
  • The distribution of PINNA climate categories displays an increasing aridity trend over the SEEu, which appears more intense in the central and eastern regions. This evolution is attributed to the spatiotemporal increase in the Semi-Dry and Moderate Wet climate types at the cost of the Wet conditions in most cases. The higher distribution of the Semi-Dry is majorly apparent over the AgrA and NatA of BG and on a smaller scale over both areas of MK and EL and the AgrA of RO. A remarkable expansion of the Moderate Wet climate is demonstrated over the AgrA and NatA of RO and BA and, to a lesser degree, over the respective areas of HR and MK and the AgrA of BG and RS. Slight increase in the Dry is shown over EL, while the Wet regime over SI remains spatiotemporally unmodified.
  • Overall, the tendency towards increased continentality and aridity concerns the conservation, sustainability, and development of agricultural and natural ecosystems. The increasing temperature and decreasing precipitation expected to comprise more intense phenomena in the future, particularly over the SEEu, may be evaluated as serious risk features and furthermore, may be labeled as threats to sustainability mainly regarding water availability.
  • It is highlighted that the Semi-Dry and Continental regimes impact more agricultural areas and depend on irrigation or need supplementary water inputs to achieve sustainability goals. The evolved, more xerothermic climates influence expanded natural formations and are, therefore, already more susceptive to adverse conditions.
  • This reality necessitates the obligation to implement mitigation plans and adaptation measures by considering the gradual spatiotemporal evolution of a dry–thermal trend, which appears to be continually increasing up to the present and in the future, particularly in Southeastern European territory.

Author Contributions

Conceptualization, I.C.; methodology, I.C.; investigation I.C.; resources, F.D; writing, F.D.; writing-materials and methods, I.C.; review and editing, I.C. and F.D.; visualization, I.C.; supervision, I.C. All authors have read and agreed to the published version of the manuscript.

Funding

This research received no external funding.

Data Availability Statement

All data is available upon request. In Zenodo repository readers can find the spatial statistics results. Link: https://doi.org/10.5281/zenodo.15615422 (accessed on 30 May 2025).

Conflicts of Interest

The authors declare no conflicts of interest.

Abbreviations

The following abbreviations are used in this manuscript:
SEEuSoutheastern Europe
ALAlbania
BABosnia Herzegovina
BGBulgaria
SICroatia
ELGreece
MEMontenegro
MKNorth Macedonia
RORomania
RSSerbia
SISlovenia
JCIJohansson Continentality index
KOIKerner Oceanity index
PINNAPinna Combinative index
AgrAAgricultural areas
NatANatural areas
p1First period (1964–1993)
p2Second period (1994–2023)

References

  1. Hernández-Morcillo, M.; Burgess, P.; Mirck, J.; Pantera, A.; Plieninger, T. Scanning Agroforestry-Based Solutions for Climate Change Mitigation and Adaptation in Europe. Environ. Sci. Policy 2018, 80, 44–52. [Google Scholar] [CrossRef]
  2. European Environment Agency (EEA). Global and European Temperatures. 2024. Available online: https://www.eea.europa.eu/en/analysis/indicators/global-and-european-temperatures (accessed on 8 February 2025).
  3. Vicente-Serrano, S.M.; Beguería, S.; López-Moreno, J.I. A Multiscalar Drought Index Sensitive to Global Warming: The Standardized Precipitation Evapotranspiration Index. J. Clim. 2010, 23, 1696–1718. [Google Scholar] [CrossRef]
  4. Spinoni, J.; Naumann, G.; Vogt, J.V. Pan-European Seasonal Trends and Recent Changes of Drought Frequency and Severity. Glob. Planet. Change 2017, 148, 113–130. [Google Scholar] [CrossRef]
  5. André, J.; D’Andrea, F.; Drobinski, P.; Muller, C. Regimes of Precipitation Change Over Europe and the Mediterranean. J. Geophys. Res. Atmos. 2024, 129, e2023JD040413. [Google Scholar] [CrossRef]
  6. Berényi, A.; Bartholy, J.; Pongrácz, R. Analysis of Precipitation-Related Climatic Conditions in European Plain Regions. Weather Clim. Extrem. 2023, 42, 100610. [Google Scholar] [CrossRef]
  7. Charalampopoulos, I.; Droulia, F.; Tsiros, I.X. Projecting Bioclimatic Change over the South-Eastern European Agricultural and Natural Areas via Ultrahigh-Resolution Analysis of the de Martonne Index. Atmosphere 2023, 14, 858. [Google Scholar] [CrossRef]
  8. Kelebek, M.B.; Batibeniz, F.; Önol, B. Exposure Assessment of Climate Extremes over the Europe–Mediterranean Region. Atmosphere 2021, 12, 633. [Google Scholar] [CrossRef]
  9. Markonis, Y.; Kumar, R.; Hanel, M.; Rakovec, O.; Máca, P.; AghaKouchak, A. The Rise of Compound Warm-Season Droughts in Europe. Sci. Adv. 2021, 7, eabb9668. [Google Scholar] [CrossRef]
  10. Moravec, V.; Markonis, Y.; Rakovec, O.; Svoboda, M.; Trnka, M.; Kumar, R.; Hanel, M. Europe under Multi-Year Droughts: How Severe Was the 2014–2018 Drought Period? Environ. Res. Lett. 2021, 16, 034062. [Google Scholar] [CrossRef]
  11. Rakovec, O.; Samaniego, L.; Hari, V.; Markonis, Y.; Moravec, V.; Thober, S.; Hanel, M.; Kumar, R. The 2018–2020 Multi-Year Drought Sets a New Benchmark in Europe. Earths Future 2022, 10, e2021EF002394. [Google Scholar] [CrossRef]
  12. Naumann, G.; Cammalleri, C.; Mentaschi, L.; Feyen, L. Increased Economic Drought Impacts in Europe with Anthropogenic Warming. Nat. Clim. Change 2021, 11, 485–491. [Google Scholar] [CrossRef]
  13. Cook, B.I.; Anchukaitis, K.J.; Touchan, R.; Meko, D.M.; Cook, E.R. Spatiotemporal Drought Variability in the Mediterranean over the Last 900 Years. J. Geophys. Res. Atmos. 2016, 121, 2060–2074. [Google Scholar] [CrossRef]
  14. Nistor, M.-M. High-Resolution Projections of the Aridity in Europe under Climate Change. In Climate and Land Use Impacts on Natural and Artificial Systems. Mitigation and Adaptation; Nistor, M.-M., Ed.; Elsevier: Amsterdam, The Netherlands, 2021; pp. 73–90. ISBN 978-0-12-822184-6. [Google Scholar]
  15. Dascălu, S.; Gothard, M.; Bojariu, R.; Birsan, M.-V.; Cică, R.; Vintila, R.; Adler, M.-J.; Chendeş, V.; Mic, R.-P. Drought-Related Variables over the Bârlad Basin (Eastern Romania) under Climate Change Scenarios. Catena 2016, 141, 92–99. [Google Scholar] [CrossRef]
  16. Gao, X.; Giorgi, F. Increased Aridity in the Mediterranean Region under Greenhouse Gas Forcing Estimated from High Resolution Simulations with a Regional Climate Model. Glob. Planet. Change 2008, 62, 195–209. [Google Scholar] [CrossRef]
  17. Baltas, E. Spatial distribution of climatic indices in northern Greece. Meteorol. Appl. 2007, 14, 69–78. [Google Scholar] [CrossRef]
  18. Nistor, M.M. Spatial Distribution of Climate Indices in the Emilia-Romagna Region. Meteorol. Appl. 2016, 23, 304–313. [Google Scholar] [CrossRef]
  19. Cheval, S.; Dumitrescu, A.; Birsan, M.-V. Variability of the Aridity in the South-Eastern Europe over 1961–2050. CATENA 2017, 151, 74–86. [Google Scholar] [CrossRef]
  20. Nistor, M.-M. Climate Change Effect on Groundwater Resources in South East Europe during 21st Century. Quat. Int. 2019, 504, 171–180. [Google Scholar] [CrossRef]
  21. Baltas, E.A. Climatic Conditions and Availability of Water Resources in Greece. Int. J. Water Resour. Dev. 2008, 24, 635–649. [Google Scholar] [CrossRef]
  22. Droulia, F.; Charalampopoulos, I. Future Climate Change Impacts on European Viticulture: A Review on Recent Scientific Advances. Atmosphere 2021, 12, 495. [Google Scholar] [CrossRef]
  23. Droulia, F.; Charalampopoulos, I. A Review on the Observed Climate Change in Europe and Its Impacts on Viticulture. Atmosphere 2022, 13, 837. [Google Scholar] [CrossRef]
  24. Marini, G.; Fontana, N.; Mishra, A.K. Investigating Drought in Apulia Region, Italy Using SPI and RDI. Theor. Appl. Climatol. 2019, 137, 383–397. [Google Scholar] [CrossRef]
  25. Paltineanu, C.; Mihailescu, I.F.; Seceleanu, I.; Dragota, C.; Vasenciuc, F. Using Aridity Indices to Describe Some Climate and Soil Features in Eastern Europe: A Romanian Case Study. Theor. Appl. Climatol. 2007, 90, 263–274. [Google Scholar] [CrossRef]
  26. Corduneanu, F.; Țopa, D.-C.; Balan, I.-E.; Balan, I.; Boți, I.; Pricop, C.; Crețu, A.; Bucur, D. Northeast Romania Water Resources Management in the Context of Climate Change Issue—Iaşi County Case Study. Rom. Agric. Res. 2021, 38, 429–439. [Google Scholar] [CrossRef]
  27. Aridity—American Meteorological Society (AMS)—Glossary of Meteorology. Available online: https://glossary.ametsoc.org/wiki/Aridity (accessed on 9 February 2025).
  28. Charalampopoulos, I. Agrometeorological Conditions and Agroclimatic Trends for the Maize and Wheat Crops in the Balkan Region. Atmosphere 2021, 12, 671. [Google Scholar] [CrossRef]
  29. Charalampopoulos, I.; Droulia, F. Frost Conditions Due to Climate Change in South-Eastern Europe via a High-Spatiotemporal-Resolution Dataset. Atmosphere 2022, 13, 1407. [Google Scholar] [CrossRef]
  30. Straffelini, E.; Tarolli, P. Climate Change-Induced Aridity Is Affecting Agriculture in Northeast Italy. Agric. Syst. 2023, 208, 103647. [Google Scholar] [CrossRef]
  31. Şmuleac, L.; Rujescu, C.; Șmuleac, A.; Imbrea, F.; Radulov, I.; Manea, D.; Ienciu, A.; Adamov, T.; Pașcalău, R. Impact of Climate Change in the Banat Plain, Western Romania, on the Accessibility of Water for Crop Production in Agriculture. Agriculture 2020, 10, 437. [Google Scholar] [CrossRef]
  32. Charalampopoulos, I.; Polychroni, I.; Droulia, F.; Nastos, P.T. The Spatiotemporal Evolution of the Growing Degree Days Agroclimatic Index for Viticulture over the Northern Mediterranean Basin. Atmosphere 2024, 15, 485. [Google Scholar] [CrossRef]
  33. Charalampopoulos, I.; Droulia, F.; Kokkoris, I.P.; Dimopoulos, P. Future Bioclimatic Change of Agricultural and Natural Areas in Central Europe: An Ultra-High Resolution Analysis of the De Martonne Index. Water 2023, 15, 2563. [Google Scholar] [CrossRef]
  34. Charalampopoulos, I.; Droulia, F.; Evans, J. The Bioclimatic Change of the Agricultural and Natural Areas of the Adriatic Coastal Countries. Sustainability 2023, 15, 4867. [Google Scholar] [CrossRef]
  35. Charalampopoulos, I.; Droulia, F.; Kokkoris, I.P.; Dimopoulos, P. Projections on the Spatiotemporal Bioclimatic Change over the Phytogeographical Regions of Greece by the Emberger Index. Water 2024, 16, 2070. [Google Scholar] [CrossRef]
  36. Hu, B.; Wu, H.; Li, Z.; Jing, H.; Zheng, Z.; Han, H.; Cheng, X.; Kang, F. Aridification Weakens Ecosystem Services by Reducing Complexity and Stability of Socio-Ecological Networks. J. Clean. Prod. 2023, 387, 135823. [Google Scholar] [CrossRef]
  37. Gumus, V.; El Moçayd, N.; Seker, M.; Seaid, M. Future Projection of Droughts in Morocco and Potential Impact on Agriculture. J. Environ. Manag. 2024, 367, 122019. [Google Scholar] [CrossRef]
  38. Rodrigo-Comino, J.; Salvia, R.; Quaranta, G.; Cudlín, P.; Salvati, L.; Gimenez-Morera, A. Climate Aridity and the Geographical Shift of Olive Trees in a Mediterranean Northern Region. Climate 2021, 9, 64. [Google Scholar] [CrossRef]
  39. Charalampopoulos, I.; Droulia, F. The Agro-Meteorological Caused Famines as an Evolutionary Factor in the Formation of Civilisation and History: Representative Cases in Europe. Climate 2021, 9, 5. [Google Scholar] [CrossRef]
  40. Lickley, M.; Solomon, S. Drivers, Timing and Some Impacts of Global Aridity Change. Environ. Res. Lett. 2018, 13, 104010. [Google Scholar] [CrossRef]
  41. Tariq, A.; Sardans, J.; Zeng, F.; Graciano, C.; Hughes, A.C.; Farré-Armengol, G.; Peñuelas, J. Impact of Aridity Rise and Arid Lands Expansion on Carbon-Storing Capacity, Biodiversity Loss, and Ecosystem Services. Glob. Change Biol. 2024, 30, e17292. [Google Scholar] [CrossRef]
  42. Kheyruri, Y.; Sharafati, A.; Neshat, A. The Socioeconomic Impact of Severe Droughts on Agricultural Lands over Different Provinces of Iran. Agric. Water Manag. 2023, 289, 108550. [Google Scholar] [CrossRef]
  43. Gebru, A.B.; Gebreyohannes, T.; Kahsay, G.H. Modelling Climate Change and Aridity for Climate Impact Studies in Semi-Arid Regions: The Case of Giba Basin, Northern Ethiopia. Heliyon 2025, 11, e41693. [Google Scholar] [CrossRef]
  44. Myronidis, D. Theofanous Nikolaos Changes in Climatic Patterns and Tourism and Their Concomitant Effect on Drinking Water Transfers into the Region of South Aegean, Greece. Stoch. Environ. Res. Risk Assess. 2021, 35, 1725–1739. [Google Scholar] [CrossRef] [PubMed]
  45. Gebremedhin, M.A.; Abraha, A.Z.; Fenta, A.A. Changes in Future Climate Indices Using Statistical Downscaling Model in the Upper Baro Basin of Ethiopia. Theor. Appl. Climatol. 2018, 133, 39–46. [Google Scholar] [CrossRef]
  46. Gebremedhin, M.A.; Kahsay, G.H.; Fanta, H.G. Assessment of Spatial Distribution of Aridity Indices in Raya Valley, Northern Ethiopia. Appl. Water Sci. 2018, 8, 217. [Google Scholar] [CrossRef]
  47. Nistor, M.-M.; Mîndrescu, M. Climate Change Effect on Groundwater Resources in Emilia-Romagna Region: An Improved Assessment through NISTOR-CEGW Method. Quat. Int. 2019, 504, 214–228. [Google Scholar] [CrossRef]
  48. Spinoni, J.; Vogt, J.; Naumann, G.; Carrao, H.; Barbosa, P. Towards Identifying Areas at Climatological Risk of Desertification Using the Köppen-Geiger Classification and FAO Aridity Index. Int. J. Climatol. 2015, 35, 2210–2222. [Google Scholar] [CrossRef]
  49. Prăvălie, R.; Bandoc, G. Aridity Variability in the Last Five Decades in the Dobrogea Region, Romania. Arid Land Res. Manag. 2015, 29, 265–287. [Google Scholar] [CrossRef]
  50. Salvati, L.; Sateriano, A.; Zitti, M. Long-Term Land Cover Changes and Climate Variations—A Country-Scale Approach for a New Policy Target. Land Use Policy 2013, 30, 401–407. [Google Scholar] [CrossRef]
  51. Gavrilov, M.B.; An, W.; Xu, C.; Radaković, M.G.; Hao, Q.; Yang, F.; Guo, Z.; Perić, Z.; Gavrilov, G.; Marković, S.B. Independent Aridity and Drought Pieces of Evidence Based on Meteorological Data and Tree Ring Data in Southeast Banat, Vojvodina, Serbia. Atmosphere 2019, 10, 586. [Google Scholar] [CrossRef]
  52. Bešťáková, Z.; Strnad, F.; Vargas Godoy, M.R.; Singh, U.; Markonis, Y.; Hanel, M.; Máca, P.; Kyselý, J. Changes of the Aridity Index in Europe from 1950 to 2019. Theor. Appl. Climatol. 2023, 151, 587–601. [Google Scholar] [CrossRef]
  53. Gavrilov, M.B.; Radaković, M.G.; Sipos, G.; Mezősi, G.; Gavrilov, G.; Lukić, T.; Basarin, B.; Benyhe, B.; Fiala, K.; Kozák, P.; et al. Aridity in the Central and Southern Pannonian Basin. Atmosphere 2020, 11, 1269. [Google Scholar] [CrossRef]
  54. Milentijević, N.; Martić-Bursać, N.; Gocić, M.; Ivanović, M.; Strålman, S.O.; Pantelić, M.; Milošević, D.; Stričević, L. Spatio-Temporal Variability of Aridity and Humidity Indices in Bačka (Serbia). Pure Appl. Geophys. 2024, 182, 705–728. [Google Scholar] [CrossRef]
  55. Mihai, G.; Alexandru, A.-M.; Nita, I.-A.; Birsan, M.-V. Climate Change in the Provenance Regions of Romania over the Last 70 Years: Implications for Forest Management. Forests 2022, 13, 1203. [Google Scholar] [CrossRef]
  56. Nikolova, N.; Yanakiev, D. Climate Aridity in Southern Bulgaria for the Period 1961–2015. Forum Geogr. 2020, 19, 10–17. [Google Scholar] [CrossRef]
  57. Ullah, S.; You, Q.; Sachindra, D.A.; Nowosad, M.; Ullah, W.; Bhatti, A.S.; Jin, Z.; Ali, A. Spatiotemporal Changes in Global Aridity in Terms of Multiple Aridity Indices: An Assessment Based on the CRU Data. Atmos. Res. 2022, 268, 105998. [Google Scholar] [CrossRef]
  58. Hrnjak, I.; Gavrilov, M.; Markovic, S.; Lukic, T.; Tošić, I.; Unkašević, M. Special Software for Aridity Indices Calculation (AICS); Vojvodina, Serbia Case Study. J. Geogr. Inst. Jovan Cvijic 2013, 63, 83–94. [Google Scholar] [CrossRef]
  59. Halbac-Cotoara-Zamfir, R. Changes in Agricultural Water Demands for Western Romania. In Proceedings of the 42nd International Symposium on Agricultural Engineering, Opatija, Croatia, 25–28 February 2014; pp. 35–45. [Google Scholar]
  60. My, L.; Di Bacco, M.; Scorzini, A.R. On the Use of Gridded Data Products for Trend Assessment and Aridity Classification in a Mediterranean Context: The Case of the Apulia Region. Water 2022, 14, 2203. [Google Scholar] [CrossRef]
  61. Deniz, A.; Toros, H.; Incecik, S. Spatial Variations of Climate Indices in Turkey. Int. J. Climatol. 2011, 31, 394–403. [Google Scholar] [CrossRef]
  62. Continentality—American Meteorological Society (AMS)—Glossary of Meteorology. Available online: https://glossary.ametsoc.org/wiki/Continentality (accessed on 9 February 2025).
  63. Stine, A.R.; Huybers, P. Changes in the Seasonal Cycle of Temperature and Atmospheric Circulation. J. Clim. 2012, 25, 7362–7380. [Google Scholar] [CrossRef]
  64. Balybina, A.S.; Osipova, O.P. Climate Continentality in Cisbaikalia in Different Circulation Epochs. Geogr. Nat. Resour. 2024, 45, 162–168. [Google Scholar] [CrossRef]
  65. Hirschi, J.; Sinha, B.; Josey, S. Global Warming and Changes of Continentality since 1948. Weather 2007, 62, 215–221. [Google Scholar] [CrossRef]
  66. Stonevicius, E.; Stankunavicius, G.; Rimkus, E. Continentality and Oceanity in the Mid and High Latitudes of the Northern Hemisphere and Their Links to Atmospheric Circulation. Adv. Meteorol. 2018, 2018, 5746191. [Google Scholar] [CrossRef]
  67. Szabó-Takács, B.; Farda, A.; Zahradníček, P.; Stepanek, P. Continentality in Europe According to Various Resolution Regional Climate Models with A1B Scenario in the 21st Century. Időjárás 2015, 119, 515–535. [Google Scholar]
  68. Ciaranek, D. Variability of the Thermal Continentality Index in Central Europe. In Proceedings of the ”Air and Water, Components of the Environment”, Cluj-Napoca, Romania, 21–23 March 2014; pp. 307–313. [Google Scholar]
  69. Brázdil, R.; Chromá, K.; Dobrovolný, P.; Tolasz, R. Climate Fluctuations in the Czech Republic during the Period 1961–2005. Int. J. Climatol. 2009, 29, 223–242. [Google Scholar] [CrossRef]
  70. Vilček, J.; Jaroslav, S.; Vido, J.; Nalevanková, P.; Kandrík, R.; Škvareninová, J. Minimal Change of Thermal Continentality in Slovakia within the Period 1961–2013. Earth Syst. Dyn. 2016, 7, 735–744. [Google Scholar] [CrossRef]
  71. Vlăduţ, A. Ștefania Thermal Continentality in Romania (Period 1961–2018). Arab. J. Geosci. 2023, 16, 557. [Google Scholar] [CrossRef]
  72. Valeriano, C.; Gutiérrez, E.; Colangelo, M.; Gazol, A.; Sánchez-Salguero, R.; Tumajer, J.; Shishov, V.; Bonet, J.A.; Martínez de Aragón, J.; Ibáñez, R.; et al. Seasonal Precipitation and Continentality Drive Bimodal Growth in Mediterranean Forests. Dendrochronologia 2023, 78, 126057. [Google Scholar] [CrossRef]
  73. Andrade, C.; Corte-Real, J.A. Spatial Distribution of Climate Indices in the Iberian Peninsula. AIP Conf. Proc. 2015, 1648, 110006. [Google Scholar] [CrossRef]
  74. Kenawy, A.M.E.; McCabe, M.F.; Vicente-Serrano, S.M.; Robaa, S.M.; Lopez-Moreno, J.I. Recent Changes in Continentality and Aridity Conditions over the Middle East and North Africa Region, and Their Association with Circulation Patterns. Clim. Res. 2016, 69, 25–43. [Google Scholar] [CrossRef]
  75. Ols, C.; Gschwantner, T.; Schadauer, K.; Bontemps, J.-D. Unexpected Negative Effect of Available Water Capacity Detected on Recent Conifer Forest Growth Trends Across Wide Environmental Gradients. Ecosystems 2022, 25, 404–421. [Google Scholar] [CrossRef]
  76. Vlăduţ, A.; Nikolova, N.; Licurici, M. Evaluation of Thermal Continentality within Southern Romania and Northern Bulgaria (1961–2015). Geofizika 2018, 35, 1–18. [Google Scholar] [CrossRef]
  77. Oceanicity—American Meteorological Society AMS—Glossary of Meteorology. Available online: https://glossary.ametsoc.org/wiki/Oceanicity (accessed on 9 February 2025).
  78. Gavilán, R. The Use of Climatic Parameters and Indices in Vegetation Distribution. A Case Study in the Spanish Sistema Central. Int. J. Biometeorol. 2005, 50, 111–120. [Google Scholar] [CrossRef] [PubMed]
  79. Freschi, P.; Cosentino, C.; Mallia, E.; Trocchi, V. Fertility of the European Brown Hare Across Plain, Hill and Mountain Environments in the Italian Peninsula. Animals 2024, 14, 3690. [Google Scholar] [CrossRef] [PubMed]
  80. Sawaisarje, G.K.; Chaudhari, H.S. Influence of Continentality and Oceanity Over India During 1981–2010 and Its Teleconnections to ENSO and IOD. Pure Appl. Geophys. 2023, 180, 2443–2460. [Google Scholar] [CrossRef]
  81. Kachur, A.N.; Skrylnik, G.P. Continentality and Oceanicity as Indicators of the Current Ecological State of the Russian Far East. Geogr. Nat. Resour. 2022, 43, 228–232. [Google Scholar] [CrossRef]
  82. Charalampopoulos, I.; Droulia, F. A Pathway towards Climate Services for the Agricultural Sector. Climate 2024, 12, 18. [Google Scholar] [CrossRef]
  83. Dunn, R.J.H.; Alexander, L.V.; Donat, M.G.; Zhang, X.; Bador, M.; Herold, N.; Lippmann, T.; Allan, R.; Aguilar, E.; Barry, A.A.; et al. Development of an Updated Global Land In Situ-Based Data Set of Temperature and Precipitation Extremes: HadEX3. J. Geophys. Res. Atmos. 2020, 125, e2019JD032263. [Google Scholar] [CrossRef]
  84. Lorenz, R.; Stalhandske, Z.; Fischer, E.M. Detection of a Climate Change Signal in Extreme Heat, Heat Stress, and Cold in Europe From Observations. Geophys. Res. Lett. 2019, 46, 8363–8374. [Google Scholar] [CrossRef]
  85. Muñoz-Sabater, J.; Dutra, E.; Agustí-Panareda, A.; Albergel, C.; Arduini, G.; Balsamo, G.; Boussetta, S.; Choulga, M.; Harrigan, S.; Hersbach, H.; et al. ERA5-Land: A State-of-the-Art Global Reanalysis Dataset for Land Applications. Earth Syst. Sci. Data 2021, 13, 4349–4383. [Google Scholar] [CrossRef]
  86. De La Guardia, L.; de Miranda, J.H.; dos Santos Luciano, A.C. Assessment of Irrigation Water Use for Dry Beans in Center Pivots Using ERA5 Land Climate Variables and Sentinel 2 NDVI Time Series in the Brazilian Cerrado. Agric. Water Manag. 2024, 305, 109128. [Google Scholar] [CrossRef]
  87. Zhao, J.; Zhao, X.; Wu, D.; Meili, N.; Fatichi, S. Satellite-Based Evidence Highlights a Considerable Increase of Urban Tree Cooling Benefits from 2000 to 2015. Glob. Change Biol. 2023, 29, 3085–3097. [Google Scholar] [CrossRef]
  88. Li, W.; Pacheco-Labrador, J.; Migliavacca, M.; Miralles, D.; Hoek van Dijke, A.; Reichstein, M.; Forkel, M.; Zhang, W.; Frankenberg, C.; Panwar, A.; et al. Widespread and Complex Drought Effects on Vegetation Physiology Inferred from Space. Nat. Commun. 2023, 14, 4640. [Google Scholar] [CrossRef] [PubMed]
  89. Higgins, S.I.; Conradi, T.; Muhoko, E. Shifts in Vegetation Activity of Terrestrial Ecosystems Attributable to Climate Trends. Nat. Geosci. 2023, 16, 147–153. [Google Scholar] [CrossRef]
  90. Espinosa, L.A.; Portela, M.M.; Moreira Freitas, L.M.; Gharbia, S. Addressing the Spatiotemporal Patterns of Heatwaves in Portugal with a Validated ERA5-Land Dataset (1980–2021). Water 2023, 15, 3102. [Google Scholar] [CrossRef]
  91. Araghi, A.; Adamowski, J.F. Assessment of 30 Gridded Precipitation Datasets over Different Climates on a Country Scale. Earth Sci. Inform. 2024, 17, 1301–1313. [Google Scholar] [CrossRef]
  92. Gorczyński, L. Sur Le Calcul Du Degré Du Continentalisme et Son Application Dans La Climatologie. Geogr. Ann. 1920, 2, 324–331. [Google Scholar]
  93. Hijmans, R.J.; Bivand, R.; Forner, K.; Ooms, J.; Pebesma, E.; Sumner, M.D. Terra: Spatial Data Analysis. Available online: https://CRAN.R-project.org/package=terra (accessed on 7 July 2022).
  94. Wickham, H.; Averick, M.; Bryan, J.; Chang, W.; McGowan, L.D.; François, R.; Grolemund, G.; Hayes, A.; Henry, L.; Hester, J.; et al. Welcome to the Tidyverse. J. Open Source Softw. 2019, 4, 1686. [Google Scholar] [CrossRef]
  95. R Core Team. R: A Language and Environment for Statistical Computing. Available online: https://www.R-project.org/ (accessed on 11 July 2022).
  96. Apostol, L.; Sirghea, L. Thermal Continentalism in Europe. In Air & Water Components of the Environment; EBSCO Industries, Inc.: Birmingham, AL, USA, 2015; pp. 49–55. [Google Scholar]
  97. Wypych, A. Variability of the European Climate on the Basis of Differentiation of Indicators of Continentalism. In The Polish Climate in the European Context: An Historical Overview; Przybylak, R., Ed.; Springer: Dordrecht, The Netherlands, 2010; pp. 473–484. ISBN 978-90-481-3167-9. [Google Scholar]
  98. Croitoru, A.-E.; Piticar, A.; Imbroane, A.M.; Burada, D.C. Spatiotemporal Distribution of Aridity Indices Based on Temperature and Precipitation in the Extra-Carpathian Regions of Romania. Theor. Appl. Climatol. 2013, 112, 597–607. [Google Scholar] [CrossRef]
  99. Nistor, M.-M.; Dezsi, Ş.; Cheval, S.; Baciu, M. Climate Change Effects on Groundwater Resources: A New Assessment Method through Climate Indices and Effective Precipitation in Beliş District, Western Carpathians. Meteorol. Appl. 2016, 23, 554–561. [Google Scholar] [CrossRef]
  100. Vlăduţ, A.; Nikolova, N.; St. Kliment Ohridski University of Sofia, Faculty of Geology and Geography; Licurici, M. University of Craiova, Faculty of Sciences, Geography Department Aridity Assessment within Southern Romania and Northern Bulgaria. Hrvat. Geogr. Glas. Geogr. Bull. 2017, 79, 5–26. [Google Scholar] [CrossRef]
  101. Vlăduţ, A.Ș.; Licurici, M. Aridity Conditions within the Region of Oltenia (Romania) from 1961 to 2015. Theor. Appl. Climatol. 2020, 140, 589–602. [Google Scholar] [CrossRef]
  102. Eremija, S.; Brasanac-Bosanac, L.; Ćirković-Mitrović, T.; Stajic, S. Climate Characteristics of Mountain Beech Forests Belt (Fagetum Montanum Illyricum Fuk. et Stef. 1958) on Manjača. Sustain. For. 2019, 79–80, 93–102. [Google Scholar] [CrossRef]
  103. Hrnjak, I.; Lukić, T.; Gavrilov, M.B.; Marković, S.B.; Unkašević, M.; Tošić, I. Aridity in Vojvodina, Serbia. Theor. Appl. Climatol. 2014, 115, 323–332. [Google Scholar] [CrossRef]
  104. Gavrilov, M.B.; Lukić, T.; Janc, N.; Basarin, B.; Marković, S.B. Forestry Aridity Index in Vojvodina, North Serbia. Open Geosci. 2019, 11, 367–377. [Google Scholar] [CrossRef]
  105. Radaković, M.G.; Tošić, I.; Bačević, N.; Mladjan, D.; Gavrilov, M.B.; Marković, S.B. The Analysis of Aridity in Central Serbia from 1949 to 2015. Theor. Appl. Climatol. 2018, 133, 887–898. [Google Scholar] [CrossRef]
  106. Bačević, N.; Vukoičić, D.; Nikolić, M.; Janc, N.; Milentijević, N.; Gavrilov, M. Aridity in Kosovo and Metohija, Serbia. Carpathian J. Earth Environ. Sci. 2017, 12, 563–570. [Google Scholar]
  107. Gocić, M.; Milentijević, N.; Ivanović, M.; Tošić, I.; Živanović, S.; Bursać, N.M.; Stričević, L. Spatial and Temporal Variability of Aridity Indices in the Region of Southern and Eastern Serbia. Theor. Appl. Climatol. 2025, 156, 6. [Google Scholar] [CrossRef]
  108. Burić, D.; Mihajlović, J.; Ducić, V.; Milenković, M.; Anđelković, G. Contribution to the Study of Climate Change in Serbia Using Continentality, Oceanity, and Aridity Indices. IDŐJÁRÁS 2023, 127, 379–399. [Google Scholar] [CrossRef]
  109. Luković, J.; Burić, D.; Mihajlović, J.; Pejović, M. Spatial and Temporal Variations of Aridity-Humidity Indices in Montenegro. Theor. Appl. Climatol. 2024, 155, 4553–4566. [Google Scholar] [CrossRef]
  110. Buric, D.; Ivanovic, R.; Milenkovic, M. Indicators of Specificity of Climate: The Example of Podgorica (Montenegro). J. Geogr. Inst. Jovan Cvijic SASA 2018, 68, 399–403. [Google Scholar] [CrossRef]
  111. Burić, D.; Milenković, M.; Ducić, V. The Specificities of the Climate of Danilovgrad (Montenegro). Glas. Srp. Geogr. Drus. 2019, 99, 19–28. [Google Scholar] [CrossRef]
  112. Prodanova, H.; Nedkov, S.; Petrov, G. GIS-Based Modelling of Landscape Patterns in Mountain Areas Using Climate Indices and Regression Analysis. Environ. Model. Softw. 2024, 180, 106160. [Google Scholar] [CrossRef]
  113. Lappas, I.; Zorapas, V.; K., K. Estimation and Surface Distribution of Climate Indices in the Water District of Central—Eastern Greece. In Proceedings of the 10th International Hydrogeological Congress of Greece, Thessaloniki, Greece, 8–10 October 2014; pp. 397–406. [Google Scholar]
  114. Mavrakis, A. Climatic Classification of an Industrial Area of Eastern Mediterranean (Thriassio Plain: Greece). In Advances in Meteorology, Climatology and Atmospheric Physics; Helmis, C.G., Nastos, P.T., Eds.; Springer: Berlin/Heidelberg, Germany, 2013; pp. 599–604. ISBN 978-3-642-29172-2. [Google Scholar]
Figure 1. Generalized CORINE land cover 2018 (CLC 2018) illustrating the study area’s natural and agricultural areas (AL: Albania, BA: Bosnia Herzegovina, BG: Bulgaria, HR: Croatia, EL: Greece, MK: N. Macedonia, ME: Montenegro, RO: Romania, and RS: Serbia and SI: Slovenia).
Climate 13 00121 g001
Figure 2. The Johansson Continentality index (JCI) distribution over the study area during p1 (1964–1993).
Climate 13 00121 g002
Figure 3. The Johansson Continentality index (JCI) distribution over the study area during p2 (1994–2023).
Climate 13 00121 g003
Figure 4. The relative surface area per class and country for the Johansson Continentality index during p1 (1964–1993) and p2 (1994–2023) over the agricultural areas.
Climate 13 00121 g004
Figure 5. The relative surface area per class and country for the Johansson Continentality index during p1 (1964–1993) and p2 (1994–2023) over the natural areas.
Climate 13 00121 g005
Figure 6. Climate evolution between p1 (1964–1993) and p2 (1994–2023) based on the JCI.
Climate 13 00121 g006
Figure 7. The Kerner Oceanity index (KOI) distribution over the study area during p1 (1964–1993).
Climate 13 00121 g007
Figure 8. The Kerner Oceanity index (KOI) distribution over the study area during p2 (1994–2023).
Climate 13 00121 g008
Figure 9. The relative surface area per class and country for the Kerner Oceanity index during p1 (1964–1993) and p2 (1994–2023) over the agricultural areas.
Climate 13 00121 g009
Figure 10. The relative surface area per class and country for the Kerner Oceanity index during p1 (1964–1993) and p2 (1994–2023) over the natural areas.
Climate 13 00121 g010
Figure 11. Climate evolution between p1 (1964–1993) and p2 (1994–2023) based on the KOI.
Climate 13 00121 g011
Figure 12. Dry month over the study area during p1 (1964–1993).
Climate 13 00121 g012
Figure 13. The Pinna combinative index (PINNA) distribution over the study area during p1 (1964–1993).
Climate 13 00121 g013
Figure 14. Dry month over the study area during p2 (1994–2023).
Climate 13 00121 g014
Figure 15. The Pinna combinative index (PINNA) distribution over the study area during p2 (1994–2023).
Climate 13 00121 g015
Figure 16. The relative surface area per class and country for the Pinna combinative index during p1 (1964–1993) and p2 (1994–2023) over the agricultural areas.
Climate 13 00121 g016
Figure 17. The relative surface area per class and country for the Pinna combinative index during p1 (1964–1993) and p2 (1994–2023) over the natural areas.
Climate 13 00121 g017
Figure 18. Climate evolution between p1 (1964–1993) and p2 (1994–2023) based on the PINNA.
Climate 13 00121 g018
Table 1. Johansson continentality index categories by Cheval et al. [19].
JCIClimate Classification
>20Marine
[20,32)Moderate marine
[32–34]Transitional
>34Continental
Table 2. Kerner Oceanity index categories by Cheval et al. [19].
KOIClimate Classification
>20Hyper-Oceanic
(10,20]Oceanic
(0,10]Sub-Continental
(−10,0]Continental
Table 3. PINNA index categories by Cheval et al. [19].
PINNAClimate Classification
>40Wet
(30,40]Moderate Wet
(20,30]Moderate Dry
(10,20]Semi-Dry
(2.5,10]Dry
Disclaimer/Publisher’s Note: The statements, opinions and data contained in all publications are solely those of the individual author(s) and contributor(s) and not of MDPI and/or the editor(s). MDPI and/or the editor(s) disclaim responsibility for any injury to people or property resulting from any ideas, methods, instructions or products referred to in the content.

