Abstract
Observations reveal a strong correlation between the magnitude of El Niño and the displacement of the eastern edge of the western Pacific warm pool (WPWP). In Part I, this relationship was examined in the Coupled Model Intercomparison Project Phase 6 (CMIP6) models using their historical simulations, and it was found to be comparable to that in the observations. The present study extends the analysis to future projections under two Shared Socioeconomic Pathway (SSP) scenarios—SSP245 and SSP585—to assess whether this strong relationship persists under global warming. It is found that El Niño magnitude and WPWP boundary displacement in most models under global warming are as strongly correlated as in the observations and their historical simulations. Moreover, most models project that stronger El Niño events will be accompanied by a greater eastward displacement of the WPWP boundary. For models with a positive response, the ensemble projects an increase in El Niño magnitude of 0.21 ± 0.03 °C (0.20 ± 0.03 °C) under the SSP245 (SSP585) scenario, accompanied by an eastward displacement of the WPWP by 11.7 ± 1.3° (11.1 ± 1.0°) in longitude. These results further support the notion that El Niño is a consequence of the eastward extension of the WPWP.
1. Introduction
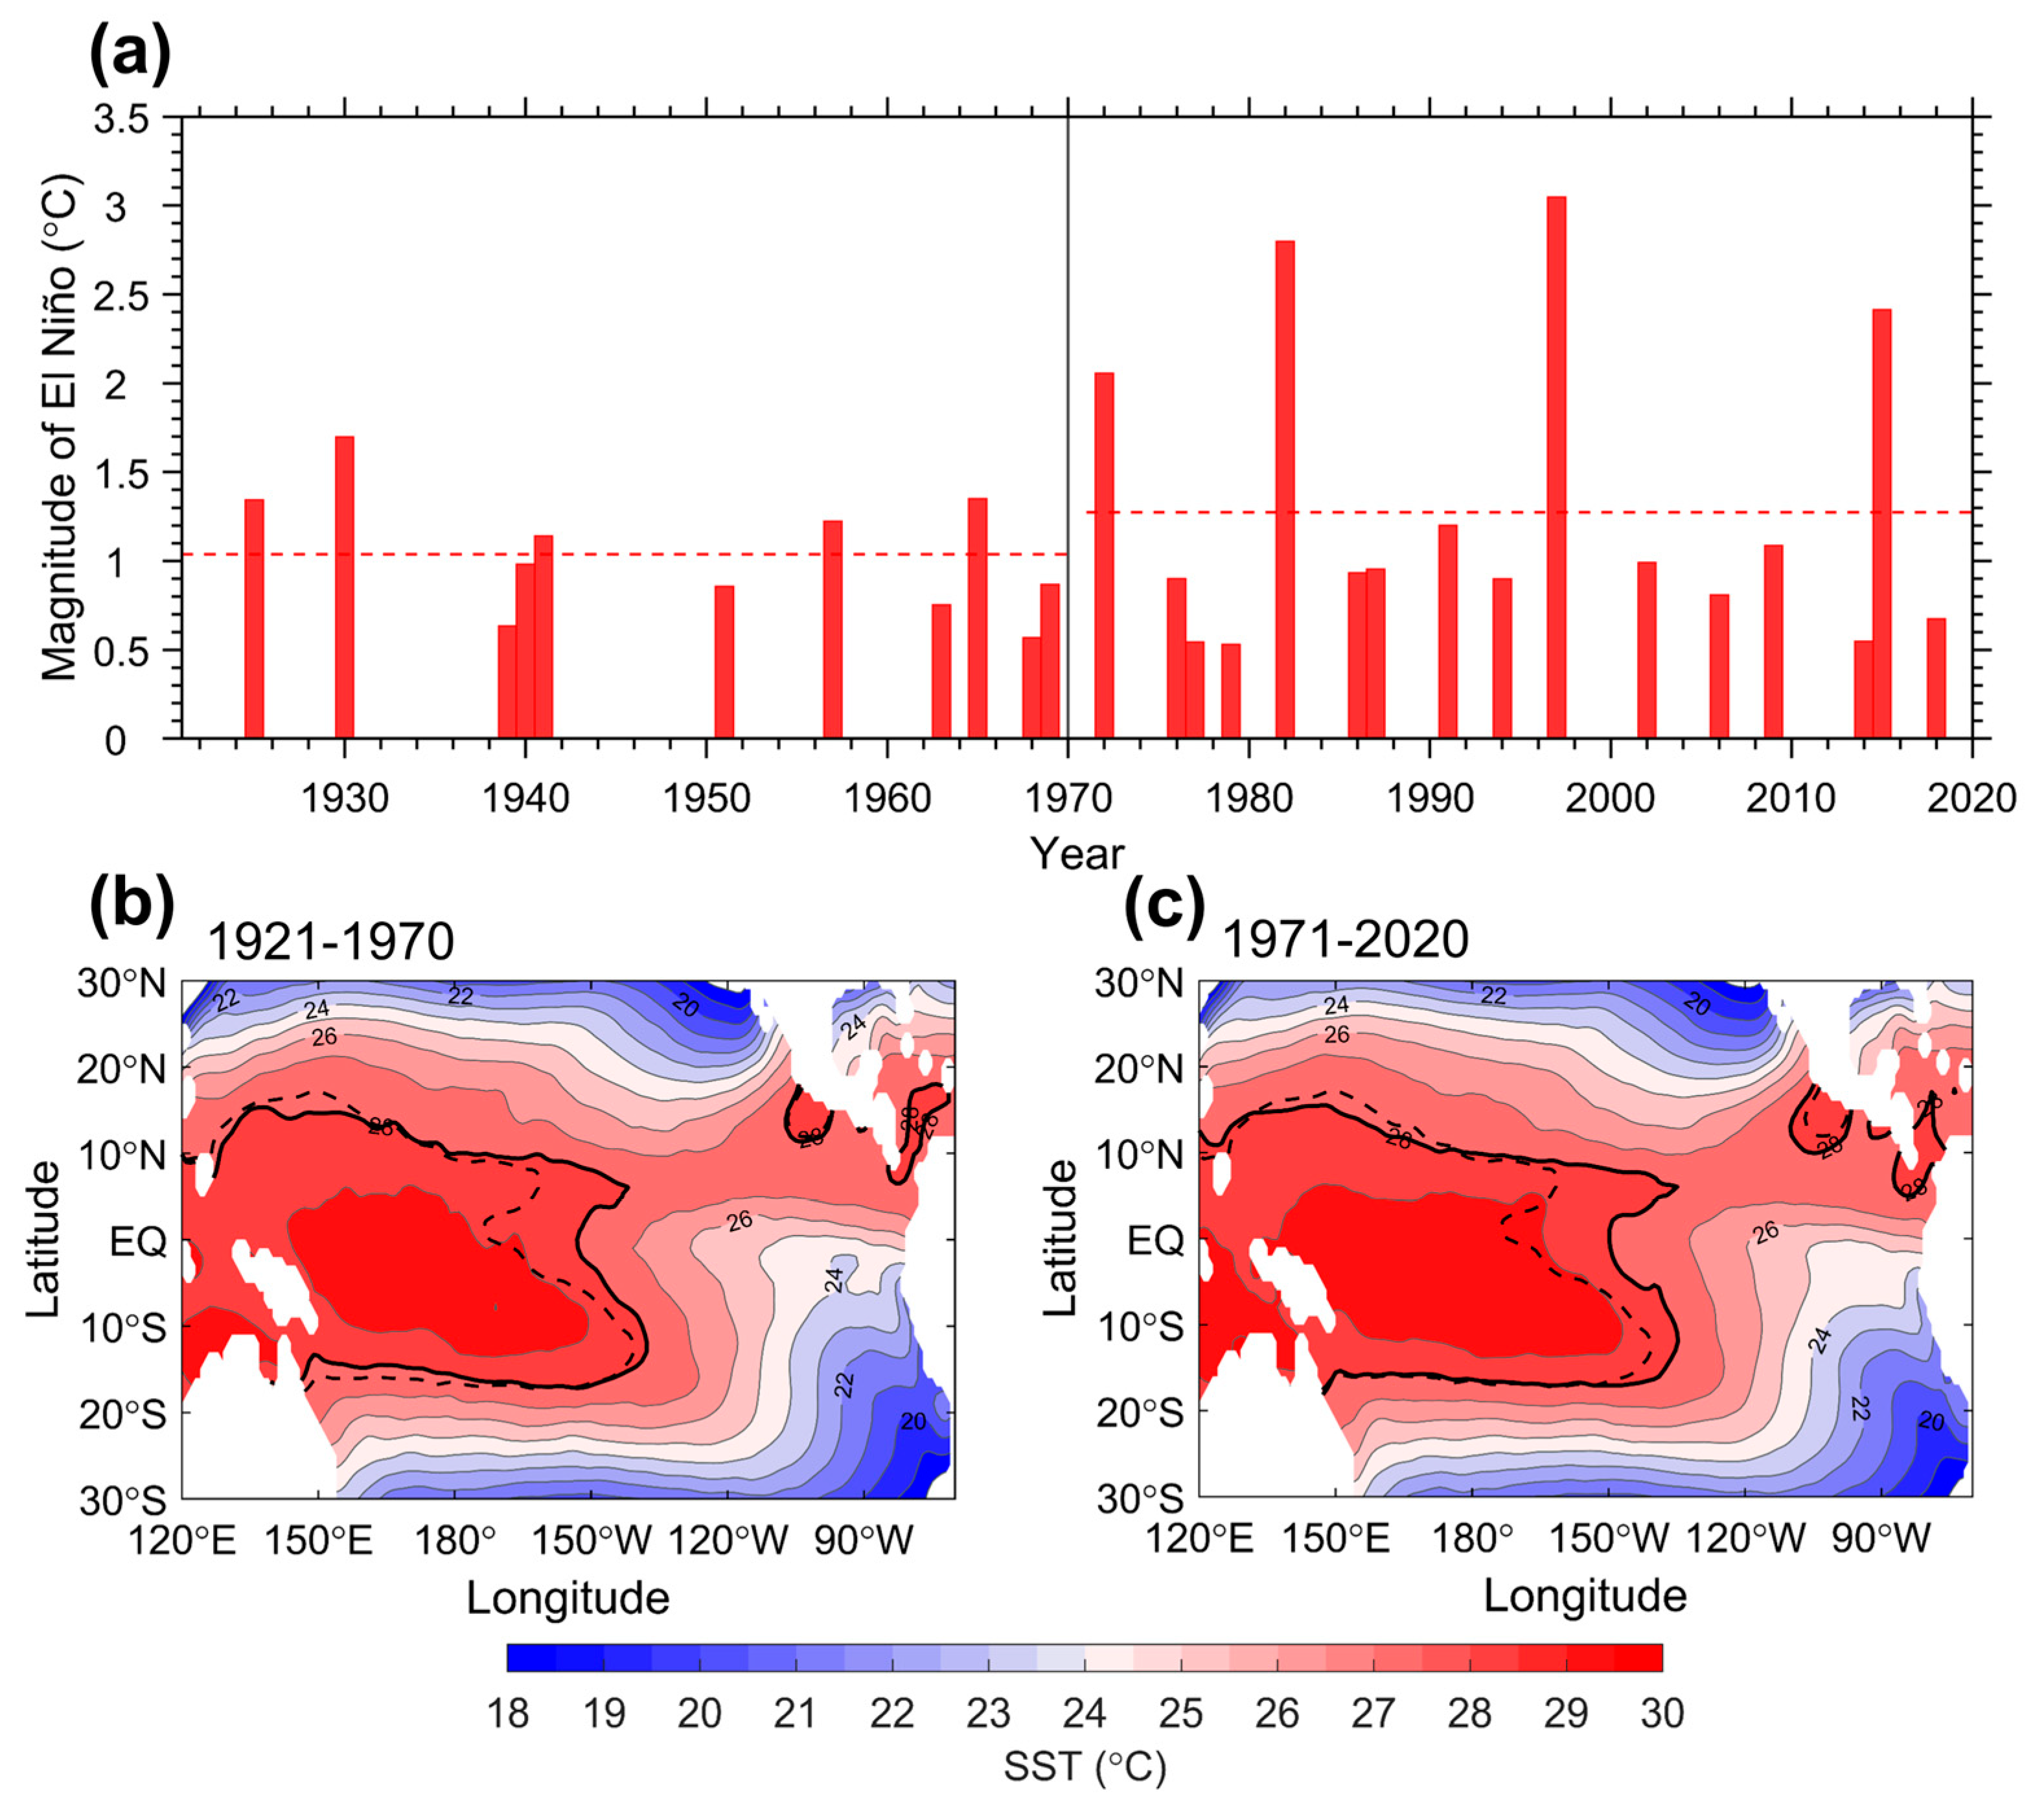
El Niño plays an important role in driving climate variability [1,2,3,4,5,6,7]. Its effects on global weather and climate are largely determined by its intensity [8,9,10,11]. Observations have revealed a strong correlation between the magnitude of El Niño and the displacement of the western Pacific warm pool (WPWP) boundary. This observed relationship has also been anticipated by theoretical studies [12,13,14]. In addition, this relationship is evident not only on an inter-annual time scale but also on a decadal time scale. Epochs characterized by stronger El Niño events tend to coincide with a more pronounced displacement of the WPWP boundary (Figure 1), further highlighting the importance of investigating this linkage.

Figure 1.
(a) The magnitude of El Niño measured by the sea surface temperature (SST) anomalies in the eastern equatorial Pacific (5° S–5° N, 155° W–70° W). Red dashed lines indicate the average magnitude of El Niño events during 1921–1970 and 1971–2020, respectively. (b,c) Composite SST structures during El Niño events for 1921–1970 (b) and 1971–2020 (c). The black dashed line indicates the position of the climatological 28 °C isotherm, while the black solid line denotes the 28 °C isotherm during El Niño events. An El Niño event is identified when the average SST anomaly in the eastern equatorial Pacific during the boreal winter (November–January) exceeds 0.5 °C.
In Part I of this two-part study, the relationship between El Niño magnitude and the displacement of the WPWP eastern boundary was evaluated using the historical simulations of the Coupled Model Intercomparison Project Phase 6 (CMIP6) models. It was found that most models successfully reproduce the observed strong correlation between these two variables. Furthermore, models that simulate stronger El Niño events also tend to exhibit greater WPWP displacement and vice versa.
Recent studies have shown that El Niño is likely to change significantly under global warming [15,16,17,18,19,20,21]. This raises an important question: Will the relationship between the magnitude of El Niño and the displacement of the WPWP boundary also change? Similar to Part I, Part II of this study examines the relationship between El Niño magnitude and WPWP displacement, except under future climate warming scenarios. The analysis reveals that this relationship persists in a warmer climate, although the correlation coefficients are generally reduced compared to the historical period. Furthermore, the majority of models project an intensification of El Niño events and a greater displacement of the WPWP boundary. A robust inter-model relationship remains evident: models that project stronger El Niño events also tend to project greater WPWP displacement. We also show that the inter-model spread is substantial.
Specifically, Part II aims to address the following questions: (1) Will the relationship between El Niño magnitude and the displacement of the WPWP boundary remain robust under global warming? (2) How are changes in El Niño intensity and WPWP boundary displacement projected by CMIP6 models in a warming climate?
2. Materials and Methods
The Hadley Centre Sea Ice and SST dataset (HadISST1) [22] was the source of the observed SST data used in this study. These data covered the period ranging from 1921 to 2020 and had a grid resolution of 1° × 1°. To calculate the monthly anomalies, the long-term monthly mean was subtracted, and a quadratic detrending method was applied to remove long-term trends.
As delineated in Part I, for the present study, 33 CMIP6 models that exhibit positive skewness in the eastern equatorial Pacific SST anomalies in historical simulations (1929–2014) were selected, as positive skewness is associated with a more realistic representation of ENSO dynamics [23,24,25]. In subsequent analysis, “Selected MME” refers to the multi-model ensemble constructed from these 33 CMIP6 models. Monthly SST data for these models are available from 1929 to 2100. In the historical period (1929–2014), simulations were based on observed anthropogenic and natural forcings. For future projections spanning 2015–2100, scenarios from the Shared Socioeconomic Pathways (SSP) framework [26] were adopted. Our analysis focuses on the moderate emission scenario (SSP245) and the high emission scenario (SSP585), which represent moderate and high levels of radiative forcing, respectively. Monthly anomalies for the periods 1929–2014 and 2015–2100 were calculated relative to their respective monthly climatologies and subsequently detrended using a quadratic method. For consistency with observational datasets, model outputs were re-gridded to a 1° × 1° resolution prior to analysis. In accordance with earlier work [19,27], we utilized only one experiment per model. The CMIP6 models employed in this study are detailed in Table 1.

Table 1.
CMIP6 models and their corresponding institutions and countries.
The definitions of El Niño magnitude and the displacement of the WPWP eastern boundary are consistent with those in Part I. The magnitude of El Niño was gauged by the SST anomaly in the eastern equatorial Pacific (5° S–5° N, 155° W–70° W) during November, December, and January (NDJ). An El Niño event is identified when this SST anomaly exceeds 0.5 °C. The displacement of the eastern edge of the WPWP was measured by the longitudinal position of the 28 °C isotherm along the equator relative to its climatological position, with positive values indicating an eastward shift.
Our investigation began with an assessment of the projected changes in El Niño magnitude and the longitudinal displacement of the WPWP under a warming climate. We then examined the relationship between El Niño magnitude and WPWP edge displacement for each model under global warming conditions. Finally, we analyzed the inter-model relationship between changes in El Niño magnitude and variations in the WPWP eastern boundary.
3. Results
3.1. Future Changes in the Magnitude of El Niño
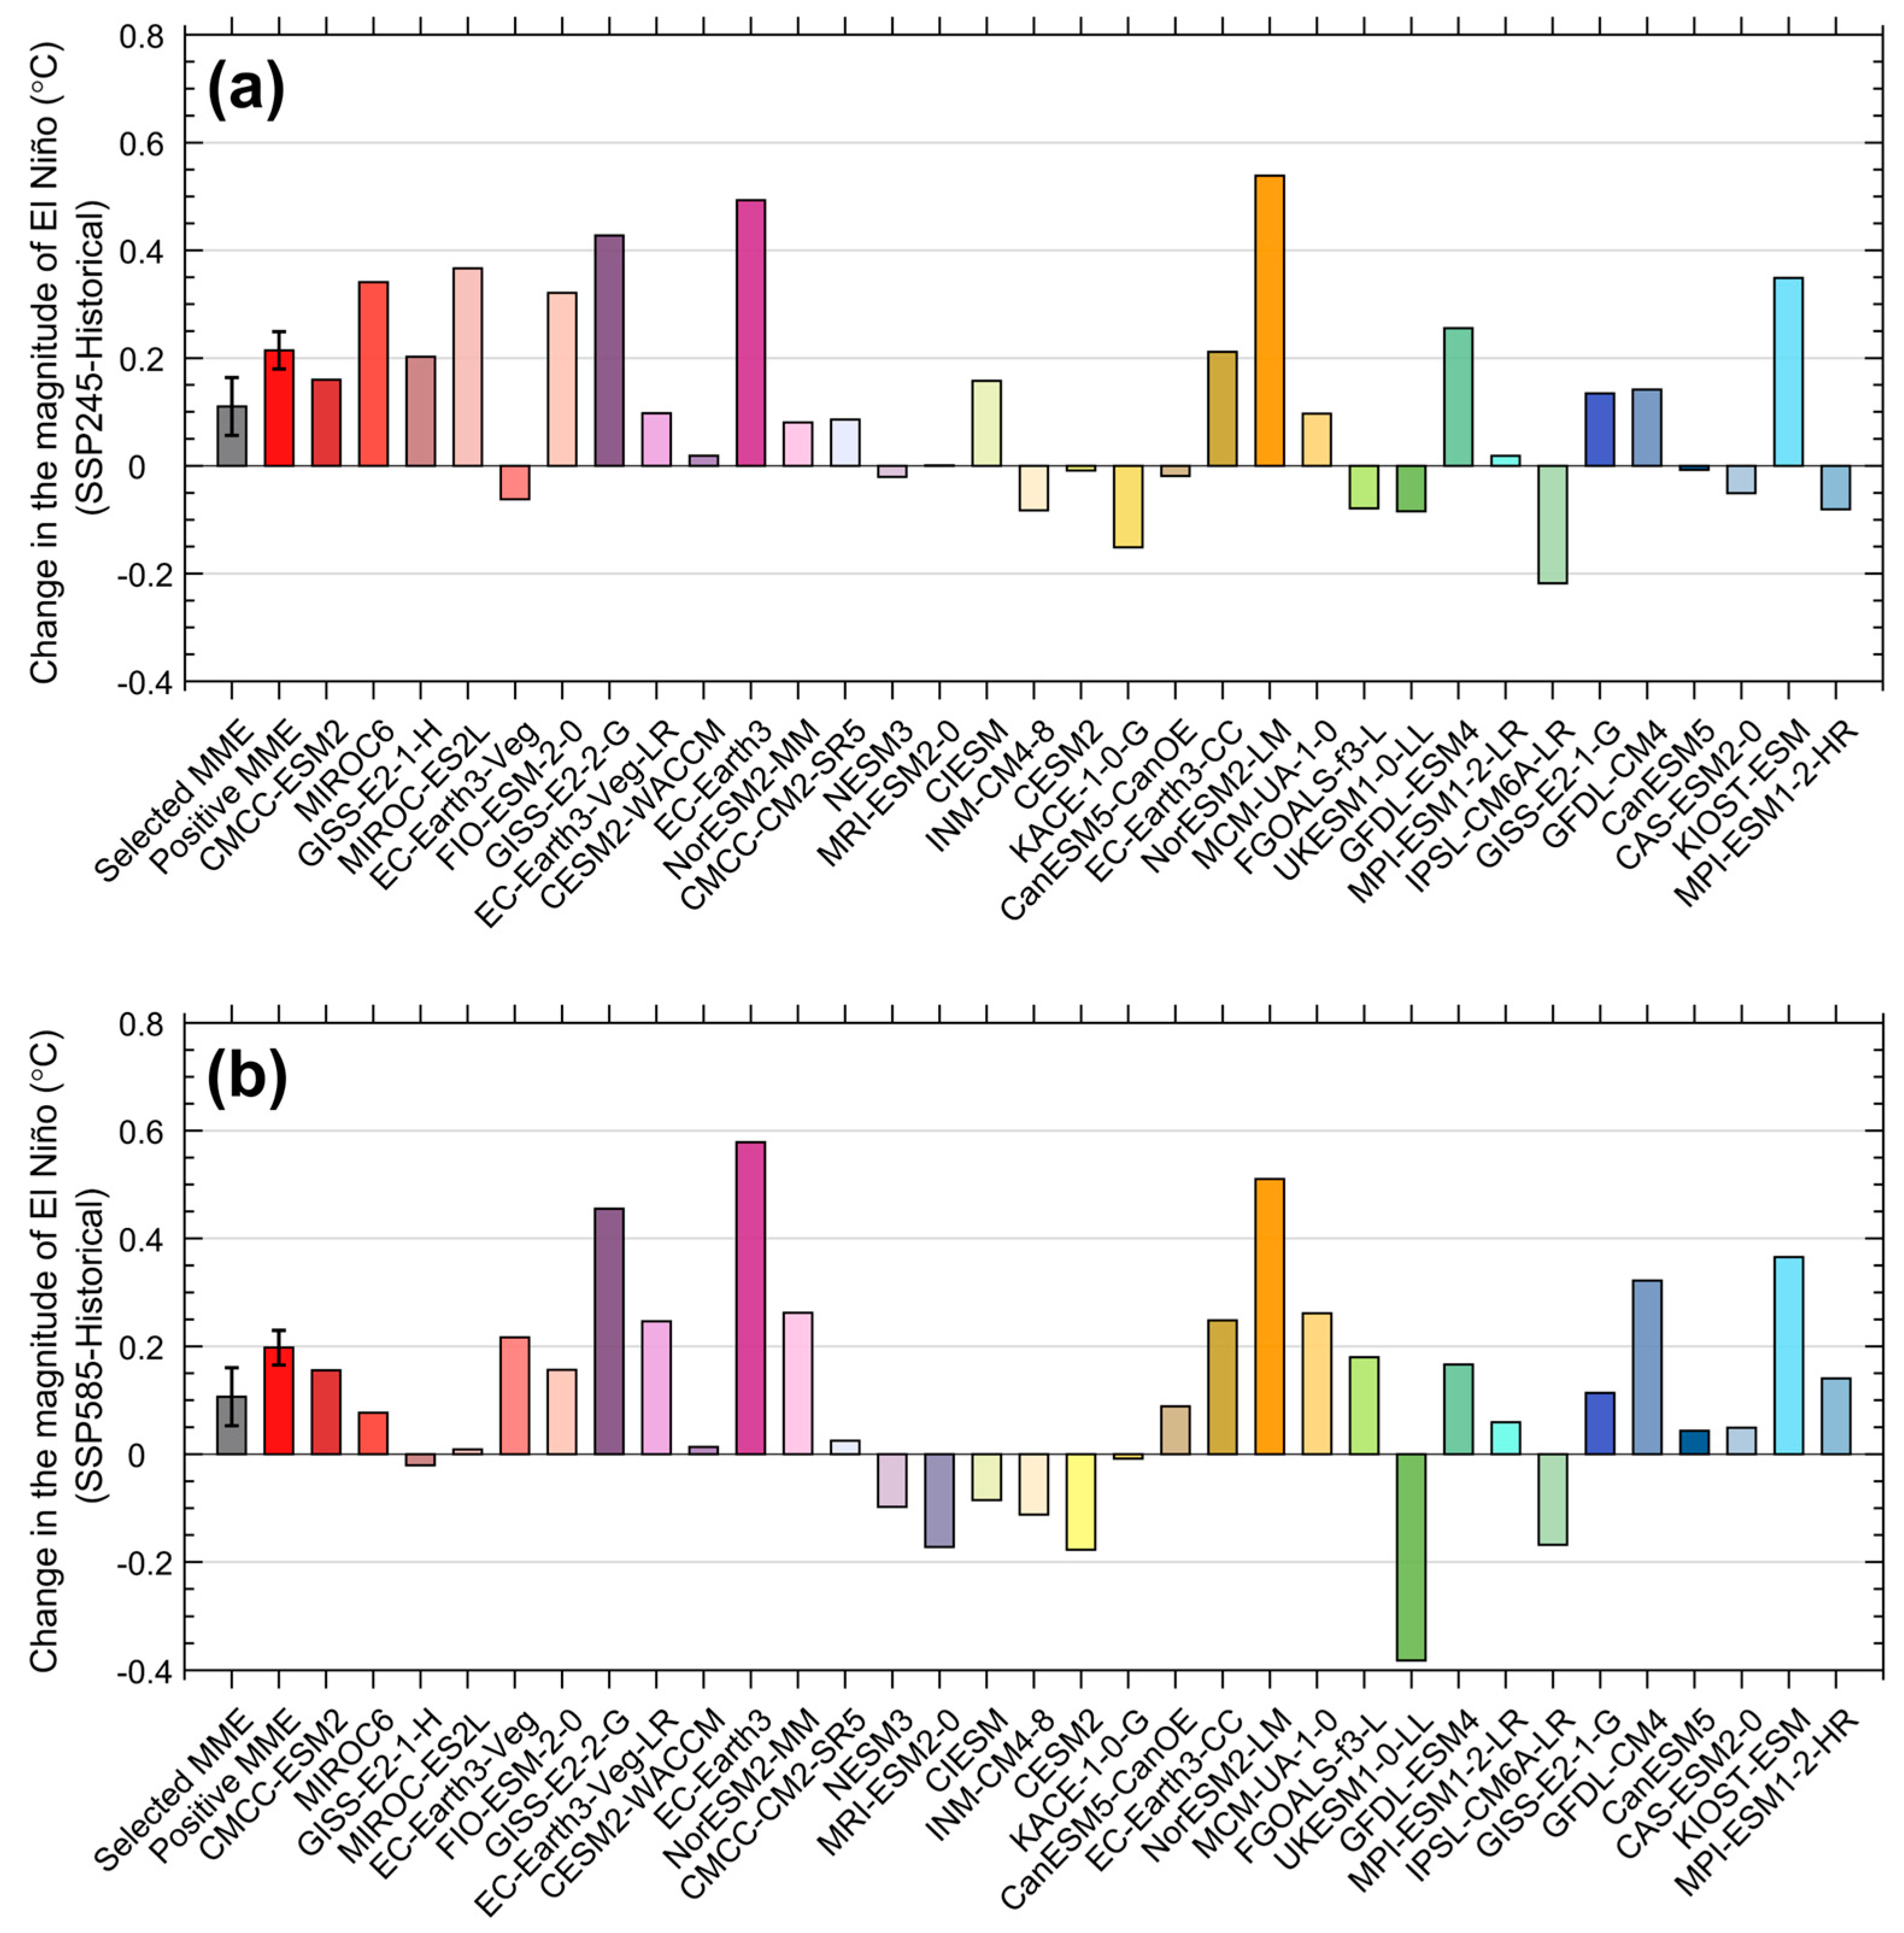
The MME mean projects a stronger magnitude of El Niño under future warming scenarios (Figure 2). The changes shown in Figure 2 are quantified as the difference between the mean El Niño magnitude in the SSP245 (or SSP585) scenario and that in the historical simulations. In the context of the SSP245 scenario, the MME indicates an increase of 0.11 ± 0.05 °C, with individual model projections ranging from –0.22 °C to +0.54 °C (Figure 2a). Among the 33 models, 21 project an increase in El Niño intensity, with an average increase of 0.21 ± 0.03 °C and a spread from +0.00 °C to +0.54 °C. The NorESM2-LM model demonstrates the most substantial increase in El Niño magnitude, while the IPSL-CM6A-LR model displays the most pronounced decrease in El Niño magnitude. Under the SSP585 scenario, the MME mean indicates a 0.11 ± 0.05 °C increase in El Niño intensity but with a wider spread from –0.38 °C to +0.58 °C (Figure 2b). In this scenario, 24 models project an increase in El Niño magnitude, with an average increase of 0.20 ± 0.03 °C and a spread from +0.01 °C to +0.58 °C. The model with the largest increase in El Niño intensity is the EC-Earth3, and the model with the largest decrease is the UKESM1-0-LL. The CESM2-WACCM model shows little change in the El Niño magnitude under both scenarios, suggesting that El Niño in this model is not sensitive to global warming. The significant differences among the models may indicate that they are in different dynamic regimes [28,29].
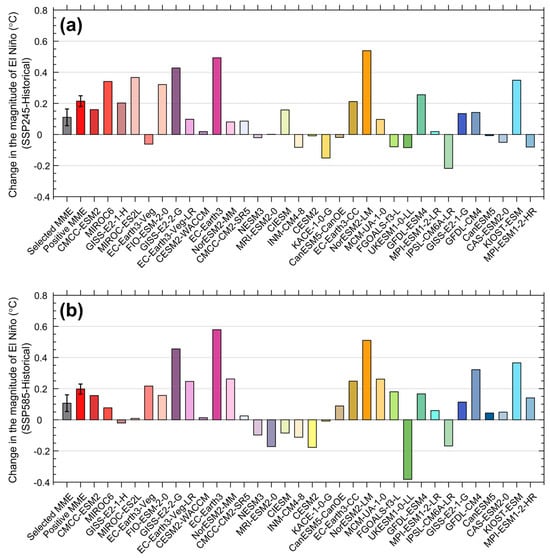
Figure 2.
Changes in El Niño magnitude from the historical simulation to the SSP245 (a) and SSP585 (b) scenarios. The multi-model ensemble (MME) mean is represented by a gray bar, and the positive MME mean is indicated by a bright red bar. The black error bars represent the inter-model standard deviation for all models and models with positive values, respectively. Results from individual CMIP6 models are shown by colored bars. An increase in El Niño magnitude under the respective scenario is indicated by positive values, while a decrease is signaled by negative values.
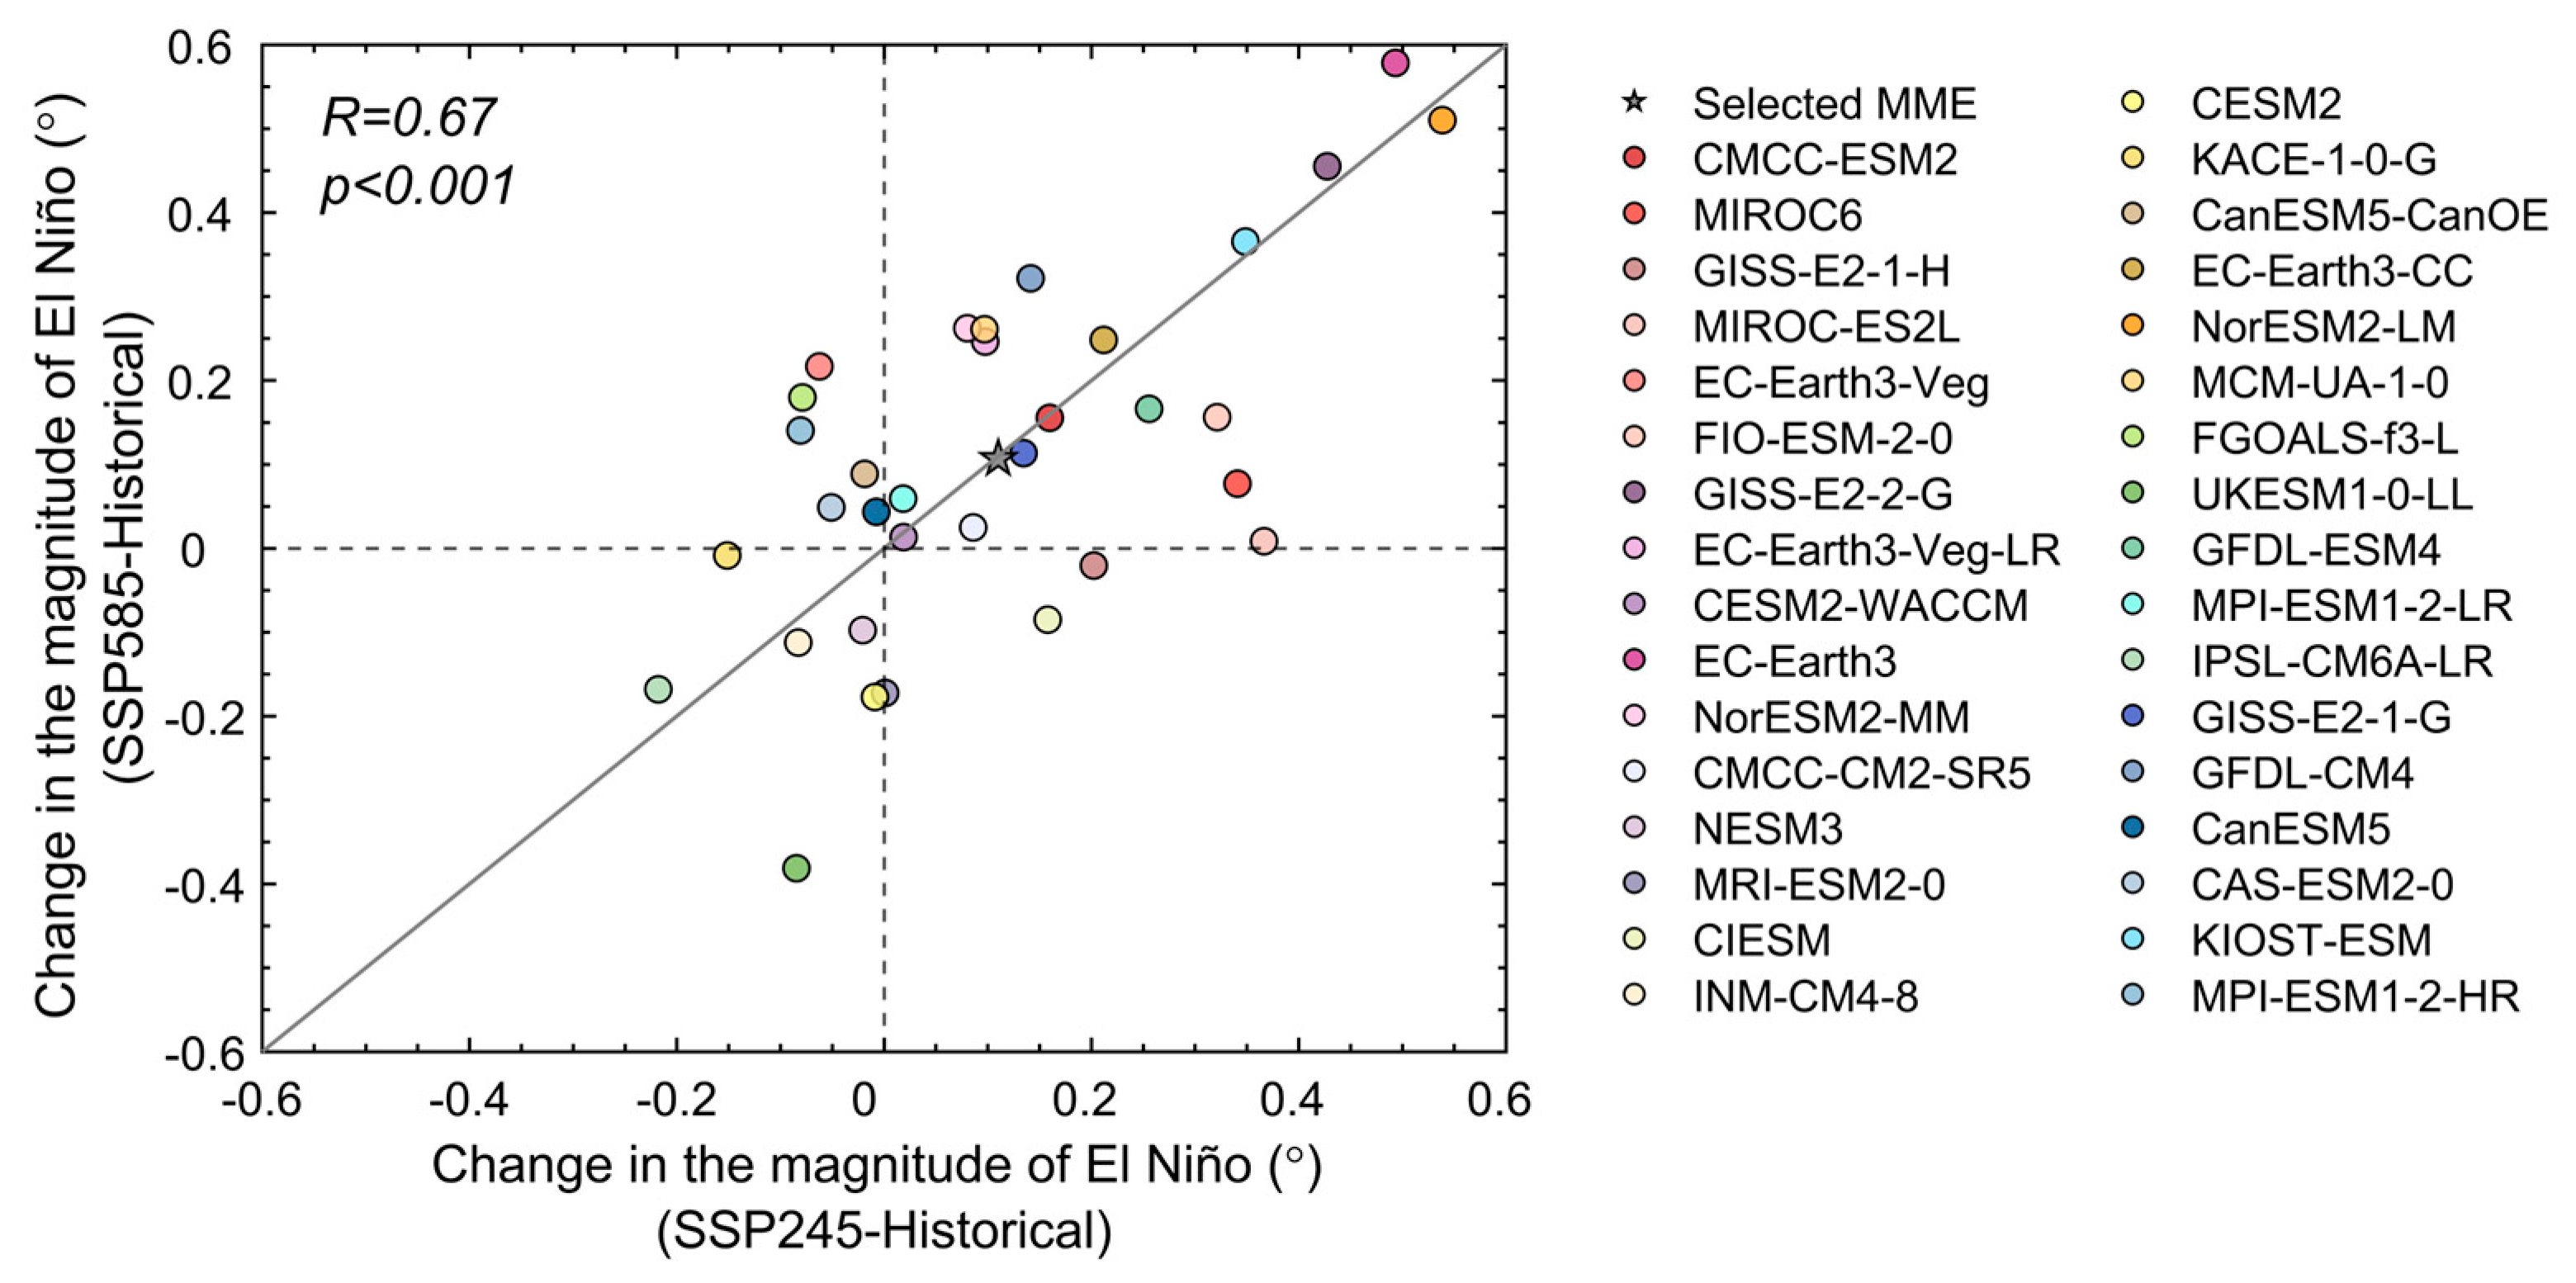
Further analysis shows that the changes in the magnitude of El Niño projected by 24 models are consistent under different climate warming scenarios, with the changes either showing increases or decreases in the same direction. Figure 3 illustrates the relationship between the changes in El Niño magnitude under the SSP245 and SSP585 scenarios. The correlation coefficient of the changes among the models is 0.67, indicating a significant consistency (passing the significance test with a confidence level of 99.9%). Specifically, 18 models project a consistent increase in El Niño magnitude under both scenarios. These include CMCC-ESM2, MIROC6, MIROC-ES2L, FIO-ESM-2-0, GISS-E2-2-G, EC-Earth3-Veg-LR, CESM2-WACCM, EC-Earth3, NorESM2-MM, CMCC-CM2-SR5, EC-Earth3-CC, NorESM2-LM, MCM-UA-1-0, GFDL-ESM4, and MPI-ESM1-2-LR. Conversely, six models consistently project a decrease: NESM3, INM-CM4-8, CESM2, KACE-1-0-G, UKESM1-0-LL, and IPSL-CM6A-LR. However, nine models exhibit scenario-dependent responses, including GISS-E2-1-H, EC-Earth3-Veg, MRI-ESM2-0, CIESM, CanESM5-CanOE, FGOALS-f3-L, CanESM5, CAS-ESM2-0, and MPI-ESM1-2-HR. Among all models, CESM2-WACCM stands out by projecting a minimal change in the El Niño magnitude under either scenario.
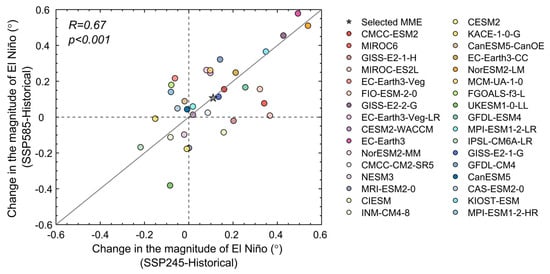
Figure 3.
Scatter plot illustrating the relationship between changes in the magnitude of El Niño from the historical simulation run to the SSP245 scenario and the SSP585 scenario. The MME mean is represented by the gray pentagram, and individual models are represented by the other colored dots. The least squares regression line is presented in gray. R symbolizes the correlation coefficient, and p represents the confidence level.
3.2. Future Changes in the WPWP
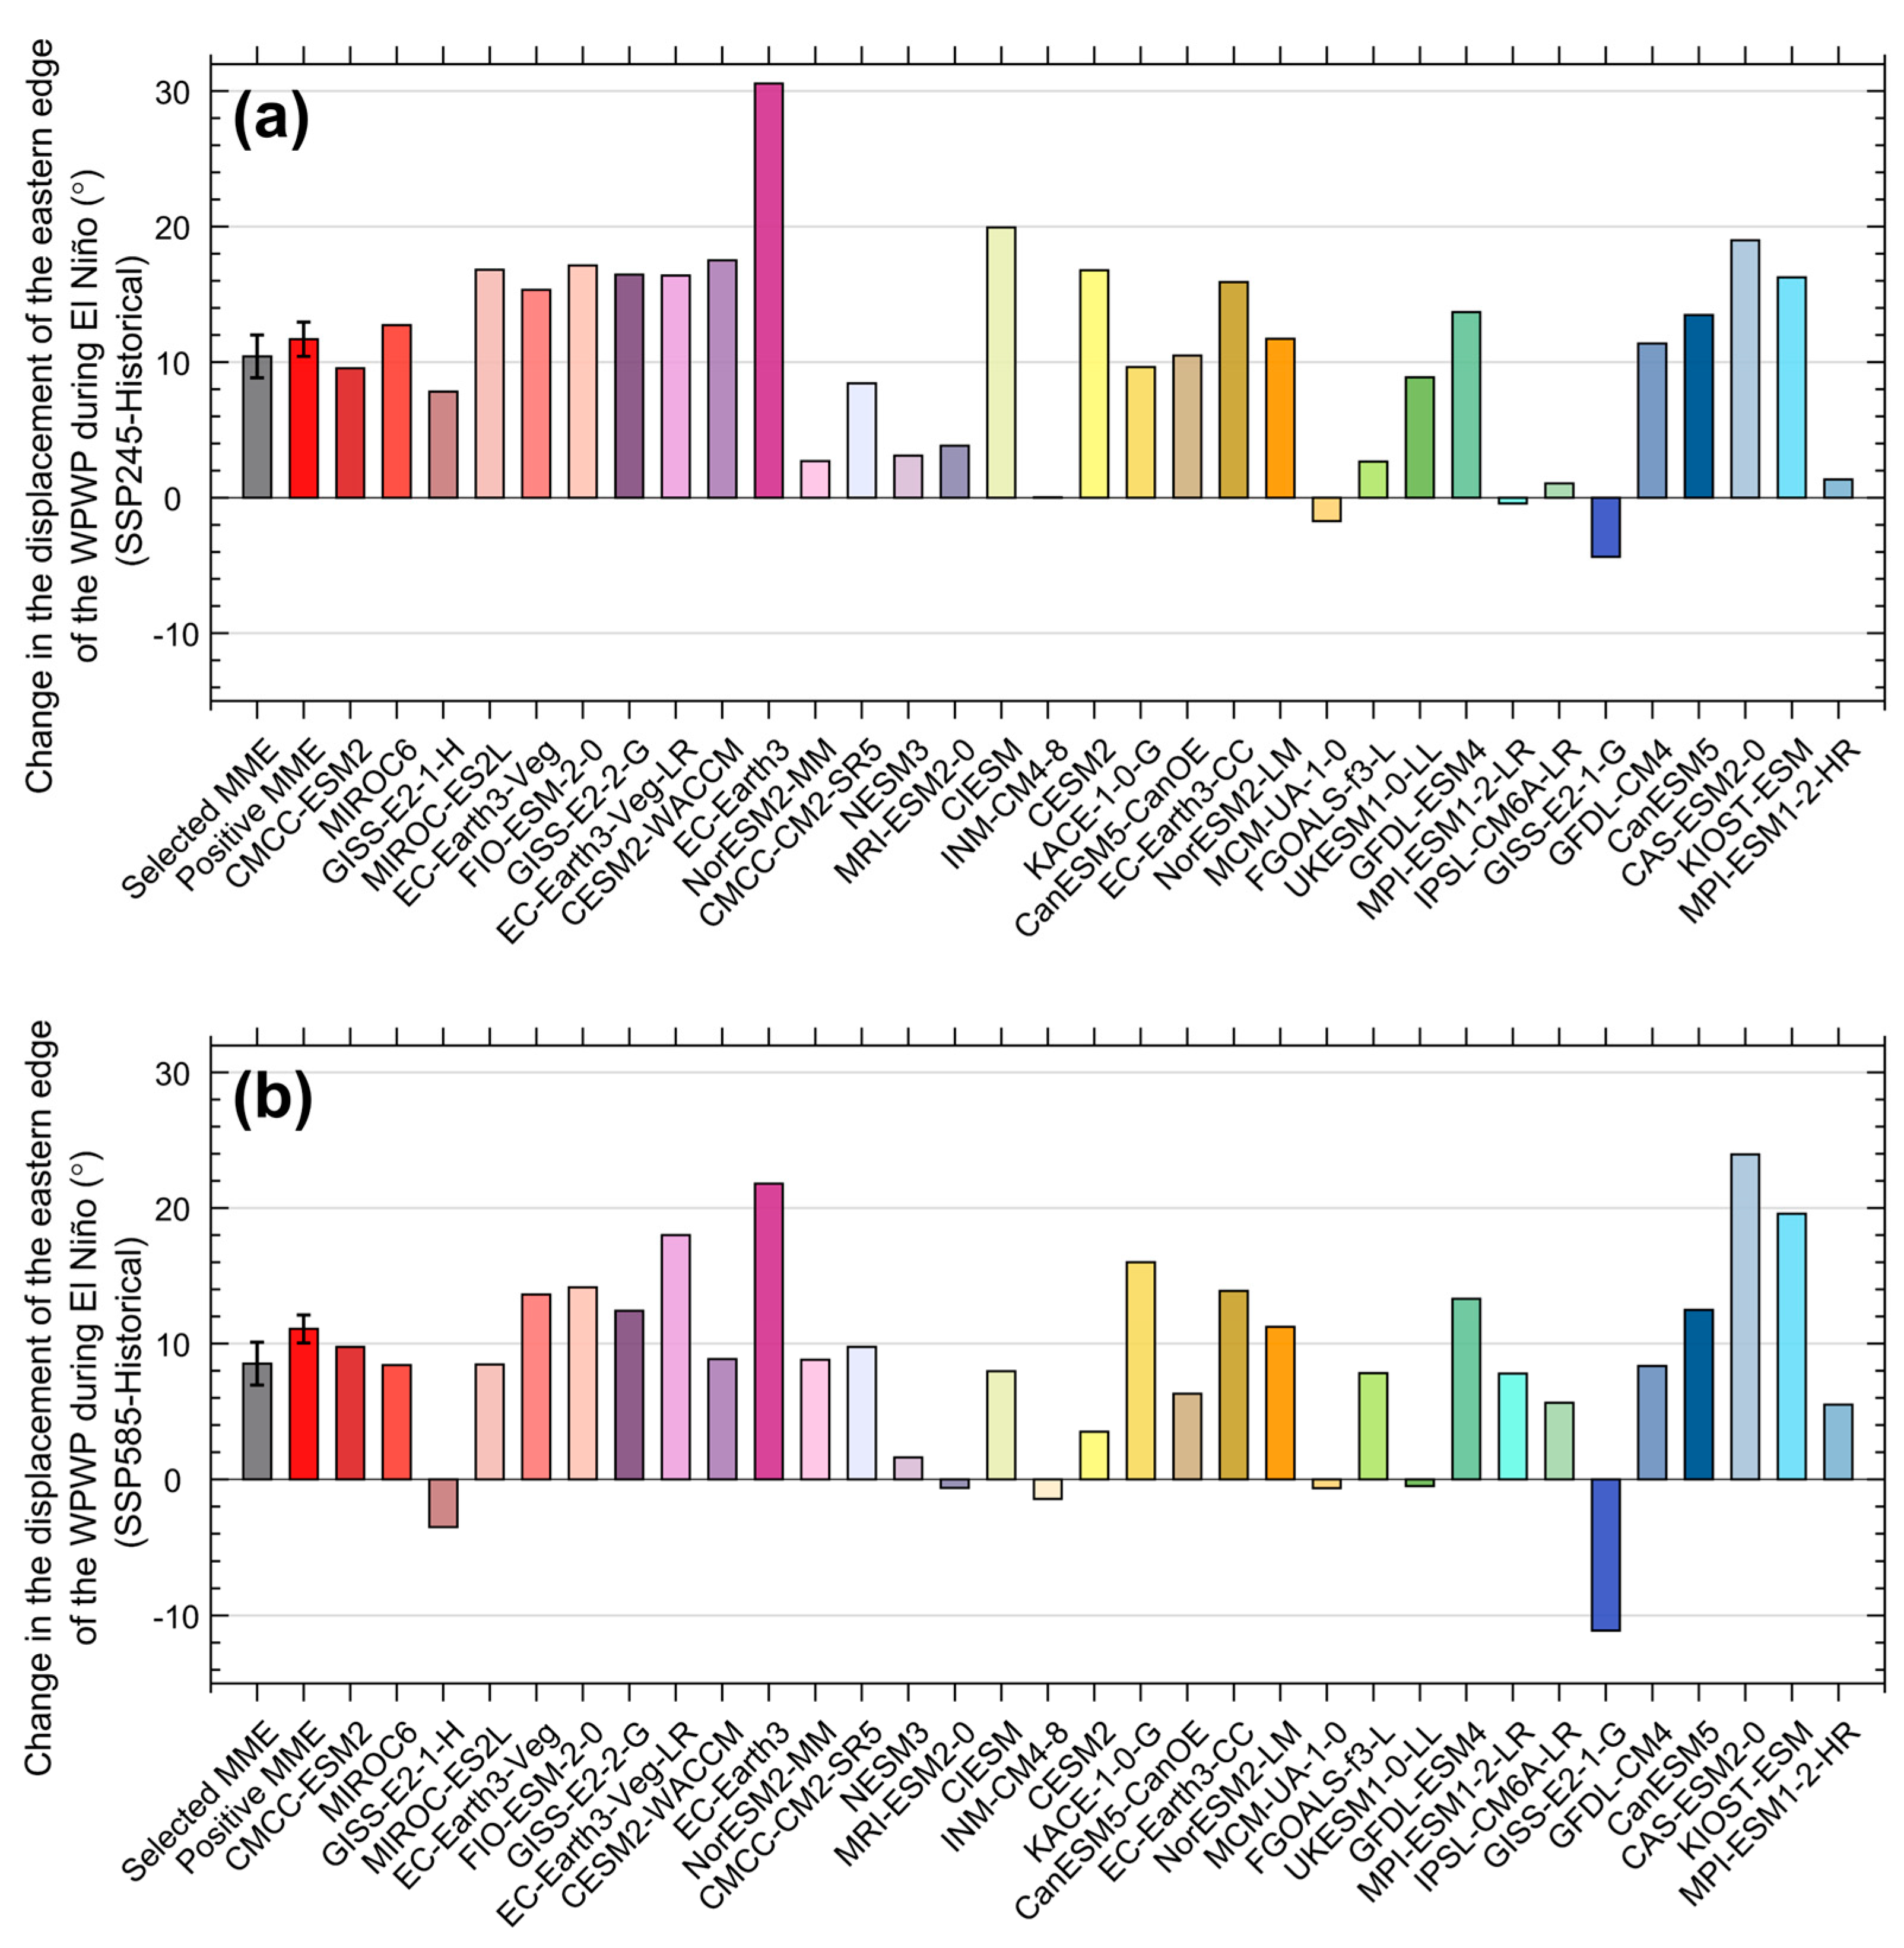
The eastern boundary of the WPWP is observed to shift more in response to global warming, according to the MME mean (Figure 4). Figure 4a,b show the changes in WPWP displacement under the SSP245 scenario and the SSP585 scenario relative to historical simulations, respectively. The results (MME mean) from the SSP245 scenario reveal that the displacement of the WPWP boundary increases by 10.4 ± 1.6° (individual model spread: −4.4° to +30.6°). Among the 33 models analyzed, 30 project an increase in WPWP displacement, with a mean increase of 11.7 ± 1.3° and an inter-model spread ranging from +0.0° to +30.6°. The models MCM-UA-1-0, MPI-ESM1-2-LR, and GISS-E2-1-G, however, display a marginal decrease in displacement. Among all the models analyzed, EC-Earth3 stands out with the largest increase in WPWP displacement at 30.6°. Under the SSP585 scenario, the MME mean shows a slightly smaller increase of 8.5 ± 1.6° in the WPWP boundary displacement (model spread: −11.0° to +24.0°), with 27 out of 33 models projecting an eastward shift. The mean increase among these 27 models is 11.1 ± 1.0°, with an inter-model spread ranging from +1.6° to +24.0°. The CAS-ESM2-0 and EC-Earth3 models show the most pronounced eastward shifts. On the other hand, the GISS-E2-1-G model projects a decrease in WPWP displacement for both scenarios, with a notably larger reduction under SSP585 conditions.
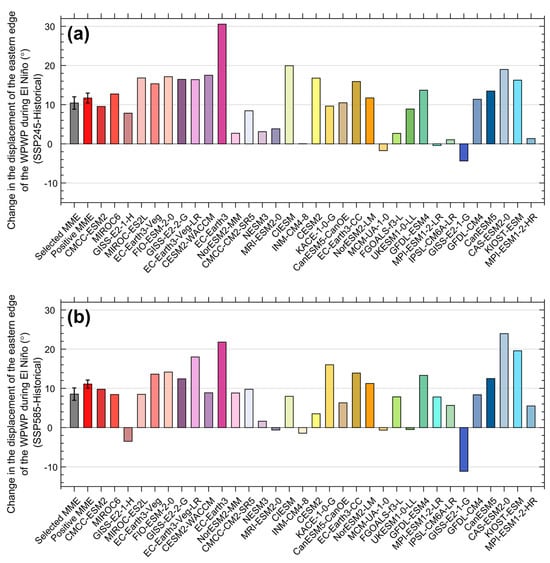
Figure 4.
Projected changes in the displacement of the WPWP boundary during El Niño events: (a) from the historical run to the SSP245 scenario and (b) from the historical period to the SSP585 scenario. The gray bar represents the MME mean, with the error bar (black symbol) indicating the standard deviation across models. The bright red bar shows the MME mean of models with positive values, with the corresponding black error bar representing the inter-model standard deviation within this subset. Results from individual models are presented by colored bars. An enhanced eastward displacement of the WPWP’s eastern boundary is indicated by positive values, while a reduced displacement is signaled by negative values.
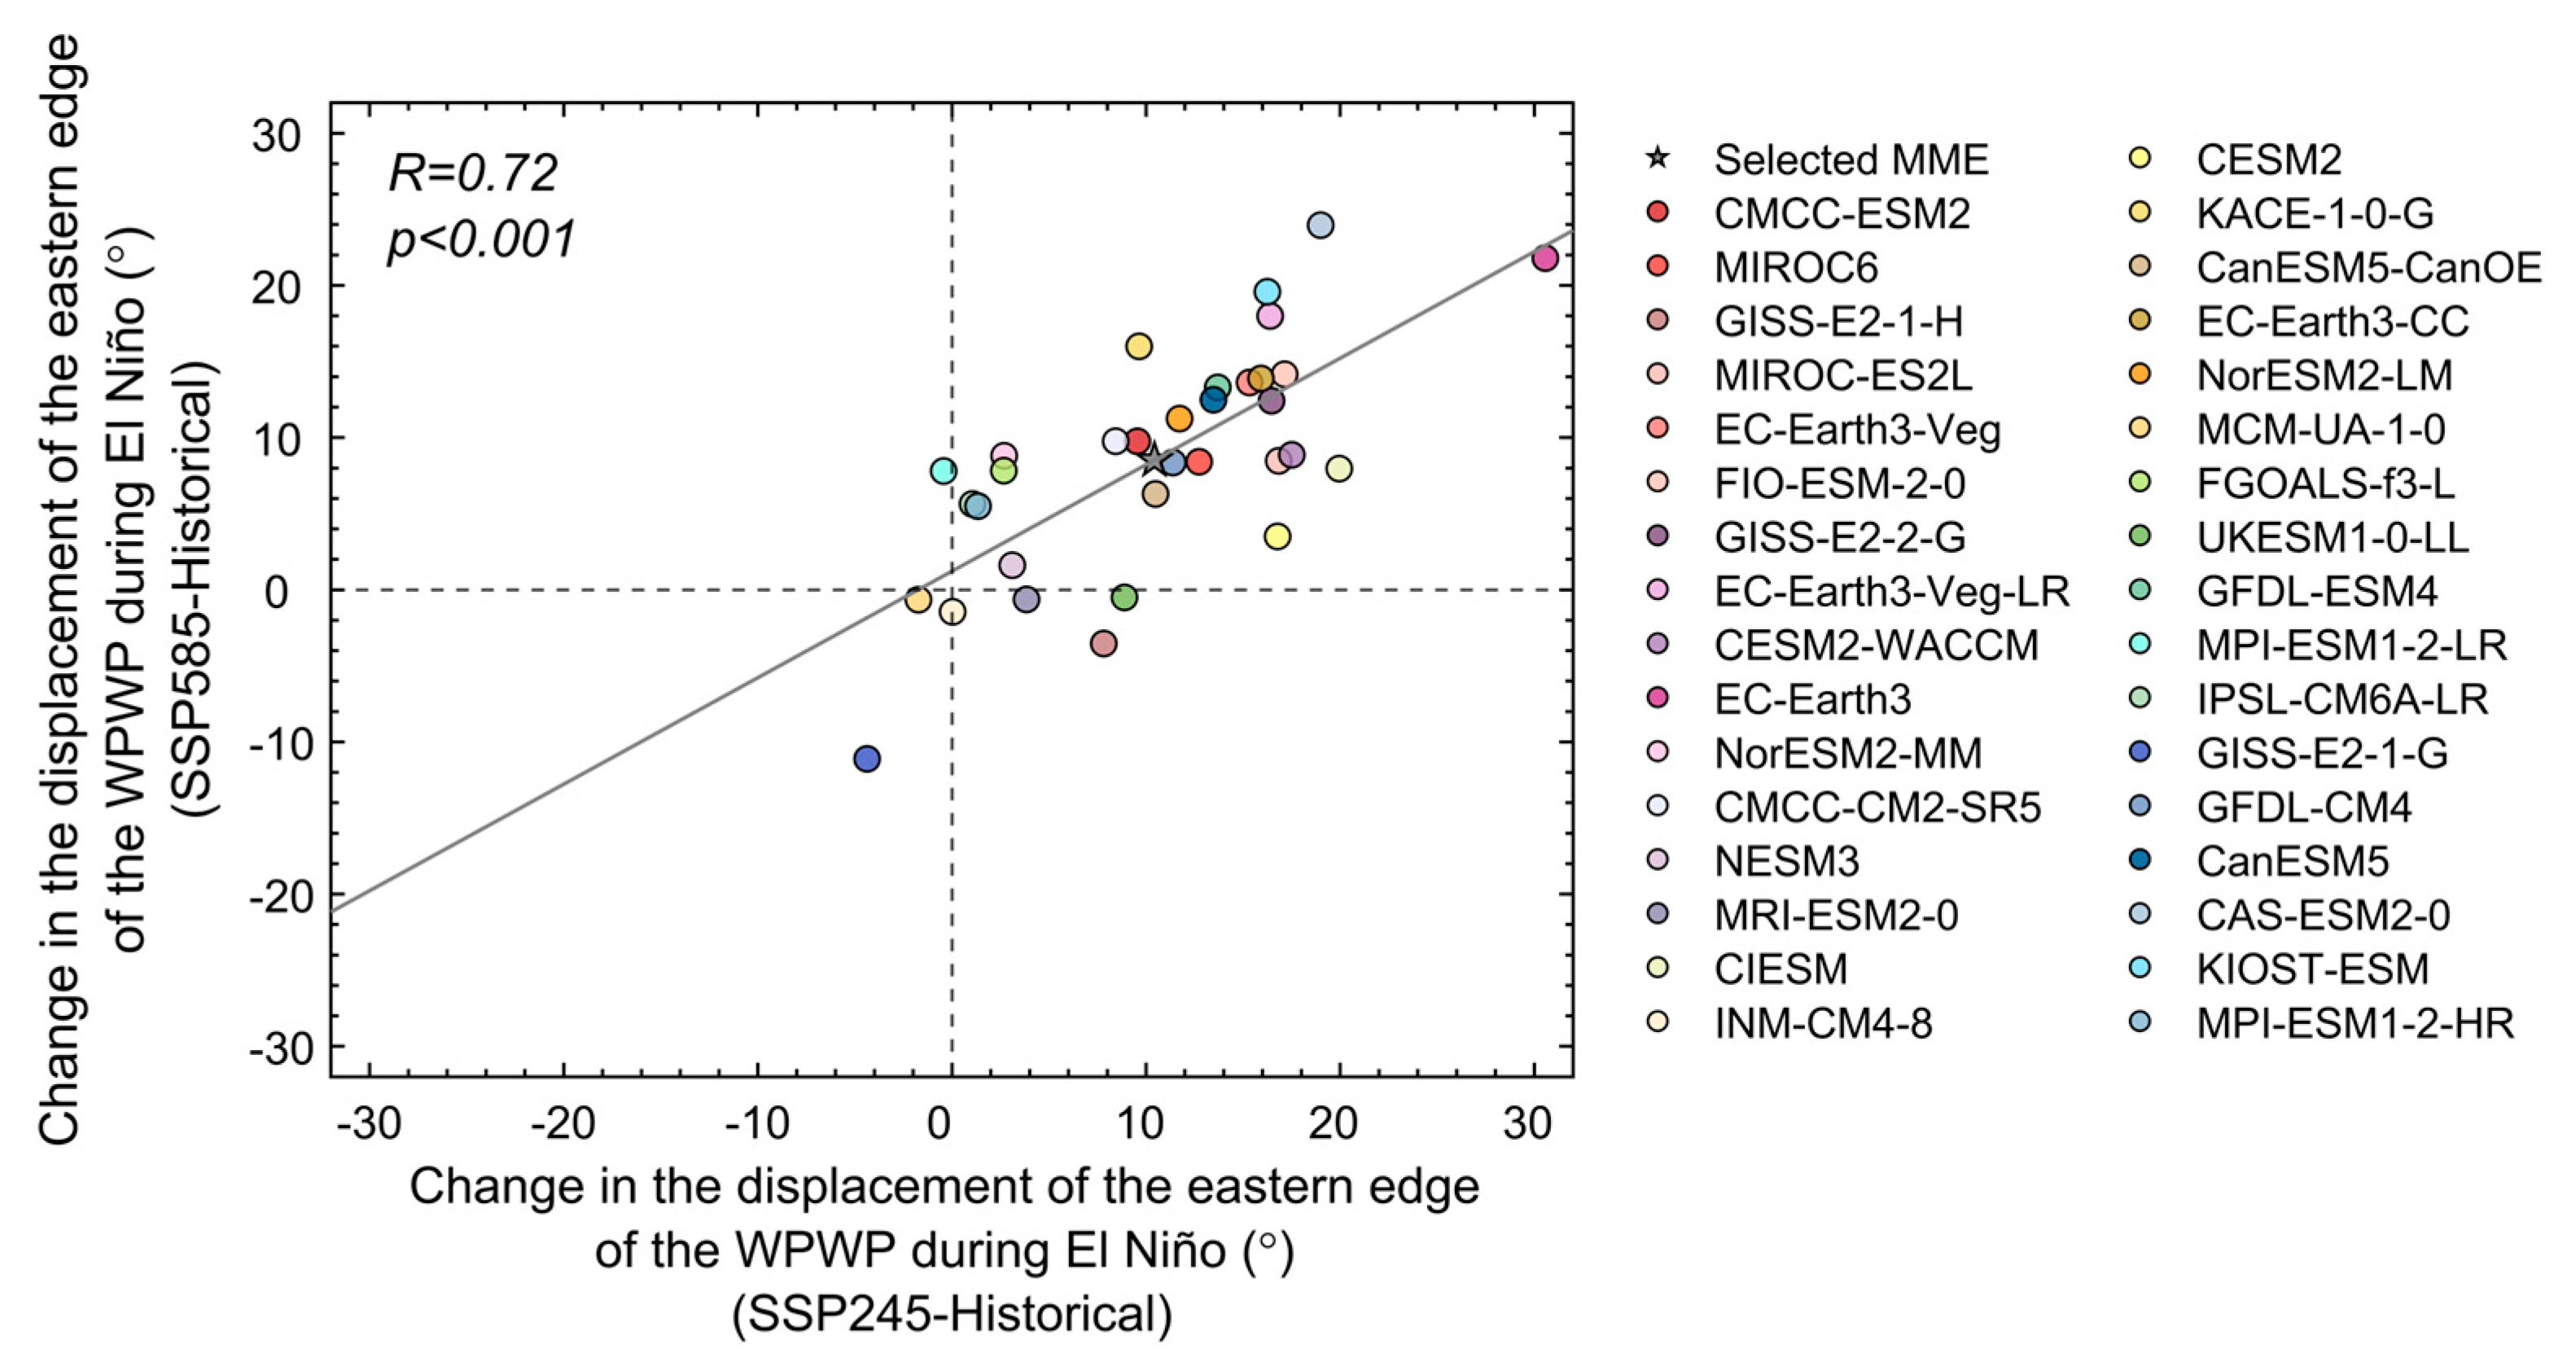
For all models, consistency analysis reveals that 28 models agree on the direction of WPWP displacement changes in response to both SSP245 and SSP585 scenarios (Figure 5). Figure 5 illustrates the correlation between changes in WPWP boundary displacement under the SSP245 and SSP585 scenarios. A correlation coefficient of 0.72, statistically significant at the 99.9% confidence level, supports the conclusion that global warming leads to an enhanced eastward displacement of the WPWP boundary. Among the 33 models analyzed, 26 consistently project an increase in WPWP displacement under both SSP245 and SSP585 scenarios. These include CMCC-ESM2, MIROC6, MIROC-ES2L, EC-Earth3-Veg, FIO-ESM-2-0, GISS-E2-2-G, EC-Earth3-Veg-LR, CESM2-WACCM, EC-Earth3, NorESM2-MM, CMCC-CM2-SR5, NESM3, CIESM, CESM2, KACE-1-0-G, CanESM5-CanOE, EC-Earth3-CC, NorESM2-LM, FGOALS-f3-L, GFDL-ESM4, IPSL-CM6A-LR, GFDL-CM4, CanESM5, CAS-ESM2-0, KIOST-ESM, and MPI-ESM1-2-HR. By contrast, GISS-E2-1-G and MCM-UA-1-0 consistently project a decrease under both scenarios. The remaining five models—GISS-E2-1-H, INM-CM4-8, MPI-ESM1-2-LR, MRI-ESM2-0, and UKESM1-0-LL—exhibit scenario-dependent behavior. Notably, the INM-CM4-8 model exhibits minimal change in the displacement of the WPWP eastern boundary under both warming scenarios.
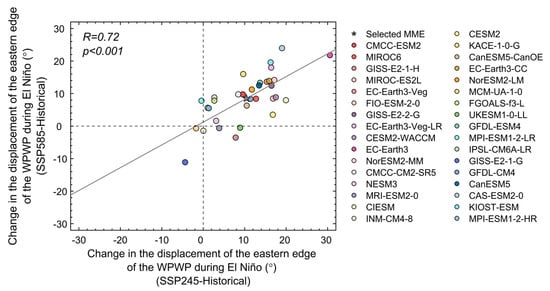
Figure 5.
The correlation between the change in the displacement of the WPWP boundary from the historical run to the SSP245 scenario and that from the historical run to the SSP585 scenario. The gray pentagram represents the MME mean, and colored dots represent individual models. The correlation (R) and confidence level (p) corresponding to the least squares regression fit (shown as the gray solid line) are also provided.
3.3. Relationship Between the El Niño Magnitude and the Displacement of the WPWP
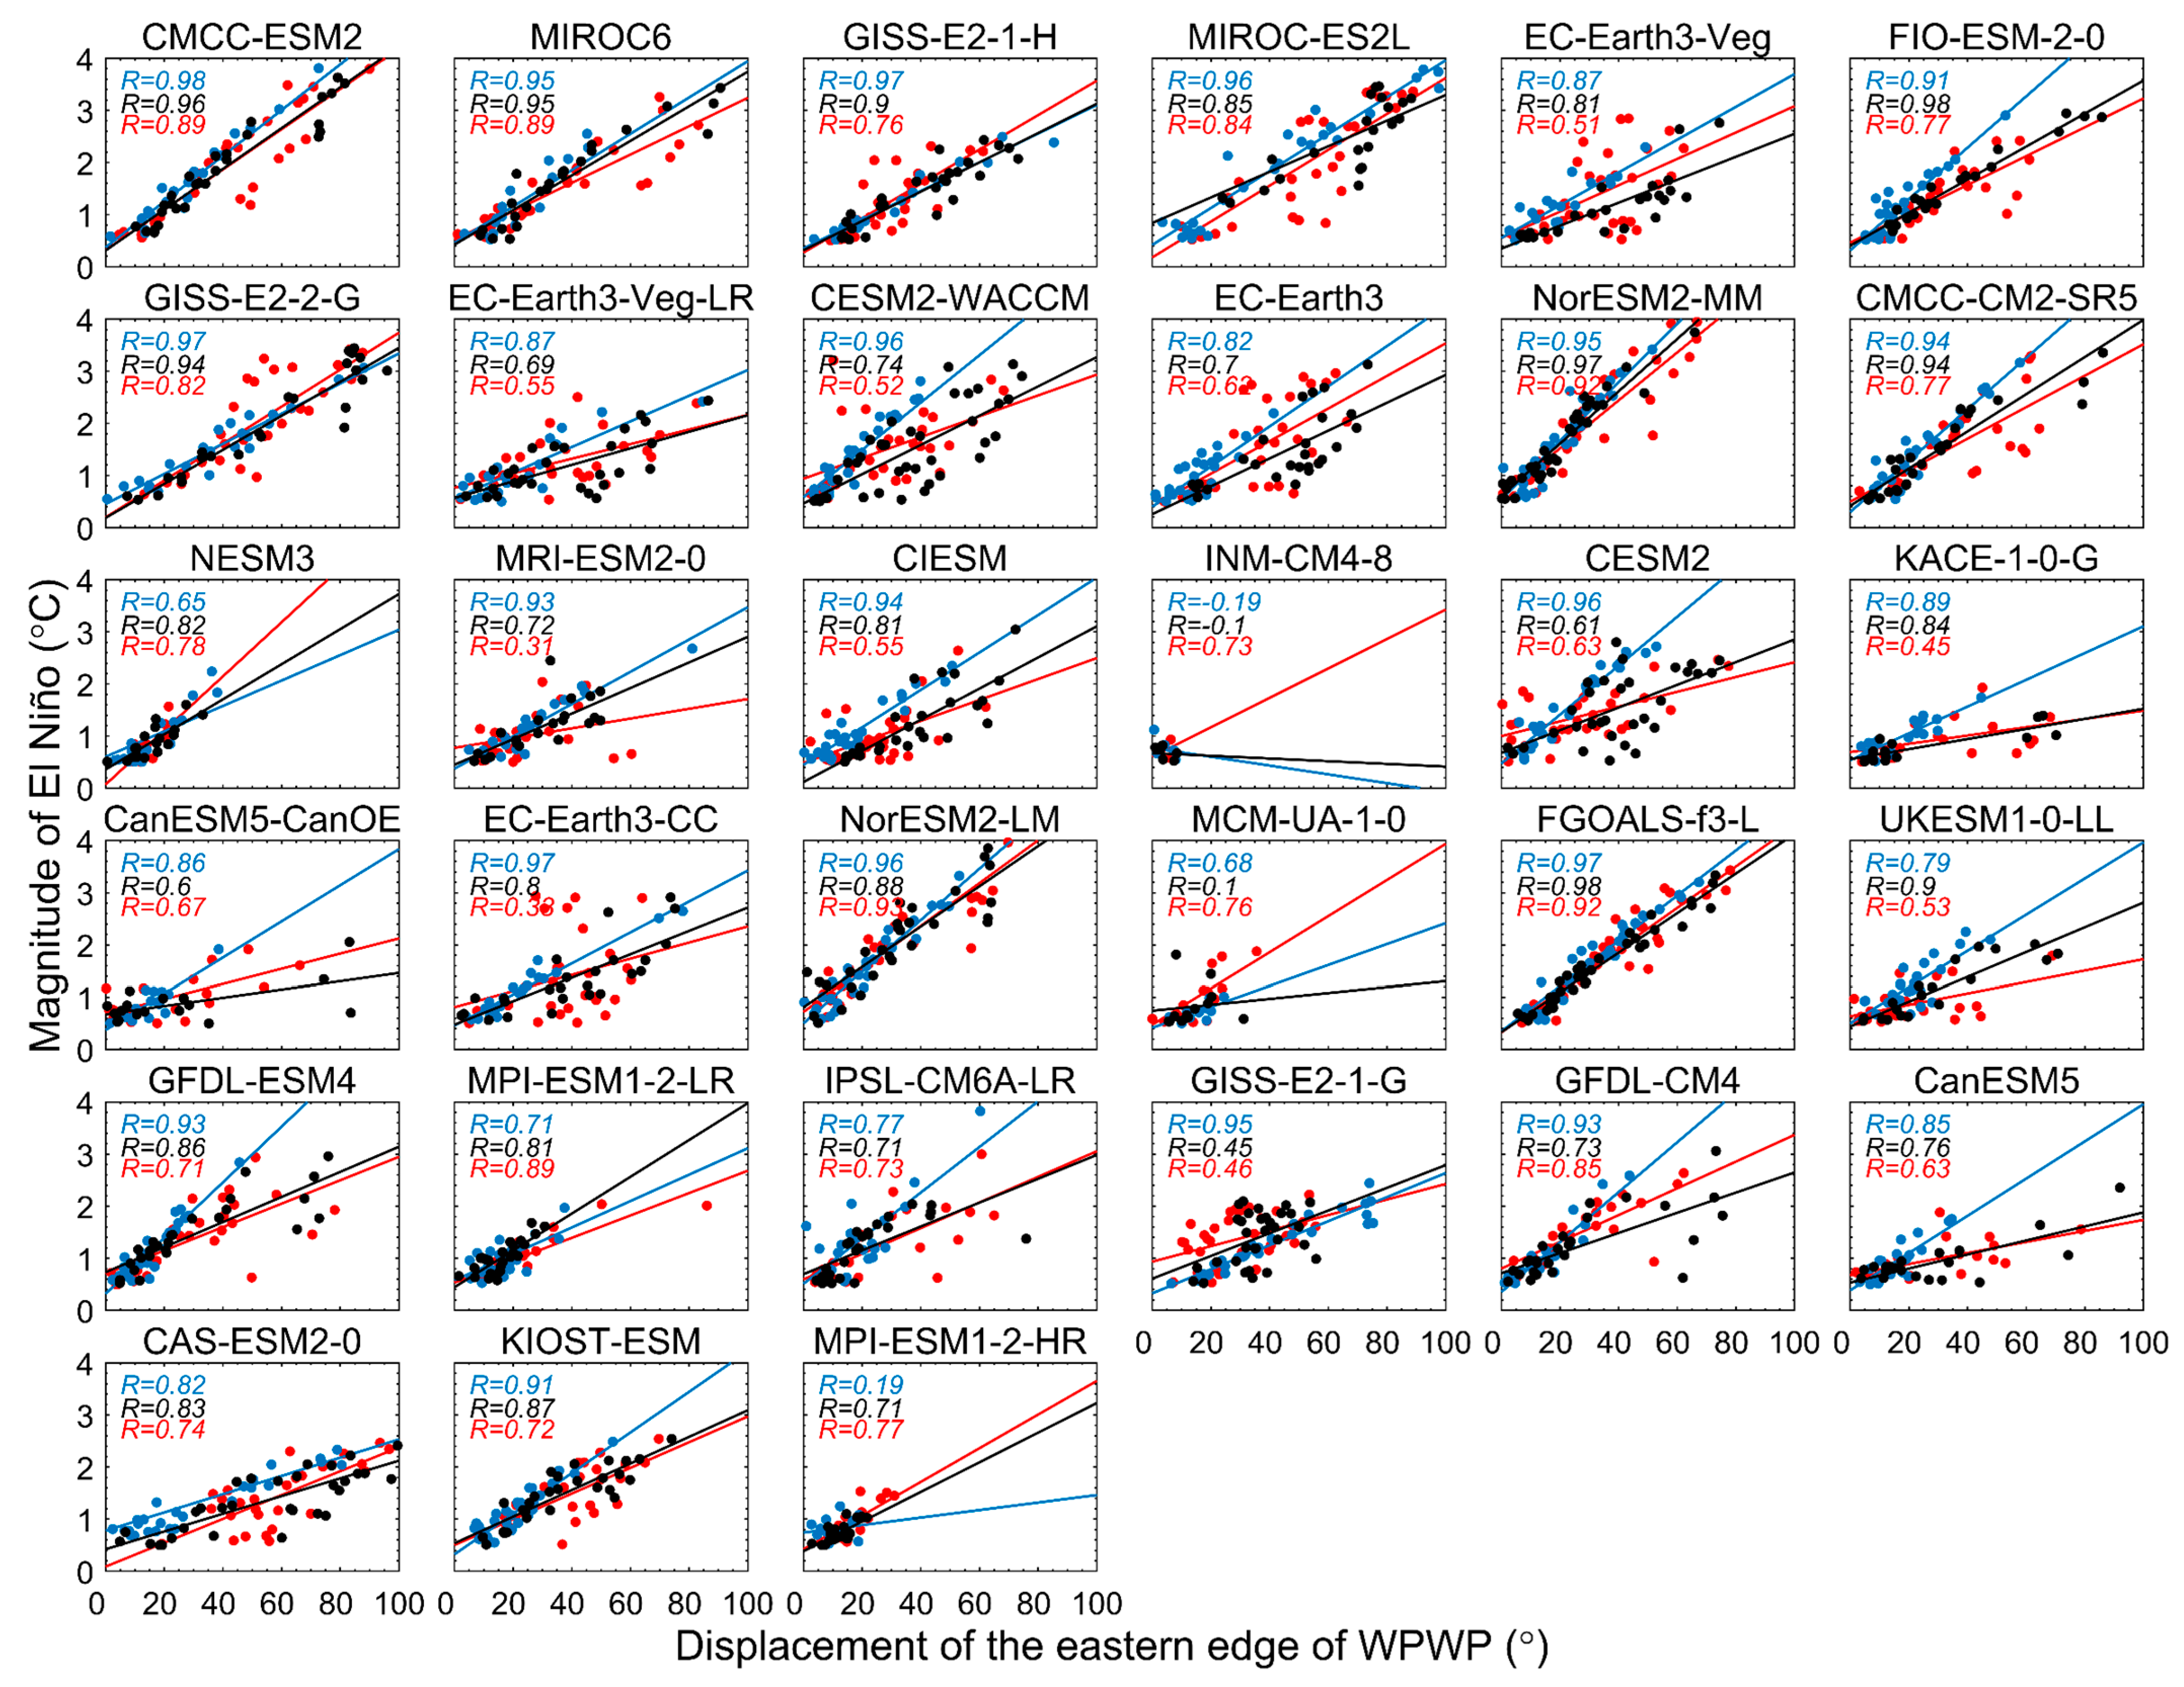
Historical simulations demonstrate a robust relationship between El Niño magnitude and the displacement of the WPWP eastern boundary, which largely persists under global warming (Figure 6). Figure 6 illustrates the relationship between El Niño magnitude and the eastward displacement of the WPWP during El Niño events under the historical run (blue), the SSP245 scenario (black), and the SSP585 scenario (red). Nearly all models capture this relationship in the historical period, with the exception of the INM-CM4-8 and MPI-ESM1-2-HR models. Under the SSP245 scenario, a positive correlation between stronger El Niño events and greater WPWP displacement is projected by 31 out of 33 models, with the exceptions being INM-CM4-8 and MCM-UA-1-0. Similarly, most models reproduce this relationship under the SSP585 scenario, except for MRI-ESM2-0 and EC-Earth3-CC. Although the correlation weakens in some models under warming (23 under SSP245 and 28 under SSP585), it generally remains statistically significant. These results further support the interpretation of El Niño as a manifestation of WPWP boundary displacement under both present and future climate conditions while also suggesting that other dynamical processes may influence El Niño intensity in a warming climate.
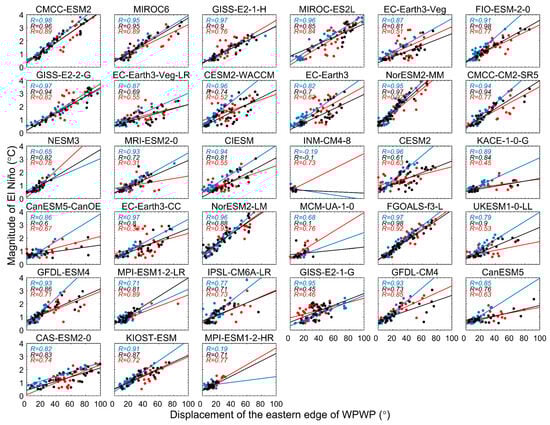
Figure 6.
Relationship between El Niño magnitude and the eastward displacement of the eastern edge of the WPWP during El Niño events under the historical run (blue), the SSP245 scenario (black), and the SSP585 scenario (red). Linear regression lines are shown in corresponding colors. The correlation coefficients (R) for each scenario are also indicated in blue (historical), black (SSP245), and red (SSP585).
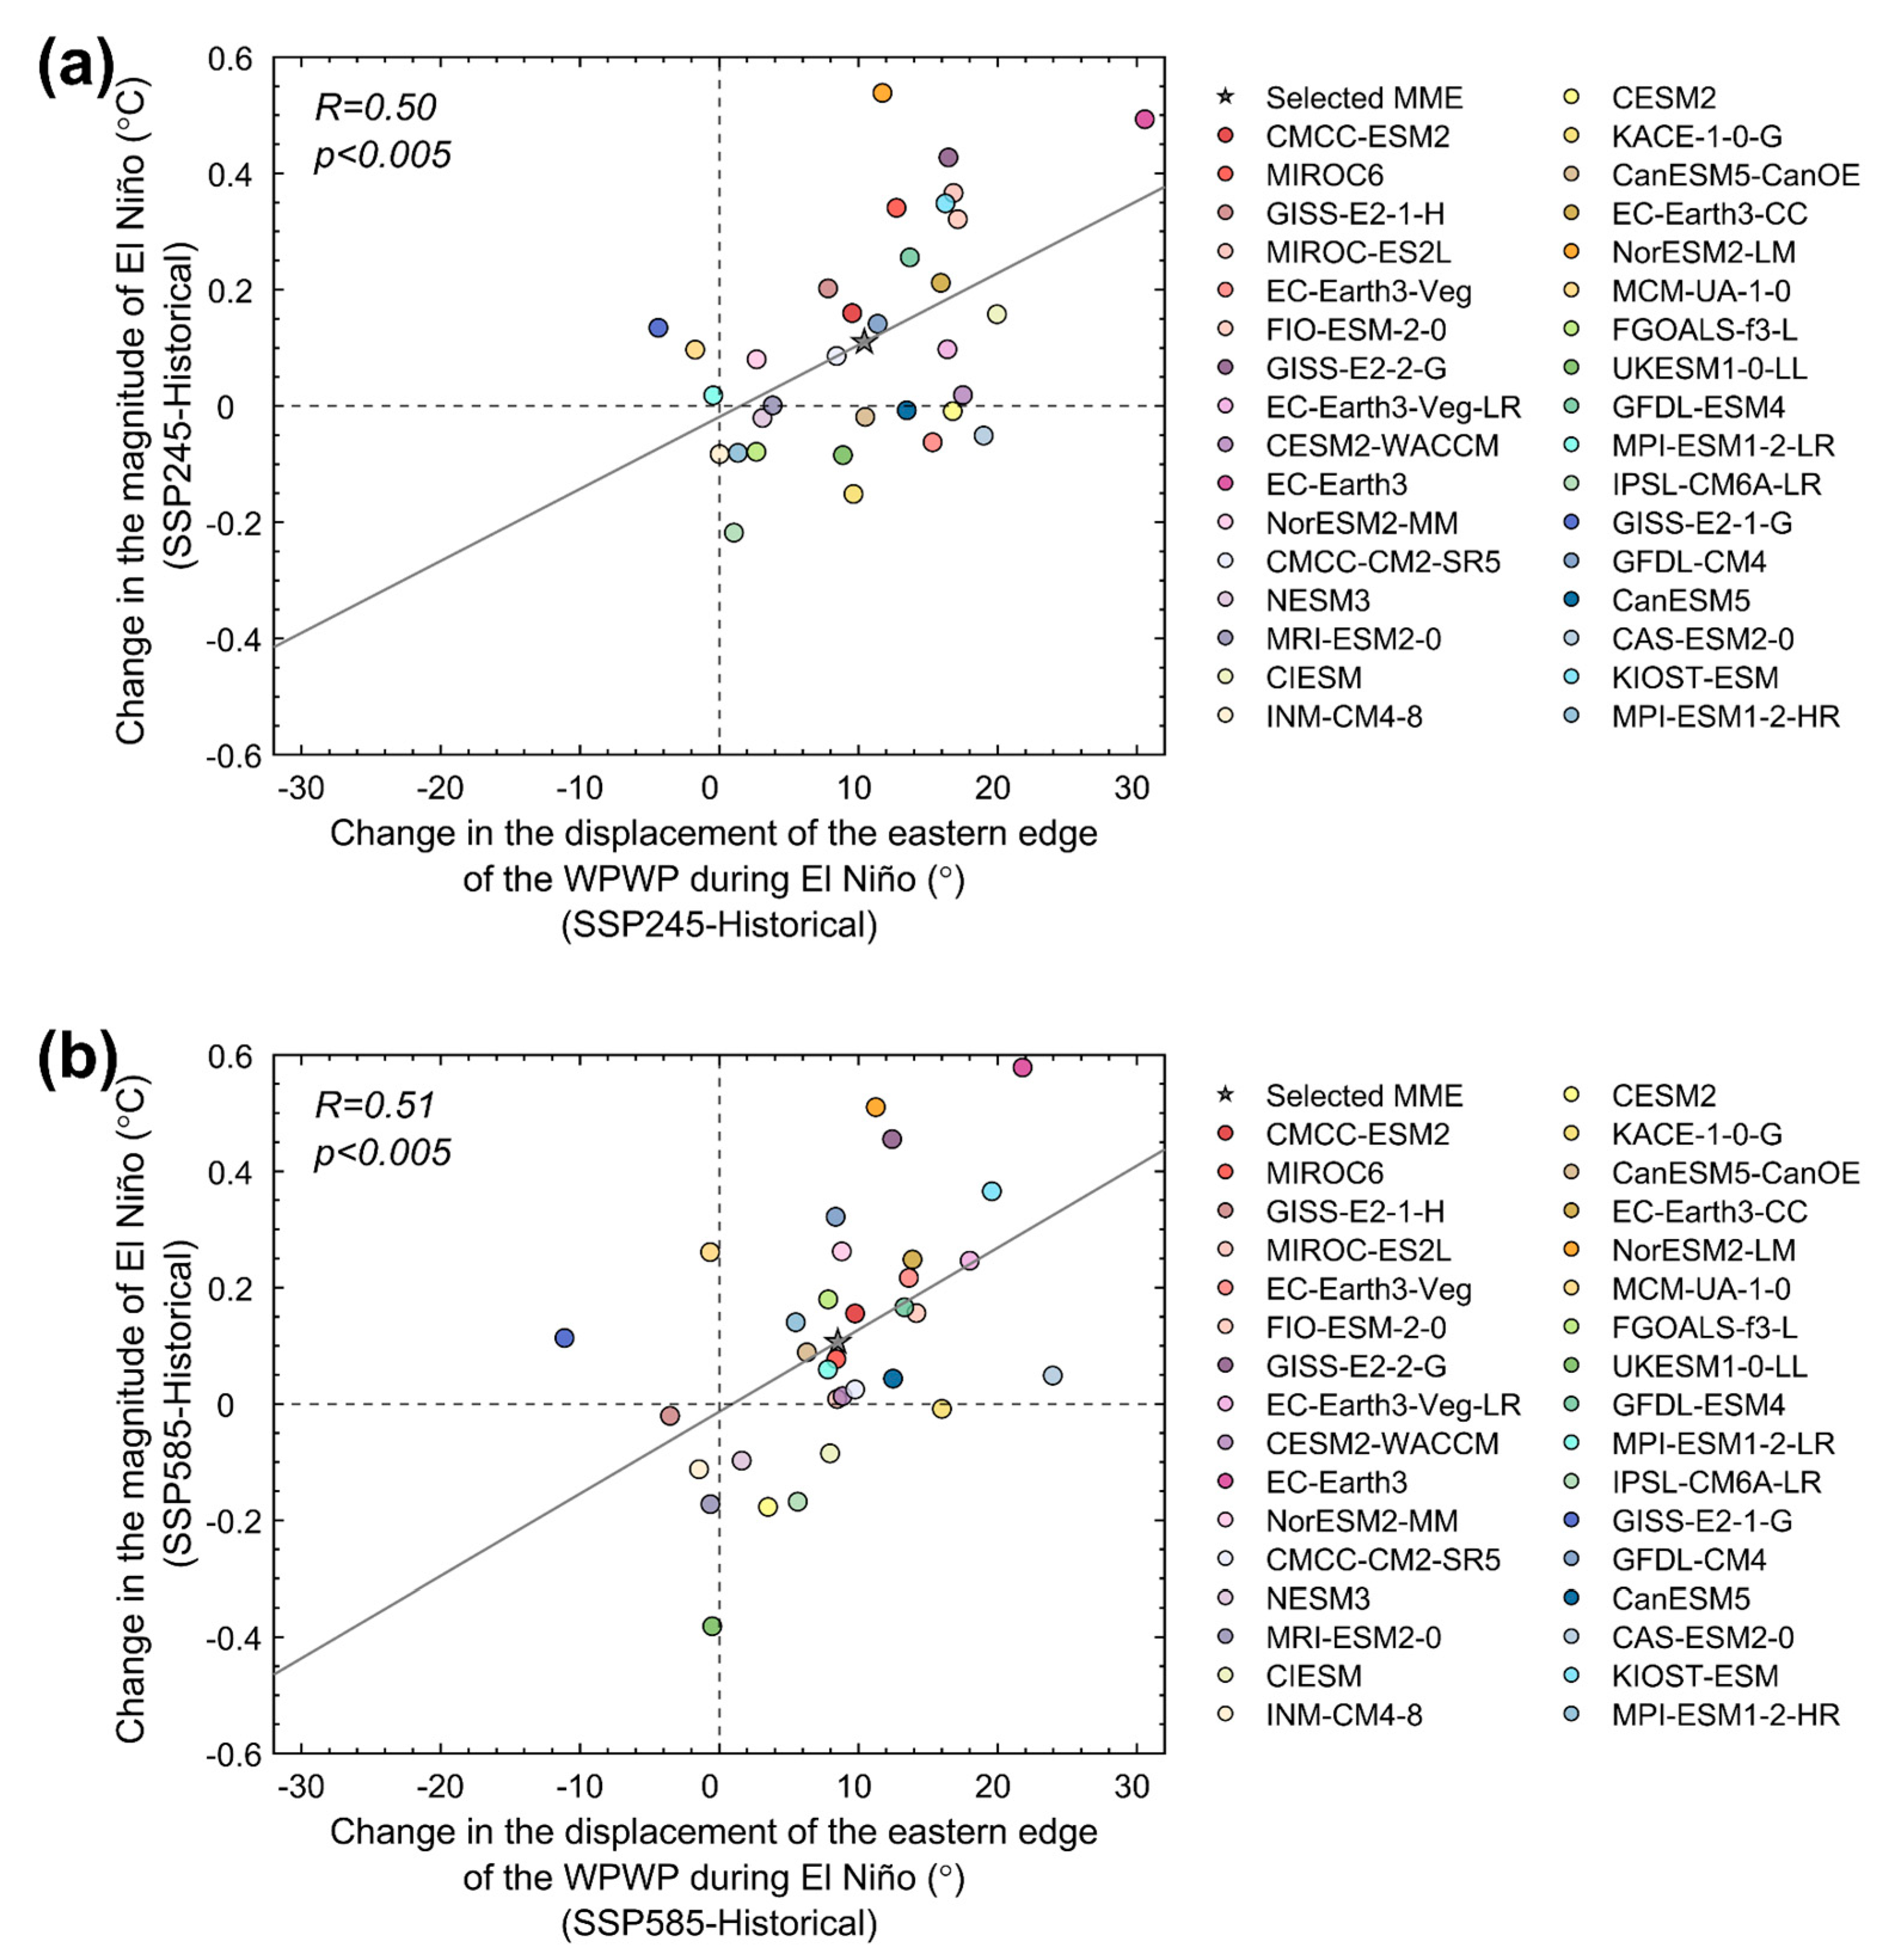
Under future climate warming scenarios, most models project an increase in El Niño magnitude accompanied by a more pronounced eastward displacement of the WPWP’s eastern edge (Figure 7). Figure 7a illustrates the relationship between projected changes in El Niño intensity and WPWP displacement under the SSP245 scenario, revealing a linear connection between the two variables. The calculated correlation coefficient is 0.50, which is statistically significant at a confidence level of 99.5%. Similarly, under the SSP585 scenario (Figure 7b), the correlation remains robust. The correlation coefficient between the two variables is 0.51 and meets the same significance criteria. This consistent inter-model response further supports the interpretation of El Niño as an eastward extension of the WPWP in a warming climate.
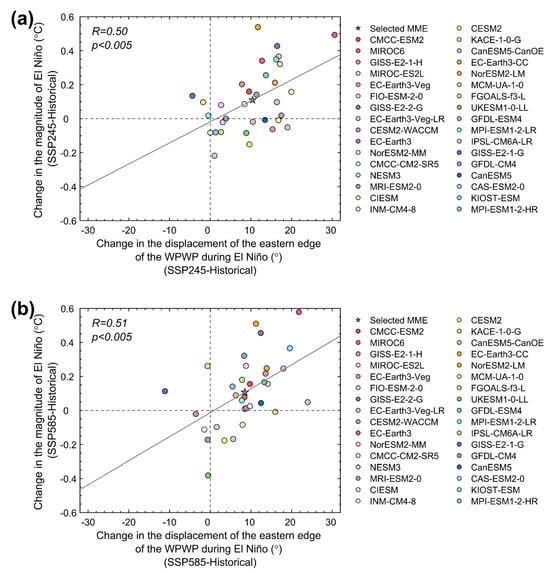
Figure 7.
Inter-model relationship between projected changes in El Niño magnitude and the displacement of the eastern edge of the WPWP during El Niño events: (a) from the historical run to the SSP245 scenario and (b) from the historical run to the SSP585 scenario. The MME mean is represented by the gray pentagram, and individual models are shown as colored dots. The gray line indicates the least-squares linear regression fit. The correlation coefficient (R) and significance level (p) are also provided. Positive values indicate an increase relative to the historical period.
4. Discussion
There is a strong correlation between the magnitude of El Niño and the displacement of the WPWP boundary, a relationship also supported by theoretical studies [12,13,14]. In Part I, this connection was examined using historical simulations from the CMIP6 models, revealing that the vast majority of models successfully reproduce the observed correlation. A key question that arises is whether this relationship remains robust under global warming. In the present study, we extended the analysis to future projections to assess whether the El Niño–WPWP relationship persists under global warming.
Through the analysis of outputs from 33 CMIP6 models under future warming scenarios, we found that similar to the historical simulations, most models continue to project a positive correlation between El Niño magnitude and the displacement of the WPWP eastern boundary, although the correlation tends to be somewhat weaker in a warmer climate. The results reinforce the view that El Niño can be understood as a manifestation of WPWP boundary displacement across both present and future climates while also indicating that additional dynamic processes may play an increasing role in modulating El Niño intensity in a warming climate. Under future warming, the MME mean projects stronger El Niño events, consistent with previous studies [17,30,31], as well as an enhanced eastward displacement of the WPWP boundary. Moreover, under different warming scenarios, the models show consistent changes in the variation of the intensity of El Niño and the change of the boundary of the WPWP, respectively. Among models showing a positive response to warming, the MME-projected increase in El Niño magnitude is 0.20 ± 0.03 °C under the SSP585 scenario, slightly lower than the 0.21 ± 0.03 °C increase projected under SSP245. The WPWP boundary displacement during El Niño events is also projected to be smaller under SSP585 (11.1 ± 1.0° in longitude) than under SSP245 (11.7 ± 1.3°). These findings further support the reflected displacement of the WPWP boundary.
However, the inter-model spread is substantial: projected changes in El Niño magnitude range from a decrease of 0.22 °C to an increase of 0.54 °C under the SSP245 scenario and from a decrease of 0.38 °C to an increase of 0.58 °C under the SSP585 scenario. Meanwhile, the projected displacement of the WPWP boundary ranges from a westward shift of 4.4° to an eastward shift of 30.6° under the SSP245 scenario and from a westward shift of 11.1° to an eastward shift of 24.0° under the SSP585 scenario. Despite this variability, a robust inter-model relationship persists: models projecting stronger El Niño events also tend to project greater WPWP displacement.
The strong relationship identified in this study may provide a novel perspective for understanding how El Niño may respond to global warming, an issue that has not been satisfactorily addressed [32,33,34,35,36]. Specifically, we proposed an understanding of El Niño through the stability and variability of the warm pool.
Author Contributions
Conceptualization, Z.G.; Data curation, Z.G.; Formal analysis, Z.G.; Funding acquisition, D.-Z.S.; Investigation, Z.G.; Methodology, Z.G.; Supervision, D.-Z.S.; Validation, Z.G.; Visualization, Z.G.; Writing—original draft, Z.G.; Writing—review and editing, D.-Z.S. All authors have read and agreed to the published version of the manuscript.
Funding
This research was funded by the National Natural Science Foundation of China, grant number 42250710154.
Data Availability Statement
The HadISST data are available at https://www.metoffice.gov.uk/hadobs/hadisst/data/download.html (accessed on 30 March 2024). The data from CMIP6 coupled models can be downloaded online: https://aims2.llnl.gov/search/cmip6/ (accessed on 30 March 2024).
Acknowledgments
The authors thank the Hadley Centre for the SST data and the WCRP for providing the simulations and projections by CMIP6 models.
Conflicts of Interest
The authors declare no conflicts of interest.
References
- Ropelewski, C.F.; Halpert, M.S. Global and regional scale precipitation patterns associated with the El Niño/Southern Oscillation. Mon. Weather Rev. 1987, 115, 1606–1626. [Google Scholar] [CrossRef]
- Ronghui, H.; Yifang, W. The influence of ENSO on the summer climate change in China and its mechanism. Adv. Atmos. Sci. 1989, 6, 21–32. [Google Scholar] [CrossRef]
- Zhang, R.; Sumi, A.; Kimoto, M. Impact of El Niño on the East Asian monsoon a diagnostic study of the ‘86/87 and ‘91/92 events. J. Meteorol. Soc. Jpn. Ser. II 1996, 74, 49–62. [Google Scholar] [CrossRef]
- Wang, B.; Wu, R.; Fu, X. Pacific–East Asian teleconnection: How does ENSO affect East Asian climate? J. Clim. 2000, 13, 1517–1536. [Google Scholar] [CrossRef]
- Neelin, J.; Chou, C.; Su, H. Tropical drought regions in global warming and El Niño teleconnections. Geophys. Res. Lett. 2003, 30, 2273. [Google Scholar] [CrossRef]
- Chiodi, A.M.; Harrison, D.E. El Niño impacts on seasonal US atmospheric circulation, temperature, and precipitation anomalies: The OLR-event perspective. J. Clim. 2013, 26, 822–837. [Google Scholar] [CrossRef]
- Lu, B.; Li, H.; Wu, J.; Zhang, T.; Liu, J.; Liu, B.; Chen, Y.; Baishan, J. Impact of El Niño and Southern Oscillation on the summer precipitation over Northwest China. Atmos. Sci. Lett. 2019, 20, e928. [Google Scholar] [CrossRef]
- McPhaden, M.J.; Zebiak, S.E.; Glantz, M.H. ENSO as an integrating concept in earth science. Science 2006, 314, 1740–1745. [Google Scholar] [CrossRef]
- Cai, W.; McPhaden, M.J.; Grimm, A.M.; Rodrigues, R.R.; Taschetto, A.S.; Garreaud, R.D.; Dewitte, B.; Poveda, G.; Ham, Y.-G.; Santoso, A. Climate impacts of the El Niño–southern oscillation on South America. Nat. Rev. Earth Environ. Health 2020, 1, 215–231. [Google Scholar] [CrossRef]
- Goddard, L.; Gershunov, A. Impact of El Niño on weather and climate extremes. In El Niño Southern Oscillation in a Changing Climate; Wiely: Hoboken, NJ, USA, 2020; pp. 361–375. [Google Scholar]
- Liu, Y.; Cai, W.; Lin, X.; Li, Z.; Zhang, Y. Nonlinear El Niño impacts on the global economy under climate change. Nat. Commun. 2023, 14, 5887. [Google Scholar] [CrossRef]
- Wyrtki, K. Water displacements in the Pacific and the genesis of El Niño cycles. J. Geophys. Res. Ocean. 1985, 90, 7129–7132. [Google Scholar] [CrossRef]
- Picaut, J.; Ioualalen, M.; Menkès, C.; Delcroix, T.; Mcphaden, M.J. Mechanism of the zonal displacements of the Pacific warm pool: Implications for ENSO. Science 1996, 274, 1486–1489. [Google Scholar] [CrossRef]
- Picaut, J.; Masia, F.; Du Penhoat, Y. An advective-reflective conceptual model for the oscillatory nature of the ENSO. Science 1997, 277, 663–666. [Google Scholar] [CrossRef]
- Timmermann, A.; Oberhuber, J.; Bacher, A.; Esch, M.; Latif, M.; Roeckner, E. Increased El Niño frequency in a climate model forced by future greenhouse warming. Nature 1999, 398, 694–697. [Google Scholar] [CrossRef]
- Lee, T.; McPhaden, M.J. Increasing intensity of El Niño in the central-equatorial Pacific. Geophys. Res. Lett. 2010, 37, L14603. [Google Scholar] [CrossRef]
- Cai, W.; Borlace, S.; Lengaigne, M.; Van Rensch, P.; Collins, M.; Vecchi, G.; Timmermann, A.; Santoso, A.; McPhaden, M.J.; Wu, L. Increasing frequency of extreme El Niño events due to greenhouse warming. Nat. Clim. Change 2014, 4, 111–116. [Google Scholar] [CrossRef]
- Wang, G.; Cai, W.; Gan, B.; Wu, L.; Santoso, A.; Lin, X.; Chen, Z.; McPhaden, M.J. Continued increase of extreme El Niño frequency long after 1.5℃ warming stabilization. Nat. Clim. Change 2017, 7, 568–572. [Google Scholar] [CrossRef]
- Cai, W.; Wang, G.; Dewitte, B.; Wu, L.; Santoso, A.; Takahashi, K.; Yang, Y.; Carréric, A.; McPhaden, M.J. Increased variability of eastern Pacific El Niño under greenhouse warming. Nature 2018, 564, 201–206. [Google Scholar] [CrossRef]
- Heede, U.K.; Fedorov, A.V. Towards understanding the robust strengthening of ENSO and more frequent extreme El Niño events in CMIP6 global warming simulations. Clim. Dyn. 2023, 61, 3047–3060. [Google Scholar]
- Pathirana, G.; Oh, J.-H.; Cai, W.; An, S.-I.; Min, S.-K.; Jo, S.-Y.; Shin, J.; Kug, J.-S. Increase in convective extreme El Niño events in a CO2 removal scenario. Sci. Adv. 2023, 9, eadh2412. [Google Scholar] [CrossRef]
- Rayner, N.; Parker, D.E.; Horton, E.; Folland, C.K.; Alexander, L.V.; Rowell, D.; Kent, E.C.; Kaplan, A. Global analyses of sea surface temperature, sea ice, and night marine air temperature since the late nineteenth century. J. Geophys. Res. Atmos. 2003, 108, 4407. [Google Scholar] [CrossRef]
- Zhang, T.; Sun, D.-Z. ENSO asymmetry in CMIP5 models. J. Clim. 2014, 27, 4070–4093. [Google Scholar] [CrossRef]
- Hayashi, M.; Jin, F.-F.; Stuecker, M.F. Dynamics for El Niño-La Niña asymmetry constrain equatorial-Pacific warming pattern. Nat. Commun. 2020, 11, 4330. [Google Scholar] [CrossRef]
- Zhao, Y.; Sun, D.-Z. ENSO asymmetry in CMIP6 models. J. Clim. 2022, 35, 5555–5572. [Google Scholar] [CrossRef]
- Eyring, V.; Bony, S.; Meehl, G.A.; Senior, C.A.; Stevens, B.; Stouffer, R.J.; Taylor, K.E. Overview of the Coupled Model Intercomparison Project Phase 6 (CMIP6) experimental design and organization. Geosci. Model Dev. 2016, 9, 1937–1958. [Google Scholar] [CrossRef]
- Geng, T.; Jia, F.; Cai, W.; Wu, L.; Gan, B.; Jing, Z.; Li, S.; McPhaden, M.J. Increased occurrences of consecutive La Niña events under global warming. Nature 2023, 619, 774–781. [Google Scholar] [CrossRef]
- Kim, B.-M.; An, S.-I. Understanding ENSO regime behavior upon an increase in the warm-pool temperature using a simple ENSO model. J. Clim. 2011, 24, 1438–1450. [Google Scholar] [CrossRef]
- Liang, J.; Yang, X.-Q.; Sun, D.-Z. Factors determining the asymmetry of ENSO. J. Clim. 2017, 30, 6097–6106. [Google Scholar] [CrossRef]
- Cai, W.; Santoso, A.; Wang, G.; Yeh, S.-W.; An, S.-I.; Cobb, K.M.; Collins, M.; Guilyardi, E.; Jin, F.-F.; Kug, J.-S. ENSO and greenhouse warming. Nat. Clim. Change 2015, 5, 849–859. [Google Scholar] [CrossRef]
- Wang, B.; Luo, X.; Yang, Y.-M.; Sun, W.; Cane, M.A.; Cai, W.; Yeh, S.-W.; Liu, J. Historical change of El Niño properties sheds light on future changes of extreme El Niño. Proc. Natl. Acad. Sci. USA 2019, 116, 22512–22517. [Google Scholar] [CrossRef]
- Knutson, T.R.; Manabe, S.; Gu, D. Simulated ENSO in a global coupled ocean–atmosphere model: Multidecadal amplitude modulation and CO2 sensitivity. J. Clim. 1997, 10, 138–161. [Google Scholar] [CrossRef]
- Collins, M.; An, S.-I.; Cai, W.; Ganachaud, A.; Guilyardi, E.; Jin, F.-F.; Jochum, M.; Lengaigne, M.; Power, S.; Timmermann, A. The impact of global warming on the tropical Pacific Ocean and El Niño. Nat. Geosci. 2010, 3, 391–397. [Google Scholar] [CrossRef]
- Wang, Y.; Luo, Y.; Lu, J.; Liu, F. Changes in ENSO amplitude under climate warming and cooling. Clim. Dyn. 2019, 52, 1871–1882. [Google Scholar] [CrossRef]
- Cai, W.; Ng, B.; Geng, T.; Wu, L.; Santoso, A.; McPhaden, M.J. Butterfly effect and a self-modulating El Niño response to global warming. Nature 2020, 585, 68–73. [Google Scholar] [CrossRef]
- Callahan, C.W.; Chen, C.; Rugenstein, M.; Bloch-Johnson, J.; Yang, S.; Moyer, E.J. Robust decrease in El Niño/Southern Oscillation amplitude under long-term warming. Nat. Clim. Change 2021, 11, 752–757. [Google Scholar] [CrossRef]
Disclaimer/Publisher’s Note: The statements, opinions and data contained in all publications are solely those of the individual author(s) and contributor(s) and not of MDPI and/or the editor(s). MDPI and/or the editor(s) disclaim responsibility for any injury to people or property resulting from any ideas, methods, instructions or products referred to in the content. |
© 2025 by the authors. Licensee MDPI, Basel, Switzerland. This article is an open access article distributed under the terms and conditions of the Creative Commons Attribution (CC BY) license (https://creativecommons.org/licenses/by/4.0/).