Article

Recent Increasing Trend in Fire Activity over Southern India Inferred from Two Decades of MODIS Satellite Measurements

1
Department of Computer Science and Engineering, GITAM University, Hyderabad 502329, India
2
Department of Atmospheric Sciences, National Central University, Taoyuan 32001, Taiwan
3
Centre for Remote Sensing and Geo-Informatics, Sathyabama Institute of Science and Technology, Chennai 600119, India
4
Indian Institute of Tropical Meteorology, Ministry of Earth Science, Pune 411008, India
5
Department of Geophysics, Banaras Hindu University, Varanasi 221005, India
6
Department of Computer Science Engineering, Koneru Lakshmaiah Education Foundation, Vaddeswaram, Guntur 522302, India
*
Author to whom correspondence should be addressed.
Climate 2025, 13(5), 103; https://doi.org/10.3390/cli13050103
Submission received: 14 March 2025 / Revised: 9 May 2025 / Accepted: 13 May 2025 / Published: 16 May 2025
(This article belongs to the Section Climate and Environment)

Abstract

:
With rising global temperatures attributed to climate change, an increase in fire occurrences worldwide is anticipated. Therefore, a detailed examination of changing fire patterns is essential to improve our understanding of effective control strategies. This study analyzes the long-term trends of fire activity in Southern India (8–20° N, 73–85° E), utilizing MODIS active fire count data from January 2003 to December 2023. The climatological monthly mean results show that Southern India experiences heightened fire activity from December to May, reaching a peak in March. Yearly variations indicate that the highest fire counts occurred in 2021, followed by 2023, 2012, and 2018. The three most significant fire years in recent history reflect an upward trend in fire activity over the past decade, confirming insights from annual trend analysis. The correlation between inter-annual fire anomalies and different meteorological factors reveals a notable negative relationship with precipitation and soil moisture and a positive relationship with surface air temperature (SAT). Soil moisture demonstrates a stronger correlation (−0.45) than precipitation and SAT. In summary, long-term trends show a noteworthy annual increase of 3%. Additionally, monthly trends reveal interesting rising patterns in October, November, December, and January with higher significance levels. Our research supports regional climate action initiatives and policies addressing fire incidents in Southern India in light of the ongoing warming crisis.

1. Introduction

Active fire management is an essential traditional practice that plays a crucial role in converting organic matter from vegetation and soils into carbon [1]. Fire events, such as vegetation fires, forest fires and biomass burning, significantly affect ecosystems globally and have far-reaching implications for various human activities. These fires emit vast amounts of aerosols and gases into the atmosphere which greatly influence the global carbon cycle and subsequently the climate [1,2]. The Intergovernmental Panel on Climate Change [3] recently indicated that weather conditions favorable to fires are becoming more frequent in specific regions that may lead to an increasing trend in frequency and intensity of fires in a warming climate. Notably, countries in South and Southeast Asia, including India, Pakistan, Indonesia, and Myanmar, have seen a marked increase in fire activity over the last twenty years [4]. India stands as one of the richest countries in biodiversity, with forests occupying over one-fifth of its land area (Forest Survey of India [5]). Wildfires pose a significant environmental challenge in India, affecting human activities, wildlife, ecosystems, weather, and climate. More than half of the nation’s forested regions are susceptible to fires, with over 95% of these incidents caused by human activities [6,7]. The most intense fire season typically occurs during the dry pre-monsoon months of March to May, where the frequency and severity of fires vary with vegetation type, climatic conditions, and socioeconomic influences [8,9]. The impact of crop-residue burning in northwestern India after the wheat harvest in April–May (pre-monsoon) and the rice harvest in October–November (post-monsoon) has been thoroughly analyzed [10,11]. In Northeast India and the Eastern Ghats, fire activity is mainly linked to slash-and-burn farming methods [11].
In addition to ground-based in-situ measurements that enhance temporal resolution and provide detailed insights into fire emissions, satellite data are essential for monitoring and analyzing the spatial distribution of fire activity and its impacts. They also play a significant role in identifying long-term trends in fire activity within specific regions. Various studies have documented fire activity throughout India using satellite observations. For example, ref. [10] examined fire counts from the Along-Track Scanning Radiometer (ATSR) satellite to report the biomass burning (BB) trends in India from 1998 to 2009. Ref. [8] utilized data from the SPOT (Satellite Pour l’Observation de la Terre) satellite to outline the spatial fire characteristics in Andhra Pradesh. Moreover, ref. [9] quantified vegetation fire activity with MODerate resolution Imaging Spectroradiometer (MODIS) active fire datasets covering 2002 to 2010, revealing a statistically significant upward trend in fire activity in India. Ref. [12] investigated the relationship between various climate parameters and MODIS fire hotspots in the Palamau Tiger Reserve (PTR) in Jharkhand, India, from 2001 to 2017. Ref. [13] examined the spatiotemporal patterns of agricultural residue burning in central India using 15 years of MODIS data (2002–2016). Recently, Ref. [14] analyzed changes in forest fire activity in central India based on MODIS data from 2001 to 2020.
Fires are a significant source of greenhouse gas emissions, including carbon dioxide (CO2), carbon monoxide (CO), nitrogen oxides (NOx), methane (CH4), and non-methane hydrocarbons [15,16]. Additionally, they release various chemical compounds such as aerosols. These emissions have substantial impacts on the radiative budget, air quality, and public health at both local and regional scales [17,18]. Furthermore, pollutants are capable of traversing extensive distances, influencing not only local climatic conditions but also those of broader regional climates [19,20]. For example, every October and November, satellites detect numerous crop fires in northwestern India, primarily in Punjab and Haryana. These frequent fires produce smoke that drifts eastward, mixing with pollutants and obscuring the skies over the Indo-Gangetic Plain, which leads to air quality warnings in Delhi and nearby cities [21]. In this context, comprehending behavioral patterns, long-term alterations, and trends associated with fires is crucial for assessing their impacts and formulating effective control strategies. While previous studies have described trends in fire activity across India, there is a lack of comprehensive records documenting long-term trends and recent changes specifically in Southern India. This study focuses on changes in fire activity and long-term trends in South India, using 21 years of MODIS active fire counts data from January 2003 to December 2023. The manuscript is organized such that the details of the data used and methodology followed are given in Section 2, the results are presented in Section 3, and finally the main findings of the current study are presented in the summary and conclusion in Section 4.

2. Data and Methodology

2.1. MODIS Active Fire Data

We used the latest collection of C6.1 Moderate Resolution Imaging Spectroradiometer (MODIS) active fire counts during January 2003–December 2023. The MODIS instrument on board the Terra (Earth Observation Satellite (EOS) with morning crossover (AM-1)) and Aqua (EOS with afternoon crossover (PM-1)) satellites provides high spatial resolution (1 km) estimates of active fire products across the globe like the geographic location of the fire spot, burnt area, fire radiative power (FRP), and fire count detection confidence. To date, MODIS is the only instrument that provides the longest data record of fire activity with high spatial resolution global mapping of both fire locations and burned areas. More technical details and a description of the fire detection algorithm can be found in [22]. MODIS active fire/hotspot data for any country across the globe can be downloaded from https://firms.modaps.eosdis.nasa.gov (last access: 9 May 2025).
To see the plausible relation between fire activity and various meteorological parameters, we also used precipitation, surface temperature, and soil moisture during the study period. The Global Precipitation Climatology Project (GPCP) Version 3.2 Satellite-Gauge (SG) Combined Precipitation Data Set during the study period was used and the data can be downloaded from https://measures.gesdisc.eosdis.nasa.gov/data/GPCP/GPCPMON.3.2/ (last access: 8 May 2025). Surface air temperature during the study period was obtained from the MERRA-2 reanalysis and the data can be downloaded from https://disc.gsfc.nasa.gov/ (last access: 8 May 2025). Monthly mean soil moisture content (0–10 cm underground) from the Global Land Data Assimilation System (GLDAS)_NOAH025_M v2.1 was utilized and the data can be downloaded from https://hydro1.gesdisc.eosdis.nasa.gov/data/GLDAS/GLDAS_NOAH025_M.2.1/ (last access: 8 May 2025).

2.2. Methodology

In this study, we employed MODIS fire data with a confidence level exceeding 30%. To mitigate the risk of misidentifying fire events, only cases regarded as nominal to high confidence are included and instances classified as low-confidence fires (with confidence levels below 30%) were excluded from our dataset. Further, by utilizing all available fire counts, irrespective of the months within the study period, the long-term climatology and standard deviations of fire activity across India has been developed at a grid resolution of 0.5° × 0.5°. Based on these long-term means and standard deviations, we designated Southern India as the focal region for this research. Monthly active fire counts were estimated for Southern India from 2003 to 2023 for the subsequent analyses conducted in this study.
Using the MODIS active fire data from 2003–2023, we computed the standardized anomalies (SD) [4] for each month as
S D = X μ σ
where X represents the monthly total fire counts of the individual month, μ (σ) is the corresponding monthly long-term mean and σ is the standard deviation calculated using the data from 2003 to 2023. Similarly, we also estimated the standardized anomalies for precipitation, SAT, and SM during the study period. By using these standardized anomalies, we obtained the relationship between fire activity and meteorological parameters over SI. In this study, we employed the Pearson correlation method to analyze the relationship between fire activity and meteorological factors. This technique assesses the linear correlation between two variables, resulting in values ranging from +1 to −1: +1 signifies a perfect positive linear correlation, 0 indicates no linear correlation, and −1 denotes a perfect negative linear correlation. This method is frequently used in scientific research.
To estimate the trend, the relative percentage change in fire activity in each month during the study period is used. We estimated using following equation:
R e l a t i v e   c h a n g e   i n   f i r e   a c t i v i t y   ( % ) = x i x ¯ x ¯ × 100
where x i represents the monthly mean of the individual month and x ¯ is the long-term mean of the corresponding month calculated using the data from 2003 to 2023. By using these monthly percentages change in fires, we estimated the long-term trends in the fire activity over SI. The traditional and straight forward linear regression analysis using the least squares method, which is commonly applied for trend detection in atmospheric constituents, has been employed. We used direct trend code function, which is available in the Climate Data Toolbox [23].

3. Results and Discussion

3.1. Long-Term Mean Pattern of Fire Activity over India

Figure 1a illustrates the long-term annual mean spatial distribution of fire activity across India from January 2003 to December 2023. Figure 1b presents the standard deviations corresponding to this long-term annual mean. The analysis identifies three regions with heightened fire activity: North India (NI), Central India (CI), and Northeast India (NEI). Moderate fire activity is detected in Southern India (SI), although it remains relatively lower than the other regions, as depicted in Figure 1a,b. The notable standard deviations reflect significant inter-annual variability, similar to trends observed in other areas. Notably, fire activity in India shows pronounced seasonality and trend, as highlighted in earlier studies. It has been established that forest fires predominantly occur during the pre-monsoon period, while agricultural burning peaks in two phases: the pre-monsoon (April and May) and post-monsoon (October and November) [18]. Overall, Figure 1 confirms that NI, CI, and NEI are the primary regions for fire activity in India, aligning with existing research [14,24,25,26,27,28,29,30]. For instance, ref. [14] analyzed fires in CI from 2001 to 2020, revealing that approximately 70% occurred in March and April, particularly in the years 2009, 2012, and 2017, which saw significant fire incidents. Ref. [30] focused on the western Himalayan region, highlighting Uttarakhand as the state with the highest vulnerability to forest fires, in contrast to northwestern Himalayan states. Notably, the highest fire activity in NI (Punjab and Haryana) correlates strongly with the disposal of wheat crop residue during May, while the October/November fire activity is associated with rice crop residue burning [4]. According to the Indian national and statewide pollution inventory database, Punjab and Haryana rank among the highest for crop residues burned, releasing carbonaceous aerosols and trace gases, along with particulate matter [14]. The substantial emissions from these fires during October and November considerably affect the air quality and pollution levels in neighboring regions [15,16]. The influence of open field crop residue burning on aerosol and gaseous concentrations over northwestern India has been extensively studied and discussed previously [15,16,30]. Building on the extensive existing literature, this study will primarily examine changes in fire activity in Southern India, with major findings elaborated in the subsequent sections.

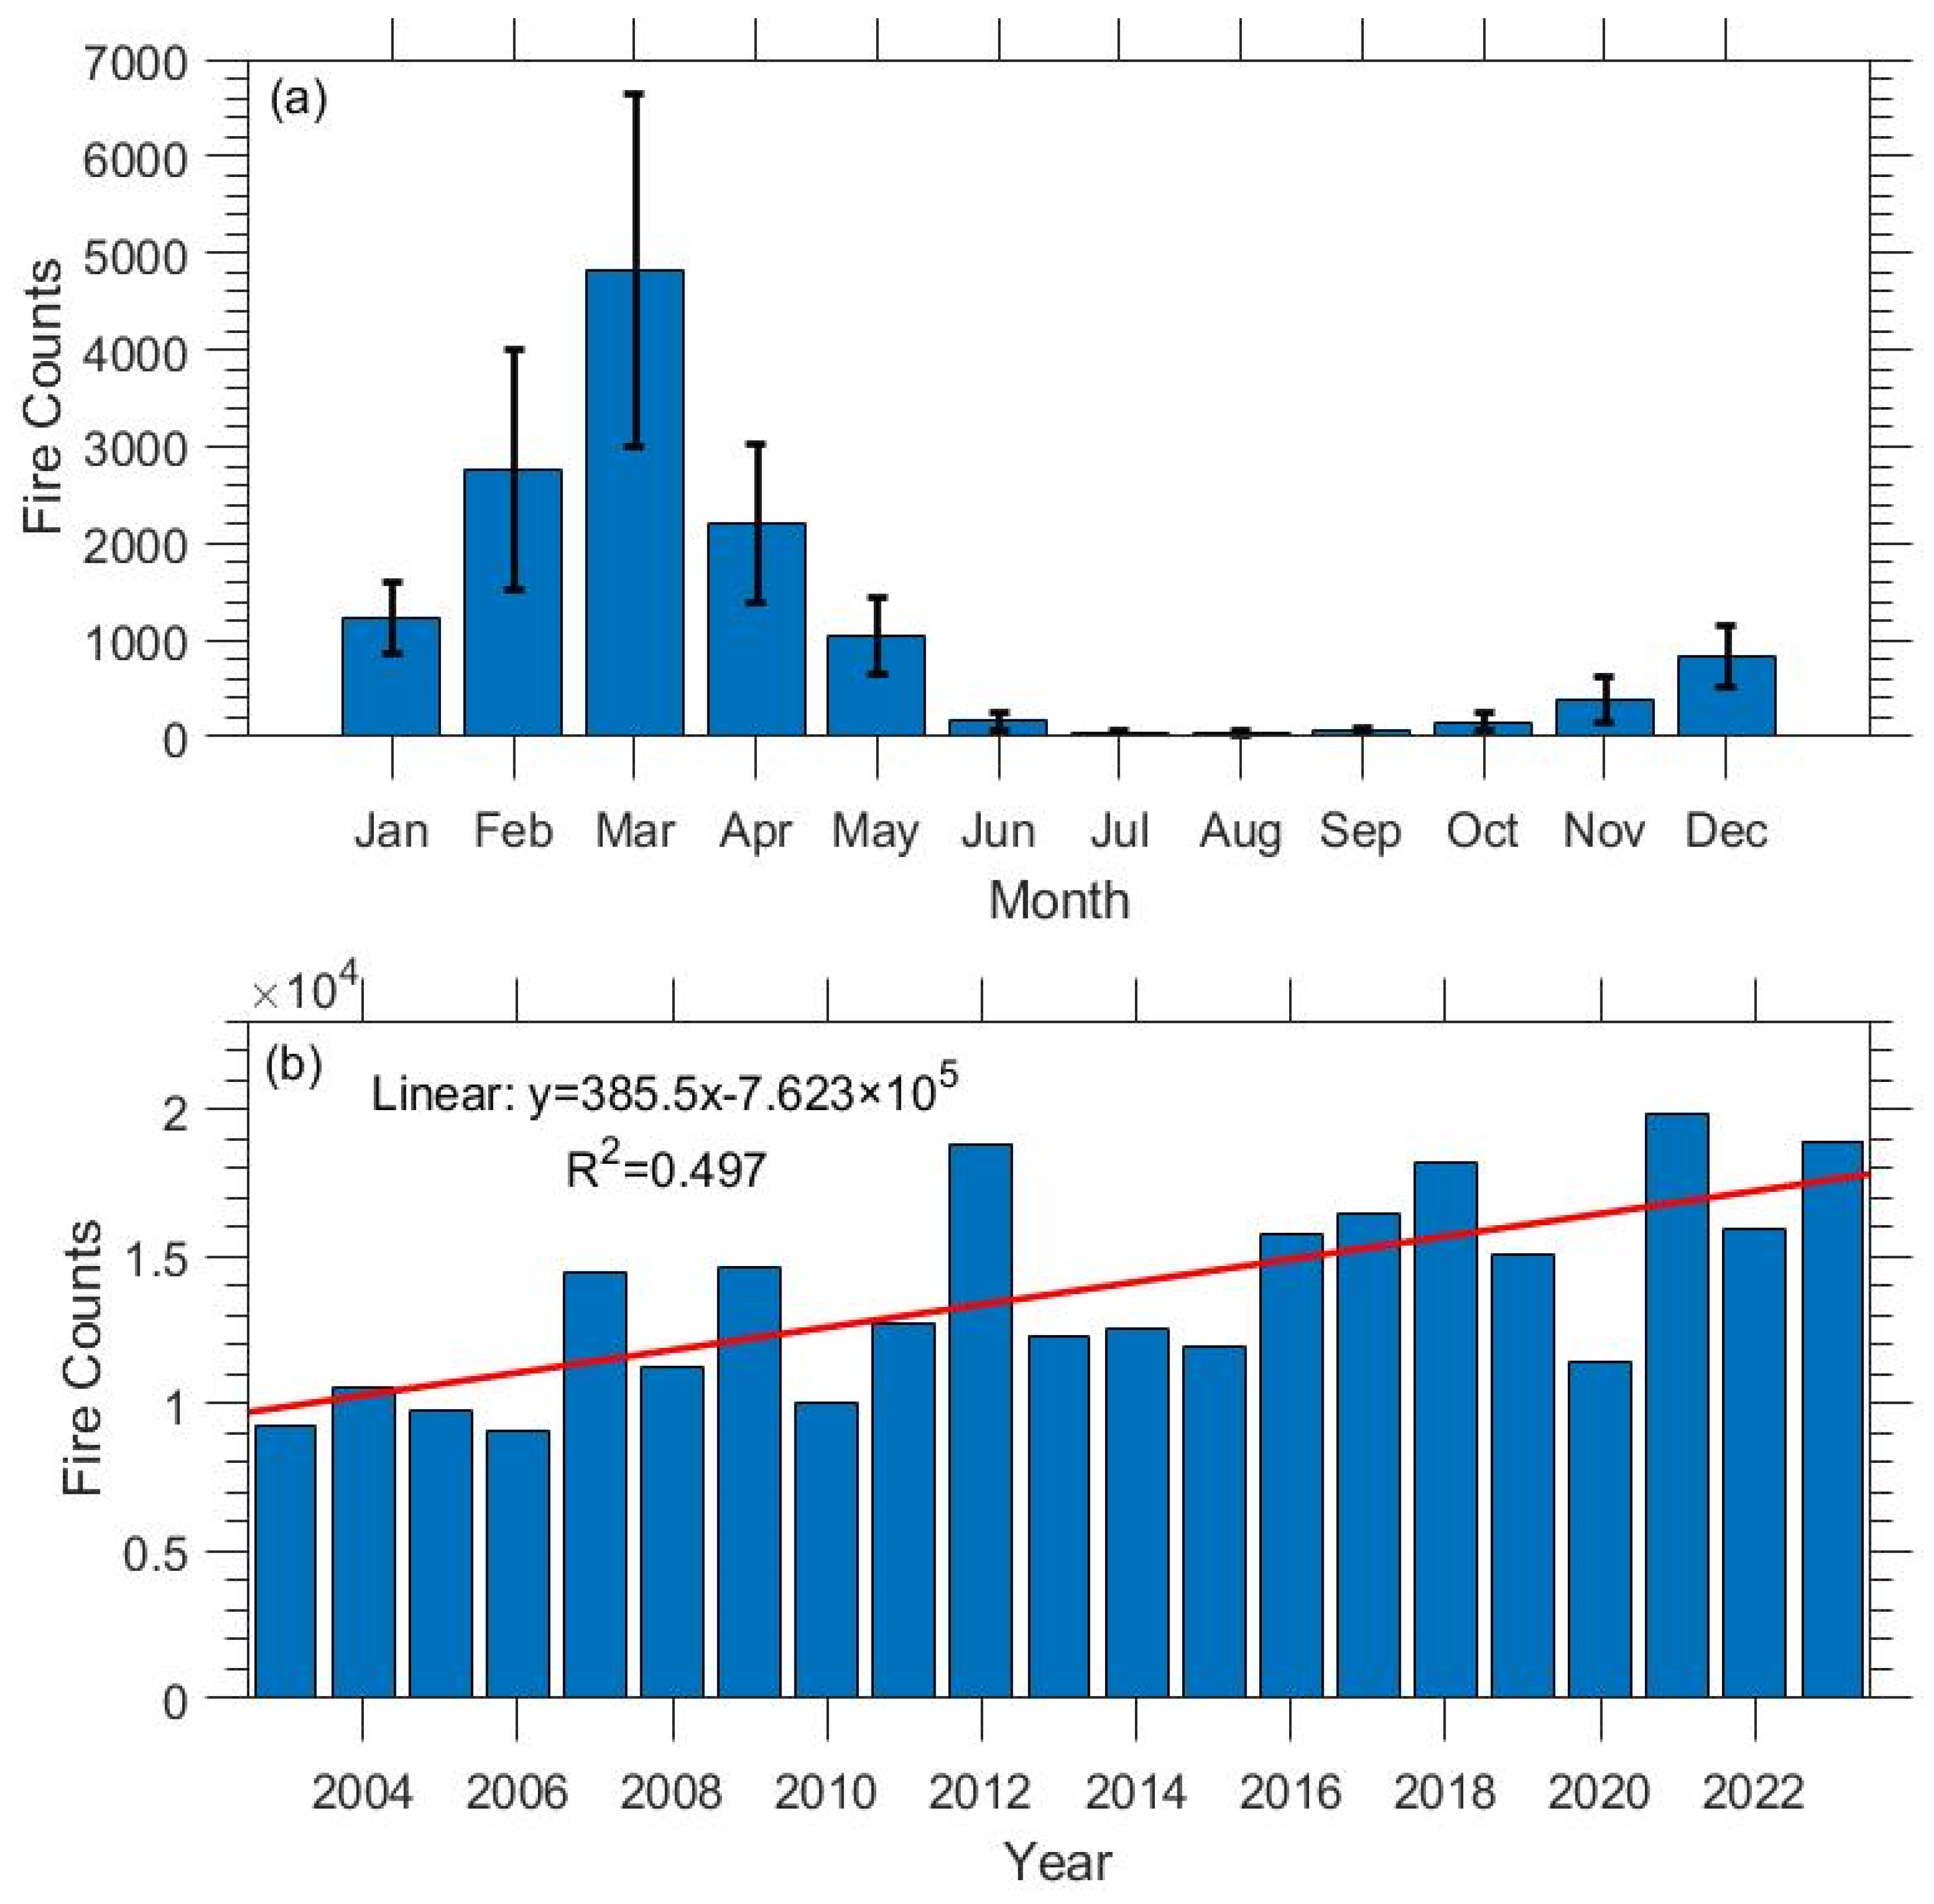
3.2. Fire Activity over Southern India

The long-term monthly mean fire activity over SI obtained from MODIS fire counts during January 2003 to December 2023 is illustrated in Figure 2a. Significant fire activity was evident between December and May, with a maximum in March over SI. As expected, the fire activity was very low or negligible from June to September due to the Indian summer monsoon (ISM). In general, fire activity in ISM months is less due to the widespread rain across India, causing high fuel moisture. The results are consistent with the entire India averaged seasonality reported by previous studies [8,9], carried over India, where more than 70% of total fires occurred during March–April from 2002 to 2011. In addition to seasonal patterns, fire activity in India exhibits significant inter-annual variability, with certain years experiencing unusually high or low fire occurrences. To see the year-to-year changes in the fire activity, we calculated the total fires for each year from 2003 to 2023 and show them in Figure 2b. Annual changes in fire incidents show that the most fires were reported in 2021. Notable incidents closely followed this peak in 2023, 2012, and 2018. The highest fire activity in 2021 over SI observed in the present study is consistent with the report of [31,32]. A closer look at Figure 2b reveals a significant rise in fire-related events, indicating a concerning upward trend in fire activity over the past decade. According to India Meteorological Department (IMD) reports [33], 11 out of the 15 warmest years have occurred in the recent fifteen-year period (2007–2021). In addition, the past decade (2011–2020) was the warmest on record, with a decadal averaged annual mean temperature anomaly of 0.34 °C [33]. This trend raises concerns about the frequency and severity of incidents, reinforcing the conclusions from the detailed yearly trend analysis that indicate a growing number of fire events in recent years. These findings warrant further investigation, particularly to comprehend the factors contributing to this increase and its implications for future safety and prevention efforts. Additional analysis was conducted to evaluate how various meteorological factors may influence fire activity across SI by examining the relationship between fire anomalies and weather conditions. The details are discussed in the next section.
Figure 3a presents the time series of monthly total fires over SI, while the corresponding standardized anomalies are illustrated in Figure 3b. The highest number of monthly fires occurred in March 2021 (9126), followed by March 2012 (8116) during the entire MODIS data record in the study period. The fire anomalies reveal several interesting findings throughout the study. Notably, the anomalies were mostly negative between 2003 and 2014, with the exceptions of 2008 and 2012. From 2014 onwards, the anomalies primarily remained positive, except during the winter of 2019–2020. This indicates a continuous increase in fires over SI during the study period, with a prominent upward trend observed in the recent decade. The linear trend line in Figure 3b further illustrates the significant increase in fire activity over SI from 2003 to 2023.
We also estimated the standardized anomalies of precipitation, surface air temperature, and soil moisture (SM) averaged over SI during the study period, which is shown in Figure 4. Additionally, we overlaid the smoothed fire anomalies in Figure 4c along with the SM anomalies. It is notable that SM gradually increased from 2003 to 2010 and then significantly decreased until 2019. The increasing pattern of SM from 2003 to 2010 aligns well with the negative fire anomalies. Similarly, the decrease in SM corresponds to the rise in fire activity over SI. However, the relationship between fire and SM anomalies in 2021 and 2022 deviates from this earlier pattern, as both fire and SM anomalies exhibit positive anomalies in those years. Moreover, temperature and precipitation anomalies display opposite trends throughout the study period. Positive temperature anomalies were recorded in 2009–2010, 2014, 2015–2016, 2018–2019, and in the recent year 2023, all coinciding with the positive phase of ENSO (El Niño). Most negative temperature anomalies occurred during the negative phase of ENSO (La Niña) [14]. Conversely, an opposite pattern was noted in precipitation anomalies. To establish a more apparent connection between these anomalies and fire activity, we conducted a correlation analysis, with the observed correlation displayed in Figure 5. It appears that SM and precipitation are negatively correlated with fires, while temperature positively correlates with fires. This suggests higher temperatures, lower precipitation, and low SM may elevate fire activity. Among these variables, SM exhibits the highest correlation with fires at −0.45. We also performed a month-wise correlation analysis during the study period, presenting the correlation values in Table 1.
This analysis indicated that SM has the highest correlation in April (−0.72) and the lowest in December (−0.07). Notably, every month, there is a negative correlation with fire anomalies. Regarding temperature, the maximum positive correlation is noted in June (0.63) and the minimum in March (0.12). Interestingly, January and February temperatures correlate negatively with fires, while other months display positive correlations. Similarly, precipitation shows the maximum negative correlation in April (−0.65) and the minimum in January (−0.09). Except for December, every month precipitation demonstrates a negative correlation with fires over SI. The correlation results regarding precipitation (temperature) and fires in this study align with those observed by [4], who identified a negative (positive) correlation across India from 2003 to 2016. Further, ref. [14] reported a significant negative correlation between fires and precipitation (r = −0.364, p ≤ 0.01) over the central India domain. They also reported a significant negative correlation between soil moisture and fires over CI (r = −0.521, p ≤ 0.01). Our results strongly align with the reports of [14]. However, they used MODIS data between 2001 and 2020, whereas our data period is between 2003 and 2023. Figure 6 presents the monthly mean fire standardized anomalies for each year from 2003 to 2023. In the last decade, most months show positive anomalies, with particularly notable increases in October, November, December, and January. The anomaly patterns during these months are distinctly different between the first half of the data (2003–2012) and the latter half (2013–2023). Importantly, there has been a significant rise in fire activity over the past decade compared to the previous one.

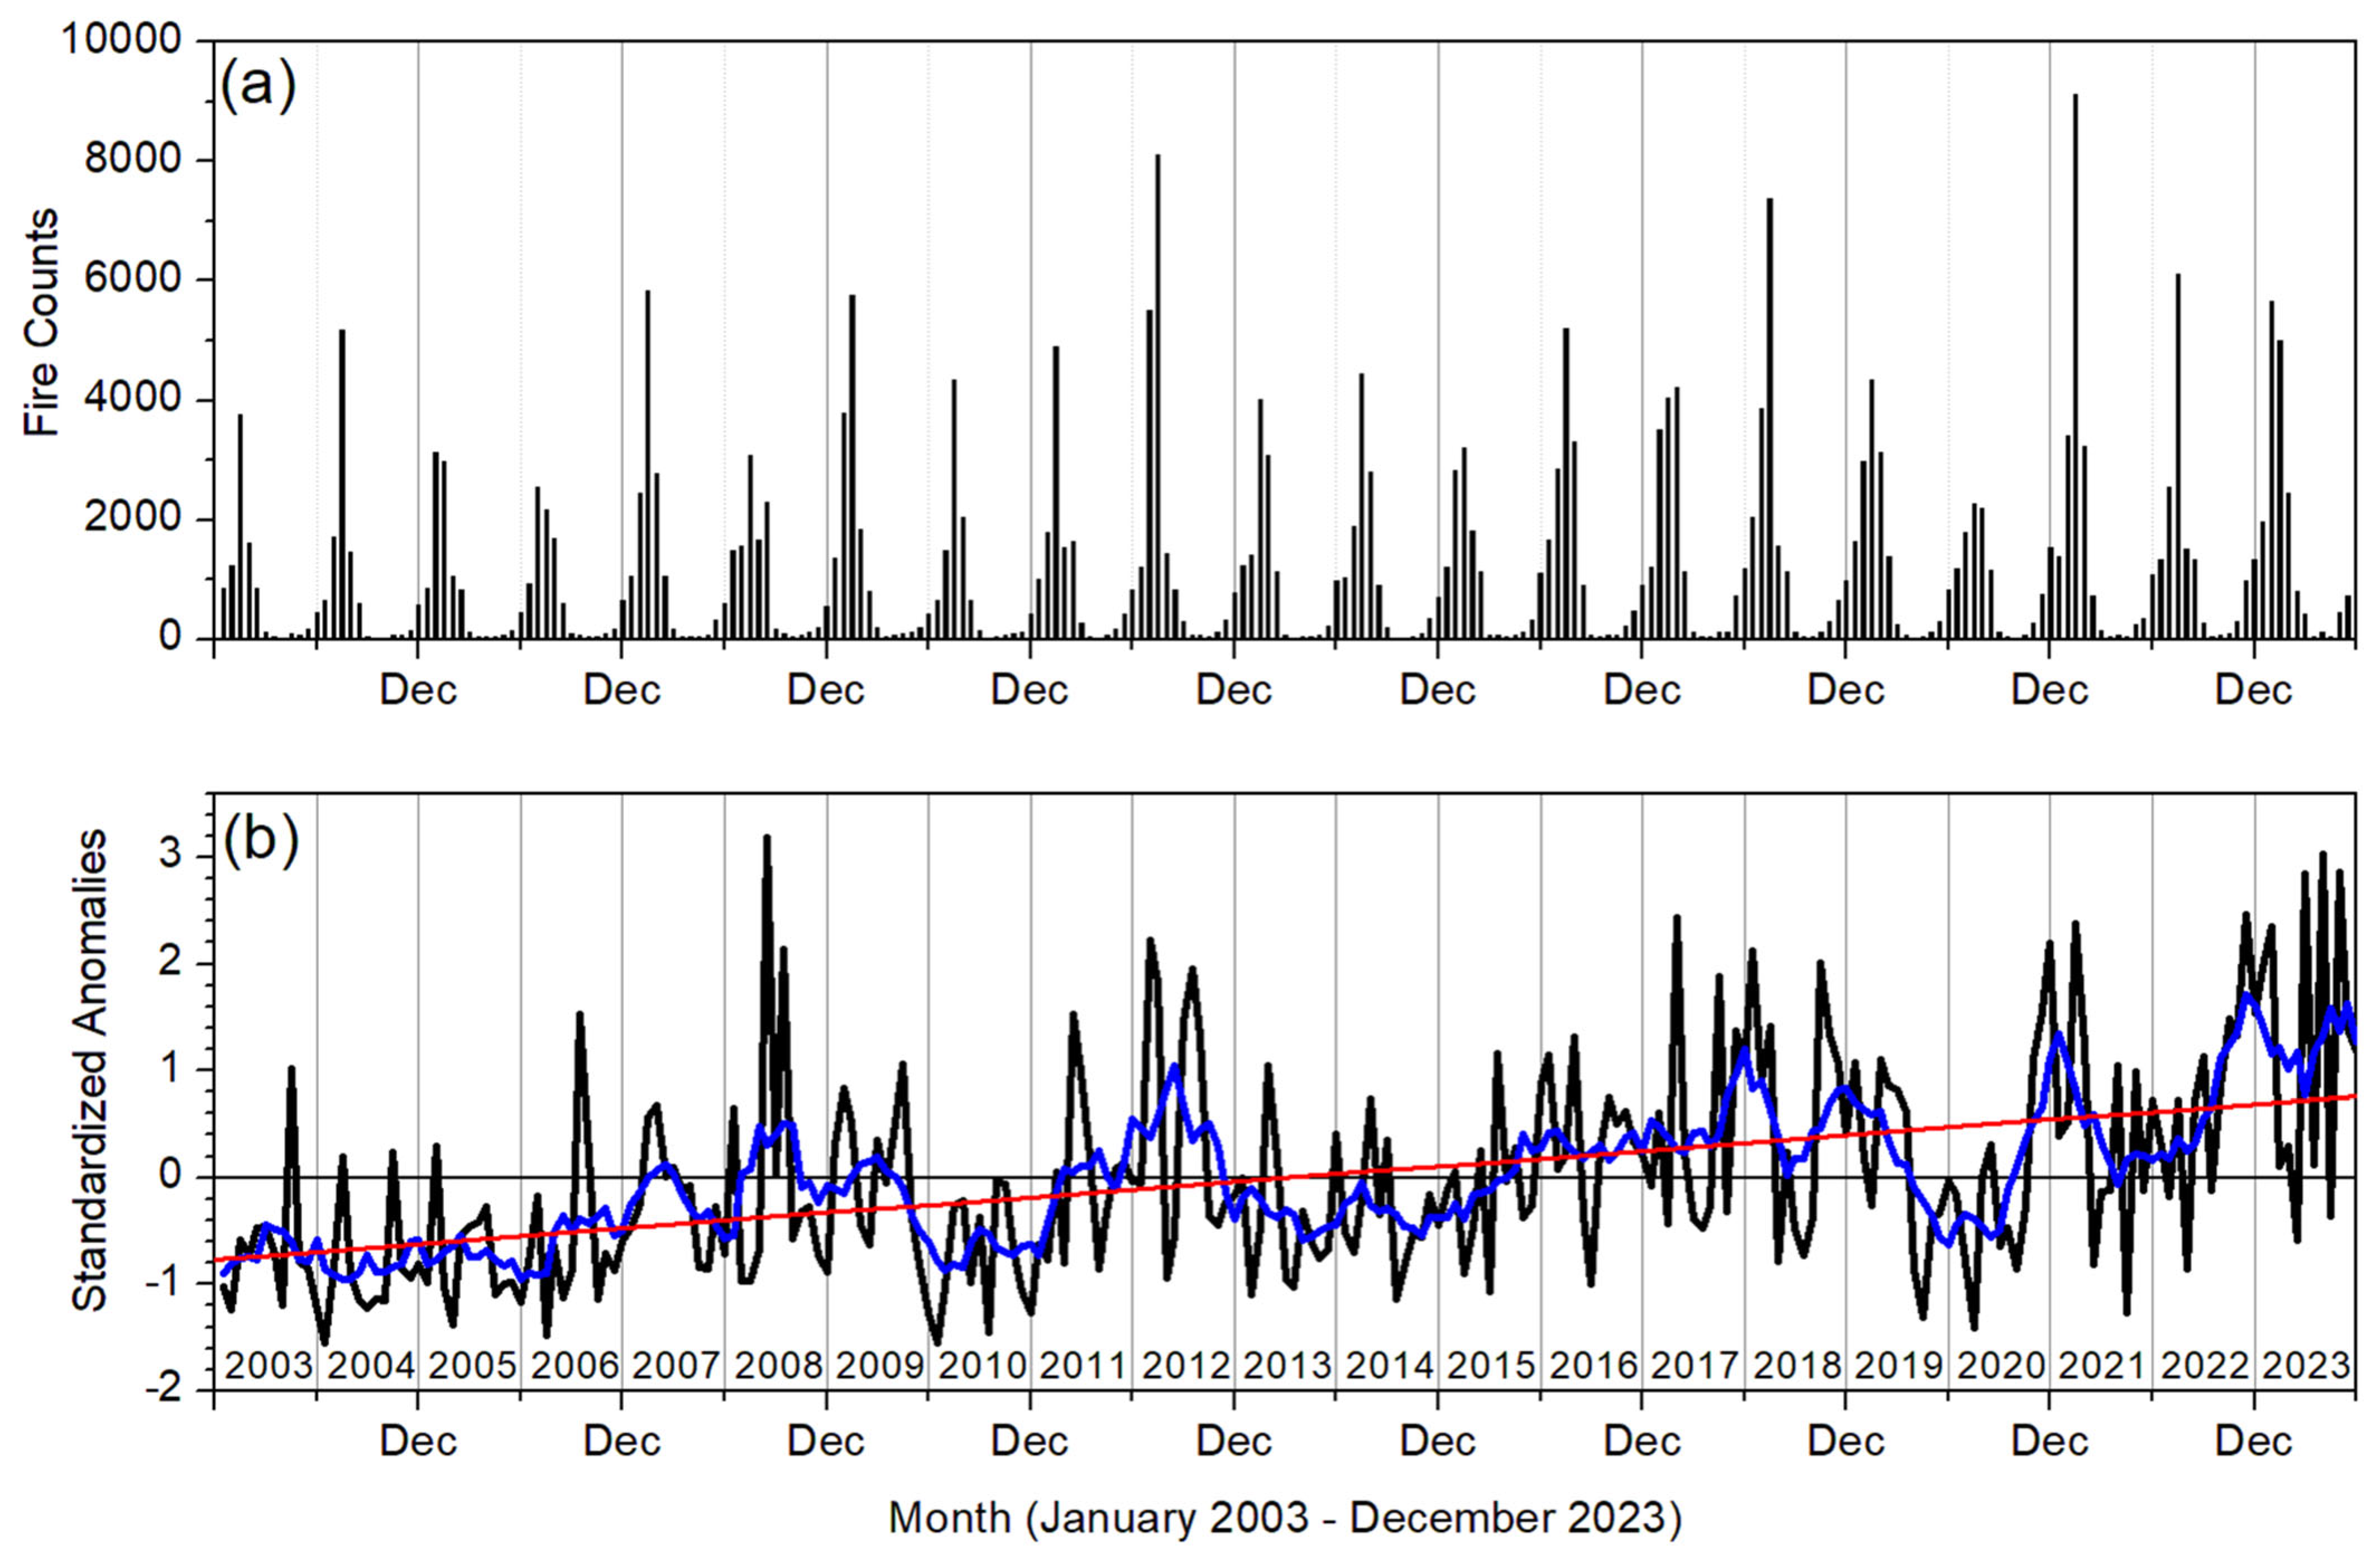
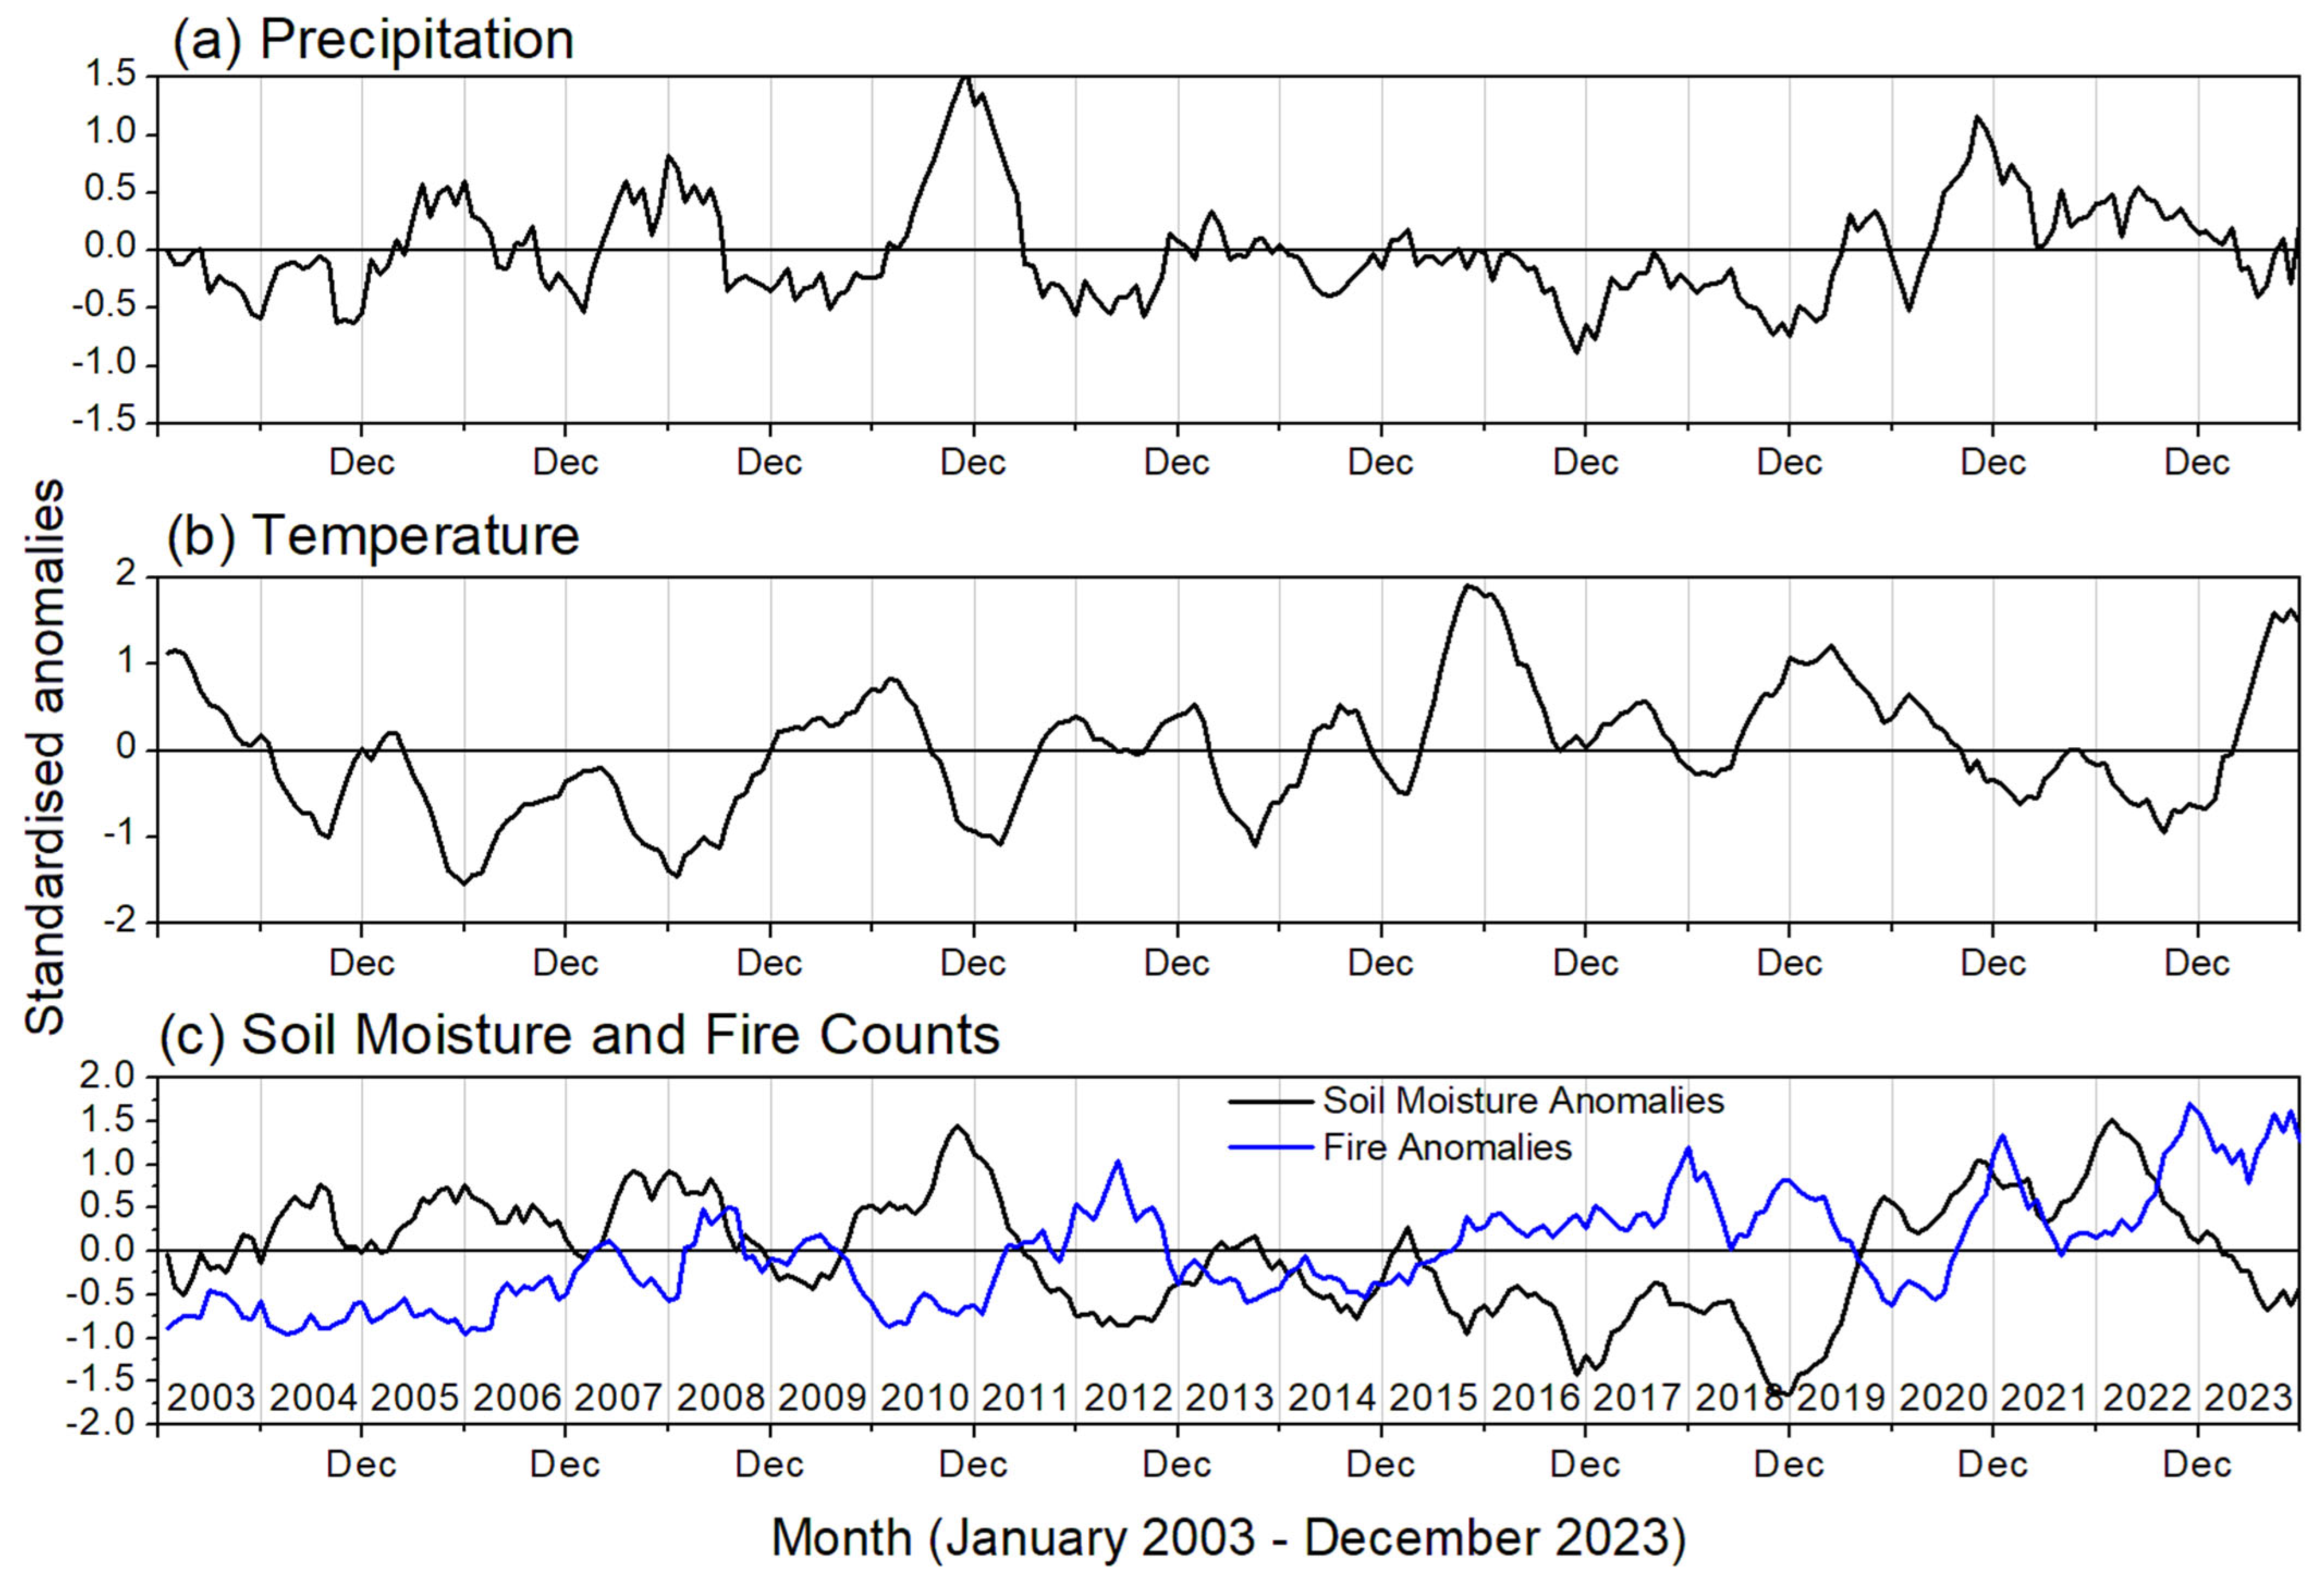
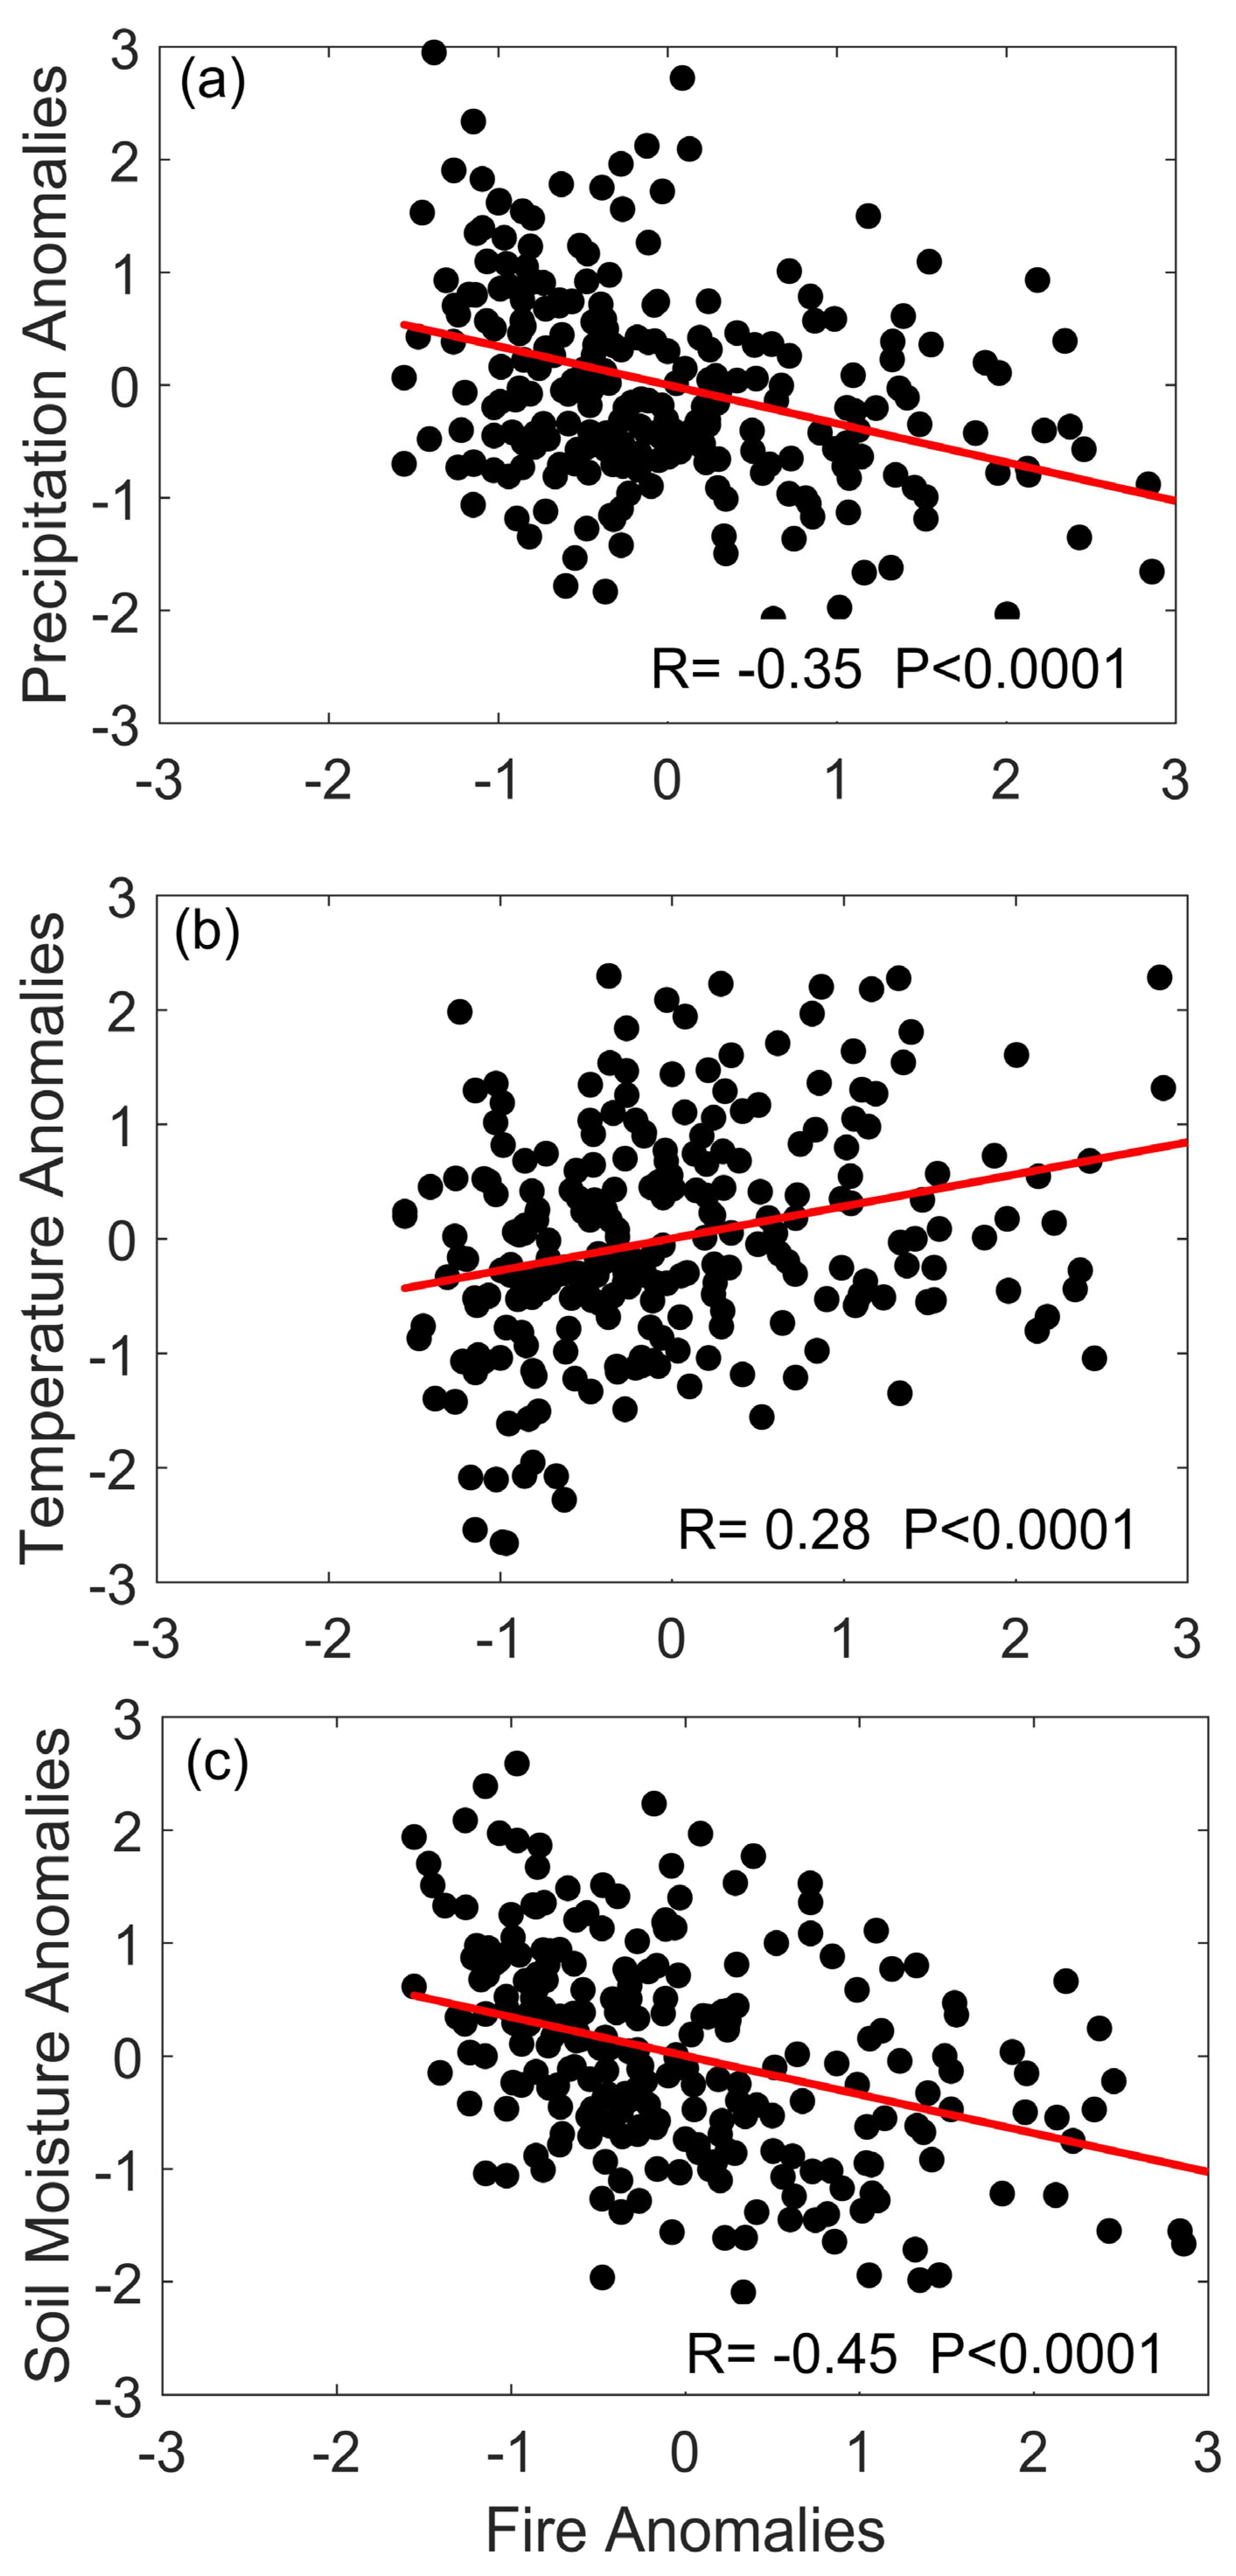
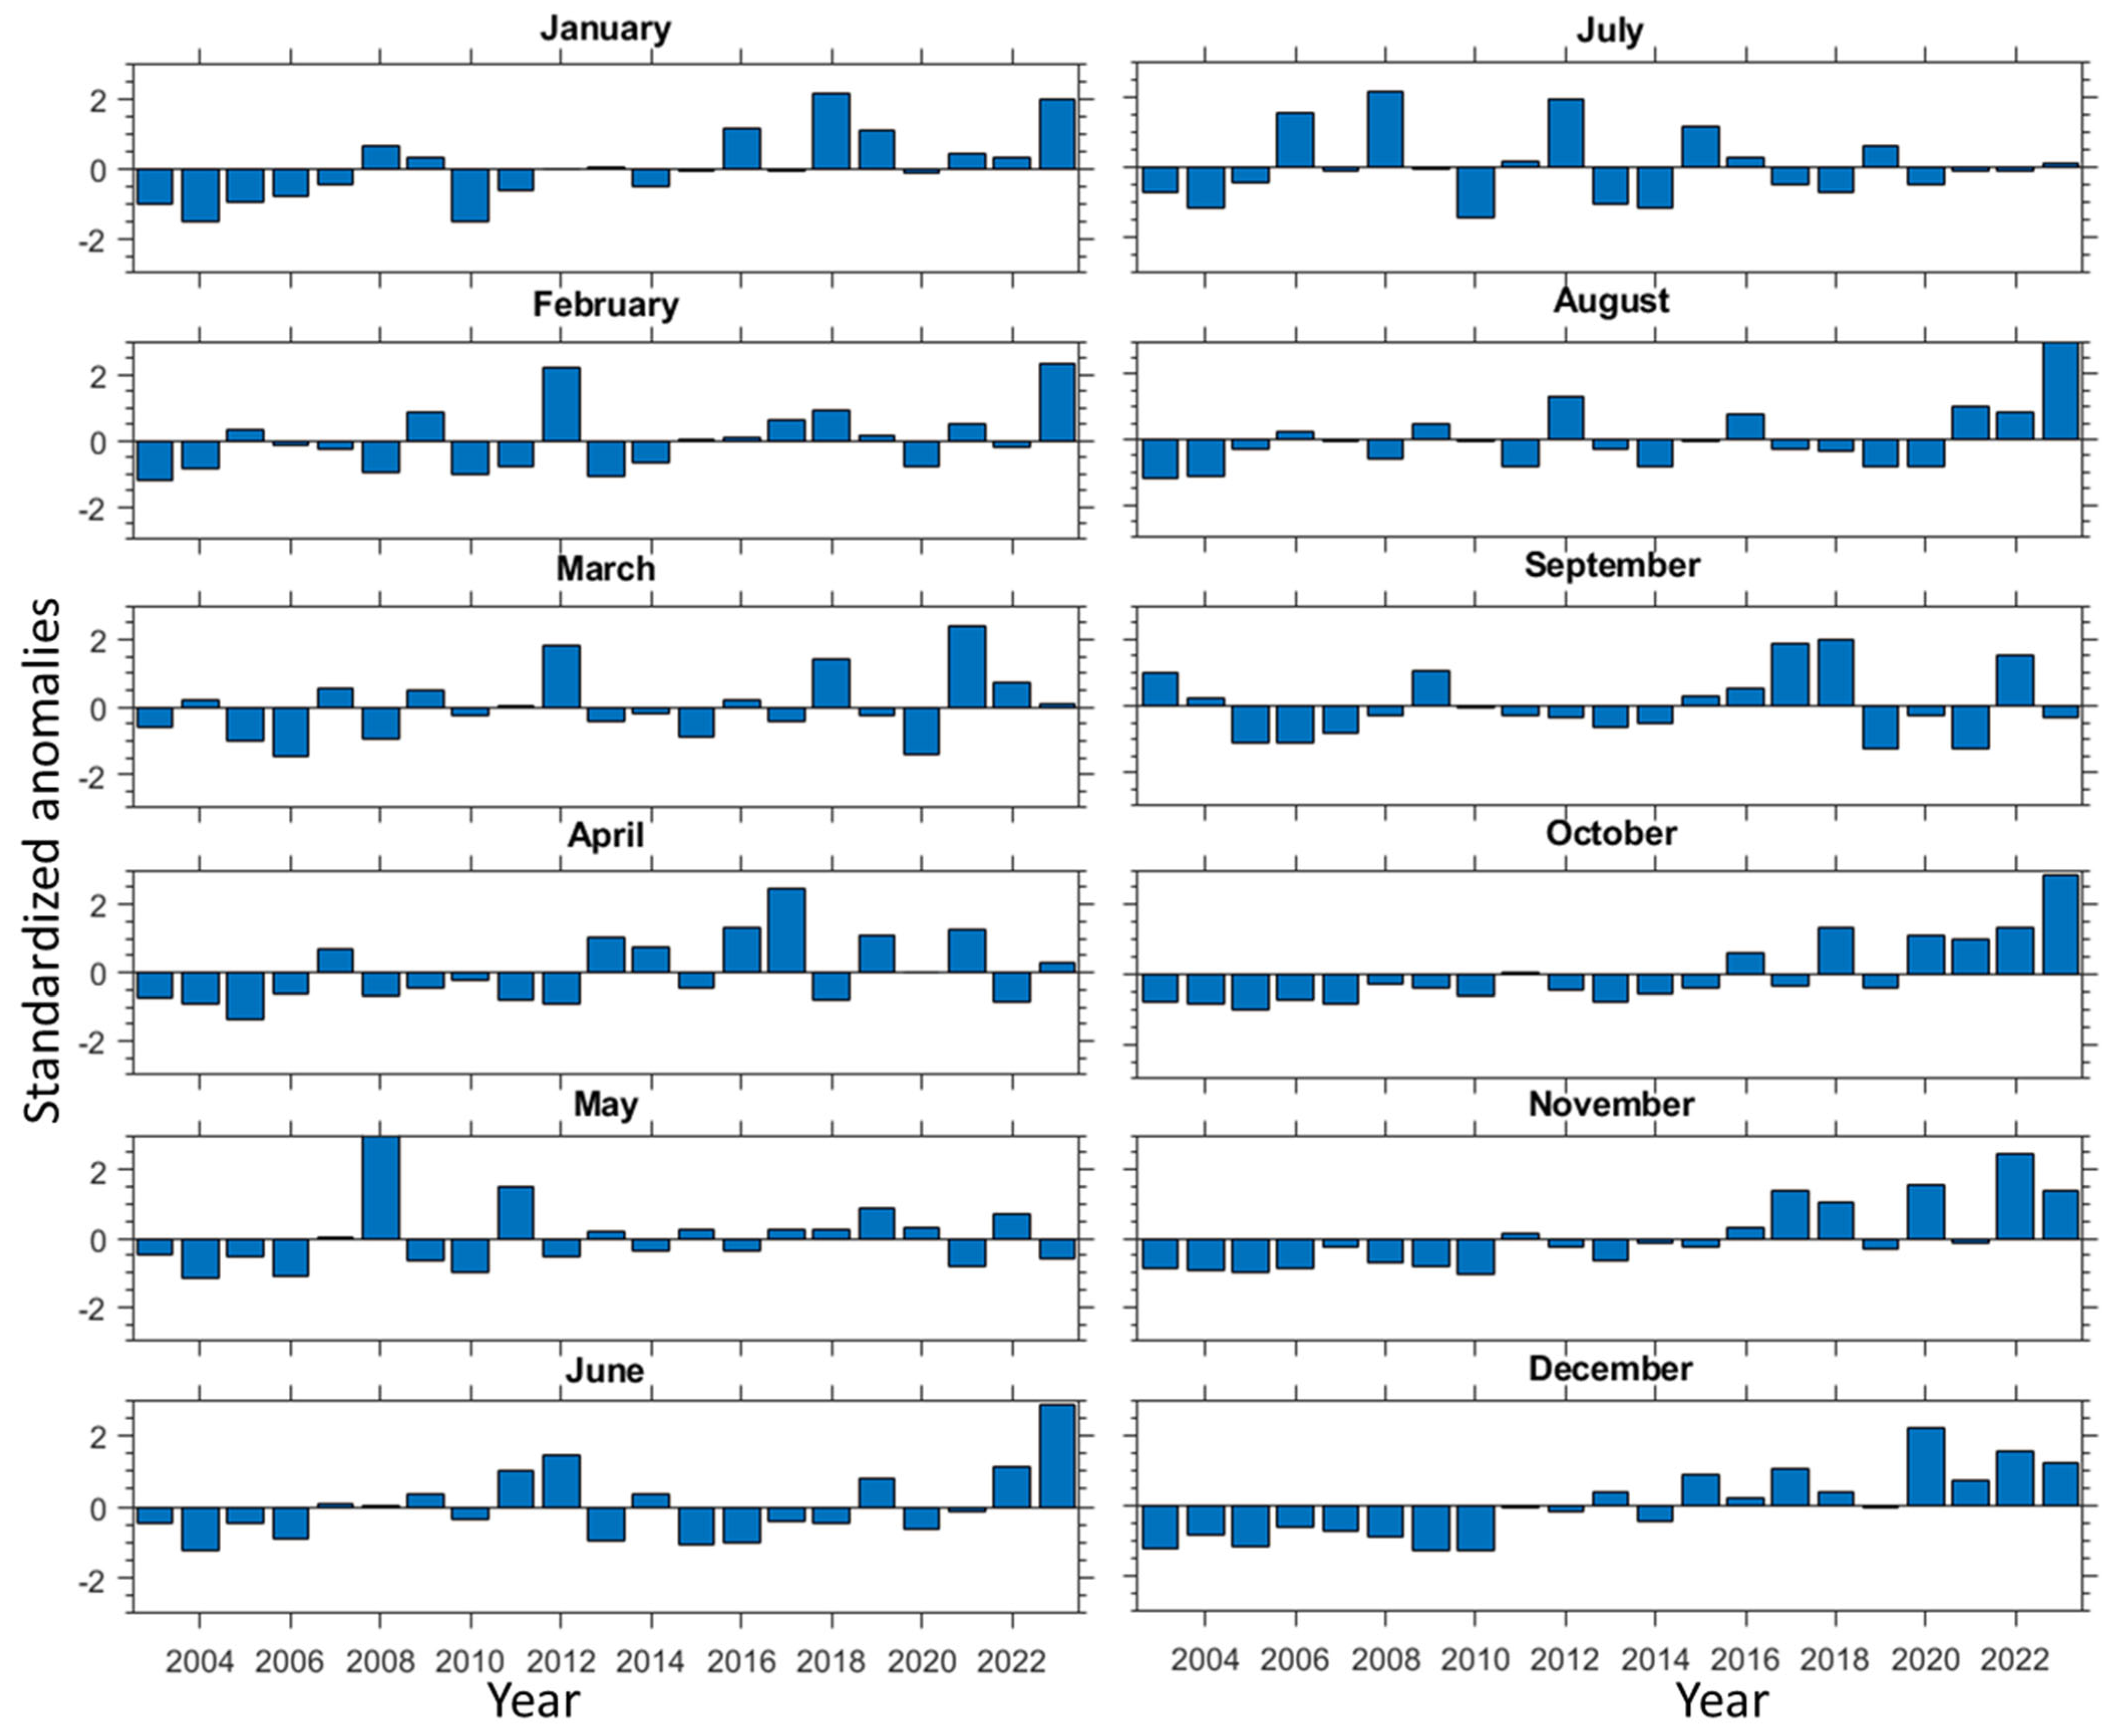
3.3. Long-Term Trends in Fire Activity over Southern India

Several recent studies have highlighted trends in fire activity across India. For instance, ref. [4] observed a notable rise in wildfire incidents in India from 2003 to 2016. Similarly, ref. [33] documented a statistically significant increase in fire occurrences in India by analyzing MODIS fire counts between 2001 and 2016. However, their research did not address regional and spatial variations. In this context, we further explored the long-term fire activity trends across SI by calculating the relative percentage change in fire incidence. We observed an overall increasing trend in fire activity, with 3.4% yearly increase from January 2003 to December 2023. Furthermore, the monthly trend analysis was conducted for all the data and the observed trend values and their p-values are presented in Table 2. Monthly trends exhibit distinct patterns during the study period. Except for July, every month shows an increasing trend, with the maximum increase observed in October (8.25%), followed by November (8.08%) and December (5.3%). A minimal increase was recorded in May and September. January, June, and August also recorded a significant increasing trend, aligning with the long-term trend. March, May, and September show insignificant trends. These results indicate that fire activity significantly increases in the winter months compared to the pre-monsoon months over SI. In conclusion, our research reveals a significant increase in fire activity over SI, consistent with previous studies.

4. Summary and Conclusions

This study carefully investigates the long-term pattern and trends in fire activity, focusing on Southern India, using MODIS satellite-derived active fire count data spanning from January 2003 to December 2023. Significant fire activity was observed over SI during December to May, with a peak in March. Reduced fire activity during June to September is attributed to the occurrence of Indian summer monsoon (ISM) precipitation. Inter-annual variation in fire activity shows the highest fire counts occurred in 2021, followed by 2023, 2012, and 2018, highlighting a trend of rising incidents in recent years. Analysis of fire incidents reveals that, within the past decade, a higher number of fires predominantly occurred in each month; however, exceptions were noted in May and July. Our analysis further reveals that the highest number of monthly fires occurring over SI in the entire MODIS data was in March 2021, with 9126 fires, followed by March 2012 at 8116. The standardized fire anomalies during the study period revealed that from 2003 to 2014, mostly negative fire anomalies were observed, except in 2008 and 2012. After 2014 and until 2023, anomalies became predominantly positive, except the winter of 2019–2020. This indicates a steady increase in SI fires, which is particularly evident in a significant upward trend over the last decade.
This study also investigated the relationship between fire anomalies and several meteorological factors such as precipitation, surface air temperature, and soil moisture. We find a significant negative correlation with precipitation and soil moisture while a positive correlation is noted with surface air temperature. Notably, soil moisture shows a stronger correlation (−0.45) than precipitation and temperature, indicating that reductions in soil moisture may be crucial in influencing fire activity over SI. Monthly correlation analysis revealed that SM has a negative correlation in all months, with the highest correlation in April (−0.72) and the lowest in December (−0.07). The temperature correlated positively in all months except January and February, with a maximum in June (0.63) and a minimum in March (0.12). Similarly, precipitation has a negative correlation in all months except December, with the maximum negative correlation in April (−0.65) and the minimum in January (−0.09).
Finally, we examined long-term trends in fire activity over the region of SI. Our findings revealed a noteworthy and consistent upward trend in fire activity, characterized by an annual growth rate of 3.4% from January 2003 to December 2023. Monthly trend analysis revealed that all months exhibited an increasing trend, except July. Among the months analyzed, October demonstrated the most pronounced rise in fire activity. Following October, November also showed significant increases in fire activity, while May and September experienced only minor growth. Specifically, the increases for October, November, and December were substantial, recorded at 8.25%, 8.08%, and 5.3%, respectively. These values underline the escalation of fire incidents during the latter part of the year and suggest a need for heightened awareness and preparedness during these months. Overall, our findings highlight essential trends in fire activity that could impact future fire management strategies and policy decisions. The present analysis can be effectively used for formulating region-specific strategy and climate action plans to improve the preparedness of forests and the environment.

Author Contributions

S.V.K.: Conceptualization, Methodology, Writing—Original Draft, Writing—Review & Editing. S.R.B.: Data Curation, Software, Formal Analysis, Writing—Original Draft, Writing—Review & Editing, Funding Acquisition. M.R.R.: Conceptualization, Resources, Writing—Review & Editing, Funding Acquisition. K.S.: Data Curation, Software. N.N.R.: Data Curation, Software. M.R.: Formal Analysis. All authors have read and agreed to the published version of the manuscript.

Funding

This research received no external funding.

Data Availability Statement

The original data used in this study can be acquired from the corresponding websites mentioned in the manuscript. The analyzed data and the programs used to analyze can be made available upon individual request to the corresponding author.

Acknowledgments

The MODIS active fire counts data used in this study were acquired from the following website: https://firms.modaps.eosdis.nasa.gov/download/ (accessed on 8 May 2025). The authors thank NASA for providing MODIS data. Authors also thank NASA GIOVANNI team for providing the web-based data visualization and subset tool to download meteorological datasets used in this study.

Conflicts of Interest

The authors declare that they have no conflicts of interest.

References

  1. Bowman, D.M.J.S.; Balch, J.K.; Artaxo, P.; Bond, W.J.; Carlson, J.M.; Cochrane, M.A.; D’Antonio, C.M.; DeFries, R.S.; Doyle, J.C.; Harrison, S.P.; et al. Fire in the Earth System. Science 2009, 324, 481–484. [Google Scholar] [CrossRef] [PubMed]
  2. Bowman, D.M.J.S.; Kolden, C.A.; Abatzoglou, J.T.; Johnston, F.H.; van der Werf, G.R.; Flannigan, M. Vegetation fires in the Anthropocene. Nat. Rev. Earth Environ. 2020, 1, 500–515. [Google Scholar] [CrossRef]
  3. Intergovernmental Panel on Climate Change. Summary for Policy makers. In Climate Change 2021: The Physical Science Basis; Contribution of Working Group I to the Sixth Assessment Report of the Intergovernmental Panel on Climate Change; IPCC, Cambridge University Press: Cambridge, UK, 2021. [Google Scholar]
  4. Vadrevu, K.P.; Lasko, K.; Giglio, L.; Schroeder, W.; Biswas, S.; Justice, C. Trends in Vegetation fires in South and Southeast Asian Countries. Sci. Rep. 2019, 9, 7422. [Google Scholar] [CrossRef] [PubMed]
  5. Forest Survey of India (FSI). Rapid Assessment of Fire Affected Forest Areas in the Country Based on MODIS-Detections Following a Sampling Approach; FSI Technical Information Series; Ministry of Environment, Forest and Climate Change; Govt. of India: New Delhi, India, 2020; Volume 2, pp. 1–20. Available online: http://webline.co.in/fsi-result/technical-information-series-vol2-no2-2020.pdf (accessed on 8 May 2025).
  6. Reddy, C.S.; Jha, C.S.; Diwakar, P.G.; Dadhwal, V.K. Nationwide classification of forest types of India using remote sensing and GIS. Environ. Monit. Assess. 2015, 187, 777. [Google Scholar] [CrossRef]
  7. Babu, S.; Roy, A.; Prasad, P.R. Forest Fire Risk Modeling in Uttarakhand Himalaya Using TERRA Satellite Datasets. Eur. J. Remote Sens. 2016, 49, 381–395. [Google Scholar] [CrossRef]
  8. Vadrevu, K.P.; Eaturu, A.; Badarinath, K.V.S. Spatial Distribution of Forest Fires and Controlling Factors in Andhra Pradesh, India Using Spot Satellite Datasets. Envrion. Monit Assess. 2006, 123, 75–96. [Google Scholar] [CrossRef]
  9. Vadrevu, K.P.; Csiszar, I.; Ellicott, E.; Giglio, L.; Badarinath, K.V.S.; Vermote, E.; Justice, C. Hotspot analysis of vegetation fires and intensity in the Indian region. IEEE J. Sel. Top. Appl. Earth Obs. Remote Sens. 2013, 6, 224–238. [Google Scholar] [CrossRef]
  10. Sahu, L.K.; Sheel, V.; Pandey, K.; Yadav, R.; Saxena, P.; Gunthe, S. Regional biomass burning trends in India: Analysis of satellite fire data. J. Earth Syst. Sci. 2015, 124, 1377–1387. [Google Scholar] [CrossRef]
  11. Bhardwaj, P.; Naja, M.; Kumar, R.; Chandola, H.C. Seasonal, Interannual, and Long-Term Variabilities in Biomass Burning Activity over South Asia. Environ. Sci. Pollut. Res. 2016, 23, 4397–4410. [Google Scholar] [CrossRef]
  12. Kumari, B.; Pandey, A.C. MODIS based forest fire hotspot analysis and its relationship with climatic variables. Spat. Inf. Res. 2020, 28, 87–99. [Google Scholar] [CrossRef]
  13. Verma, S.; Dar, J.A.; Malasiya, D.; Khare, P.K.; Dayanandan, S.; Khan, M.L. A MODIS-based spatiotemporal assessment of agricultural residue burning in Madhya Pradesh, India. Ecol. Indic. 2019, 105, 496–504. [Google Scholar] [CrossRef]
  14. Jain, M.; Saxena, P.; Sharma, S.; Sonwani, S. Investigation of forest fire activity changes over the Central India domain using satellite observations During 2001–2020. Geohealth 2021, 5, e2021GH000528. [Google Scholar] [CrossRef] [PubMed]
  15. Kuttippurath, J.; Singh, A.; Dash, S.; Mallick, N.; Clerbaux, C.; VanDamme, M.; Clarisse, L.; Coheur, P.-F.; Raj, S.; Abbhishek, K. Record high levels of atmospheric ammonia over India: Spatial and temporal analyses. Sci. Total Environ. 2020, 740, 139986. [Google Scholar] [CrossRef] [PubMed]
  16. Ojha, N.; Sharma, A.; Kumar, M.; Girach, I.; Ansari, T.U.; Sharma, S.K.; Singh, N.; Pozzer, A.; Gunthe, S.S. On the wide spread enhancement in fine particulate matter across the Indo-Gangetic Plain towards winter. Sci. Rep. 2020, 10, 5862. [Google Scholar] [CrossRef]
  17. Saxena, P.; Sonwani, S.; Srivastava, A.; Jain, M.; Srivastava, A.; Bharti, A.; Rangra, D.; Mongia, N.; Tejan, S.; Bhardwaj, S. Impact of Crop Residue Burning in Haryana on the Air Quality of Delhi, India. Heliyon 2021, 7, e06973. [Google Scholar] [CrossRef]
  18. Shaik, D.S.; Kant, Y.; Mitra, D.; Singh, A.; Chandola, H.C.; Sateesh, M.; Babu, S.S.; Chauhan, P. Impact of biomass burning on regional aerosol optical properties: A case study over northern India. J. Environ. Manag. 2019, 244, 328–343. [Google Scholar] [CrossRef]
  19. RavindraBabu, S.; Ou-Yang, C.-F.; Griffith, S.M.; Pani, S.K.; Kong, S.S.-K.; Lin, N.-H. Transport pathways of carbon monoxide from Indonesian fire pollution to a sub tropical high-altitude mountain site in the western North Pacific. Atmos. Chem. Phys. 2023, 23, 4727–4740. [Google Scholar] [CrossRef]
  20. Ravindra, K.; Singh, T.; Mor, S. Emissions of air pollutants from primary crop residue burning in India and the mitigation strategies for cleaner emissions. J. Clean. Prod. 2019, 208, 261–273. [Google Scholar] [CrossRef]
  21. Lan, R.; Eastham, S.D.; Liu, T.; Norford, L.K.; Barrett, S.R.H. Air quality impacts of crop residue burning in India and mitigation alternatives. Nat. Commun. 2022, 13, 6537. [Google Scholar] [CrossRef]
  22. Giglio, L.; Boschetti, L.; Roy, D.P.; Humber, M.L.; Justice, C.O. The Collection 6 MODIS burned area mapping algorithm and product. Remote Sens. Environ. 2018, 217, 72–85. [Google Scholar]
  23. Greene, C.A.; Thirumalai, K.; Kearney, K.A.; Delgado, J.M.; Schwanghart, W.; Wolfenbarger, N.S.; Thyng, K.M.; Gwyther, D.E.; Gardner, A.S.; Blankenship, D.D. The Climate Data Toolbox for MATLAB. Geochem. Geophys. Geosyst. 2019, 20, 3774–3781. [Google Scholar] [CrossRef]
  24. Bhatt, A.; Rana, D.; Khan, M.L. Forest fires in the Western Himalayan region of India: Areview. Int. J. Ecol. Environ. Sci. 2022, 48, 137–142. [Google Scholar] [CrossRef]
  25. Sarkar, S.; Singh, R.P.; Chauhan, A. Crop residue burning in Northern India: Increasing threat to Greater India. J. Geophys. Res. Atmos. 2018, 123, 6920–6934. [Google Scholar] [CrossRef]
  26. Roy, C.; Ayantika, D.C.; Girach, I.; Chakrabarty, C. Intense biomass burning over northern India and its impact on air quality, chemistry and climate. In Extremes in Atmospheric Processes and Phenomenon: Assessment, Impacts and Mitigation; Springer: Singapore, 2022; pp. 169–204. [Google Scholar]
  27. Ray, T.; Malasiya, D.; Rajpoot, R.; Verma, S.; Dar, J.A.; Dayanandan, A.; Raha, D.; Lone, P.; Pandey, P.; Khare, P.K.; et al. Impact of Forest Fire Frequency on Tree Diversity and Species Regeneration in Tropical Dry Deciduous Forest of Panna Tiger Reserve, Madhya Pradesh, India. J. Sustain. For. 2020, 40, 831–845. [Google Scholar] [CrossRef]
  28. Borgohain, A.; Gogoi, M.; Barman, N.; Kundu, A.; Banik, T.; Kundu, S.S.; Aggarwal, S.P. Impact of Biomass Burning on Black Carbon and NO2 over North Eastern Region of India using multi-satellite observations. J. Indian Soc. Remote Sens. 2023, 51, 1605–1617. [Google Scholar] [CrossRef]
  29. Kumar, S.; Kumar, A. Hot spot and Trend Analysis of Forest Fires and its Relation to Climatic in the Western Himalayas. Nat. Hazards 2022, 114, 3529–3544. [Google Scholar] [CrossRef]
  30. Venkataraman, C.; Habib, G.; Kadamba, D.; Shrivastava, M.; Leon, J.F.; Crouzille, B.; Streets, D. Emissions from open biomass burning in India: Integrating the inventory approach with high-resolution Moderate Resolution Imaging Spectro radiometer(MODIS) active-fire and land cover data. Glob. Biogeochem. Cycles 2006, 20, GB2013. [Google Scholar] [CrossRef]
  31. Sagar, N.; Suresh, K.P.; Naveesh, Y.B.; Archana, C.A.; Hemadri, D.; Patil, S.S.; Chethan, A.J. Forest fire dynamics in India (2005–2022):Unveiling climatic Impacts, spatial patterns, and interface with anthrax incidence. Ecol. Indic. 2024, 166, 112454. [Google Scholar] [CrossRef]
  32. India Meteorological Department (IMD). Statement on Climate of India During 2020; Press Release; Government of India, Ministry of Earth Sciences (MoES): New Delhi, India, 2021; pp. 1–5.
  33. Earl, N.; Simmonds, I. Spatial and temporal variability and trends in 2001–2016 global fire activity. J. Geophys. Res. Atmos. 2018, 123, 2524–2536. [Google Scholar] [CrossRef]
Figure 1. (a) Long-term annual mean spatial distribution in fire activity and (b) corresponding standard deviations over India observed from MODIS fire counts from January 2003 to December 2023. The highlighted box shows the area of interest (Southern India; 8–20° N, 73–85° E) for the present study.
Climate 13 00103 g001
Figure 2. Long-term mean annual cycle in fire activity (a) and year-to-year variations of total fire counts over Southern India (averaged over highlighted box in Figure 1) obtained from 2003 to 2023 (b). Linear trend line also over plotted in bottom sub plot.
Climate 13 00103 g002
Figure 3. Temporal variability in (a) monthly fire counts, (b) corresponding standardized fire anomalies (black), and 6-point running mean fire anomalies (blue) observed from January 2003 to December 2023. The linear trend line is shown in red color.
Climate 13 00103 g003
Figure 4. Time series of standardized anomalies observed in (a) precipitation, (b) surface air temperature, and (c) soil moisture over Southern India. The blue line in sub-plot (c) shows the 6-point running meanfor fire anomalies.
Climate 13 00103 g004
Figure 5. Scatter plots showing the correlation between fire anomalies index and different meteorological parameters over Southern India. Their respective correlation coefficients (R) are also shown in the respective plots. The red line shows the best fit.
Climate 13 00103 g005
Figure 6. Monthly mean fire standardized anomalies over Southern India for each year from 2003 to 2023.
Climate 13 00103 g006
Table 1. The observed correlation between fire anomalies and various meteorological anomalies for each month.
MonthSoil MoistureTemperaturePrecipitation
January−0.35−0.13−0.09
February−0.47−0.09−0.31
March−0.370.12−0.25
April−0.720.49−0.65
May−0.420.16−0.53
June−0.670.63−0.48
July−0.440.37−0.36
August−0.460.47−0.49
September−0.560.52−0.57
October−0.430.34−0.49
November−0.460.19−0.13
December−0.070.340.18
Table 2. The observed linear trends (%) in fire activity over Southern India during 2003–2023 for each month and the corresponding p-values.
MonthTrend (%)p Value
January3.41<0.001
February3.040.05
March1.940.15
April2.750.03
May0.830.55
June3.660.06
July−0.070.95
August3.480.03
September0.830.55
October8.25<0.001
November8.08<0.001
December5.3<0.001
Disclaimer/Publisher’s Note: The statements, opinions and data contained in all publications are solely those of the individual author(s) and contributor(s) and not of MDPI and/or the editor(s). MDPI and/or the editor(s) disclaim responsibility for any injury to people or property resulting from any ideas, methods, instructions or products referred to in the content.

