Article

Climate Dynamics in Guinea Under Global Warming: Analysis of Extreme Air Temperatures and Precipitation

by
Elena V. Vyshkvarkova
*,
Polina V. Drygval
and
Roman V. Gorbunov
A.O. Kovalevsky Institute of Biology of the Southern Seas of RAS, Sevastopol 299011, Russia
*
Author to whom correspondence should be addressed.
Climate 2025, 13(12), 239; https://doi.org/10.3390/cli13120239 (registering DOI)
Submission received: 1 September 2025 / Revised: 16 November 2025 / Accepted: 20 November 2025 / Published: 22 November 2025

Abstract

The study investigates observed and projected climate change in Guinea by analyzing air temperature and precipitation trends from 1991 to 2024, along with numerical simulations from global climate models (CMIP6) under the SSP2-4.5 and SSP5-8.5 scenarios up to 2100. Using ERA5 reanalysis and CHIRPS satellite precipitation data, supplemented by CMIP6 ensemble outputs, we identify a consistent warming trend across the country, averaged values of 0.1–0.5 °C per decade, with the most significant increases in the northern and southeastern regions. Extreme temperatures are rising faster than mean temperatures, elevating the risk of heatwaves. Precipitation trends exhibit spatial variability: coastal areas are experiencing increased precipitation intensity (up to 200 mm per decade), while mountainous and northern regions are becoming drier (with declines of up to 250 mm per decade). Projections for the 21st century indicate accelerated warming, with temperature increases of +2–3 °C by 2050 and +3–5.5 °C by 2100, depending on the scenario. While moderate emissions (SSP2-4.5) may lead to a temporary rise in precipitation, the high-emission scenario (SSP5-8.5) predicts a sharp decline in precipitation during the latter half of the century. Utilizing high-resolution data, we identified regional climatic features across Guinea’s diverse topography. By dividing the country into four distinct regions and conducting a detailed analysis of representative points, we assessed their varying vulnerability to climate change.

1. Introduction

The current climate crisis, manifested in global warming and changing precipitation patterns, represents one of the most serious threats to planetary ecosystems and socio-economic systems. The past decades have seen record increases in global temperatures, with recent years consistently becoming the warmest in the history of instrumental observations [1,2,3]. Global warming is intensifying the hydrological cycle, resulting in an increase in the frequency and severity of extreme precipitation events [4]. The African continent is experiencing unambiguous signals of anthropogenic climate change. The warming observed throughout the 20th century provides compelling evidence of continent-wide anthropogenic forcing [5,6,7,8,9,10]. Observed trends in mean annual surface temperature show a rapid increase across Africa from 1961 to 2015, with significant warming of 0.1–0.2 °C per decade or more in all regions [3]. Projections under high-emission scenarios, such as RCP8.5, indicate that warming in Africa may exceed 4 °C by the end of the century, surpassing global average rates [11,12].
Within this continental context, West Africa emerges as a region of particular vulnerability, with warming rates that exceed the African average. The region has already warmed by approximately 0.5 °C in recent decades, with minimum temperatures rising faster than maximums [13,14,15]. The region has also observed a higher frequency of extreme events, including fewer cold nights, more frequent warm days, and intensified heatwaves [16,17,18]. Previously, based on data from 90 meteorological stations, Moron et al. [19] found a positive trend in minimum and maximum air temperatures, frequency of hot days and tropical nights in northern tropical Africa for the period 1961–2014. Precipitation patterns are also undergoing complex shifts. While the 20th century was marked by a general rainfall decline, the last two decades have seen a recovery, characterized by a delayed monsoon retreat, fewer rainy days, and more intense precipitation events [20,21,22,23,24]. The countries of the western African continent have shown a notable increase in annual average precipitation since 2000 [21]. Climate models project that West Africa could reach 2 °C of warming 10–20 years earlier than other regions [5,14,25,26]. Under the RCP8.5 scenario, in West Africa the number of rainy days could decrease the most in the long term, by 30% [27]. Models from the NASANEX-GDDP project predict increases in both temperature and precipitation over West Africa [28], which are particularly pronounced in the SSP5-8.5 scenario compared to SSP2-4.5. Projected changes in the position and strength of the West African Monsoon, African Easterly Jet, and African Easterly Waves are likely to significantly reduce mean seasonal summer precipitation in West Africa by the end of the 21st century, with predominantly negative changes observed in the Savanna-Sahel region [29]. These projections remain uncertain due to conflicting signals across climate models [30].
Located within West Africa, the Republic of Guinea exemplifies these regional challenges while possessing unique geographical and climatic characteristics that shape its specific vulnerabilities. The country features a subequatorial climate with distinct dry and wet seasons, and its diverse topography encompasses coastal lowlands, mountainous plateaus (Fouta Djallon, North Guinean Highlands), and savannahs transitioning into the Sahel. These factors contribute to a complex spatial pattern of climate change, necessitating detailed analysis of both observed trends and future projections. The Republic of Guinea belongs to a tropical humid climate regime, where relatively low natural climate variability creates narrow climatic thresholds that can be easily exceeded by anthropogenic forcing [5]. While Guinea’s coast is projected to become wetter, the western Sahel may face aridification [20].
The Republic of Guinea remains exposed to the broader West African threats: declining annual precipitation totals, shorter rainy seasons, increased droughts during rainy seasons, irregular precipitation patterns, and rising temperatures [31,32]. The observed climatic changes are already significantly affecting Guinea’s key sectors (agriculture, water resources, energy, and public health) necessitating the development of science-based adaptation strategies [33,34,35,36,37,38,39,40]. Shifting rainfall patterns and rising temperatures threaten food security, reducing maize yields and necessitating the selection of climate-resilient crops [34,35,36,37]. Increased frequency of droughts and floods disrupts water supply and limits water availability for agriculture [38]. According to climate model forecasts, Guinea is expected to experience the largest decline in water availability among West African countries by the end of the 21st century [38]. According to estimates, droughts driven by climate change have diminished Africa’s agricultural output by 21%, triggering a 9.7% drop in GDP [41]. Rainfall irregularity diminishes irrigation potential and makes hydropower generation less predictable [33,39]. Intensifying heatwaves adversely affect human health and natural ecosystems [40]. In the spring of 2010, mane Sahelian countries experienced a heat wave of unprecedented magnitude, with temperatures rising above 45 °C [42]. The African continent demonstrates the most pronounced escalation in susceptibility to extreme heat globally (more than 10% since 1990), paralleled by enhanced climatic suitability for infectious disease transmission—particularly evidenced by a 38.7% increase in malaria transmission potential in highland regions since the mid-twentieth century [43].
The study aims to assess current and future climate change patterns in Guinea. The novelty of this research lies in the application of a high-resolution, multi-source data approach (combining CHIRPS satellite data and ERA5 reanalysis) to uncover the microclimatic specifics of Guinea, which cannot be captured by its sparse ground-based station network. This study undertakes a comparative analysis of extreme temperature and precipitation indices (ETCCDI) for the country, conducted not only at the national scale but also with detailed resolution for key physiographic regions. This granular approach is essential for transitioning from broad climate scenarios to a targeted regional vulnerability assessment.

2. Materials and Methods

2.1. Study Region
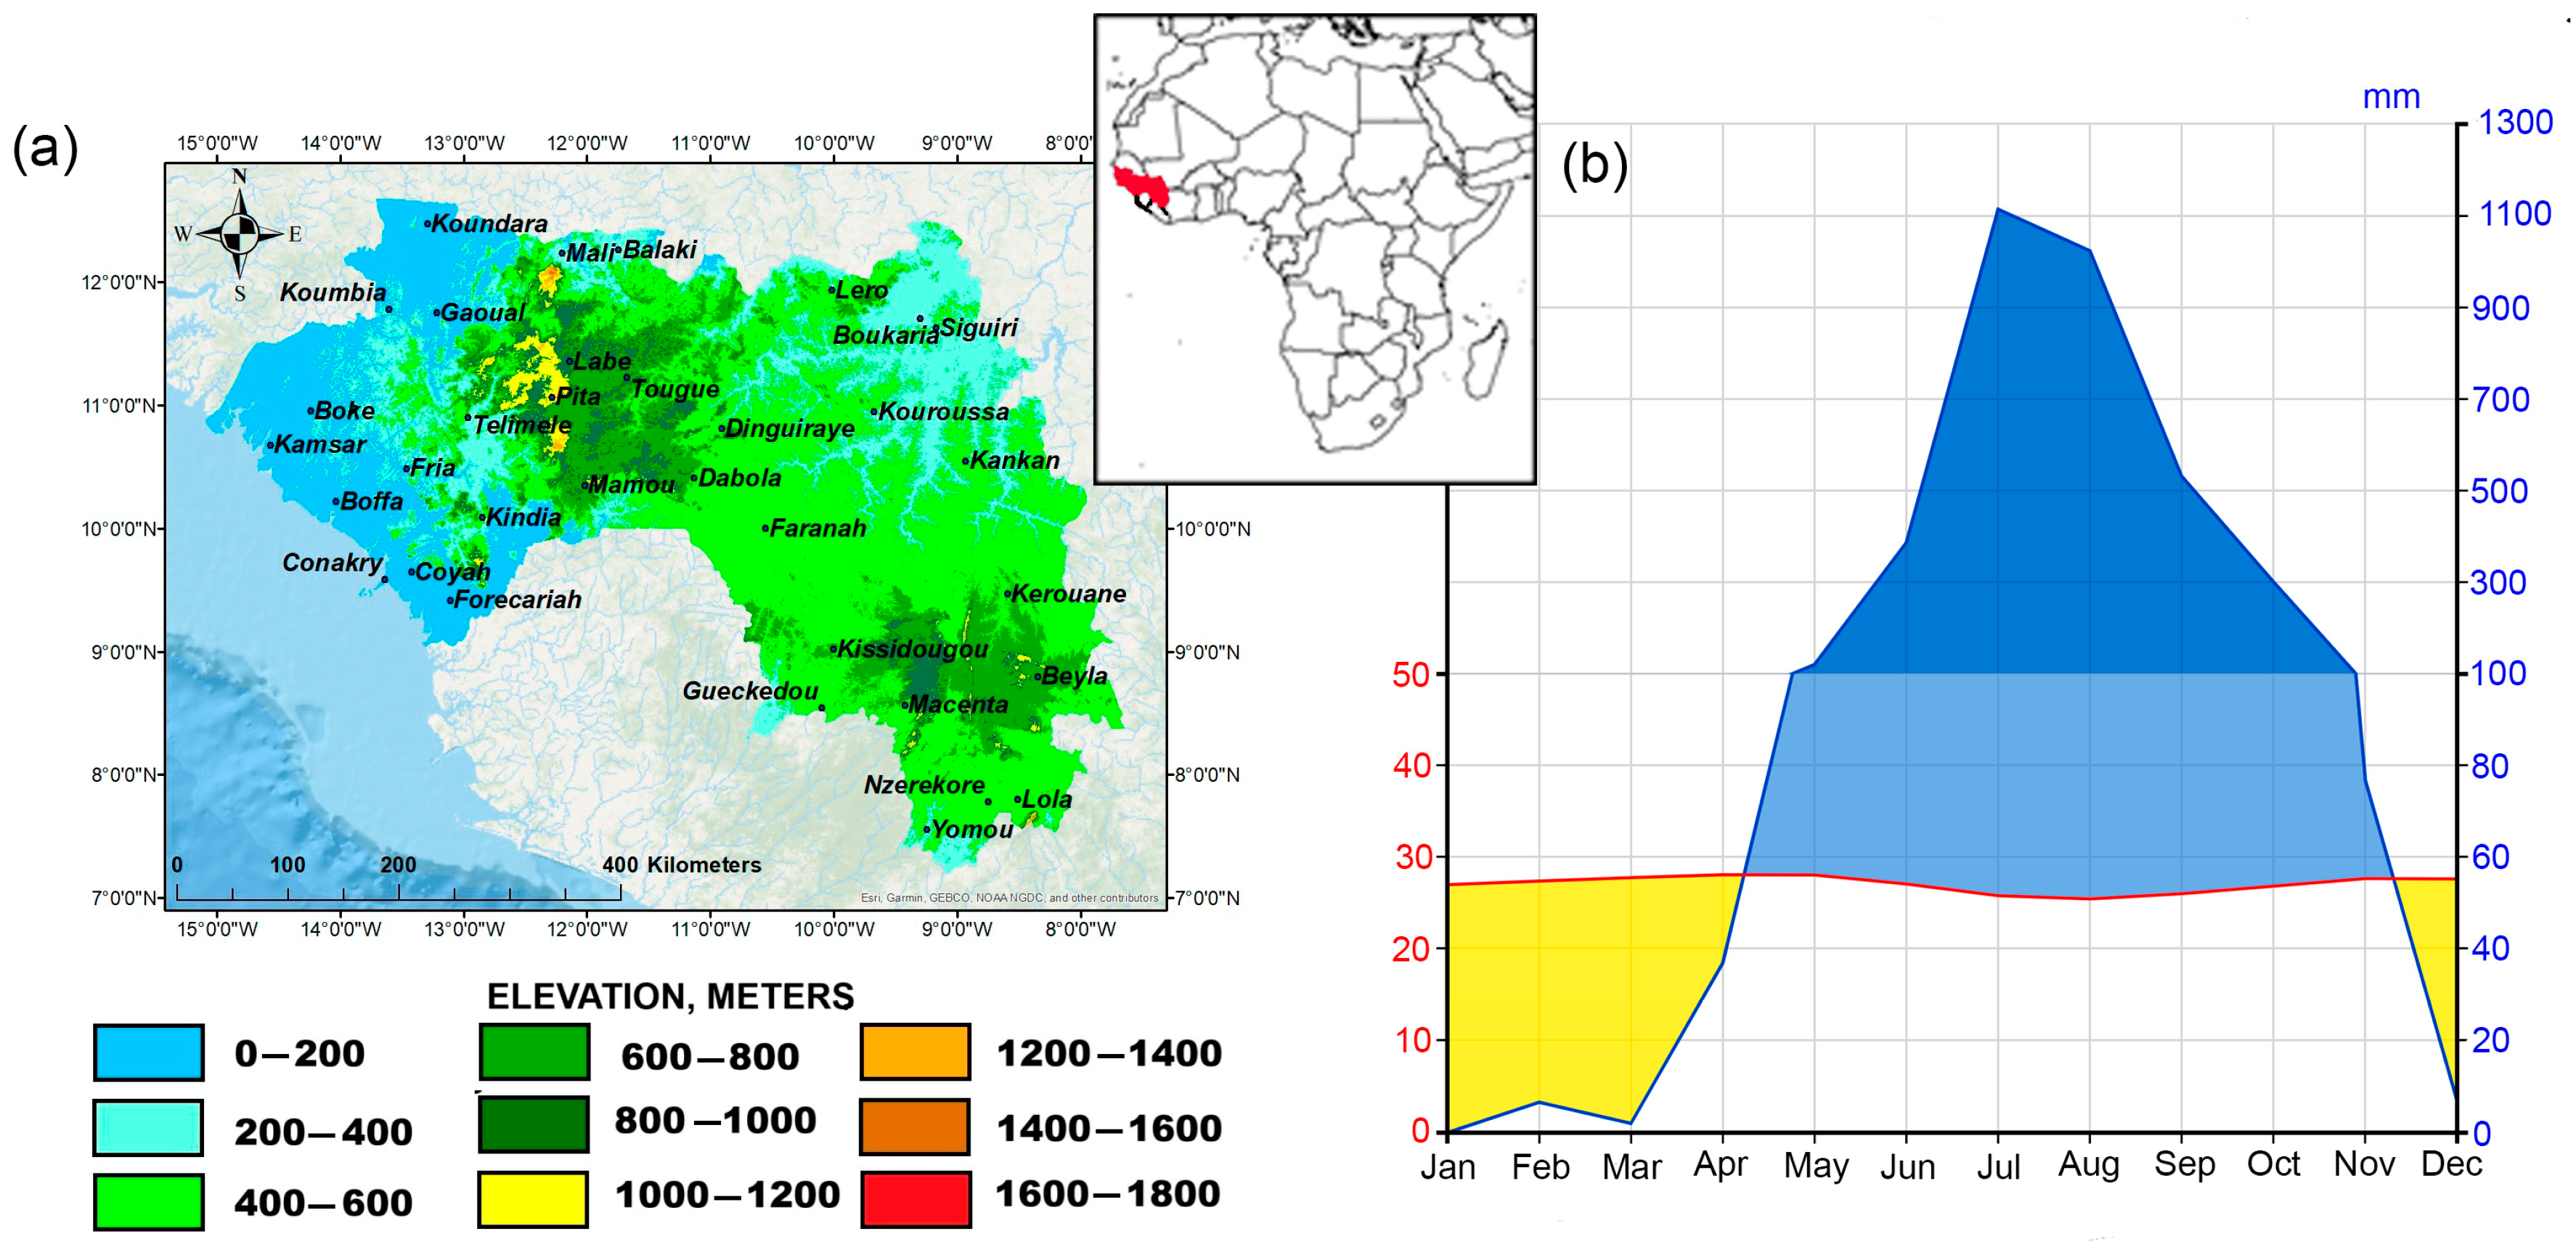
Guinea is situated in West Africa (7–15° W, 7–13° N), with a diverse topography dominated by mountainous terrain (Figure 1a). More than half of the country’s territory consists of low mountains and plateaus. The Atlantic coastline features a highly indented morphology with river estuaries and is bordered by an alluvial-marine plain (30–50 km wide). Moving inland, the landscape ascends through terraces to the Fouta Djallon plateau, which reaches elevations of up to 1538 m (Mount Tamgué) and is dissected into distinct massifs. Further east lies an elevated structural plain, bounded to the south by the North Guinean Highlands. This transitions into basement plateaus (≈800 m) and block mountains (Mount Nimba—the country’s highest point at 1752 m). The interior regions are predominantly hilly and mountainous, with the most significant elevations (≈1500 m) occurring in the Fouta Djallon massif (northwest) and the Nimba Range (southeast).
These highlands serve as the headwaters for major West African rivers, including the Niger, Senegal, and Gambia. Guinea is traditionally divided into four natural regions: Coastal Guinea, Middle Guinea, Upper Guinea and Forest Guinea. The country’s relief is shown in Figure 1a, generated using elevation data from the Copernicus Global Digital Elevation Model [44].
Guinea experiences a distinct subequatorial climate characterized by pronounced seasonal variations [45,46]: dry season in winter and rainy season in summer, due to the arrival of southwest monsoons. According to the Köppen–Geiger climate classification, most of Guinea’s territory has a tropical savanna climate (Aw). The Atlantic coast and the southwestern part of the country have a tropical monsoon climate (Am) [47]. The dry season lasts from October to April, the rainy season from May to September. Annual precipitation ranges from 1200–1500 mm in the interior of Guinea, to 4000 mm on the coast. On the coast, the average temperature in the warmest period (March–April) is 27–30 °C, compared to 23–27 °C inland. In the coldest month (August), the figures are 24–26 °C and 18–24 °C, respectively. The annual precipitation pattern shows remarkable concentration, with over 70% of total precipitation occurring during the West African monsoon period [48]. This seasonal distribution is illustrated in Figure 1b.
Figure 1. Study region (a) and climate chart for Conakry (b) [46].
Climate 13 00239 g001

2.2. Data

Temperature trends across Guinea were evaluated using daily mean, minimum, and maximum air temperature data from the ERA5 reanalysis [49] with spatial resolution 0.25° × 0.25°. ERA5 represents the fifth-generation atmospheric reanalysis product from the European Centre for Medium-Range Weather Forecasts (ECMWF) with temporal coverage from 1940 to present (eight decades of continuous data). The ERA5 reanalysis incorporates an advanced data assimilation scheme (IFS Cycle 41r2) with improved parameterizations of convective processes and cloud microphysics. Data are freely available from the Copernicus Climate Data Store (Copernicus Climate Change Service) [50].
The CHIRPS v2.0 dataset (Climate Hazards Group InfraRed Precipitation with Station data, Climate Hazards Center, UC Santa Barbara, Santa Barbara, CA) is a quasi-global resource widely recognized as one of the most reliable precipitation sources for tropical Africa [51,52]. It provides continuous daily records from 1981 to the present (50° S–50° N) at a high 0.05° spatial resolution. Its robust accuracy is achieved by blending infrared satellite observations, ground station data, and a proprietary climatology (CHPclim) [53]. Trend analysis of mean and extreme values of air temperature and precipitation over Guinea was carried out for the most recent climatic period (1991–2024).
To assess projected climate changes in the region, we utilized outputs from coupled atmosphere-ocean general circulation models participating in Phase 6 of the Coupled Model Intercomparison Project (CMIP6) [54]. CMIP6, developed under the World Climate Research Programme (WCRP), introduced an innovative scenario—Shared Socioeconomic Pathways (SSPs) [55]. This integrated approach captures both socioeconomic development trajectories and associated greenhouse gas concentration pathways [56], providing a comprehensive foundation for climate impact assessments.
We used data from calculations under the SSP2-4.5 and SSP5-8.5 scenarios. The SSP2-4.5 scenario is essentially an update of the RCP4.5 scenario, which represents a middle-of-the-road development pathway and is considered optimal when past and current global trends are extrapolated into the future [57]. Under SSP2-4.5, radiative forcing will reach 4.5 W/m2 by 2100, and CO2 concentration will rise to 600 [58]. This scenario assumes that some climate mitigation measures will be implemented. The SSP5-8.5 scenario is the most aggressive in terms of intensity and is considered the worst-case pathway. Under this scenario, radiative forcing will reach 8.5 W/m2 by 2100, with greenhouse gas concentrations rising to 1100 ppm [58]. Innovations and technologies have advanced due to the intensive use of fossil fuels [57].
To mitigate the uncertainties associated with any single model [59], our analysis is based on a pre-processed multi-model ensemble mean obtained from the Climate Explorer website (https://climexp.knmi.nl/start.cgi, accessed on 28 July 2025). This dataset consolidates results from 33 individual models (Table 1). The provided data represents the collective mean of these models and has been regridded to a uniform spatial resolution of 1.88° by 1.25° using bilinear interpolation, which constitutes the final grid used for our calculations.
The historical period was set as 1980–2014, and three future periods were analyzed: 2026–2050, 2051–2075, and 2076–2100.

2.3. Method

Climate change was assessed using extreme temperature and precipitation indices developed by the CCl/CLIVAR Expert Team on Climate Change Detection and Indices (ETCCDI) [86,87] (Table 2, Figure 2). The assessment of climate extremes in this study relied on absolute threshold indices rather than percentile-based indices. This choice was primarily dictated by the characteristics of the precipitation data. The CHIRPS satellite-derived precipitation record, essential for achieving high spatial resolution across Guinea, is available from 1981 onwards. A period of 30–40 years is generally considered the minimum for calculating a stable climatological baseline. Absolute thresholds (e.g., R10mm, R20mm) are more robust in this context, as they are not dependent on the specific reference period and provide physically intuitive metrics that are directly comparable across regions and throughout the entire data record. These indices allow us to estimate physically significant impacts, in particular, increased flood risk (with increasing SDII) and increased drought risk (with increasing CDD and decreasing PRCPTOT).
The calculation of spatial fields for key meteorological parameters and their extremes was performed in Matlab R2024a. Time series analysis was conducted using the RClimDex 2.0 software [88] (Figure 2).
Linear trends were computed using the least squares method and Theil-Sen estimator. When calculating the trend using the least squares method, the following equation of linear regression is used:
y = β 0 + β 1 · x + ε ,
where y—dependent variable, x—independent variable (years), β0—intercept (mean value at the beginning of the period), β1—slope (annual trend rate of change per year) and ε—random error term
Sen slope [89] is a non-parametric method. It represents the slope of time series by calculating the median value of the sequence
S e n = M e d i a n x j x i j i ,   j > i ,
where Sen is the estimated slope value; xi and xj are the i-th and j-th rank slope values, respectively, where 1 ≤ ijn, and n is the length of the order column.
Statistical significance was assessed via the t-test (two-tailed test with Student’s t-distribution with n-2 degrees of freedom) and the non-parametric Mann–Kendall test [90,91].
The Mann–Kendall test statistic S is calculated as:
S = i = 1 n 1 j = i = 1 n s g n ( x j x i ) ,
where xj and xi are the annual values in years j and i, j > i respectively.
The variance is calculated as follows:
V A R S = 1 18 ( n 1 ) ( 2 n + 5 ) p = 1 q t p ( t p 1 ) ( 2 t p + 5 ) ,
where q is defined as the number of tied groups and tp is the amount of data in the p-th group. The values of S and VAR(S) are accustomed to calculate the test statistics Z which is following as:
Z = S 1 V A R ( S )       i f   S > 0 0       i f   S = 0 S + 1 V A R ( S )       i f   S < 0
The standardized test statistic Z follows a standard normal distribution under the null hypothesis of no trend. The significance level was set at α = 0.05 (95% confidence level). The null hypothesis was rejected if ∣Z∣ > Z1−α/2, where Z1−α/2 = 1.96.

3. Results

3.1. Temperature Tendencies

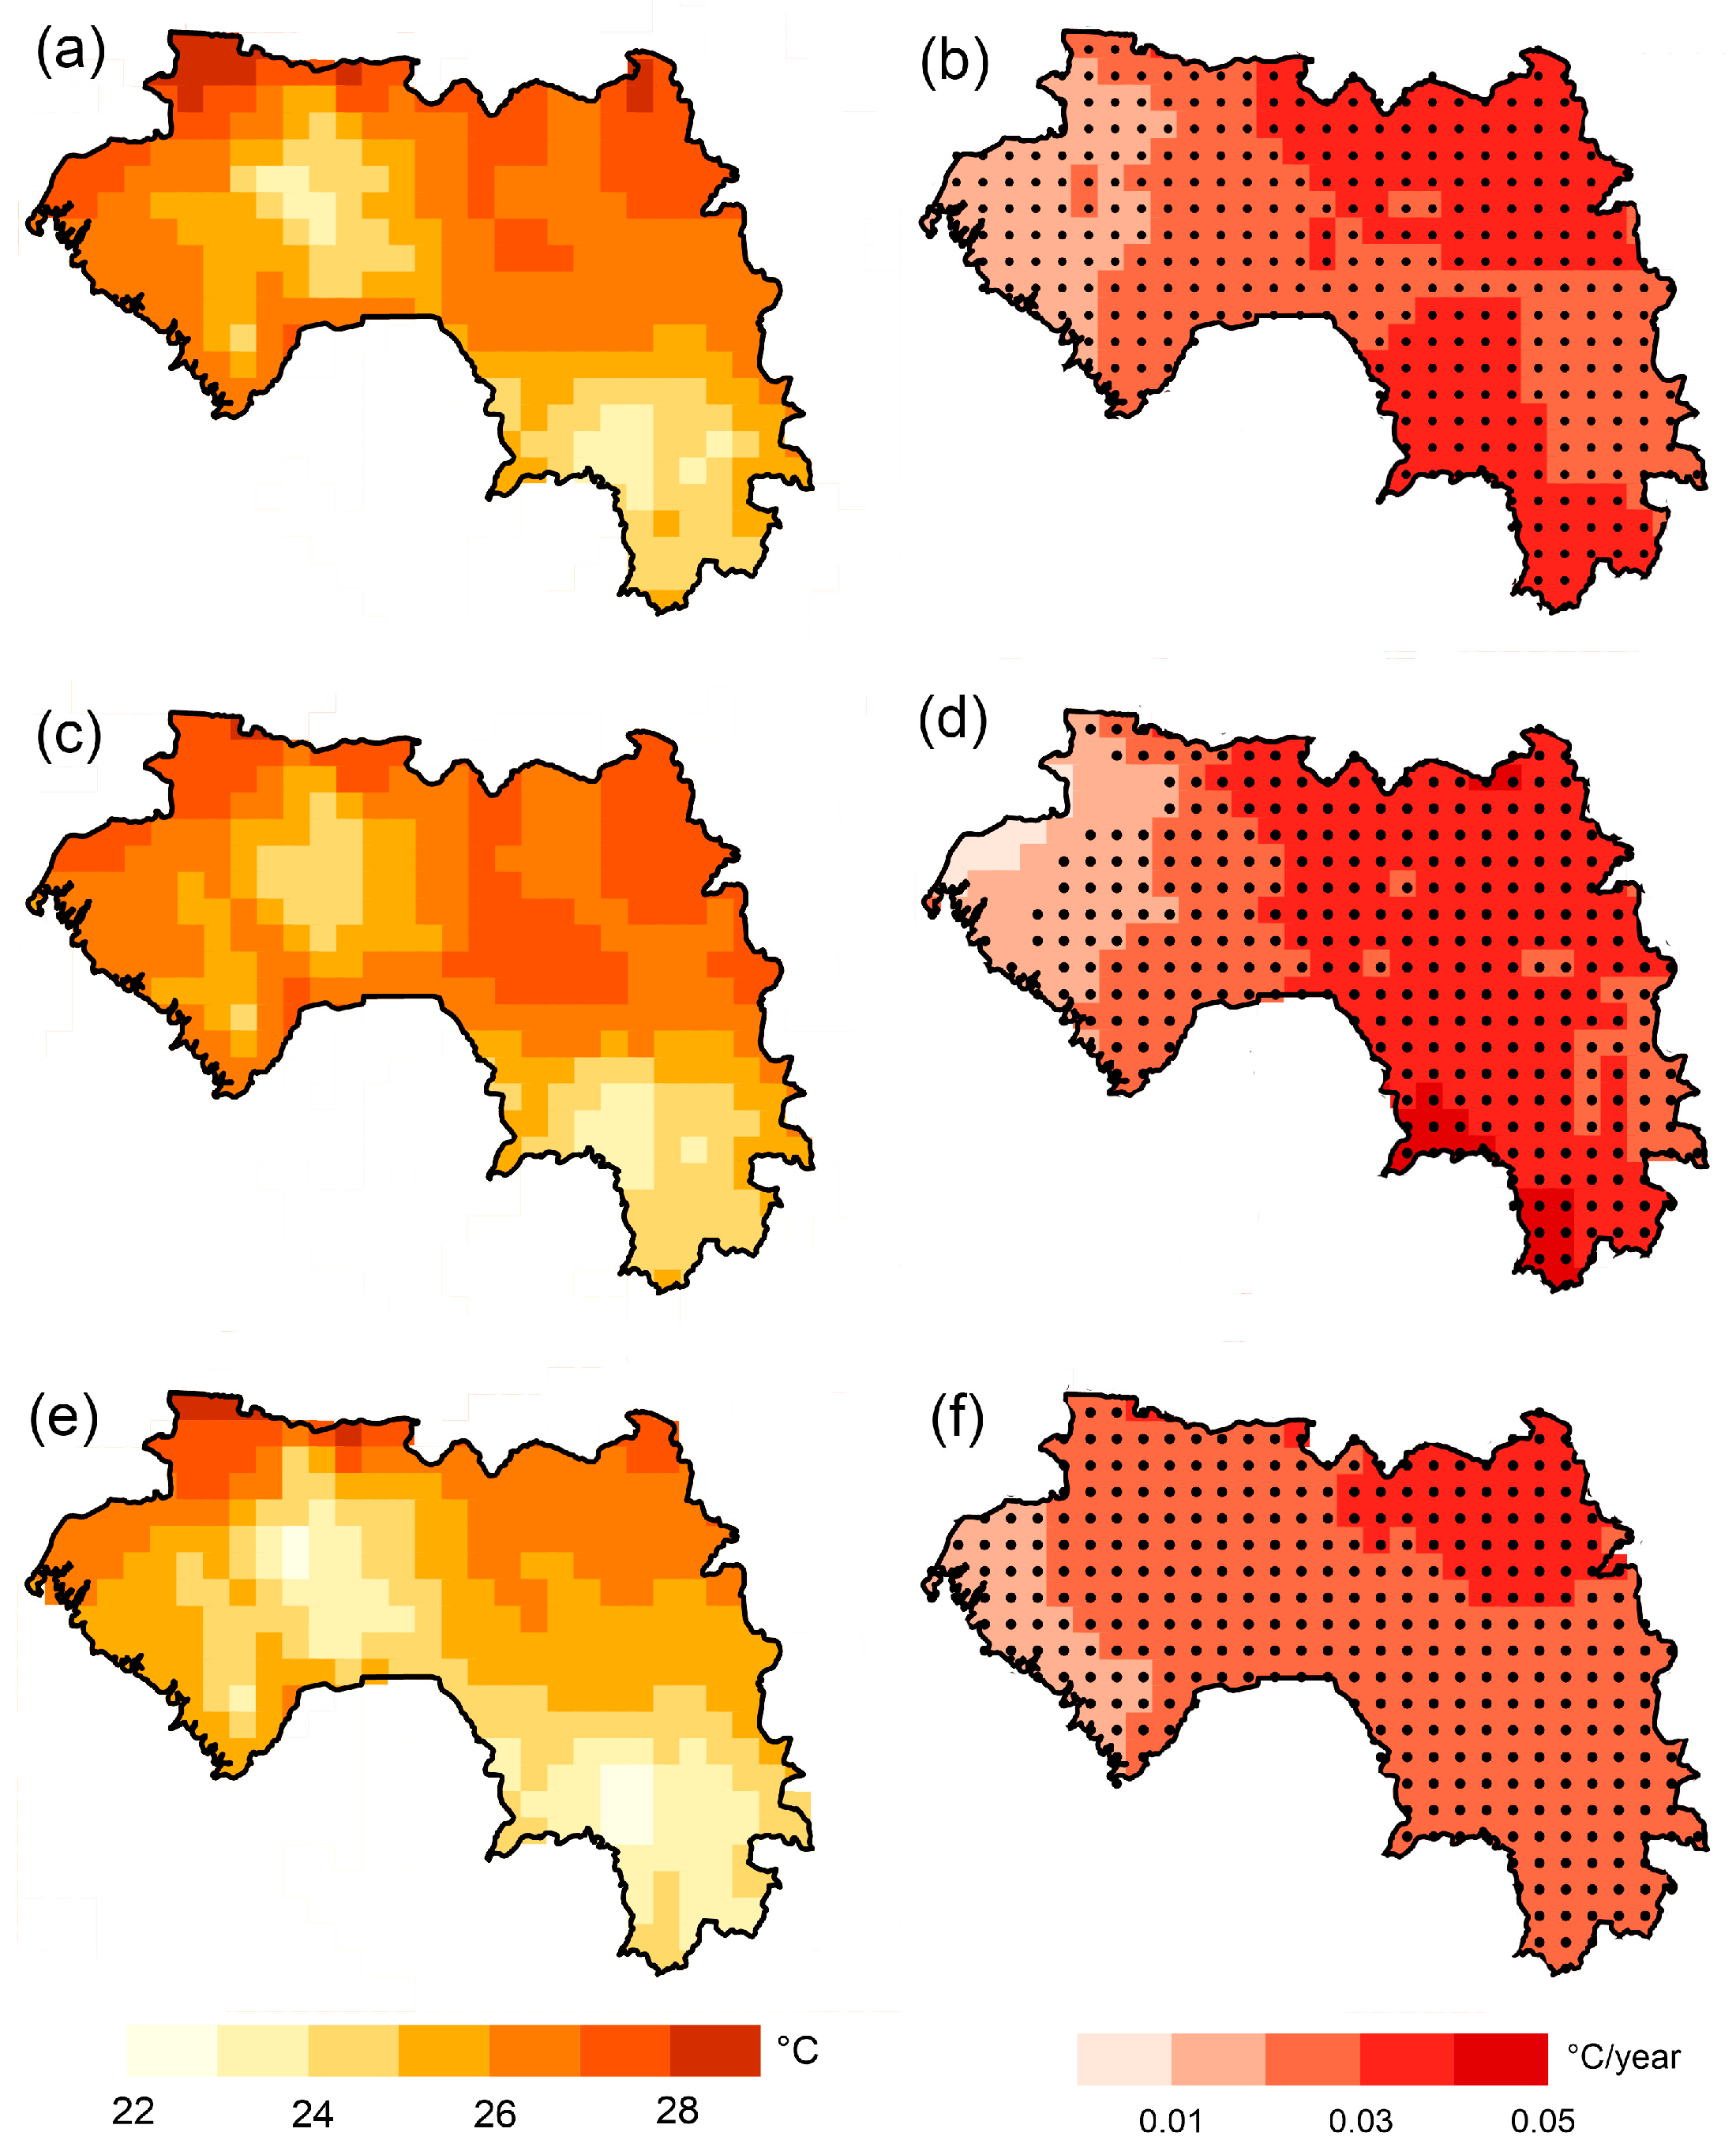
Mean annual air temperature across Guinea during the 1991–2024 period ranged from 23 to 29 °C (Figure 3). The lowest temperatures were recorded in high-altitude regions (the Fouta Djallon mountains in the northwest and the Nimba Mountains in the eastern part of the Guinean Highlands). The highest mean annual temperatures were observed in northern Guinea. Positive linear trends in annual mean air temperature were detected across all of Guinea, with statistical significance (p < 0.05). The warming rate varied from 0.1 °C/decade in western coastal areas to 0.4 °C/decade in northern regions bordering Mali. Dry season mean temperatures ranged between 26–28 °C, except in mountainous zones (23–24 °C). Rainy season temperatures were lower (25–26 °C). Warming trends were observed in both seasons, with stronger trends during the dry season (up to 0.5 °C/decade) compared to the rainy season (≤0.35 °C/decade). The highest warming rates occurred in northern and southeastern Guinea. Most trends were statistically significant at the 95% confidence level.
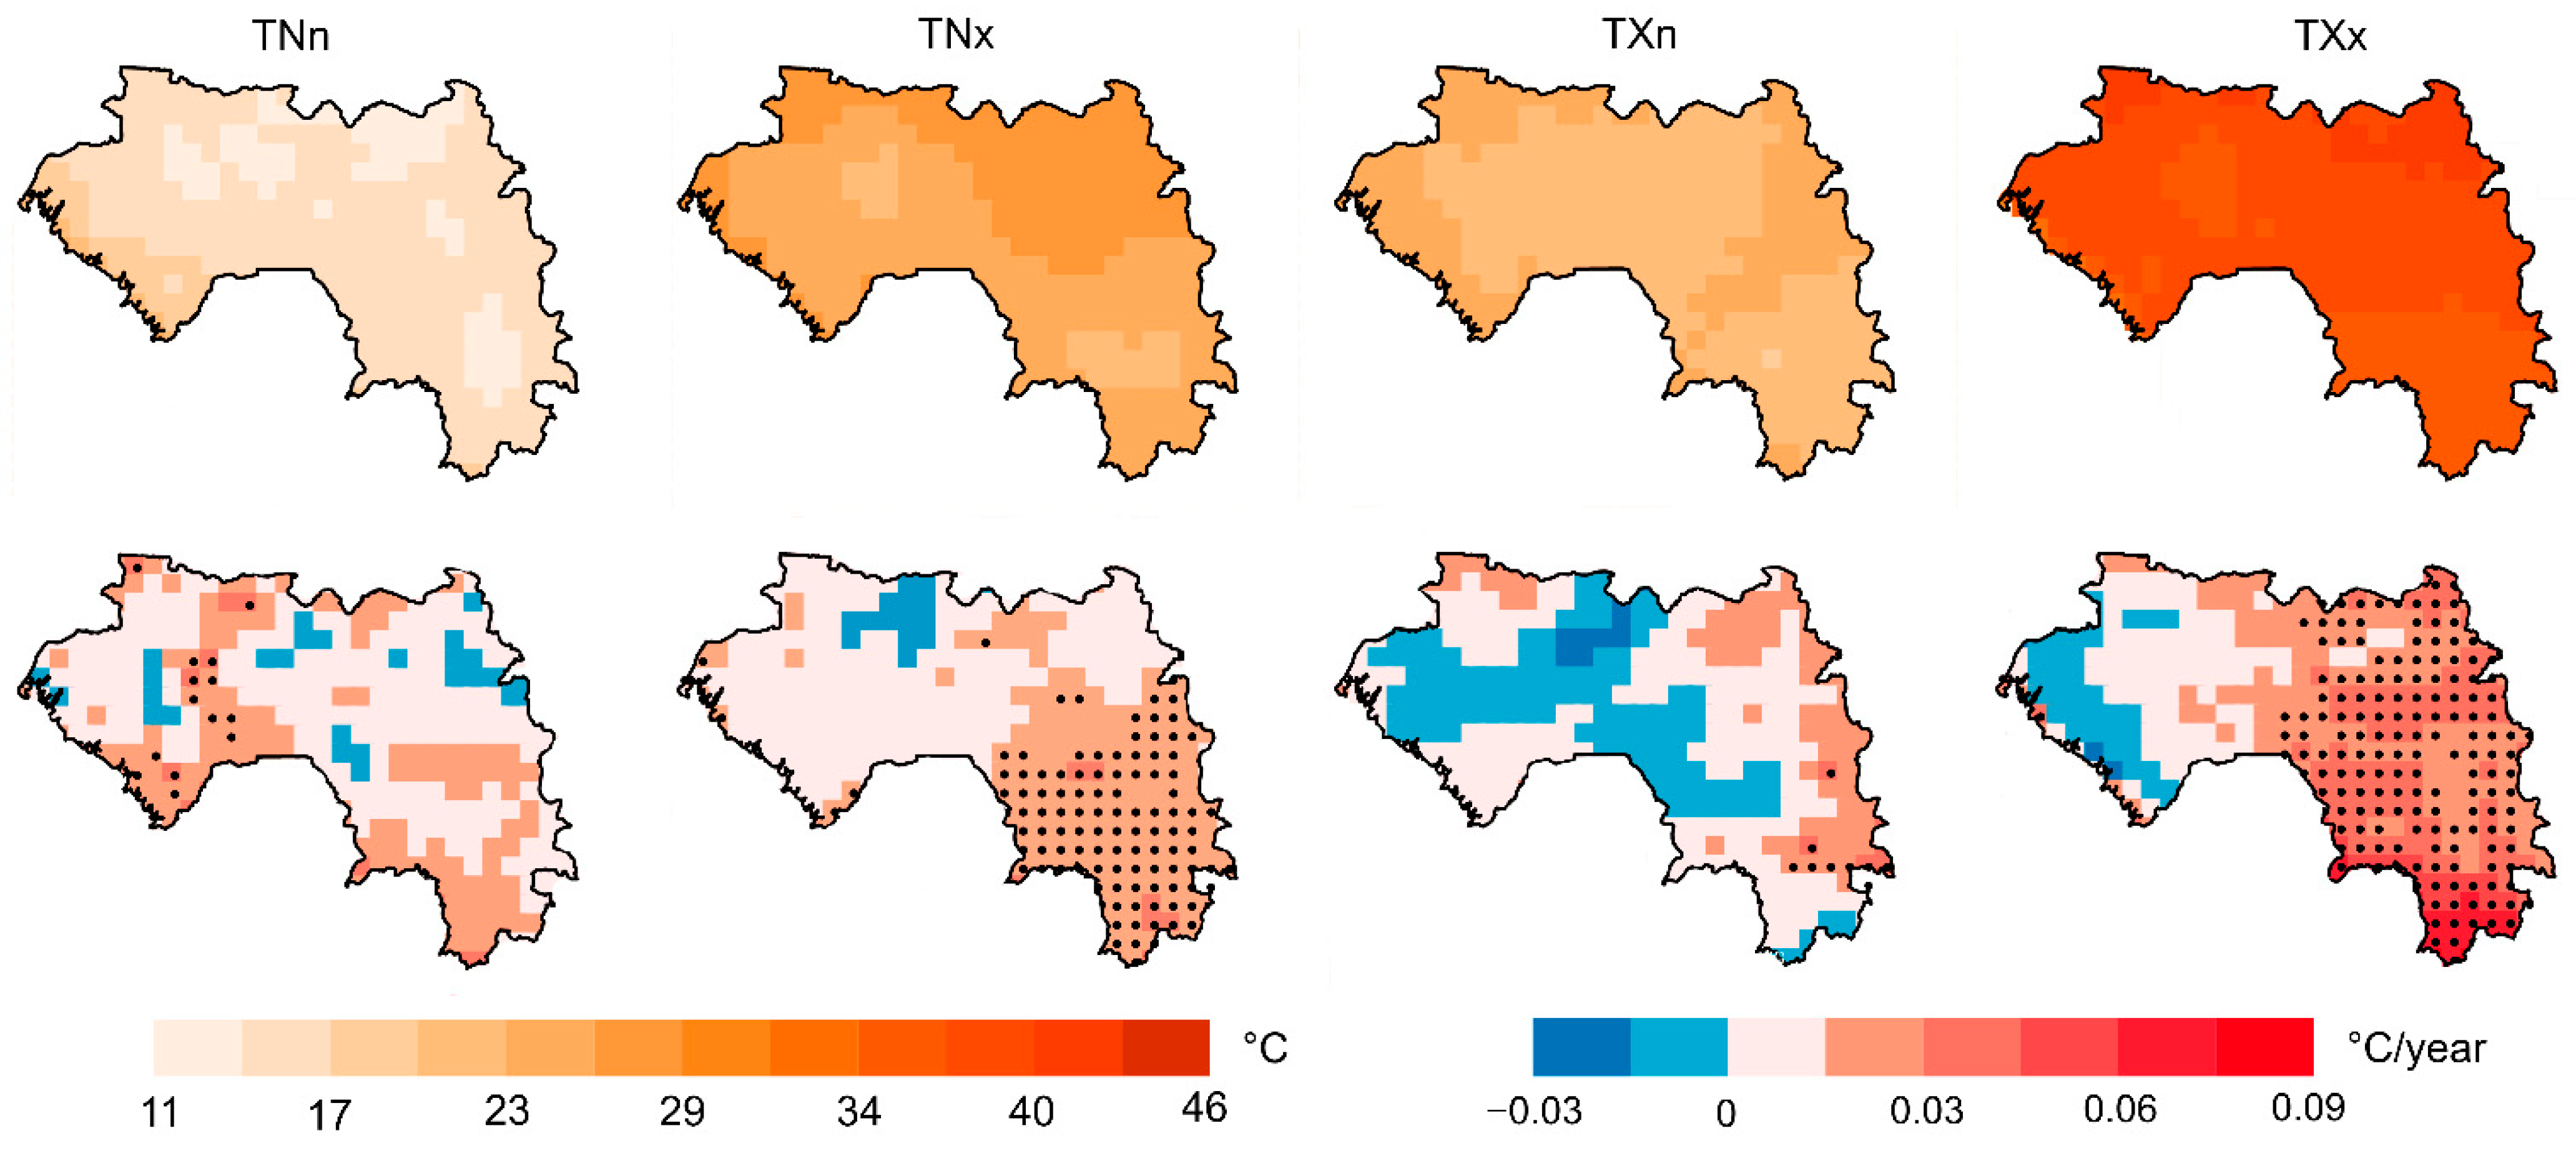
The assessment of minimum air temperatures was performed using the TNn (minimum of daily minimum temperatures) and TNx (maximum of daily minimum temperature) indices, which characterize the range and extremes of nighttime temperatures. Both indices show clear warming tendencies. During the 1991–2024 period, the mean TNn values across Guinea remained below 20 °C (Figure 4). The highest values (17–20 °C) were typical for coastal areas, while most inland regions showed mean absolute minimum temperatures of 11–17 °C. The mean TNx values varied from 23 °C to 29 °C, with maximum values observed in northeastern parts of the country and reduced values in highland regions. Analysis revealed positive trends in minimum temperatures throughout Guinea. The TNn index exhibited weak but statistically significant increases in certain regions. More notably, the TNx index demonstrated substantial warming in southeastern Guinea, where the trend magnitude reached 0.45 °C per decade.
The analysis of extreme daytime temperatures was conducted using the TXx and TXn indices, representing annual absolute extremes of daily maximum temperatures. Mean values of maximum temperature minima (TXn) across Guinea ranged from 20 °C to 26 °C (Figure 4). The absolute maximum temperatures (TXx) during 1991–2024 reached 46 °C in the northeastern part of the country. Positive and statistically significant warming trends in TXx were observed across nearly all of Guinea, except for the coastal zone. The most rapid warming occurred in southern regions (+0.9 °C per decade). In contrast, trends in maximum temperature minima (TXn) showed spatially heterogeneous changes that were statistically insignificant throughout Guinea.
Changes in temperature extremes indicate a consistent warming pattern affecting both daily minimum temperatures and their extreme values across different regions of the country. The spatial distribution of these trends highlights particularly rapid warming in southeastern areas, suggesting potential regional climate shifts that may require further investigation. The results reveal a pronounced asymmetry in daytime temperature extremes: while absolute maximum temperatures demonstrate robust and significant warming trends (particularly in interior regions), minimum values of daily maxima exhibit no statistically coherent pattern of change. This differential warming of temperature extremes may have important implications for local ecosystems and human populations, particularly in southern Guinea where the most intensive warming of peak daytime temperatures was observed.

3.2. Precipitation Trends Across Guinea

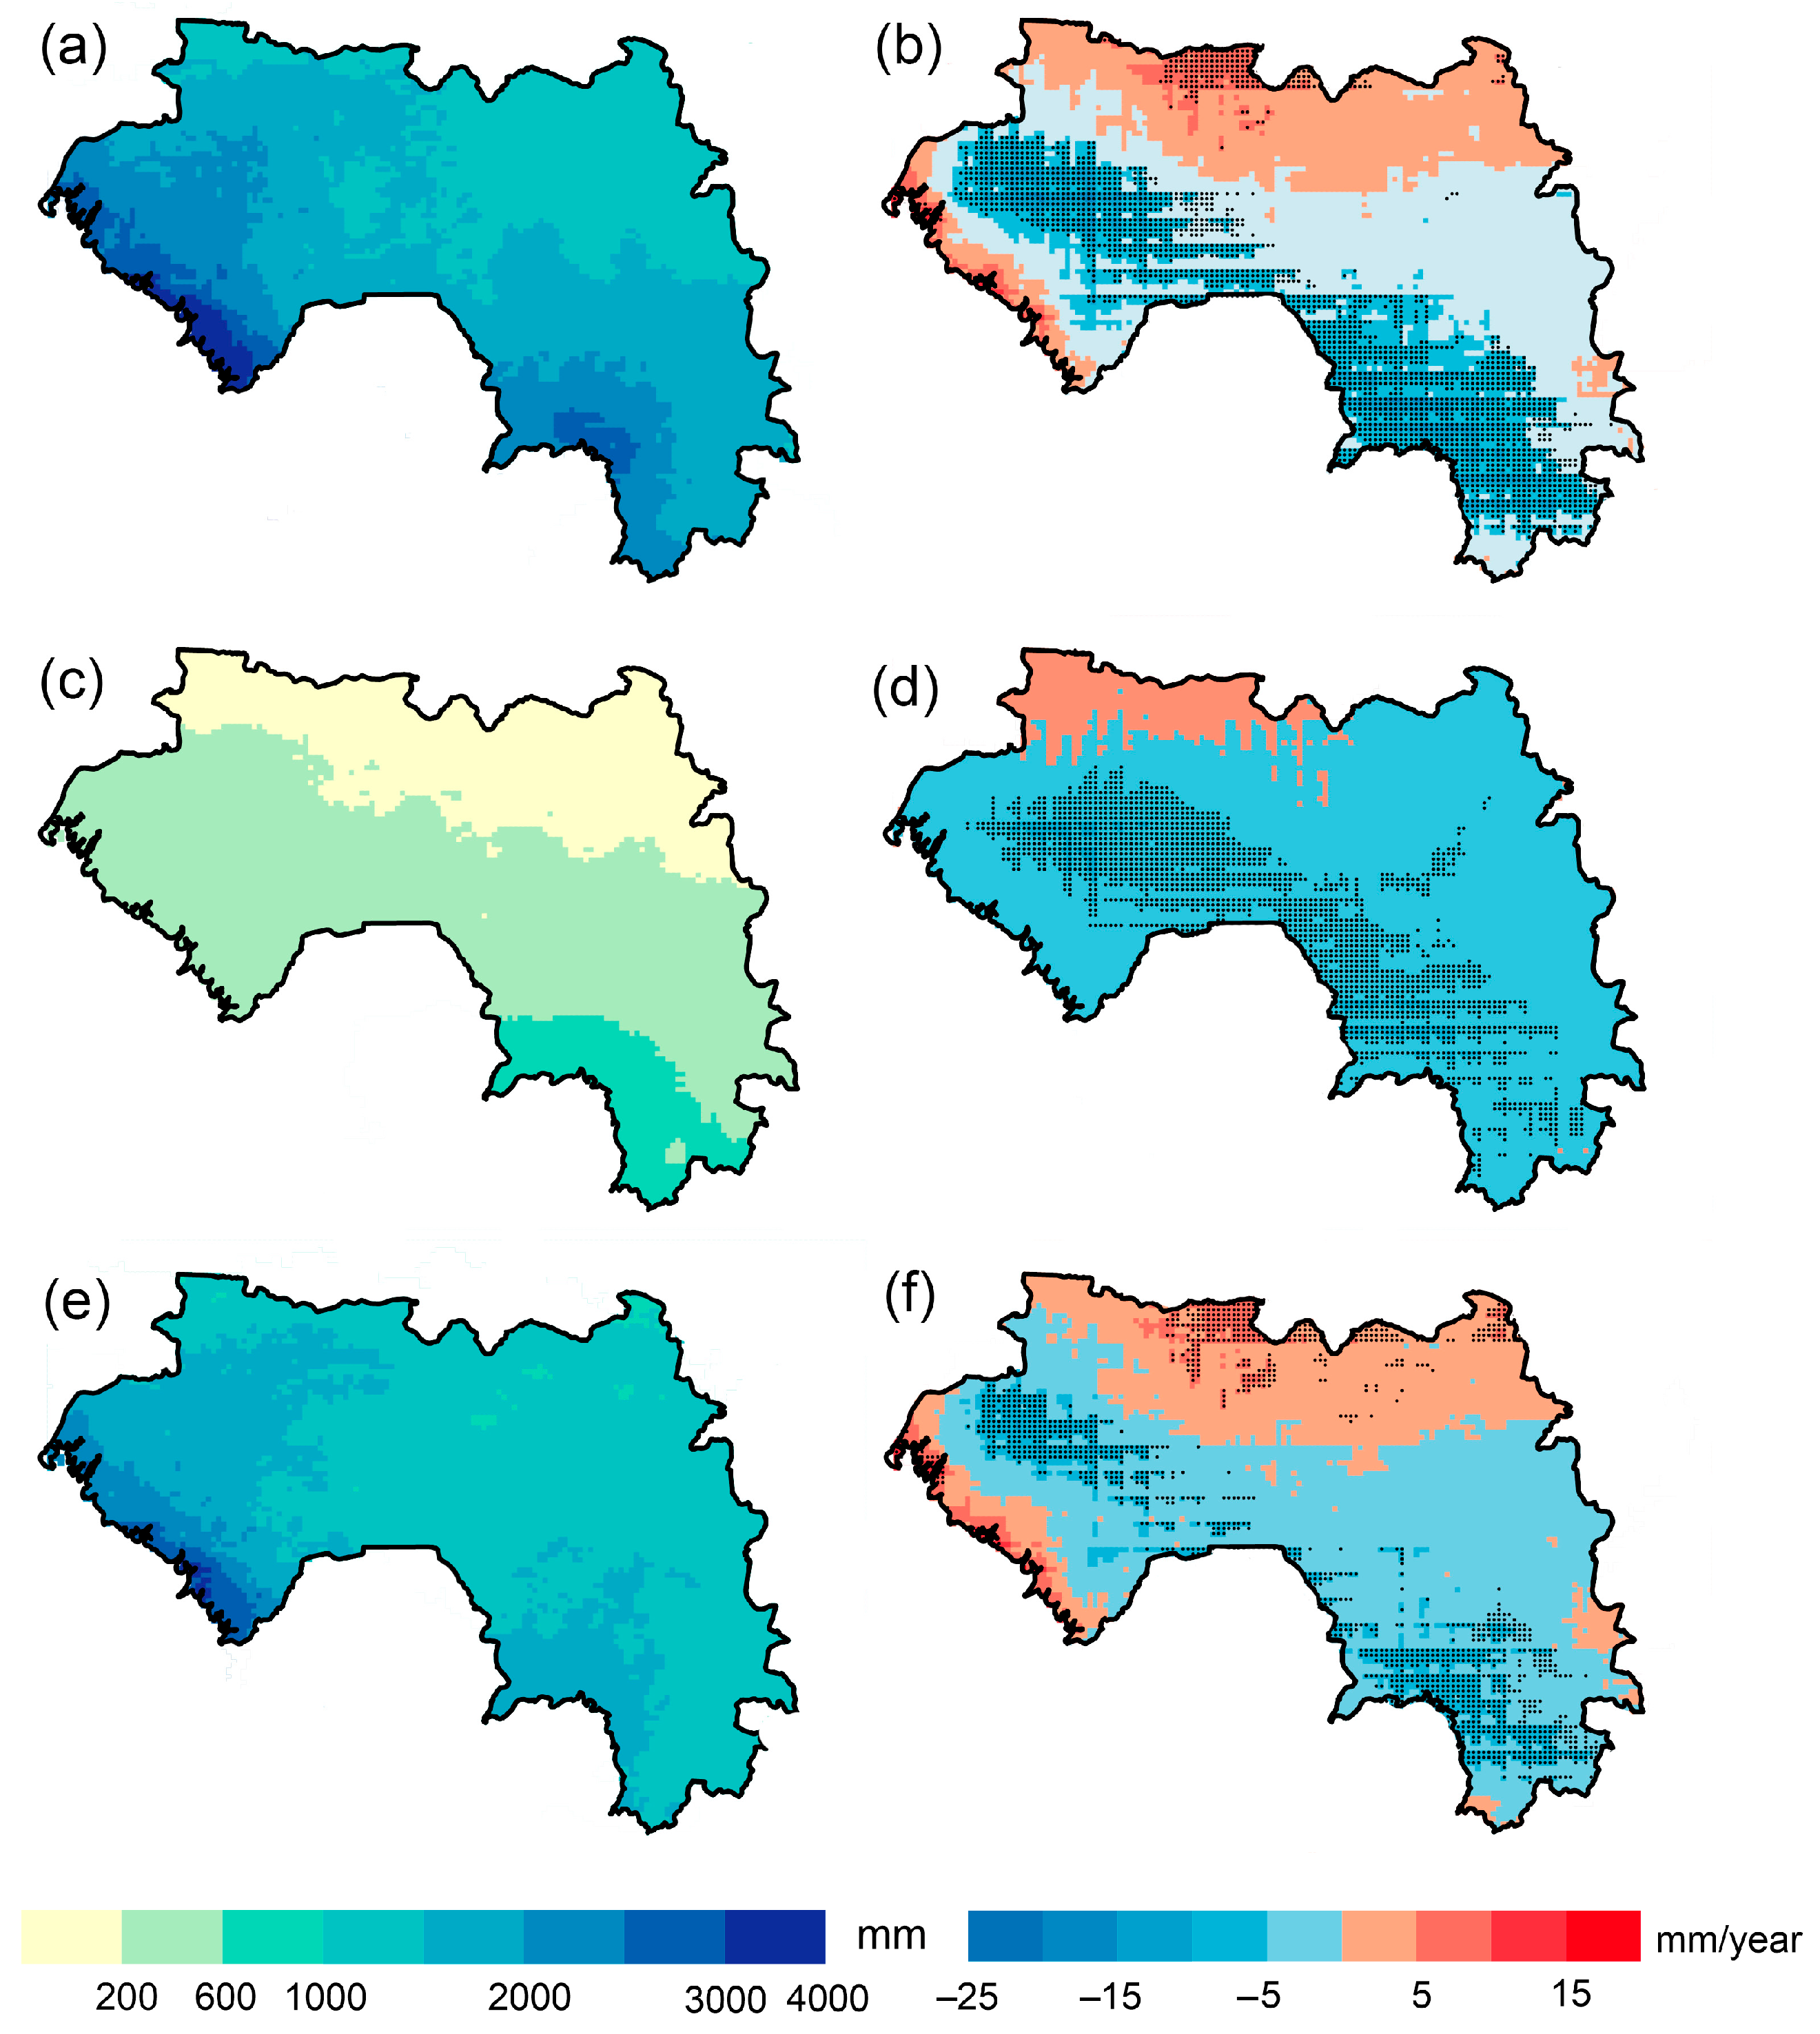
The analysis of precipitation patterns in Guinea during 1991–2024 revealed significant spatial and temporal variations. Annual precipitation totals ranged from 1000 mm in the northern regions to 3800 mm along the coast, with the coastal zone receiving the highest amounts while the northeastern areas remained relatively drier (Figure 5). The study identified contrasting precipitation trends across different regions of the country. Positive trends were observed along the coast, where precipitation increased by up to 200 mm per decade, and in northern areas, where the increase was statistically significant. In contrast, most other regions showed declining precipitation, with particularly notable and statistically significant reductions in highland areas, where annual precipitation decreased at a rate of 250 mm per decade. Seasonal analysis demonstrated distinct patterns in precipitation distribution. During the dry season, precipitation did not exceed 1000 mm nationwide, with maximum amounts occurring along the coast and in the southeastern regions. A countrywide reduction in dry season precipitation was observed, reaching statistically significant levels in the southeast (up to 100 mm per decade decrease). The rainy season brought substantially higher precipitation, with coastal areas receiving up to 3200 mm. While most of Guinea experienced decreasing trends in rainy season precipitation, the coastal zone showed a statistically significant increase of up to 200 mm per decade.
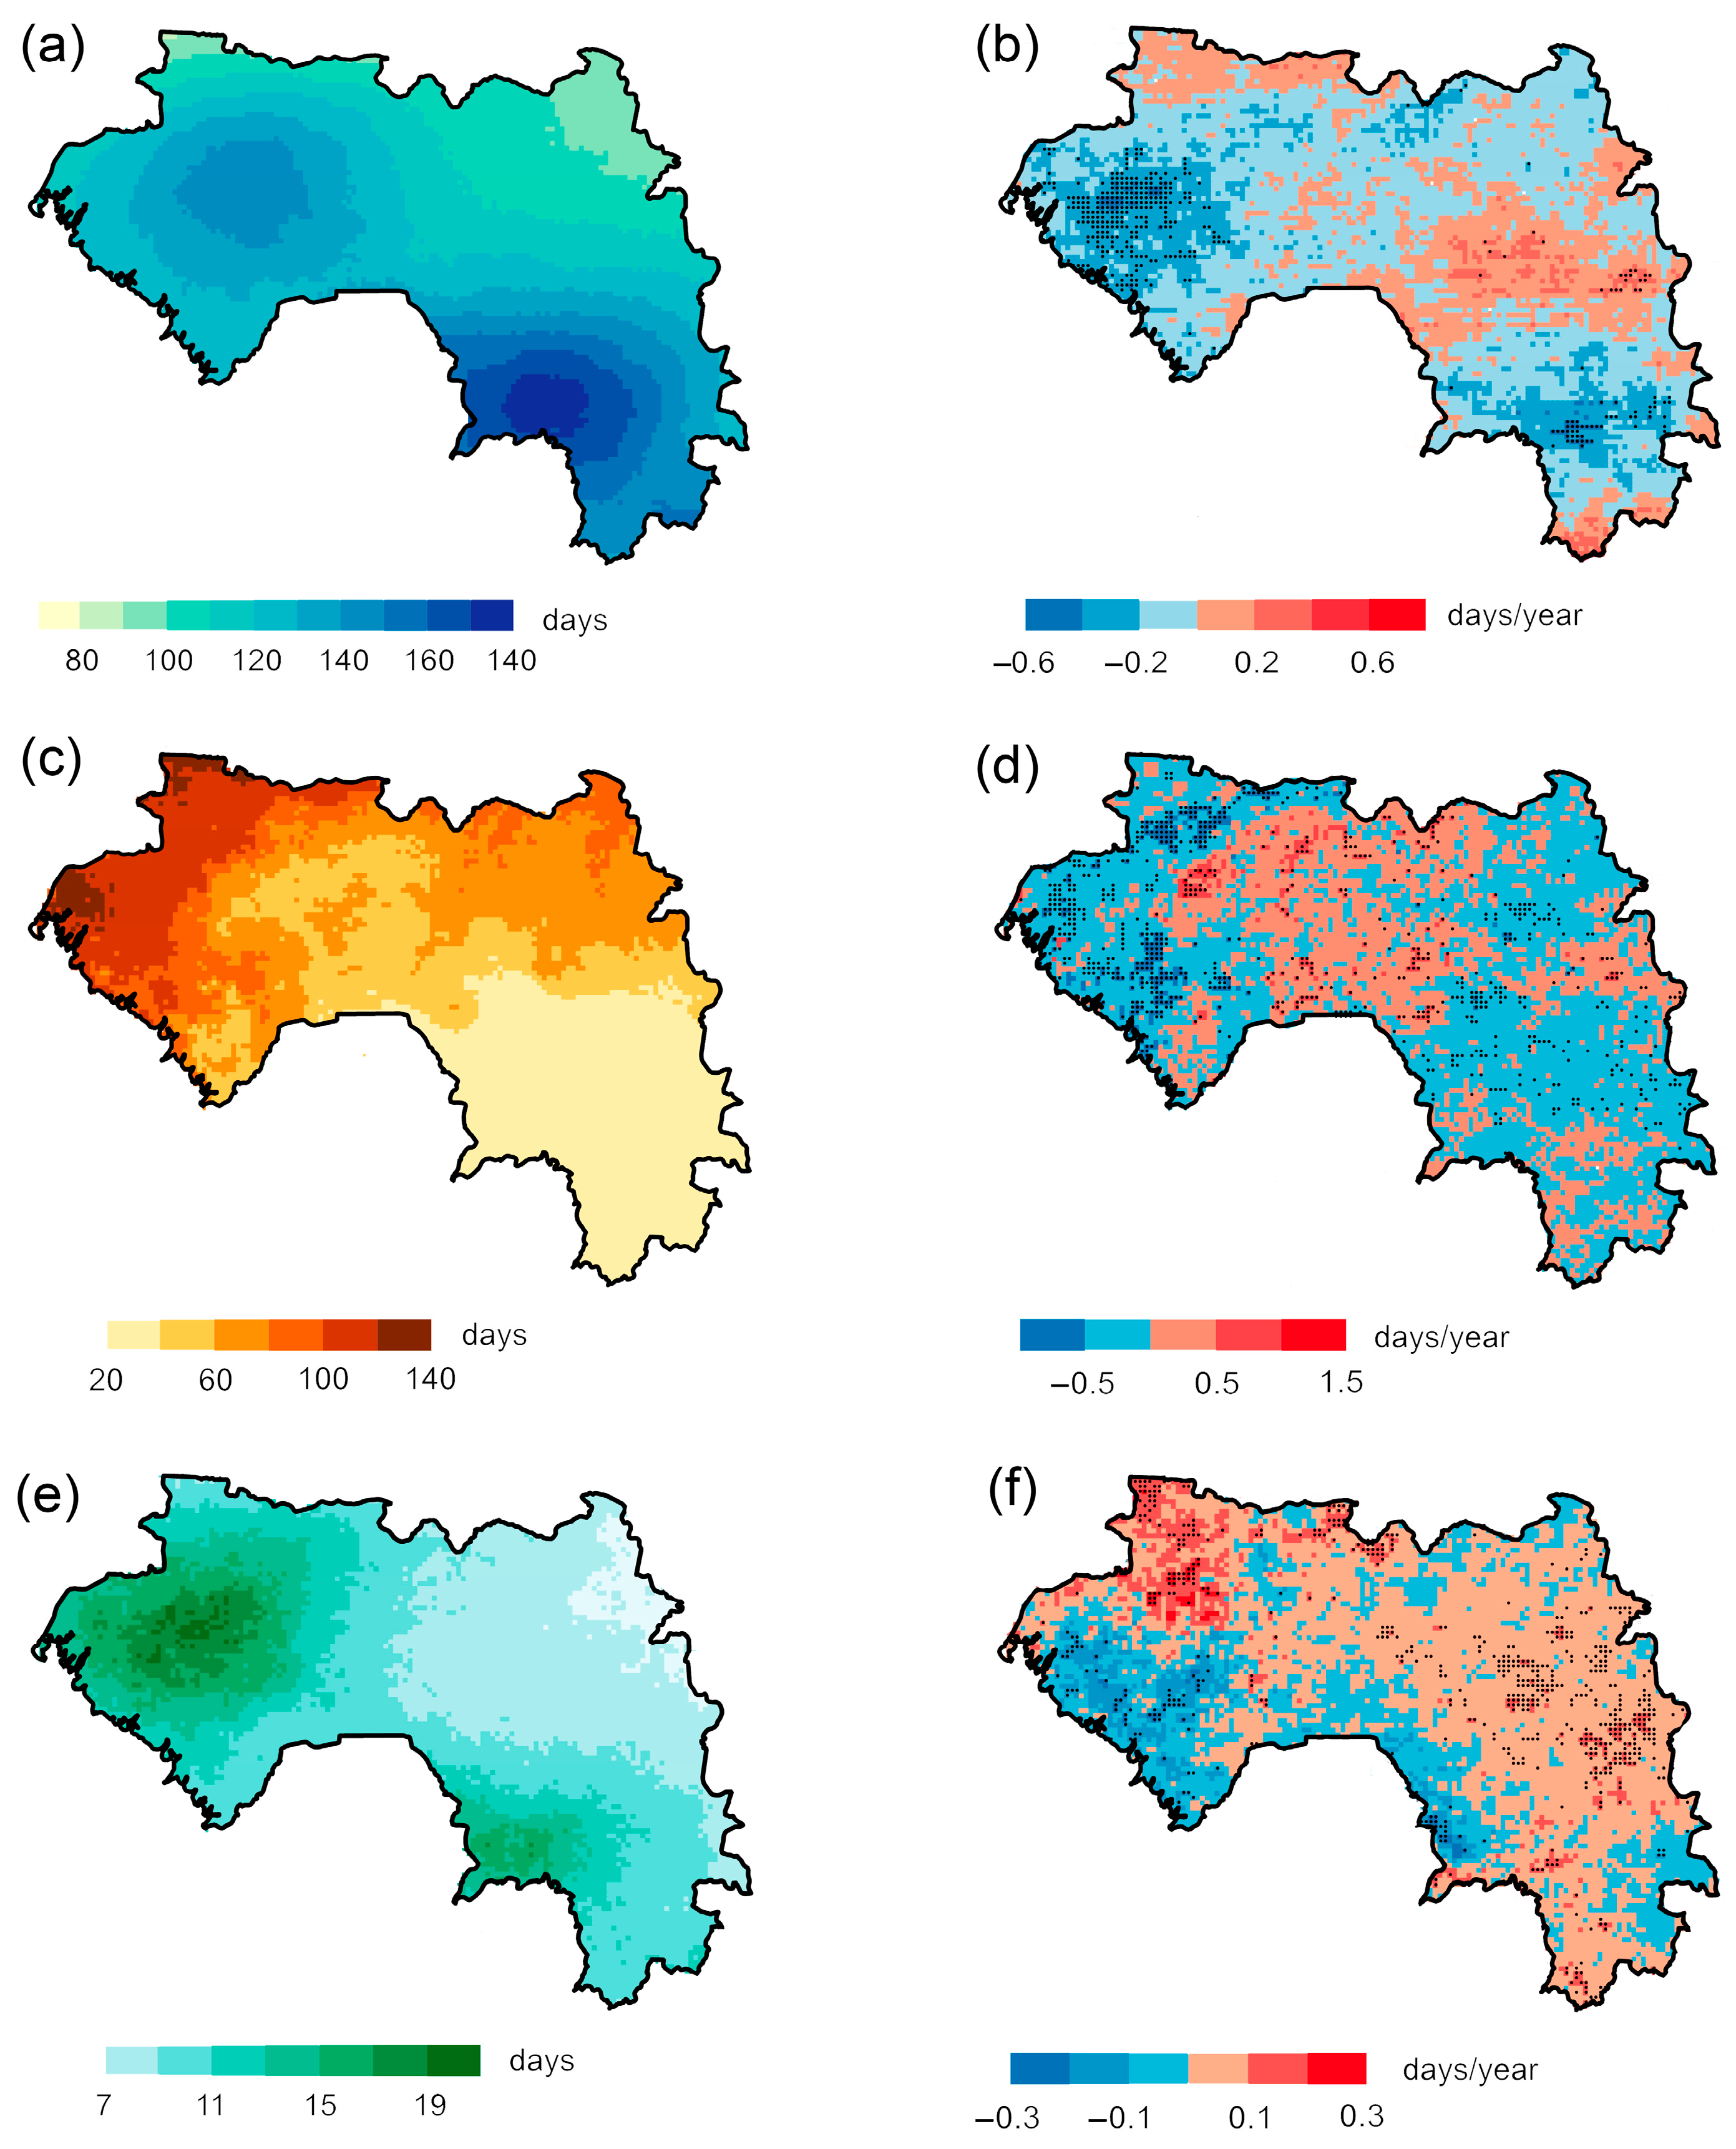
Guinea’s monsoon climate creates a stark contrast between summer precipitation dominance and near-complete winter dryness. The analysis reveals several key spatial and temporal patterns in precipitation characteristics. Areas with maximum rainy days (precipitation > 1 mm) are concentrated in mountainous regions, showing 150–180 wet days annually (Figure 6). Most regions exhibit declining trends in rainy days, with statistically significant reductions in the northwest (up to –6 days/decade) and southeast. The duration of wet/dry spells was analyzed using CWD (consecutive wet days) and CDD (consecutive dry days) indices. During 1991–2024, maximum mean CWD values occurred in the northwest and coastal areas (up to 21 days), while the northeast showed minimal values (7–9 days). Extreme CWD values reached 65 days in some years. Notable trends include decreasing CWD along the coast and western regions (up to –3 days/decade), significant reduction in coastal wet spells and pronounced increase in eastern wet periods (+3 days/decade). Dry spell duration varied widely across Guinea: 20 days in southeast and 120–140 days in northwest.
A nationwide trend toward shorter dry periods was observed, except in central regions. These patterns demonstrate an ongoing transformation of Guinea’s precipitation regime, with particularly marked changes in the duration of both wet and dry spells across different regions. The contrasting trends between coastal and eastern areas suggest complex spatial variability in how climate change is affecting the country’s monsoon system.
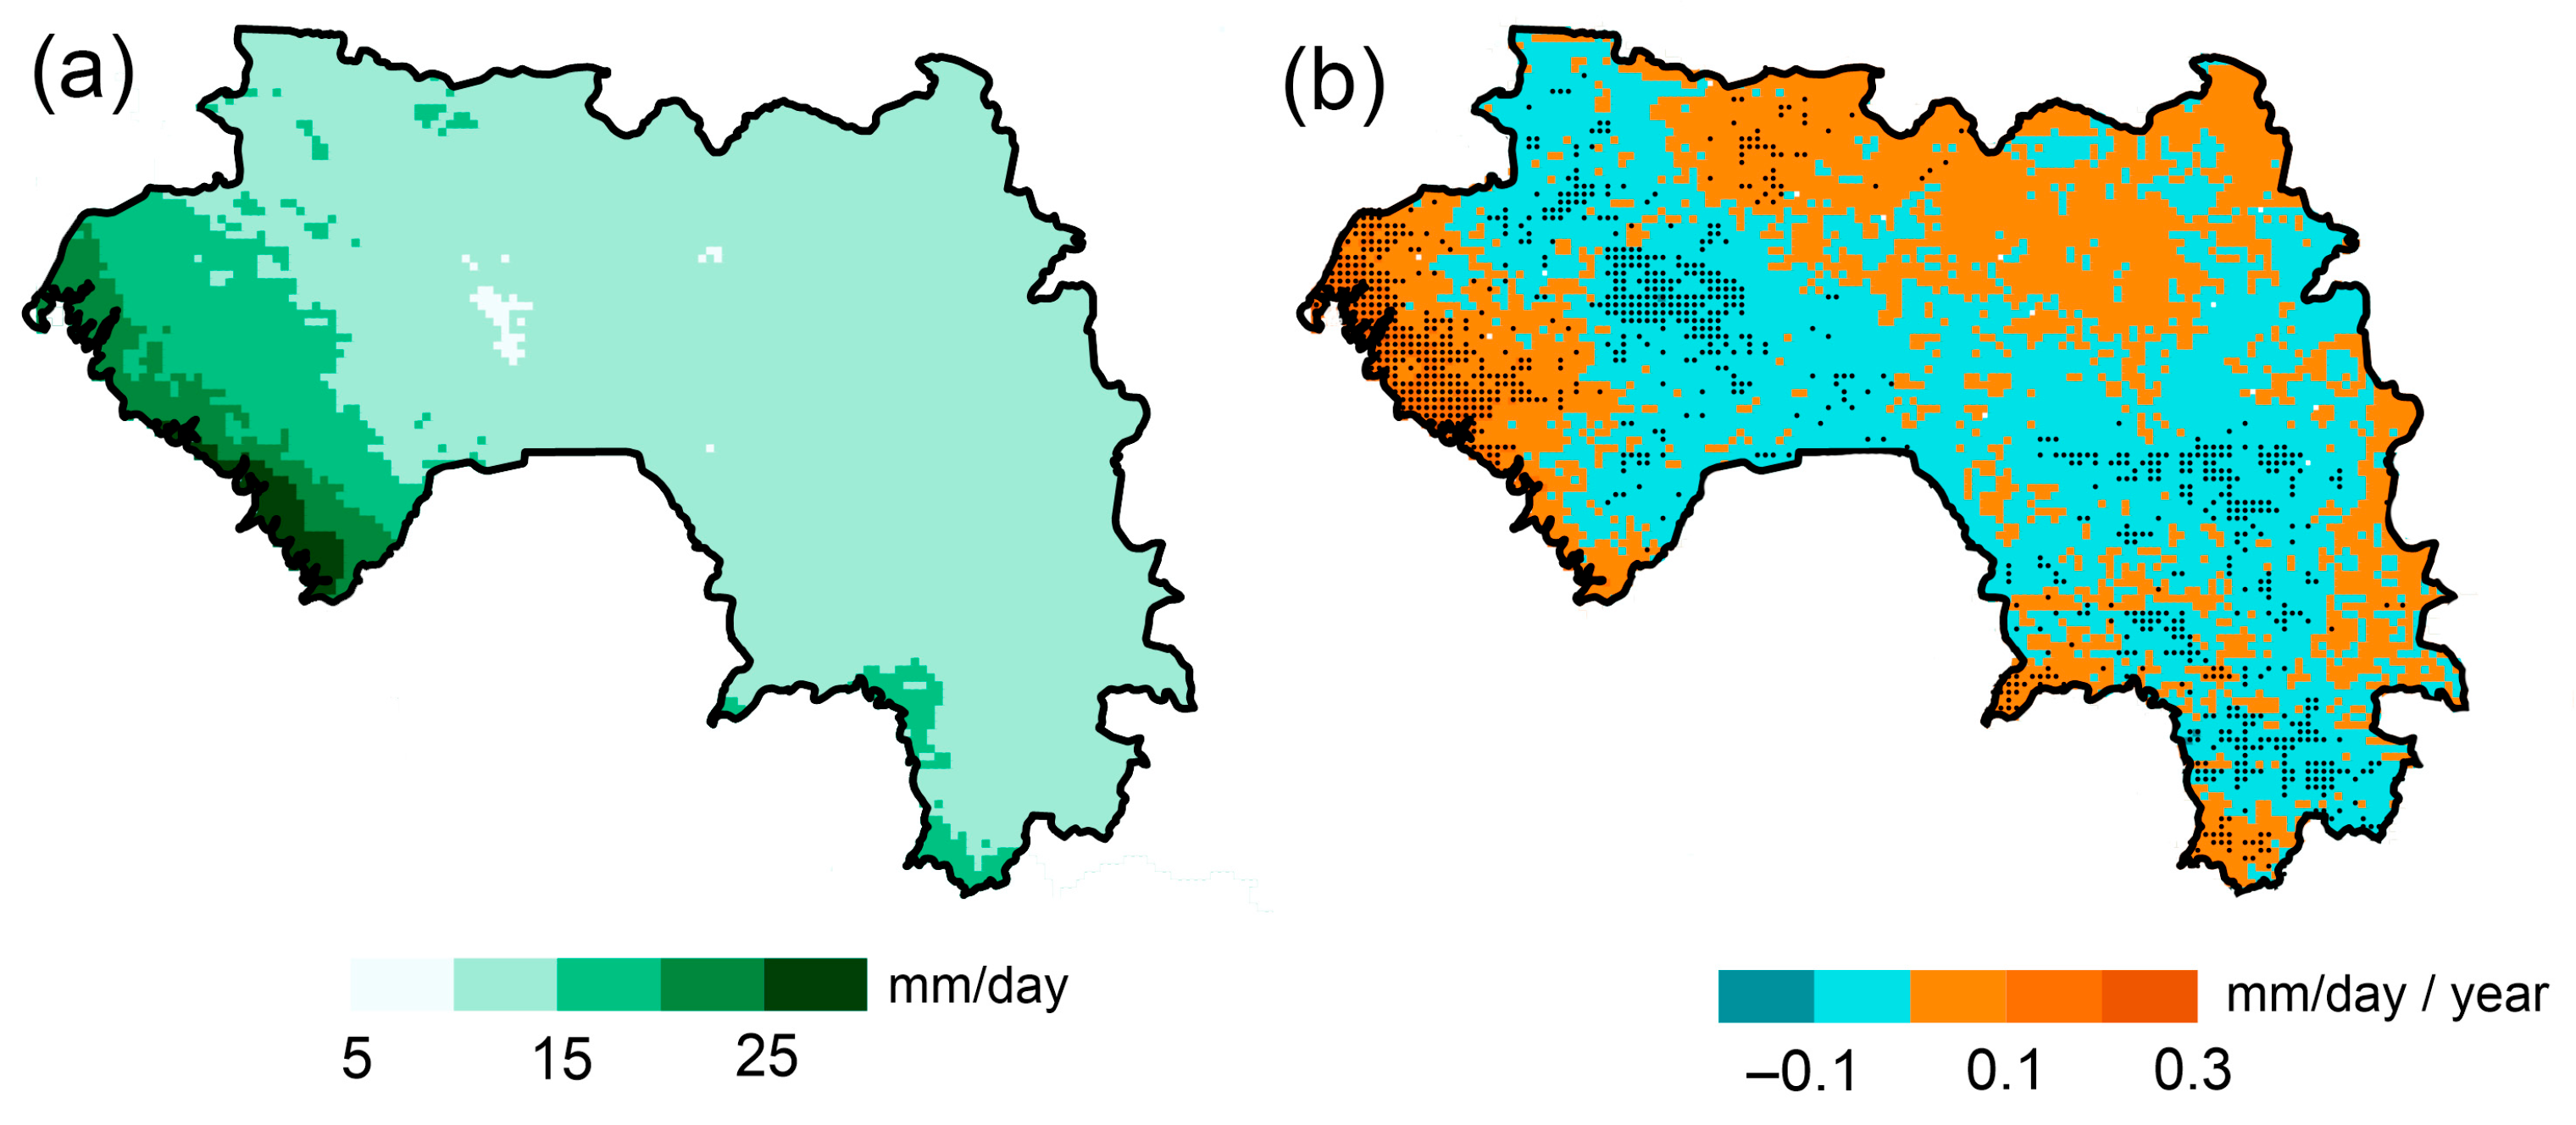
The SDII (Simple Daily Intensity Index), which characterizes precipitation intensity on days with precipitation ≥ 1 mm, reveals distinct spatial and temporal patterns across Guinea. Mean precipitation intensity varies from 5 to 30 mm/day, with maximum values observed in coastal regions and minimum values (generally below 15 mm/day) in the northeast and south of the country (Figure 7). The coastal zone not only demonstrates the highest precipitation intensity but also shows a statistically significant increasing trend of 2–3 mm/day per decade. In contrast, the Fouta Djallon Mountain range exhibits a notable decrease in precipitation intensity. These patterns highlight a growing contrast between the intensifying precipitation along the coast and the weakening precipitation in highland areas, suggesting significant regional differences in how climate change is affecting precipitation characteristics.
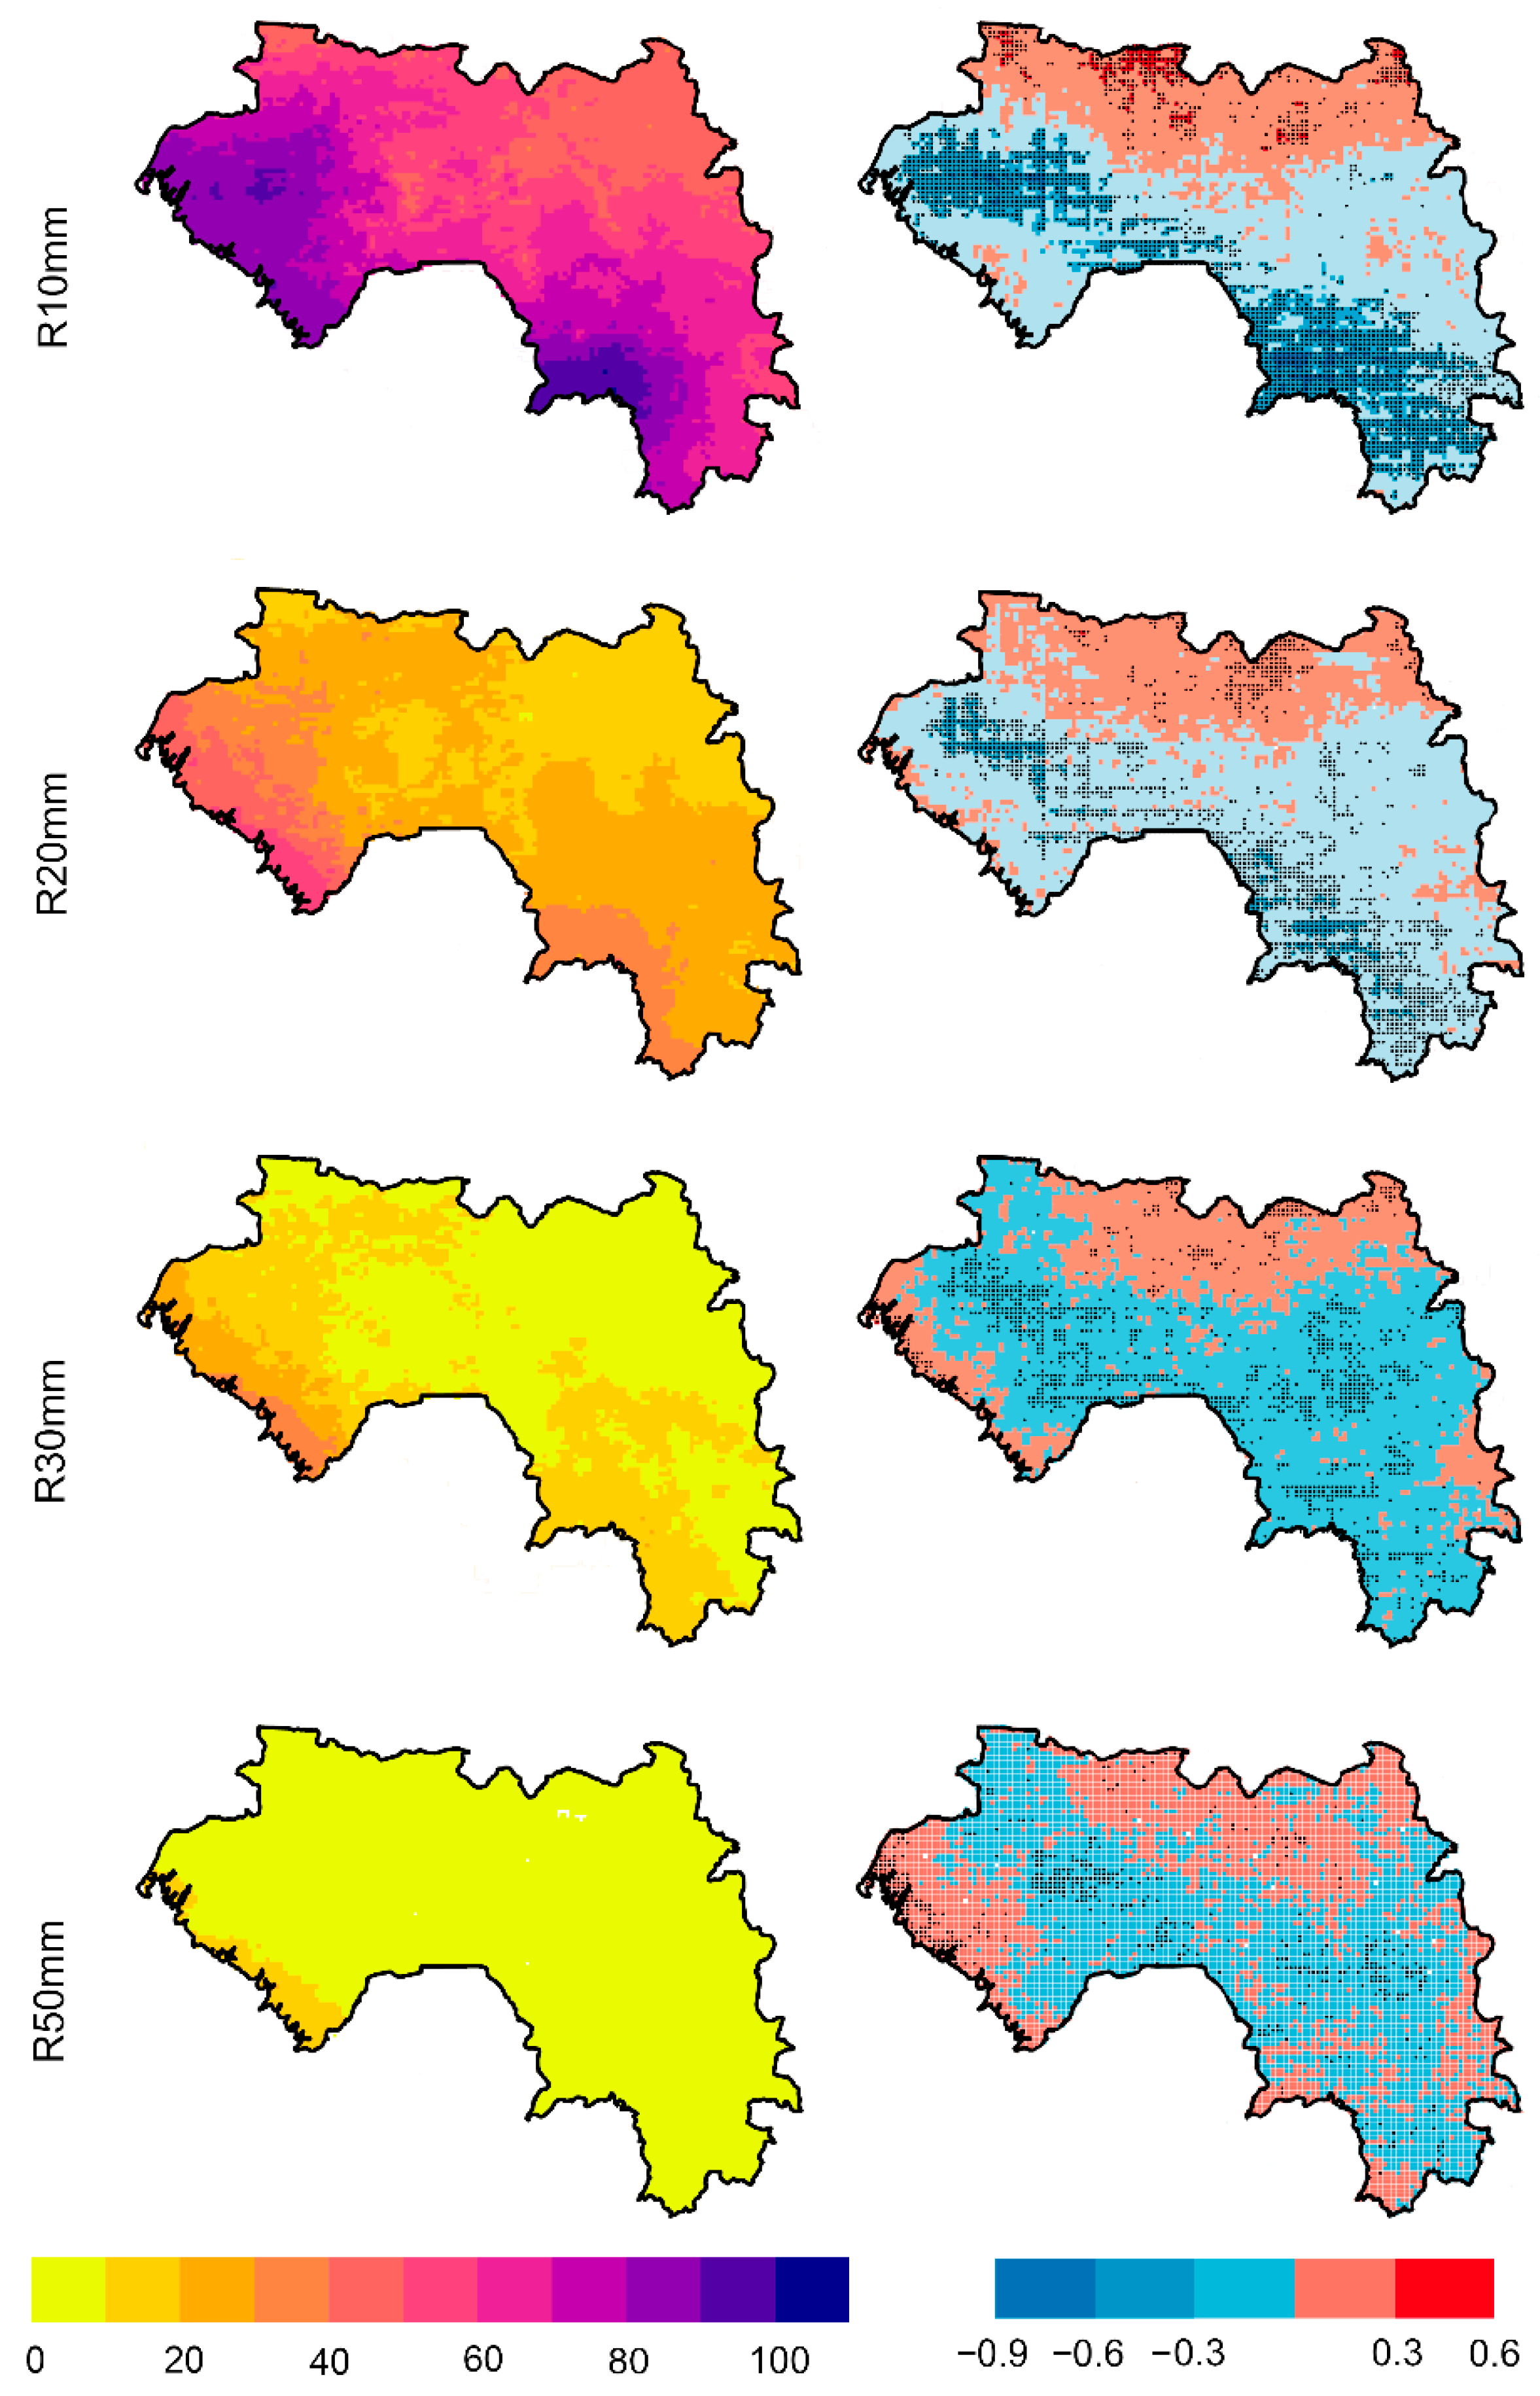
The distribution of precipitation indices based on absolute thresholds (R10mm, R20mm, R30mm, and R50mm), which count the number of days with precipitation exceeding 10, 20, 30, and 50 mm respectively, shows their highest values along the Guinean coast (Figure 8). The R10mm and R20mm indices are characterized by a secondary peak region in the southeastern part of the country.
The R10mm index reaches up to 140 days per year, R20mm—50 days, and R30mm—40 days. Values of the R50mm index do not exceed 10 days per year across most of the country, with increased values (up to 20 days per year) observed in coastal areas. All indices show decreasing trends in the number of extreme precipitation days in northwestern and southeastern Guinea (Figure 8). The most pronounced reductions are observed for the more extreme thresholds (R30mm and R50mm), indicating a transformation of heavy precipitation patterns that may significantly impact water resources and agricultural systems in these regions. In contrast, the relative stability of these indices in coastal areas highlights the spatial heterogeneity of changing precipitation extremes across the country.
The results point to potential increases in flood risks in coastal zones and possible water resource challenges in mountainous regions, with important implications for adaptation planning across different parts of the country. The diverging trends between coastal and highland areas likely reflect complex interactions between monsoon dynamics and local topography under changing climatic conditions.

3.3. Regional Differences

Guinea’s territory is divided into four distinct physical-geographical regions: Lower (Coastal) Guinea, Middle Guinea, Upper Guinea, and Forest Guinea.
Lower (Coastal) Guinea forms a flat lowland plain up to 32 km wide, with elevations below 150 m above sea level. The swampy coastal strip is covered with mangrove forests, while exposed bedrock is found only near Conakry. Rivers such as the Kogon, Fatala, and Konkouré, which drain this lowland, originate in the deep valleys of the second region—Middle Guinea. Here, the sandstone Fouta Djallon massif, with peaks reaching 1200–1400 m, stretches north–south across the country. The highest point of the plateau, Mount Tamgué (1538 m), lies north of Labé. Middle Guinea is dominated by savanna landscapes, with mountain meadows in the highest areas.
East of the Fouta Djallon massif, in the plains of the upper Niger River basin, lies Upper Guinea, a savanna-covered region. Forest Guinea, located in the southeast, occupies part of the North Guinean Highlands, featuring small remnant mountain ranges. Near the Liberian border in the Nimba Mountains stands Guinea’s highest peak (1752 m). While savannas dominate this region, tropical forests persist in some areas, particularly along river valleys.
For each of these regions, a grid point from the ERA5 and CHIRPS satellite dataset was selected near a representative settlement for comparative climate analysis: Coastal Guinea—Conakry (Atlantic coast), Middle Guinea—Labé, Upper Guinea—Siguiri, and Forest Guinea—Nzérékoré (Table 3). This approach allows for an assessment of regional climate variability across Guinea’s diverse landscapes.
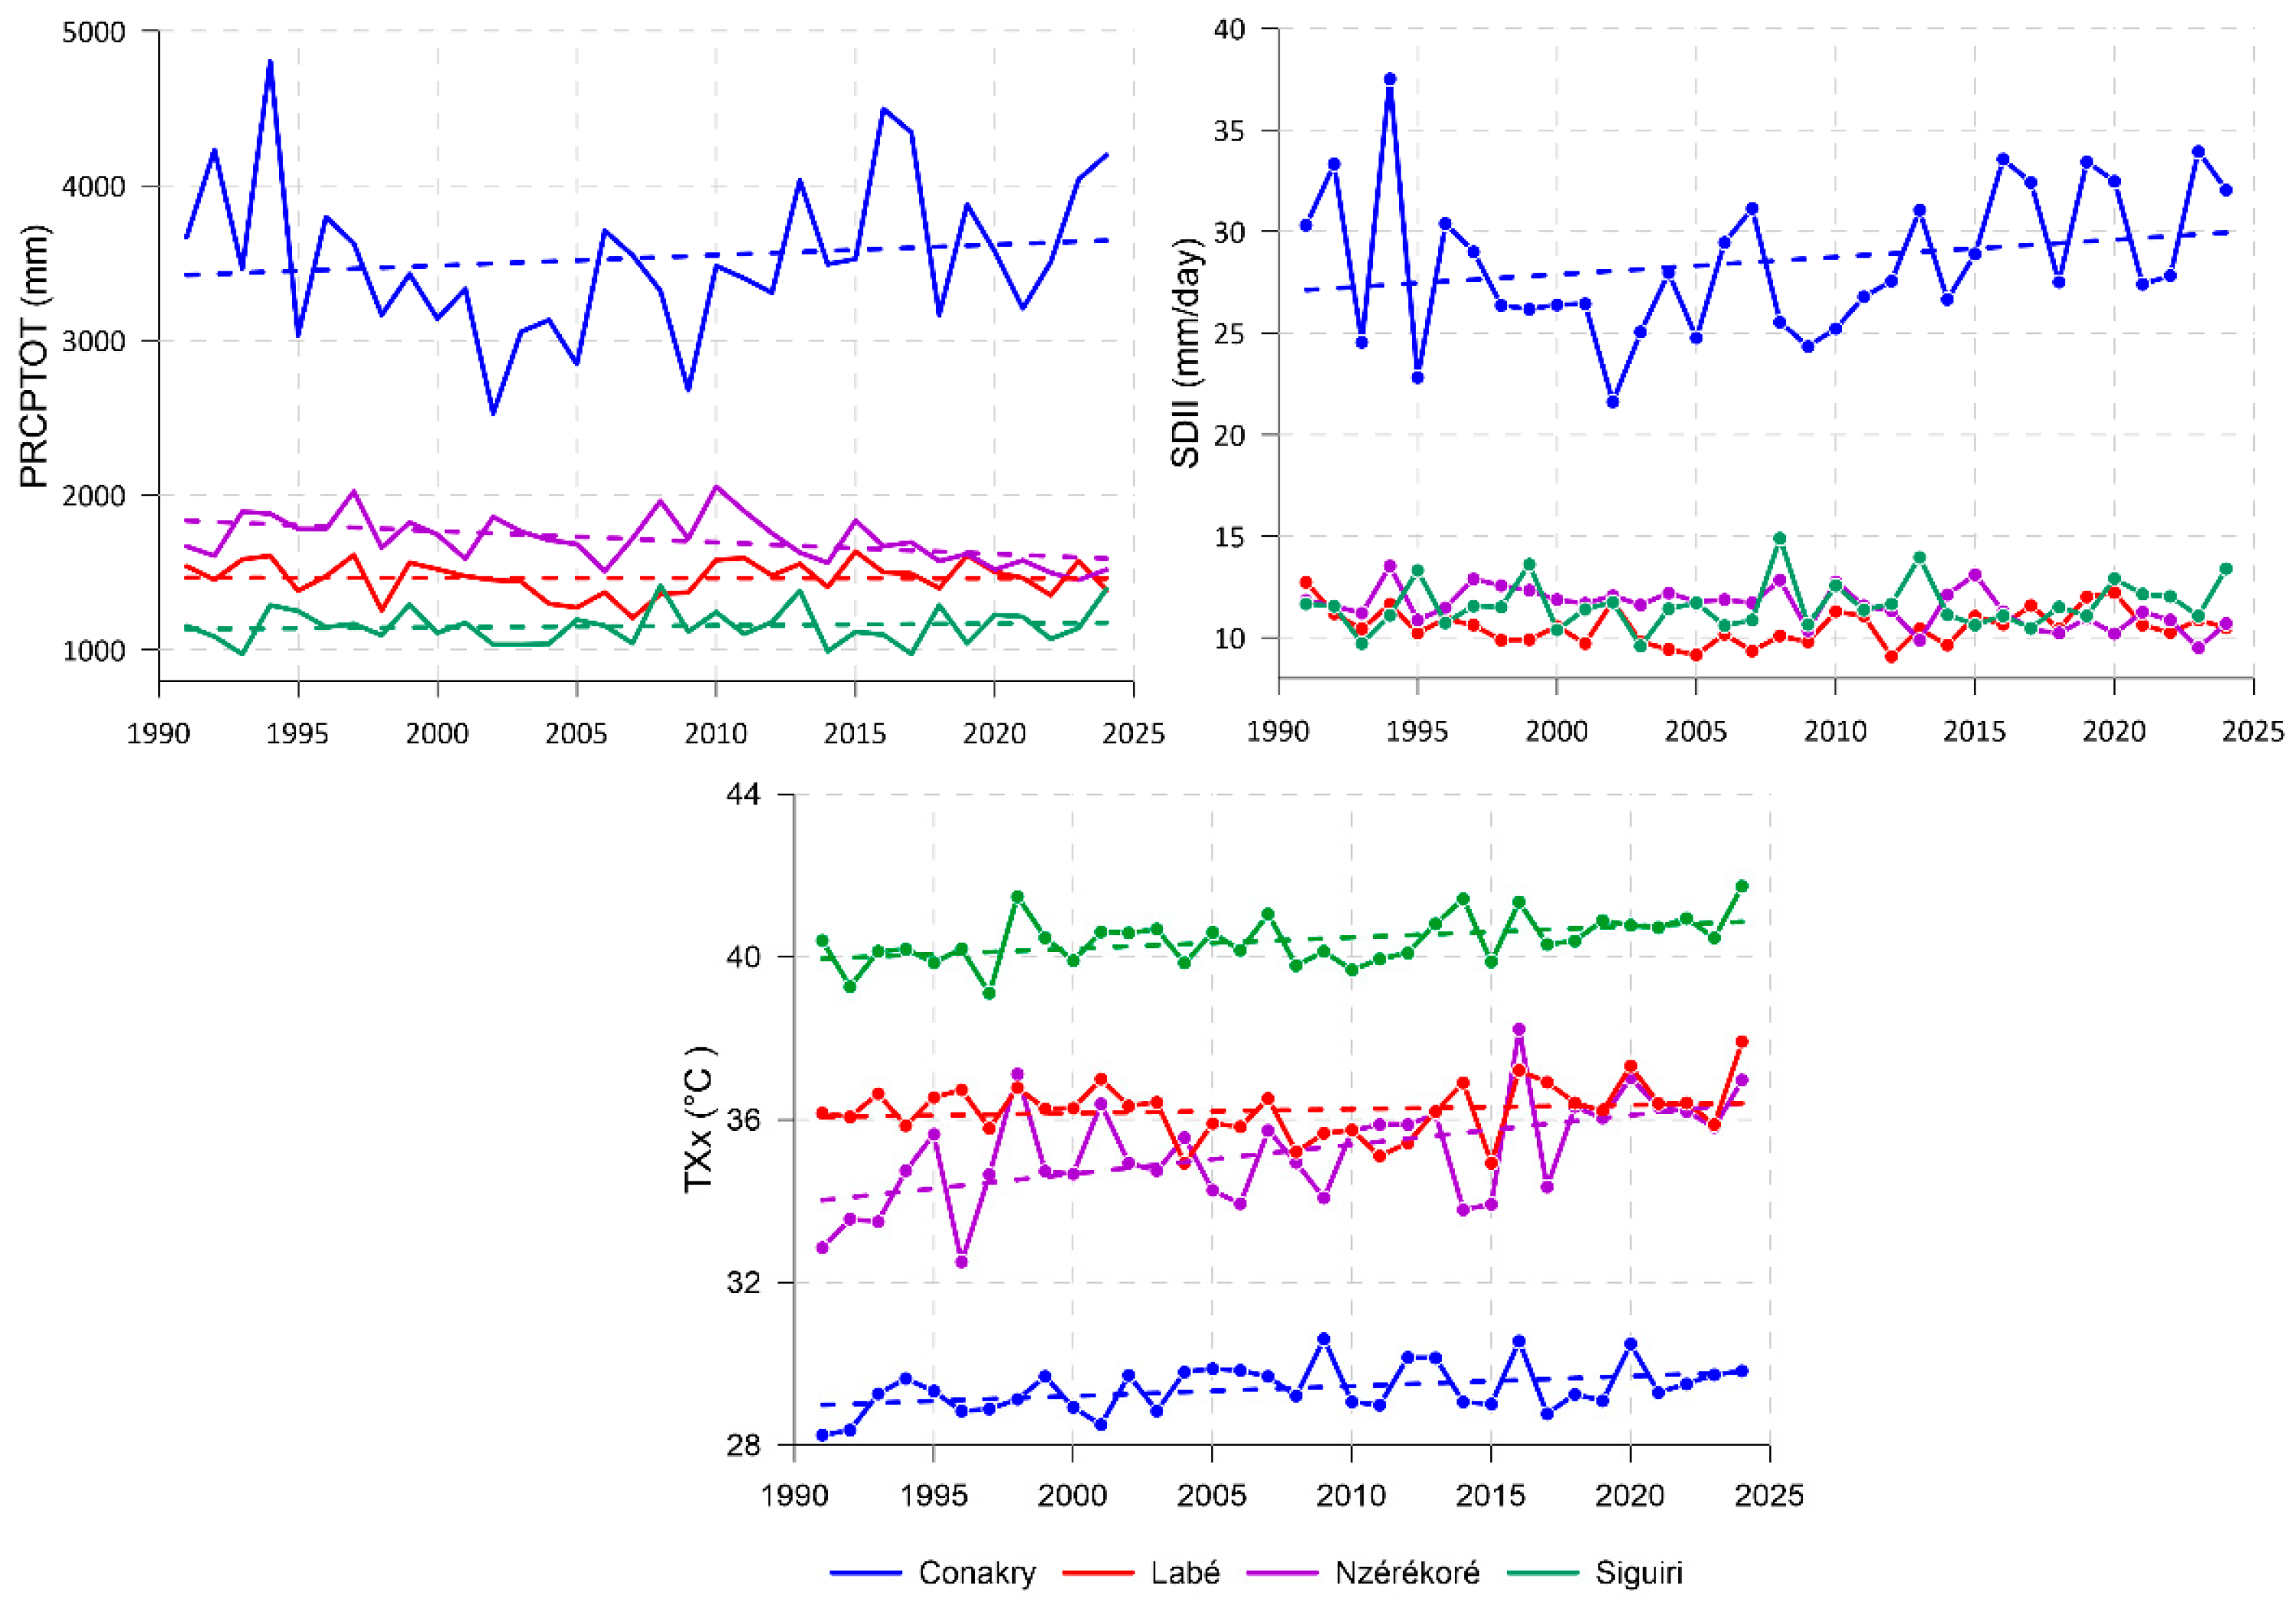
All physical-geographical regions of Guinea exhibit a consistent increase in maximum air temperatures (TXx), with Forest Guinea showing the most dramatic warming trend at 0.7 °C per decade (Figure 9, Table 4). This southeastern region simultaneously experiences concerning climatic changes: decreasing annual precipitation, reduced precipitation intensity, and fewer days with extreme precipitation (R20mm index), creating compounding stresses on its tropical forest ecosystems. Upper Guinea, represented by Siguiri, demonstrates similar temperature increases alongside modest precipitation gains, presenting particular challenges for this Sahel-adjacent region where rising heat threatens traditional pastoral livelihoods. Middle Guinea’s declining precipitation patterns endanger water security as reduced precipitation in the Fouta Djallon highlands diminishes critical river flows. Contrasting these trends, Lower Guinea faces a dual intensification—both rising temperatures and increasing precipitation intensity—which elevates flood risks in coastal areas while exacerbating urban heat island effects in cities like Conakry.
These divergent regional patterns reveal Guinea’s complex climate vulnerability landscape, where warming manifests differently across ecosystems, from threatened forests and water-stressed highlands to flood-prone coasts and heat-impacted Sahelian border zones. The spatial variability of these changes underscores the need for region-specific adaptation strategies that address distinct combinations of temperature and precipitation impacts.

3.4. Climate Change Projection for West Africa and Guinea in the 21st Century

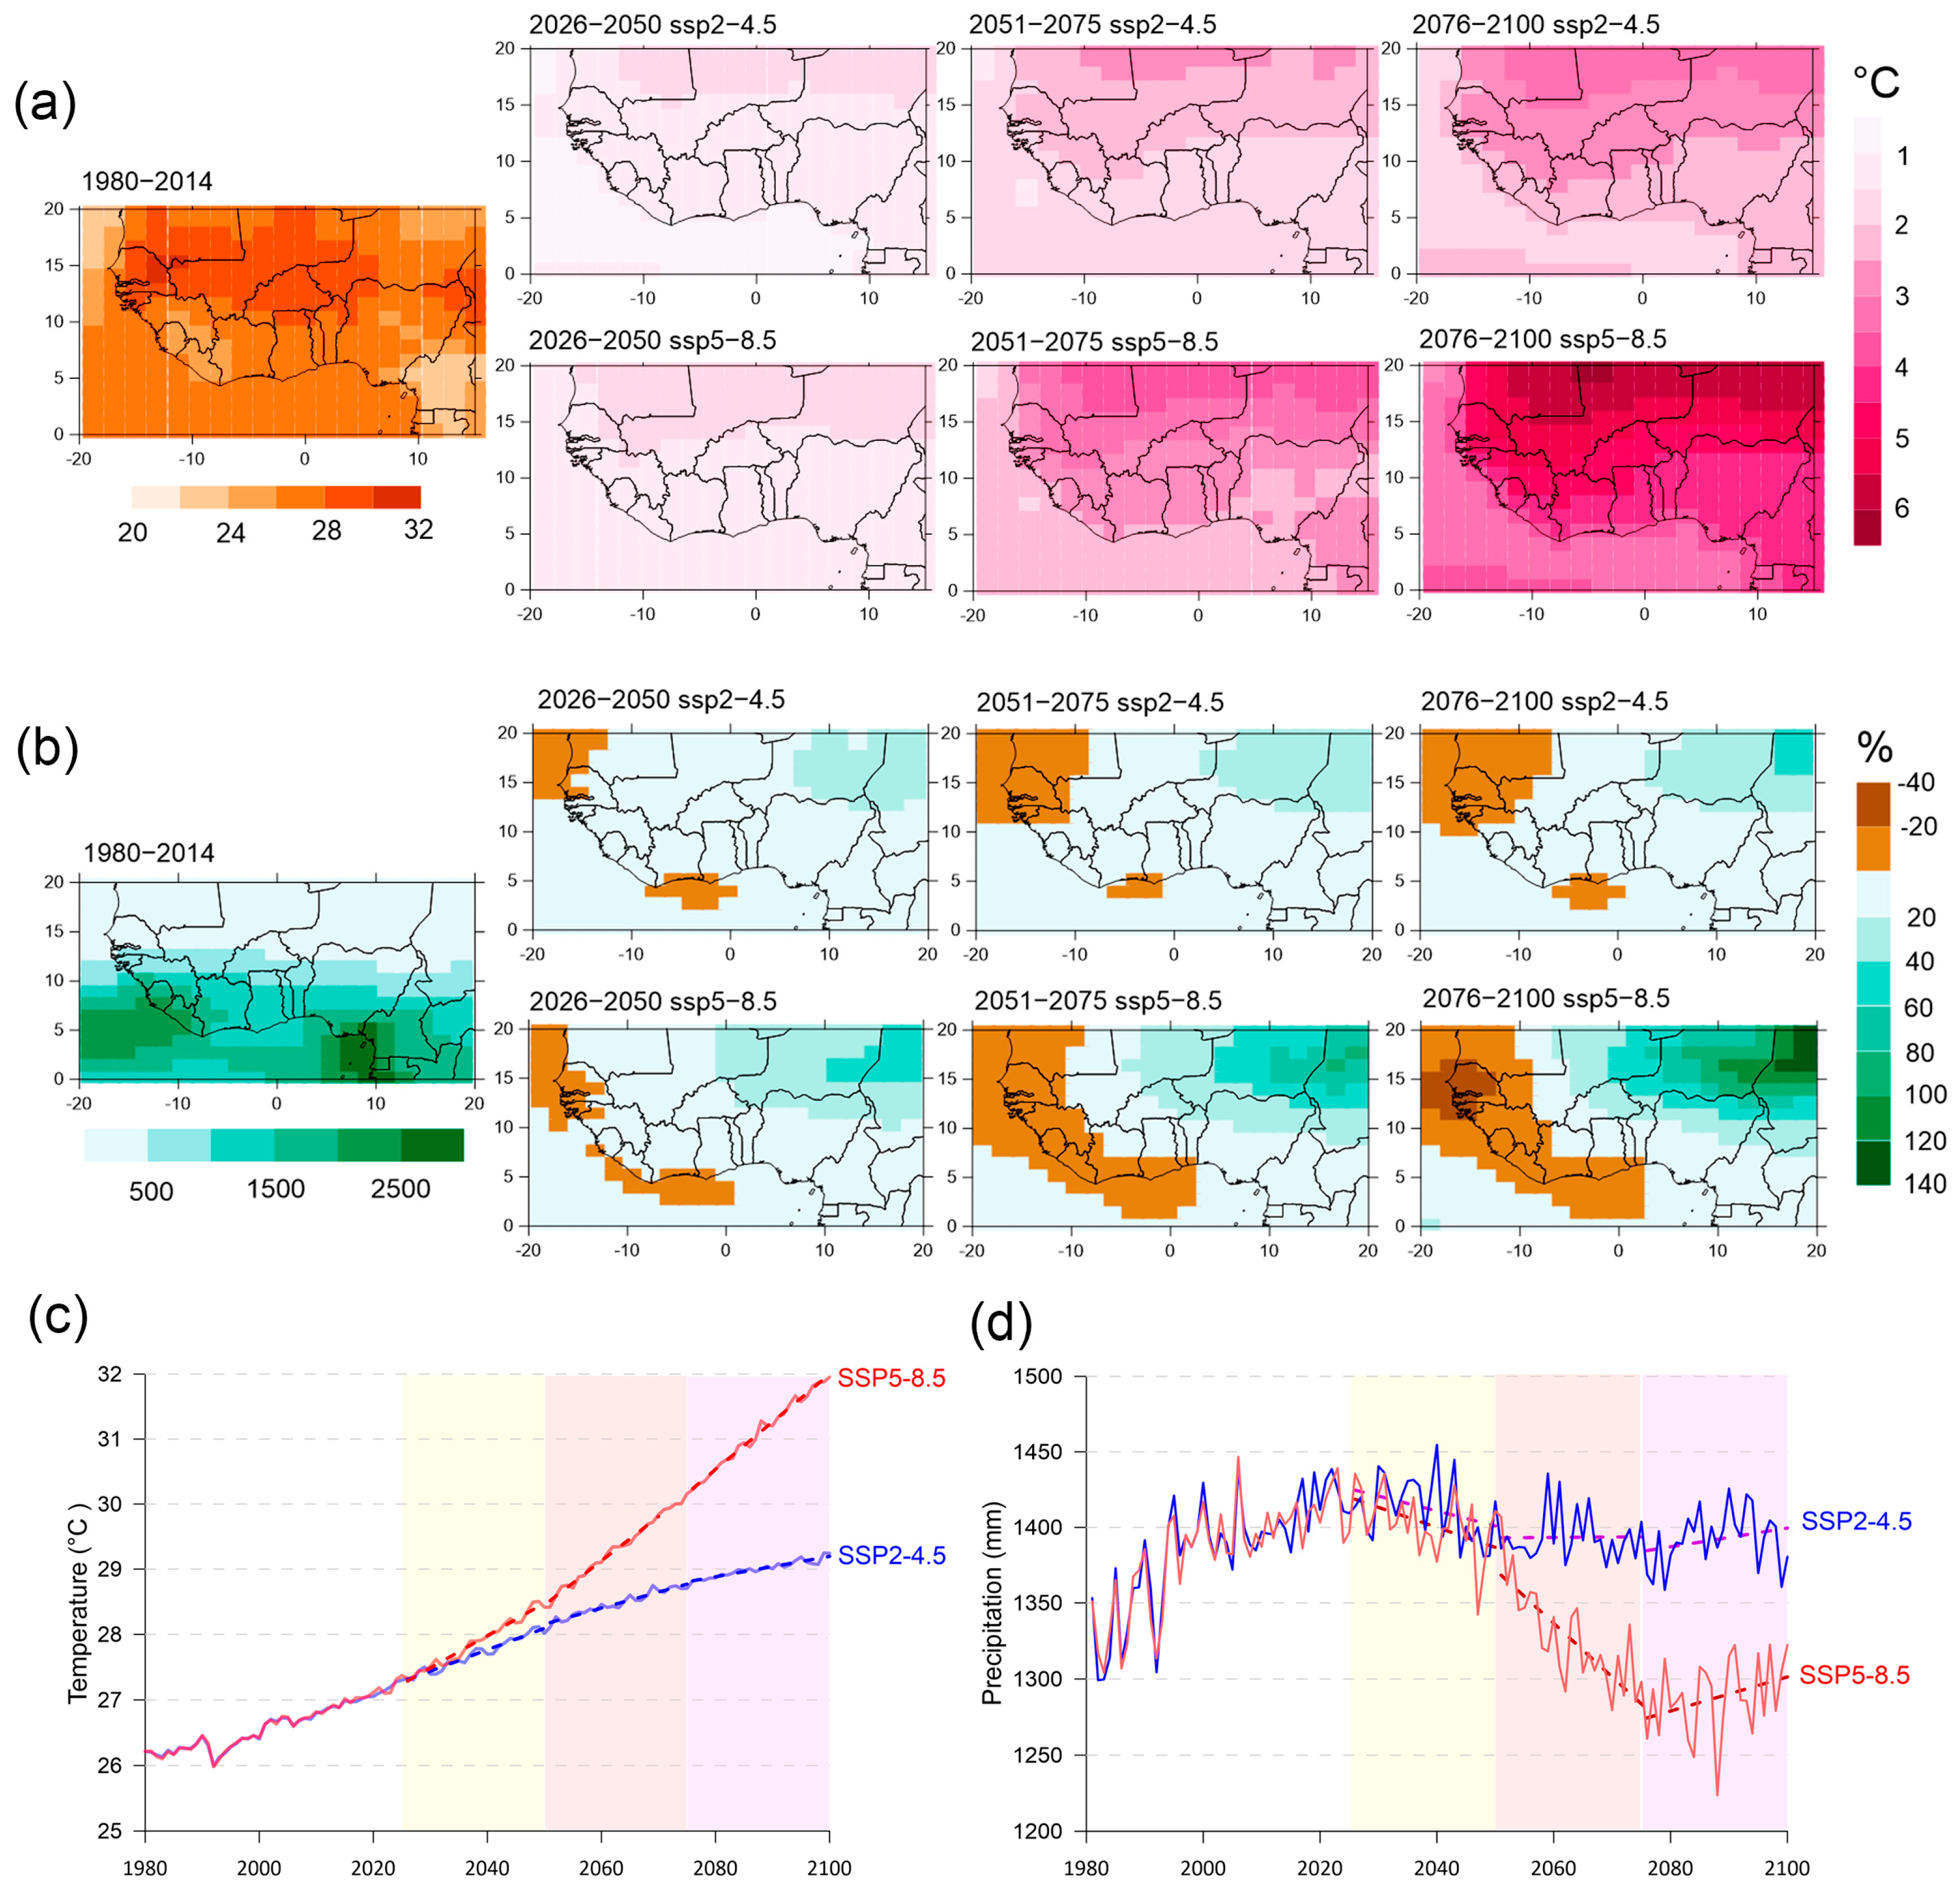
Similar to the entire African continent, West Africa is projected by global climate models to experience widespread increases in average air temperatures this century (Figure 10a). Under the moderate SSP2-4.5 scenario, temperatures are expected to rise by 1–2 °C during the near-term period (2026–2050) compared to the 1980–2014 baseline. By mid-century (2051–2075), warming is projected to intensify to 3 °C globally (2–2.5 °C for Guinea specifically), reaching 3–3.5 °C by 2100 (up to 3 °C in Guinea). The high-emission SSP5-8.5 scenario shows comparable near-term warming but dramatically diverges later, with projected increases of 4 °C globally (3.5 °C for Guinea) by 2075 and catastrophic 6.5 °C global warming (5.5 °C for Guinea) by century’s end. This nonlinear acceleration poses existential threats to regional ecosystems and socioeconomic systems, particularly through agricultural disruption, public health crises, and water scarcity. While Guinea’s proximity to the Atlantic moderates some warming compared to continental interiors, the overall projections remain alarming, especially under business-as-usual emission scenarios. The second half-century’s dramatically steeper temperature rise underscores the critical importance of near-term mitigation efforts.
While air temperature projections unanimously indicate warming throughout the 21st century, precipitation patterns show greater uncertainty (Figure 10b). Under the moderate SSP2-4.5 scenario, Guinea is projected to experience a 20% increase in annual precipitation during the near-term period (2026–2050) compared to historical levels. However, by mid-century and beyond, northern Guinea may develop a drying zone with up to 20% precipitation reduction, while most of West Africa could see precipitation increases reaching 60% above historical norms. The high-emission SSP5-8.5 scenario paints a more concerning picture for Guinea, with coastal regions—including much of the country—likely facing consistent 20–40% precipitation declines across all future periods. This divergence between scenarios highlights the critical influence of emission pathways on hydrological outcomes, particularly for coastal West Africa where Guinea’s vulnerable ecosystems and agriculture depend heavily on stable precipitation patterns. The projected precipitation increases elsewhere in West Africa under moderate emissions only underscore Guinea’s exceptional exposure to potential drying trends under higher warming scenarios.
The study analyzed nine grid points from the climate model ensemble covering Guinea, with averaged results showing long-term trends in air temperature and annual precipitation from 1981 through 2100 (Figure 10c,d). Temperature projections under different emission scenarios begin to diverge significantly starting in the late 2030s. By the end of the century, ensemble modeling indicates Guinea’s average temperature would stabilize around 29 °C under the moderate SSP2-4.5 scenario, while reaching 32 °C under the high-emission SSP5-8.5 pathway, with all three future periods (2026–2050, 2051–2075, 2076–2100) demonstrating consistent warming trends.
Precipitation patterns reveal more complex dynamics. Both scenarios show synchronous precipitation declines during the near-term period (2026–2050), but diverge markedly thereafter. The mid-century (2051–2075) sees sharp drying under SSP5-8.5 contrasted against stable precipitation in the moderate scenario. Surprisingly, late-century projections (2076–2100) indicate a precipitation recovery, particularly pronounced under the high-emission pathway. This counterintuitive wetting trend may reflect complex monsoon modifications and increased atmospheric moisture capacity under extreme warming, suggesting that thermodynamic effects may eventually override initial drying tendencies in West Africa’s tropical climate system. The growing divergence between scenarios after 2050 underscores how emission choices will critically determine Guinea’s hydrological future, with the high-emission path leading to both greater temperature extremes and more volatile precipitation shifts.

4. Discussion

Analysis of climate change in Guinea from 1991 to 2024 reveals significant shifts in temperature and precipitation patterns. A steady warming trend has been observed across the entire country, particularly pronounced in the northern and southeastern regions. The highest rate of temperature increase was recorded during the dry season (up to 0.5 °C per decade), consistent with global trends of increasing climatic continentality due to anthropogenic climate change. Extreme temperatures (TXx, TNx) have risen more sharply compared to mean temperatures, elevating the risks of heatwaves, especially in arid regions (Upper Guinea). The observed warming trends and increasing temperature extremes across Guinea, particularly the rapid rise in TXx (hottest day temperatures), are consistent with broader global patterns of heatwave intensification [92,93]. The increase in nighttime temperatures (TNn, TNx) may negatively impact agriculture by reducing the cooling period essential for certain crops. New et al. [94] found that between 1961 and 2006, West Africa experienced fewer cold days and cold nights and more warm days and warm nights. Rising minimum and maximum temperatures increase the likelihood of heatwaves, which adversely affect public health. This local manifestation can be understood within the context of large-scale climate dynamics. Analyses based on the Community Earth System Model 2—Large Ensemble (CESM2-LE) indicate that the period 1985–2014 saw a pronounced intensification of heatwaves across many regions, with strong increases in frequency, duration, and intensity across Africa [95]. This trend was largely driven by greenhouse gases and was primarily modulated by enhanced clear-sky longwave radiation, anticyclonic circulation, and increased atmospheric moisture [95]. Projections from a very high-resolution global model indicate that heatwave magnitude will increase worldwide, with a significant rise expected over Africa, South America, and Southeast Asia even at 1.5 °C of warming [92]. This global trend confirms regional projections of more frequent, longer-lasting heatwaves and a heightened risk of lethal heat stress, particularly in vulnerable regions like West Africa [33,96].
Significant regional differences in precipitation changes highlight an emerging divide between Guinea’s humid coastal areas and its drier interior, which can be attributed to the complex dynamics of the West African Monsoon (WAM). The distribution of precipitation in Guinea is directly controlled by the seasonal dynamics of the WAM, a system driven by the land–sea thermal contrast. This contrast fuels a moist southwesterly flow from the Gulf of Guinea in the lower troposphere, which converges with dry northeasterly winds from the Sahara, forming the Intertropical Front [97]. African Easterly Waves, propagating westward along the African Easterly Jet, are critical in triggering the mesoscale convective systems and squall lines that generate most monsoon rainfall [98,99]. The monsoon’s evolution is further modulated by factors like the Atlantic Cold Tongue, influencing the monsoon onset timing, and the Saharan Heat Low, affecting rainfall distribution in the Sahel [100,101]. The observed spatial patterns of precipitation change are likely linked to modifications in these atmospheric processes. On the coast, the detected increase in precipitation intensity (SDII, +0.9 mm/year per decade) and annual totals (+67.8 mm per decade) aligns with a “wet-get-wetter” pattern. A warmer atmosphere, with its increased moisture-holding capacity (Clausius-Clapeyron relationship), favors more intense rainfall events over the warm Atlantic Ocean [102]. This thermodynamic effect may be compounded by dynamical changes, such as a potential strengthening of the monsoon flow or a delayed monsoon retreat [23], which would concentrate more moisture along the coastal zone, thereby elevating flood risks. Conversely, the drying trend in the mountainous interior (Fouta Djallon, Nimba) and Forest Guinea suggests that increased atmospheric stability, a reduced inland penetration of moisture-laden winds, or a shift in the primary focus of convective activity may be suppressing orographic rainfall. This trend threatens the hydrological regime of major West African rivers that originate in these highlands. Nationally, the pattern of fewer rainy days (R10mm, R20mm) coupled with more intense rainfall indicates a shift towards a more extreme hydrological cycle, consistent with broader West African trends [24,103,104]. This restructuring of precipitation regimes, characterized by longer dry spells punctuated by heavy downpours, poses a significant threat to water security, traditional pastoralism in the north, and agricultural planning across the country.
Overall, the trends in climate change parameters considered show that the overall picture reflects regional differences in climate change in Lower (Maritime), Upper, Middle and Forest Guinea, and it is important to understand these differences when assessing climate risks and, accordingly, environmental impacts for these regions. Forest Guinea turned out to be the most vulnerable region: a combination of warming and reduced precipitation threatens tropical forests and biodiversity. In Middle Guinea, reduced precipitation threatens water supply, as this is where key rivers (Niger, Senegal, Gambia) originate. In Lower Guinea, increased precipitation and its intensity increase the risks of floods and soil erosion.
Under both scenarios (SSP2-4.5 and SSP5-8.5), further warming is expected, reaching +3 °C (SSP2-4.5) and +5.5 °C (SSP5-8.5) by 2100. Precipitation shows ambiguous trends: under the moderate scenario (SSP2-4.5), a slight increase is possible in the first half of the century, but with increasing aridity in the north. Under the extreme scenario (SSP5-8.5), a sharp decline in precipitation is likely in the second half of the century, particularly in coastal areas. These findings align with previous studies [96,105,106]. Almazroui et al. [105], using the CMIP6 model ensemble, projected an increase in mean air temperature across West Africa under three emission scenarios (SSP1-2.6, SSP2-4.5, and SSP5-8.5) in both the near and long term, while precipitation is expected to decrease by 7–57%, depending on the scenario. In addition, an increase in the frequency of heat waves is predicted [105]. Projections of monthly and seasonal precipitation sums by the end of the 21st century, based on regional model ensembles, indicate a predominant decline across most of West Africa at different stages of the West African monsoon cycle, with the most severe and prolonged droughts occurring during the pre-monsoon and early monsoon phases [106]. Diedhiou et al. [96] using the CMIP5 model ensemble under two RCP scenarios, found the most intense warming in the Sahel region (which includes northwestern Guinea), along with an increase in the duration of dry periods. The results of the study Odunmorayo et al. [107] indicate a marked increase in the frequency, duration and intensity of heat waves under high emission scenarios (SSP2-4.5 and SSP5-8.5), especially in the long term. Negative trends in Consecutive Dry Days (CDD) were observed in our historical analysis (1991–2024) for northwestern Guinea, and this trend is likely to persist in the future.
Thus, in the 21st century, West Africa, including Guinea, will face inevitable temperature increases, while precipitation changes will depend on the chosen anthropogenic forcing scenario. The obtained results provide a foundation for proposing specific adaptation and mitigation measures tailored to the distinct regional vulnerabilities of Guinea. Adaptation strategies, essential for coping with unavoidable changes, must be spatially differentiated. In Coastal Guinea, the trends of increasing precipitation intensity and heightened flood risk necessitate a focus on enhancing early warning systems for floods and developing green infrastructure, such as restoring mangrove forests and creating buffer zones, to protect the coastline. Furthermore, the introduction of waterlogging-tolerant crops and a revision of urban planning norms in cities like Conakry are critical to manage inundation risks. For Middle Guinea, where declining precipitation threatens the region’s status as a vital water source, the priority should be on safeguarding water resources. This can be achieved through restoring forest cover on watersheds to improve water infiltration, promoting water-saving irrigation technologies in agriculture, and constructing or modernizing small reservoirs to capture rainfall. Additionally, diversifying energy sources is imperative to reduce reliance on hydropower, which is becoming less predictable. In Upper Guinea and Forest Guinea, which face rising temperatures and increasing aridity or decreasing rainfall, the focus should shift to agricultural and ecosystem resilience. Key measures include introducing drought-tolerant and heat-resistant crop varieties, promoting agroforestry to conserve soil moisture and biodiversity, and implementing traditional soil and water conservation techniques like terracing and mulching.

5. Conclusions

The paper presents a detailed analysis of the current (1991–2024) and future (until the end of the 21st century) climate trends in Guinea. The integrated approach, combining ERA5 reanalysis and CHIRPS satellite data, provided a high-resolution assessment of climate trends despite Guinea’s sparse weather station network. The application of standardized ETCCDIs enabled the quantification of not only mean changes but also the dynamics of extreme events, which is critical for climate risk assessment. The application of absolute threshold indices enabled a quantitative assessment of regional differences between the coast and the interior, using country-wide consistent thresholds, which effectively highlighted the distinct spatial gradient. The use of a CMIP6 model ensemble under two scenarios (SSP2-4.5 and SSP5-8.5) established a robust foundation for future climate projections. The spatial analysis, which divided the country into four distinct physiographic regions, revealed substantial differentiation in climate change across the territory, thereby providing a scientific basis for developing targeted adaptation measures.
Spatially heterogeneous trends were identified across Guinea. An increase in precipitation was observed on the coast (up to +200 mm/decade), while a decrease was detected in the mountainous areas (up to –250 mm/decade). The most significant warming was found in the southern and eastern regions (up to +0.9 °C/decade for TXx), whereas the coastal zone exhibited a slower rate of temperature increase. The analysis showed that maximum daily temperatures (TXx) are rising faster than minimum temperatures (TNn), which increases the risks of heatwaves, particularly in arid regions (Upper Guinea).
An increase in precipitation intensity occurred on the coast, concurrent with a decrease in the number of rainy days inland. The reduction in precipitation in the mountainous regions (Fouta Djallon) directly threatens the water discharge of major West African rivers (the Niger, Senegal, and Gambia), which is of transboundary significance.
The territory was divided into four unique regions (Coastal, Middle, Upper, and Forest Guinea), with a detailed analysis conducted for representative points (Conakry, Siguri, Labé, and Nzérékoré). The obtained results highlight the distinct vulnerability of each region to climate change and underscore the necessity for region-specific adaptation measures. These include flood and erosion protection for the coast, water conservation and forest restoration for the mountainous areas, and sustainable land use and irrigation for the savannah regions.
CMIP6 ensemble projections for the SSP2-4.5 and SSP5-8.5 scenarios show temperature trends diverging after the 2030s, leading to a warming of +3 °C and +5.5 °C by 2100, respectively. Precipitation forecasts are uncertain, suggesting a possible wetting trend in the early century, but a subsequent drying, particularly in northern and coastal areas under the high-emission SSP5-8.5 scenario.
Despite its comprehensive approach, this study has limitations primarily related to model data. The spatial resolution of CMIP6 models is insufficient to capture Guinea’s complex topography, potentially smoothing local climate extremes and reducing projection accuracy, particularly for mountainous regions. Precipitation projections show the greatest uncertainty, as models struggle to reproduce West African Monsoon dynamics and mesoscale convective processes crucial for Guinea’s rainfall patterns. Additional limitations include simplified representation of land-use changes in CMIP6 models, which could affect local climate patterns, and potential reduced accuracy of validation data in Guinea’s data-sparse mountainous areas. This study focused on the most robust estimate provided by the ensemble mean. However, for a more comprehensive assessment of uncertainties, future work should analyze not only the ensemble mean but also its spread, and aim to refine regional climate models, especially in mountainous areas where the most dramatic changes are observed. Thus, Guinea, like many countries in West Africa, faces serious climate challenges in 21st century.

Author Contributions

Conceptualization, E.V.V. and R.V.G.; methodology, E.V.V.; formal analysis, E.V.V. and P.V.D.; investigation, E.V.V.; data curation, E.V.V.; writing—original draft preparation, E.V.V.; writing—review and editing, E.V.V. and R.V.G.; visualization, E.V.V. and P.V.D.; project administration, R.V.G.; funding acquisition, R.V.G. All authors have read and agreed to the published version of the manuscript.

Funding

This work was carried out within the framework of IBSS state research assignment “Studying the features of the functioning and dynamics of subtropical and tropical coastal ecosystems under the climate change and anthropogenic load using remote sensing, cloud information processing, and machine learning to create a scientific basis for their rational use”, registration number: 124030100030-0.

Data Availability Statement

The ERA5 reanalysis data are freely available from the Copernicus Climate Data Store [https://climate.copernicus.eu/climate-reanalysis, accessed on 10 June 2025]. The CHIRPS dataset are freely available from the Climate Hazards Center [https://www.chc.ucsb.edu/data/chirps3, accessed on 10 July 2025]. The ensemble model simulation data were obtained from the Climate Explorer website [https://climexp.knmi.nl/start.cgi, accessed on 28 July 2025].

Conflicts of Interest

The authors declare no conflicts of interest.

References

  1. Hartmann, D.L.; Klein Tank, A.M.G.; Rusticucci, M. Observations: Atmosphere and Surface, in The Physical Science Basis; Stocker, T.F., Qin, D., Plattner, G.K., Tignor, M.M.M.B., Allen, S.K., Boschung, J., Eds.; Contribution of Working Group I to the Fifth Assessment Report of the Intergovernmental Panel on Climate Change; Cambridge University Press: Cambridge, UK, 2013; pp. 159–254. [Google Scholar]
  2. Coumou, D.; Rahmstorf, S. A decade of weather extremes. Nat. Clim. Change 2012, 2, 491–496. [Google Scholar] [CrossRef]
  3. IPCC. Climate Change 2021: The Physical Science Basis; Masson-Delmotte, V., Zhai, P., Pirani, A., Connors, S.L., Péan, C., Berger, S., Caud, N., Chen, Y., Goldfarb, L., Gomis, M.I., et al., Eds.; Contribution of Working Group I to the Sixth Assessment Report of the Intergovernmental Panel on Climate Change; Cambridge University Press: Cambridge, UK; New York, NY, USA, 2021; p. 2391. [Google Scholar] [CrossRef]
  4. Donat, M.G.; Alexander, L.V.; Yang, H.; Durre, I.; Vose, R.; Caesar, J. Global land-based datasets for monitoring climatic extremes. Bull. Am. Meteorol. Soc. 2013, 94, 997–1006. [Google Scholar] [CrossRef]
  5. Niang, I.; Ruppel, O.C. Climate Change 2014: Impacts, Adaptation, and Vulnerability; Barros, V.R., Field, C.B., Dokken, D.J., Mastrandrea, M.D., Mach, K.J., Bilir, T.E., Chatterjee, M., Ebi, K.L., Estrada, Y.O., Genova, R.C., et al., Eds.; Part B: Regional Aspects. Contribution of Working Group II to the Fifth Assessment Report of the Intergovernmental Panel on Climate Change; Cambridge University Press: Cambridge, UK; New York, NY, USA, 2014; pp. 1199–1265. [Google Scholar] [CrossRef]
  6. Hoerling, M.; Hurrell, J.; Eischeid, J.; Phillips, A. Detection and Attribution of Twentieth-Century Northern and Southern African Rainfall Change. J. Clim. 2006, 19, 3989–4008. [Google Scholar] [CrossRef]
  7. Min, S.-K.; Hense, A. A Bayesian Assessment of Climate Change Using Multimodel Ensembles. Part II: Regional and Seasonal Mean Surface Temperatures. J. Clim. 2007, 12, 2769–2790. [Google Scholar] [CrossRef]
  8. Stott, P.A.; Gillett, N.P.; Hegerl, G.C.; Karoly, D.J.; Stone, D.A.; Zhang, X.; Zwiers, F. Detection and attribution of climate change: A regional perspective WIREs. Clim. Change 2010, 1, 192–211. [Google Scholar] [CrossRef]
  9. Stott, P.A.; Christidis, N.; Betts, R.A. Changing return periods of weather-related impacts: The attribution challenge. Clim. Change 2011, 109, 263–268. [Google Scholar] [CrossRef]
  10. Fontaine, B.; Janicot, S.; Monerie, P.-A. Recent changes in air temperature, heat waves occurrences, and atmospheric circulation in Northern Africa. J. Geophys. Res. Atmos. 2013, 118, 8536–8552. [Google Scholar] [CrossRef]
  11. Lennard, C.J.; Nikulin, G.; Dosio, A.; Moufouma-Okia, W. On the need for regional climate information over Africa under varying levels of global warming. Environ. Res. Lett. 2018, 13, 060401. [Google Scholar] [CrossRef]
  12. Nikulin, G.; Lennard, C.; Dosio, A.; Kjellström, E.; Chen, Y.; Hänsler, A.; Kupiainen, M.; Laprise, R.; Mariotti, L.; Maule, C.F.; et al. The effects of 1.5 and 2 degrees of global warming on Africa in the CORDEX ensemble. Environ. Res. Lett. 2018, 13, 065003. [Google Scholar] [CrossRef]
  13. Nicholson, S.E.; Nash, D.J.; Chase, B.M.; Grab, S.W.; Shanahan, T.M.; Verschuren, D.; Asrat, A.; Lézine, A.-M.; Umer, M. Temperature variability over Africa during the last 2000 years. Holocene 2013, 23, 1085–1094. [Google Scholar] [CrossRef]
  14. Sylla, M.B.; Nikiema, P.M.; Gibba, P.; Kebe, I.; Klutse, N.A.B. Climate Change over West Africa: Recent Trends and Future Projections. In Adaptation to Climate Change and Variability in Rural West Africa; Yaro, J., Hesselberg, J., Eds.; Springer: Cham, Switzerland, 2016; pp. 25–40. [Google Scholar] [CrossRef]
  15. Nooni, I.K.; Ogou, F.K.; Saidou Chaibou, A.A.; Fianko, S.K.; Atta-Darkwa, T.; Prempeh, N.A. Relative Humidity and Air Temperature Characteristics and Their Drivers in Africa Tropics. Atmosphere 2025, 16, 828. [Google Scholar] [CrossRef]
  16. Ly, M.; Traore, S.B.; Alhassane, A.; Sarr, B. Evolution of some observed climate extremes in the West African Sahel. Weather Clim. Extrem. 2013, 1, 19–25. [Google Scholar] [CrossRef]
  17. Ringard, J.; Dieppois, B.; Rome, S.; Diedhiou, A.; Pellarin, T.; Konaré, A.; Diawara, A.; Konaté, D.; Dje, B.K.; Katiellou, G.L.; et al. The intensification of thermal extremes in west Africa. Glob. Planet. Change 2016, 139, 66–77. [Google Scholar] [CrossRef]
  18. Aguilar, E.; Aziz Barry, A.; Brunet, M.; Ekang, L.; Fernandes, A.; Massoukina, M.; Mbah, J.; Mhanda, A.; do Nascimento, D.J.; Peterson, T.C.; et al. Changes in temperature and precipitation extremes in western central Africa, Guinea Conakry, and Zimbabwe, 1955–2006. J. Geop. Res. 2009, 114, D02115. [Google Scholar] [CrossRef]
  19. Moron, V.; Oueslati, B.; Pohl, B.; Rome, S.; Janicot, S. Trends of mean temperatures and warm extremes in northern tropical Africa (1961–2014) from observed and PPCA-reconstructed time series. J. Geophys. Res. Atmos. 2016, 121, 5298–5319. [Google Scholar] [CrossRef]
  20. Losada, T.B.; Rodríguez-Fonseca, I.P.; Janicot, S.; Gervois, S.; Chauvin, F.; Ruti, P. Tropical response to the Atlantic Equatorial mode: AGCM multimodel approach. Clim. Dyn. 2010, 35, 45–52. [Google Scholar] [CrossRef]
  21. Alahacoon, N.; Edirisinghe, M.; Simwanda, M.; Perera, E.; Nyirenda, V.R.; Ranagalage, M. Rainfall Variability and Trends over the African Continent Using TAMSAT Data (1983–2020): Towards Climate Change Resilience and Adaptation. Remote Sens. 2022, 14, 96. [Google Scholar] [CrossRef]
  22. Christensen, J.H.; Kanikicharla, K.K. Climate Phenomena and their Relevance for Future Regional Climate Change. In Climate Change 2013: The Physical Science Basis; Stocker, T.F., Qin, D., Plattner, G.-K., Tignor, M., Allen, S.K., Boschung, J., Nauels, A., Xia, Y., Bex, V., Midgley, P.M., Eds.; Contribution of Working Group I to the Fifth Assessment Report of the Intergovernmental Panel on Climate Change; Cambridge University Press: Cambridge, UK; New York, NY, USA, 2014; pp. 1217–1308. [Google Scholar] [CrossRef]
  23. Sanogo, S.; Fink, A.H.; Omotosho, J.A.; Ba, A.; Redl, R.; Ermert, V. Spatio-Temporal Characteristics of the Recent Rainfall Recovery in West Africa. Int. J. Climatol. 2015, 35, 4589–4605. [Google Scholar] [CrossRef]
  24. Panthou, G.; Vischel, T.; Lebel, T. Recent trends in the regime of extreme rainfall in the Central Sahel. Int. J. Climatol. 2014, 34, 3998–4006. [Google Scholar] [CrossRef]
  25. Mora, C.; Frazier, A.G.; Longman, R.J.; Dacks, R.S.; Walton, M.M.; Tong, E.J.; Sanchez, J.J.; Kaiser, L.R.; Stender, Y.O.; Anderson, J.M.; et al. The projected timing of climate departure from recent variability. Nature 2013, 502, 183–187. [Google Scholar] [CrossRef] [PubMed]
  26. Klutse, N.A.B.; Ajayi, V.O.; Gbobaniyi, E.O.; Egbebiyi, T.S.; Kouadio, K.; Nkrumah, F.; Quagraine, K.A.; Olusegun, C.; Diasso, U.; Abiodun, B.J.; et al. Potential impact of 1.5 °C and 2 °C global warming on consecutive dry and wet days over West Africa. Environ. Res. Lett. 2018, 13, 055013. [Google Scholar] [CrossRef]
  27. Basse, J.; Camara, M.; Diba, I.; Diedhiou, A. Projected Changes in Dry and Wet Spells over West Africa during Monsoon Season Using Markov Chain Approach. Climate 2024, 12, 211. [Google Scholar] [CrossRef]
  28. Arowolo, A.V.; Odunmorayo, M.T.; Okeyode, I.A.; Raji, I.A.; Ibukun, B.; Tella, I.A. Exploring Added Value of NASA NEX-GDDP High Resolution Model in Simulating West Africa Present and Future Climate. Earth Syst. Environ. 2025, 9, 1–24. [Google Scholar] [CrossRef]
  29. Kebe, I.; Diallo, I.; Sylla, M.B.; De Sales, F.; Diedhiou, A. Late 21st Century Projected Changes in the Relationship between Precipitation, African Easterly Jet, and African Easterly Waves. Atmosphere 2020, 11, 353. [Google Scholar] [CrossRef]
  30. Dosio, A.; Jones, R.G.; Jack, C.; Lennard, C.; Nikulin, G.; Hewitson, B. What can we know about future precipitation in Africa? Robustness, significance and added value of projections from a large ensemble of regional climate models. Clim. Dyn. 2019, 53, 5833–5858. [Google Scholar] [CrossRef]
  31. Parker, D.J.; Diop-Kane, M.; Lafore, J.-P. Météorologie de l’AFRIQUE de l’ouest Tropicale: Le Manuel du Prévisionniste; EDP Sciences: Les Ulis, France, 2018; p. 756. [Google Scholar]
  32. De Longueville, F.; Ozer, P.; Gemenne, F.; Henry, S.; Mertz, O.; Nielsen, J.Ø. Comparing climate change perceptions and meteorological data in rural West Africa to improve the understanding of household decisions to migrate. Clim. Change 2020, 160, 123–141. [Google Scholar] [CrossRef]
  33. Sylla, M.B.; Pal, J.S.; Faye, A.; Dimobe, K.; Kunstmann, H. Climate change to severely impact West African basin scale irrigation in 2  °C and 1.5  °C global warming scenarios. Sci. Rep. 2018, 8, 14395. [Google Scholar] [CrossRef]
  34. Sultan, B.; Gaetani, M. Agriculture in West Africa in the Twenty-First Century: Climate Change and Impacts Scenarios, and Potential for Adaptation. Front. Plant Sci. 2016, 7, 1262. [Google Scholar] [CrossRef]
  35. Sultan, B.; Roudier, P.; Quirion, P.; Alhassane, A.; Muller, B.; Dingkuhn, M.; Ciais, P.; Guimberteau, M.; Traore, S.; Baron, S. Assessing climate change impacts on sorghum and millet yields in the Sudanian and Sahelian savannas of West Africa. Environ. Res. Lett. 2013, 8, 014040. [Google Scholar] [CrossRef]
  36. Challinor, A.J.; Watson, J.; Lobell, D.B.; Howden, S.M.; Smith, D.R.; Chhetri, N. A meta-analysis of crop yield under climate change and adaptation. Nat. Clim. Change 2014, 4, 287–291. [Google Scholar] [CrossRef]
  37. Deryng, D.; Sacks, W.J.; Barford, C.C.; Ramankutty, N. Simulating the effects of climate and agricultural management practices on global crop yield. Glob. Biogeochem. Cycles 2011, 25, GB2006. [Google Scholar] [CrossRef]
  38. Gbode, I.E.; Diro, G.T.; Intsiful, J.D.; Dudhia, J. Current Conditions and Projected Changes in Crop Water Demand, Irrigation Requirement, and Water Availability over West Africa. Atmosphere 2022, 13, 1155. [Google Scholar] [CrossRef]
  39. Boko, B.A.; Konaté, M.; Yalo, N.; Berg, S.J.; Erler, A.R.; Bazié, P.; Hwang, H.-T.; Seidou, O.; Niandou, A.S.; Schimmel, K.; et al. High-Resolution, Integrated Hydrological Modeling of Climate Change Impacts on a Semi-Arid Urban Watershed in Niamey, Niger. Water 2020, 12, 364. [Google Scholar] [CrossRef]
  40. Ngoungue Langue, C.G.; Lavaysse, C.; Vrac, M.; Flamant, C. Heat wave monitoring over West African cities: Uncertainties, characterization and recent trends. Nat. Hazards Earth Syst. Sci. 2023, 23, 1313–1333. [Google Scholar] [CrossRef]
  41. Sintayehu Dejene, W. Impact of climate change on biodiversity and associated key ecosystem services in Africa: A systematic review. Ecosyst. Health Sustain. 2018, 4, 225–239. [Google Scholar] [CrossRef]
  42. Largeron, Y.; Guichard, F.; Roehrig, R.; Couvreux, F.; Barbier, J. The April 2010 North African heatwave: When the water vapor greenhouse effect drives nighttime temperatures. Clim. Dyn. 2020, 54, 3879–3905. [Google Scholar] [CrossRef]
  43. Watts, N.; Amann, M.; Arnell, N.; Ayeb-Karlsson, S.; Beagley, J.; Belesova, K.; Boykoff, M.; Byass, P.; Cai, W.; Campbell-Lendrum, D.; et al. The 2020 report of The Lancet Countdown on health and climate change: Responding to converging crises. Lancet 2021, 397, 129–170. [Google Scholar] [CrossRef]
  44. European Space Agency. Copernicus Global Digital Elevation Model. Distributed by OpenTopography. 2025. Available online: https://portal.opentopography.org/datasetMetadata?otCollectionID=OT.032021.4326.1 (accessed on 19 August 2025).
  45. Peel, M.C.; Finlayson, B.L.; McMahon, T.A. Updated world map of the Koppen-Geiger climate classification. Hydrol. Earth Syst. 2007, 11, 1633–1644. [Google Scholar] [CrossRef]
  46. Zepner, L.; Karrasch, P.; Wiemann, F.; Bernarda, L. ClimateCharts.net—An interactive climate analysis web platform. Int. J. Digit. Earth 2021, 14, 338–356. [Google Scholar] [CrossRef]
  47. Beck, H.E.; McVicar, T.R.; Vergopolan, N.; Alexis, B.; Lutsko, N.J.; Dufour, A.; Zeng, Z.; Jian, X.; van Dijk, A.I.J.M.; Miralles, D.G. High-resolution (1 km) Köppen-Geiger maps for 1901–2099 based on constrained CMIP6 projections. Sci. Data 2023, 10, 724. [Google Scholar] [CrossRef]
  48. CLIVAR. Special Issue on Monsoons: Advancing understanding of monsoon variability and improving prediction. Exchanges 2015, 19, 66. [Google Scholar]
  49. Hersbach, H.; Bell, B.; Berrisford, P.; Hirahara, S.; Horanyi, A.; Muñoz-Sabater, J.; Nicolas, J.; Peubey, C.; Radu, R.; Schepers, D.; et al. The ERA5 global reanalysis. Q. J. R. Meteorol. Soc. 2020, 146, 1999–2049. [Google Scholar] [CrossRef]
  50. Copernicus Climate Change Service. Access to ERA5 Reanalysis Data. Available online: https://climate.copernicus.eu/climate-reanalysis (accessed on 20 May 2025).
  51. Satgé, F.; Defrance, D.; Sultan, B.; Bonnet, M.-P.; Seyler, F.; Rouché, N.; Pierron, F.; Paturel, J.-E. Evaluation of 23 gridded precipitation datasets across West Africa. J. Hydrol. 2020, 581, 124412. [Google Scholar] [CrossRef]
  52. Goudiaby, O.; Bodian, A.; Dezetter, A.; Diouf, I.; Ogilvie, A. Evaluation of Gridded Rainfall Products in Three West African Basins. Hydrology 2024, 11, 75. [Google Scholar] [CrossRef]
  53. Funk, C.; Peterson, P.; Landsfeld, M.; Pedreros, D.; Verdin, J.; Shukla, S.; Husak, G.; Rowland, J.; Harrison, L.; Hoell, A.; et al. The climate hazards infrared precipitation with stations—A new environmental record for monitoring extremes. Sci. Data 2015, 2, 150066. [Google Scholar] [CrossRef]
  54. Eyring, V.; Bony, S.; Meehl, G.A.; Senior, C.A.; Stevens, B.; Stouffer, R.J.; Taylor, K.E. Overview of the Coupled Model Intercomparison Project Phase 6 (CMIP6) experimental design and organization. Geosci. Model Dev. 2016, 9, 1937–1958. [Google Scholar] [CrossRef]
  55. van Vuuren, D.P.; Kriegler, E.; O’Neill, B.C.; Ebi, K.L.; Riahi, K.; Carter, T.R.; Edmonds, J.; Hallegatte, S.; Kram, T.; Mathur, R.; et al. A new scenario framework for climate change research: Scenario matrix architecture. Clim. Change 2014, 122, 373–386. [Google Scholar] [CrossRef]
  56. Meinshausen, M.; Nicholls, Z.R.J.; Lewis, J.; Gidden, M.J.; Vogel, E.; Freund, M.; Beyerle, U.; Gessner, C.; Nauels, A.; Bauer, N.; et al. The shared socio-economic pathway (SSP) greenhouse gas concentrations and their extensions to 2500. Geosci. Model Dev. 2020, 13, 3571–3605. [Google Scholar] [CrossRef]
  57. Riahi, K.; van Vuuren, D.P.; Kriegler, E.; Edmonds, J.; O'Neill, B.; Fujimori, S.; Bauer, N.; Calvin, K. The shared socioeconomic pathways and their energy, land use, and greenhouse gas emissions implications: An overview. Glob. Environ. Change 2017, 42, 153–168. [Google Scholar] [CrossRef]
  58. O’Neill, B.C.; Tebaldi, C.; van Vuuren, D.P.; Eyring, V.; Friedlingstein, P.; Hurtt, G.; Knutti, R.; Kriegler, E.; Lamarque, J.-F.; Lowe, J.; et al. The Scenario Model Intercomparison Project (ScenarioMIP) for CMIP6. Geosci. Model Dev. 2016, 9, 3461–3482. [Google Scholar] [CrossRef]
  59. Intergovernmental Panel on Climate Change (IPCC). Good Practice Guidance Paper on Assessing and Combining Multi Model Climate Projections; National Center for Atmospheric Research: Boulder, CO, USA, 2010. [Google Scholar]
  60. Bi, D.; Dix, M.; Marsland, S.J.; O’Farrell, S.; Rashid, H.A.; Uotila, P.; Hirst, A.C.; Kowalczyk, E.; Golebiewski, M.; Sullivan, A.; et al. The ACCESS coupled model: Description, control climate and evaluation. Aust. Meteorol. Oceanogr. J. 2012, 63, 41–64. [Google Scholar] [CrossRef]
  61. Law, R.M.; Ziehn, T.; Matear, R.J.; Lenton, A.; Chamberlain, M.A.; Stevens, L.E.; Wang, Y.-P.; Srbinovsky, J.; Bi, D.; Yan, H.; et al. The carbon cycle in the Australian Community Climate and Earth System Simulator (ACCESS-ESM1)—Part 1: Model description and pre-industrial simulation. Geosci. Model Dev. 2017, 10, 2567–2590. [Google Scholar] [CrossRef]
  62. Semmler, T.; Danilov, S.; Gierz, P.; Goessling, H.F.; Hegewald, J.; Hinrichs, C.; Koldunov, N.; Khosravi, N.; Mu, L.; Rackow, T.; et al. Simulations for CMIP6 With the AWI Climate Model AWI-CM-1-1. J. Adv. Model Earth Syst. 2020, 12, e2019MS002009. [Google Scholar] [CrossRef]
  63. Wu, T.; Lu, Y.; Fang, Y.; Xin, X.; Li, L.; Li, W.; Jie, W.; Zhang, J.; Liu, Y.; Zhang, L.; et al. The Beijing climate center climate system model (BCC-CSM): The main progress from CMIP5 to CMIP6. Geosci. Model Dev. 2019, 12, 1573–1600. [Google Scholar] [CrossRef]
  64. Li, L.; Pu, Y.; Xie, J. CAS FGOALS-g3 model output prepared for CMIP6 ScenarioMIP ssp370 (Version 20191026). Earth Syst. Grid Fed. 2019. [Data set]. [Google Scholar] [CrossRef]
  65. Lauritzen, P.H.; Nair, R.D.; Herrington, A.R.; Callaghan, P.; Goldhaber, S.; Dennis, J.M.; Bacmeister, J.T.; Eaton, B.E.; Zarzycki, C.M.; Taylor, M.A.; et al. NCAR release of CAM-SE in CESM2.0: A reformulation of the spectral element dynamical core in drymass vertical coordinates with comprehensive treatment of condensates and energy. J. Adv. Model Earth Syst. 2018, 10, 1537–1570. [Google Scholar] [CrossRef]
  66. Neale, R.B.; Gettelman, A.; Park, S.; Chen, C.; Lauritzen, P.H.; Williamson, D.L. Description of the NCAR Community Atmosphere Model (CAM 5.0). NCAR Technical Notes, Ncar/Tn-464+StrBoulder, CO: National Center for Atmospheric Research. 2012. Available online: http://www.cesm.ucar.edu/models/cesm1.0/cam/docs/description/cam5_desc.pdf (accessed on 20 May 2025).
  67. Cherchi, A.; Fogli, P.G.; Lovato, T.; Peano, D.; Iovino, D.; Gualdi, S.; Masina, S.; Scoccimarro, E.; Materia, S.; Bellucci, A.; et al. Global mean climate and main patterns of variability in the CMCC-CM2 coupled model. J. Adv. Model Earth Syst. 2019, 11, 185–209. [Google Scholar] [CrossRef]
  68. Voldoire, A.; Saint-Martin, D.; Sénési, S.; Decharme, B.; Alias, A.; Chevallier, M.; Colin, J.; Guérémy, J.-F.; Michou, M.; Moine, M.-P.; et al. Evaluation of CMIP6 DECK experiments with CNRM-CM6-1. J. Adv. Model Earth Syst. 2019, 11, 2177–2213. [Google Scholar] [CrossRef]
  69. Séférian, R.; Nabat, P.; Michou, M.; Saint-Martin, D.; Voldoire, A.; Colin, J.; Decharme, B.; Delire, C.; Berthet, S.; Chevallier, M.; et al. Evaluation of CNRM Earth-System model, CNRMESM2-1: Role of Earth system processes in present-day and future climate. J. Adv. Model Earth Syst. 2019, 11, 4182–4227. [Google Scholar] [CrossRef]
  70. Swart, N.C.; Cole, J.N.S.; Kharin, V.V.; Lazare, M.; Scinocca, J.F.; Gillett, N.P.; Anstey, J.; Arora, V.; Christian, J.R.; Hanna, S.; et al. The Canadian Earth System Model version 5 (CanESM5.0.3). Geosci. Model Dev. 2019, 12, 4823–4873. [Google Scholar] [CrossRef]
  71. Massonnet, F.; Ménégoz, M.; Acosta, M.; Yepes-Arbós, X.; Exarchou, E.; Doblas-Reyes, F.J. Replicability of the EC-Earth3 Earth system model under a change in computing environment. Geosci. Model Dev. 2020, 13, 1165–1178. [Google Scholar] [CrossRef]
  72. He, B.; Bao, Q.; Wang, X.; Zhou, L.; Wu, X.; Liu, Y.; Wu, G.; Chen, K.; He, S.; Hu, W.; et al. CAS FGOALS-f3-L model datasets for CMIP6 historical Atmospheric Model Inter-comparison Project simulation. Adv. Atmos. Sci. 2019, 36, 771–778. [Google Scholar] [CrossRef]
  73. Held, I.M.; Guo, H.; Adcroft, A.; Dunne, J.P.; Horowitz, L.W.; Krasting, J.; Shevliakova, E.; Winton, M.; Zhao, M.; Bushuk, M.; et al. Structure and performance of GFDL’s CM4.0 climate model. J. Adv. Model Earth Syst. 2019, 11, 3691–3727. [Google Scholar] [CrossRef]
  74. Kelley, M.; Schmidt, G.A.; Nazarenko, L.S.; Bauer, S.E.; Ruedy, R.; Russell, G.L.; Yao, M.S. GISS-E2.1: Configurations and climatology. J. Adv. Model Earth Syst. 2020, 12, e2019MS002025. [Google Scholar] [CrossRef]
  75. Kuhlbrodt, T.; Jones, C.G.; Sellar, A.; Storkey, D.; Blockley, E.; Stringer, M.; Hill, R.; Graham, T.; Ridley, J.; Blaker, A.; et al. The low-resolution version of HadGEM3 GC3.1: Development and evaluation for global climate. J. Adv. Model Earth Syst. 2018, 10, 2865–2888. [Google Scholar] [CrossRef]
  76. Volodin, E.M.; Mortikov, E.V.; Kostrykin, S.V.; Galin, V.Y.; Lykossov, V.N.; Gritsun, A.S.; Diansky, N.A.; Gusev, A.V.; Iakovlev, N.G.; Shestakova, A.A.; et al. Simulation of the modern climate using the INM-CM48 climate model. Russ. J. Numer. Anal. Math. Model. 2018, 33, 367–374. [Google Scholar] [CrossRef]
  77. Hourdin, F.; Rio, C.; Grandpeix, J.-Y.; Madeleine, J.-B.; Cheruy, F.; Rochetin, N.; Musat, I.; Idelkadi, A.; Fairhead, L.; Foujols, M.-A.; et al. LMDZ6: Improved atmospheric component of the IPSL coupled model. J. Adv. Model Earth Syst. 2020, 12, e2019MS001892. [Google Scholar] [CrossRef]
  78. Hajima, T.; Watanabe, M.; Yamamoto, A.; Tatebe, H.; Noguchi, M.A.; Abe, M.; Ohgaito, R.; Ito, A.; Yamazaki, D.; Okajima, H.; et al. Description of the MIROC-ES2L Earth system model and evaluation of its climate–biogeochemical processes and feedbacks. Geosci. Model Dev. 2020, 13, 2197–2244. [Google Scholar] [CrossRef]
  79. Tatebe, H.; Ogura, T.; Nitta, T.; Komuro, Y.; Ogochi, K.; Takemura, T.; Sudo, K.; Sekiguchi, M.; Abe, M.; Saito, F.; et al. Description and basic evaluation of simulated mean state, internal variability, and climate sensitivity in MIROC6. Geosci. Model Dev. 2019, 12, 2727–2765. [Google Scholar] [CrossRef]
  80. Gutjahr, O.; Putrasahan, D.; Lohmann, K.; Jungclaus, J.H.; von Storch, J.-S.; Brüggemann, N.; Haak, H.; Stössel, A. Max Planck Institute Earth System Model (MPI-ESM1.2) for the High-Resolution Model Intercomparison Project (HighResMIP). Geosci. Model Dev. 2019, 12, 3241–3281. [Google Scholar] [CrossRef]
  81. Mauritsen, T.; Bader, J.; Becker, T.; Behrens, J.; Bittner, M.; Brokopf, R.; Brovkin, V.; Claussen, M.; Crueger, T.; Esch, M.; et al. Developments in the MPI-M Earth System Model version 1.2 (MPI-ESM1.2) and its response to increasing CO2. J. Adv. Model Earth Syst. 2019, 11, 998–1038. [Google Scholar] [CrossRef]
  82. Yukimoto, S.; Kawai, H.; Koshiro, T.; Oshima, N.; Yoshida, K.; Urakawa, S.; Tsujino, H.; Deushi, M.; Tanaka, T.; Hosaka, M.; et al. The meteorological research institute earth system model version 2.0, MRI-ESM2.0: Description and basic evaluation of the physical component. J. Meteorol. Soc. Jpn. 2019, 97, 931–965. [Google Scholar] [CrossRef]
  83. Cao, J.; Wang, B.; Yang, Y.-M.; Ma, L.; Li, J.; Sun, B.; Bao, Y.; He, J.; Zhou, X.; Wu, L. The NUIST Earth System Model (NESM) version 3: Description and preliminary evaluation. Geosci. Model Dev. 2016, 11, 2975–2993. [Google Scholar] [CrossRef]
  84. Seland, Ø.; Bentsen, M.; Seland, G.L.; Olivié, D.; Toniazzo, T.; Gjermundsen, A.; Debernard, J.B.; Gupta, A.K.; He, Y.; Kirkevåg, A.; et al. The Norwegian Earth System Model, NorESM2—Evaluation of theCMIP6 DECK and historical simulations. Model Dev. Discuss. Geosci. 2020, 13, 6165–6200. [Google Scholar] [CrossRef]
  85. Sellar, A.; Jones, C.; Mulcahy, J.; Tang, Y.; Yool, A.; Wiltshire, A.; O’Connor, F.; Stringer, M.; Hill, R.; Palmieri, J.; et al. UKESM1: Description and evaluation of the UK Earth System Model. J. Adv. Model Earth Syst. 2019, 11, 4513–4558. [Google Scholar] [CrossRef]
  86. Peterson, T.C. Report on the Activities of the Working Group on Climate Change Detection and Related Rapporteurs 1998–2001; ICPO Publication Series, 48; ICPO: Southampton, UK, 2001; p. 144. [Google Scholar]
  87. Zhang, X.; Alexander, L.; Hegerl, G.C.; Jones, P.; Klein Tank, A.; Peterson, T.C.; Trewin, B.; Zwiers, F.W. Indices for monitoring changes in extremes based on daily temperature and precipitation data. Wiley interdisciplinary reviews. Clim. Change 2011, 2, 851–870. [Google Scholar] [CrossRef]
  88. Zhang, X.; Yang, F. RClimDex (1.1) User Guide. Climate Research Division ETCCDI/CRD Climate Change Indices, 2017. Available online: http://etccdi.pacificclimate.org/software.shtml (accessed on 25 July 2025).
  89. Sen, P.K. Estimates of the Regression Coefficient Based on Kendall’s Tau. J. Am. Stat. Assoc. 1968, 63, 1379–1389. [Google Scholar] [CrossRef]
  90. Mann, H.B. Non-parametric tests against trend. Econometrica 1945, 13, 163–171. [Google Scholar] [CrossRef]
  91. Kendall, M.G. Rank Correlation Methods, 4th ed.; Charles Griffin: London, UK, 1975. [Google Scholar]
  92. Dosio, A.; Mentaschi, L.; Fischer, E.M.; Wyser, K. Extreme heat waves under 1.5 °C and 2 °C global warming. Environ. Res. Lett. 2018, 13, 054006. [Google Scholar] [CrossRef]
  93. Yin, C.; Yang, Y.; Chen, X.; Yue, X.; Liu, Y.; Xin, Y. Changes in global heat waves and its socioeconomic exposure in a warmer future. Clim. Risk Manag. 2022, 38, 100459. [Google Scholar] [CrossRef]
  94. New, M.; Hewitson, B.; Stephenson, D.B.; Tsiga, A.; Kruger, A.; Manhique, A.; Gomez, B.; Coelho, C.A.S.; Ntiki Masisi, D.; Kululanga, E.; et al. Evidence of trends in daily climate extremes over southern and west Africa. J. Geophys. Res. Atmos. 2006, 111, D14102. [Google Scholar] [CrossRef]
  95. Bobde, V.; Ayegbusi, K.; Akinsanola, A.A.; Adeyeri, O.E.; Morakinyo, T.E.; Adebiyi, A.A. Anthropogenic warming is accelerating recent heatwaves in Africa. Commun. Earth Environ. 2025, 6, 578. [Google Scholar] [CrossRef]
  96. Diedhiou, A.; Bichet, A.; Wartenburger, R.; Seneviratne, S.I.; Rowell, D.P.; Sylla, M.B.; Diallo, I.; Todzo, S.; Tour´e, N.E.; Camara, M.; et al. Changes in climate extremes over West and Central Africa at 1.5 °C and 2 °C global warming. Environ. Res. Lett. 2018, 13, 065020. [Google Scholar] [CrossRef]
  97. Issa Lélé, M.; Lamb, P.J. Variability of the Intertropical Front (ITF) and Rainfall over the West African Sudan–Sahel Zone. J. Clim. 2010, 23, 3984–4004. [Google Scholar] [CrossRef]
  98. Cretat, J.; Vizy, E.K.; Cook, K.H. The relationship between African easterly waves and daily rainfall over West Africa: Observations and regional climate simulations. Clim. Dyn. 2015, 44, 385–404. [Google Scholar] [CrossRef]
  99. Poan, E.; Lafore, J.P.; Roehrig, R.; Couvreux, F. Internal processes within the African Easterly Wave system. Q. J. R. Meteorol. Soc. 2015, 141, 1121–1136. [Google Scholar] [CrossRef]
  100. Druyan, L.M.; Fulakeza, M. The impact of the Atlantic cold tongue on West African monsoon on set in regional model simulations for 1998–2002. Int. J. Climatol. 2015, 35, 275–287. [Google Scholar] [CrossRef]
  101. Lavaysse, C.; Flamant, C.; Janicot, S.; Parker, D.J.; Lafore, J.P.; Sultan, B. Seasonal evolution of the West African heat low: A climatological perspective. Clim. Dyn. 2009, 33, 313–330. [Google Scholar] [CrossRef]
  102. Qian, C.; Chen, G. Warmer-get-wetter or wet-get-wetter? A criterion to classify oceanic precipitation. J. Ocean Univ. China 2014, 13, 552–560. [Google Scholar] [CrossRef]
  103. Ta, S.; Kouadio, K.Y.; Ali, K.E.; Toualy, E.; Aman, A.; Yoroba, F. West Africa Extreme Rainfall Events and Large-Scale Ocean Surface and Atmospheric Conditions in the Tropical Atlantic. Adv. Meteorol. 2016, 2016, ID1940456. [Google Scholar] [CrossRef]
  104. Sougué, M.; Merz, B.; Sogbedji, J.M.; Zougmoré, F. Extreme Rainfall in Southern Burkina Faso, West Africa: Trends and Links to Atlantic Sea Surface Temperature. Atmosphere 2023, 14, 284. [Google Scholar] [CrossRef]
  105. Almazroui, M.; Saeed, F.; Saeed, S.; Islam, M.N.; Ismail, M.; Klutse, N.A.B.; Siddiqui, M.H. Projected Change in Temperature and Precipitation Over Africa from CMIP6. Earth Syst. Environ. 2020, 4, 455–475. [Google Scholar] [CrossRef]
  106. Sylla, M.B.; Giorgi, F.; Pal, J.S.; Gibba, P.; Kebe, I.; Nikiema, M. Projected changes in the annual cycle of high intensity precipitation events over West Africa for the late 21st century. J. Clim. 2015, 28, 6475–6488. [Google Scholar] [CrossRef]
  107. Odunmorayo, M.T.; Alani, B.O.; Adefisan, E.A. Projected change in occurrence and severity of heatwaves over West Africa as simulated by CMIP6 models. J. Disaster Sci. Manag. 2025, 1, 16. [Google Scholar] [CrossRef]
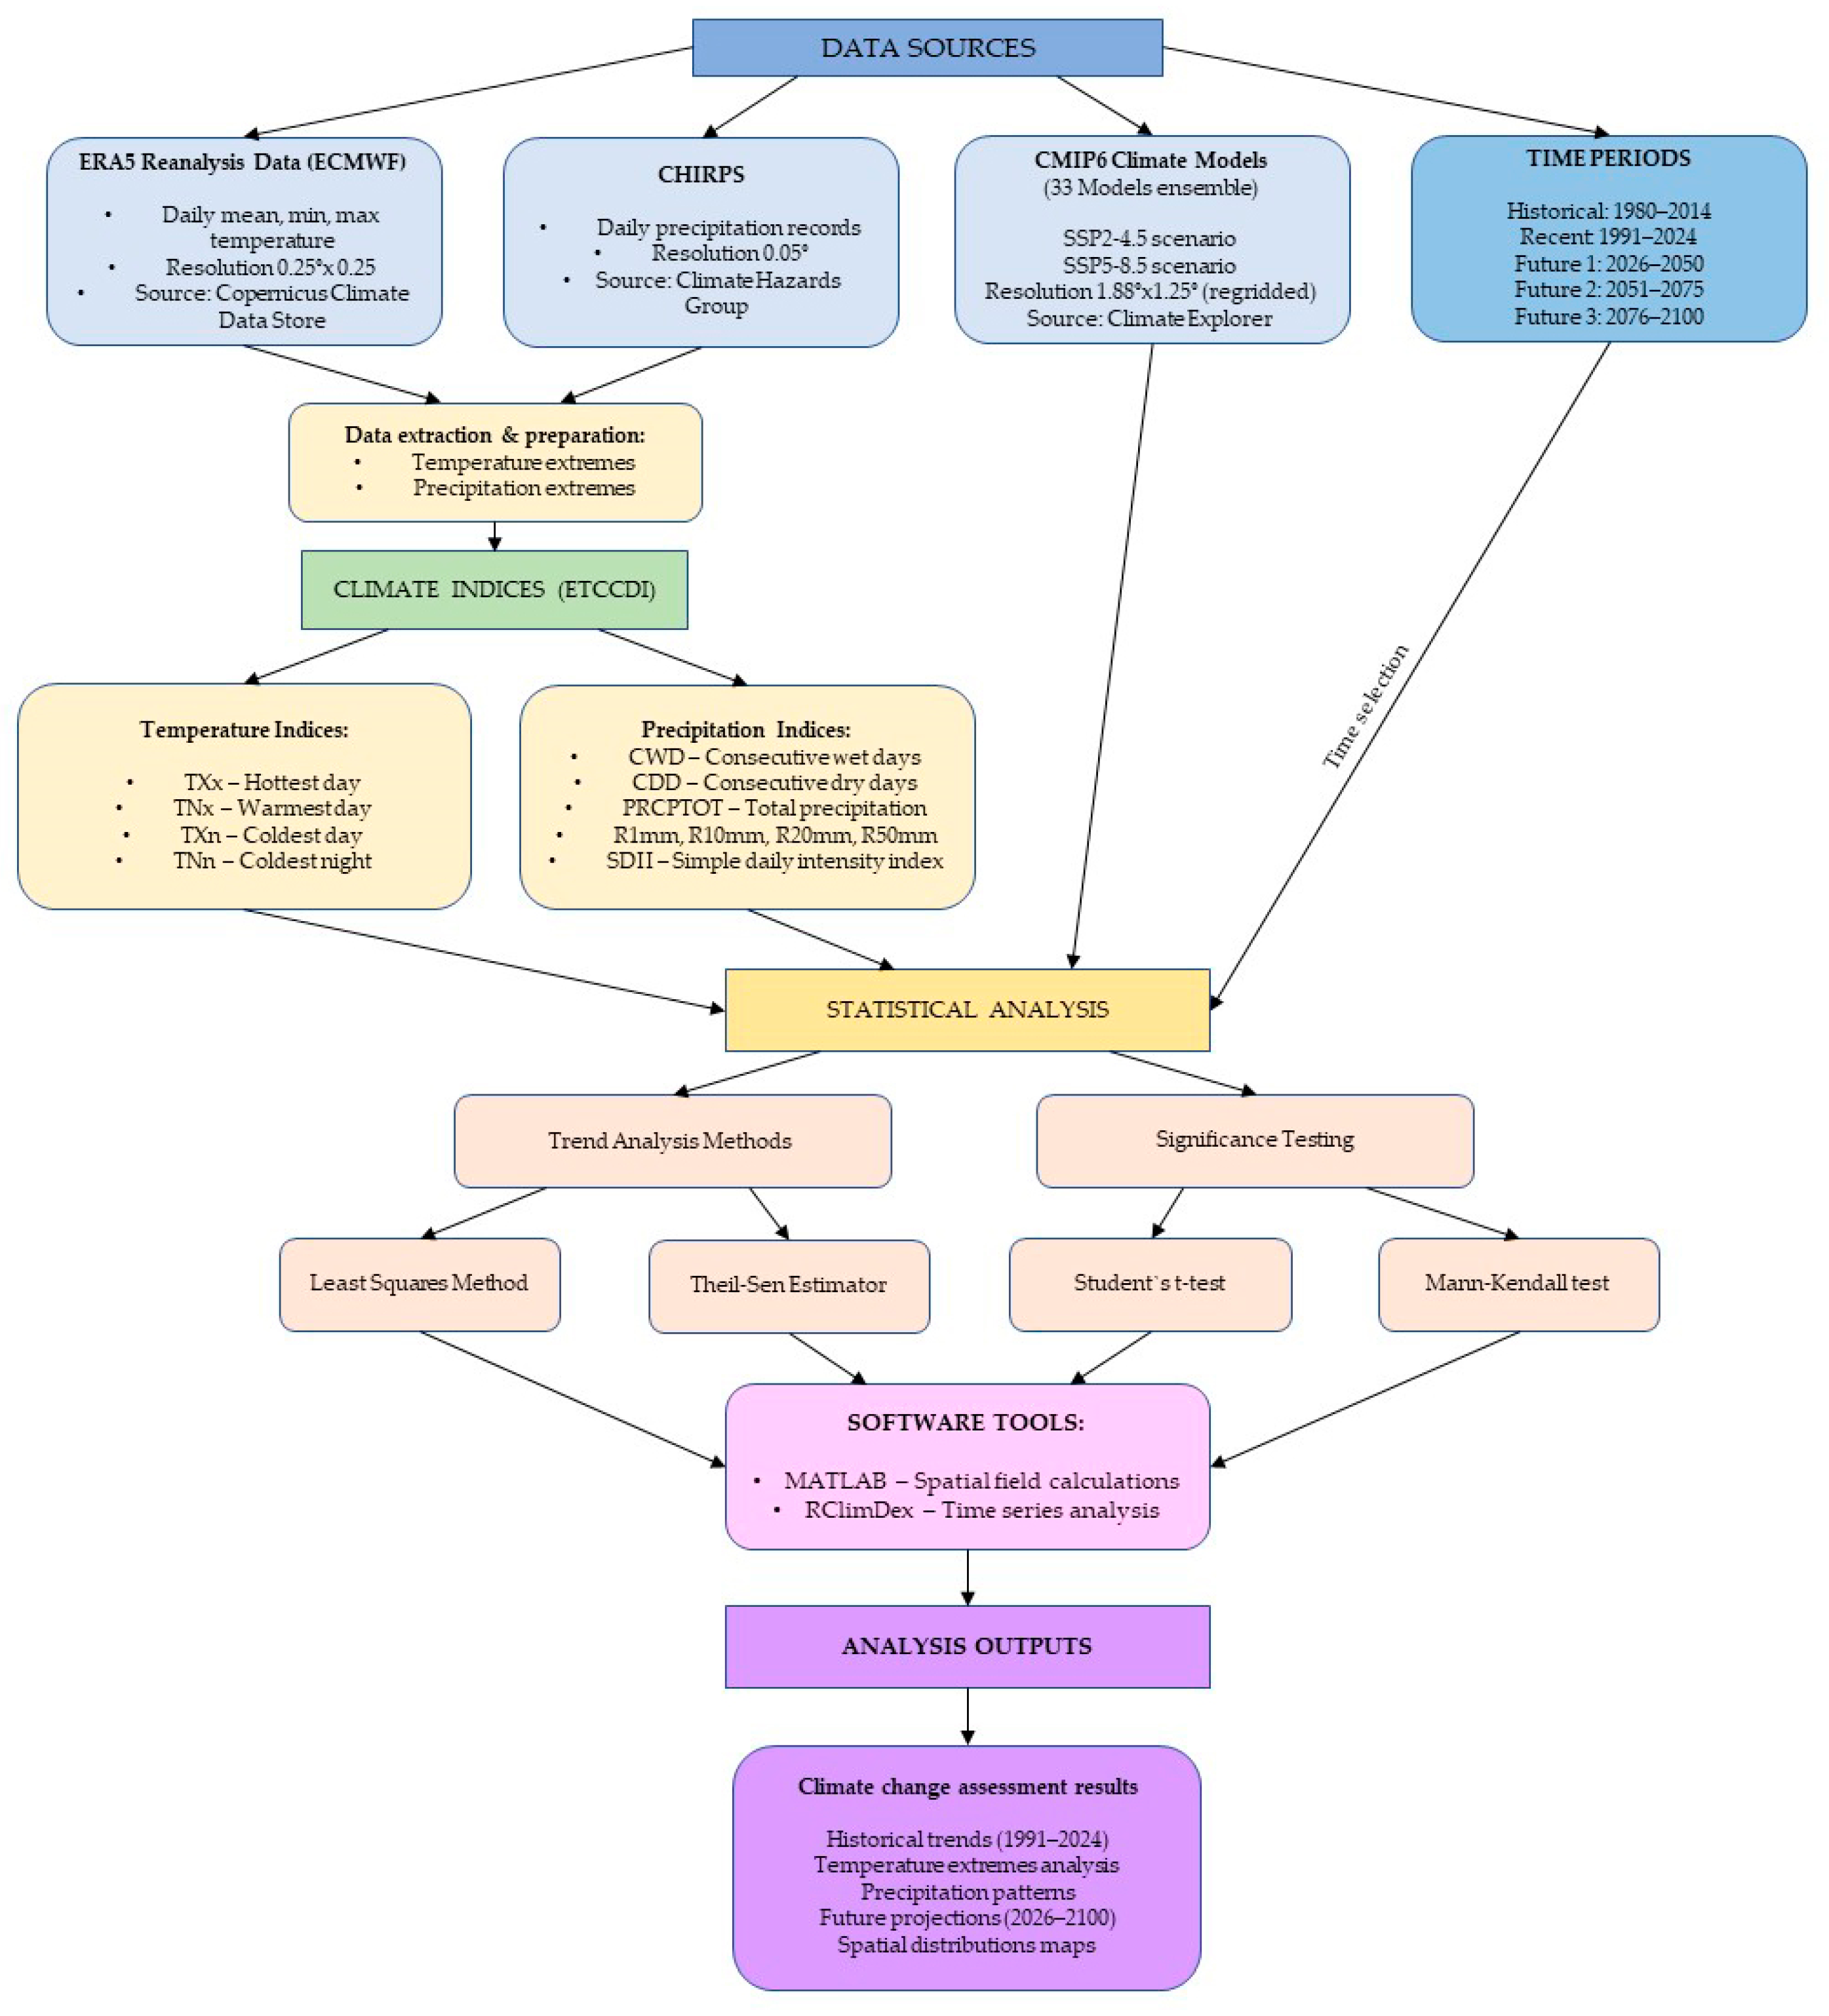
Figure 2. Flowchart of the used data and methods.
Climate 13 00239 g002
Figure 3. Average annual air temperature (a), average air temperature in the dry season (c) and in the rainy season (e) and trends (b,d,f respectively) for the period 1991–2024. Black dots indicate statistically significant trend (p < 0.05).
Climate 13 00239 g003
Figure 4. TNn and TNx, TXn and TXx indices (upper row), and their trends (lower row) for the period 1991–2024. Black dots indicate statistically significant trend (p < 0.05).
Climate 13 00239 g004
Figure 5. Average annual precipitation (a), dry season (c) and wet season (e) precipitation, linear trends (b,d,f respectively) for the period 1991–2024. Black dots indicate statistically significant trends (p < 0.05).
Climate 13 00239 g005
Figure 6. Number of rainy days (a), CDD (c) and CWD (e) indices for the period 1991–2024 and their trends (b,d,f). Black dots indicate statistically significant trend (p < 0.05).
Climate 13 00239 g006
Figure 7. SDII (a) and trends (b) for the period 1991–2024. Black dots indicate statistically significant trend (p < 0.05).
Climate 13 00239 g007
Figure 8. Spatial maps of the R10, R20, R30 and R50mm (days) indices (left column) and trends (right column) for the period 1991–2024. Black dots indicate statistically significant trend (p < 0.05).
Climate 13 00239 g008
Figure 9. Long-term variability of PRCPTOT, TXx and SDII indices for the period 1991–2024 for the physical-geographical regions of Guinea. The dotted lines correspond to the linear trend.
Climate 13 00239 g009
Figure 10. Projected changes in air temperature (a) and precipitation (b) for the CMIP6 ensemble of models for the historical period (1980–2014) and the difference in average air temperature (°C) and precipitation (%) between future periods and the historical one for two SSP scenarios: SSP2-4.5 scenario—top row and SSP5-8.5—bottom row; (c,d) change in average air temperature and annual precipitation averaged for grid nodes located in Guinea. The dotted line is the trends for 25-year intervals. The color areas correspond to three future periods.
Climate 13 00239 g010
Table 1. List of models used in the ensemble.
Model TitleCountryResolutionReference
ACCESS-CM2Australia1.9° × 1.3°[60]
ACCESS-ESM1-5Australia1.9° × 1.2°[61]
AWI-CM-1-1-MRGermany1° × 1°[62]
BCC-CSM2-MRChina1.1° × 1.1°[63]
CESM2-WACCMUSA1.3° × 0.9°[64]
CESM2USA1.3° × 0.9°[65]
CIESMChina1° × 1°[66]
CMCC-CM2-SR5Italy1° × 1°[67]
CNRM-CM6-1-HR-f2France0.5° × 0.5°[68]
CNRM-CM6-1-f2France1.4° × 1.4°[68]
CNRM-ESM2-1-f2France1.4° × 1.4°[69]
CanESM5-CanOE-p2Canada2.8° × 2.8[70]
CanESM5Canada2.8° × 2.8°[70]
EC-Earth3-VegEurope0.7° × 0.7°[71]
EC-Earth3Europe0.7° × 0.7°[71]
FGOALS-f3-LChina1.3° × 1°[72]
FGOALS-g3China2° × 2.3°[72]
GFDL-ESM4USA1.3° × 1°[73]
GISS-E2-1-G-p3USA2.5° × 2°[74]
HadGEM3-GC31-LL-f3UK1° × 1°[75]
INM-CM4-8Russia2° × 1.5°[76]
INM-CM5-0Russia2° × 1.5°[76]
IPSL-CM6A-LRFrance2.5° × 1.3°[77]
KACE-1-0-GRepublic of Korea1.875° × 1.25°
MIROC-ES2L-f2Japan2.8° × 2.8°[78]
MIROC6Japan1.4° × 1.4°[79]
MPI-ESM1-2-HRGermany0.9° × 0.9°[80]
MPI-ESM1-2-LRGermany1.9° × 1.9°[81]
MRI-ESM2-0Japan1.1° × 1.1°[82]
NESM3China1.9° × 1.9°[83]
NorESM2-LMNorway2.5° × 1.9°[84]
NorESM2-MMNorway2.5° × 1°[84]
UKESM1-0-LL-f2UK1.9° × 1.3°[85]
Table 2. The ETCCDIs used in the study.
IDIndicator NameDefinitionUnits
Precipitation
CWDConsecutive wet days Maximum number of consecutive days when precipitation ≥ 1 mmdays
CDDConsecutive dry daysMaximum number of consecutive days when precipitation < 1 mmdays
PRCPTOT Annual total wet-day precipitationmm
R1mmNumber of rainy daysNumber of days with precipitation ≥ 1 mmdays
R10mmNumber of heavy precipitation daysNumber of days per year when precipitation ≥ 10 mmdays
R20mm (R30 and R50mm)Number of very heavy precipitation daysNumber of days per year when precipitation ≥20 mm (additional thresholds of 30 mm and 50 mm per day have been selected for the territory of Guinea)days
SDIISimple daily intensity indexThe ratio of annual total precipitation to the number of wet days (≥1 mm)mm/day
Temperature
TXxThe hottest dayAnnual maximum value of daily maximum temperature°C
TNxThe warmest night of the yearAnnual maximum value of daily minimum temperature°C
TXnThe coldest day of the yearAnnual minimum value of daily maximum temperature°C
TNnThe coldest night of the year.Annual minimum value of daily minimum temperature°C
Table 3. Selected points for comparative analysis in different physical-geographical regions of Guinea.
RegionCoastal GuineaUpper GuineaMiddle GuineaForest Guinea
CityConakrySiguiriLabéNzérékoré
Altitude13 m335 m927 m560 m
Coordinates9°30′33″ N11°25′00″ N11°19′ N7°45′00″ N
13°42′44″ E9°10′00″ E12°17′ E8°49′00″ E
Table 4. Statistical indicators of extreme temperature and precipitation indices for the physical-geographical regions of Guinea.
IndexIndicatorReanalysis Grid Node
ConakrySiguiriLabéNzérékoré
PRCPTPOTMean3534115414641712
Max4802141516362055
Min252897212091451
Slope (mm/year)6.781.23−0.12−7.4
CWDMean12.16.612.910.6
Max26122321
Min7486
Slope (day/year)−0.060.02−0.030.03
CDDMean116.5120.886.333.2
Max15916512763
Min83473817
Slope (day/year)−0.210.490.530.21
TXxMean29.440.436.235.2
Max30.641.737.938.2
Min28.239.134.932.5
Slope (′C/year)0.0270.0260.0070.073
SDIIMean28.511.610.611.5
Max37.514.912.713.5
Min21.69.69.19.5
Slope (mm/year/year)0.090.020.001−0.05
R20mmMean58141720
Max78222631
Min397912
Slope (day/year)−0.03−0.01−0.002−0.22
Statistically significant trends are highlighted in bold (p < 0.05).
Disclaimer/Publisher’s Note: The statements, opinions and data contained in all publications are solely those of the individual author(s) and contributor(s) and not of MDPI and/or the editor(s). MDPI and/or the editor(s) disclaim responsibility for any injury to people or property resulting from any ideas, methods, instructions or products referred to in the content.