1. Introduction
Fog is essentially a cloud that forms at or near the ground level, or by the lowering of stratus clouds, when the air becomes saturated, and pollution aerosols, sea salt particles (less relevant inland except when advected by onshore winds), and mineral dust supply condensation nuclei. In Padua, fog is mainly due to cooling during clear nights (radiation fog) or the addition of moisture (evaporative fog). Rarely, it is due to frontal situation (i.e., mixing of a cold air mass with a humid one), but episodes of advection of mild and moist air from the Mediterranean or the Adriatic may give rise to advection fog or low stratus layers, particularly when the warm, humid air mass flows over a pre-existing cold and stable layer over the plain. Upslope fog is excluded because the landscape is flat, although it is contoured by mountains. Padua is not in a windy region, except for some rare situations with Bora wind from the east, or a local wind from the west, named Garbino. The southern Sirocco wind blows aloft to flow above the Alpine chain, and forms a frontal situation which generates precipitation and Dark Bora wind at ground level [
1,
2]. The poor ventilation and the nocturnal cooling favor air layering (i.e., nocturnal inversion) and the increase of local pollution. This was a serious problem before 1973, when the use of coal and oil for domestic heating was prohibited, and methane was distributed as an alternative fuel. This change reduced air pollution and local mist and fog [
3]. In Padua, the fog is frequent from autumn to spring [
4]. The main synoptic driver includes dynamic anticyclones, which enhance thermal inversions and suppress vertical mixing. The resulting static stability traps moisture in the lower boundary layer, favoring persistent fog development. Occasionally, the intrusion of cold, dry continental air from central Eurasia further strengthens the inversions induced by dynamic anticyclones. After entering the Po Valley, the air mass may persist for an extended period, undergoing progressive radiative cooling and a gradual increase in relative humidity. When upper-level subsidence inversions merge with surface radiation inversions, a deep, persistent layer forms that daytime solar heating—reduced in winter and further weakened by fog albedo—may dissipate, or may fail to dissipate [
5,
6,
7,
8,
9].
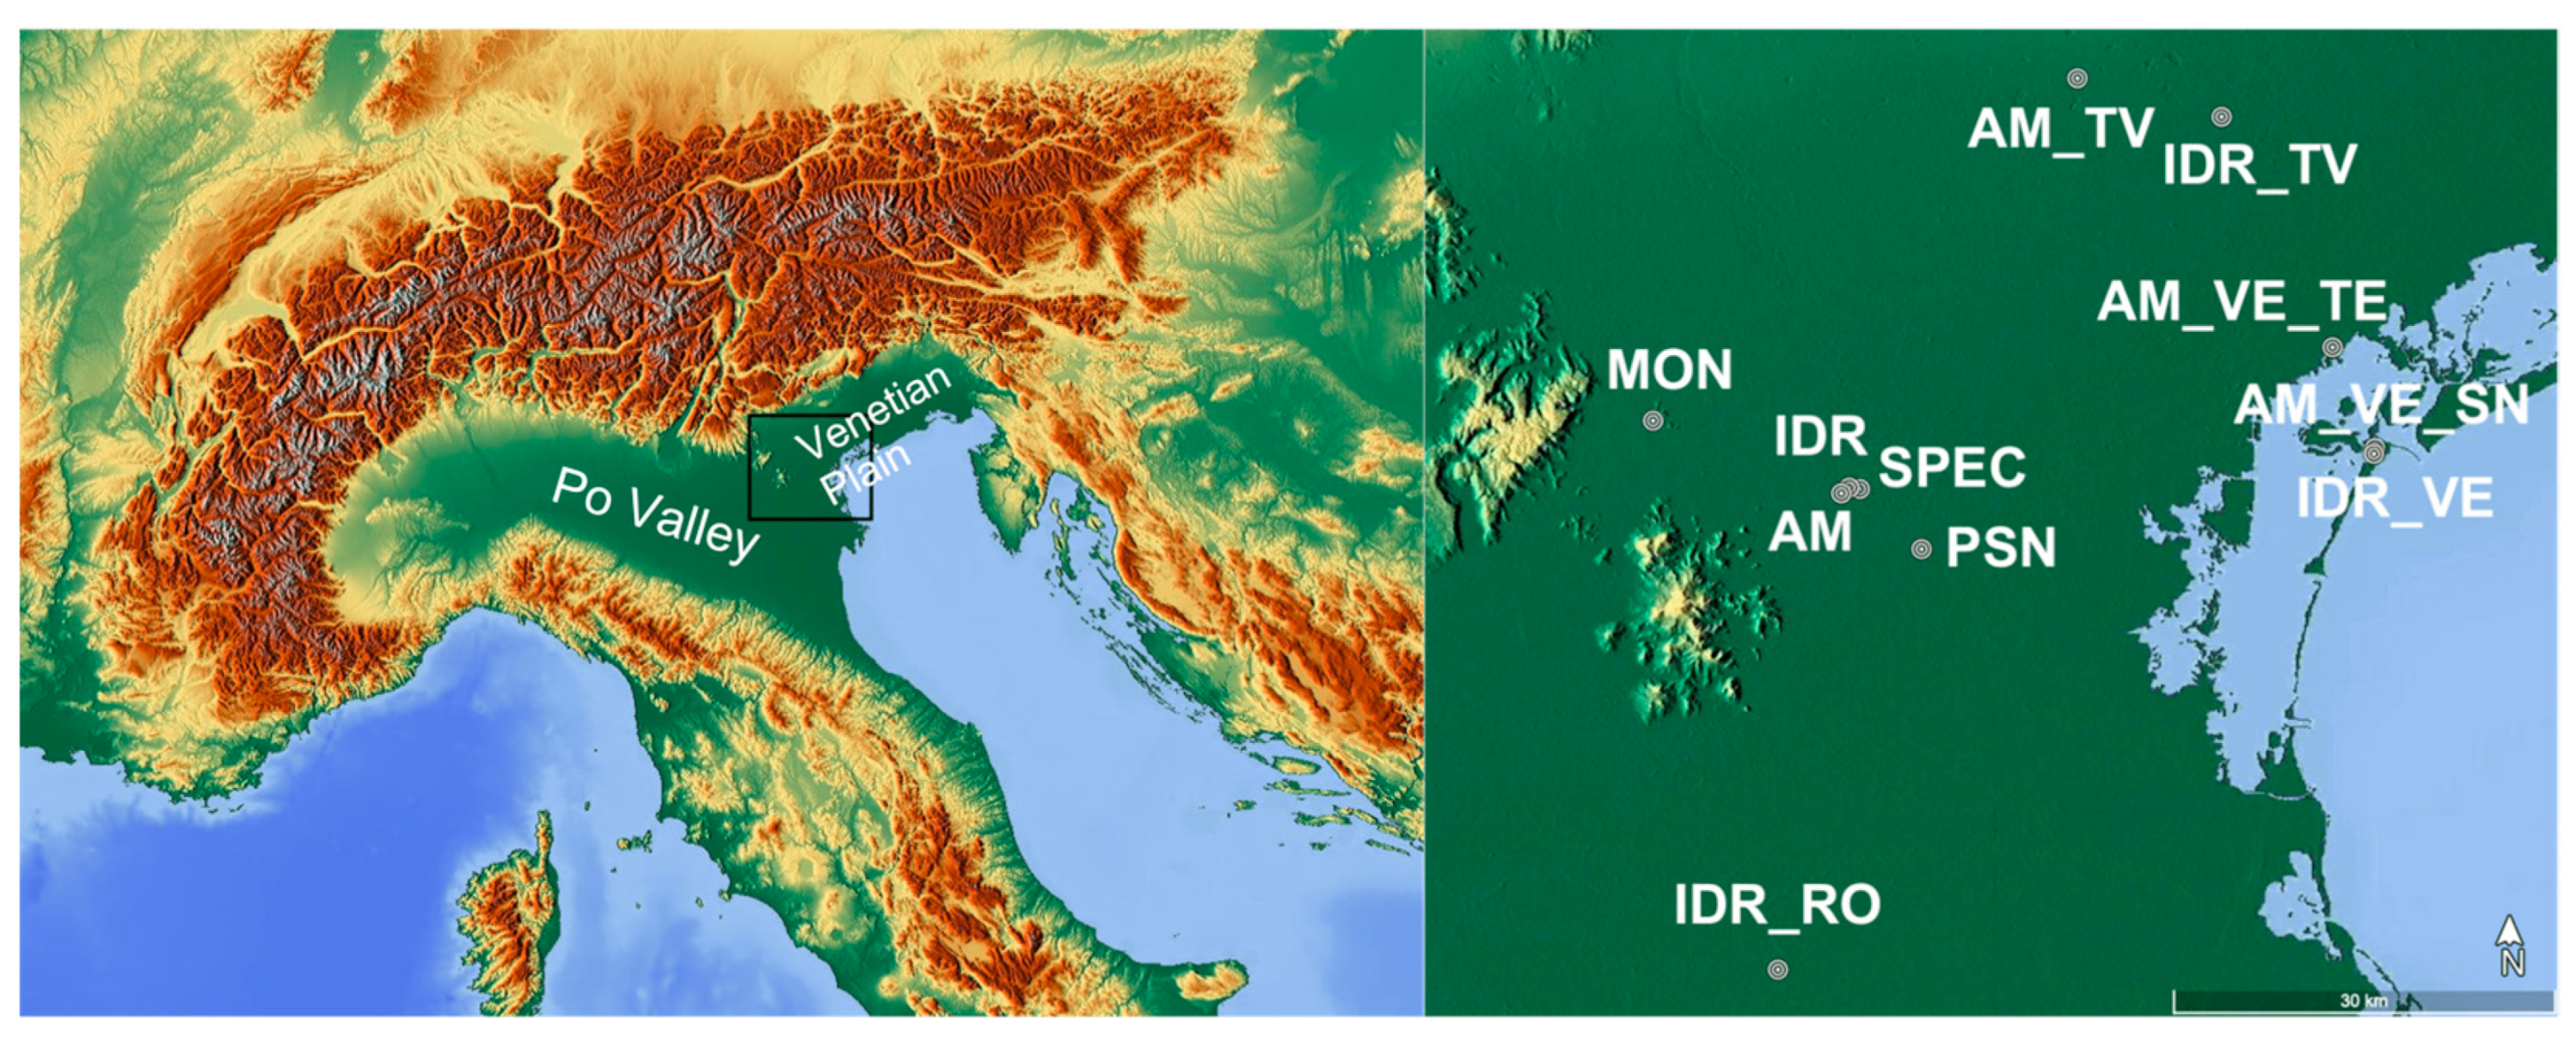
At the mesoscale, the presence of the Euganean Hills, rising to heights of up to 600 m, significantly affect the atmospheric circulation, resulting in a fog climatology in the Venetian Plain that diverges markedly from that of the central Po Valley: the hills (recognizable in the right panel of
Figure 1, together with the Berici Hills to the north-west) often block the fog coming from Mantua or Verona, i.e., central Po Valley, creating “high fogs” above the hills [
10]. Early studies, limited to a few decades, have already analyzed the fog occurrence in the Padua and Venice areas, showing that Padua has a larger number of days with fog than Venice [
6,
11,
12]. The Venice lagoon reduces night cooling, so fog is less frequent there compared with Padua, where temperature inversions and air stratification are favored, which are key for radiation fog [
10]. Thus, fog formation depends not only on geography and meteorology but also on the physical state of the land and on pollution levels, both of which have changed significantly over time. These transformations are tied to demographic growth and economic development in the region, and they must be considered to properly explain the evolution of fog frequency and distribution. In the Padua region, a comparative analysis of historical cartography and contemporary aerial imagery indicates a profound reduction in wetland extent, with present-day wetlands representing only 3.4% of those mapped in 1882 [
13]. Additionally, the current wetland pattern diverges substantially from the historical configuration: while most original wetlands have disappeared, the few existing ones are largely fragmented, and newly formed wetlands are primarily linked to anthropogenic activities [
13]. Moreover, beginning in the 1950s, a developmental vision framed Padua as a prospective hub of industrial modernization for the region, promoting the conversion of agricultural landscapes into industrial areas. The Paduan countryside progressively gave way to industrial expansion: by the early 2000s, approximately 700 ha of farmland had been expropriated for infrastructure development [
14]. Air pollution, which increased jointly with urbanization, started to decrease in the 1970s, because of European air quality legislation [
15] and the Yom Kippur War of 1973, which induced a gradual switch from oil to methane, thus decreasing the aerosols. Moreover, the reduction in aerosol concentrations resulting from these measures led to a positive change in the aerosol radiative effect at the top of the atmosphere, decreased atmospheric absorption, and increased the amount of solar radiation reaching the surface over Europe [
15]. All together, these factors—topography, meteorology, land-use change, and air pollution—have profoundly influenced fog occurrence in the Padua region.
In a previous study, using a clustering analysis on vertical relative humidity profiles, fog events in the Po Valley over ten years were classified into two main clusters [
16]. The first cluster, the most frequent, comprises mainly radiative events under stable, high-pressure conditions, characterized by temperature inversions and high near-surface humidity, leading to long-lasting and vertically extensive fog. The second cluster corresponds to advective events under more dynamic conditions, with low-pressure systems transporting moist Mediterranean air, resulting in colder, moister boundary layers [
16]. Although the two clusters generally capture the main synoptic patterns for fog events, formation can involve a combination of radiative and advective processes: it may begin under stable conditions via radiative cooling and then intensify through the advection of moist, cool air from the Mediterranean. This can generate dense fog with very low visibility (~100 m) and last for several days. For example, in December 2015, fog persisted in Padua nearly every day, more than twice the climatological average. Moreover, similar synoptic conditions may or may not lead to fog across the Po Valley, often differing between the central Po Valley and the Venetian Plain due to local factors such as the previously described topography, land use, and microclimate.
At first glance, daily observations reported in diaries and registers might seem to offer a straightforward source of data that could be machine-coded by simply counting the number of fog occurrences within specified time intervals. However, this approach faces several significant challenges:
- 1.
Early observers have a personal threshold for fog. Astronomers are very sensitive to vertical visibility. This can result in different fog frequencies in overlapping records from different sources [
17].
- 2.
Observers often use a variety of terms—such as fog, smoke, haze, or mist—to describe foggy conditions, not always interchangeable (in Italian, “nebbia”, “foschia”, “caligine”, “fumo”, “vapori”).
- 3.
Sometimes the exact time of observation is missing; moreover, a few records indicate how long the fog lasted, making it difficult to determine its persistence (hours, days).
- 4.
The location of observation can greatly influence fog frequency, especially as rural areas have gradually become urbanized over time.
Until the 19th century, no clear fog characterization was used, for example in 1792 the meteorologist Toaldo defined fog as “a cloud at ground level—that is, a mass of vapors with condensed exhalations in the lower part of the atmosphere”, but also “fog, strictly speaking, is the same as haze, but in common usage it refers to the harmful effect it produces on vegetables and grains” [
18]. In 1919, Crestani remarked, “there are no substantial differences between fog and clouds; fog is any cloud seen up close, while a cloud is fog viewed from below or from a great distance”, but he did not mention any visibility threshold [
19]. The difficulties in defining the presence of fog were clear, as for example Eredia, in his book containing the observations carried out in northern Italy from 1892 to 1914, stated the following: “Indeed, considerable difficulties arise when examining the distribution of fog in a region based on observations collected by different observers, because fog varies in density. At times it may be dripping and icy, while at others the droplets are so minute, far from full condensation, that they form only a light veil—an evanescent haze lingering close to the lower layers of the horizon. It must therefore not be overlooked that the observer’s judgment may be prone to error, especially when observations are carried out at different hours, or at times not coinciding with those when the observer usually records the various meteorological elements and thus pays attention to the entire visible horizon” [
11]. Finally, in 1934, Bonacini and Muzzioli, referring to the 1899-1928 period, wrote, “in our observation logs, phrases such as ‘fog on the horizon’ and ‘fog over the countryside’ (often qualified by its varying density) appear almost daily, so that days with a ‘clear horizon’ are noted with particular attention.
Likewise, remarks about haze in an otherwise clear sky are often necessary to indicate the lack of perfect air transparency. As a result, any assessment of fog is difficult and often imprecise […]. For our records, we define foggy days as those when the fog makes the atmosphere opaque enough to limit visibility of objects even near the station, so that it can truly be said the station is enveloped in fog” [
20]. Today, an observer defines fog as a condition in which visibility is limited to 1 km, selecting a reference point during daylight and a slightly illuminated object at the same distance for nighttime observations. In the period before public lighting, the nocturnal reference was missing or related to the Full Moon. Public lighting with gas dates around the mid-19th century, and electric lighting was introduced after World War I. When nocturnal light was missing, fog could be recognized only after sunrise. This was not a problem as the lack of nocturnal lighting did not affect the detection of radiative fog, which typically persists until sunrise and can therefore be observed and recorded in the morning. In contrast, fog events occurring during windy nights were more easily dispersed before sunrise and were therefore underestimated.
One of the first scales of fog intensity was introduced at the beginning of the 20th century by the Meteorological Office, the Admiralty and Trinity House as a result of an investigation of London fogs [
21]. This scale encompassed five categories of fog intensity, from clear atmosphere to thick fog. However, it was not sufficiently defined to report the visibility required for aviation. A new scale was consequently developed in which an explicit limiting distance of visibility was specified for each degree of fogginess. Presently, the term “fog” is used when visibility (i.e., the greatest distance at which objects can be clearly seen and identified with the unaided eye, typically measured horizontally near the Earth’s surface) is less than 1 km, whereas when the visibility is at least 1 km but not more than 5 km, it is called mist [
22]. However, as a definition, this is not entirely sufficient. Visibility may fall below these thresholds due to other meteorological phenomena—such as heavy rain or snow—which are not classified as fog or mist. Typically, the terms “fog” and “mist” are reserved for reduced visibility in the lower layers of the atmosphere caused by suspended microscopic particles of condensed moisture [
21]. In the absence of instrumental measurements, periodic manned observations could easily miss a fog occurrence. For example, Bosa in 1939 wrote, “a foggy day is defined as a day on which fog was observed during at least one of the regular observation times, which are carried out at 8:00, 14:00, and 19:00 each day. Therefore, the statistical analysis does not include cases where fog occurred at night or outside the scheduled observation hours; nor does it include days when only horizon fog, haze, or mist was reported. I have considered a day to be foggy when visibility was limited to a maximum of 1000 m” [
10].
The aim of this work is to investigate the fog occurrence in Padua, in the Venetian Plain, from the 1773–2024 period; the raw data have been analyzed without resort to any homogenization to obtain a fog frequency time series, to assess whether the multiple datasets can be used for fog climatology.
After the Introduction,
Section 2 presents the datasets and the methodologies used to analyze fog occurrence.
Section 3 shows and discusses the results. Finally, some conclusive remarks are given in
Section 4.
3. Results and Discussion
Five series of fog observations are available for Padua (see
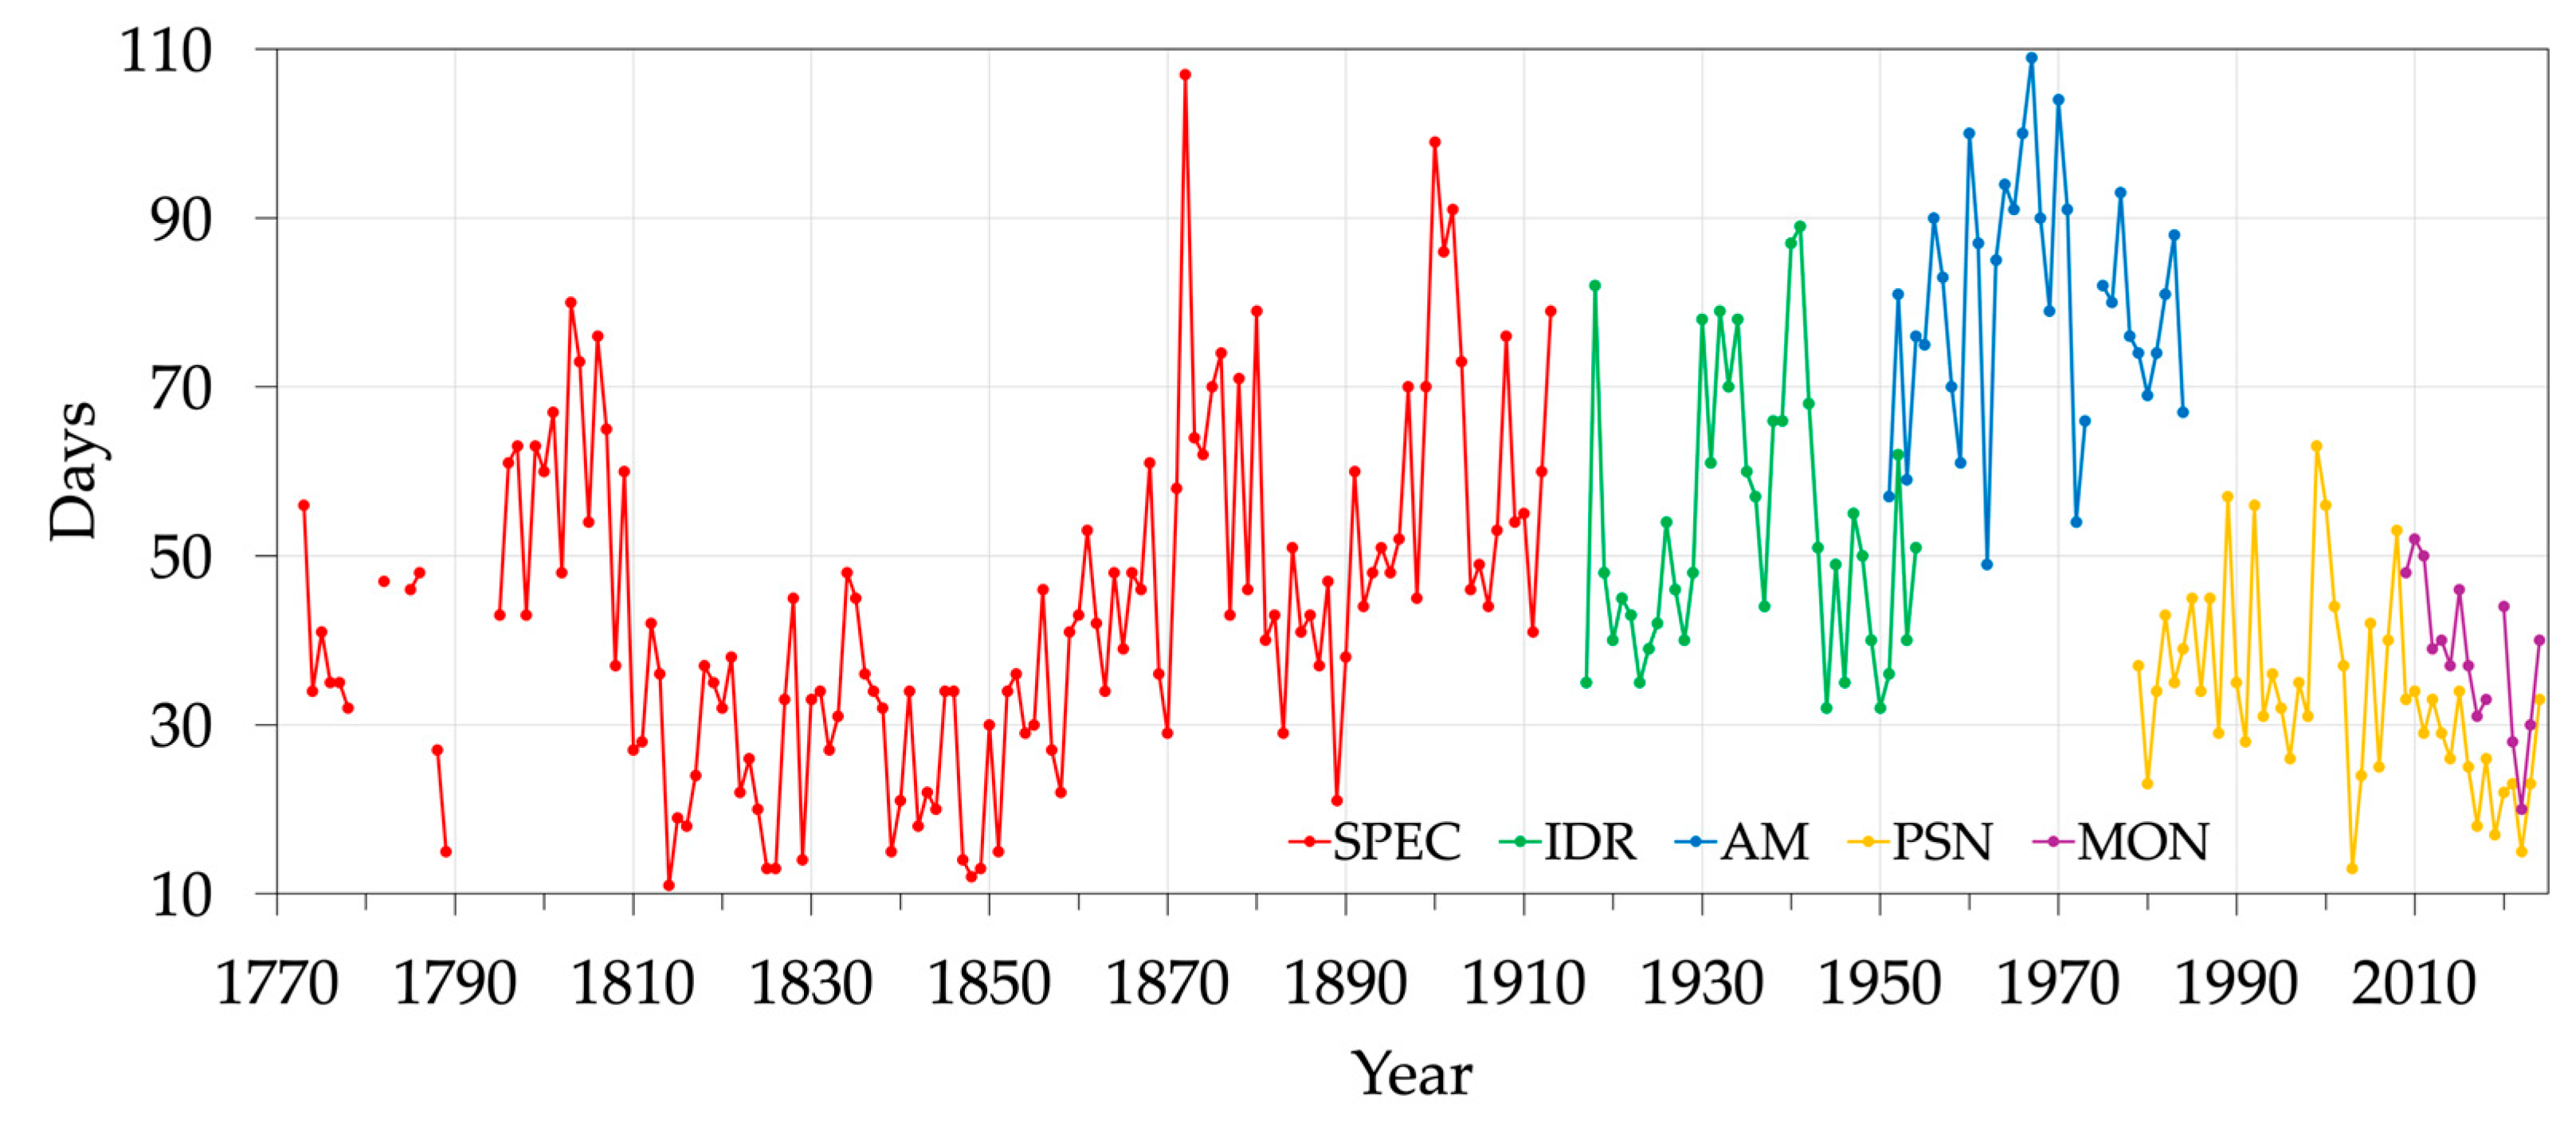
Section 2.1): SPEC, IDR, AM, PSN, and MON. AM and MON are the only series that provide visibility in km from which the fog occurrence can be extracted, i.e., visibility less than 1 km. The yearly number of foggy days for each subseries is presented in
Figure 2. As explained in the Introduction, the precise definition of fog has been introduced only in modern times as part of the standardization of the meteorological observations for aviation. Therefore, in the early meteorological observations, the classification was not exact, which makes it difficult to compare different observers. Hence, caution must be used in assessing possible variation of the fog occurrence, as changes can be related to different definitions and thresholds, instead of climatology.
Excluding the SPEC and IDR series, which do not overlap, there is no correspondence between the observations in the common periods of the other subseries. Additionally, even inside each subseries, some discontinuities not related to climatic transitions could be present. Therefore, these data cannot be considered homogeneous. Each series will be analyzed separately in the next sections.
3.1. Specola Observations (1773–1913)
In 1773, the astronomer and meteorologist Giuseppe Toaldo (1719–1797) established the Astro-Meteorological Journal. The publication featured solar and lunar ephemerides, meteorological records, and a summary of the previous year’s climate in Padua, with references to extreme weather events in other Italian and European cities. It also included compilations of historical climate information and curiosities, meteorological data from numerous Italian and foreign cities gathered through a network of correspondents, as well as explanations of measurement units and their conversions [
26,
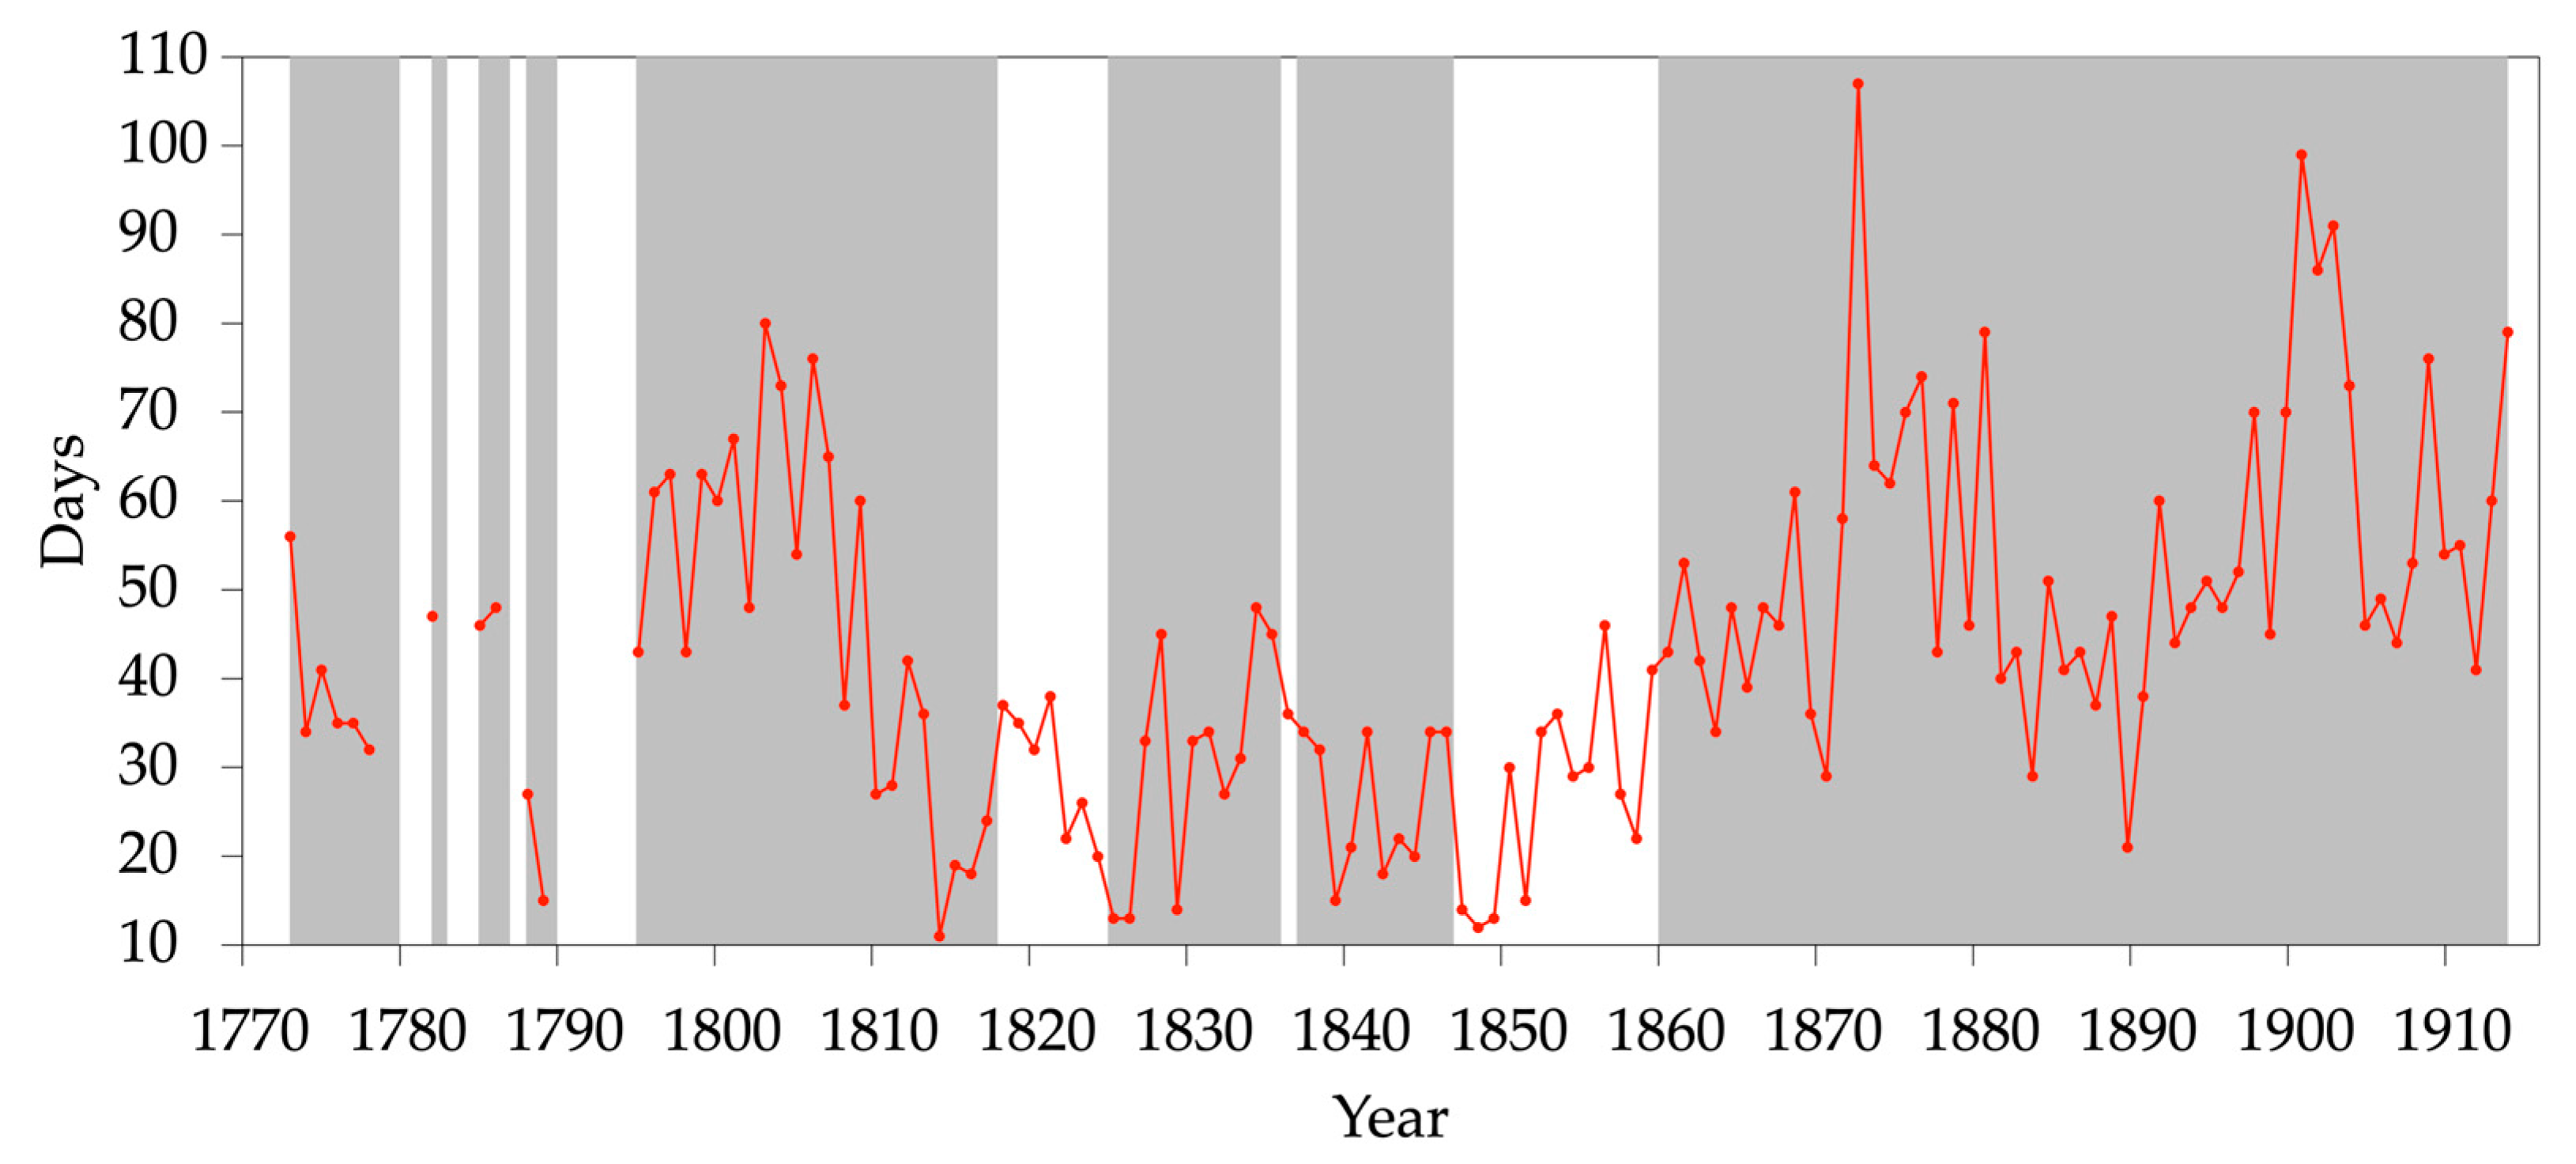
27]. Yearly editions of the journal continued after his death until 1848, providing, most of the time, tables summarizing the monthly number of days with fog and other meteorological phenomena. Starting from 1860, monthly sums of fog occurrence were written as footnotes in the original logs at the Specola. The remaining years, when possible, have been filled manually by counting the days with fog in the logs (
Figure 3).
Some inhomogeneities are present in this time series. Excluding the early years, which have several gaps, the 1795–1809 period had 59 days with fog a year, while in the 1810–1859 they were only 28. A Student’s
t-test of these sets shows that they are statistically different (
p-value < 0.05). Afterward, an oscillatory pattern began, with a maximum in the 1870s and the 1900s, and a minimum in the 1880s–1890s. The change point from 1809–1810 (see
Figure 3) can be explained by a decay of the overall quality of observations, for a bad period under the direction of Giuseppe Santini, which started with the illness of Francesco Bertirossi-Busata and lasted until 1859, when Giuseppe Lorenzoni returned to high-quality observations, as explained in another paper [
28].
In 1865, the Italian Central Meteorological Office was established within the Ministry of the Navy and based in Florence at the Royal Museum of Physics and Natural History, which collected meteorological data from various Italian and foreign stations to produce weather forecasts. Data were recorded at the same hours (9, 15, and 21), using instruments of the same type and cross-compared with each other, and were subsequently entered on forms to be completed in the same manner. Therefore, from the 1860s, a more coherent approach was adopted among the personnel of the meteorological observatories [
29], explaining the change point in the yearly fog occurrence in that period. In the first half of the 19th century, for the astronomers, in particular at the Specola in Padua, only the fog covering the sky was relevant, not the one present at the horizon that was not recorded, as for astronomical observations, only vertical visibility is crucial.
3.2. Hydrographic Office Observations (1917–1954)
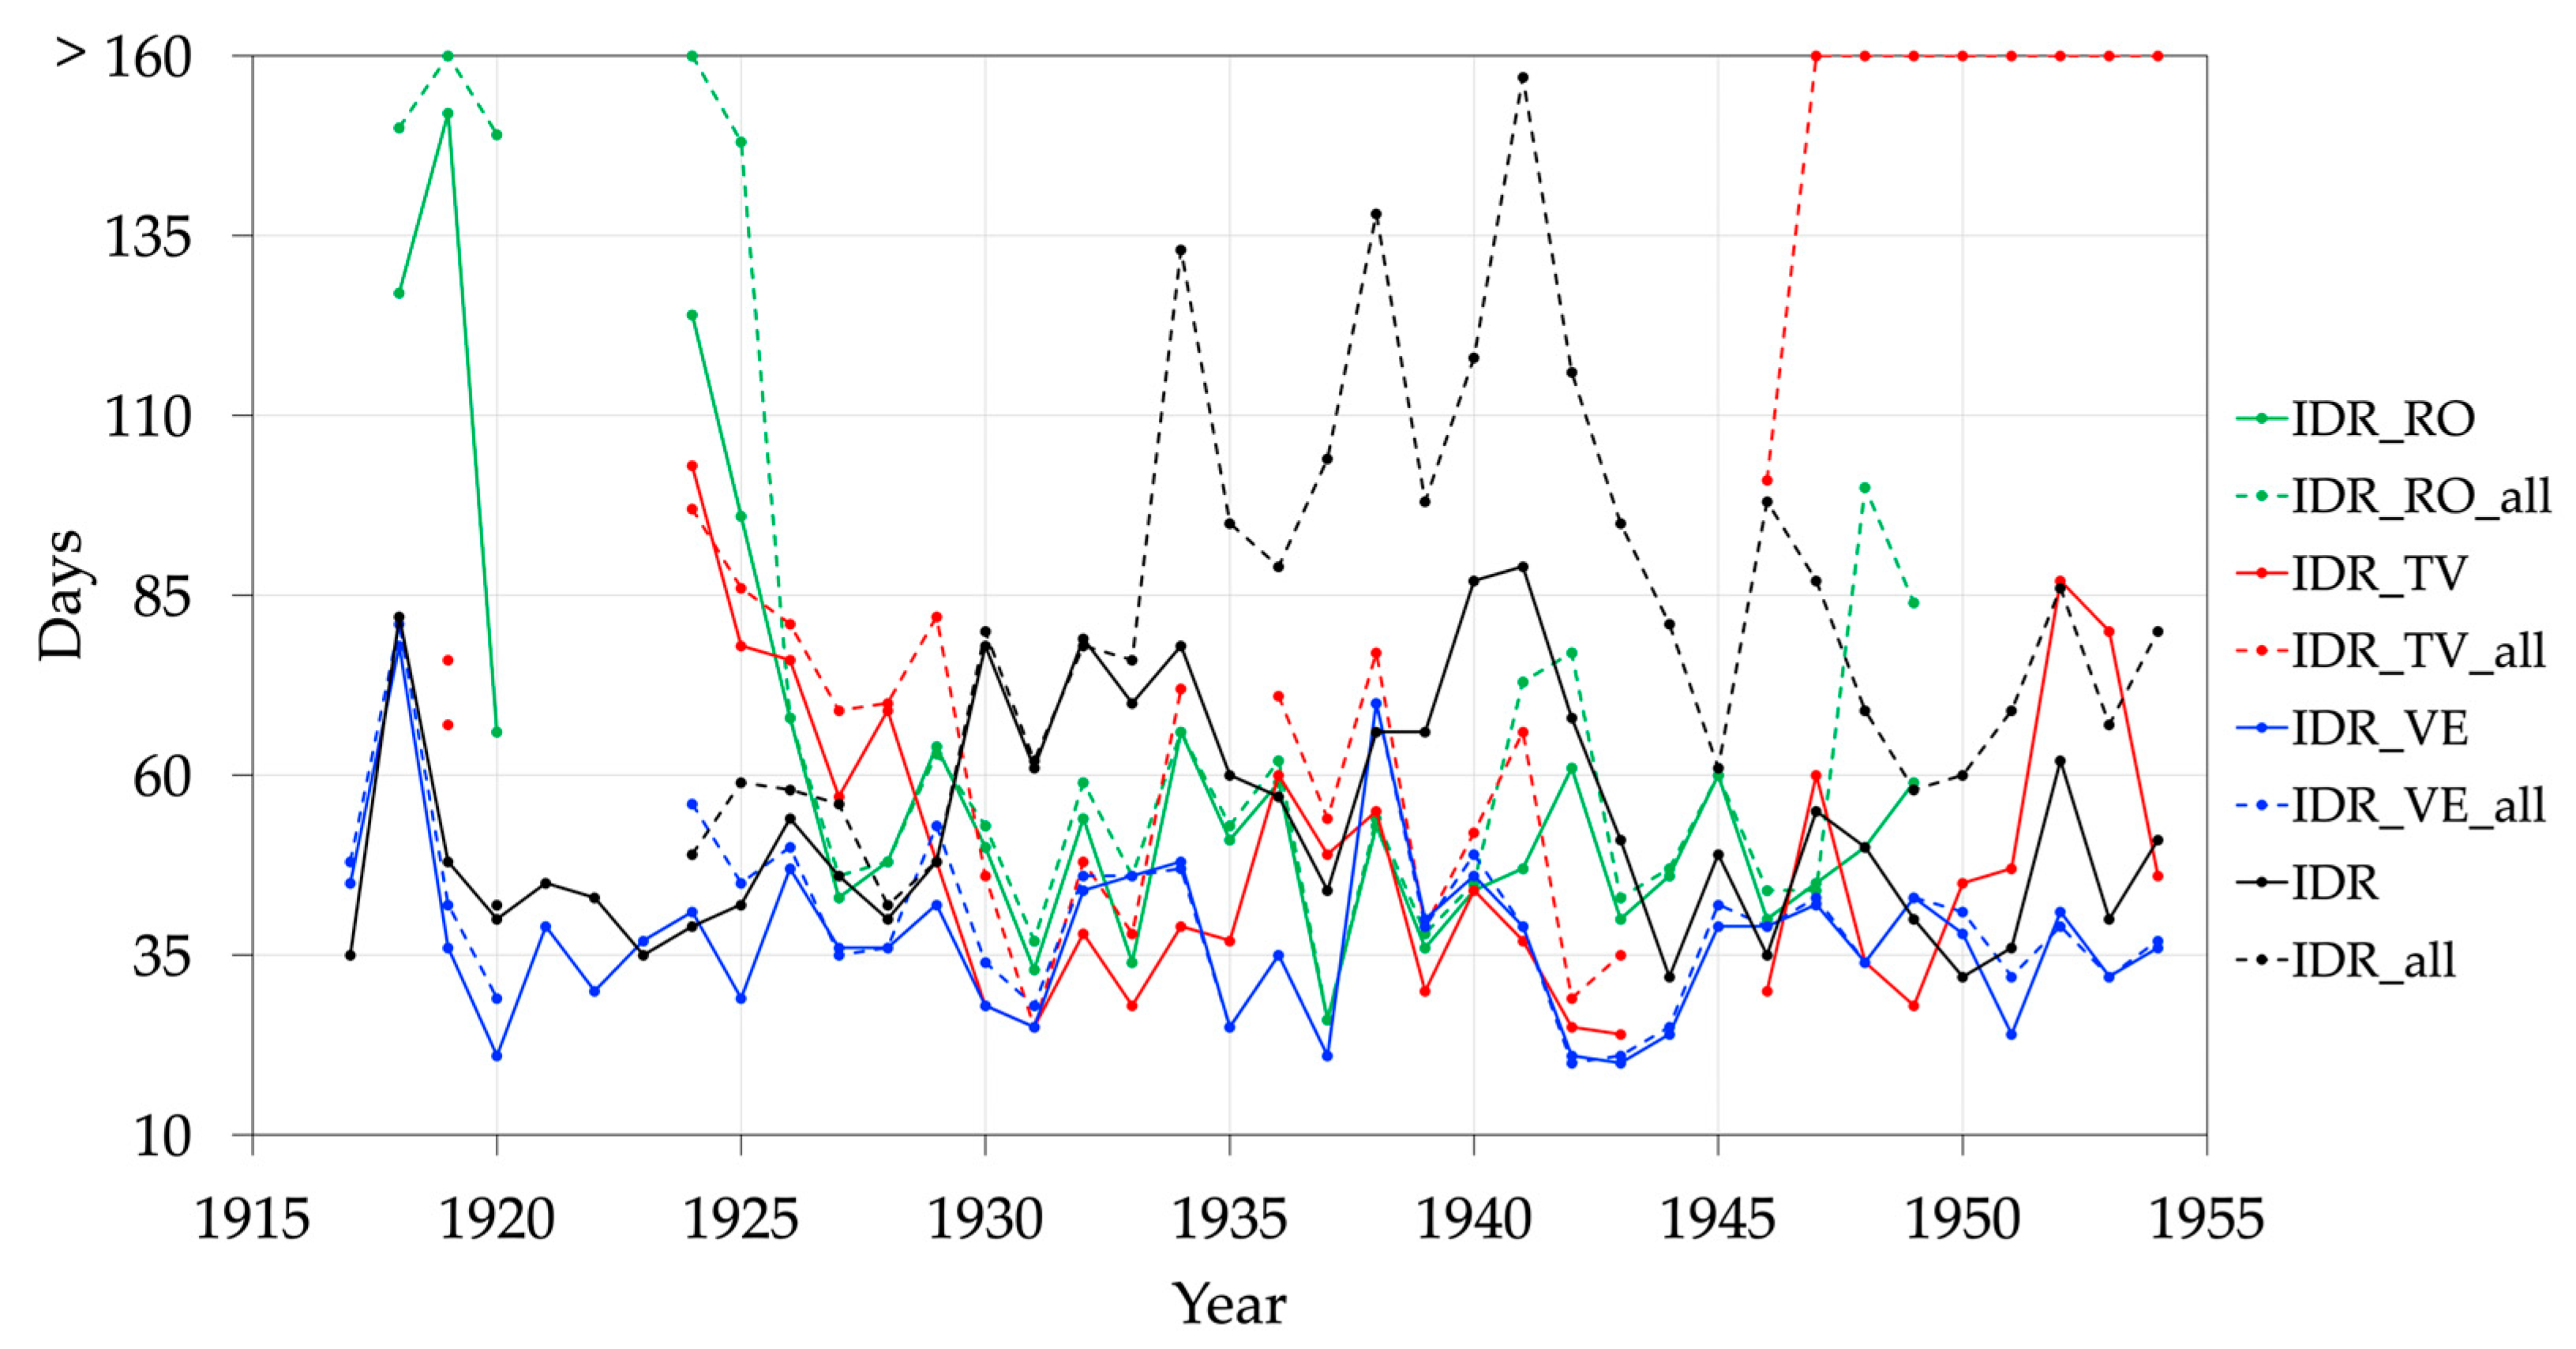
The Hydrographic Office network provided comprehensive meteorological observations, including both instrumental and visual records, as well as descriptions of sky conditions. Observers were instructed to record fog occurrence, distinguishing between cases in which fog covered the entire sky and those in which it was present only above the horizon, leaving the sky otherwise clear. Unfortunately, even these records suffer from significant inhomogeneities.
Figure 4 presents the yearly fog occurrences between 1917 and 1954 for Padua, Venice, Treviso, and Rovigo. Both conditions—including and excluding “fog above the horizon” (FAH)—are shown. The graph has been truncated at 160 days, as larger values are not reliable for this area.
In Padua, from 1924 to 1932, the two records are similar; however, from 1933 onward, the inclusion of FAH results in much higher values than fog occurrences alone. There is no physical explanation for this increasing, especially given that the other locations exhibit different behavior. For instance, in Rovigo, FAH occurrences are anomalously high from the beginning until 1925 compared with subsequent years; in Venice, FAH events remain very rare throughout the entire 1917–1954 period; and in Treviso, they are quite sporadic until 1946, when they suddenly increase to over 160 cases per year.
Nonetheless, excluding the FAH cases, the series still exhibits some anomalous behavior. IDR_RO shows very large values at the beginning of the series, up to 152 days with fog, whereas after 1926, the maximum was only 68. IDR_TV has about 10 more days on average than IDR_VE, whereas more recent data (see
Section 3.3) shows the opposite pattern. Finally, the Padua series (IDR) has a slightly higher average than IDR_VE until 1929 (6 days) and after 1944 (8 days), while the difference is considerably larger in the intermediate period (30 days).
3.3. Air Force Observations (1951–2024)
Starting from 1951, visibility records have been provided by the Air Force network. Surface Synoptic Observations (SYNOPs) are available every 3 h, and a foggy day occurs if at least one of these observations has a visibility below 1 km. The time series of the yearly number of days with fog in Padua, Venice, and Treviso are shown in
Figure 5.
To measure visibility, the observer scans the horizon for predetermined landmarks (such as mountains, islands, churches, or buildings) situated at known distances. A numerical code is then assigned according to the WMO scale [
30], where each code corresponds to the greatest distance at which a predefined object can be clearly seen and recognized with the naked eye. If the observed visibility falls between two listed distances (and thus their associated codes) in the WMO table, the code corresponding to the lower distance is recorded. The uncertainty of visibility observations increases with distance, and the WMO scale accounts for this by reducing the resolution of the codes at higher visibility ranges [
30].
The result of this standardized procedure is a coherent trend of the selected time series, which has its maximum in the 1960s and then decreases until the present day. Padua generally has a higher number of foggy days than the other locations, with a maximum of 109 in 1967.
3.4. Periphery Data (1979–2024)
The visibilimeter provided by ARPAV is located far from the Padua city center, in open countryside, where different microclimatic conditions can be present. The Urban Heat Island (UHI) effect in Padua has been studied extensively: the difference between the temperature in the city center and in its surrounding rural areas is 0.6 °C, which is the result of an increase of 0.3 °C over the last 30 years [
31,
32]. During winter, UHI, jointly with the Urban Relative Humidity Island (URHI), affects the fog presence [
33,
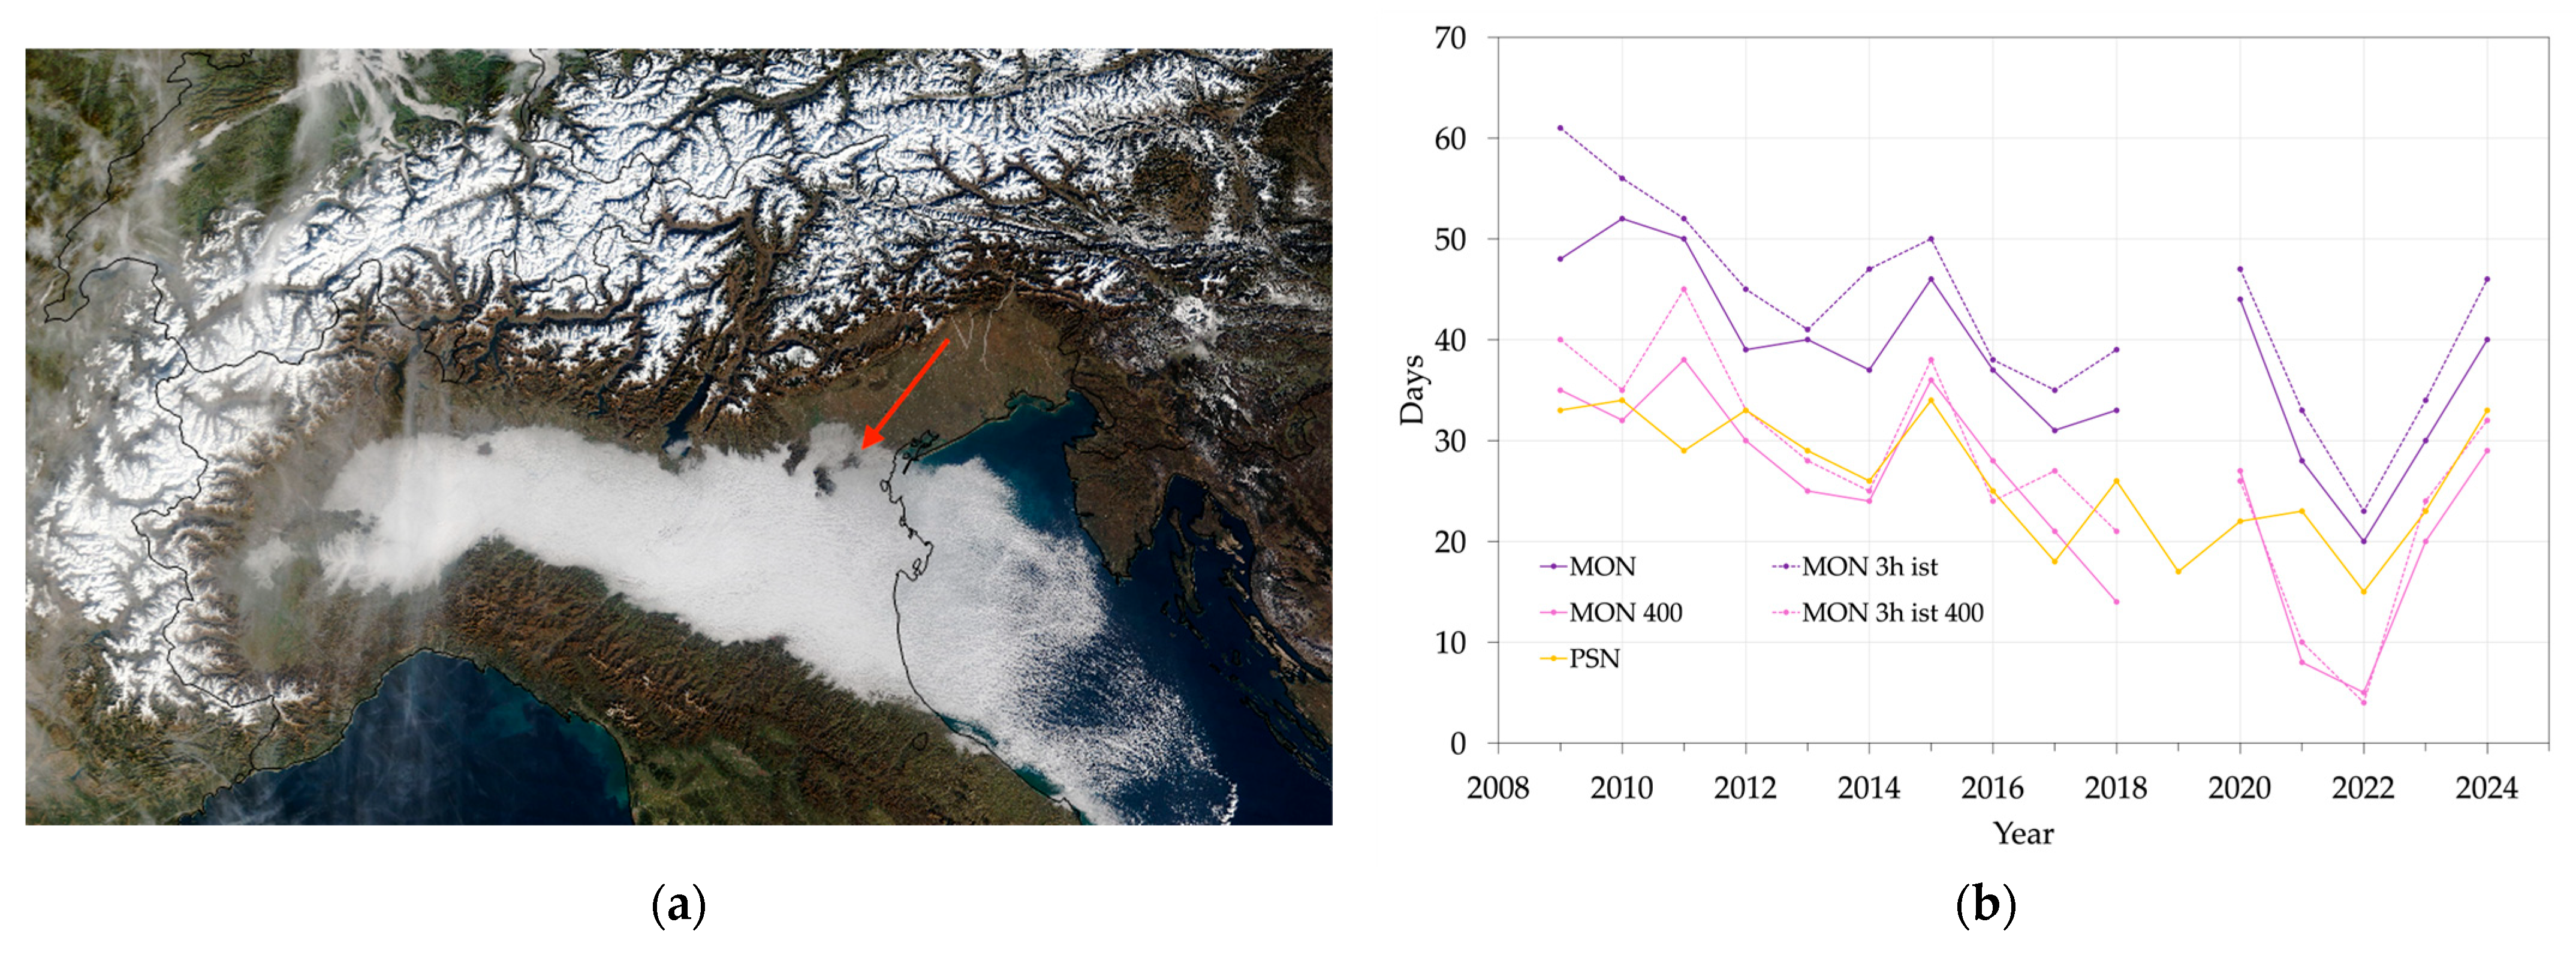
34], as shown for example by the MODIS Terra satellite on 29 January 2024 (
Figure 6a): in anticyclonic conditions, fog usually forms in the Northern Italy plain, but the major cities sometimes emerge as their UHI dissipates the fog. When cold, moist air from rural surroundings is advected to the city, it can reduce urban temperatures and raise relative humidity, favoring fog if saturation is reached. These advections are driven by local wind circulations—such as the local mountain–sea interaction [
35,
36], drainage flows, breezes, or valley jets—whose strength depends on calm synoptic conditions and local topography. Strong inflows can overcome the UHI locally and enable fog to form, while weak ones allow the UHI to dominate, often producing “fog holes” over urban centers [
37,
38].
For example, in Milan—the largest city in Northern Italy with 1,380,000 inhabitants (compared to Padua’s 210,000)—the Urban Heat Island (UHI) effect is stronger. Between 1991 and 2000, the city center experienced only 10% of the foggy days recorded at Linate Airport, located about 7 km east of the city [
7]. In the 1960s, this percentage was 18%, providing evidence of a progressive intensification of the UHI effect. In Padua, however, this difference is more difficult to evaluate. The MON visibilimeter is not affected by Padua’s UHI and URHI effects, and PSN fog observations are taken at the edge of the city’s periphery. Moreover, PSN records only thick fog events, with an uncertain visibility threshold. The PSN and AM datasets, both collected at a comparable distance from Padua’s city center, overlap from 1978 to 1984. This overlap allows the construction of a confusion matrix to compare Boolean fog observations from the two series. True Positives are cases in which both PSN and AM recorded fog; True Negatives are when neither did; a False Negative occurs when AM recorded fog, but PSN did not; and conversely, a False Positive occurs when PSN recorded fog, but AM did not. From these counts, the Matthews Correlation Coefficient (MCC, see
Section 2.2) can be calculated, providing a measure of the quality of the binary classification. When the AM visibility threshold is adjusted, the MCC reaches its maximum (0.65) at a threshold of 400 m, suggesting that PSN most likely uses that visibility level to define fog, on average. Accordingly,
Figure 6b shows not only the MON and PSN yearly series but also MON_400, i.e., the MON fog occurrence recalculated using a 400 m threshold. Because the AM data are given as instantaneous observations every 3 h, MON_3h_ist and MON_3h_ist_400 are also reported for comparison, representing instantaneous values sampled every 3 h.
Table 2 presents the trends for different periods and series. The “3h_ist” cases for MON are shown to be consistent with the AM data. In addition, the “400” cases are also considered for the AM_VE_TE and AM_TV series (AM_VE_TE_400 and AM_TV_400, respectively). Over the 1979–2024 period, PSN and AM_TV_400 exhibit the same linear trend slopes, while the AM_VE_TE_400 series shows a stronger decrease. In contrast, during 2009–2024, both AM_VE_TE_400 and AM_TV_400 display no significant trend, whereas PSN exhibits a more negative trend compared to the 1979–2024 period. A possible explanation is the expansion of the metropolitan area, which may have enhanced the UHI and URHI effects. Conversely, the steeper decrease observed in the MON series—considering both the 1000 m and 400 m thresholds—may be due to a potential drift in the visibilimeter signal, the calibration of which is currently under investigation by ARPAV.
At the daily level, MON observations can be used to explore the hourly distribution of fog occurrence, shown in
Figure 7 for each season. In winter (DJF), 5 and 6 local time (LT) have the highest fog frequency, reporting fog in 12% of the days; the minimum occurs at 14 LT, with less than 1% of the days. Autumn (SON) is the second season with the highest fog frequencies, with a maximum of 6% at 6 LT, and the percentage decreases to 2% in spring (MAM). Finally, fog is nearly absent in summer. Foggy conditions in summer may develop after thunderstorms, when downdrafts bring cooler air from the upper atmosphere, causing a sharp drop in surface temperature. This cooling effect can be further enhanced during clear and calm nights, leading to fog formation around sunrise [
8,
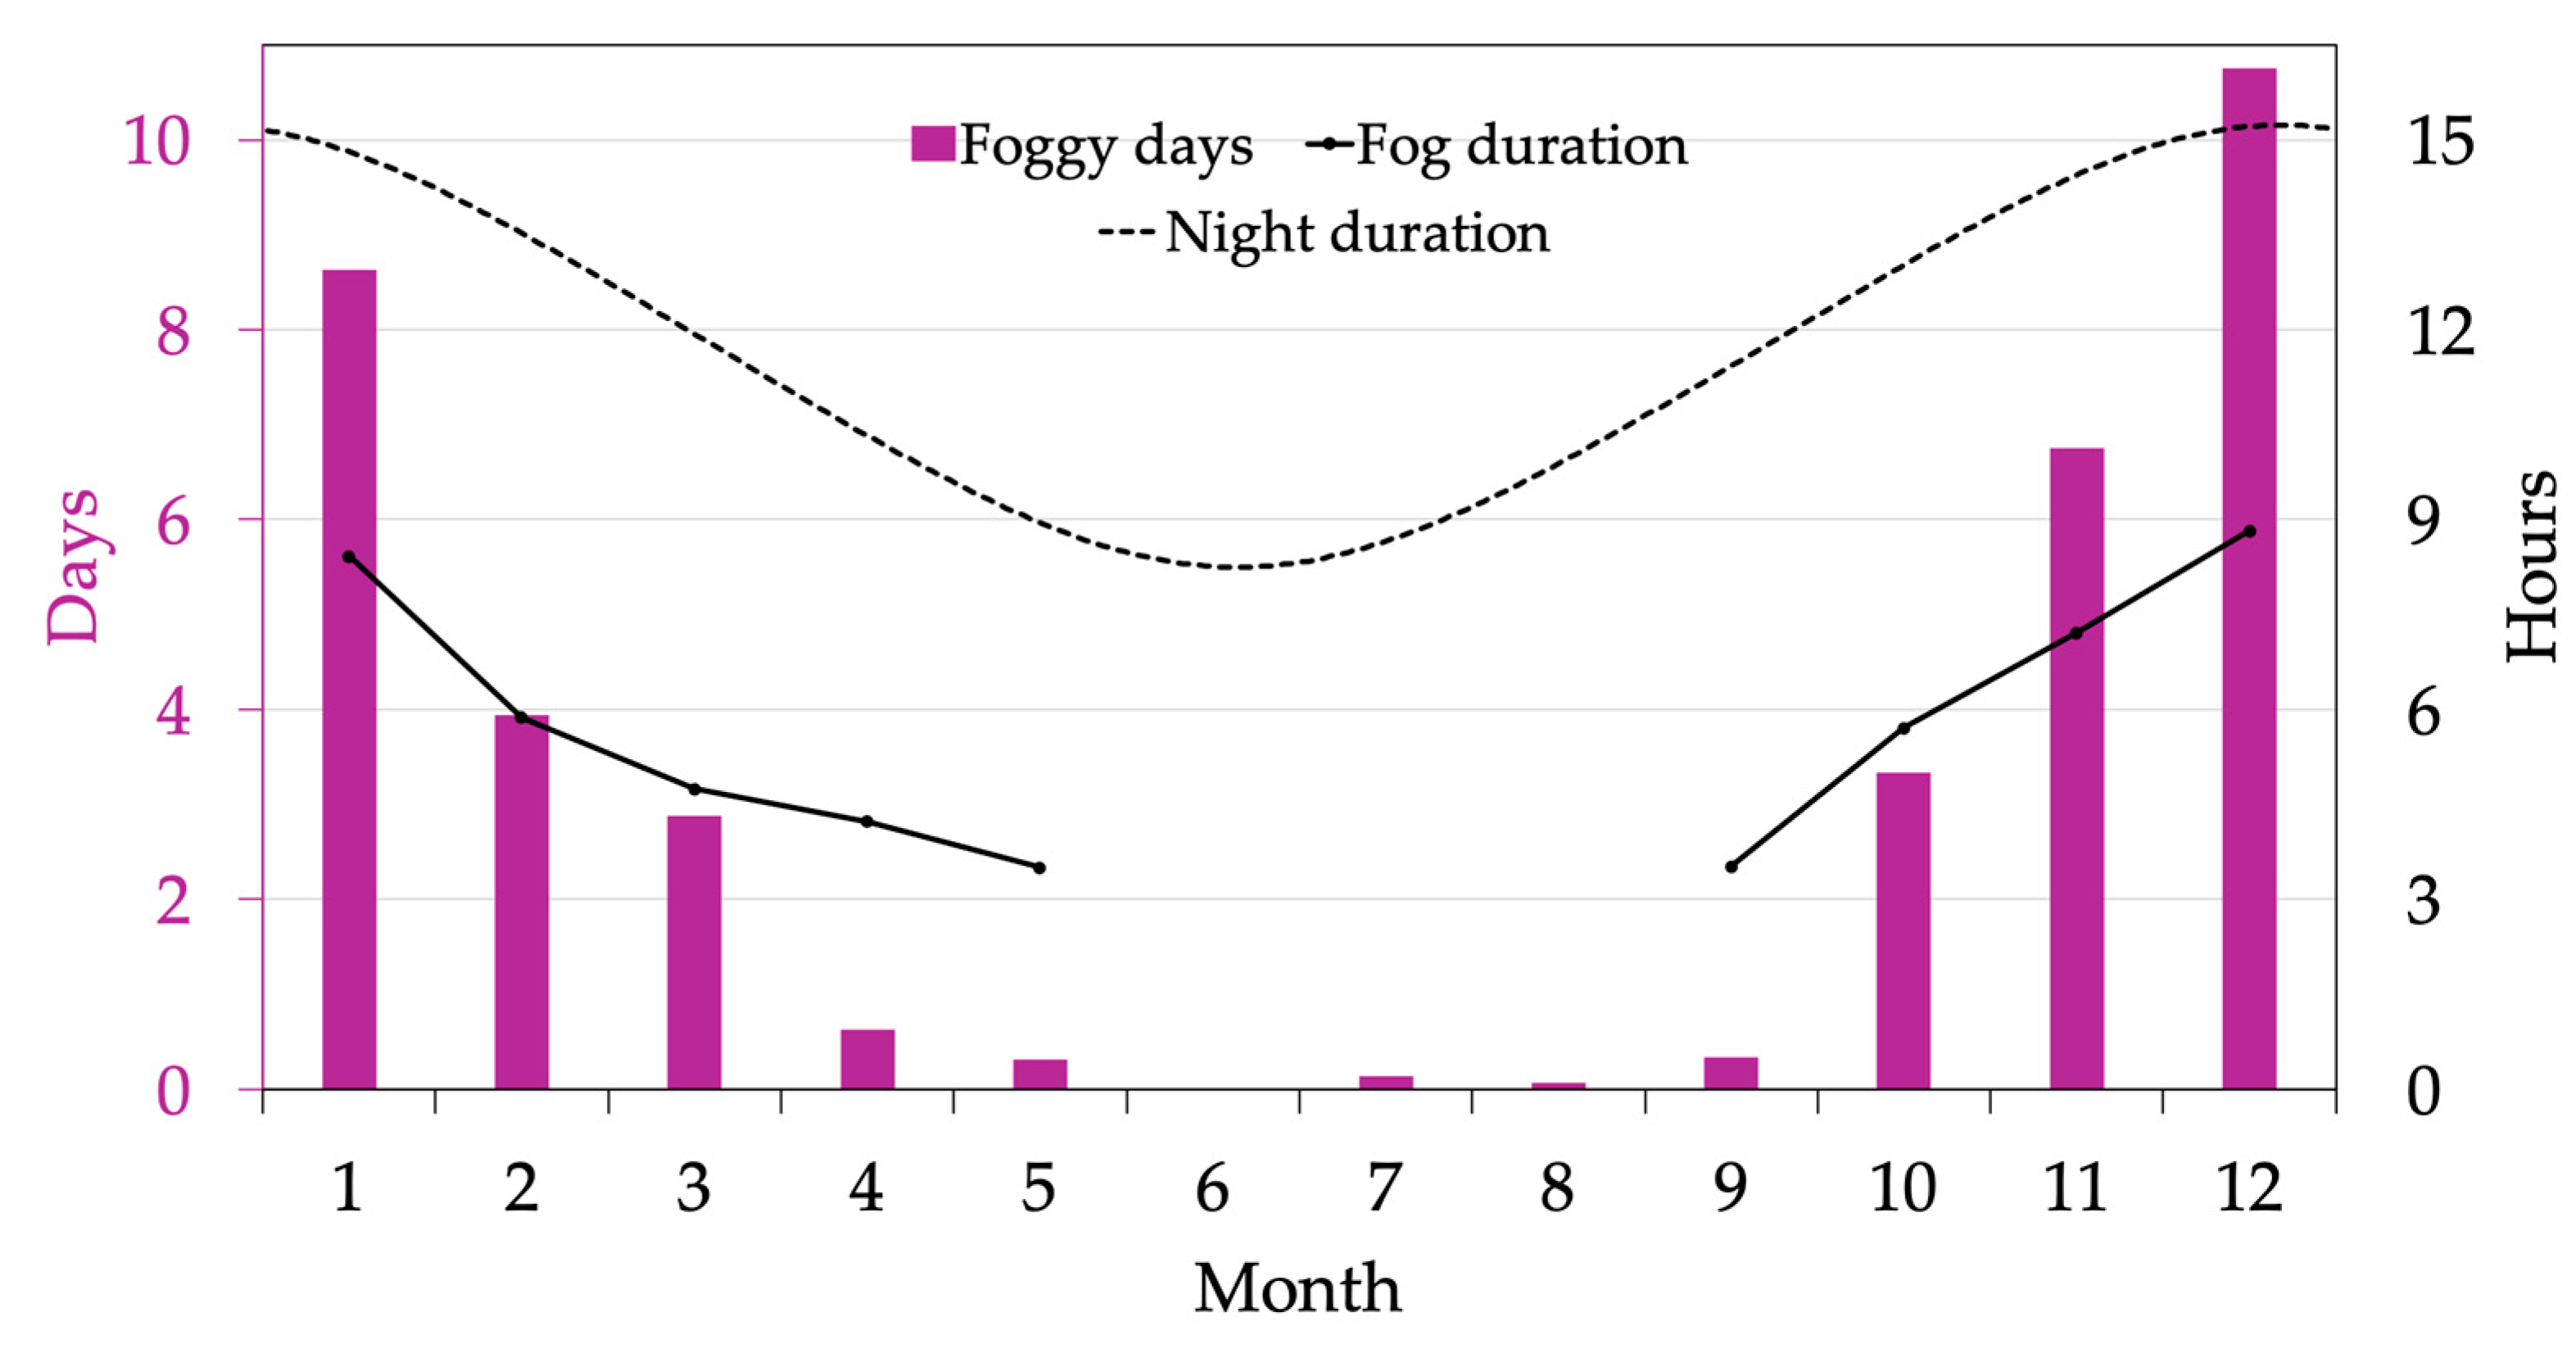
9]. The maximum in winter is explained by the shorter and smaller solar input. In this season, the nighttime is over 15 h (
Figure 8), which means a severe cooling for IR loss in the clear night, with formation of temperature inversion and lack of diffusion of pollutants, especially those emitted for domestic heating and traffic. When the ground is reached by solar radiation, the convective mixing with the upper layers dissipates the fog and disperses the pollution.
This seasonal evolution can also be appreciated in
Figure 8, which shows the mean monthly number of foggy days jointly with the mean duration of fog events. In December, the number of days with fog reaches a maximum of 10–11, while it is practically zero from June to August. When fog occurs, it persists for over 8 h, on average, in January and December (half of the night duration, see
Figure 8), while the duration is halved in May and September. This calculation cannot be performed for the summer months because of the scarcity of the number of events.
The decrease of foggy days over the last decades is associated with a less polluted environment, as in Italy, the SO
2 concentration decreased on average since the 1980s, and the concentrations of NO
x, PM
10 and PM
2.5 decreased since the 1990s [
39]. PM
10 daily mean concentrations are available for Padua since February 2001, allowing a direct comparison with the fog occurrence, shown in
Figure 9. The number of days with a PM
10 mean value over 50 mg/m
3 has a linear trend of −1.8 ± 0.3 days/year in the 2002–2024 period, and the linear correlation coefficient with PSN is 0.21 over the same period, not significant, while with MON it is 0.50 in the 2009–2024 period, which has a
p-value of 0.055. Thus, PM
10 concentration has a medium correlation with fog occurrence (MON) but no link with thick fog presence (PSN). This can be explained because fog is generated by saturated moisture in the air, i.e., when the air temperature reaches the dew point. This is related to two factors: air temperature and moisture content in the air. These are independent of pollution. However, pollution supplies condensation nuclei that may facilitate the onset (and therefore the duration) of fog, e.g., fog formed at around 90% RH instead of 99% RH [
40].
4. Conclusions
This study provides the longest available reconstruction of fog occurrence in Padua and the stations nearby, covering 252 years, from 1773 to 2024. The analysis of multiple heterogeneous datasets—ranging from early qualitative observations to modern instrumental measurements—highlights the challenges of comparing fog frequency across different periods due to changes in definitions, thresholds, and observational practices.
Early records from the Specola Observatory show significant inhomogeneities associated with changes of the observer and evolving criteria for reporting fog. Similarly, the Hydrographic Office data (1917–1954) exhibit inconsistencies among stations and over time, suggesting that non-climatic factors often dominate variability in these historical series. By contrast, Air Force observations from 1951 onwards provide a more standardized record, revealing a coherent trend: fog frequency peaked in the 1960s and declined thereafter. The most recent visibilimeter data confirm this decreasing tendency.
The long-term decrease in fog occurrence, consistent with the findings for other regions in northern Italy, appears to be linked to a combination of factors, including improvements in air quality and the intensification of the urban heat island effect. While PM10 concentrations show only a moderate correlation with fog in the most recent period, their overall decline since the early 2000s coincides with the observed reduction in fog frequency.
Despite the uncertainties inherent in historical observations, this analysis demonstrates that Padua—historically one of the foggiest locations in Italy—has experienced a marked decrease in fog days over the last half-century, when severe laws were applied to control fuels for domestic heating and traffic, and reduce air pollution. These findings have implications for transportation safety, air quality, and urban planning in the context of ongoing climatic and anthropogenic changes.
The main limitations of this study arise from the heterogeneity of observational methods, incomplete metadata, and uncertainties in historical definitions of fog. Instrumental biases, particularly in the latest visibilimeter series, may also influence recent trends. Future research should focus on integrating additional metadata to improve comparability and exploring the role of atmospheric composition and land-use changes in shaping fog variability. The development of high-resolution models incorporating microphysical processes and urban effects could further clarify the drivers of long-term fog occurrence.
