1. Introduction
Modern climatic changes can substantially change the recreational properties of resorts, affect the state of health and the feeling of comfort of the environment by a person, and even reduce the tourist flow [
1,
2]. Most methods for characterizing the comfort of climatic conditions are based on bioclimatic indices [
1,
2,
3], which, in turn, not only characterize the features of the environment, but are also indicators of well-being and determine comfort and discomfort zones for a person [
4]. Bioclimatic indices are selected taking into account the availability and quality of meteorological data, regional characteristics of the territory, and the effectiveness of comfort indicators in assessing the heat load over the year for the studied region. In Russia, these indices are used to assess the bioclimatic conditions of large megacities [
5,
6] and the medical-climatic characteristics of localities intended for the organization of therapeutic recreation and tourism [
7,
8,
9,
10,
11,
12,
13,
14,
15,
16,
17,
18,
19,
20,
21,
22,
23,
24,
25].
The analyzed Black Sea coast lies in the subtropical climate zone and is characterized by the unique landscapes and medicinal vegetation. The main determining climatic factor here is the presence of two mountain ranges: the Crimean Mountains, located on the southern coast of the peninsula, and the Caucasus Mountains, on the Black Sea coast of the Caucasus. They serve as a kind of natural barrier that protects the coast from winds and at the same time captures the flow of moist air from the sea.
In the Southern coast of Crimea, the height of the mountains is lower than the Caucasus Mountains, so there is less intensive condensation of moisture. This, in turn, is the cause of a rather dry, hot summer with little rainfall. In the summer season, the air humidity index here does not exceed 58%, which helps the body to tolerate heat better. Such a climate is considered healthier and is good for vacationers with various pulmonary and bronchial diseases. Therefore, the Southern coast of Crimea is characterized by a subtropical Mediterranean type of climate in contrast to the predominantly temperate type of climate in the rest of the Crimea. Here, as on the shores of the Mediterranean Sea, winter precipitation prevails over summer precipitation. Winter is mild and humid, with predominantly positive temperatures due to the warming effect of the sea and the proximity of the mountains. Despite the positive temperatures at this time, high humidity can have a strong cooling effect, and therefore the use of the wind cooling index is very appropriate [
26].
The climate of the Caucasian coast is typical subtropical, with humid, hot summers and wet winters with heavy rainfall. Due to the high altitude of the Caucasus Mountains, moist air from the sea condenses and falls, causing a large amount of precipitation. The average air humidity of 76–80% is difficult to tolerate, especially when accompanied by thermal overheating. Among the effective methods for characterizing thermal bioclimatic conditions in the warm and transitional seasons, various types of equivalent temperatures are usually used [
26,
27]. In this study, the equivalent effective temperature is used. Moreover, in hot weather and at high humidity values, there may be a feeling of physiological oxygen deficiency. In this case, the calculation of the weight oxygen content (partial oxygen density) in the air will help determine the type of weather and its comfort level.
Yalta and Sochi are the largest resorts on the analyzed Black Sea coast, and they can be considered as the reference representatives of the resorts of the Southern coast of Crimea (Yalta) and Caucasian coast (Sochi) on climatic and bioclimatic features. Earlier, the authors conducted a comprehensive analysis of bioclimatic conditions in the territory of Crimea over a long period in order to assess the possibility of developing year-round tourist activity in the region [
28] and studied the features of changes in the spatio-temporal dynamics of average and extreme daily index values in the resorts of Crimea [
27,
29].
Bioclimatic indices are determined by hydrometeorological conditions and their changes, which in turn are largely associated with the global climate system [
27,
28,
29]. Specially developed projects and programs, such as CLIVAR, EUROMED, etc., proved that the state, change, and variability of the global climate system on the interannual-multidecadal scale can be described by global processes in the ocean–atmosphere system, called climate modes or oscillations, whose permanent centers of action are located over the oceans [
30,
31,
32]. The manifestations of these oscillations in regional climatic anomalies of the European, Mediterranean, and Black Sea regions were shown in many studies, for example [
33,
34,
35].
The main climate mode determined by the baric (geopotential height) field of the entire Northern Hemisphere is the North Atlantic Oscillation (NAO) [
36]. The NAO index and phase are determined by the seesaw fluctuations of pressure anomalies between the centers of action: the Azores maximum and the Icelandic minimum. These fluctuations determine the intensity of western flow at mid-latitudes and regional weather-climatic anomalies in Europe [
34,
37,
38,
39,
40,
41,
42,
43]. The North Atlantic storm tracks experience a shift depending on the NAO phases: to the north-northeast in the positive phase and to the south-southwest in the negative phase [
34]. The NAO is pronounced in all seasons of the year and is manifested on scales from several days to several centuries [
44,
45].
The second climate mode determined by the baric field of the Northern Hemisphere is the East Atlantic Oscillation (EAO) [
35,
40,
46,
47]. As in the case of the NAO, the spatial structure of the EAO is represented by a dipole in the geopotential field of the North Atlantic; however, the centers of action of the EAO are shifted to the south-southeast relative to the NAO centers. For this reason, the EAO is sometimes interpreted as a “south-shifted” NAO mode that characterizes the intensity of zonal flow [
35,
40]. The character of influence of the EAO does not differ from that of the NAO and consists of the prevalence of the type of atmospheric circulation in different phases: the zonal circulation type in the positive phase and the meridional type in the negative phase. The EAO is also manifested in all seasons over the year and most pronounced in winter. It is important that there are many more studies devoted to the analysis of NAO manifestations than those of the EAO, which nevertheless is an independent oscillation (orthogonal mode to the NAO) [
36].
Moreover, the variability of regional climatic characteristics is determined by the combined influence of global processes of different scales, as shown by the example of the Black Sea region in [
35]. The joint influence of the interannual NAO and EAO modes plays an important role in changing the circulation and temperature regime in the Atlantic-European region [
41,
48]. Thus, the NAO index mainly reflects latitudinal variations in the position of storm tracks, and the EAO index affects the number of cyclones and their intensity [
49,
50]. Cyclones cause large-scale anomalies of air pressure, temperature, precipitation, and other characteristics, including dangerous and extreme weather events. Taking into account these parameters, expressed in terms of bioclimatic indices, is necessary to ensure a full-scale recreational process at resorts. It is important to have a comprehensive assessment of the typical variability of bioclimatic characteristics from year to year, as well as an assessment of abnormal (extreme) conditions that can significantly affect health and lead to serious negative consequences.
Therefore, this study is a logical continuation of previous research [
27,
29], but earlier studies on the assessment of bioclimatic conditions did not analyze the influence of global climate processes of the interannual-multidecadal scale on the variability of bioclimatic indices and their extreme values. In this connection, there is a need to assess the impact of large-scale processes on the variability of the comfort level of weather conditions. The aim of this study was to characterize the change and variability of bioclimatic indices in Yalta and Sochi and assess responses of their extremes to the interannual climate modes: North Atlantic Oscillation and East Atlantic Oscillation. The obtained results will contribute to solving the problem of long-term forecasting of regional climatic anomalies and the problems of planning and rational organization of therapeutic recreation and tourism, improving the effectiveness of climate therapy in the structure of sanatorium treatment at the resorts.
2. Materials and Methods
The analysis of the average and extreme bioclimatic indices was done for the middle months of winter and summer (January and July). Using daily NCEP/NCAR reanalysis data (retrieved from the
https://psl.noaa.gov/data/gridded/data.ncep.reanalysis.html, accessed on 30 May 2023) on air pressure, humidity wind speed (2.5° × 2.5° grid), and E-OBS reanalysis [
51] data on air temperature (0.25° × 0.25° grid) over the period 1950–2018 for Yalta and 1950–2013 for Sochi, the following bioclimatic indices were calculated: equivalent-effective temperature (EET) according to the Missenard methodology [
17], weight oxygen content in the air (partial oxygen density) (ρO
2) [
52], and wind cooling index according to Hill (H
w) [
53]. The NCEP/NCAR reanalysis was chosen, despite the coarse resolution, for the longest data series covering two climatic periods of 30 years, according to the definition of climate and the recommendations of the World Meteorological Organization [
54].
Equivalent-effective temperature (EET) takes into account the complex influence of temperature, relative humidity, and wind speed on a person. EET reflects a combination of meteorological parameters, which together give the same thermal effect as with stationary saturated air and a certain temperature. This bioclimatic index is usually used to assess the heat feelings of a half-naked (up to the waist) person. Calculations of the EET index are carried out using Equation (1) according to [
17]:
where
t is the air temperature (°C),
υ is the wind speed (m/s), and
f is the relative humidity (%). Comfortable index values are in the ranges from +12 to 18 °C (“comfort-moderately warm”) and from +18 °C to 24 °C (“comfort-warm”).
Such bioclimatic indices as normal equivalent-effective temperature and biologically active temperature are directly related to EET, and their annual variations coincide. In this regard, the analysis was carried out only for EET as a key indicator among various types of equivalent temperatures.
The weight content of oxygen in the air (partial oxygen density) (ρO
2) according to the method of [
52] is widely used for making medical forecasts, since this bioclimatic index is important for determining the type of weather throughout the year. To determine the partial density of oxygen in the air, the following Equation (2) [
52] is used:
This is example 2 of an equation:
where
P is atmospheric pressure (mbar),
e is the partial pressure of water vapor (mbar),
R is the specific gas constant for dry air at a pressure expressed in mbar, equal to 2.87 × 10
3 cm
2 s
−2 degree
−1,
T is the absolute temperature equal to 273° + air temperature, °C (degree); 0.2315 is the weight proportion of oxygen in dry air.
Values from 240 to 300 g/m
3 are considered the norm for human life [
12]. The distribution of partial oxygen density in the air in time and space has a diurnal and seasonal cycle and is estimated by the magnitude of the daily deviation of this index from the average values (285 g/m
3). In this regard, three types of weather are distinguished: favorable (fluctuations in the weight content of oxygen do not exceed 5 g/m
3), moderately unfavorable (a decrease in the weight content of oxygen by 5–10 g/m
3), and unfavorable (a decrease in the weight content of oxygen by 15 g/m
3 or more) [
52].
The wind cooling index according to Hill (H
w), or the “cold stress” index, differs from effective temperatures in that the effect of heat sensation and discomfort is not calculated on the basis of humidity, but is specified adjusted for wind speed. According to [
55], every meter of wind speed lowers the temperature by 2 °C. The wind cooling index characterizes the intensity of heat loss in a moving moist air flow. With its high uncomfortable values (more than 50 mcal cm
−2 s
−1), it acts as an indicator limiting a person’s stay in the open air and determining the need for appropriate clothing. The index is calculated using Equation (3) according to [
53]:
where
t is the air temperature (°C),
υ is the wind speed (m/s), and
e is water vapor pressure (mbar).
Among the comfortable values of the wind cooling index, three intervals are distinguished: relatively comfortable range within 31–50 mcal cm−2 s−1; moderately comfortable range within 11–30 mcal cm−2 s−1; and comfortable conditions < 10 mcal cm−2 s−1.
The analysis of the number of days with extreme values of bioclimatic indices in Yalta and Sochi was also carried out. The values of meteorological parameters, and in this case bioclimatic indices, are considered extreme if their value is above or below a certain threshold. Therefore, not just anomalies of bioclimatic indicators were analyzed, but extremes implying “tails” of the distribution.
Among the many existing options for the selection of extreme values, the method of relative thresholds was used in this paper, which allows taking into account local features of climate and terrain. Fixed thresholds may not be representative for different localities. The 5th and 95th percentiles were calculated as relative thresholds. For convenience, we call percentiles close to the left “tail” of the distribution (lower 5th percentile) “extremely low values”, and percentile close to the right “tail” of the distribution (higher 95th percentile) “extremely high values”. Extremely high/low values are associated with the windy/windless conditions in the case of Hw index, fresh(hyperoxia)/stuffy conditions in the case of ρO2 index, and hot/cold conditions in the case of EET index.
Relative thresholds (5th and 95th percentile) were calculated for each month. Values below the 5th and above the 95th percentile were selected from the series of bioclimatic indices. Then, the number of days with extremely high (above the 95th percentile) and extremely low (below the 5th percentile) values was calculated for each month.
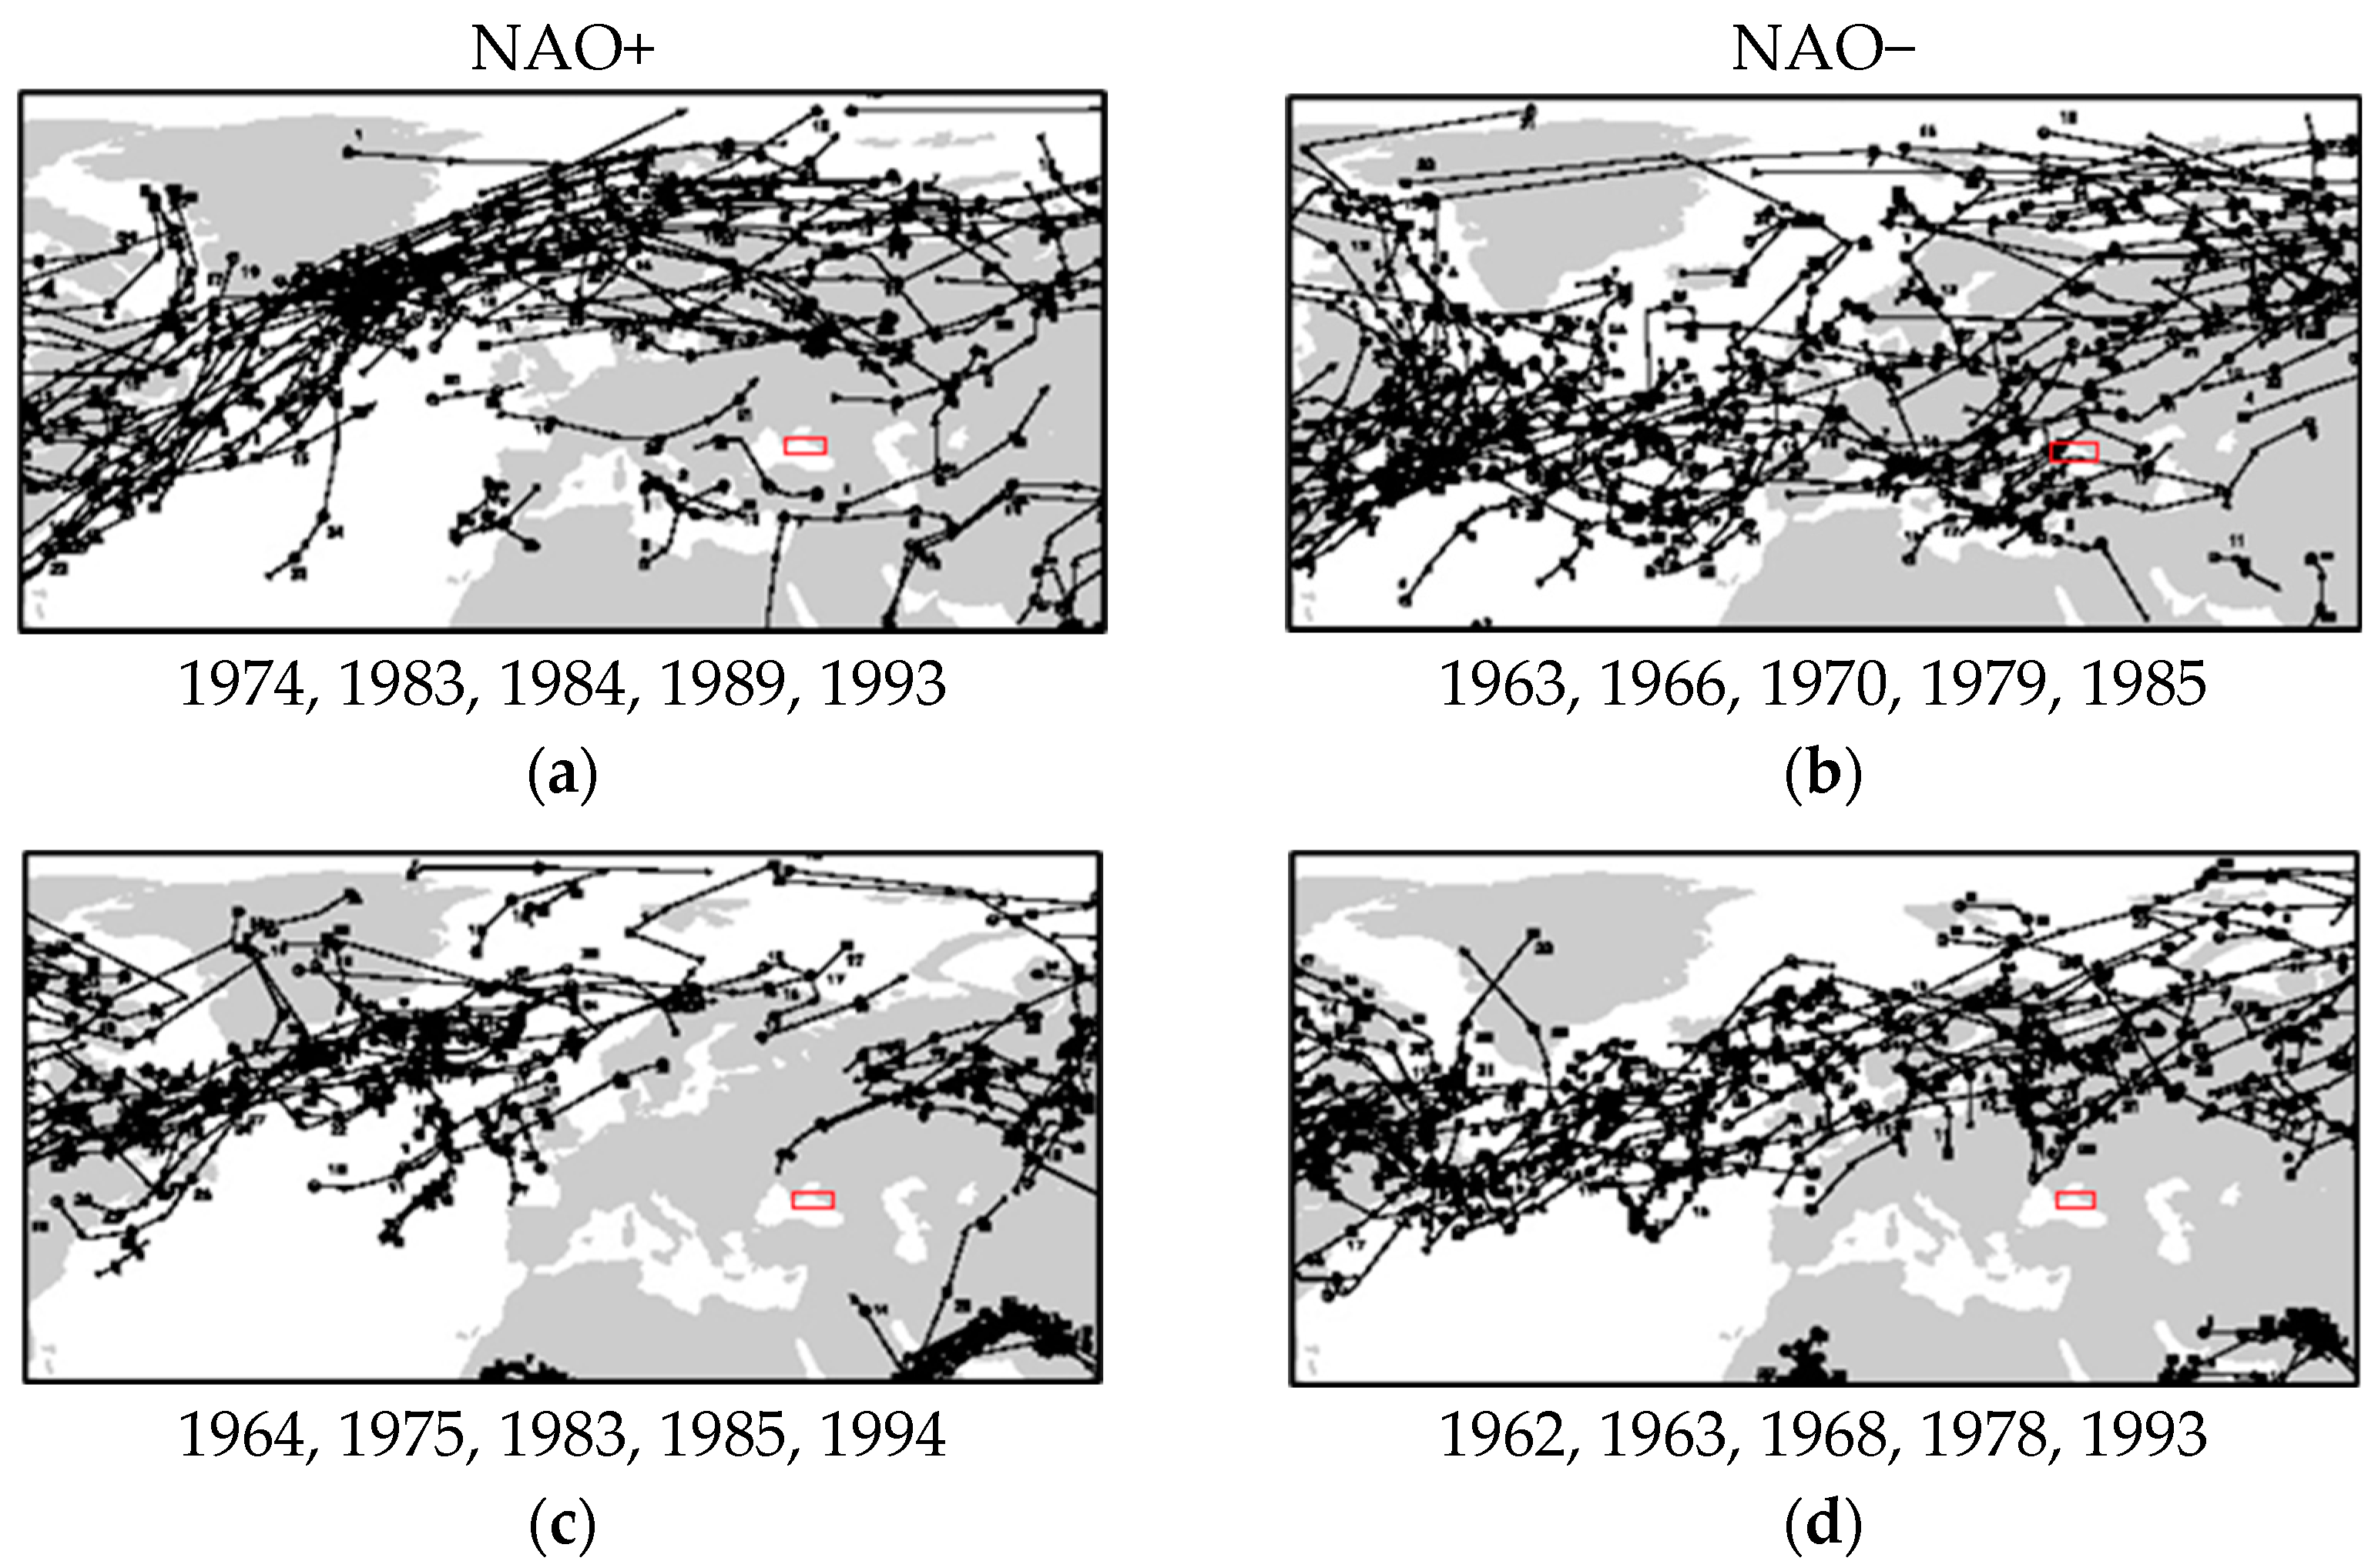
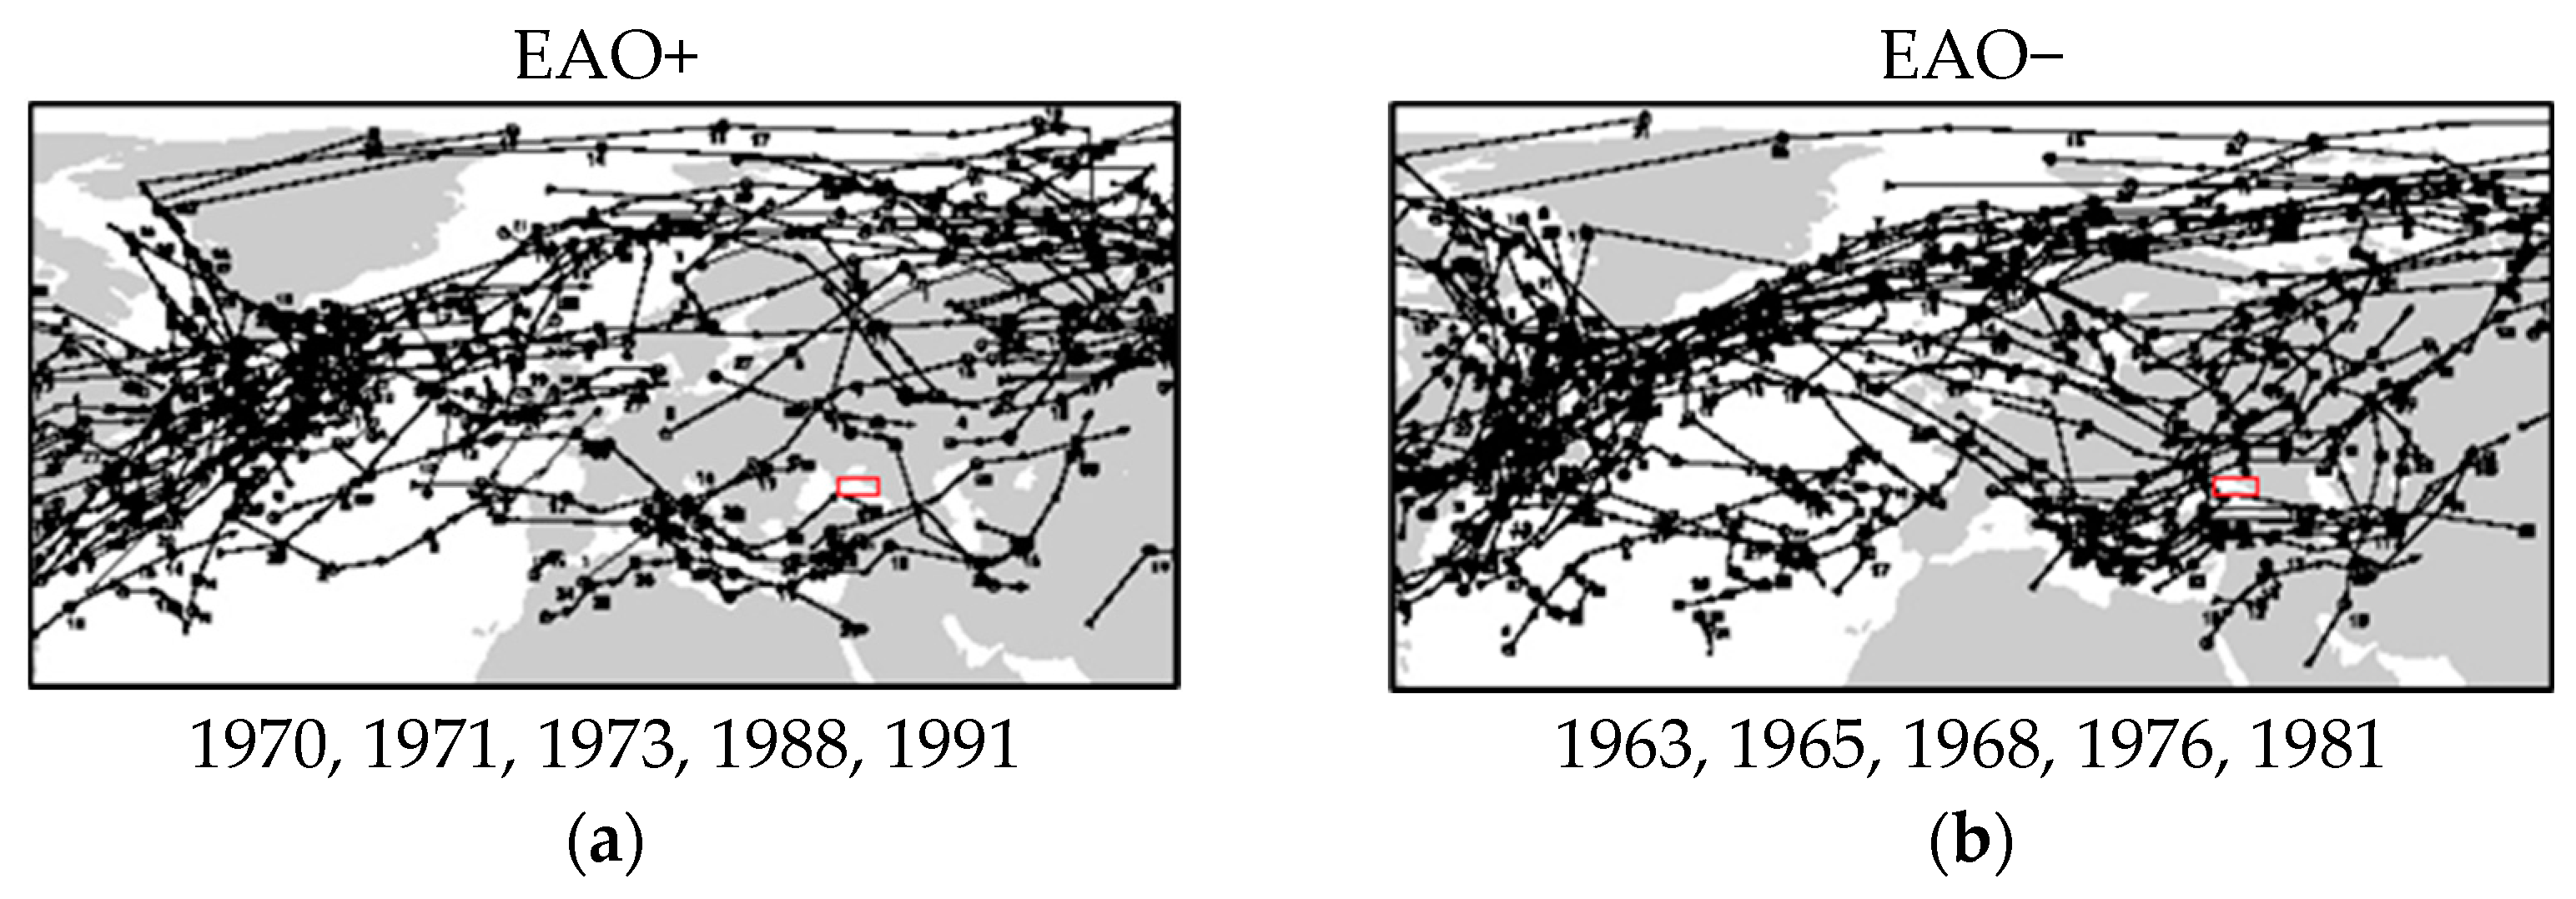
The composite method was used to analyze the relationship between the frequency (in the number of days) of extreme values of bioclimatic indices with the North Atlantic Oscillation (NAO) and the East Atlantic Oscillation (EAO) indices. These oscillations were chosen because they are the two most prominent modes of low-frequency variability (or teleconnection patterns) identified by the orthogonally rotated principle component analysis of Northern Hemisphere 700 mb geopotential heights in [
36]. They affect cyclonic activity (
Figure 1 and
Figure 2) and associated meteorological parameters over the Northern hemisphere. Schemes of storm tracks in the positive and negative NAO and EAO phases (
Figure 1 and
Figure 2) were obtained using the Atlas of Extratropical storm tracks (retrieved from the
https://data.giss.nasa.gov/stormtracks/, accessed on 30 May 2023).
The algorithm of the composite analysis was as follows. Monthly series of the number of days with extreme values were rearranged in relation to the sorted (from larger to smaller) NAO/EAO indices. From each end of the ranked series, 10 values were averaged, which corresponded to the maximum NAO/EAO index values (positive phase) and minimum index values (negative phase). The average number of days related to the NAO/EAO phases (in other words, composites) was calculated for extremely high and extremely low bioclimatic indices separately. To visualize the results, the difference of the composites for each oscillation was used (a larger value for one phase minus a lower value for another phase) and expressed as a percentage of the larger number of days in one of the phases. The confidence probability of the differences was assessed using the Student’s t-criterion.
3. Results
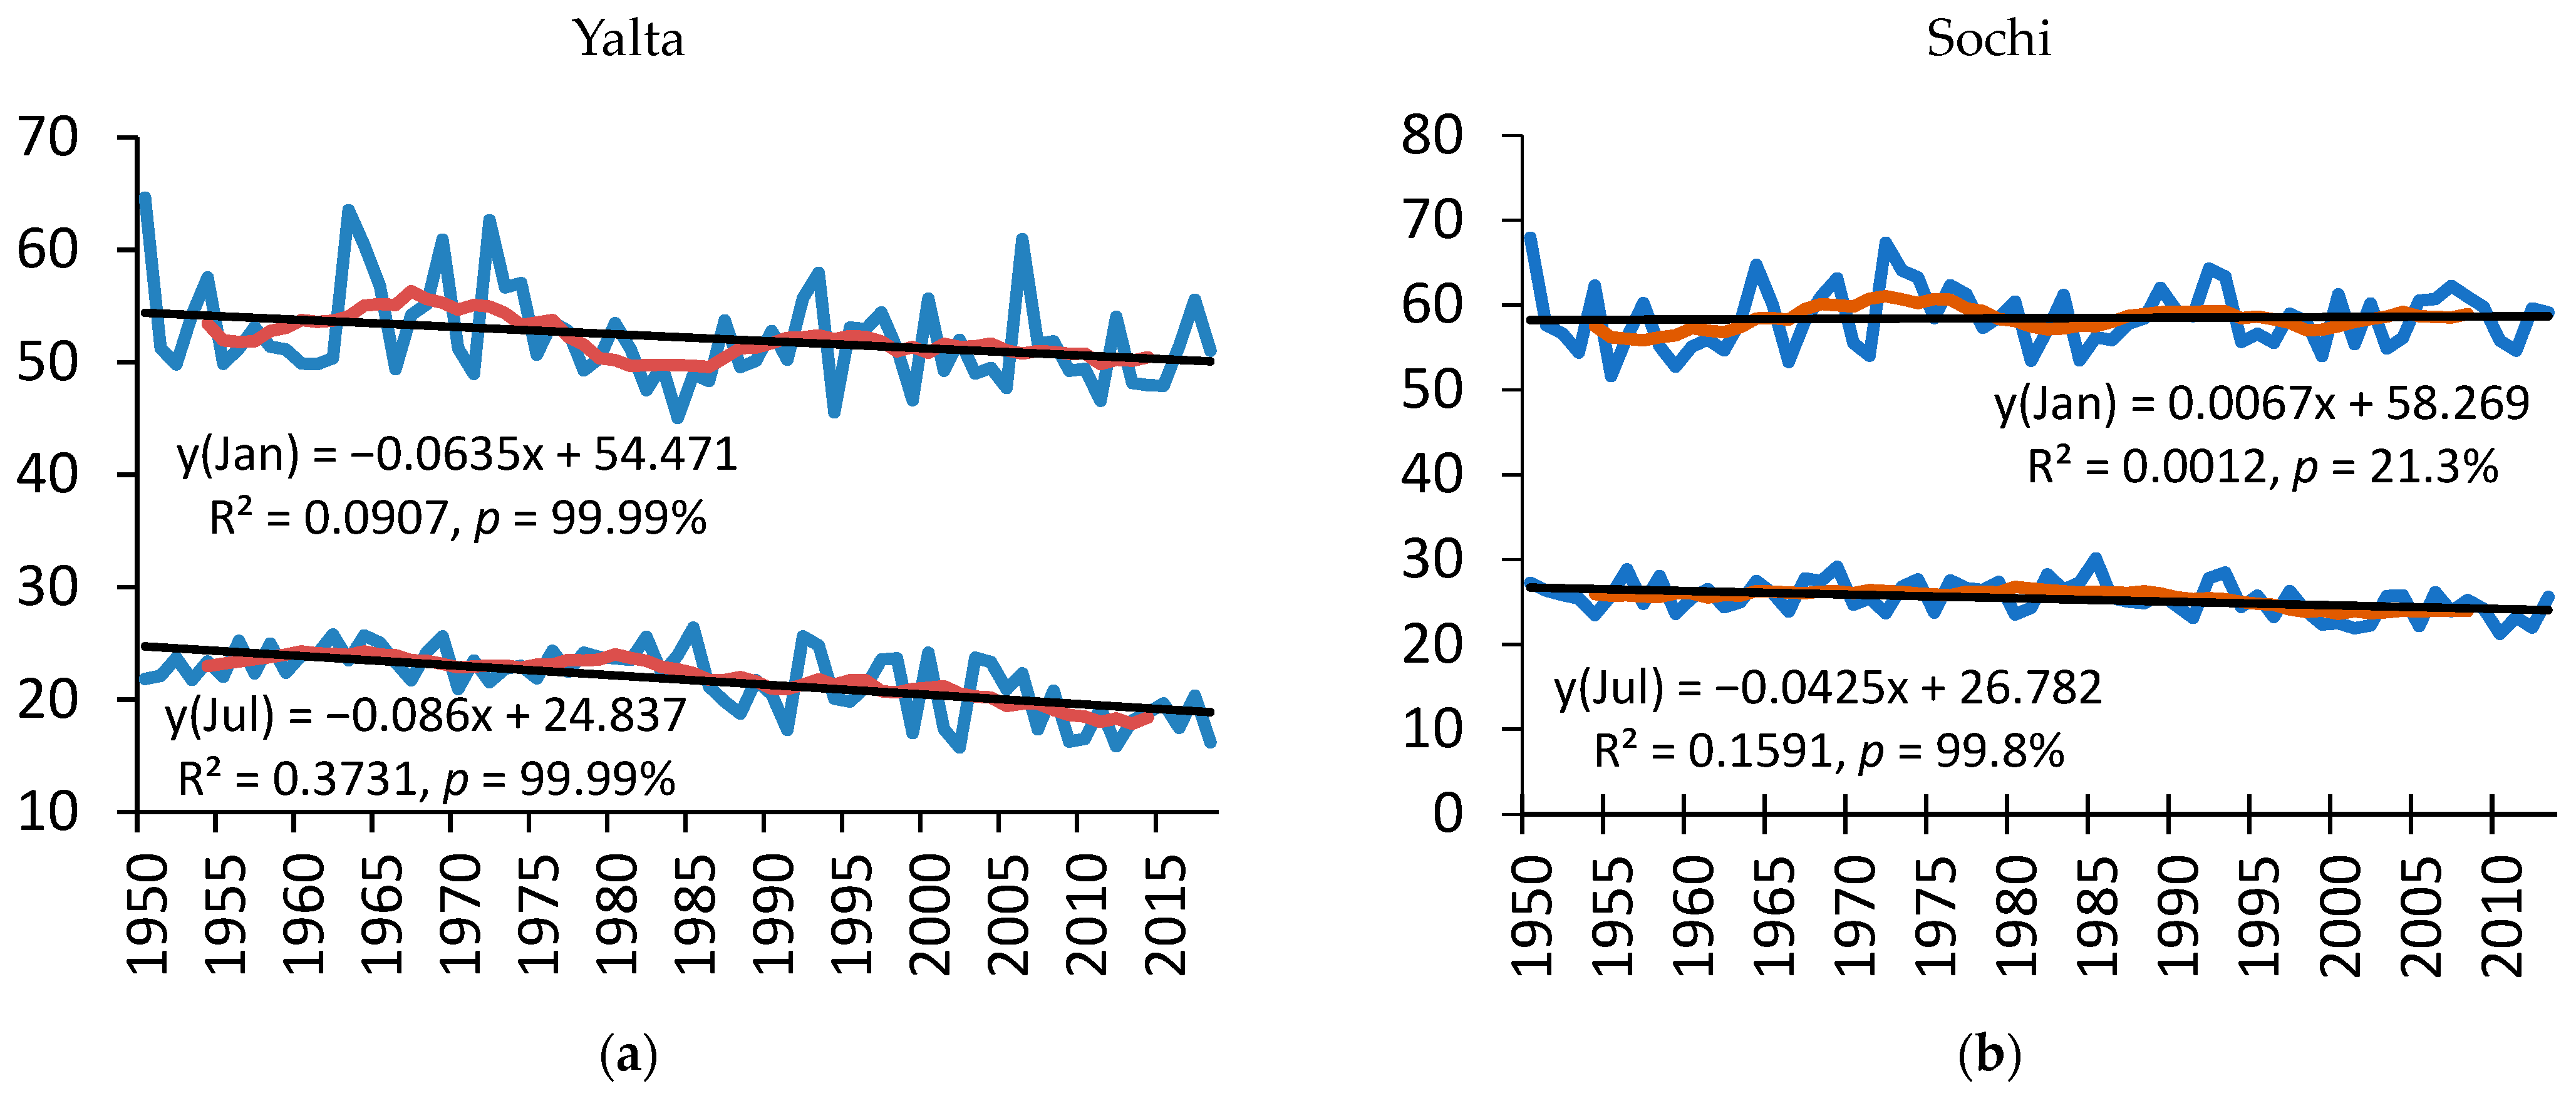
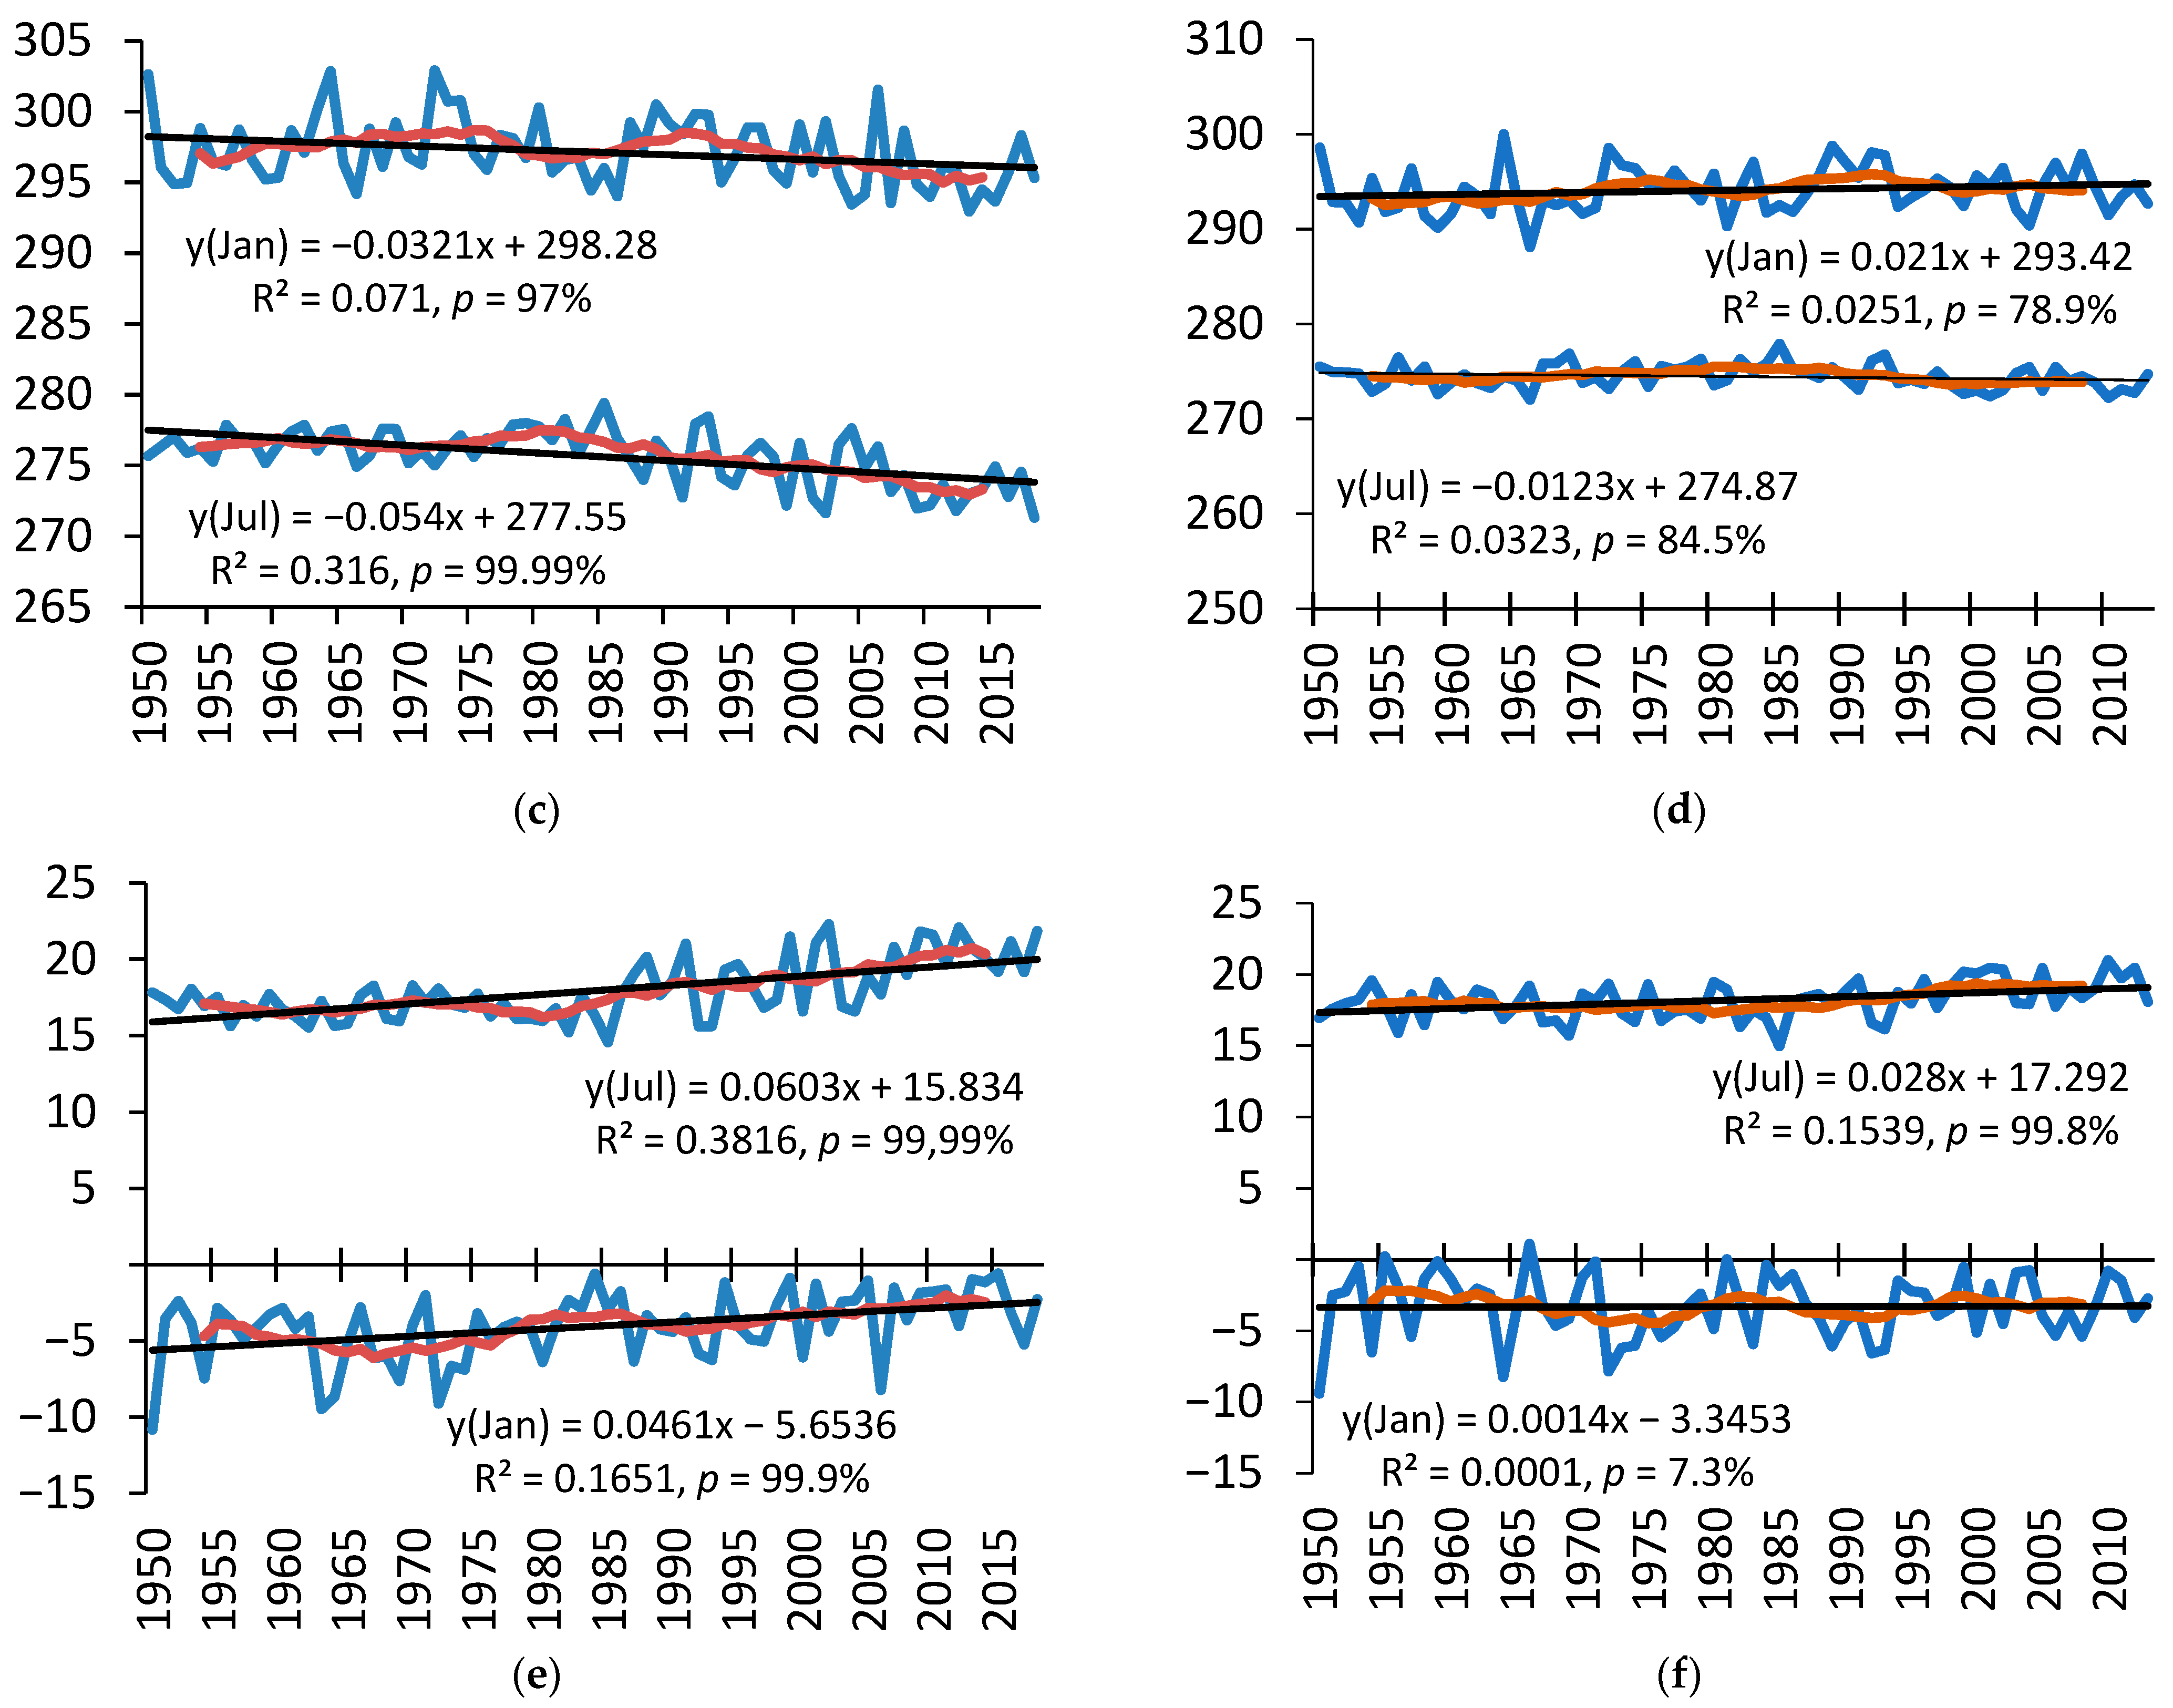
Using Equations (1)–(3) and datasets of reanalysis, the series of bioclimatic indices in Yalta and Sochi were obtained for each month over the period 1950–2018. Their time course in January and July is shown in
Figure 3.
The wind cooling index (H
w) in January in Yalta (
Figure 3a) varies on an interannual scale every few years from the range of high discomfort values (more than 50 mcal cm
−2 s
−1) to the range of relative comfort (31–50 mcal cm
−2 s
−1) and backwards. Approximately after 1975, the number of Januaries in the range of discomfort decreased, i.e., the need for appropriate clothing also decreased. The H
w index in January in Sochi (
Figure 3b) varies in the discomfort range without significant linear trend.
According to the H
w index values in July (
Figure 3a,b), both resorts belong to a moderately comfortable zone (11–30 mcal cm
−2 s
−1). At the same time, there is a tendency for the index in Yalta to reach a range of comfortable conditions (<10 mcal cm
−2 s
−1) approximately in the middle of the 21st century on condition that the linear trend remains the same. The H
w index in July in Sochi (
Figure 3b) also declines to the more comfortable range, but with a lower rate by half (trend coefficient).
The index of the weight oxygen content (ρO
2) in January and July (
Figure 3c) is mainly in the normal range (240–300 g/m
3), but in January, it is at the upper limit of the norm. In some years, there was even an excess of the weight oxygen content in January: above 302 g/m
3 in 1950, 1964, and 1972 and from 300 to 302 g/m
3 in 1980, 1989, and 2006. Thus, there is the tendency of the index to move away from the upper limit of the norm in January completely to the normal range. In July, there is also a tendency of decreasing weight oxygen content (
Figure 3b). If this trend remains and the level of 270 g/m
3 is reached around 2030, a feeling of physiological oxygen deficiency (hypoxia) may occur in July in some years, but nevertheless at a lower level than in high-altitude areas.
The ρO
2 index in Sochi is in the normal range (240–300 g/m
3) in January and in July (
Figure 3d) with an upward trend in January (at the confidence level of almost 80%) and downward trend in July (at the confidence level of almost 85%).
The equivalent-effective temperature (EET) in January (
Figure 3e,f) is negative at both resorts and the average value for the analyzed period is −4 °C in Yalta and −3.3 °C in Sochi. There is a tendency for the EET index in Yalta to reach a positive range of values around the 2030s assuming the same linear trend. There is no significant linear trend of the EET index in Sochi for the analyzed period. Nevertheless, the index reached zero and above monthly values some years on the interannual scale, for example in 1955, 1959, 1966, 1971, 1981, and 1984. Later, there were no such cases during the second half of the series, probably due to the multidecadal modulation of the interannual variability.
The average EET index in July (
Figure 3e,f) is in the comfort range (12–24 °C) at both resorts. However, approximately the first half of the series (until 1987) was characterized by the predominance of a moderately warm range of conditions (12–18 °C), and then there was a transition to the predominance of a warmer range (18–24 °C), especially in Yalta.
Thus, all bioclimatic indices at both resorts demonstrate an expressed interannual variability, especially in the EET index in January (
Figure 3e,f), modulated by the synchronous multidecadal variability, which is shown using a 10-year running average (red curve in
Figure 3). This suggests that the causing quasiperiodic processes are common for both resorts and large-scale, beyond the regional climate influence. This interannual climate scale in the Atlantic-European region is determined mainly by the NAO and EAO modes. The responses of these fluctuations are analyzed below in the extreme values of bioclimatic indices. The multidecadal variability is especially pronounced in the time course of the H
w index in January (
Figure 3a,b) and EET in July (
Figure 3e,f) at both resorts, and in the ρO
2 index in Yalta (
Figure 3c). This scale of variability of the climate system is associated mainly with the Atlantic Multidecadal Oscillation and the Pacific Decadal Oscillation. The manifestations of these low-frequency quasiperiodic modes will be analyzed in further studies.
Significant linear trends during the analyzed period (1950–2018) are found for all bioclimatic indices in Yalta: negative for Hw (−0.6 mcal cm−2 s−1 in January and −0.86 mcal cm−2 s−1 in July for 10 years) and ρO2 (−0.3 g/m3 in January and −0.5 g/m3 in July for 10 years), and positive for EET (0.46 °C in January and 0.6 °C in July for 10 years). The contribution of trends to the variability of the Hw/ρO2/EET index series (estimated by R2, the value of the accuracy of the approximation) is 9/7/16.5 percent of variance in January and 37/32/38 percent in July. In Sochi, the only significant trends over the period (1950–2013) are in July: a decreasing trend of Hw index and an increasing trend of EET index, which are both about a half of those in Yalta (trend coefficient).
It should also be noted that the amplitude of the interannual variability and the linear trends of bioclimatic indices in July in Yalta have been noticeably increasing since about the 1980s. This may be due to either the multidecadal variability, comparable to the length of the series, or global warming. Vice versa in Sochi, as it was described above, the interannual amplitude of the EET index in July decreased on the background of multidecadal variability and without the linear trend, which is also true for the Hw index in January. This suggests that Yalta is more sensitive to the global warming effect than Sochi, which is characterized by the moderating effect of a wetter marine climate.
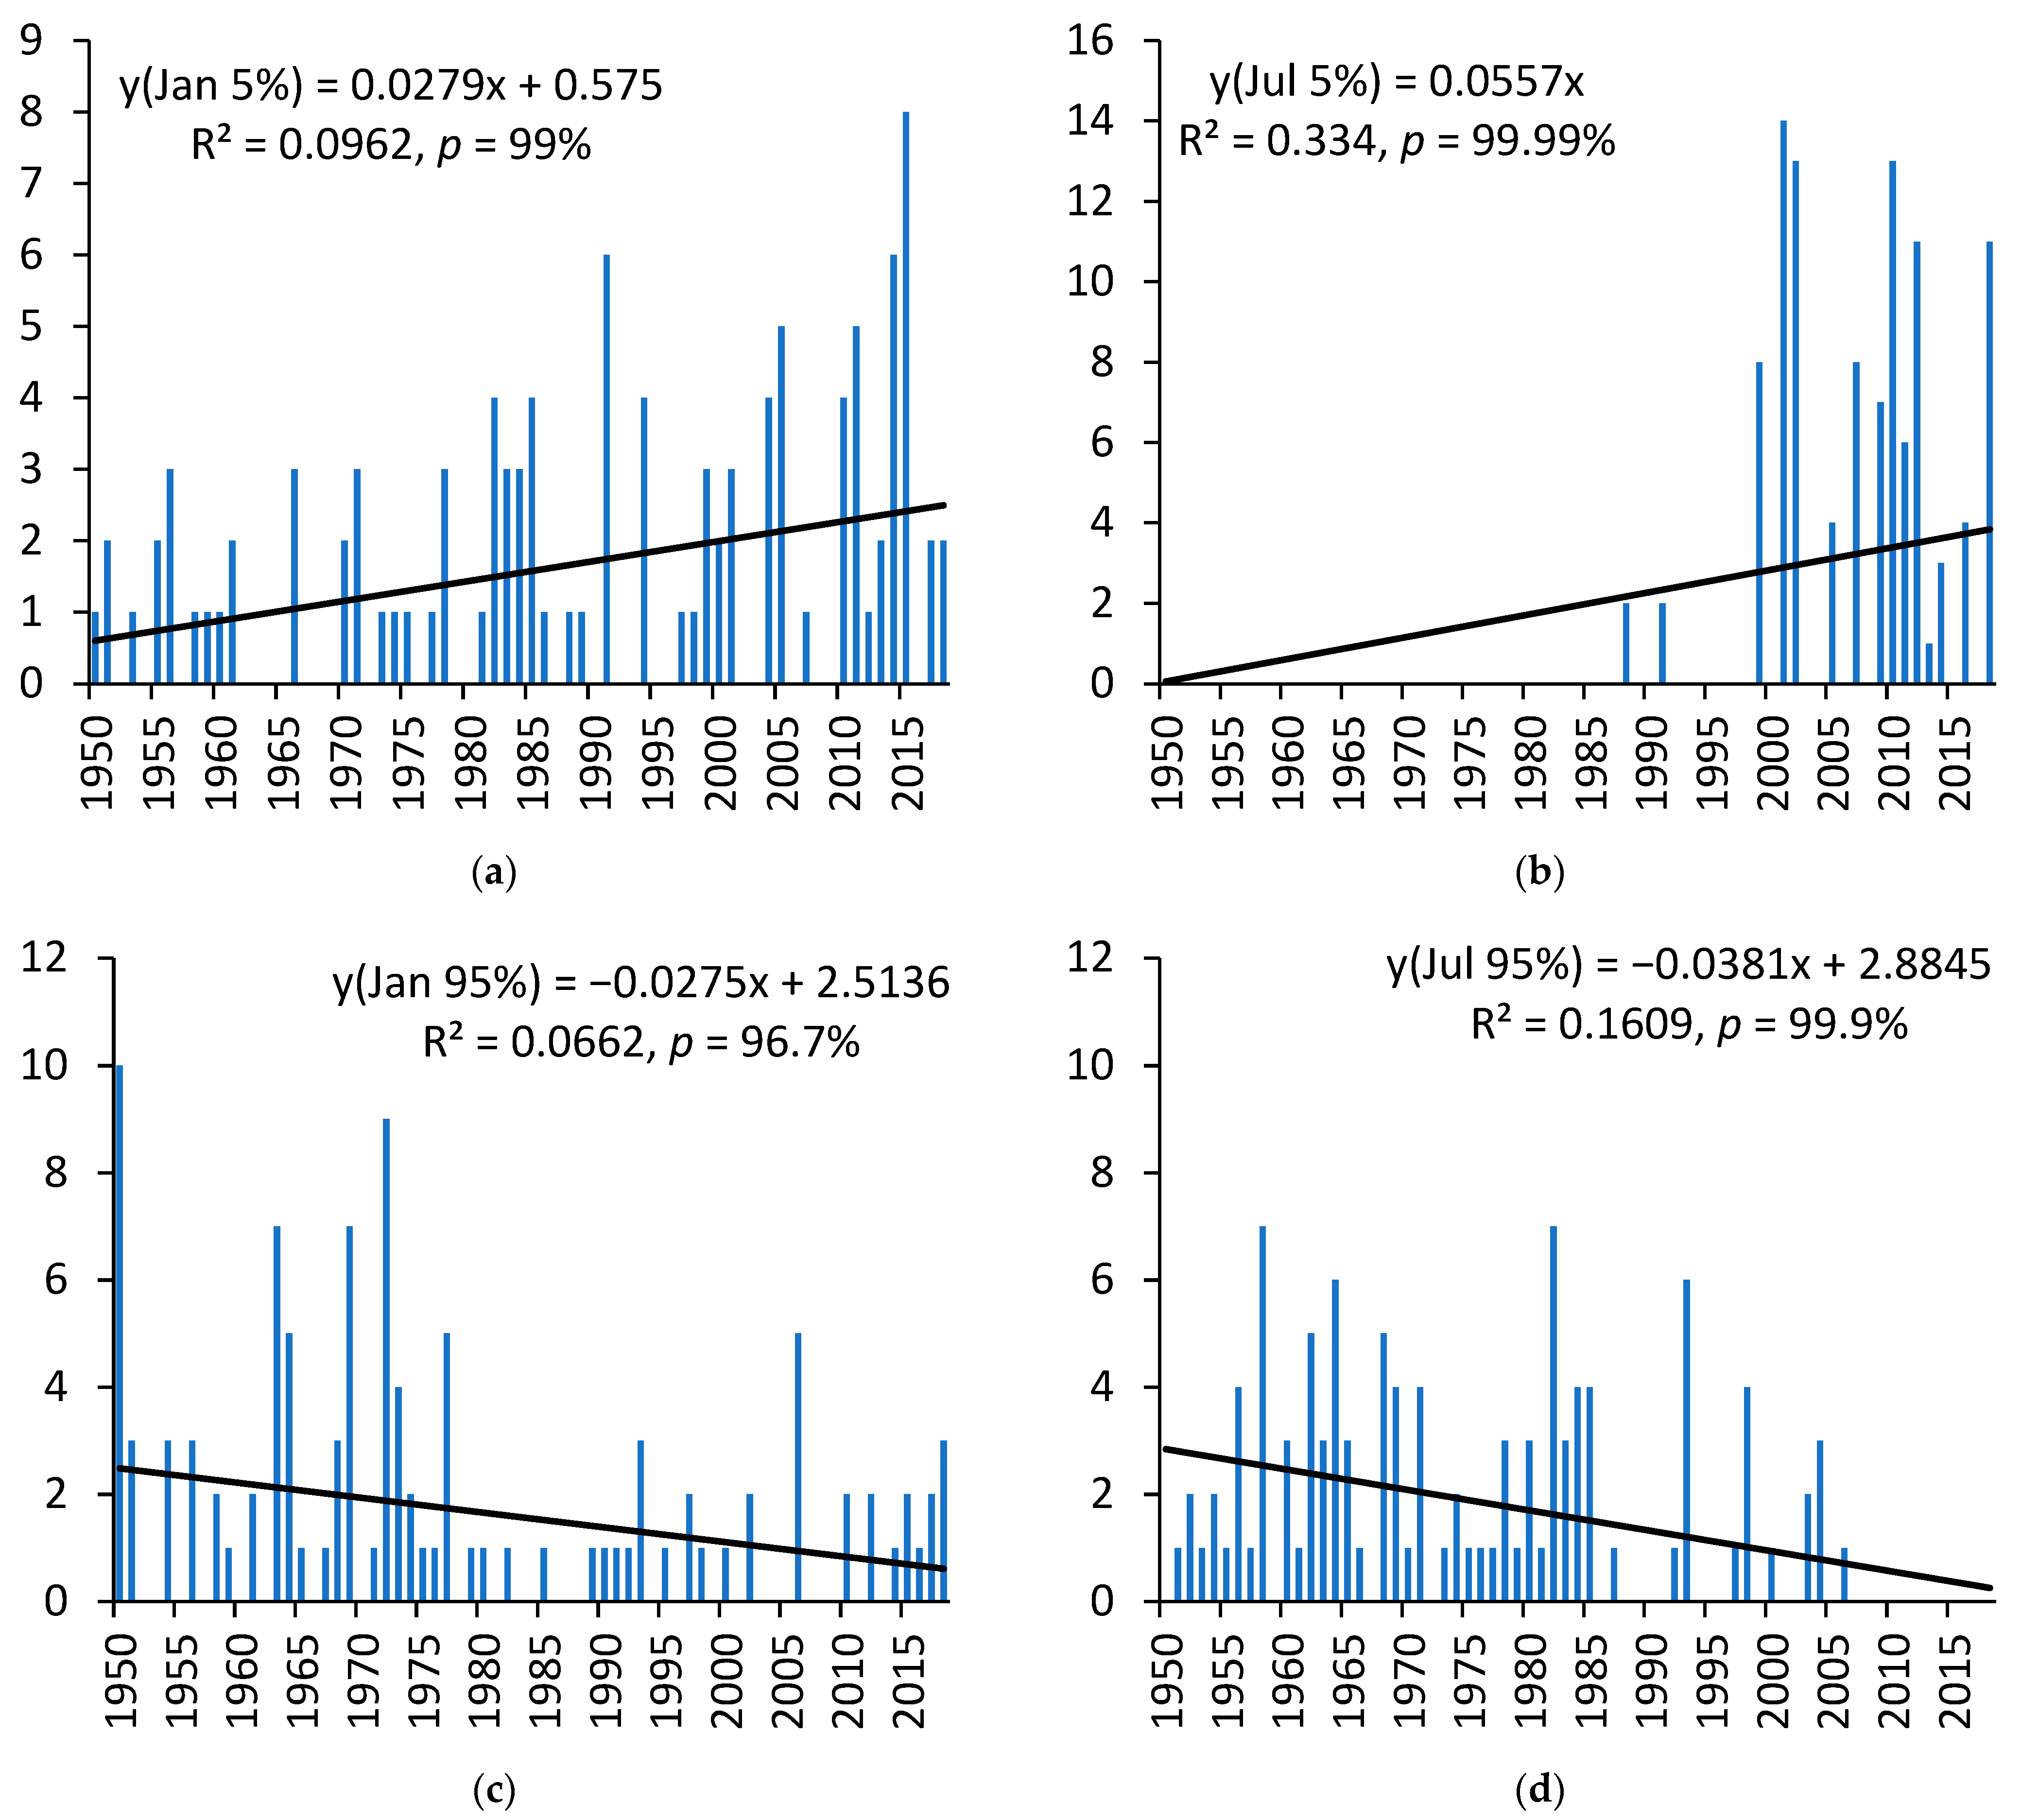
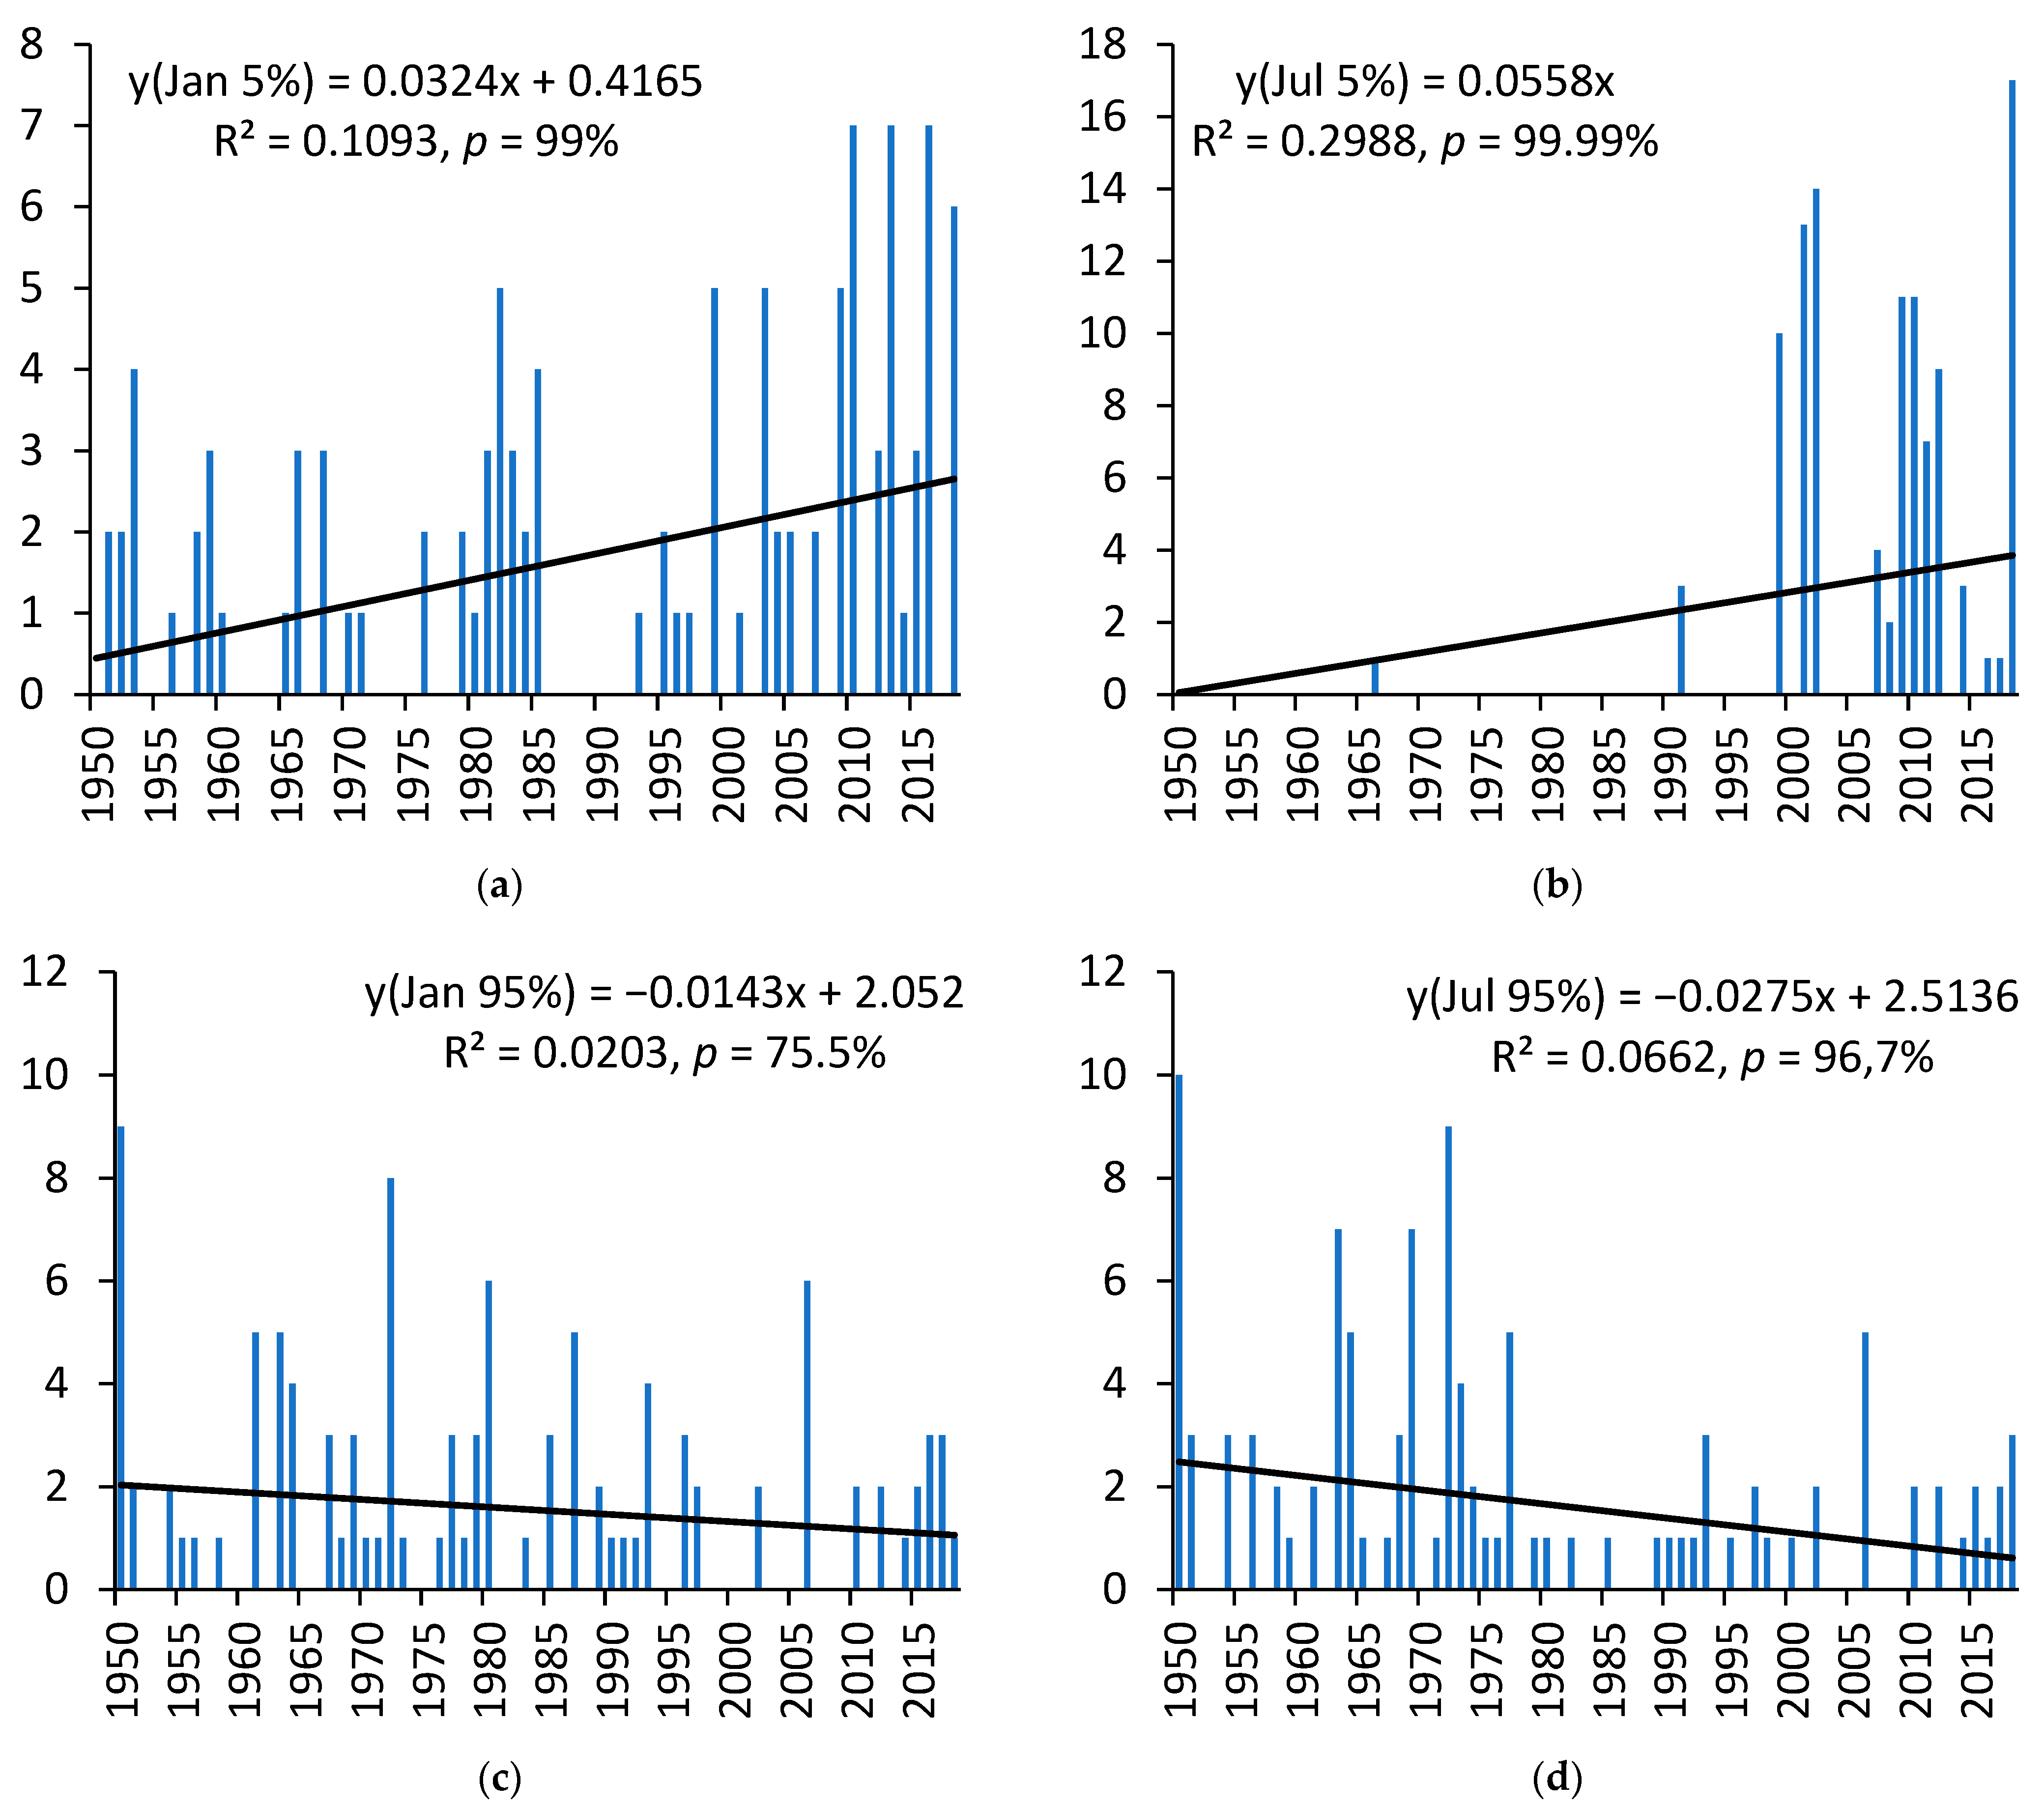
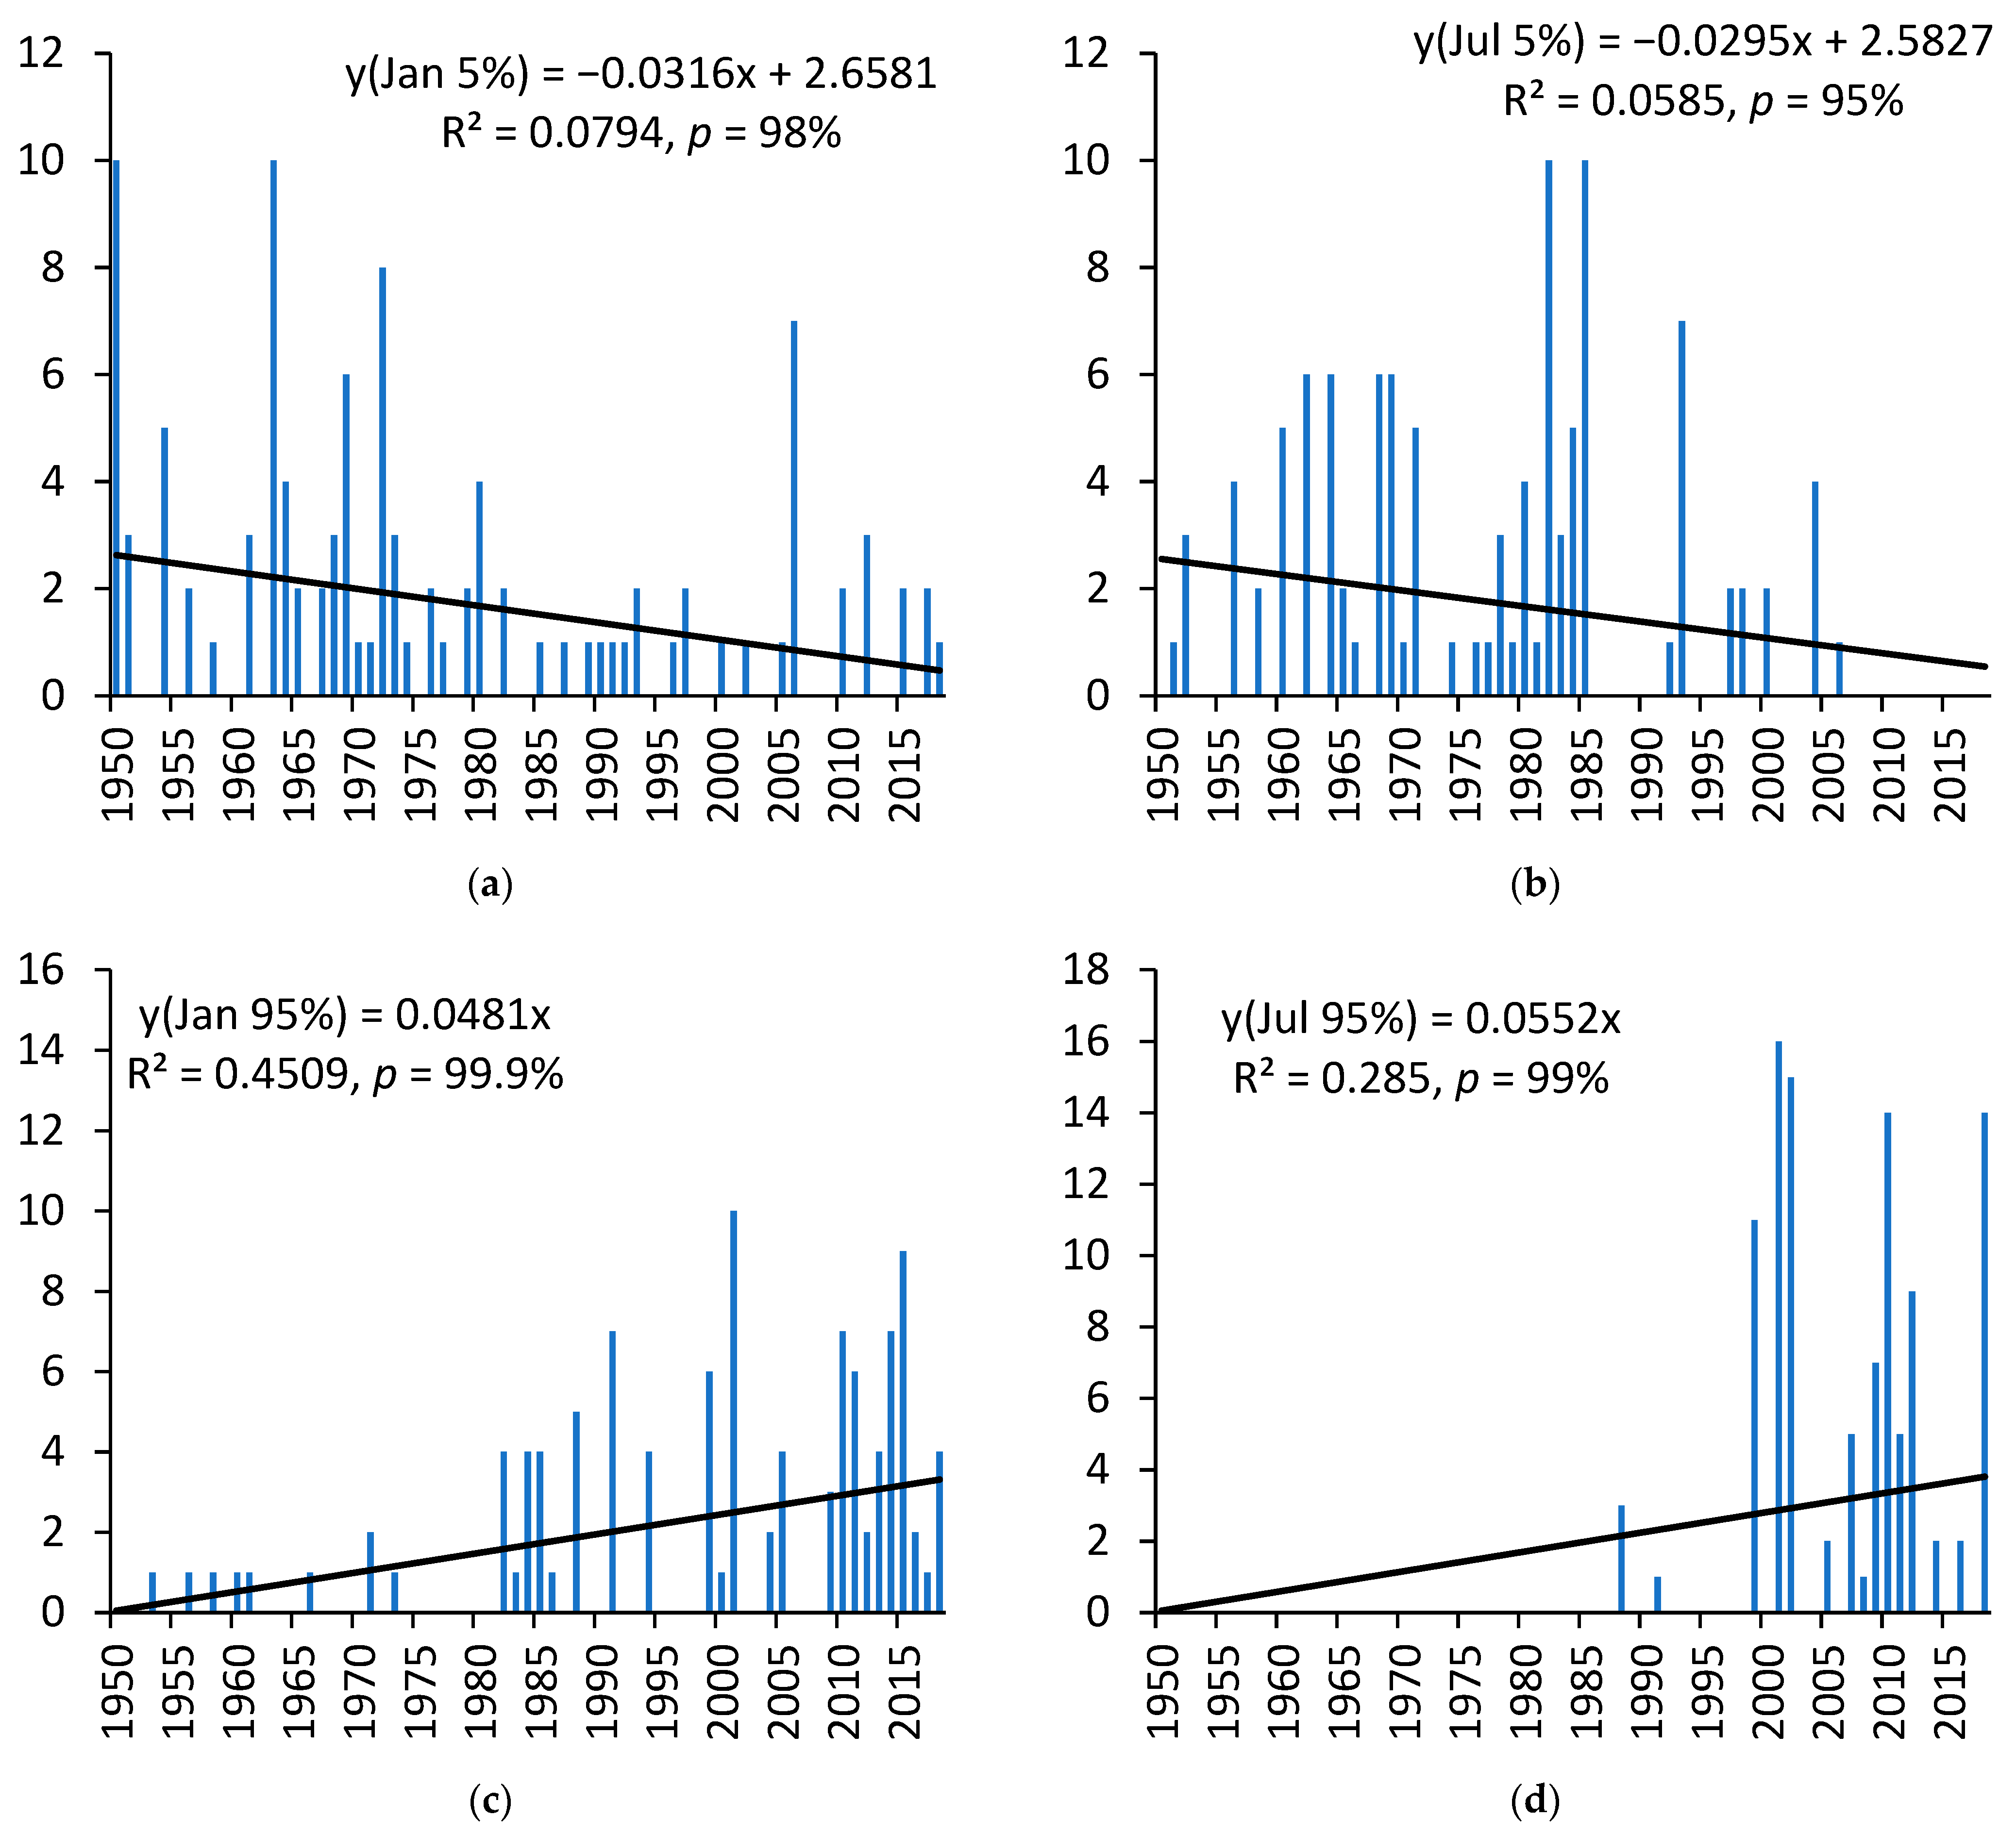
Further, we analyze the number of days below the 5th percentile and above the 95th percentile for all obtained bioclimatic indices in January and July during the period 1950–2018 in Yalta (
Figure 4,
Figure 5 and
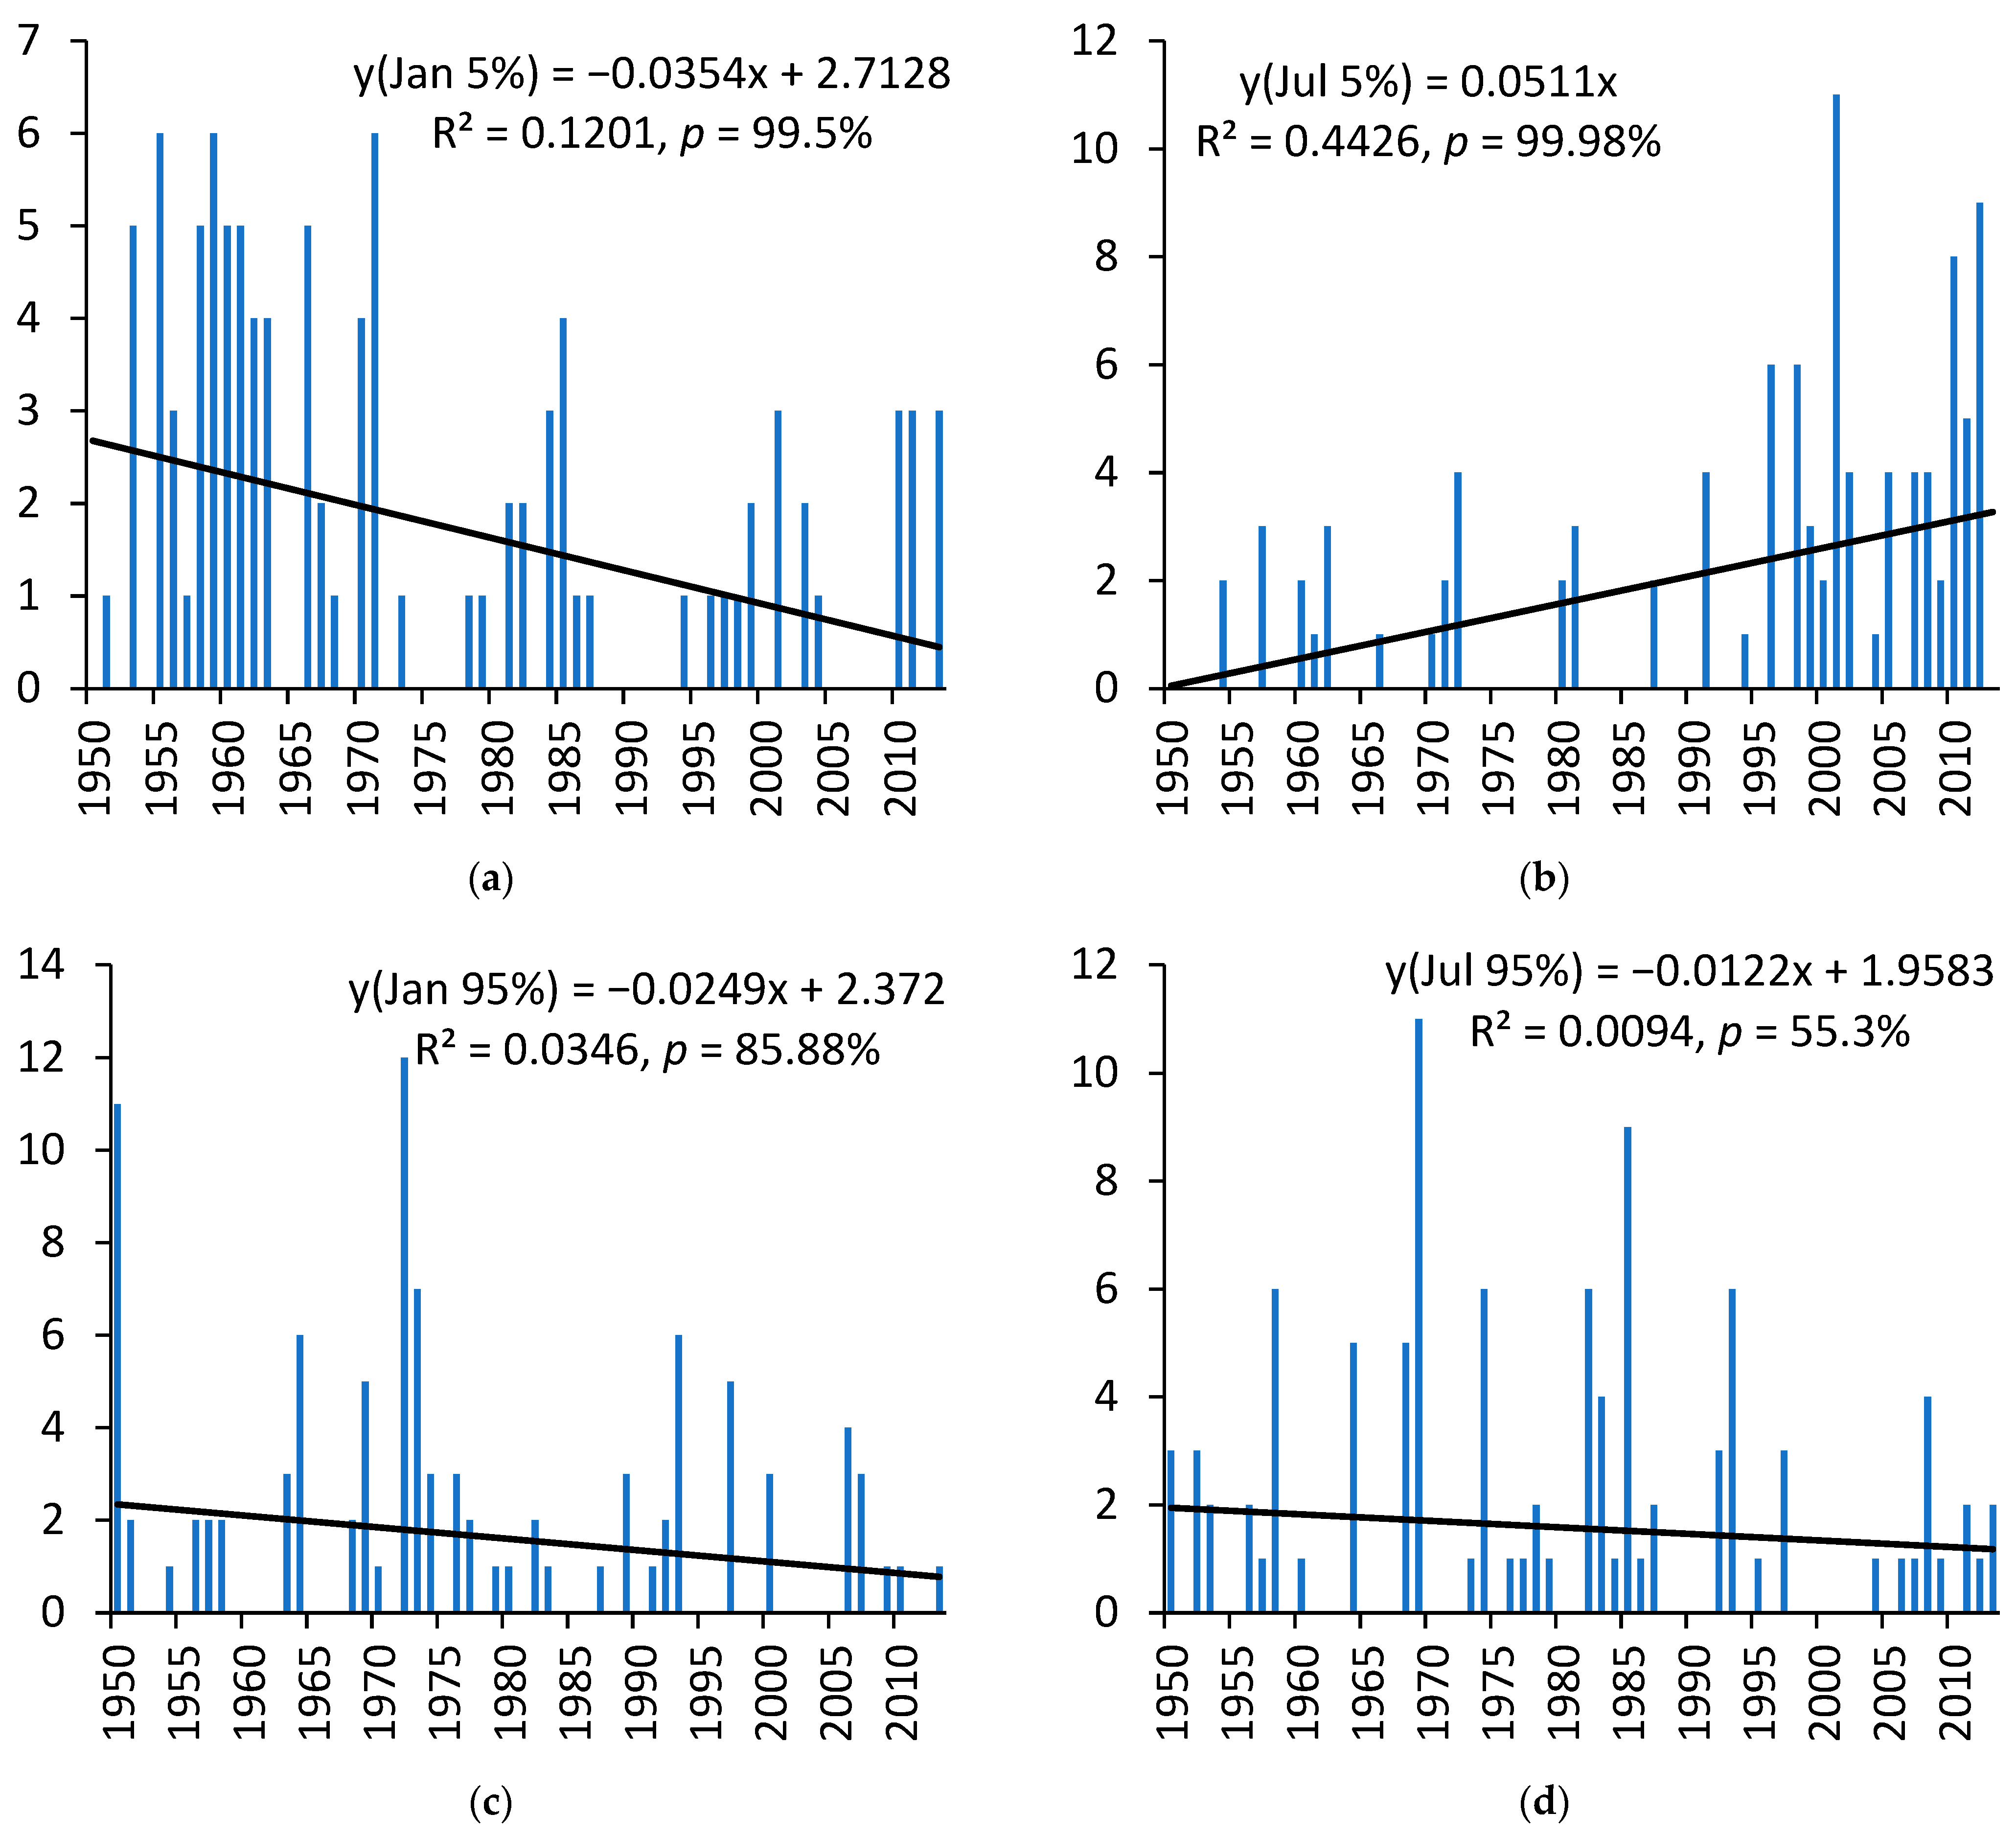
Figure 6) and 1950–2013 in Sochi (
Figure 7,
Figure 8 and
Figure 9).
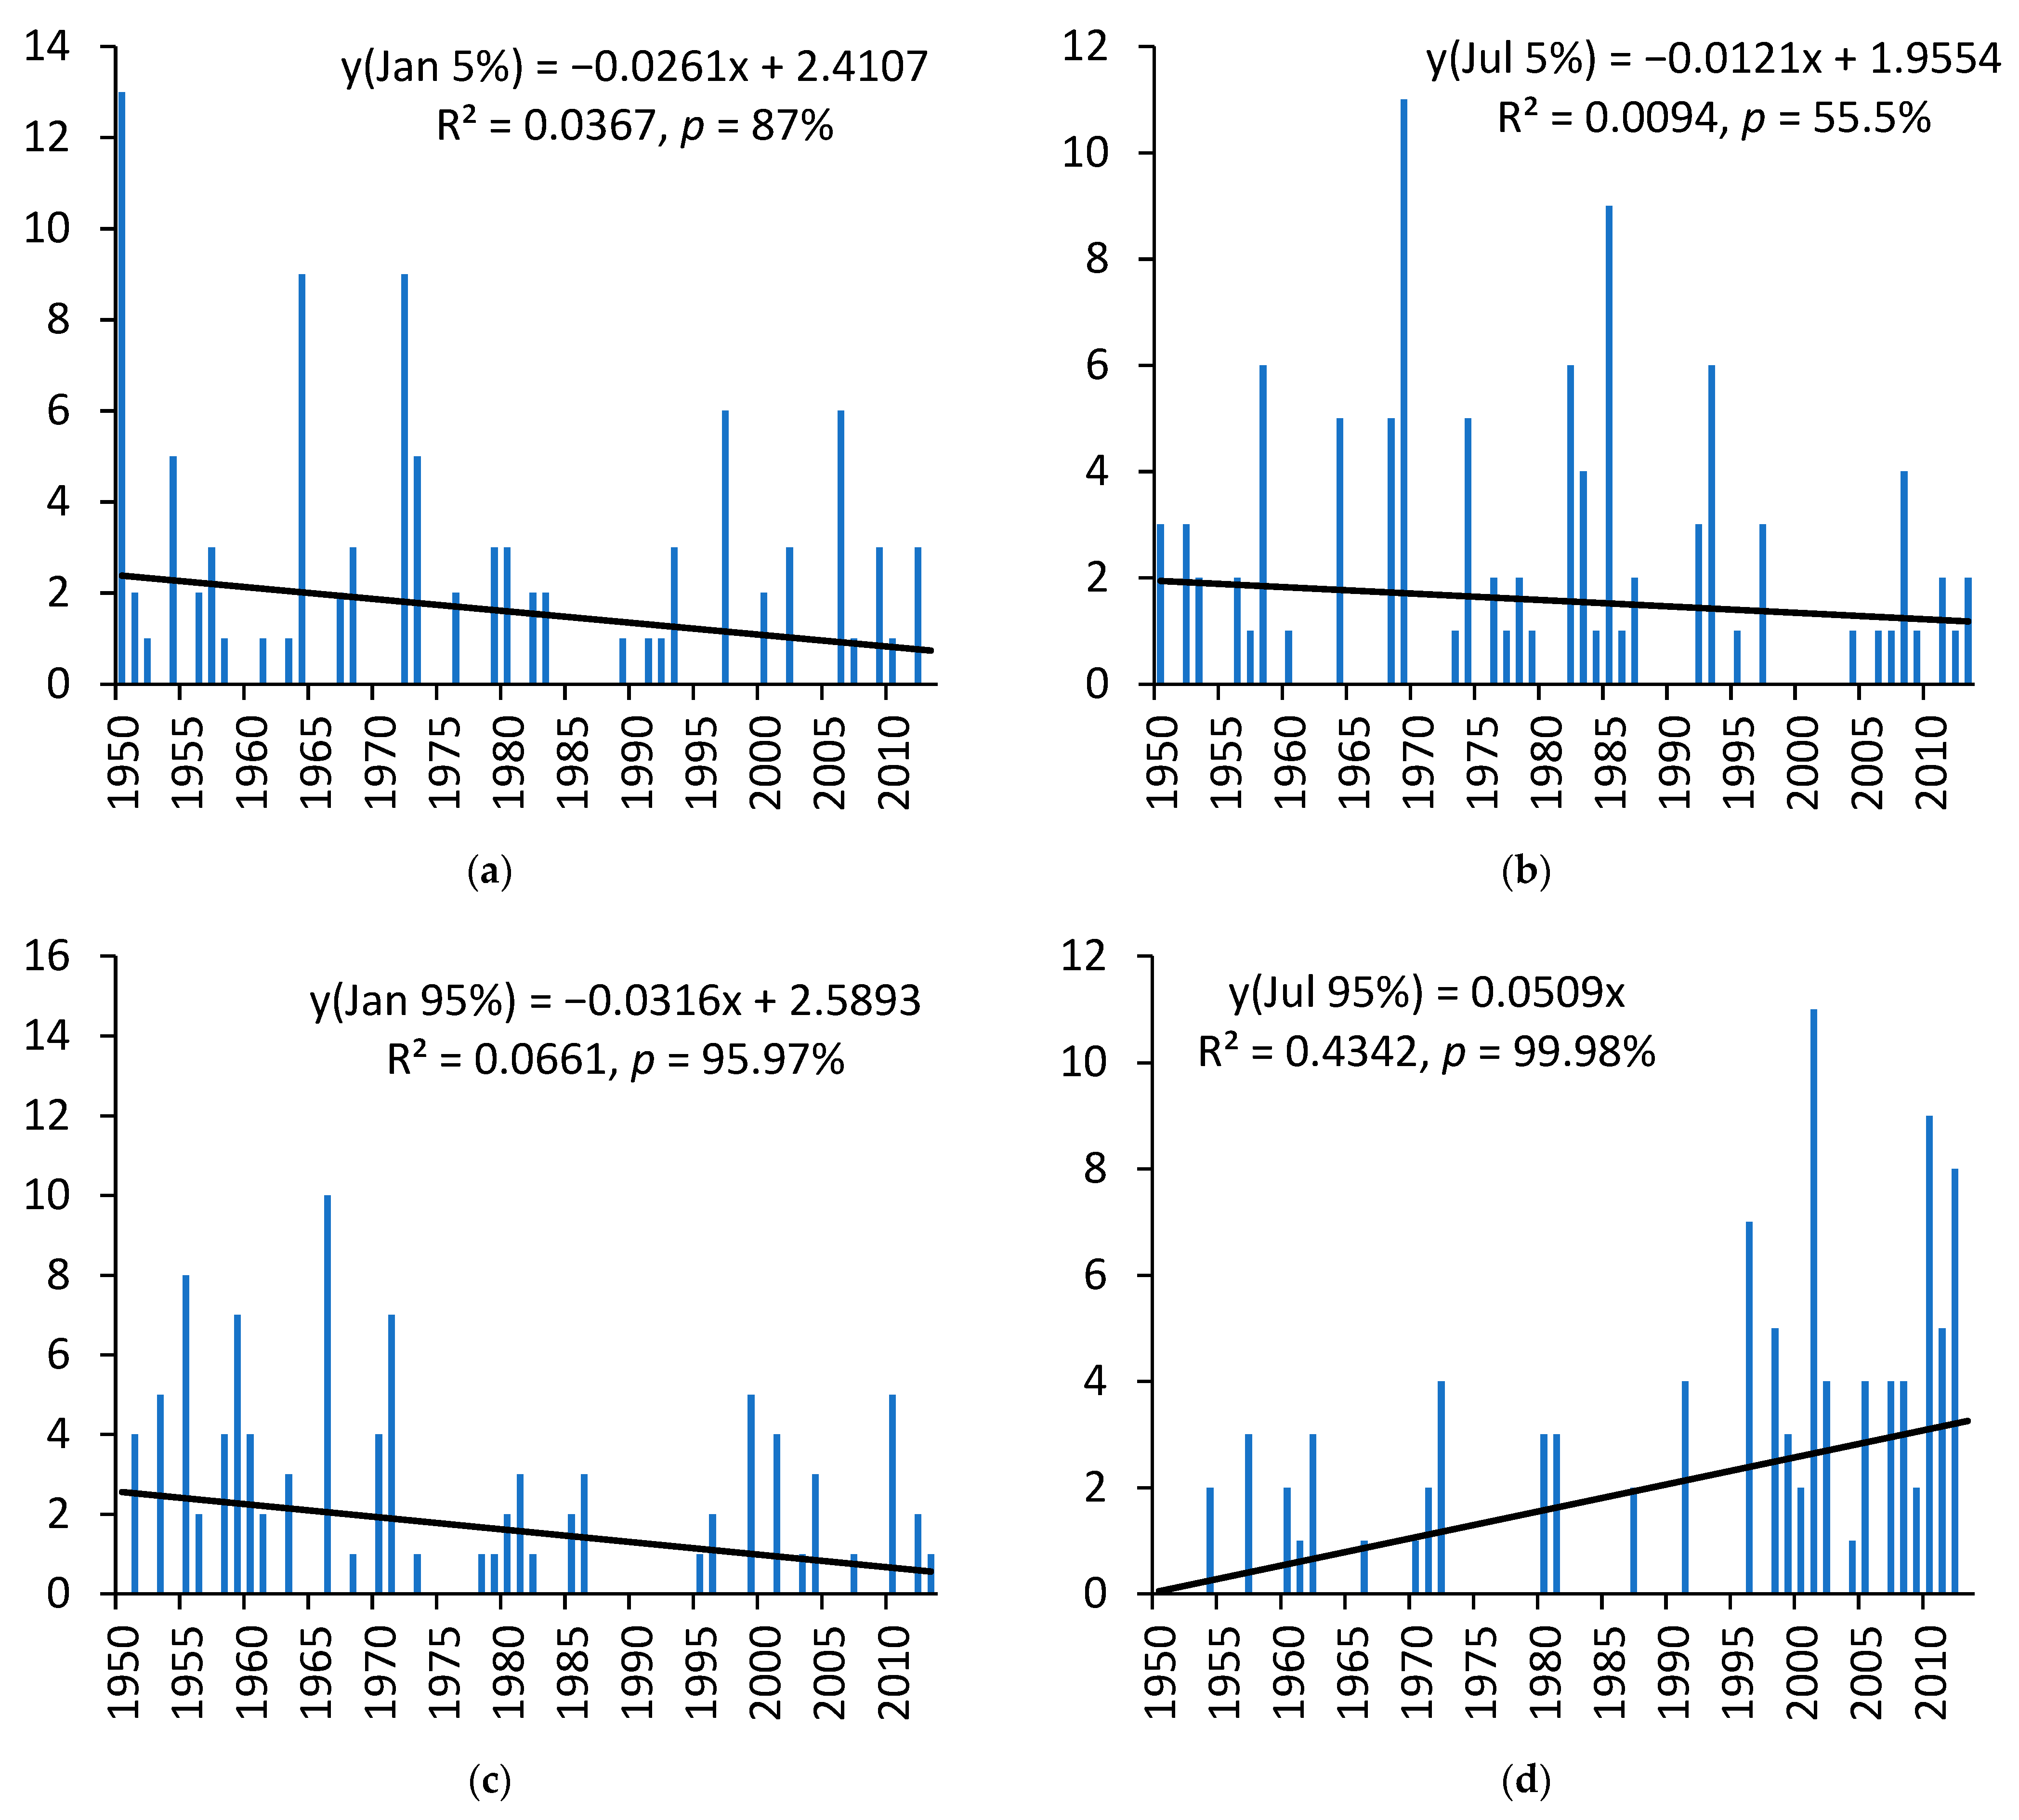
In Yalta in January, as in July, from 1950 to 2018, the number of days with extremely low H
w index (
Figure 4a,b) and ρO
2 index (
Figure 5a,b) significantly increased, and significantly decreased for the EET index (
Figure 6a,b) in the background of interannual variability. In January, linear trends are characterized by approximately the same rate, equal to a little more than 2 days for the entire 69-year period (1950–2018). In July, the linear trends in the number of days with extremely low values for the increasing H
w and ρO
2 indices are about 3.8 days over the entire period, and for the decreasing EET index are about 2 days over the period. Trends in the number of days with extremely high values of the indices behave in the opposite way: for the H
w indices (
Figure 4c,d) and ρO
2 (
Figure 5d), they decrease significantly, and for the EET index (
Figure 6c,d) they increase significantly. Only the trend in January for the ρO
2 index (
Figure 5c) is less significant (75%).
Thus, for the Yalta resort, a logical correspondence is observed: a decrease in the values of the H
w index (
Figure 3a) and ρO
2 index (
Figure 3b) over the analyzed period corresponds to an increase in the frequency (expressed in the number) of days with extremely low index values (
Figure 4a,b and
Figure 5a,b) and a decrease in the frequency of days with extremely high index values (
Figure 2c,d and
Figure 3c,d). The same is true for the EET index: on the background of the increasing index (
Figure 3c), there is an increase in the frequency of days with extremely high index values (
Figure 6c,d) and a decrease in the frequency of days with extremely low values (
Figure 6a,b).
During approximately the first half of the analyzed series (up to 1988) in July in Yalta, there were almost no days at all with extremely low values of the H
w index (
Figure 4b) and ρO
2 index (
Figure 5b) and with extremely high values of the EET index (
Figure 6d). The revealed feature can indicate both the presence of about half-century variability and the manifestation of global warming.
In Sochi, for the period 1950–2013, the number of days with extremely low H
w index significantly decreased in January (
Figure 7a) and increased in July (
Figure 7b) without corresponding (the opposite) significant trends in the number of days with extremely high H
w index (
Figure 7c,d), as it was for Yalta. This increase of windless days in July explains the significant decrease of H
w index (
Figure 3b). It is remarkable that the significant decrease of the frequency of windless days in January corresponds to the insignificant upward linear trend of the index (
Figure 3b), while the frequency of windy days also decreases on the confidence level of almost 86% (
Figure 7c). This may indicate a change in the statistical distribution of the extremums to the shortening of “tails” and milder conditions in the terms of the wind cooling index in January.
For the ρO
2 index, the decrease in the frequency of extremely low values in January on the 80% confidence level (
Figure 8a) explains the rising ρO
2 index on almost the same confidence level (
Figure 3d). Similarly, the significant increase in the frequency of extremely low values in July (
Figure 8b) is consistent with to the downward, but less significant trend of the index in July (
Figure 3d). There are no corresponding (opposite) significant trends in the frequency of extremely high values (
Figure 8c,d).
The significant rising trend of the EET index in July in Sochi (
Figure 3f) is accompanied by the significant increase in the frequency of extremely high values (
Figure 9d) and the insignificant decrease in the extremely low values (
Figure 9b). In January, the frequency of extremely high values increases significantly (
Figure 9c) and the frequency of the extremely low values decreases with less significance (
Figure 9a), while there is no significant trend of the index in January (
Figure 3f). This may indicate a change in the statistical distribution of the index in the direction of extension of the “tails”, and a tendency to greater temperature extremes in January.
Next, we analyze the responses of extreme values of the bioclimatic indices on different phases of global climate interannual modes with the centers of action in the North Atlantic: the North Atlantic Oscillation (NAO) and East Atlantic Oscillation (EAO). The physical mechanism of both oscillations consists in the shift of storm tracks as a result of the seesaw anomalies of the large-scale baric fields and upper-level jet stream position associated with the phase (positive/negative) of oscillations [
37,
38,
40,
41,
45] as it is shown in
Figure 1 and
Figure 2. In the Black Sea region, more frequent cyclonic conditions are observed in the negative phases of oscillations, especially in January (
Figure 1b and
Figure 2b).
A composite analysis was carried out for the days with extreme values (5th and 95th percentiles) of the bioclimatic indices (H
w, ρO
2, and EET) in positive and negative phases of the NAO and EAO. The results are shown in
Figure 10 and
Figure 11.
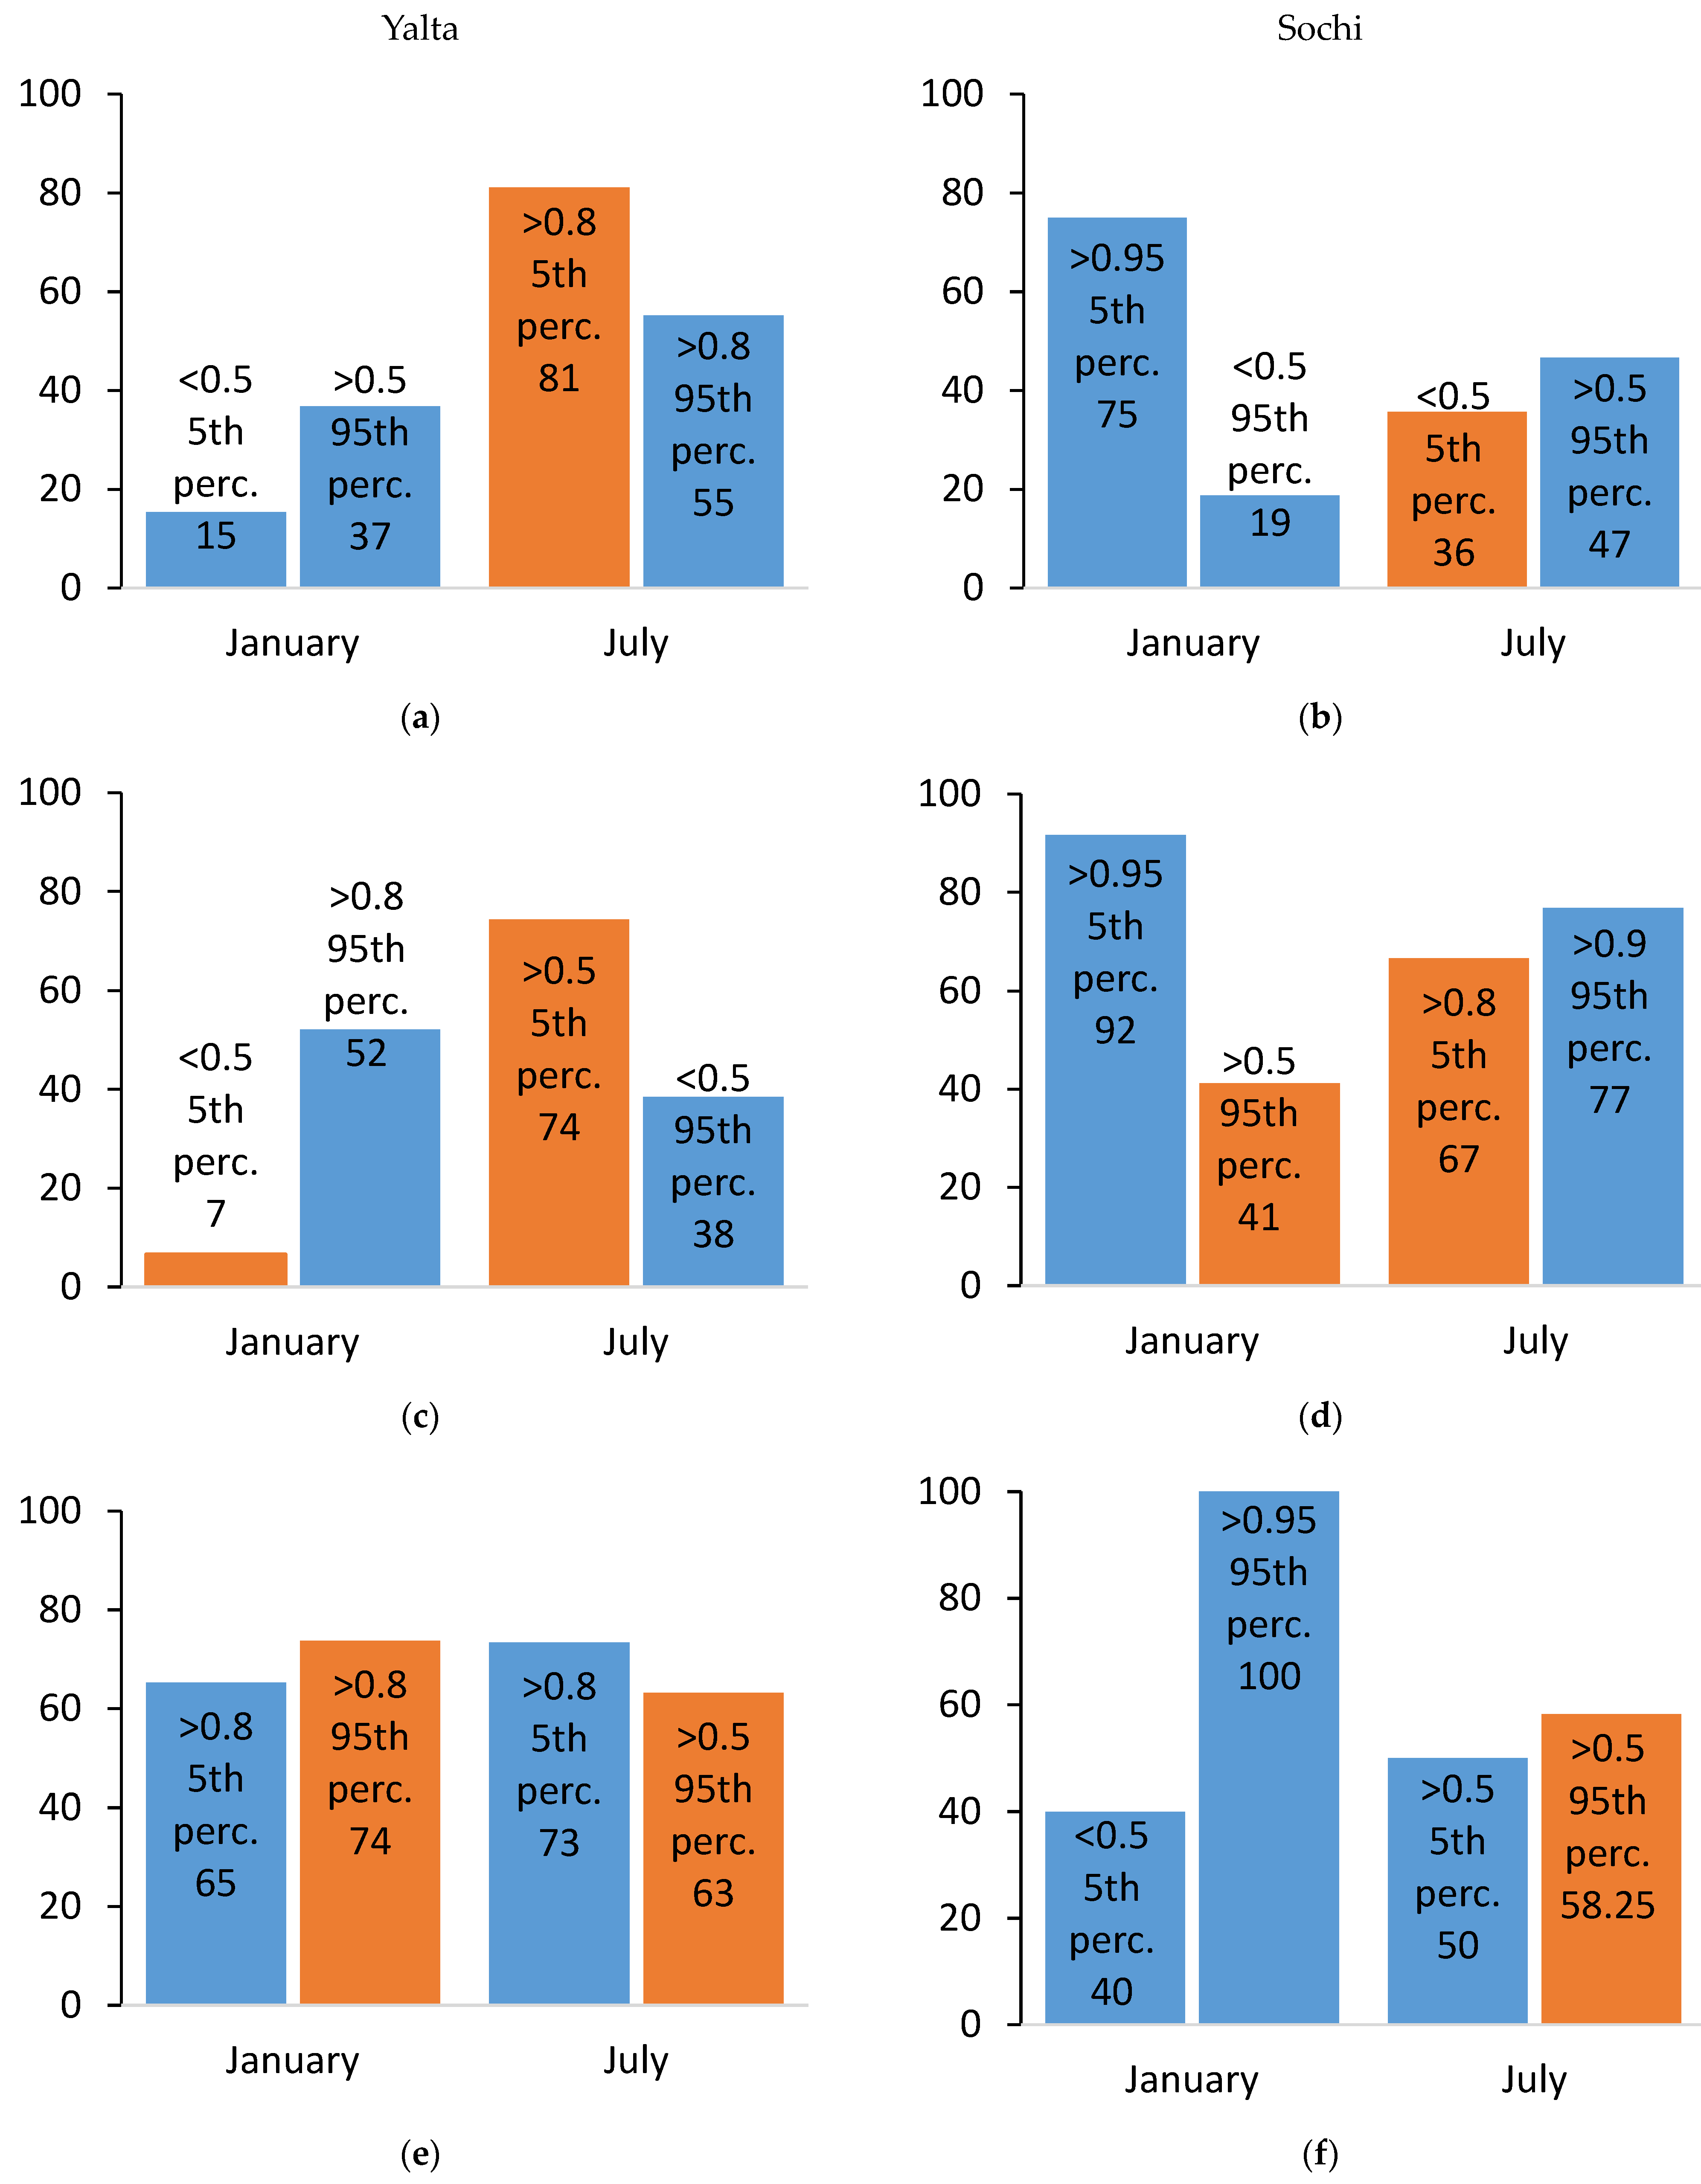
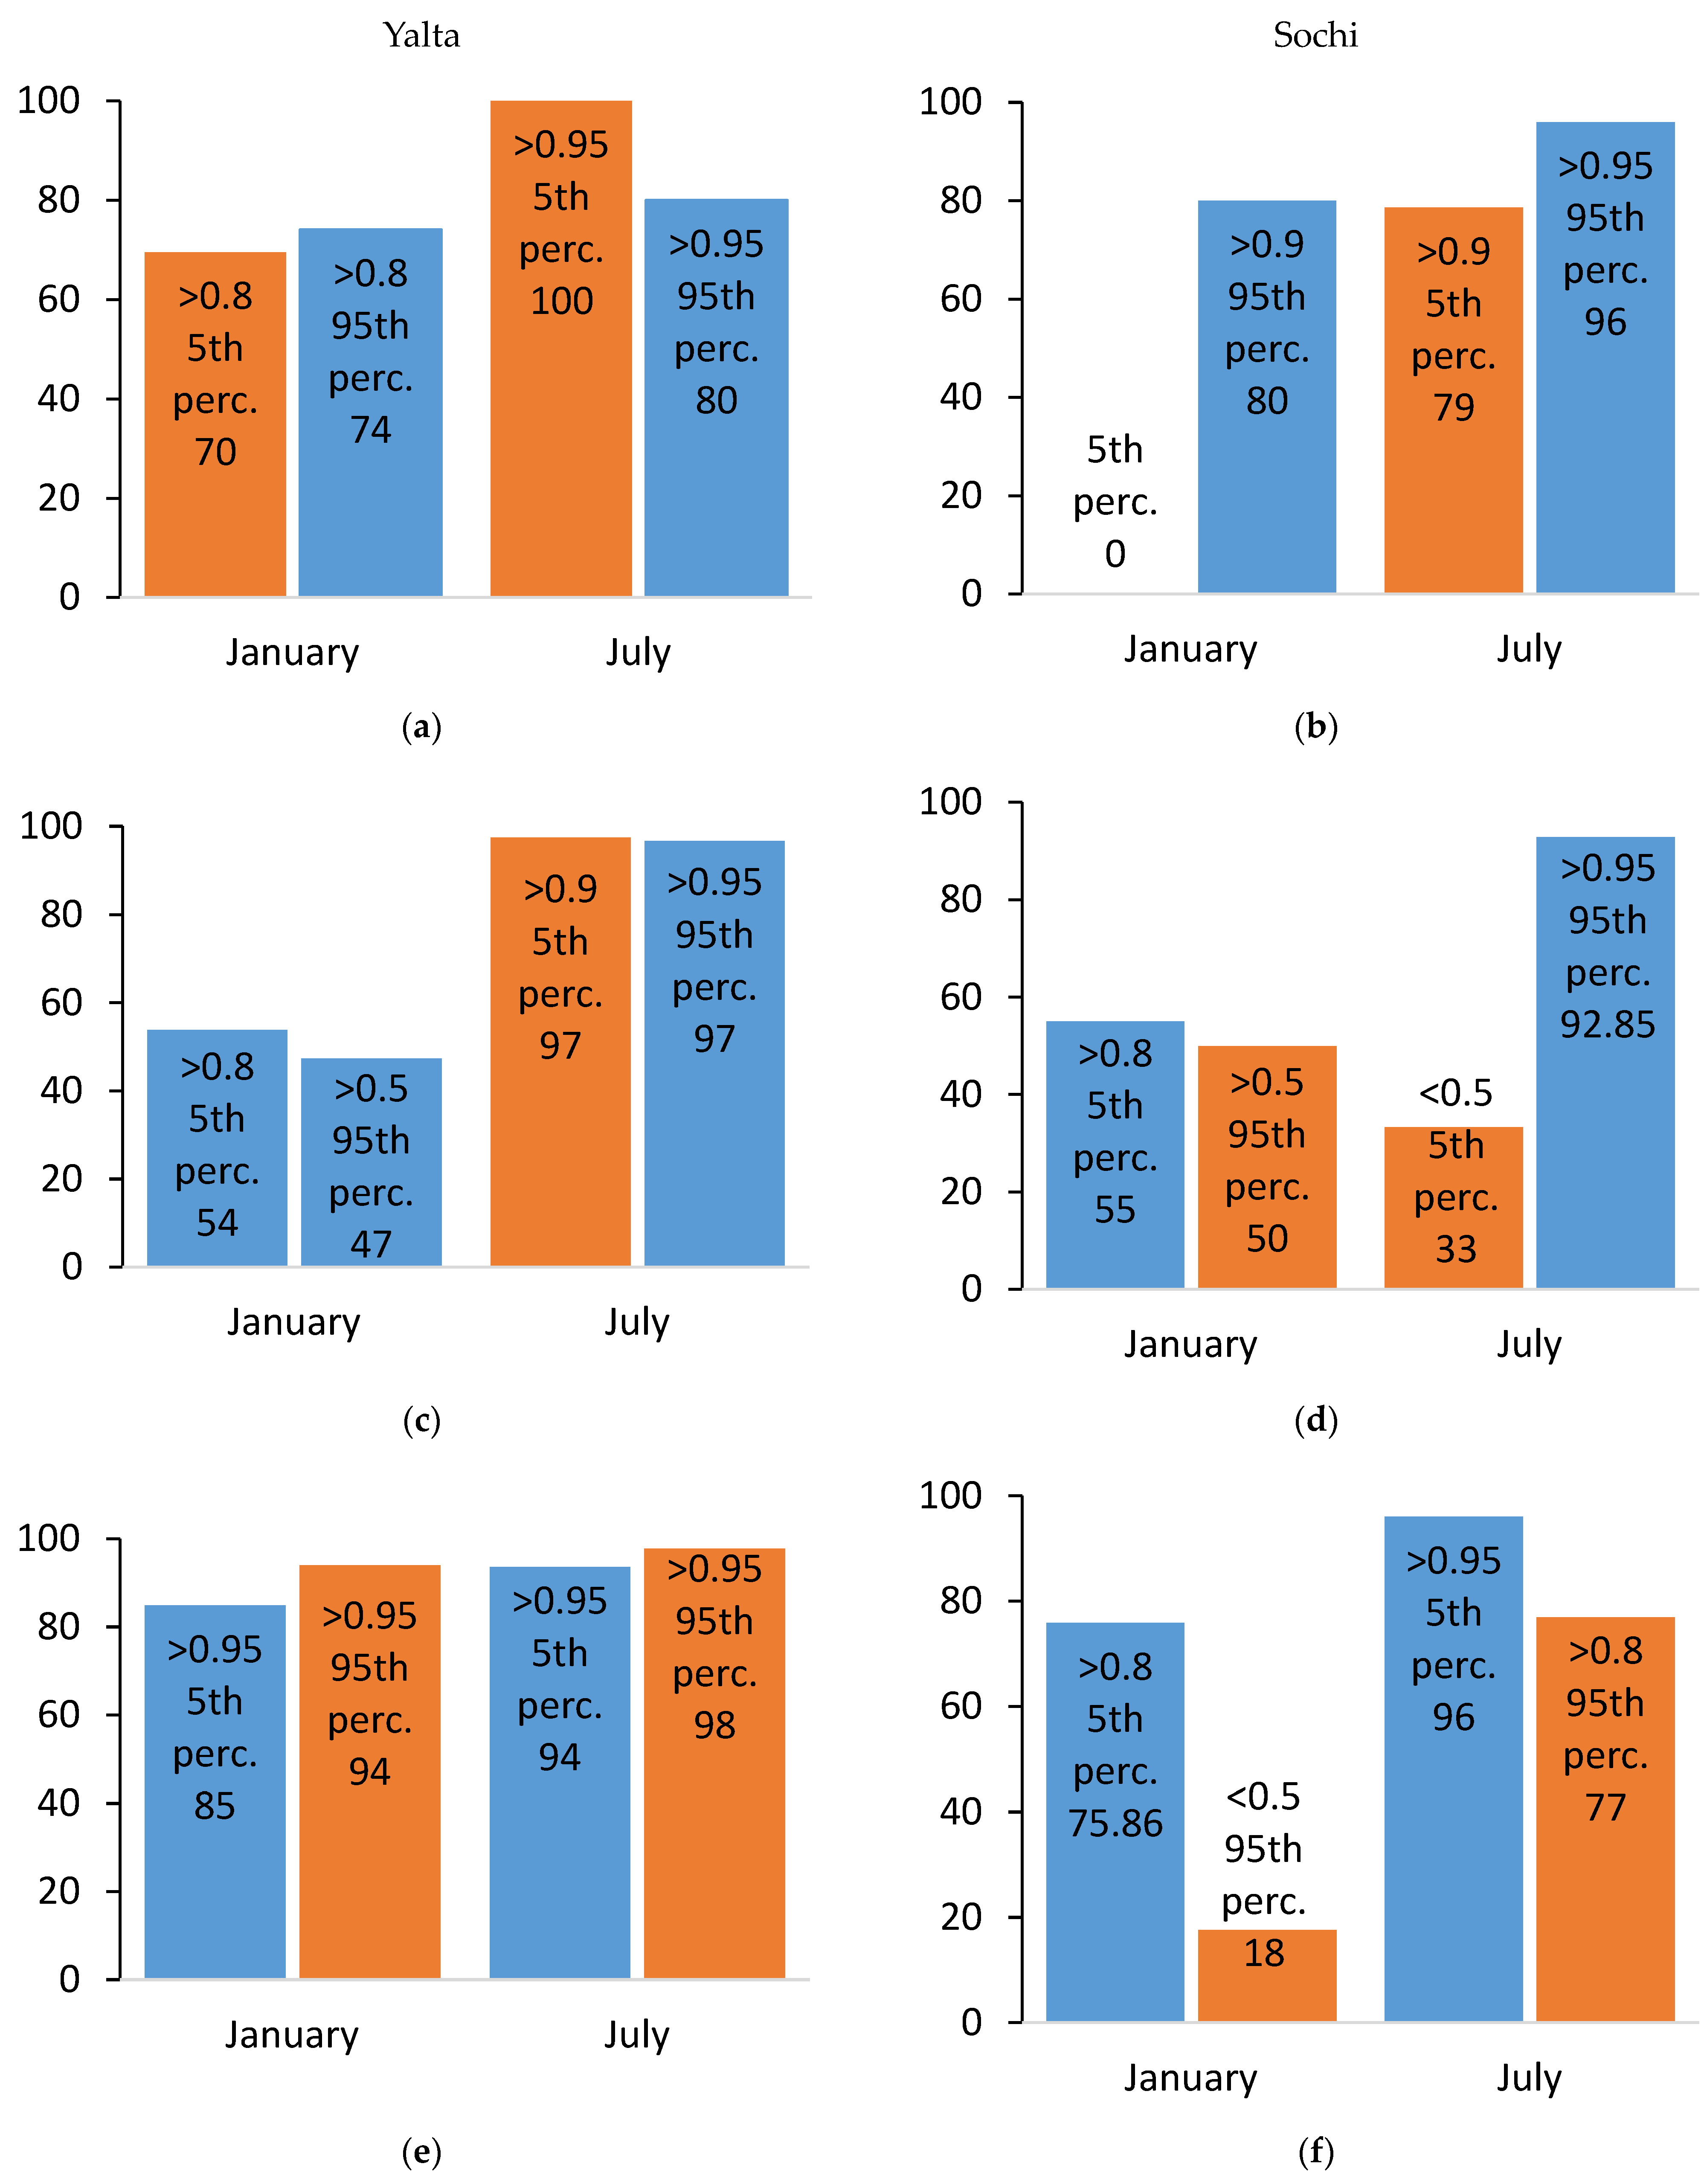
More significant (with a confidence probability of 90%) differences of the composites are found for the EAO phases (
Figure 11). As for the NAO phases (
Figure 10), the confidence probability of differences is at the level of 80% for the Yalta resort and rarely reaches 95% for the Sochi resort.
In Yalta (
Figure 11a,c,e) in July, the positive EAO phase is characterized by the significant prevalence of days with extremely low values of the H
w index (100% of the days) and ρO
2 index (97% of the days), and extremely high values of EET index (98% of the days). The negative EAO phase in July is characterized by the significant prevalence of days with extremely high H
w index values (by 80% of days) and ρO
2 index values (by 97% of days), and extremely low EET index values (by 94% of days). In January, at a high level of significance, the EAO is manifested only in the frequency of days with extreme EET values: days with extremely high EET index prevail (by 98% of days) in the positive phase; days with extremely low EET index prevail (by 94% of days) in the negative phase. At the level of confidence probability of 80%, the EAO in January is manifested in an increased frequency of days with extremely low H
w values in the positive phase (by 70% of days) and opposite conditions in the negative phase (by 74% of days). In the negative phase of the EAO in January, with a confidence probability of 80%, days with extremely low values of ρO
2 index prevail (54% of days).
Thus, the positive phase of the EAO is significantly manifested in Yalta in an increase in the frequency of hot, windless, and stuffy days in July in the positive phase and extremely hot and less likely windless days in January relative to the opposite conditions in the negative phase.
In Yalta (
Figure 10a,c,e) in July, days with extremely low H
w values prevail (by 81% of days) in the positive NAO phase with a confidence probability of 80% relative to the opposite conditions in the negative phase (by 55% of days). In January, at the level of 80%, NAO is manifested in an increase in the frequency of days with extreme EET index values: extremely low in the negative phase (by 65% of days) and extremely high in the positive phase (by 74% of days). As for the ρO
2 index, NAO is characterized by an increase in the frequency of days with extremely high index values in the negative phase (by 52% of days) at the confidence level of 80%.
Consequently, NAO is manifested at a lower level of significance than the EAO and is characterized by an increase in the frequency of hot days in January and windless days in July in the positive phase relative to the opposite conditions in the negative phase (extremely cold days in January and windy days in July).
At the same time in Yalta, in the frequency of days with extreme values of the weight oxygen content index in January, there are no opposite responses for the positive and negative phases of NAO and EAO. However, at some level of significance (80%), there is an increase of extremely stuffy days in the negative EAO phase and opposite conditions in the negative NAO phase.
The character of the manifestations of the NAO and EAO in the frequency of days with extreme values of bioclimatic indices in Sochi (
Figure 10b,d,f and
Figure 11b,d,f) is generally the same as for Yalta (larger numbers in the same phase, especially for the wind cooling index and equivalent-effective temperature), but there is a difference in the quantitative assessment of the response (difference of days). This confirms the reliability of the obtained regional manifestations of global oscillations.
The analysis of diagrams for Sochi (
Figure 10b,d,f and
Figure 11b,d,f) by analogy with the above analysis for Yalta allows us to draw the following conclusions. Negative EAO phase (
Figure 11b,d,f) is characterized by the significant responses in the increase of the windy days in January and cold, fresh (hyperoxia) and windy days in July versus windless days in the positive phase in July. Negative NAO phase (
Figure 10b,d,f) is significantly manifested in an increase in the frequency of windless, stuffy, and hot days in January and fresh days in July.
Regional responses in the frequency of extreme values of bioclimatic indices on the NAO reach a higher level of significance in Sochi compared to Yalta. This can be explained by the corresponding configuration and extension of mountain ranges and the resulting greater exposure of Sochi to the impact from the northwest (from the teleconnection with the Icelandic minimum in the North Atlantic). Yalta is protected from this and is more influenced from the south from the area of anomalies of the Azores maximum, the influence of which is expanded to the Mediterranean–Black Sea region under the EAO.
4. Discussion
The analysis of variability of the bioclimatic indices revealed the low-frequency quasiperiodicity on the time scale comparable to the half of the series length. This feature can be associated both with the natural large-scale oscillations and with global temperature rise.
A half-century variability of global climate system on the periods about 60 years is mostly associated with the Atlantic Multidecadal Oscillation [
56] and Pacific Decadal Oscillation [
57]. These oscillations are fluctuations of large-scale anomalies of sea surface temperature in the North Atlantic and North Pacific associated with the meridional overturning (thermohaline) circulation in the oceans [
58,
59]. They determine the natural decadal-multidecadal fluctuations of atmospheric circulation throughout the hemisphere, including cyclonic activity [
35,
60] and associated anomalies of hydrometeorological and biological parameters [
57]. Increased cyclonic activity leads to higher wind speeds and changes in air temperature anomalies: positive in winter and negative in summer [
42].
A linear trend of global warming is superimposed on natural fluctuations, the regional responses of which are uneven and increase further inland over territories remote from the ocean, and in the circumpolar regions [
31,
61]. Depending on the combination with the phases of natural oscillations, the global warming effect can be amplified or masked [
62,
63].
Regardless of what the linear trends found in the work are mainly associated with, their positive effect is in the improvement of the bioclimatic comfort of the resort during the cold season. In the summer, the bioclimatic comfort has already increased during the study period and there is a reserve for it to remain in this comfortable range in the 21st century. Thus, if trends remain the same in the 21st century, Yalta will have the opportunity to turn into a year-round resort.
Composite analysis of the frequency of days with extreme values of bioclimatic indices showed the EAO was characterized by more significant manifestations than the NAO. This needs to be discussed because the NAO is the main climatic mode of atmospheric circulation of the Northern Hemisphere on an interannual scale. We consider that the explanation is in the spatial structures of the responses to the NAO and EAO in the air temperature and precipitation fields, which differ in the latitude and longitude of the maxima and their magnitude [
42].
The positive phases of the NAO and EAO in January are characterized by a positive monthly average temperature anomaly in Europe (more than 3 °C in the European part of Russia); however, in the positive EAO phase, this area is shifted to the east compared to the NAO [
41].
In the negative NAO and EAO phases, the meridional circulation increases, while a more pronounced negative temperature anomaly in Europe is observed in the negative EAO phase (up to −5 °C in the center of the European part of Russia). With the meridional type of circulation, there is a more powerful influx of polar/tropical air in winter/summer than with the zonal type [
64]. At the same time, the extreme weather events, such as for example storm events and daily precipitation extremes, become more frequent with the meridional type of circulation [
65,
66]. The temperature anomaly in winter [
41] shows that, the influx of polar air in the EAO is more pronounced than in the NAO. The correlation field of the NAO with air temperature and precipitation, the Black Sea region is located on the border between positive and negative centers [
42].
In the negative phases of the NAO and EAO, the frequency of cyclones in the Mediterranean region in winter is higher, but the differences for the EAO are not so pronounced and do not extend to the northern part of the Black Sea region [
42]. The responses to the EAO in January were mainly associated with the exits of western cyclones from the North Atlantic during the negative phase (
Figure 2b), which are larger, deeper, and more intense than the Mediterranean cyclones, but usually they reach the region less often.
In summer, there is a positive correlation of the EAO with temperature and a slight negative correlation with precipitation in the Black Sea region, which is associated with increased frequency of cyclones in the negative phase [
42].
Another aspect that needs to be taken into account when analyzing regional responses is the joint effect of global oscillations. For example, in [
41], it was shown that the combination of strong NAO and EAO phases does not strengthen their individual responses, but softens them. However, the long-term steady positive EAO phase on the background of a weak and alternating NAO phases can lead to more significant changes in the atmospheric circulation and temperature regime of the Atlantic-European region [
41].
Thus, due to the fact that the centers of action (the Icelandic minimum and the Azores maximum) in the EAO are shifted to the south and southeast from the position of the centers of action in the NAO, anomalies of regional responses are also shifted and are better manifested in extreme bioclimatic indices in the Black Sea region. The results obtained indicate that responses in regional anomalies and extremes may differ significantly from global/hemispheric patterns.
5. Conclusions
This study analyzes the long-term variability of bioclimatic indices: wind cooling index (Hw), weight oxygen content (ρO2), equivalent-effective temperature (EET), for the two Black Sea resorts in January and July in 1950–2018 for the Yalta resort, Southern coast of Crimea, and 1950–2013 for the Sochi resort, Caucasian coast. The variability of the bioclimatic indices is mainly characterized by interannual fluctuations on the background of synchronous in Yalta and Sochi multidecadal oscillations on a period of about 30 years. Significant (at the level of 97–99.99%) linear trends of all indices are shown for Yalta: negative for Hw and ρO2 and positive for EET. The largest values of the trends with the largest contribution to variability (more than 30% of the variance) are typical for July and are equal to −0.86 mcal cm−2 s−1 for the Hw index, −0.5 g/m3 for the ρO2 index, and +0.6 °C for the EET index over 10 years. At the same level of significance for Sochi, only two trends are found: the decrease of Hw index and the increase of the EET index in July. Their rates (trend coefficients) are half of those for Yalta.
The long-term course of the number of days with extremely low (5th percentile) and extremely high (95th percentile) values of bioclimatic indices is analyzed and linear trends of these series are shown. Trends in the number of days with extreme index values in Yalta logically correspond to the trends of the indices: for increasing/decreasing indices (EET/Hw, ρO2), the number of days with extremely high/low index values also increases, while the number of days with extremely low/high values decreases. The rate of these trends over the entire 69-year period mainly is about 2 days with a maximum of about 3.8 days (for an increasing number of days with extremely high EET in January and July and with extremely low Hw and ρO2 in July).
The first half of the analyzed series (until about the mid-1980s) of the frequency of days with extreme values of the bioclimatic indices in Yalta was characterized by a less pronounced amplitude of the interannual course and an almost complete absence of linear trends and days with extremely low values of the Hw and ρO2 indices and extremely high values of the EET index, especially in July. The revealed features can indicate both the presence of about half-century variability and a global warming effect.
Trends in the number of days with extreme index values in Sochi in July are consistent with the trends of the indices: significant increase in the frequency of windless and stuffy days explains the significant downward trend of the Hw index and less significant downward trend of the ρO2 index; significant increase of hot days contributes to the significant increase of the EET index. In addition to that, significant trends of the frequency of extremes found also in January are not reflected in the tendencies of the bioclimatic indices. This may evidence a change in the statistical distribution of the extremums to the milder wind cooling conditions and greater temperature extremes in January. Thus, in Sochi, it is possible that global warming affects the extremes of bioclimatic indices in January. Compared to Sochi, Yalta seems to be more sensitive to the global temperature rise in the terms of bioclimatic indices. Due to the orography, Yalta is more exposed to the tropical processes, and Sochi is characterized by the moderating effect of wet sea air masses brought by the westerlies.
Composite analysis was used to assess the manifestations of the North Atlantic Oscillation (NAO) and the East Atlantic Oscillation (EAO) on extreme values of bioclimatic indices in Yalta and Sochi in January and July. The results show the difference in the number of days with extremely low (5th percentile) and high (95th percentile) index values in the positive and negative phases of NAO and EAO.
It was shown for both resorts that negative EAO phase is significantly manifested in the increase of windy days in July versus the increase of windless days in the positive phase, and in the more frequent fresh and cold days in July (versus the opposite conditions in the positive phase with enough significance only in Yalta). At a lower confidence level (from 80%) in both resorts, the negative EAO phase leads to the more frequent windy and cold days in January (versus the opposite conditions in the positive phase in Yalta).
The NAO manifestations in the frequency of extreme bioclimatic indices are mostly less pronounced than those of the EAO and are more significant in Sochi. Comparing Yalta and Sochi, the rate and significance of the responses to the NAO are different likely due to orientation of mountain ranges, although their character is mostly the same (large numbers in the same phase). For both resorts at a confidence level of 80–95%, the negative NAO phase is manifested in the more frequent hot days in January (versus cold days in the positive phase in Yalta). The other most significant (from 80% level) individual responses of the negative NAO phase are as follows: in January, more frequent windless and stuffy days in Sochi and fresh days in Yalta; in July, more frequent windless days in Yalta and fresh days in Sochi versus the opposite conditions in the positive phase; and more frequent cold days in July in Yalta.
Future research can be developed by involving better resolution data and considering a larger range of teleconnection patterns (for example, Eurasian and regional Mediterranean oscillations). The study can be expanded to other resorts for the purposes of comparison of their recreational attractiveness by bioclimatic conditions and long-term economic planning of tourist and recreational activities of resorts.
