Article

Climate Risk Analysis Using a High-Resolution Spatial Model in Costa Rica

by
María del Milagro Garro-Quesada
,
Martín Vargas-Leiva
,
Pascal O. Girot
and
Adolfo Quesada-Román
*
Escuela de Geografía, Universidad de Costa Rica, San José 11501-2060, Costa Rica
*
Author to whom correspondence should be addressed.
Climate 2023, 11(6), 127; https://doi.org/10.3390/cli11060127
Submission received: 13 April 2023 / Revised: 27 May 2023 / Accepted: 5 June 2023 / Published: 8 June 2023
(This article belongs to the Section Climate Adaptation and Mitigation)

Abstract

:
Increasing extreme weather and climate events have led to recurrent disasters that cause significant harm to human populations. The aim of this present study is to complement Costa Rica’s National Meteorological Institute 2017 risk assessment methodology for extreme weather and climate events. This methodology uses different socio-spatial indicators related to vulnerability and hazards to extreme hydrometeorological events. However, in the methodology applied and presented in this document, an exposure component was added to the model to obtain a more detailed representation of climate-related risks. The presented methodology was implemented in the municipalities of Cartago and Turrialba, where the frequency and severity of weather events have been a major issue in the last few decades. The results showed in fact, there were considerable differences between both, whereby factoring in the exposure component it is possible to visualize more specific risk zones, which evidences the need to include exposure components in this type of model, as this may allow for more timely responses and disaster risk prevention according to the specific vulnerability conditions in these zones. The outcomes at the minimal geostatistical unit level can aid local decision makers in developing more effective disaster risk management and adaptation strategies to minimize the loss of life and property resulting from extreme weather and climate events in Costa Rica.

1. Introduction

The frequency and intensity of weather-related disasters are on the rise globally [1]. This trend is primarily driven by the accelerating effects of human-induced climate change [2,3,4]. Since the start of the Industrial Revolution, the emission of greenhouse gases and other substances such as aerosols have led to a rise in atmospheric levels, resulting in an increase of around 1.07 °C in the Earth’s average surface temperature, with variations observed between the northern and southern hemispheres and in the oceans [4].
Central America ranked among all the countries with the highest risks worldwide according to the World Risk Report 2018 [5]. This is due to the location and geographical context as the risk involving coastal hazards such as typhoons, storm surges, and rising sea levels is high. Hydrometeorological events account for more than 80% of the disasters in this country during the last century [6].
The increasing frequency of weather-related disasters, driven by climate change, is exacerbating the issue of social vulnerability and hazard exposure [7]. This highlights the need for improved risk assessments using multi-scale, multi-variable approaches [8]. Effective adaptation strategies must consider not only an analysis of weather-related hazards but also the vulnerability and degree of exposure of key stakeholders and affected populations to accurately assess and address rapidly changing risk conditions.
In a regression analysis within a model of disaster risk determination, there is a significant association between the increase in disasters and population exposure, represented by population densities. There is a significant association between climate-related hazards (greater precipitation linked to floods and storms and especially higher temperature linked to droughts and heat waves) and the frequency of weather-related disasters in Asia and the Pacific and its subregions during 1971–2010 [9].
The Sendai Framework for Disaster Risk Reduction developed a conceptual framework for disaster risk reduction globally by combining concepts of vulnerability, hazard, and exposure through a variety of analytical tools [3,10]. The characterization of climate change impacts on natural and human systems depends on a complex interaction between global mitigation and local adaptation actions, which vary depending on geography, economy, politics, and society [11]. While statistical models can predict the likelihood of extreme events and potential losses, the attribution of causality of these events is complex and subject to uncertainty [12]. To assess hydrometeorological risk, multivariate approaches combining different indicators, either qualitative or quantitative, are used [13]. Multivariate methods can handle many variables but their interpretation requires precise statistical estimates [14].
To effectively assess the adverse effects of climate-related hazards on human populations, the use and management of geostatistical data is crucial. These methodologies allow for the comparison of risk factors between geographical areas and facilitate the monitoring of changes resulting from damaging events in dynamic geomorphological and socioeconomic contexts. High-resolution models generated from these data can help identify risk zones and provide valuable information for future climate risk projections. This information can then be integrated into land-use plans and urban design by local authorities, thereby contributing to more effective adaptation measures [15,16,17,18].
Being a small country with a tropical climate and a topography featuring steep hills and numerous rivers, Costa Rica is highly susceptible to disasters associated with extreme weather events, floods, and landslides. Hydrometeorological hazards are the primary cause of over 80% of recorded disaster events in the country [16]. To address this pressing issue, there is a need to enhance the accuracy and reliability of climate risk analysis models. This paper presents the findings of a study that applied a climate risk assessment model to the municipalities of Cartago and Turrialba in Costa Rica. The model uses a high-resolution geospatial approach that integrates vulnerability and exposure indices with hydrometeorological hazards, providing valuable insights for climate risk management.

2. Methodology

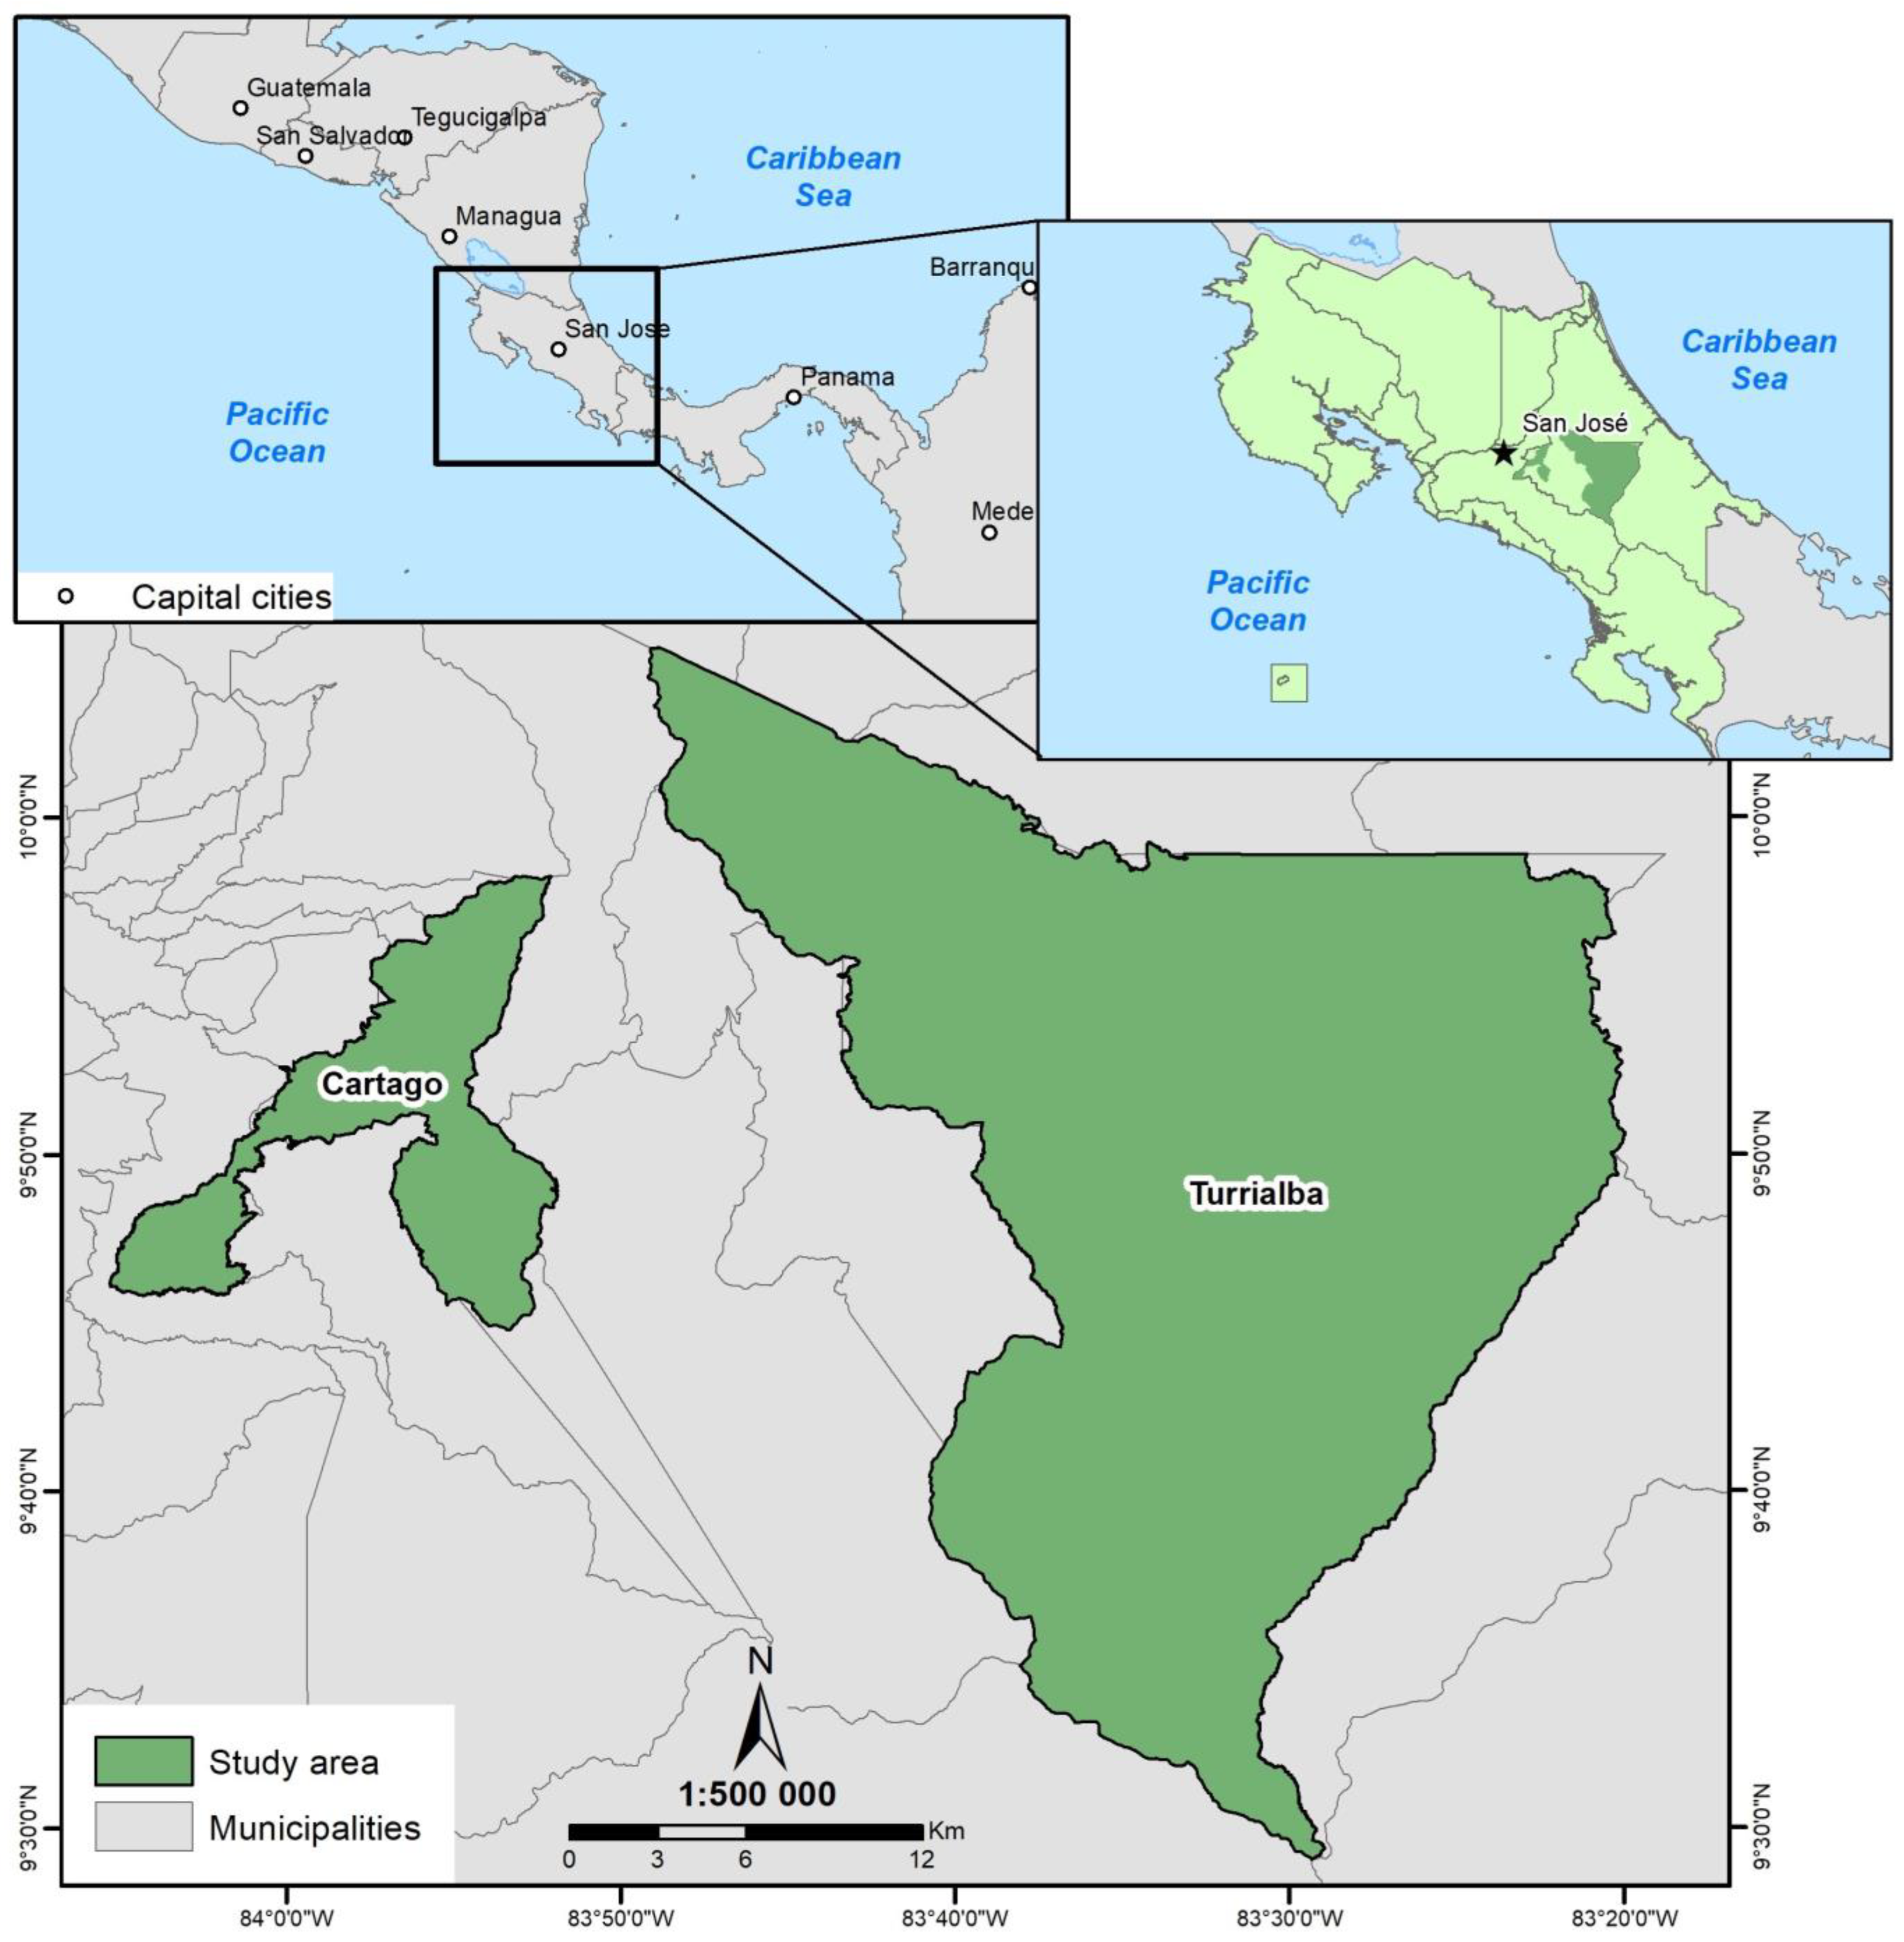
2.1. Geographical Setting

Costa Rica constitutes an illustrative case for the study of the risk of extreme hydrometeorological events due to its geographical location, as the country’s geological, geomorphological, biological, and climatological characteristics make it prone to intense hydrological dynamics [19]. Such events are largely due to a high incidence of tropical cyclones, the influence of the El Niño phenomenon (ENSO), and associated hazards [20]. Moreover, with a socioeconomic structure typical of many Central American countries, Costa Rica has adopted ineffectual land-use planning policies with a limited impact on spatial planning at the national, regional, or local levels [21]. According to the historical record of disasters in Costa Rica and the DesInventar disaster database, Cartago and Turrialba (Figure 1) are among the ten top municipalities in the country for damaging hydrometeorological events.
These municipalities are mostly rural, with significant fast-growing urban central areas [22]. The main cities are often located in high-energy alluvial fans because elsewhere steep slopes and narrow terraces offer limited suitable land for urban growth [23]. For this reason, some of the most exposed populations have been affected in recent years by floods and landslides. Rapid urban growth coupled with informal and unplanned urban sprawl and global climate change poses a major challenge for land-use planning and urban managers [24]. Costa Rica has set forth ambitious policy goals in disaster risk reduction and adaptation to climate change, with the clear objective of reducing the country’s contributions to climate change. At the same time, these policies seek to improve the quality of urban life through adaptation measures that aim to bolster the resilience of cities while reducing their vulnerability and ultimately preventing the associated risks for their inhabitants [25]. Therefore, the development of appropriate methodologies to identify the locations and causes of different climate-related risks is needed to prioritize disaster risk reduction and adaptation actions.

2.2. Data and Variables

The proposed methodology is heuristic in nature through the application of a high-resolution spatial model for the risk analysis of extreme hydrometeorological events in different municipalities of Costa Rica. It is based on a multi-variate approach, where risk drivers are defined by multiplying hazards by socioeconomic vulnerability and exposure, in order to map high-risk areas through Geographical Information Systems (GIS).
The hydrometeorological risk model is based on Retana’s methodology [15] and on further adaptations made by this work. This model adopts a social vulnerability approach, aiming at informing municipal planning efforts, which incorporates new variables that have relevance in decision making for disaster risk reduction and climate change adaptation by municipalities. These variables include areas prone to wildfires, as well as landslide and flood-prone areas, in addition to the climatological aridity indicator. These variables were included to reflect differential levels of exposure, in order to measure how selected assets can be preserved from being damaged by a specific natural hazard [26]. Namely these variables, through their location, indicate the primary manifestation of the hazard, and according to differential vulnerability, the potential risk can be adequately characterized. In addition, this methodology can be used to project these variables into the future, also considering possible risk scenarios derived from evolving climate change conditions.
The methodology uses indicators that are related to the vulnerability and hazard components, each one determined by the sum of different relevant variables, also working with standardized data from a formula either positive or negative according to the behavior of the variables. These variables are then standardized between them using the Excel platform because it is necessary to know the maximum and minimum to calculate the vulnerability in each minimal geostatistical unit (MGU). The MGU constitutes the means by which the INEC (National Institute of Statistics and Census) clusters the statistical social information of a population, in a minimum area defined by an extension of territory with similar characteristics and that also has some natural or human features such as rivers or streets so that these basic geostatistical units may be easily identifiable.
The formula for positive normalization is as follows:
c e l l   v a l u e m i n i m u m   v a l u e   o f   t h e   s e r i e s m a x i m u m   v a l u e   o f   t h e   s e r i e s m i n i m u m   v a l u e   o f   t h e   s e r i e s × 10
where the base that is multiplied at the end refers to the total range in which the data will be displayed, so that all calculated indicators are normalized to the same range, in this case from 0 to 10, to make them comparable.
On the other hand, negative normalization is used when an increase in the indicator leads to a decrease in vulnerability and vice versa, therefore, there is an inverse relationship between both components. The formula for negative normalization is as follows:
m a x i m u m   c e l l   v a l u e t o t a l   v a l u e   o f   t h e   s e r i e s m a x i m u m   v a l u e   o f   t h e   s e r i e s m i n i m u m   v a l u e   o f   t h e   s e r i e s × 10
The process to obtain the data for the vulnerability index from the livelihood indicator was differentiated through a factor-weighted methodology that consisted of assigning a relative weight of each MGU to every economic activity, taking as a reference the total population of each of them. Later, the weights are obtained by the difference between the ideal value (which is obtained through an assumption of ideal distribution) and the observed value, taking into consideration the twenty-one economic activities defined. Finally, these differences are added up by row, and thus a number is obtained for each MGU, which will later be transferred to the data matrix to be normalized by applying the formula (Table 1). This provides a high-resolution, spatially differentiated analysis of vulnerability at the MGU scale.

2.2.1. Hazard

The characterization of weather-related hazards was derived from the analysis of meteorological data showing the average annual precipitation over a thirty-year period corresponding to the rainy extreme (90th percentile) according to data obtained from the hydrometeorological stations of the National Meteorological Institute (IMN) based on a Gaussian distributional histogram. According to the intensity of precipitation, its location, and distribution at the district level, a relative hazard index was defined for each district of the canton, resulting in one district with the highest rainfall index and another with the lowest rainfall index.
The precipitation data are vector data obtained from the interpolation between the different meteorological stations that cover the extension of the country. These data come from the National Meteorological Institute (IMN) as the official source of climate data for Costa Rica.

2.2.2. Exposure

In addition to the rainy risk model proposed by Retana et al. [15], this methodology provides an additional analysis of the contribution of exposure to extreme weather hazards as a key risk driver. Two key variables were added, which are the proximity to rivers or flood zones and the presence of steep slopes.
The variable of proximity to rivers shows the presence or absence of rivers in each minimal geostatistical unit (MGU). Thus, there is a higher risk of exposure in those MGUs with the presence of rivers than in the MGUs with the absence of rivers. Regarding slopes, a high-resolution digital elevation model (DEM) was generated from the contour lines of the municipalities under study from which the slopes are generated. Once this information is available and refined at the MGU level, a reclassification is made according to the classes used by Mora–Vahrson–Mora for landslide susceptibility, where the higher the slope range, the greater the exposure [27].
The generated result reveals the points or areas with greater exposure to hydrometeorological risk for the municipalities under study according to the relationship of the hazard and vulnerability variables identified in each MGU. These exposure models have a cell size of 5 × 5 m.
Based on the results of the models, the critical areas with the highest level of climate risk were selected, and field visits were conducted to corroborate the risk profile generated by these models, in order to assess the risk phenomena identified. At the same time, this assessment serves as a basis to establish courses of action for the competent municipal authorities, thus providing solutions and recommendations in terms of future land-use plans for local adaptation and disaster risk management measures for the areas at greatest risk from extreme hydrometeorological events.

2.2.3. Vulnerability

The environmental indicators are incorporated into the sum of the normalized socioeconomic vulnerability indicators, thus obtaining the integrated vulnerability index (IVI), which will be normalized again using the positive normalization formula (Table 1).
For the socioeconomic variables, indicators of poverty and dependent population are selected to calculate the integrated vulnerability index. The poverty indicator is calculated by means of the unsatisfied basic needs Index (UBN), which takes data on the population’s deprivations (access to knowledge and other goods, access to drinking water, access to healthcare, and access to decent housing).
The dependent population, as an indicator for calculating the integrated vulnerability index, includes physical and mental limitations (PLI), which are understood as the population with little or no mobility of arms or legs, and with visual, hearing, and speech impairments. Mental limitations are those associated with intellectual or mental problems. Inhabitants under 14 years of age (CHI) and inhabitants over 65 years of age (OLD) are also considered dependent populations. Unemployment (UNE) is considered another indicator of the dependent population since the impact of a risk event has a low chance of recovery due to their economic condition.
The data for calculating these socioeconomic variables are taken from the 2011 population census from Costa Rica. These variables, by determining the social vulnerability, contribute to determining the most at-risk areas from suffering losses and damage from extreme weather events.
As for the environmental indicators, the livelihood opportunities (OPP) are considered, which are taken from the 2011 population census at the GMU level. This takes into account the number of available sources of employment, assuming that the greater the diversification, the lesser the vulnerability because if a single source of employment is affected, it does not affect the entire population within the GMU under study. land-use conflict (LUC) is also considered, which is processed by overlaying shape files at the district level containing information on the recommended use of the land and the use that is actually given to it. The greater the conflict of use, the greater the vulnerability, due to the fact that this contributes to compounding the number of exposed populations to natural hazards among others.
Protected areas (PARs) are also considered an indicator of vulnerability since the more protected areas in each district, the lower the vulnerability will be since these areas contribute to regulating hydrological services more than other anthropic land uses. These are the official vector data of the country for each canton. The last indicator considered is accessibility (ACC), which by means of vectorial data also officially takes into account the density of roads with respect to the total population of each district, assuming that the higher the density, the lower the vulnerability, since in case of an extreme hydro-meteorological event the possibility of being left stranded is lower.

3. Results

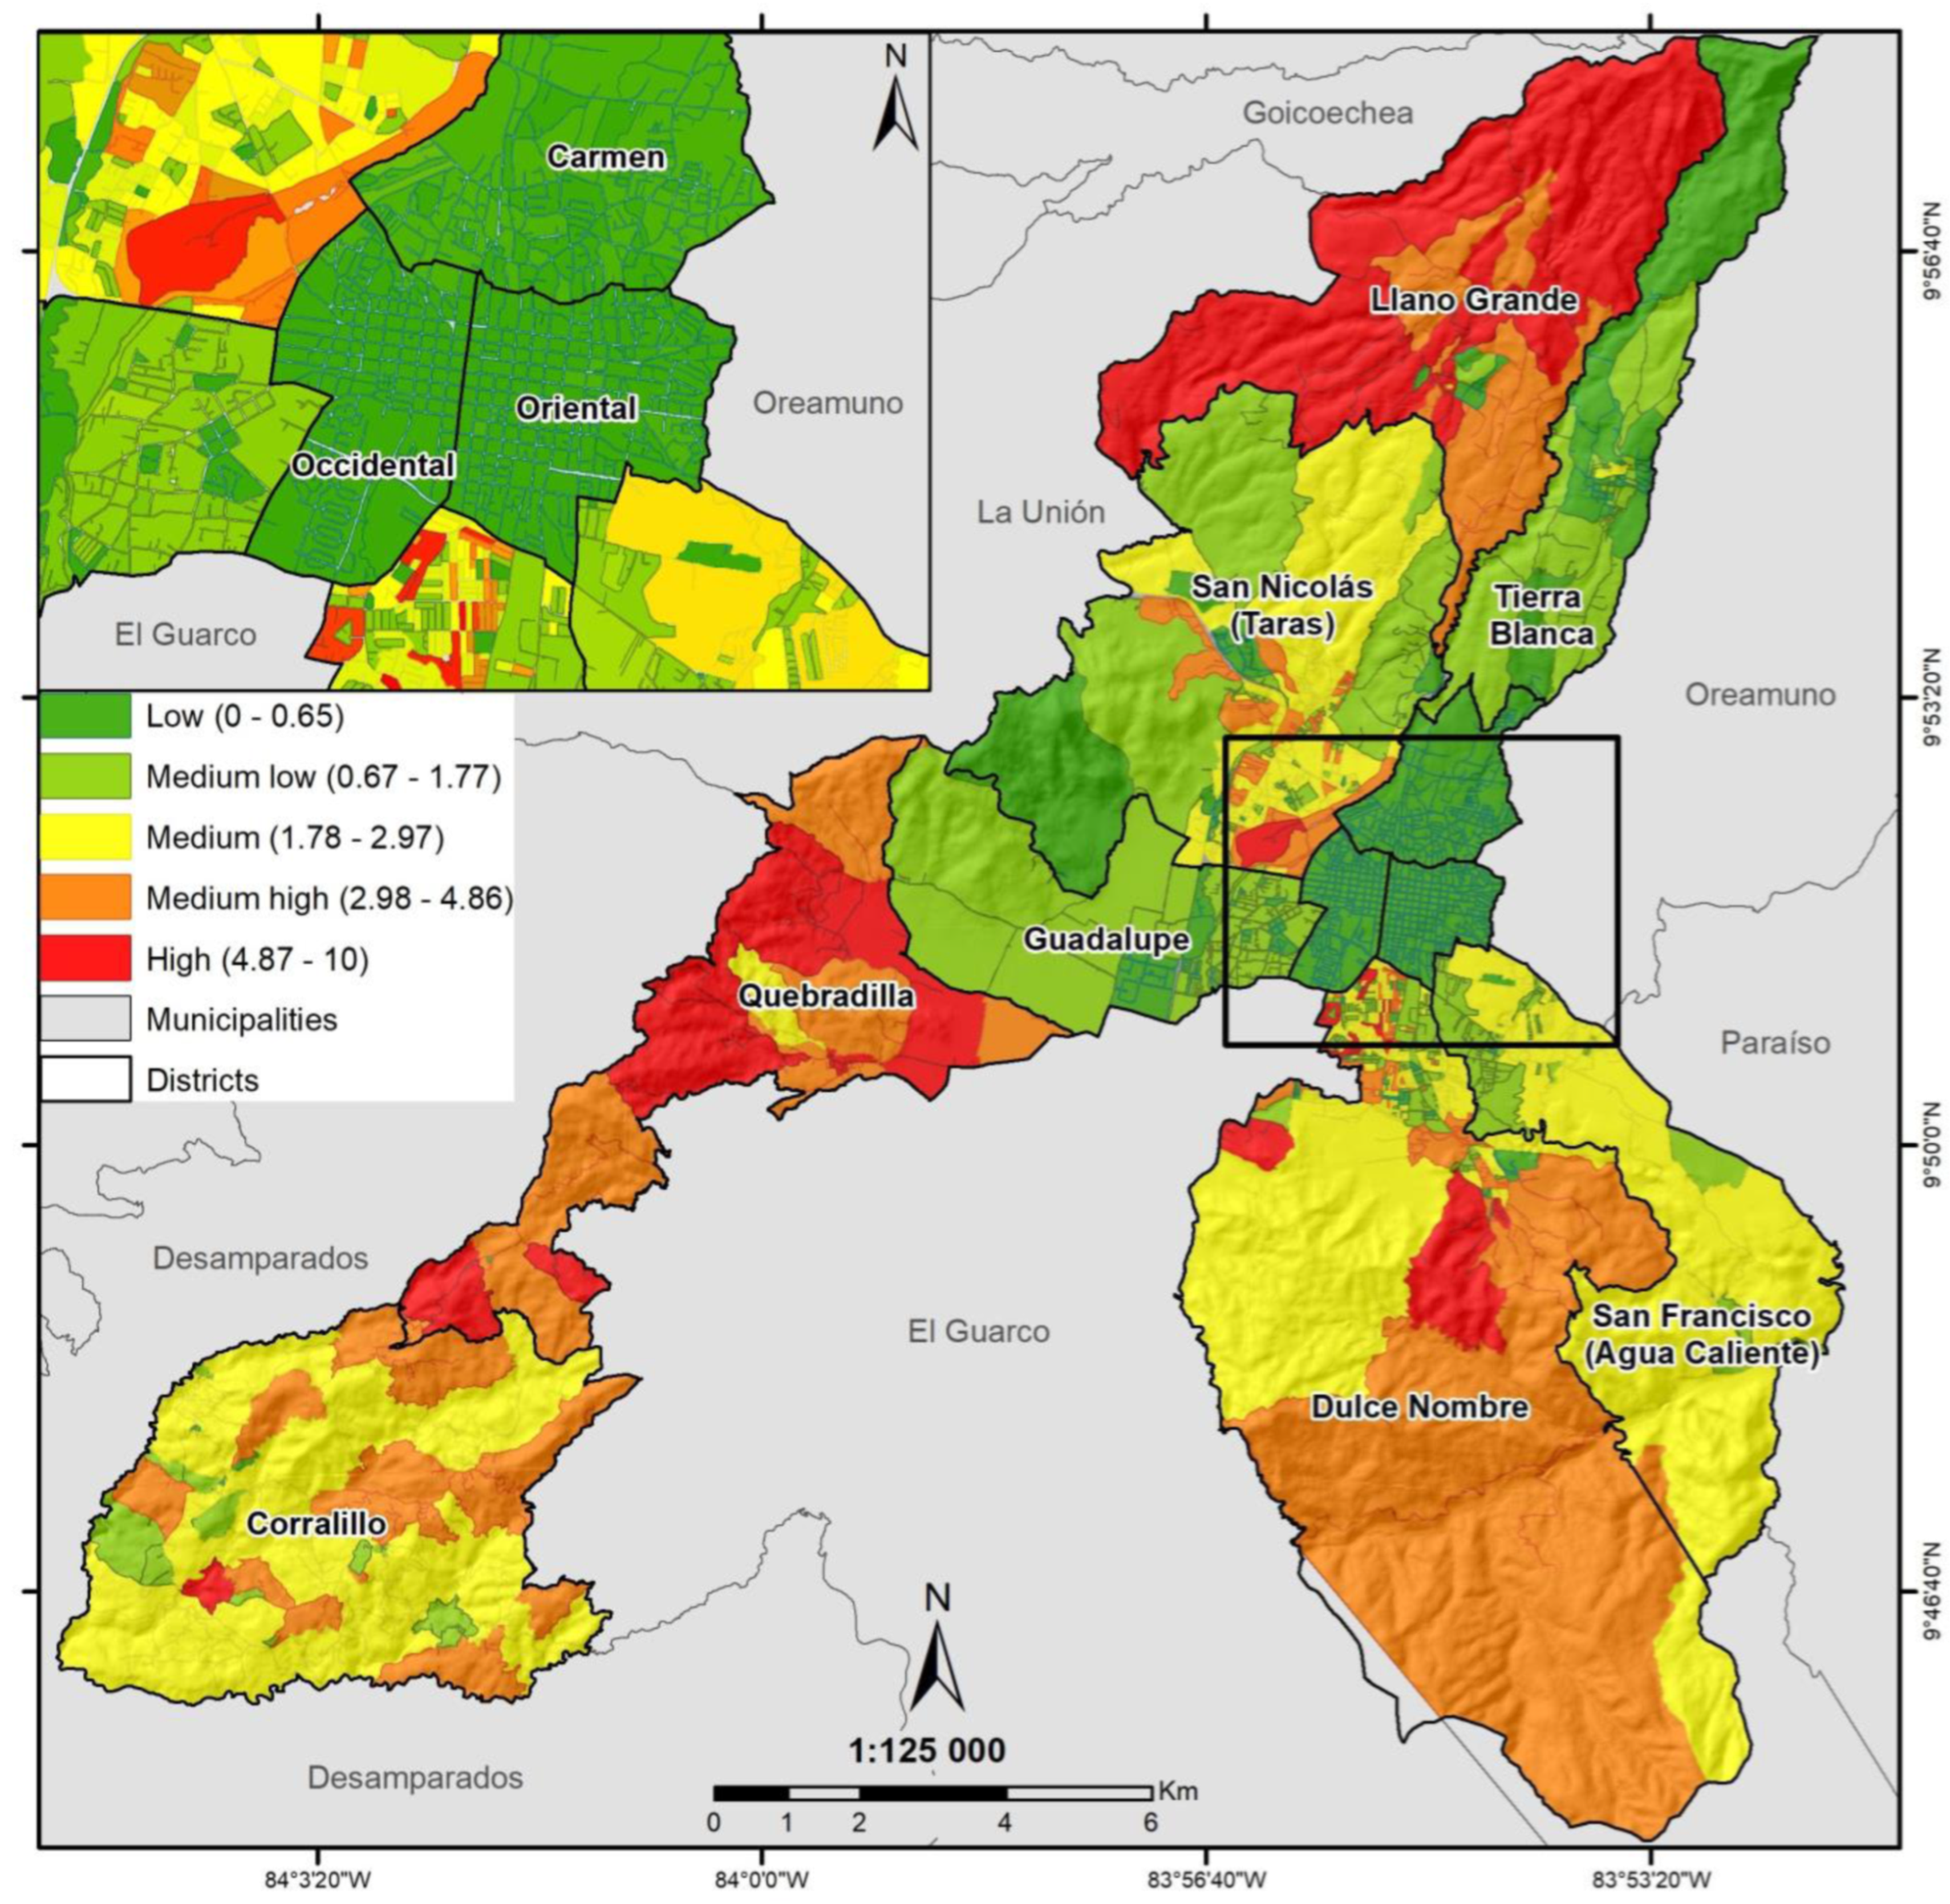
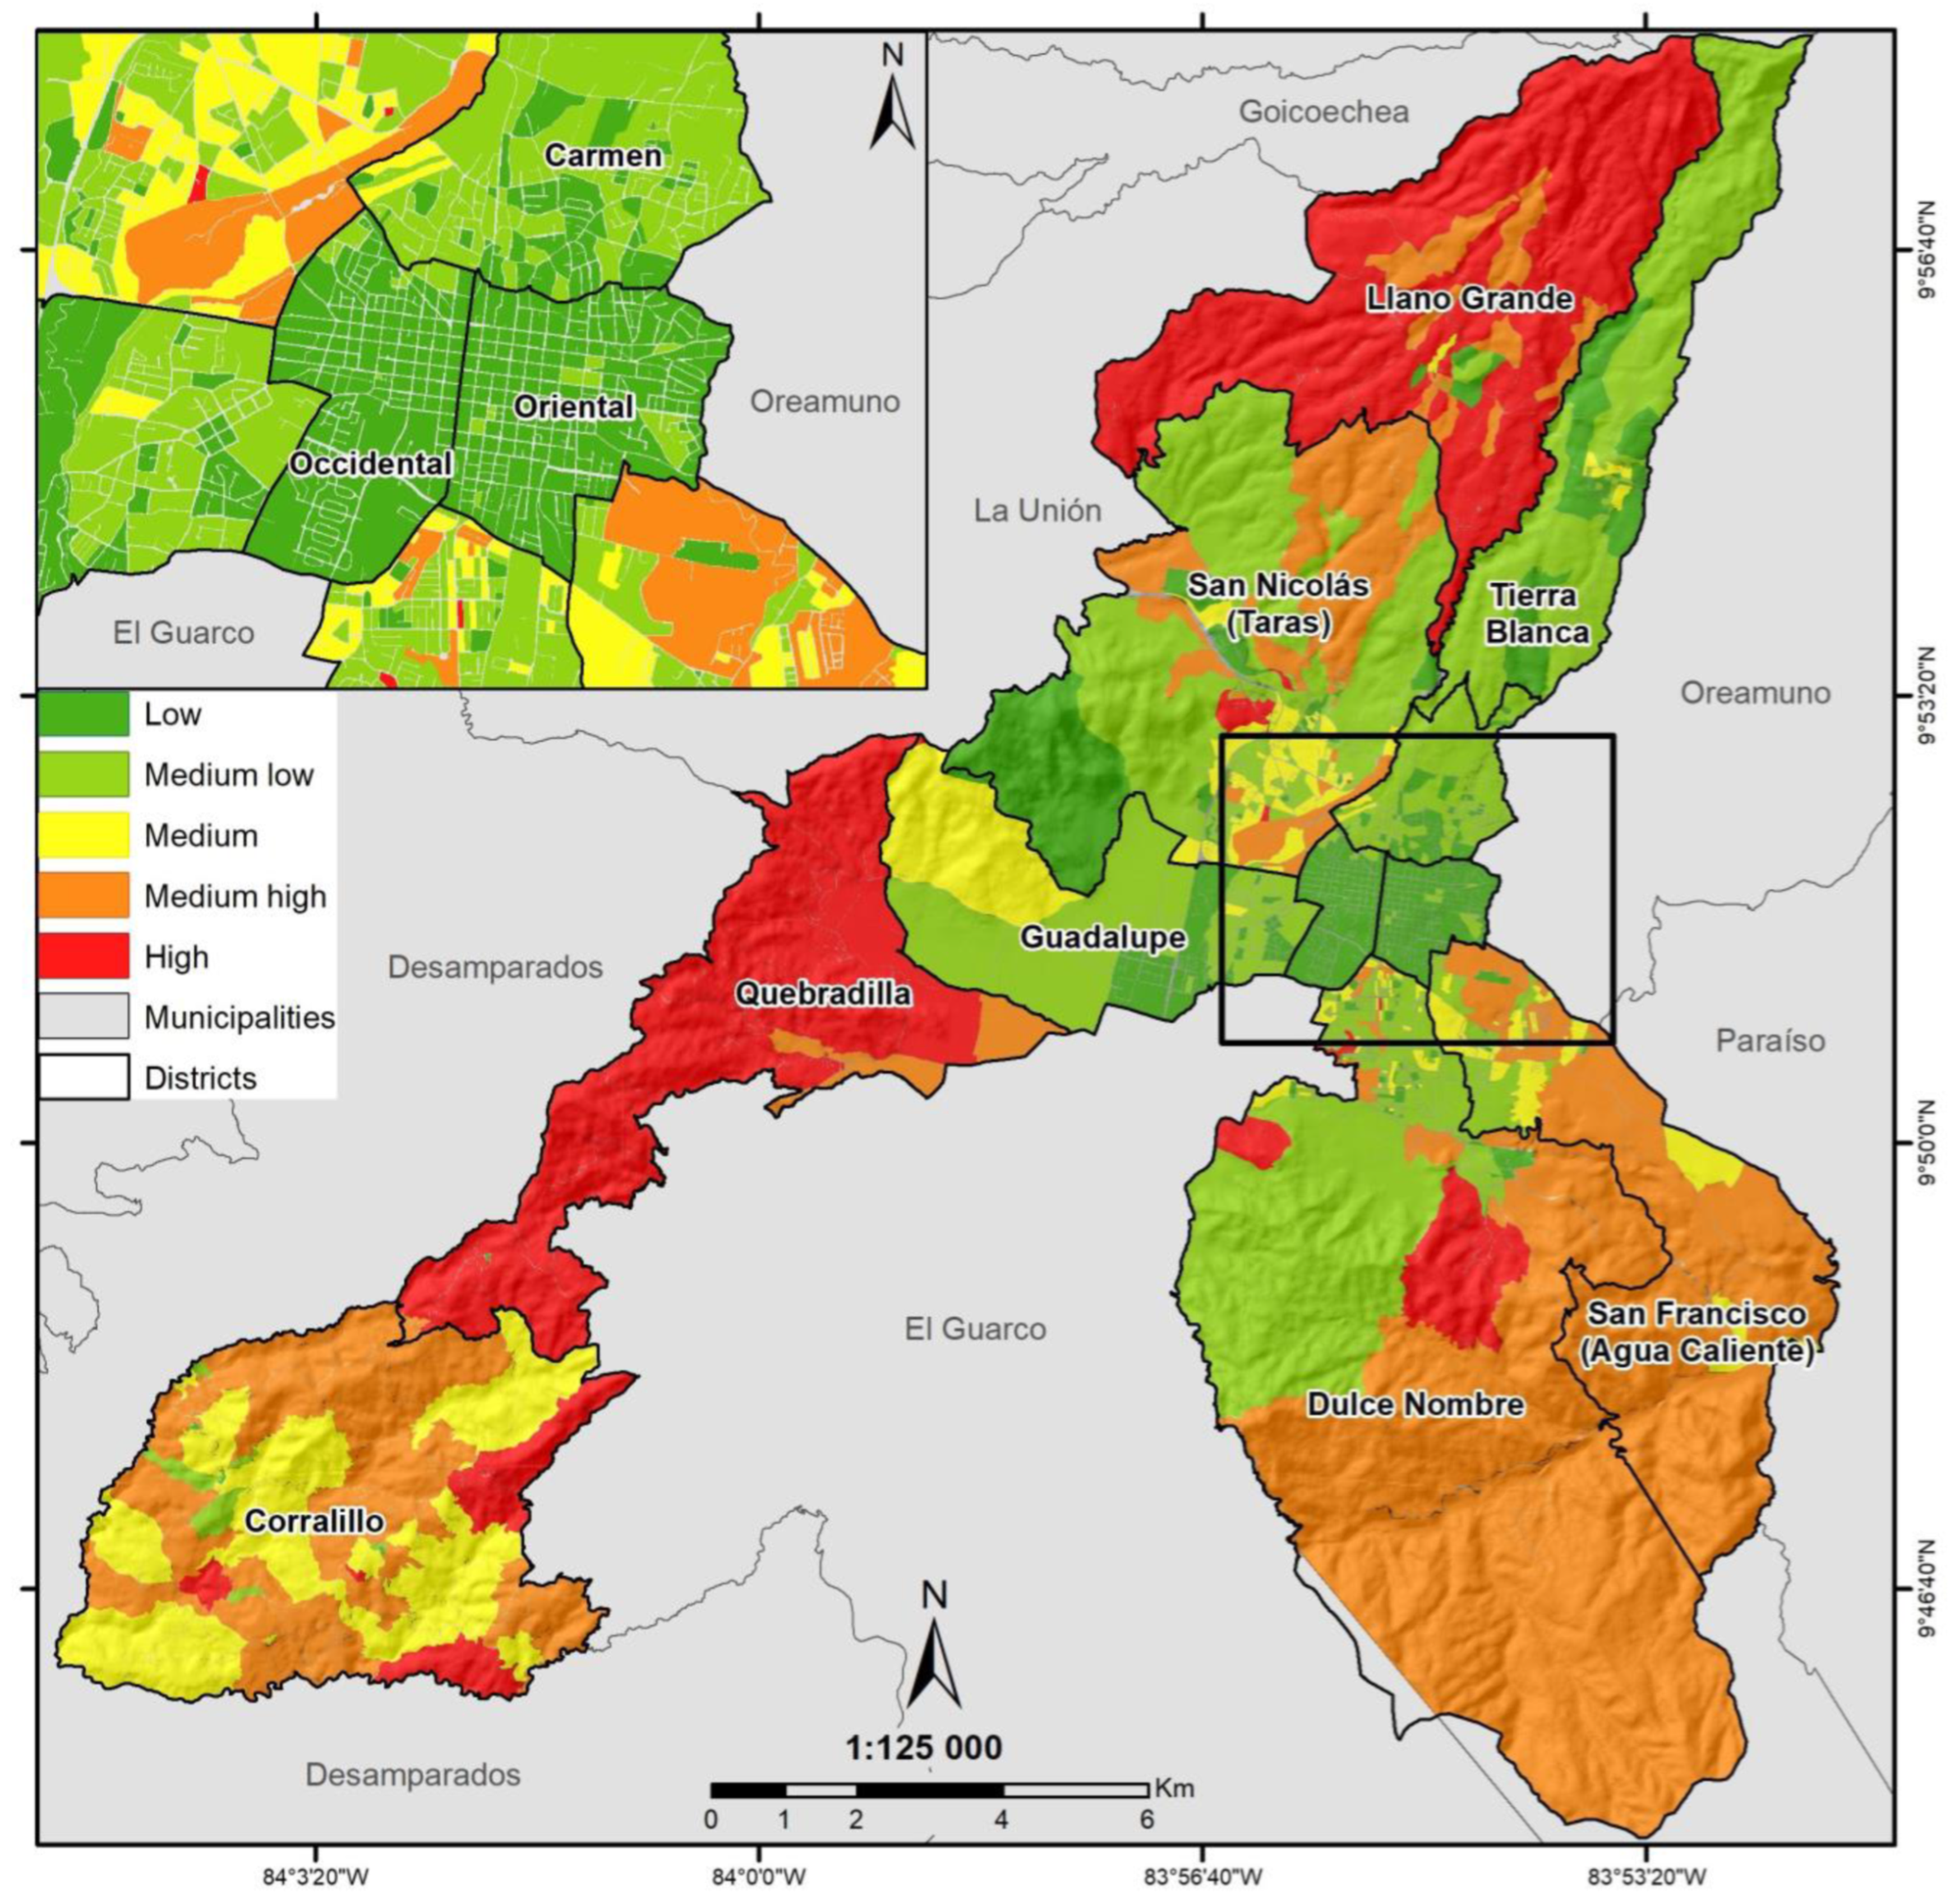
3.1. Risk Analysis for the Cartago Municipality

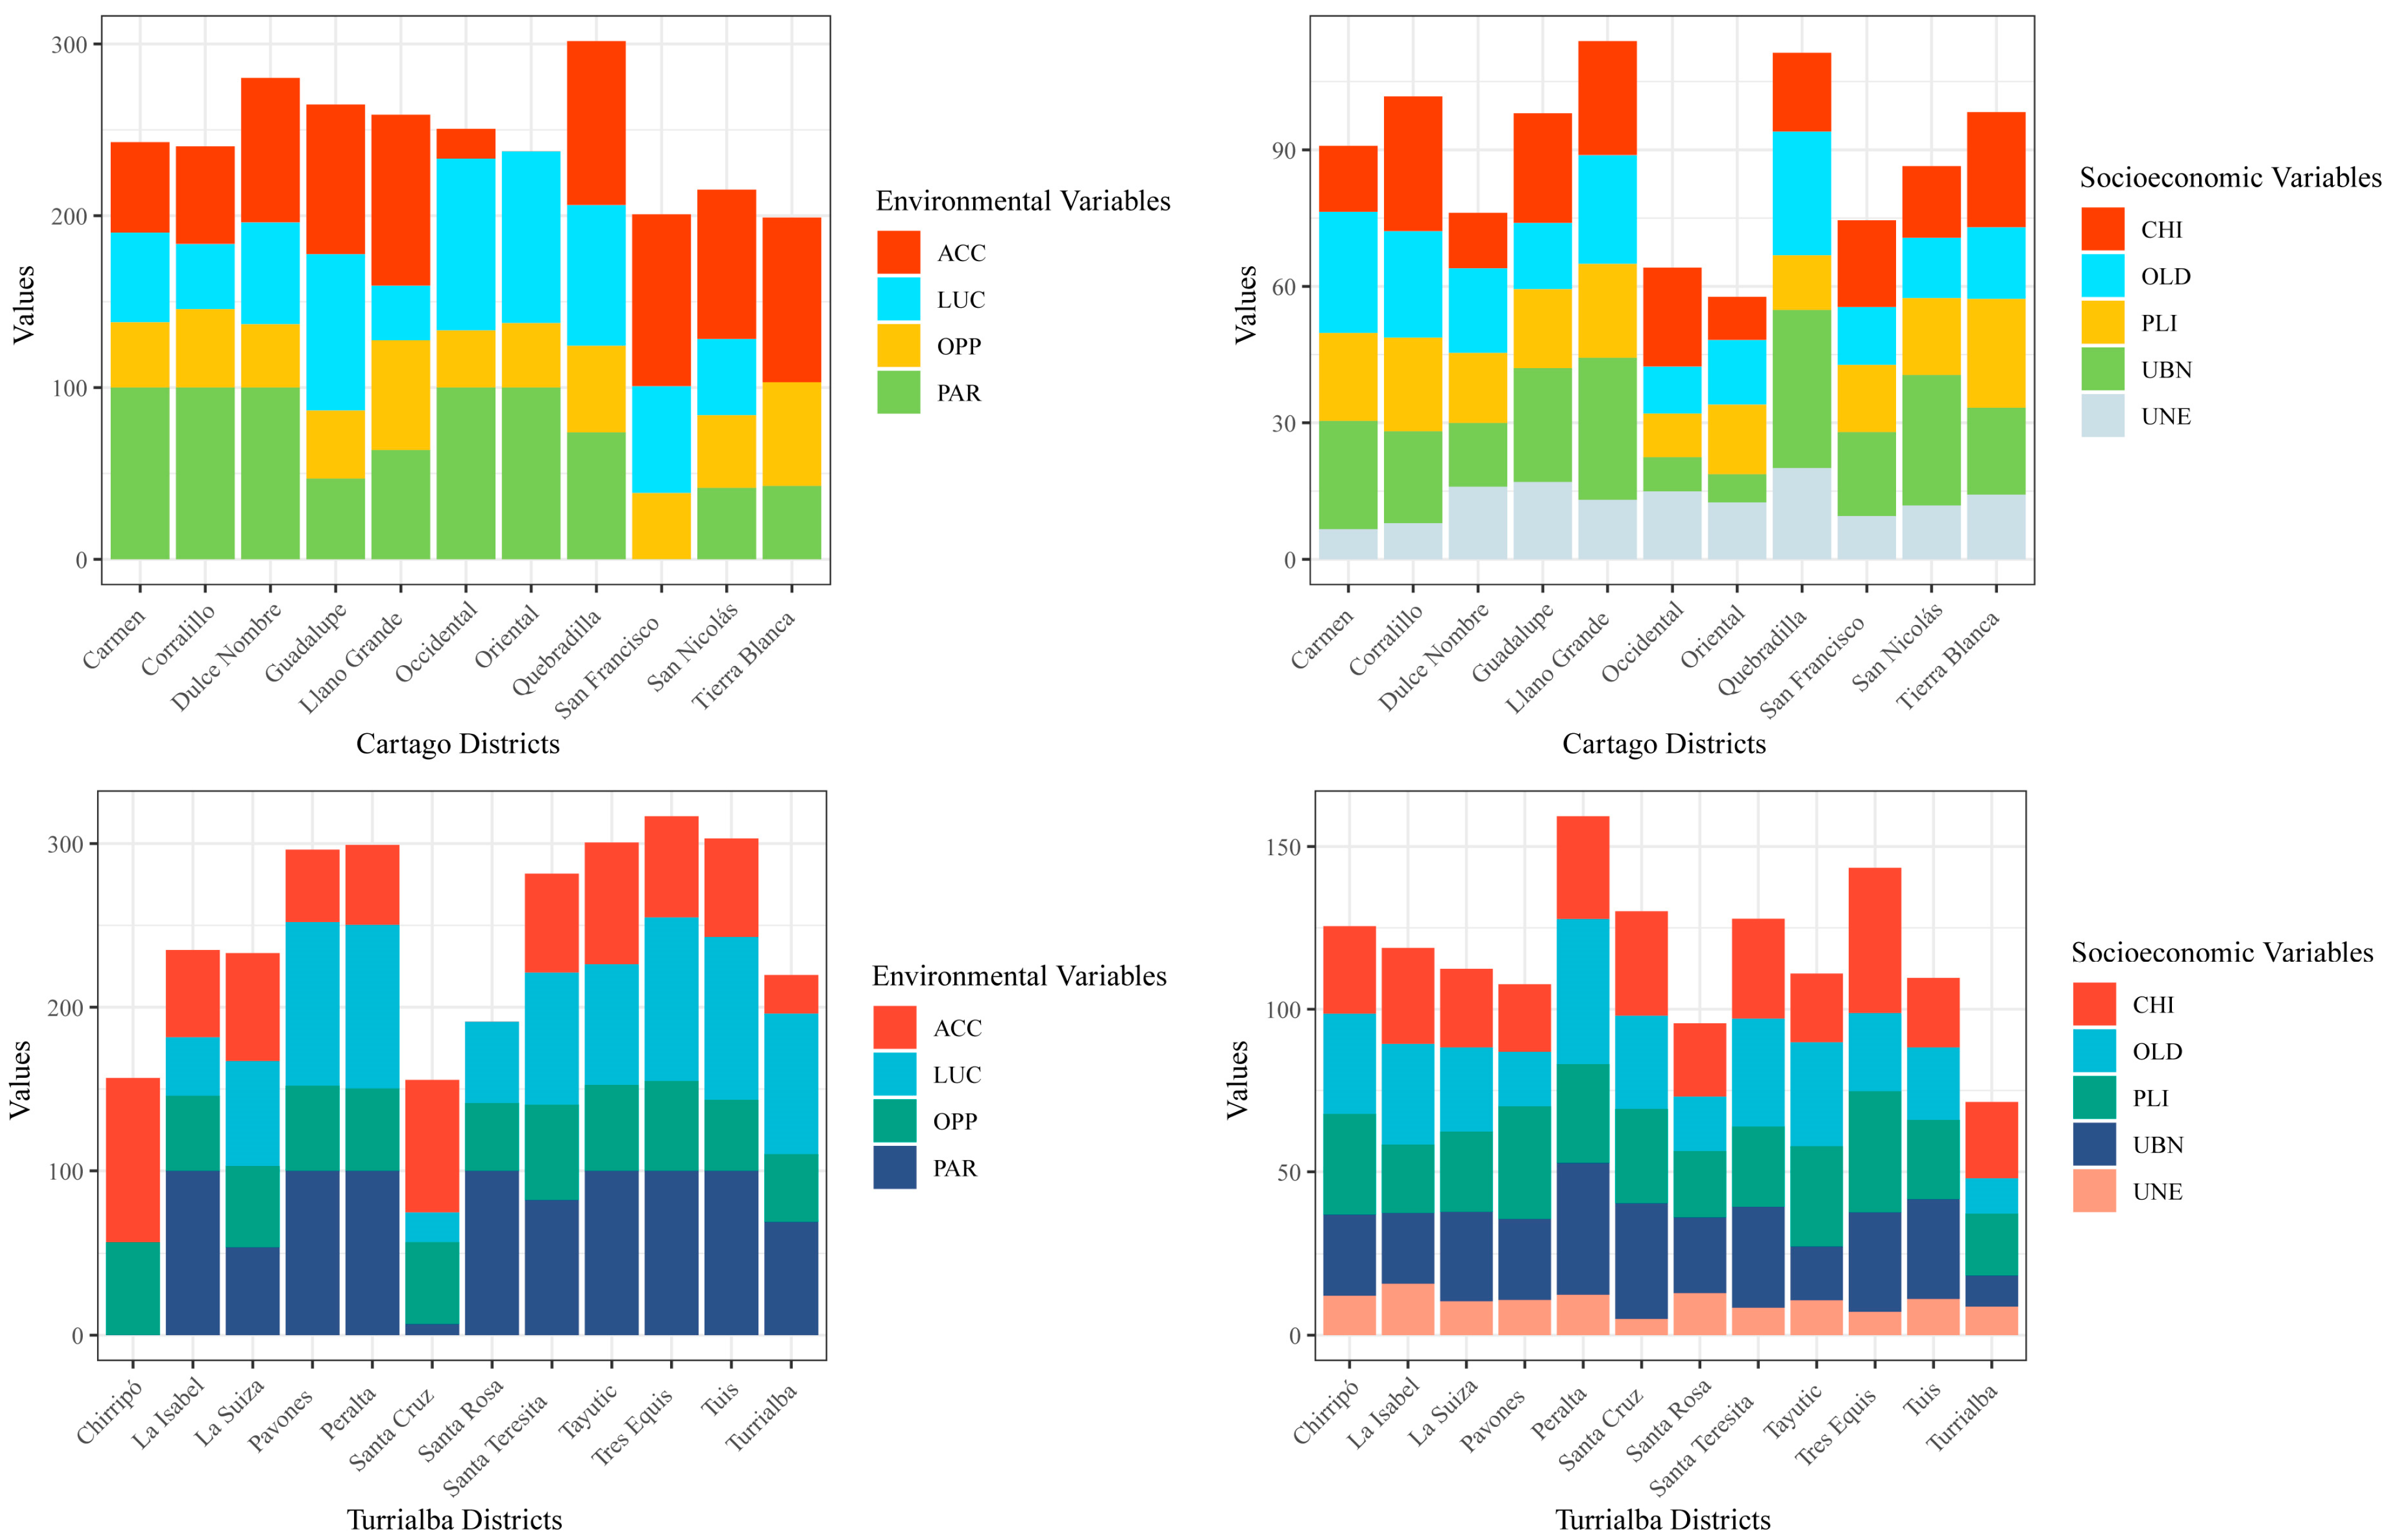
3.1.1. Vulnerability

Based on the 2011 Population Census of Costa Rica, the municipality of Cartago has a total population of approximately 147,898 people, where the largest percentage of its population (21%) lives in the district of San Francisco (31,879 people). In contrast, the smallest population is located in the districts of Tierra Blanca and Llano Grande (3%) located to the north of the canton, and Quebradilla (4%) [28]. The last two aforementioned districts (Tierra Blanca and Llano Grande) have more rural characteristics.
Figure 2 shows the socioeconomic and environmental profiles for each district in the Cartago municipality. The Oriental and Occidental districts correspond with the most densely populated areas at the center of the city of Cartago. In the Oriental district, the variables with the greatest weight in the socioeconomic profile are limitations and the population over 65 years of age. In the environmental profile for the same district, the variable with the greatest weight is protected areas, being an urban zone without the presence of conservation areas. The environmental profile of the district of Occidental is very similar to that of Oriental, the socioeconomic profile varies slightly, with the same dependent population having the greatest weight of vulnerability but in this case the child population (zero to fourteen years of age).
The highest vulnerability zone is concentrated in the Quebradilla district, which is one of the districts with the highest percentage of the population with unsatisfied basic needs (UBN) (population with little or no access to water and healthcare, knowledge, decent shelter, or other goods), with 31%. On the other hand, Cartago’s central area, where Los Diques is located, in San Nicolás, Taras, represents a level of medium and medium-high vulnerability, this explains the low indices of quality of life and socioeconomic development of its population.
Vulnerability in districts such as Corralillo and Llano Grande is medium to medium-high, and in urbanized districts such as Central, El Carmen, and Occidental, the vulnerability in most of the MGUs is medium and low (Figure 3). The indicators with more weight, according to Figure 2, are UBN and accessibility in Llano Grande. Moreover, there is a low average of presently protected areas and a high average of the population from 0 to 14 years old in Corralillo. While in Central, El Carmen, and Occidental, the indicators with more weight are vulnerable populations (0 to 14 years old and over 65), protected areas, and land-use conflict.
Tierra Blanca, however, has a medium-to-low vulnerability index, being an outlying district, with important tourist activity due to the presence of the Irazú Volcano National Park Prusia Sector as well as the Durán Sanatorium, which are frequently visited. Likewise, Tierra Blanca is a district whose main economic activity is agriculture and livestock, producing a significant proportion of vegetables sold on the national market [29].

3.1.2. Analysis of the Rainfall Risk Index According to the Differential Exposure Criteria

The districts of Llano Grande and Quebradilla are more homogeneously affected by rainfall risk, and several specific MGUs in the districts of Corralillo, San Francisco, and San Nicolás are affected by high and medium-high ranges of extreme rainfall risk. At Los Diques settlement in Taras, San Nicolás, the extreme rainfall percentile has a greater impact; the MGUs present in this location determine a zone that is highly exposed to the impacts of extreme hydrometeorological events (Figure 4a,c).
The district with the highest percentage of the population with a rainfall risk index for hydrometeorological events in Cartago is Llano Grande, located at a higher altitude on the flanks of the Irazú volcano, with 99% of its total population within the maximum rainfall risk range (Figure 4b). Next, in the district of Quebradilla, 92% of the total population has a high and medium-high risk index, which is the second highest in this municipality (Figure 4d). Then, of the total population of the district of San Francisco, 39% has a high and medium-high risk index; of the total population of the district of Corralillo, 33% has a high and medium-high risk index; and of the total population of the district of San Nicolás, 31% has a high and medium-high rainfall risk index. The remaining districts have a low rainfall risk index of 0%. The present risk trend shifts mainly towards areas that are socially identified as unsafe, such as Los Diques in Taras, where the rainfall percentile has a greater impact as well as where the indicators of dependency and unsatisfied basic needs are high (Figure 5).
The risk index for extreme hydro-meteorological events in Cartago shows greater detail of the presence of rainfall risk in the specific MGUs of the municipality. In the Occidental, Oriental, and El Carmen districts, several areas go from low to medium-low risk. In the district of Dulce Nombre, mainly its MGUs are at medium risk. Districts such as Llano Grande and Tierra Blanca do not present significant differences from what has already been analyzed in Figure 3. The Quebradilla and Corralillo districts generate an increase in their risk zones or MGUs due to high exposure rates. With the adherent factor of exposure, the MGUs—according to the incidence of the indicators of slopes and proximity to rivers—tend to rise in rank, which generates a more detailed result of specific zones at high risk from hydrometeorological events, attributing the influence of the adherent geographical variables.

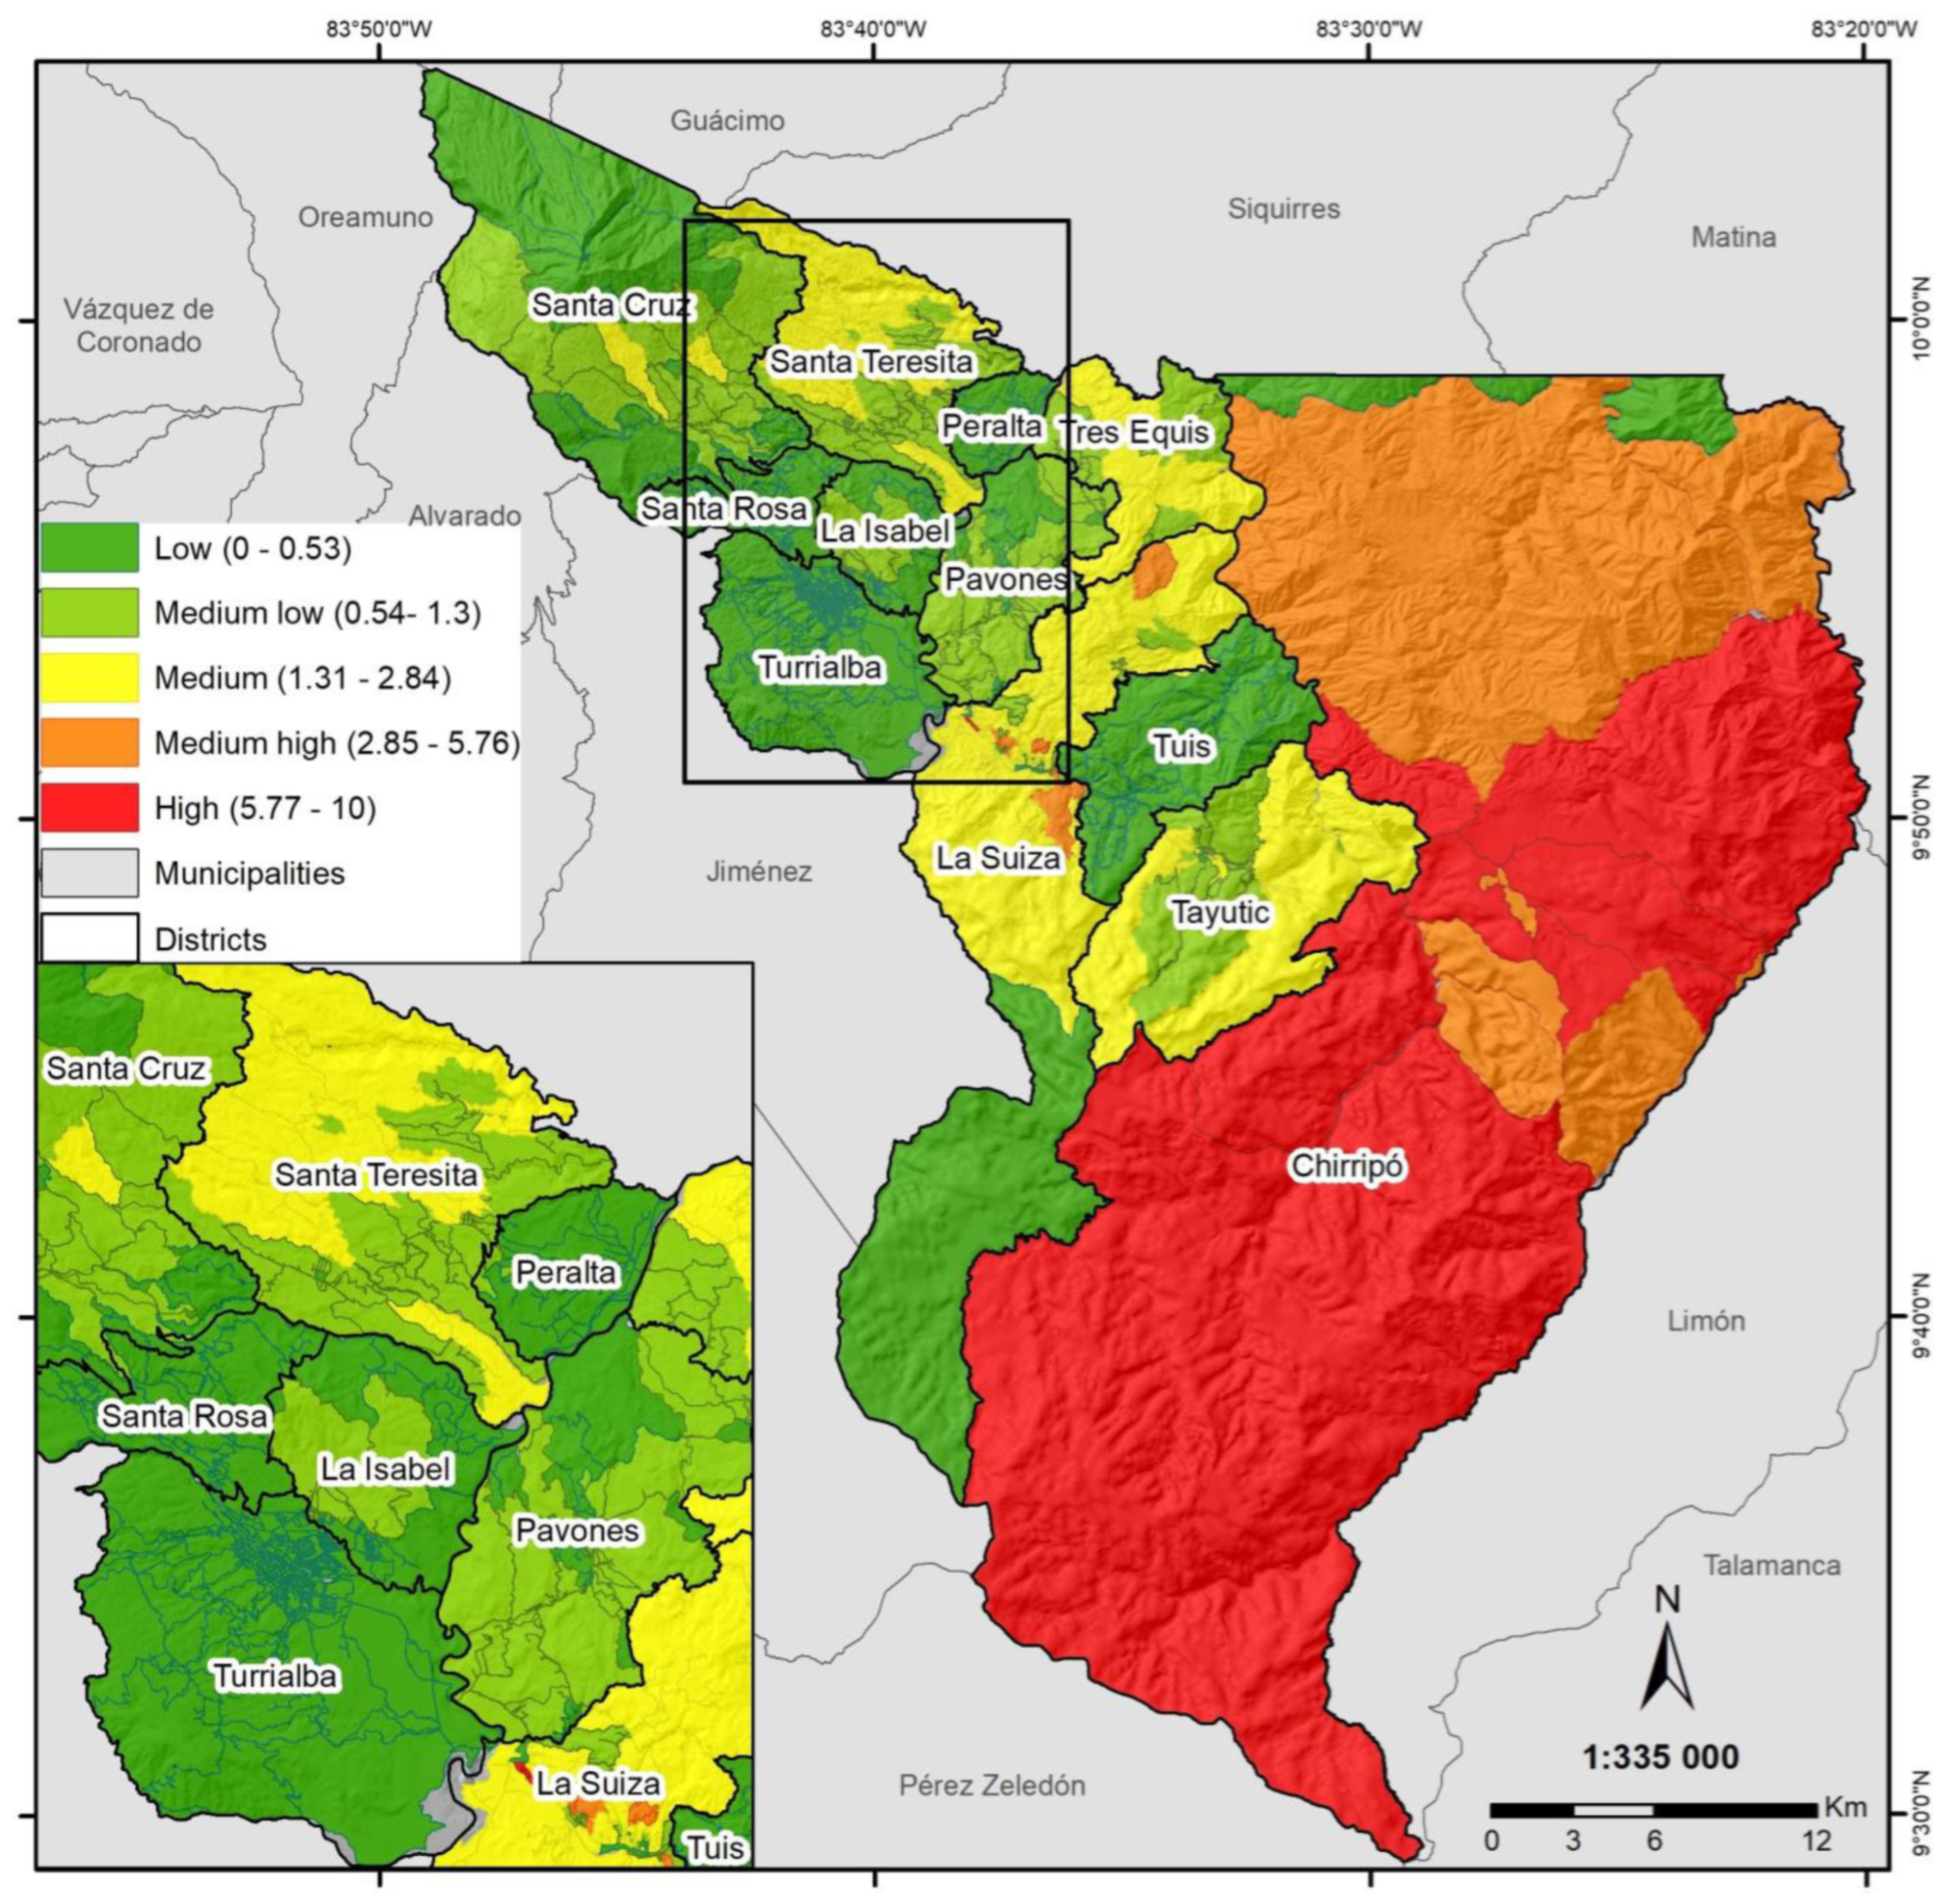
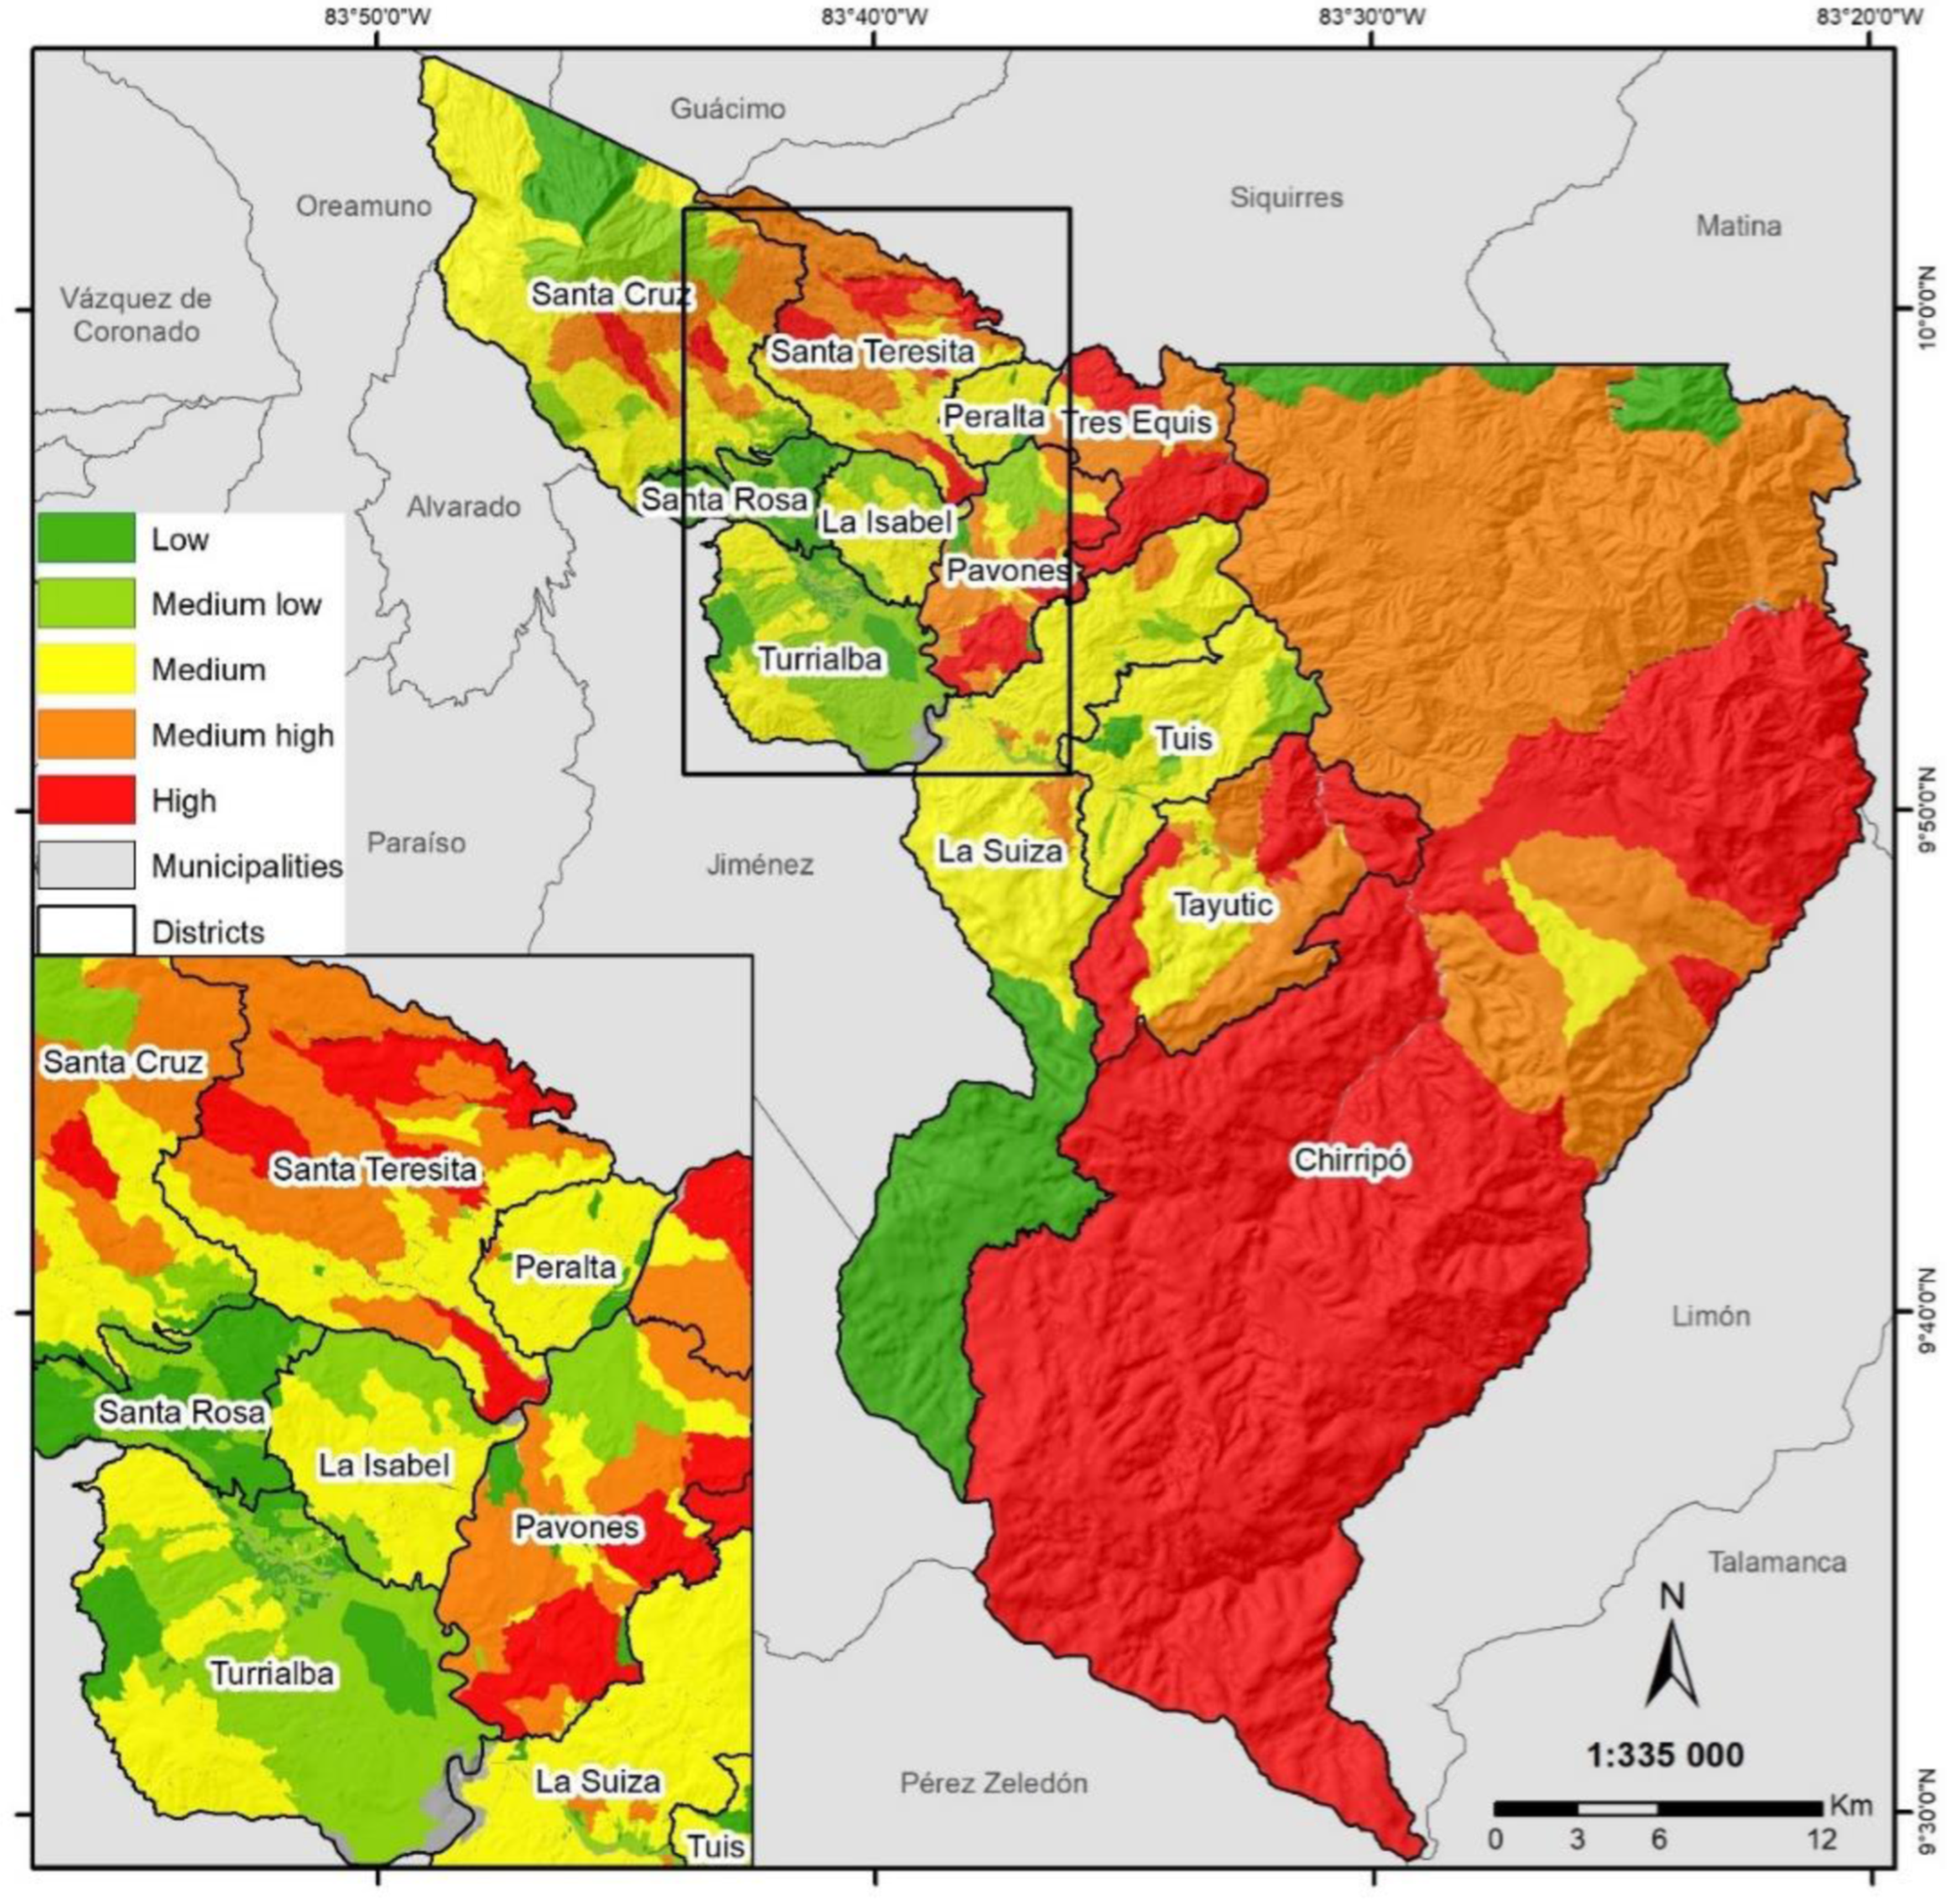
3.2. Risk Analysis for the Turrialba Municipality

3.2.1. Vulnerability

The municipality of Turrialba for the 2011 census had a total of 69,616 inhabitants, with a population density of 44 inhabitants per km2. In general, the canton has a literacy rate of 85%. Among the predominant economic activities in the municipality, 21% of the population is engaged in agriculture and livestock, followed by commerce and vehicle repair with 14%, as well as manufacturing and education with 11% and 10%, respectively.
Municipality districts such as Santa Teresita, Peralta, Pavones, La Isabel, Tayutic, and Chirripó have high levels of risk in practically the entire district. Regarding the ponderation of different indicators in the configuration of the integrated vulnerability index for these different districts, as per Figure 2, most districts share the same configuration of vulnerability, where the indicator with the greatest influence in all districts is the dependent child population. The difference in these cases is given by the environmental factors, where, for example, the districts of Turrialba, Pavones, Tuis, and Tayutic have greater vulnerability in terms of their capacity of use and ASP; La Suiza has a similar high weight in all the environmental indicators; Chirripó has less influence from land-use capacity but a greater influence from the indicators of accessibility, proximity to protected areas, and opportunities. Chirripó, the largest district by far, is also characterized by large indigenous territories in this mountainous region to the southeast of the Turrialba municipality, with low population densities but high levels of vulnerability.
Districts such as La Suiza, Santa Rosa, and Santa Cruz have lower levels of vulnerability; however, within their territory, some minimal geostatistical units remain highly vulnerable. On the other hand, Peralta, Tres Equis, and Santa Teresita have a similar configuration in the indicators of social vulnerability and the environment, with greater importance of the dependent child population but also of the elderly population, as well as the UBN and impairments. In terms of the environment, land-use capacity and lack of protected areas weigh most heavily, followed by accessibility.
As mentioned above, there is a convergence of high vulnerability values in these districts, both in terms of the dependent population and of the population with limitations and unsatisfied basic needs (UBN). In addition, there is a great influence of environmental variables, since almost all of them are with high indexes in terms of accessibility, proximity to protected areas, and land-use capacity.

3.2.2. Analysis of the Rainfall Risk Index According to the Differential Exposure Criteria

The results obtained (Figure 6) regarding the risk of extreme hydrometeorological events corresponding to the 90th percentile of average annual rainfall show a clear identification of the area with the highest risk index, coordinating with almost the entire territory of the district of Chirripó, located in the eastern part of the canton, which covers almost half of the total territory of the municipality. The other districts are at low risk, except for La Suiza, Santa Teresita, and Tres Equis, which have medium risk areas.
This result is due to the high vulnerability and high threat conditions, corresponding to Chirripó and La Suiza, followed by Tayutic, Santa Teresita, and Santa Cruz (Figure 7). The reason why the vulnerability present in the other districts does not show up in the risk result for extreme rainfall events is that comparatively, when normalizing the threat in the different districts, as Chirripó is a much larger district than the others it covers much more territory with high rainfall, so its relative importance is greatly intensified, standing out from the other districts.
However, as shown in Figure 8, the districts of Chirripó, Santa Teresita, Tres Equis, Pavones, and Tayutic present medium-, medium-high-, and high-risk conditions, followed by Suiza, Turrialba, Santa Cruz, Tuis, Peralta, Santa Rosa, and La Isabel, which present medium- and low-risk conditions. Compared to the risk map without including exposure, in addition to presenting an increase in risk in many districts, it also presents a diversification of risk levels within the same district, allowing to find more specific areas with higher levels of risk.
The reason why this result shows more areas at risk compared to the result without including exposure indicators is due to the high slopes and proximity to rivers (Figure 7b–d), which are present in all these districts mentioned, due to their geomorphology. This means that although it does not rain as much in these districts as in Chirripó, they do present other exposure conditions that can aggravate a risk situation in the face of extreme rainfall events.
It is important to mention that, as shown in Figure 7, the district of Turrialba usually presents risk scenarios due to the exposure of the population to the proximity of a river with a greater magnitude of flow than the others in the canton. The reason why this is not reflected in Figure 8 is that in the model all the rivers are considered of equal importance, therefore, it is necessary to include this in the model’s new official indicators of the exposure component, such as flood areas and the magnitude of the main stream’s flow.

4. Discussion

The most significant indicators affecting the vulnerability index in the municipalities of Cartago and Turrialba are unsatisfied basic needs, children and old-age dependency, protected wildlife areas, and access to roads, as well as land-use capacity. These indicators point to the exacerbation of social vulnerability at local, national, and regional levels in Latin America and the Global South, primarily due to poverty and unsafe living conditions, increasing natural hazards [30]. The obtained results can assist the local authorities in prioritizing risk mitigation actions through the development of resilience and adaptation to climate change, ultimately reducing the climate risk from extreme hydrometeorological events.

4.1. Methodological Limitations

This study has certain limitations in its methodology and information processing, leading to potential errors in the measurement of the vulnerability index and climate-related hazards. The differences in the temporal and spatial resolution of the models used may result in higher margins of error. The social indicators are derived from the 2011 Population Census of Costa Rica at the minimal geostatistical unit level, while environmental and hazard-related indicators are generated at the district level, causing a loss of geographical accuracy when high- and low-resolution spatial datasets are combined. This resolution issue has also been acknowledged in previous flood modeling studies in Costa Rica, as precipitation spatial distribution uncertainty generates significant variations in hazard manifestation [31].
There is a discrepancy in the temporal scale of the data layers: the social data at the land-use level are updated every decade through population and housing censuses, while the precipitation layer is an average of three decades, and the exposure data are current. The temporality of layers has been recognized as a challenge in risk calculation [32]. The use of layers from different sources and in different formats increases the likelihood of errors, thus it is crucial to ensure the temporal consistency of the data. Moreover, the absence of high-resolution layers for weather-related hazards, including precipitation data, hinders the use of advanced statistical correlations in this research.
It is also important to note the lack of an indicator related to the watershed dynamics in the territories under examination. This study only considers the extent and concentration of precipitation, without accounting for the hydrological response to extreme weather events and its impact on geomorphological dynamics, especially in the context of flood hazards. Previous research [33] highlights the significance of studying watershed dynamics, as it provides a basis for defining territorial spaces for sustainable management with extensive local or regional involvement in natural resource management and promotes regional development from within.
It is also worth mentioning that in the calculation of risk, the weight of the indicators may vary, with some having a greater impact on the outcome. In this study, however, all indicators are given equal weight. This approach based on equal weighting has been used previously [34] in a risk calculation model, where they argue that it facilitates comparability of data by assigning equal importance to all indicators. However, it is acknowledged that certain indicators may hold greater significance depending on the characteristics of the territory studied, thus further validation is necessary to determine which indicators have a greater weight in each high-risk zone. Further research could benefit from adopting multi-factorial approaches that assign varying weights to key indicators, potentially providing a more robust depiction of local-level risk drivers.

4.2. Implications of Vulnerability and Exposure Indexes

The methodology applied in this study successfully produced a more detailed and segmented analysis of risk by differentiating levels of risk into smaller areas. This provided a more in-depth examination of spatial patterns of risk. By incorporating an exposure component, the analysis provides a more comprehensive picture of current and future climate risk management and highlights critical areas that are particularly vulnerable. The inclusion of the exposure component significantly enriches the assessment of emerging climate risk and provides a more diverse understanding of risk configurations, including how exposure and vulnerability compound to increase overall risk.
The inclusion of areas near rivers and high slopes in the analysis of risk has improved the specificity of risk areas. This highlights the need for more accurate exposure indicators that can be obtained by focusing on the most susceptible areas [35]. The use of high-resolution spatial information in this study enables the integration of highly precise data, especially when assessing socioeconomic vulnerability. The resulting maps allow for the identification of patterns and specific zones where exposure exacerbates vulnerable areas, leading to potentially higher risk levels.
The results of the methodology developed [15], were successfully refined through this study. However, the methodology can be further improved by incorporating additional variables or modifying existing ones to better suit the needs of the research. Additionally, the unification of the scale of data sources can result in more consistent results, especially considering the need for high-resolution models to accurately represent the effects of climate change. This study contributes to the field by offering analytical tools for climate risk management, allowing for the identification of vulnerable and potentially at-risk areas in a timely manner, which can inform land-use planning and local adaptation strategies to effectively mitigate the impacts of climate risk on vulnerable populations.
The results of this study hold great significance in guiding local authorities to prioritize actions toward disaster risk mitigation. Furthermore, these authorities could effectively manage climate risks and strengthen resilience and adaptation to climate change. This methodology can contribute significantly to reducing the risk of extreme hydrometeorological events in Costa Rica, which cause increasing economic losses and damages at a high cost for the country every year. This is critical to implement effective risk management that promotes and enhances proper land-use planning in each study area to mitigate the impact of such events.

5. Conclusions

The methodology used in this study allowed for obtaining a more detailed and segmented cartographic product by incorporating an exposure component. The results allow for the identification of critical points and refinement of the methodology for future replications and improvement. The project was developed at a high-resolution spatial scale (MGU), which allowed for the integration of precise data, particularly when measuring socioeconomic vulnerability. Mapping the data identified patterns and specific zones where exposure compounds climate risks in highly vulnerable areas. The results can guide local authorities in prioritizing risk mitigation measures and improving adaptation to climate change, ultimately reducing climate-related risks in the face of extreme hydrometeorological events, thus reducing economic losses and high costs for the country.
Vulnerable populations should be a top priority in risk management plans for each municipality. Measures such as improving housing access and mobility, maintaining road infrastructure for evacuation, and ensuring functional sewage systems to prevent overflows should be implemented. Of equal importance is the identification and registry of dependent populations located in high-risk municipalities, in order to monitor their social conditions with updated information. This enhanced attention to the dependent population can ensure a timely and effective response in emergency situations. Overall, the goal is to reduce the risk and adverse effects of extreme weather events by promoting resilience and adaptation in the communities that need it most.
The proposed methodology is fit for purpose in terms of risk management. Through its timely application, this approach can contribute positively to the implementation of early warning systems for disaster prevention by determining the location of danger zones and highly vulnerable and exposed populations. It also can contribute to strengthening the risk management plans of each municipality through preventive and timely response measures. For example, measures for structural adaptation in terms of access and mobility in housing, shelters, and sidewalks, among others, may be mentioned. It is also recommended to promote stricter criteria for obtaining construction permits, especially in highly exposed areas, thus reducing the likelihood of future loss and damage. Overall, the results presented in this article provide promising perspectives for future climate risk studies through the implementation of high-resolution spatial models in Costa Rica and in other countries in the Central American region.

Author Contributions

Conceptualization, M.d.M.G.-Q., M.V.-L., P.O.G. and A.Q.-R.; methodology, M.d.M.G.-Q., M.V.-L., P.O.G. and A.Q.-R.; software, M.d.M.G.-Q., M.V.-L., P.O.G. and A.Q.-R.; validation, M.d.M.G.-Q., M.V.-L., P.O.G. and A.Q.-R.; formal analysis, M.d.M.G.-Q., M.V.-L., P.O.G. and A.Q.-R.; investigation, M.d.M.G.-Q., M.V.-L., P.O.G. and A.Q.-R.; writing—original draft preparation, M.d.M.G.-Q., M.V.-L., P.O.G. and A.Q.-R.; writing—review and editing, M.d.M.G.-Q., M.V.-L., P.O.G. and A.Q.-R. All authors have read and agreed to the published version of the manuscript.

Funding

This research received no external funding.

Data Availability Statement

Information will be facilitated under request.

Conflicts of Interest

The authors declare no conflict of interest.

References

  1. Thomas, V.; López, R. Global Increase in Climate-Related Disasters. ADB Economics Working Paper Series. 2015. Available online: https://www.adb.org/sites/default/files/publication/176899/ewp-466.pdf (accessed on 10 January 2023).
  2. Mora, S.; Saborío, J.; Saborío, M.; González, P. La Variabilidad Climática y el Calentamiento Global Antropogénico (CGA) en el Contexto de Reordenamiento Territorial y los Planes Reguladores en Costa Rica; Documento de Apoyo para el Protocolo; CTCN: Copenhagen, Denmark, 2018. [Google Scholar]
  3. UNDRR—United Nations Office for Disaster Risk Reduction. Global Assessment Report on Disaster Risk Reduction 2022: Our World at Risk: Transforming Governance for a Resilient Future; UNDRR: Geneva, Switzerland, 2022. [Google Scholar]
  4. IPCC. Climate Change 2022: Impacts, Adaptation, and Vulnerability; Contribution of Working Group II to the Sixth Assessment Report of the Intergovernmental Panel on Climate Change; Pörtner, H.-O., Roberts, D.C., Tignor, M., Poloczanska, E.S., Mintenbeck, K., Alegría, A., Craig, M., Langsdorf, S., Löschke, S., Möller, V., et al., Eds.; Cambridge University Press: Cambridge, UK; New York, NY, USA, 2022; 3056p. [Google Scholar]
  5. World Economic Forum. The Global Risks Report 2018, 3rd ed.; World Economic Forum: Geneva, Switzerland, 2018. [Google Scholar]
  6. UNDRR. Disaster Risk Reduction in the Philippines: Status Report 2019; United Nations Office for Disaster Risk Reduction (UNDRR), Regional Office for Asia and the Pacific: Bangkok, Thailand, 2019. [Google Scholar]
  7. Cardona, O.D.; van Aalst, M.K.; Birkmann, J.; Fordham, M.; McGregor, G.; Perez, R.; Pulwarty, R.S.; Schipper, E.L.F.; Sinh, B.T. Determinants of risk: Exposure and vulnerability. In Managing the Risks of Extreme Events and Disasters to Advance Climate Change Adaptation; A Special Report of Working Groups I and II of the Intergovernmental Panel on Climate Change (IPCC); Field, C.B., Barros, V., Stocker, T.F., Qin, D., Dokken, D.J., Ebi, K.L., Mastrandrea, M.D., Mach, K.J., Plattner, G.-K., Allen, S.K., Eds.; Cambridge University Press: Cambridge, UK; New York, NY, USA, 2012; pp. 65–108. [Google Scholar]
  8. Aldunce, P.; Neri, C.; Szlafsztein, C. Hacia la Evaluación de Prácticas de Adaptación ante La Variabilidad y el Cambio Climático. Biblioteca do Núcleo de Meio Ambiente/UFPA, Belém. 2008. Available online: https://repositorio.uchile.cl/bitstream/handle/2250/170287/Hacia-la-evaluacion-de-practicas-de-adaptacion.pdf?sequence=1&isAllowed=y (accessed on 2 March 2023).
  9. Thomas, V.; Albert, J.R.G.; Perez, R.T. Climate-Related Disasters in Asia and the Pacific. ADB Economics Working Paper Series. Asian Development Bank. 2013. Available online: https://www.adb.org/sites/default/files/publication/30323/ewp-358.pdf (accessed on 23 May 2023).
  10. UNISDR (The United Nations Office for Disaster Risk Reduction). Marco de Sendai para la Reducción del Riesgo de Desastres 2015–2030. 2015. Available online: https://www.unisdr.org/files/43291_spanishsendaiframeworkfordisasterri.pdf (accessed on 27 December 2022).
  11. UNISDR (The United Nations Office for Disaster Risk Reduction). Annual Report 2011. UNISDR Secretariat Work Programme 2010–2011. 2011. Available online: https://www.unisdr.org/files/27627_ar2011v2.pdf (accessed on 27 December 2022).
  12. OCDE. Estudios Económicos de la OCDE. 2020. Available online: https://www.oecd.org/economy/surveys/costa-rica-2020-OECD-economic-survey-overview-spanish.pdf (accessed on 8 January 2023).
  13. Lavell, C.; Lavell, A. Informe Técnico Sobre Desastres en la Región: 1999–2009 Riesgo, Desastre y Gestión del Riesgo en Centroamérica: 1999 a 2010. Informe Técnico sobre Desastres en la Región 1999–2009_IV Informe Estado de la Región; PEN: San José, Costa Rica, 2010. Available online: https://repositorio.conare.ac.cr/bitstream/handle/20.500.12337/528/727.%20Informe%20t%c3%a9cnico%20sobre%20desastres%20en%20la%20regi%c3%b3n%201999-2009_IV%20Informe%20Estado%20de%20la%20Regi%c3%b3n_Libro%20completo.pdf?sequence=1%26isAllowed=y (accessed on 27 May 2023).
  14. Chicas, R. Técnicas Estadísticas de Análisis Multivariante Aplicadas a la Interpretación de Variables del Cambio Climático. Revista Iberoamericana de Bioeconomía y Cambio Climático. 2017. Available online: http://portal.amelica.org/ameli/jatsRepo/394/3941752001/index.html (accessed on 15 January 2023).
  15. Retana, J.; Calvo, M.; Sanabria, N.; Córdoba, J.; Calderón, K.; Cordero, K. Análisis de Riesgo Ante Eventos Hidrometeorológicos Extremos en Costa Rica. Casos de Estudio: Liberia, Carrillo, Matina y Talamanca, 1–117. 2017. Available online: http://cglobal.imn.ac.cr/documentos/publicaciones/RiesgoEventosHMExtremos/offline/download.pdf (accessed on 15 March 2021).
  16. Quesada-Román, A. Landslide risk index map at the municipal scale for Costa Rica. Int. J. Disaster Risk Reduct. 2021, 56, 102144. Available online: https://www.sciencedirect.com/science/article/abs/pii/S2212420921001102?via%3Dihub (accessed on 14 March 2023). [CrossRef]
  17. Charpentier, W.; Flores, A.; Garro, M.; Vargas, M. Determinación del Riesgo Climático Actual ante Eventos Hidrometeorológicos Extremos, en Ocho Cantones de Costa Rica con Alta Recurrencia durante los Últimos Treinta Años a Partir de Indicadores Socio-Espaciales (1988–2017). Bachelor’s Thesis, Universidad de Costa Rica, Escuela de Geografía, San José, Costa Rica, 2021. [Google Scholar]
  18. Godschalk, D.R.; Beatly, T.; Berke, P.; Brower, D.J.; Kaiser, E.J. Natural Hazard Mitigation: Recasting Disaster Policy and Planning; Island Press: Washington, DC, USA, 1999. [Google Scholar]
  19. Quesada-Román, A. Geomorfología Fluvial e Inundaciones en la Cuenca Alta del Río General, Costa Rica. Universidad Nacional de Costa Rica. 2017. Available online: https://doi.org/10.11137/2017_2_278_288 (accessed on 13 February 2023).
  20. Florida International University (FIU). Disaster Risk Reduction Program. El Niño Southern Oscillation (ENSO) 2015–16 Latin American and Caribbean Region. 2016. Available online: https://drr.fiu.edu/enso-201516/report-no3_jan2016_english.pdf (accessed on 10 January 2023).
  21. Quesada-Román, A. Implicaciones en la gestión del riesgo de desastres y ambiente en el Valle Central en los últimos treinta años (1985–2015). In Vigesimoprimer Informe Estado de la Nación en Desarrollo Humano Sostenible; CONARE: San José, Costa Rica, 2014. [Google Scholar]
  22. Guiskin, M.; Yanes, P.; Negrete, M. IFAD. Investing in Rural People. The Rural Youth Situation in Latin America and the Caribbean. 2019. Available online: https://www.ifad.org/documents/38714170/41187395/19_Guiskin_2019+RDR+BACKGROUND+PAPER.pdf/8b4b5a01-0a2e-dcf6-8eb2-73a0ca03ea14 (accessed on 11 January 2023).
  23. Ortega, J.; Bandy, W.; Valiente-Banuet, A. Late Quaternary evolution of alluvial fans in the Playa, El Fresnal region, northern Chihuahua desert, Mexico: Palaeoclimatic implications. Geofísica Int. 2004, 43, 445–466. [Google Scholar] [CrossRef]
  24. Sanchez, R. Urbanización, Cambios Globales en el Ambiente y Desarrollo Sustentable en América Latina; IAI, INE, UNEP; IAI: São José dos Campos, Brasil, 2007. [Google Scholar]
  25. Comisión Nacional de Prevención de Riesgos y Atención de Emergencias (CNE). Política Nacional de Gestión del Riesgo 2016–2030; CNE y Ministerio de Ambiente y Energía (MINAE): San José, Costa Rica, 2015. [Google Scholar]
  26. Olcina, J. Prevención de Riesgos: Cambio Climático, Sequías e Inundaciones. Panel Científico-Técnico de Seguimiento de la Política del Agua. Departamento de Análisis Geográfico Regional y Geografía Física. Universidad de Alicante. 2008. Available online: http://hdl.handle.net/10045/23016 (accessed on 22 March 2023).
  27. Mora, R.; Vahrson, W.; Mora, S. Mapa de Amenaza de Deslizamientos, Valle Central, Costa Rica; Centro de Coordinación para la Prevención de Desastres Naturales en América Central (CEPREDENAC): Ciudad de Guatemala, Guatemala, 1992. [Google Scholar]
  28. INEC—Instituto Nacional de Estadística y Censos. National Population Projections for 2020 based on 2011 National Census; INEC: San José, Costa Rica, 2020. [Google Scholar]
  29. INDER—Instituto De Desarrollo Rural. Región Central Caracterización del Territorio Cartago-Oreamuno-El Guarco-La Unión, 1–38. 2016. Available online: http://cartago.go.cr/wp-content/uploads/2017/11/Reglamento-Plan-Regulador-Territorial-de-Cartago.pdf (accessed on 20 March 2021).
  30. Pizarro, R.; CEPAL. La Vulnerabilidad Social y sus Desafíos: Una Mirada desde América Latina. División de Estadística y Proyecciones Económicas. Naciones Unidas, Chile. 2001. Available online: https://repositorio.cepal.org/bitstream/handle/11362/4762/S0102116_es.pdf (accessed on 4 April 2023).
  31. Araona, G. Propuesta Metodológica de Modelización Hidrometeorológica e Hidrodinámica Enfocada a la Ordenación del Riesgo de Inundación: Aplicación a la Cuenca del Río Pejibaye (Costa Rica). Ph.D. Thesis, Universidad Politécnica de Madrid, Escuela Técnica Superior de Ingenieros de Montes, Departamento de Ingeniería Forestal, Madrid, Spain, 2011. [Google Scholar]
  32. Olaya, V. Sistemas de Información Geográfica. 2014. Available online: https://www.icog.es/TyT/files/Libro_SIG.pdf (accessed on 12 January 2023).
  33. Rodríguez, F. Cuencas Hidrográficas, Descentralización y Desarrollo Regional Participativo. 2006. Available online: https://www.redalyc.org/pdf/666/66612867008.pdf (accessed on 25 February 2023).
  34. Meza, L.; Corzo, S.; Soza, S. Gestión del Riesgo de Sequía y Otros Eventos Climáticos Extremos en Chile; Estudio Piloto Sobre la Vulnerabilidad y la Gestión Local del Riesgo; Ministerio de Agricultura de Chile, Oficina de Estudios y Políticas Agrarias—ODEPA: Santiago, Chile, 2010. [Google Scholar]
  35. Guzmán, M.; Barrera, A. Metodología para la Microzonificación de Riesgos Frente a Amenazas Naturales: Caso de Estudio Deslizamientos e Inundaciones Municipio de Mocoa Departamento del Putumayo; Universidad Católica de Colombia, Facultad de Ingeniería, Programa de Ingeniería Civil: Bogotá, Colombia, 2014. [Google Scholar]
Figure 1. Locations of study area (Turrialba and Cartago municipalities).
Climate 11 00127 g001
Figure 2. Socioeconomic and environmental variables used to determine the vulnerability profile in Cartago (upper panels) and Turrialba (lower panels). Socioeconomic variables: UBN (Unsatisfied Basic Needs); PLI (Physical Limitations); CHI (0–14 years old inhabitants); OLD (≥65 years old inhabitants); and UNE (Unemployment rate). Environmental variables: OPP (Opportunities); LUC (Land-use conflict); PAR (Protected Areas); and ACC (Accessibility).
Climate 11 00127 g002
Figure 3. Extreme rainfall risk index for the Cartago municipality.
Climate 11 00127 g003
Figure 4. Risk scenarios for the San Nicolás (a,c), Llano Grande (b), and Quebradilla (d) districts. These photos were taken at high risk points according to the model obtained.
Climate 11 00127 g004
Figure 5. Exposure-factored extreme rainfall risk index for the Cartago municipality.
Climate 11 00127 g005
Figure 6. Extreme rainfall risk index for the Turrialba municipality.
Climate 11 00127 g006
Figure 7. Risk scenarios for Peralta (a), and Turrialba (bd) districts. These photos were taken at high risk points according to the model obtained.
Climate 11 00127 g007
Figure 8. Exposure-factored extreme rainfall risk index for the Turrialba municipality.
Climate 11 00127 g008
Table 1. Indicators and variables used to determine the integrated vulnerability index.
ComponentScenario TypeIndicatorsSource
VulnerabilitySocioeconomicPoverty:National Institute for Census and Statistics (INEC, Population Census, 2011)
Access to knowledge
Access to other goods
Access to potable water and health
Access to housing
Dependent population:
Population under 14 years old
Population over 65 years old
Population with physical and mental limitations
Unemployed population
EnvironmentAccessibility:National Territorial Information System (SNIT)
Density of roads and streets (km/km2)
Ecosystem services:
Protected areas and national parks
Land-use capacity:
Classes between VI and VIII
Source: [14] based on [12].
Disclaimer/Publisher’s Note: The statements, opinions and data contained in all publications are solely those of the individual author(s) and contributor(s) and not of MDPI and/or the editor(s). MDPI and/or the editor(s) disclaim responsibility for any injury to people or property resulting from any ideas, methods, instructions or products referred to in the content.

